nevada opioid surveillancedpbh.nv.gov/uploadedfiles/dpbhnvgov/content/resources/opioids/opi… ·...
TRANSCRIPT

Nevada Opioid Surveillance
2010 - 2015
Office of Public Health Informatics and Epidemiology Division of Public and Behavioral Health
Department of Health and Human Services
Brian Sandoval Governor
State of Nevada
Richard Whitley, MS Director
Department of Health and Human Services
Amy Roukie, MBA Administrator
Division of Public and Behavioral Health
John M. DiMuro, DO Chief Medical Officer
Division of Public and Behavioral Health
Prepared By and Additional Information:
Division of Public and Behavioral Health
State of Nevada 4126 Technology Way, Suite 201 Carson City, Nevada 89706 (775) 684.5282
Thank you to following for providing leadership, data and technical support for this report:
Kyra Morgan, MS Chief Biostatistician Department of Health and Human Services State of Nevada
Jen Thompson Biostatistician Division of Public and Behavioral Health State of Nevada
James Kuzhippala, MPH Health Program Specialist II Division of Public and Behavioral Health State of Nevada
Amy Lucas, MS Health Resource Analyst Division of Public and Behavioral Health State of Nevada

Office of Public Health Informatics and Epidemiology
Division of Public and Behavioral Health
Data Source: Division of Public and Behavioral Health, Hospital Inpatient and Emergency Department Billing Data.
Data Provided by: Center for Health Information Analysis.
The following ICD Codes are included in these data:
All Diagnosis
Opioid Dependence
304.0 Opioid type dependence ICD-9-CM
F11.2 Opioid dependence ICD-10-CM
Opiate and Other Dependence
304.7 Combinations of opioid type drug with any other drug dependence ICD-9-CM
Nondependent Opioid Abuse
305.5 Nondependent opioid abuse ICD-9-CM
F11.1 Opioid abuse ICD-10-CM
Other Opioid Related Codes
F11.9 Opioid use, unspecified ICD-10-CM
External Poisoning
E850.0-E850.2 Accidental poisoning by heroin, methadone, and other opiates ICD-9-CM
Principal Diagnosis
Opiate Poisoning
965.0 Poisoning by opiates and related narcotics ICD-9-CM
T40.0 Poisoning by, adverse effect of and underdosing of opium ICD-10-CM
T40.1 Poisoning by and adverse effect of heroin ICD-10-CM
T40.2 Poisoning by, adverse effect of and underdosing of other opioids ICD-10-CM
T40.3 Poisoning by, adverse effect of and underdosing of methadone ICD-10-CM
T40.4 Poisoning by, adverse effect of and underdosing of other synthetic narcotics ICD-10-CM
T40.6 Poisoning by, adverse effect of and underdosing of other and unspecified narcotics ICD-10-CM
*Data are preliminary and are subject to changes.
Data Source: Division of Public and Behavioral Health, Electronic Death Registry System.
Deaths with any of the following ICD-10 codes as an underlying cause of death were first selected:
Accidental poisonings by drugs
X60-X64 Intentional self poisoning by drugs
X85 Assault by drug poisoning
Y10-Y14 Drug poisoning of underdetermined intent
T40.0 Opium~
T40.1 Heroin
T40.2 Natural and semi-synthetic opioids
T40.3 Methadone
T40.4 Synthetic opioids
T40.6 Other and unspecified opioids
T42.4 Benzodiazepine
Emergency Department Encounters and Inpatient Visits
In October 2015, ICD-10-CM codes were implemented. Previous to October 2015, ICD-9-CM codes were used for medical
billing. Therefore, 2015 data consists of two distinct coding schemes, ICD-9-CM and ICD-10-CM respectively. Due to this
change in coding schemes, hospital billing data from October 2015 forward may not be directly comparable to previous
data.
In 2015, quarter 4, the ICD-10-CM codes were implemented. This includes codes for long term current use of an opiate and
for opiate in the blood, neither of which existed in the ICD-9-CM codes. This may account for the increase in 2015.
Deaths
~Opium was included in analysis, since there have been 0 deaths related to opium it is not included in the tables and
charts.
Prior to December 2016, OPHIE commonly used only one parameter for Nevada Residents, Patient State (Patient State =
NV). OPHIE recently added a new layer to the parameter of including only Nevada zip codes (Patient zip code 89%)
therefore the counts may be slightly smaller from previous reports.
X40-X44
The following axis (contributing causes of death) ICD-10 Codes are included in these data:
Data as of 8/2017 1
Office of Public Health Informatics and Epidemiology
Division of Public and Behavioral Health
Year
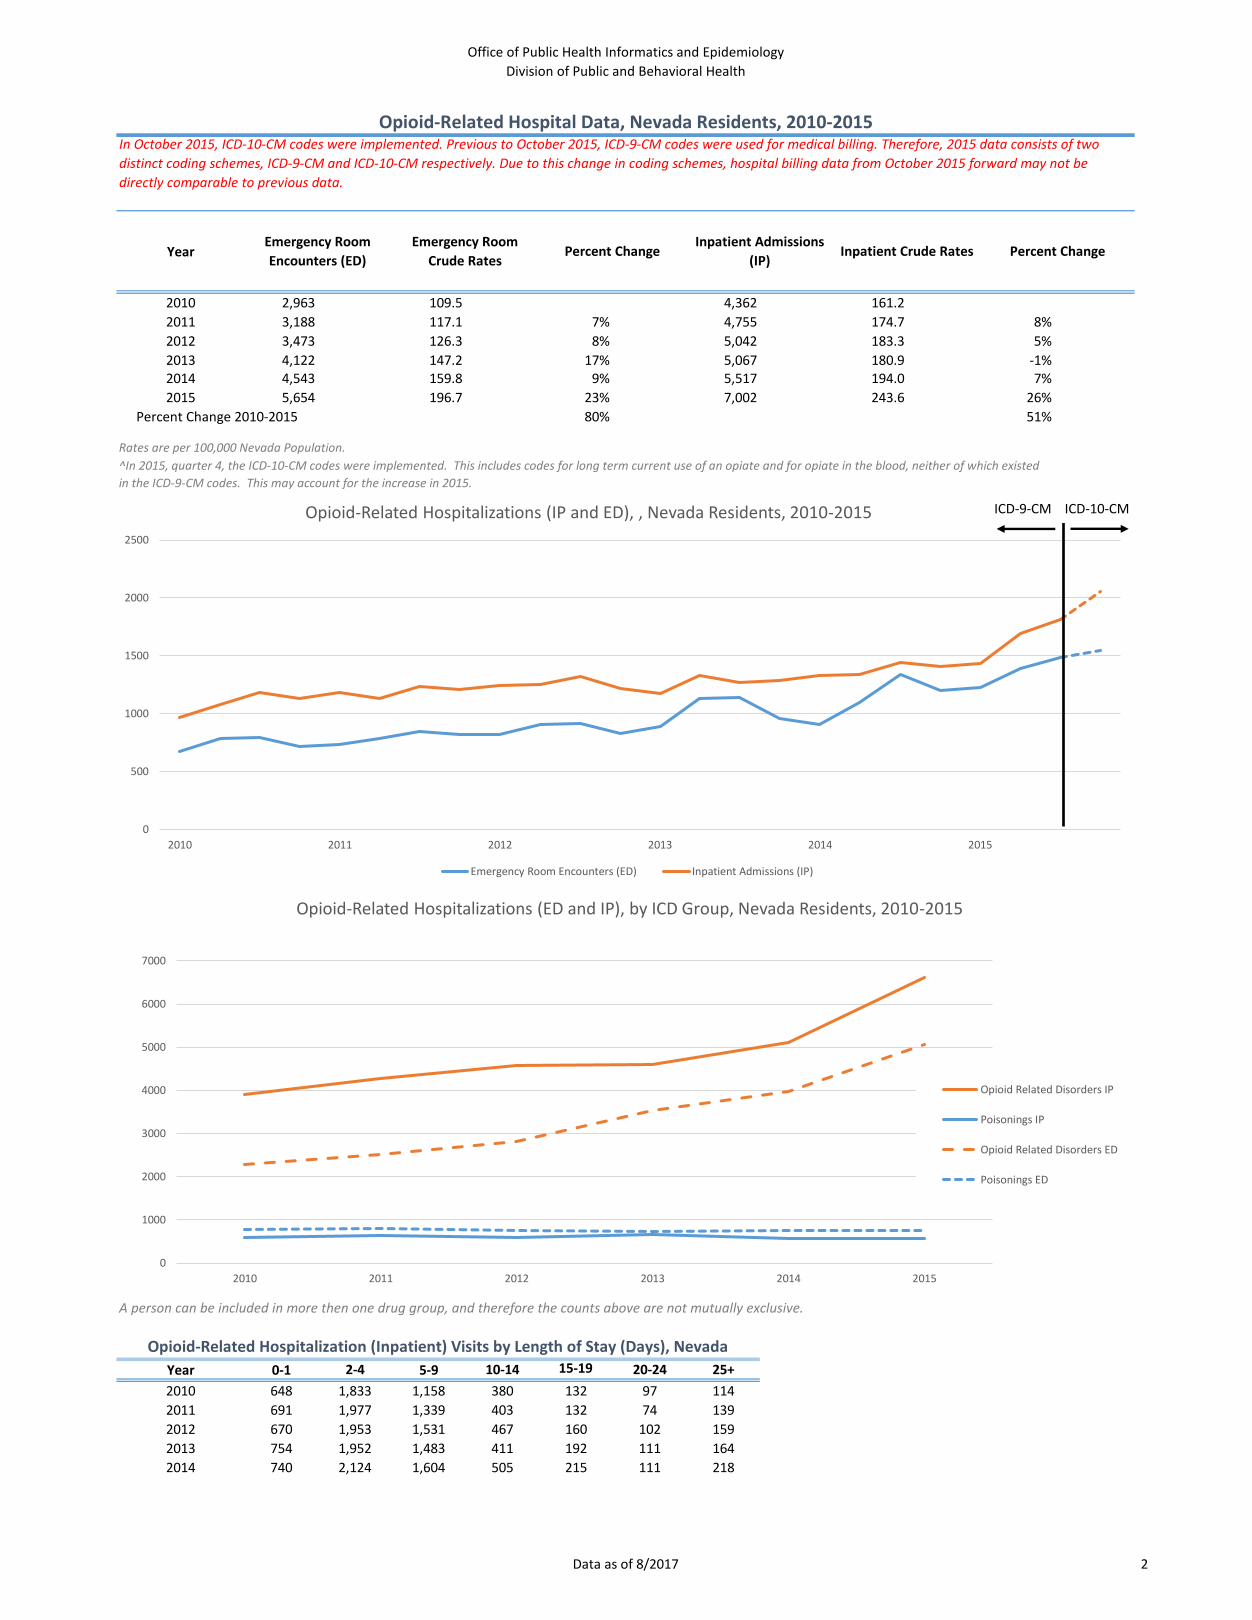
2010 2,963 109.5 4,362 161.2
2011 3,188 117.1 7% 4,755 174.7 8%
2012 3,473 126.3 8% 5,042 183.3 5%
2013 4,122 147.2 17% 5,067 180.9 -1%2014 4,543 159.8 9% 5,517 194.0 7%
2015 5,654 196.7 23% 7,002 243.6 26%
80% 51%
A person can be included in more then one drug group, and therefore the counts above are not mutually exclusive.
Year 0-1 2-4 5-9 10-14 15-19 20-24 25+
2010 648 1,833 1,158 380 132 97 114
2011 691 1,977 1,339 403 132 74 139
2012 670 1,953 1,531 467 160 102 159
2013 754 1,952 1,483 411 192 111 164
2014 740 2,124 1,604 505 215 111 218
Opioid-Related Hospitalization (Inpatient) Visits by Length of Stay (Days), Nevada
Inpatient Admissions
(IP)Inpatient Crude Rates Percent Change
Opioid-Related Hospital Data, Nevada Residents, 2010-2015
Emergency Room
Encounters (ED)
Emergency Room
Crude RatesPercent Change
Percent Change 2010-2015
Rates are per 100,000 Nevada Population.
In October 2015, ICD-10-CM codes were implemented. Previous to October 2015, ICD-9-CM codes were used for medical billing. Therefore, 2015 data consists of two
distinct coding schemes, ICD-9-CM and ICD-10-CM respectively. Due to this change in coding schemes, hospital billing data from October 2015 forward may not be
directly comparable to previous data.
^In 2015, quarter 4, the ICD-10-CM codes were implemented. This includes codes for long term current use of an opiate and for opiate in the blood, neither of which existed
in the ICD-9-CM codes. This may account for the increase in 2015.
0
500
1000
1500
2000
2500
2010 2011 2012 2013 2014 2015
Opioid-Related Hospitalizations (IP and ED), , Nevada Residents, 2010-2015
Emergency Room Encounters (ED) Inpatient Admissions (IP)
ICD-9-CM ICD-10-CM
0
1000
2000
3000
4000
5000
6000
7000
2010 2011 2012 2013 2014 2015
Opioid-Related Hospitalizations (ED and IP), by ICD Group, Nevada Residents, 2010-2015
Opioid Related Disorders IP
Poisonings IP
Opioid Related Disorders ED
Poisonings ED
Data as of 8/2017 2
Office of Public Health Informatics and Epidemiology
Division of Public and Behavioral Health
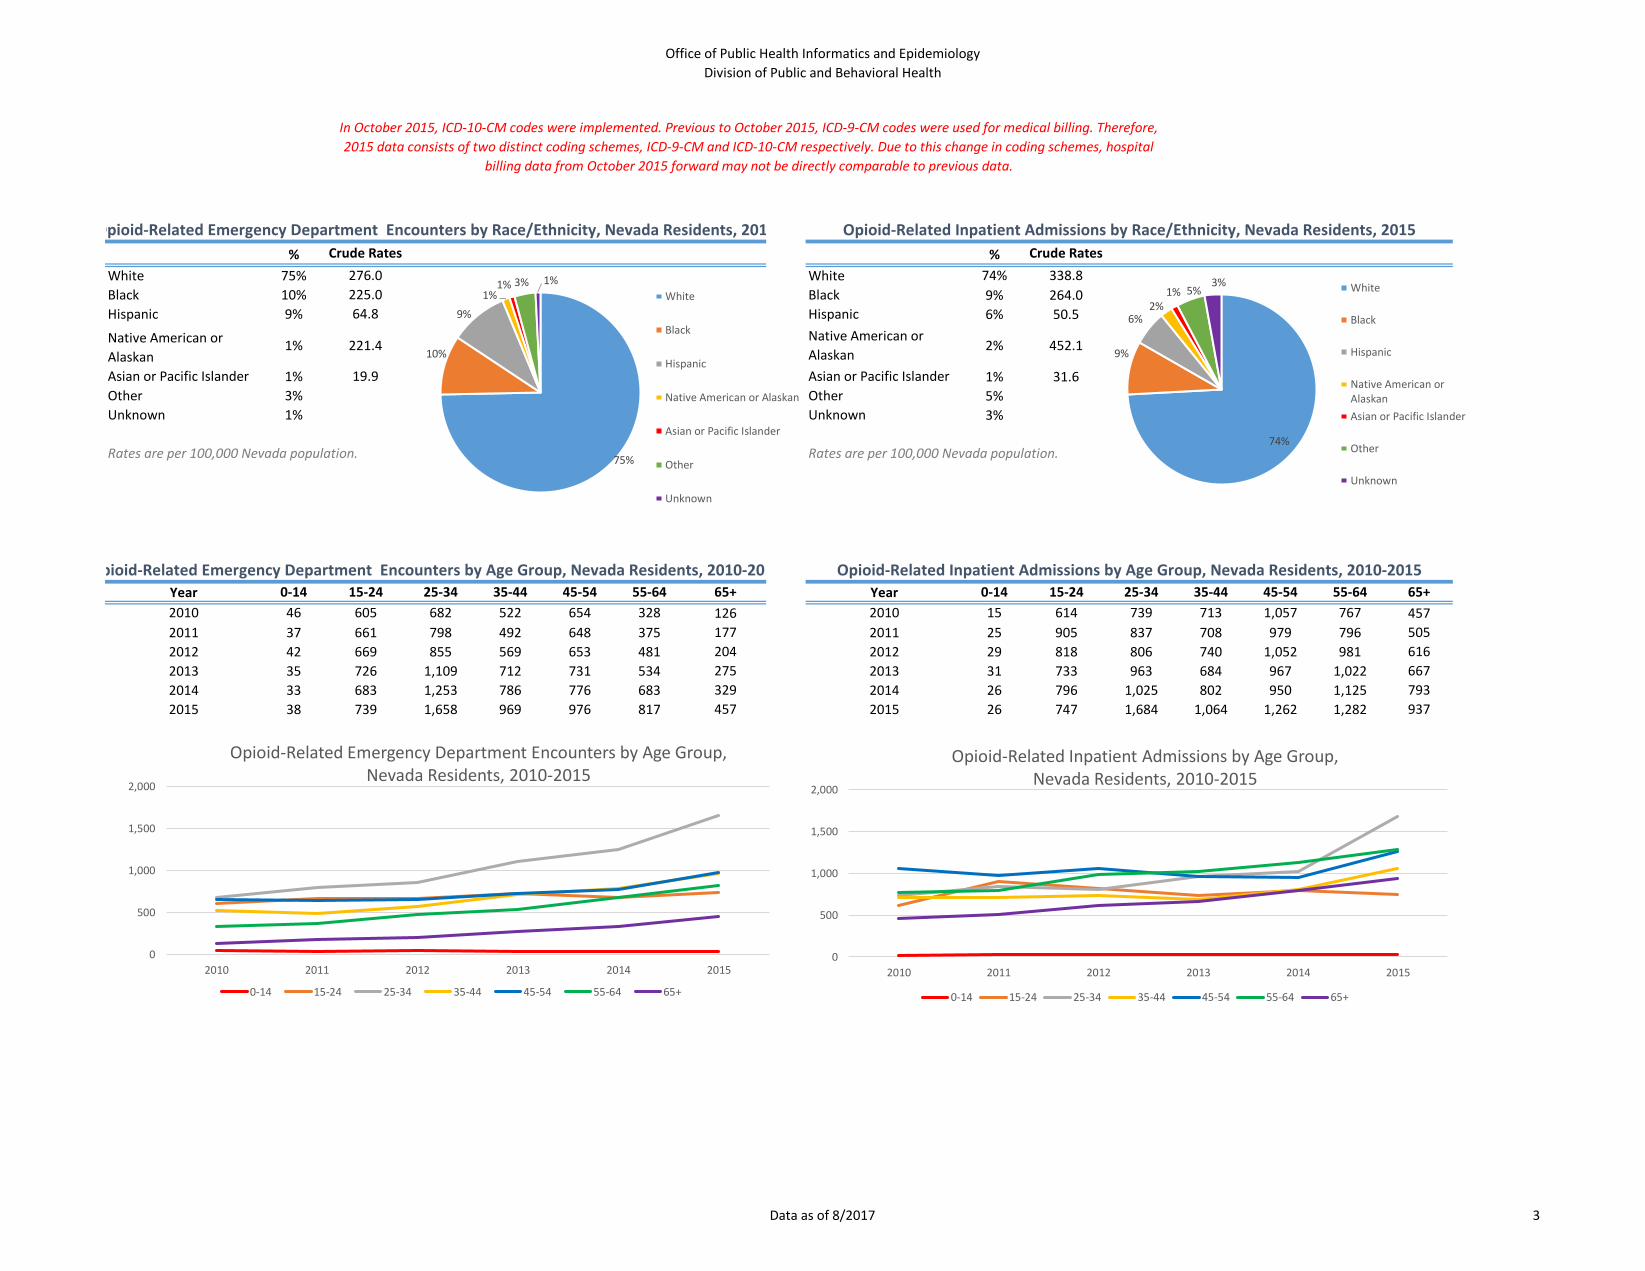
% Crude Rates % Crude Rates
White 75% 276.0 White 74% 338.8
Black 10% 225.0 Black 9% 264.0
Hispanic 9% 64.8 Hispanic 6% 50.5
Native American or
Alaskan1% 221.4
Native American or
Alaskan2% 452.1
Asian or Pacific Islander 1% 19.9 Asian or Pacific Islander 1% 31.6
Other 3% Other 5%
Unknown 1% Unknown 3%
Rates are per 100,000 Nevada population. Rates are per 100,000 Nevada population.
Year 0-14 15-24 25-34 35-44 45-54 55-64 65+ Year 0-14 15-24 25-34 35-44 45-54 55-64 65+
2010 46 605 682 522 654 328 126 2010 15 614 739 713 1,057 767 457
2011 37 661 798 492 648 375 177 2011 25 905 837 708 979 796 505
2012 42 669 855 569 653 481 204 2012 29 818 806 740 1,052 981 616
2013 35 726 1,109 712 731 534 275 2013 31 733 963 684 967 1,022 667
2014 33 683 1,253 786 776 683 329 2014 26 796 1,025 802 950 1,125 793
2015 38 739 1,658 969 976 817 457 2015 26 747 1,684 1,064 1,262 1,282 937
Opioid-Related Emergency Department Encounters by Race/Ethnicity, Nevada Residents, 2015 Opioid-Related Inpatient Admissions by Race/Ethnicity, Nevada Residents, 2015
Opioid-Related Emergency Department Encounters by Age Group, Nevada Residents, 2010-2015 Opioid-Related Inpatient Admissions by Age Group, Nevada Residents, 2010-2015
In October 2015, ICD-10-CM codes were implemented. Previous to October 2015, ICD-9-CM codes were used for medical billing. Therefore,
2015 data consists of two distinct coding schemes, ICD-9-CM and ICD-10-CM respectively. Due to this change in coding schemes, hospital
billing data from October 2015 forward may not be directly comparable to previous data.
74%
9%
6%2%
1% 5%3% White
Black
Hispanic
Native American orAlaskan
Asian or Pacific Islander
Other
Unknown
0
500
1,000
1,500
2,000
2010 2011 2012 2013 2014 2015
Opioid-Related Inpatient Admissions by Age Group, Nevada Residents, 2010-2015
0-14 15-24 25-34 35-44 45-54 55-64 65+
75%
10%
9%
1%1% 3% 1%
White
Black
Hispanic
Native American or Alaskan
Asian or Pacific Islander
Other
Unknown
0
500
1,000
1,500
2,000
2010 2011 2012 2013 2014 2015
Opioid-Related Emergency Department Encounters by Age Group, Nevada Residents, 2010-2015
0-14 15-24 25-34 35-44 45-54 55-64 65+
Data as of 8/2017 3

Office of Public Health Informatics and Epidemiology
Division of Public and Behavioral Health
Opioid-Related Hospital Data, Nevada Residents, 2010-2015
In October 2015, ICD-10-CM codes were implemented. Previous to October 2015, ICD-9-CM codes were used for medical billing. Therefore, 2015 data consists of two distinct coding schemes, ICD-9-CM and ICD-10-CM respectively. Due
to this change in coding schemes, hospital billing data from October 2015 forward may not be directly comparable to previous data.
-
100
200
300
400
500
600
700
800
Jan
uar
y
Feb
ruar
y
Mar
ch
Ap
ril
May
Jun
e
July
Au
gust
Sep
tem
be
r
Oct
ob
er
No
vem
ber
Dec
emb
er
Jan
uar
y
Feb
ruar
y
Mar
ch
Ap
ril
May
Jun
e
July
Au
gust
Sep
tem
be
r
Oct
ob
er
No
vem
ber
Dec
emb
er
Jan
uar
y
Feb
ruar
y
Mar
ch
Ap
ril
May
Jun
e
July
Au
gust
Sep
tem
be
r
Oct
ob
er
No
vem
ber
Dec
emb
er
Jan
uar
y
Feb
ruar
y
Mar
ch
Ap
ril
May
Jun
e
July
Au
gust
Sep
tem
be
r
Oct
ob
er
No
vem
ber
Dec
emb
er
Jan
uar
y
Feb
ruar
y
Mar
ch
Ap
ril
May
Jun
e
July
Au
gust
Sep
tem
be
r
Oct
ob
er
No
vem
ber
Dec
emb
er
Jan
uar
y
Feb
ruar
y
Mar
ch
Ap
ril
May
Jun
e
July
Au
gust
Sep
tem
be
r
Oct
ob
er
No
vem
ber
Dec
emb
er
2010 2011 2012 2013 2014 2015
Nu
mb
er
of
Ho
spit
al E
nco
un
ters
Emergency Room Encounters Inpatient Admissions
ICD-9-CM ICD-10-CM
Data as of 8/2017 4

Office of Public Health Informatics and Epidemiology
Division of Public and Behavioral Health
Year
Emergency
Room
Encounters
Emergency
Room Crude
Rates
Percent
Change
Inpatient
Admissions
Inpatient
Crude
Rates
Percent
Change
2010 779 28.8 599 22.1
2011 791 29.1 1% 646 23.7 7%
2012 766 27.9 -4% 600 21.8 -8%
2013 732 26.1 -6% 653 23.3 7%
2014 749 26.3 1% 576 20.3 -13%
2015 756 26.3 0% 578 20.1 -1%
-9% -9%
Rates are per 100,000 Nevada population
Year Opium Heroin MethadoneOther Opioids
and NarcoticsYear Opium Heroin Methadone
Other Opioids
and Narcotics
2010 76 136 54 553 2010 92 61 85 409
2011 95 158 53 543 2011 117 59 67 477
2012 89 154 36 547 2012 116 50 62 449
2013 102 172 29 485 2013 136 79 59 467
2014 115 233 32 442 2014 156 59 47 415
2015 93 271 36 401 2015 109 78 56 401
A person can be included in more then one drug group, and therefore the counts above are not mutually exclusive.
Opioid-Related Poisonings - Emergency Department Encounters and Inpatient Hospital Admissions, Nevada Residents, 2010-2015
In October 2015, ICD-10-CM codes were implemented. Previous to October 2015, ICD-9-CM codes were used for medical billing. Therefore, 2015 data consists of two distinct coding schemes, ICD-9-CM
and ICD-10-CM respectively. Due to this change in coding schemes, hospital billing data from October 2015 forward may not be directly comparable to previous data.
Opioid-related poisoning is a subset of the opioid -related hospitalization data. The following ICD-9-CM/ICD-10-CM for poisoning include the principal diagnosis: 965.0 ICD-9, T40.0-T40.4, and
T40.6 ICD-10.
Percent Change 2010-2015
Opioid-Related Poisonings - Emergency Department Encounters,
Nevada Residents, 2010-2015
Opioid-Related Poisonings - Inpatient Admissions,
Nevada Residents, 2010-2015
779 791 766 732 749756
599646
600653
576 578
0
200
400
600
800
1,000
Opioid-Related Poisonings (ED and IP), Nevada Residents, 2010-2015
Emergency Room Encounters Inpatient Admissions
0
100
200
300
400
500
600
700
800
2010 2011 2012 2013 2014 2015
Opioid-Related Poisonings - Emergency Department Encounters, Nevada Residents, 2010-2015
Opium
Heroin
Methadone
Other Opioids andNarcotics
0
100
200
300
400
500
600
2010 2011 2012 2013 2014 2015
Opioid-Related Poisonings - Inpatient Admissions, Nevada Residents, 2010-2015
Opium
Heroin
Methadone
Other Opioids andNarcotics
Data as of 8/2017 5

Office of Public Health Informatics and Epidemiology
Division of Public and Behavioral Health
YearOpioid-Related
Overdose DeathsCrude Rates Percent Change
Benzodiazepine
Related Overdose
Deaths
Opioid and
Benzodiazepine
Related Overdose
Deaths
2010* 436 16.1 161 139
2011* 460 16.9 5% 165 143
2012* 436 15.9 -6% 162 140
2013* 395 14.1 -11% 126 106
2014* 366 12.9 -9% 125 109
2015* 409 14.2 11% 129 117
-12%Rates are per 100,000 Nevada Population.
Year HeroinNatural and Semi-
SyntheticMethadone Synthetic Opioids
Unspecified
Narcotic
2010* 19 298 98 39 44
2011* 40 301 96 45 46
2012* 42 301 68 25 40
2013* 48 241 69 25 39
2014* 61 217 63 31 37
2015* 79 254 57 31 37
A person can be included in more then one drug group, and therefore the counts above are not mutually exclusive.
* Data are preliminary and are subject to changes.
Opioid-Related Overdose Deaths by Drug Category, Nevada Residents, 2010-2015*
Percent Change 2010-2015
Opioid-Related Overdose Deaths, Nevada Residents, 2010-2015*
298 301 301
241217
254
0
50
100
150
200
250
300
350
2010* 2011* 2012* 2013* 2014* 2015*
Opioid-Related Overdose Deaths by Drug Category, Nevada Residents, 2010-2015*
Heroin Natural and Semi-Synthetic Methadone Synthetic Opioids Unspecified Narcotic
Each year:
• Roughly 85% of all benzodiazepine-related overdose deaths also involve opioids.
• Roughly 30% of all opioid-related overdose deaths also involve benzodiazepines.
436 460 436395
366409
0
100
200
300
400
500
2010* 2011* 2012* 2013* 2014* 2015*
Opioid-Related Overdose Deaths, Nevada Residents, 2010-2015*
Data as of 8/2017 6

Office of Public Health Informatics and Epidemiology
Division of Public and Behavioral Health
Race/Ethnicity % Crude Rates
White 82% 22.0
Hispanic 9% 4.6
Black 5% 9.0
Native American or Alaskan 1% 18.5
Asian or Pacific Islander 1% 2.3Rates are per 100,000 Nevada Population.
Year 0-14 15-24 25-34 35-44 45-54 55-64 65+
2010* 0 46 72 92 122 81 23
2011* 3 54 84 89 126 81 23
2012* 0 36 70 80 134 88 28
2013* 0 33 75 65 112 80 30
2014* 1 33 62 62 96 74 38
2015* 3 30 76 74 96 92 38
Opioid-Related Deaths by Intent, Nevada Residents, 2010-2015*Cause of Death N % Crude Rates
Accident 2,123 85% 12.7
Suicide 316 13% 1.9
Assult/Homicide 4 0% 0.0
Events of Undetermined Intent 59 2% 0.4
Total (2010-2015) 2,502 100% 15.0
Year Male Crude Rates Female Crude Rates
2010* 239 17.5 197 14.7
2011* 278 20.2 182 13.5
2012* 226 16.3 210 15.4
2013* 214 15.2 181 13.0
2014* 196 13.7 170 12.0
2015* 220 15.2 189 13.2Rates are per 100,000 Nevada Population.
*Data are preliminary and are subject to changes.
Opioid-Related Deaths by Race/Ethnicity, Nevada Residents, 2015*
Opioid-Related Deaths by Age Group, Nevada Residents, 2010-2015*
Opioid-Related Deaths by Sex, Nevada Residents, 2010-2015*
82%9%
5%1%
1%White
Hispanic
Black
Native American orAlaskanAsian or Pacific Islander
0
20
40
60
80
100
120
140
160
2010* 2011* 2012* 2013* 2014* 2015*
Opioid-Related Deaths by Age Group, Nevada Residents, 2010-2015*
0-14 15-24 25-34 35-44 45-54 55-64 65+
Data as of 8/2017 7

Office of Public Health Informatics and Epidemiology
Division of Public and Behavioral Health
*Data are preliminary and are subject to changes.
Opioid-Related Deaths, Nevada Residents, 2010-2015
0
10
20
30
40
50
60
Jan
uar
y
Feb
ruar
y
Mar
ch
Ap
ril
May
Jun
e
July
Au
gust
Sep
tem
be
r
Oct
ob
er
No
vem
ber
Dec
emb
er
Jan
uar
y
Feb
ruar
y
Mar
ch
Ap
ril
May
Jun
e
July
Au
gust
Sep
tem
be
r
Oct
ob
er
No
vem
ber
Dec
emb
er
Jan
uar
y
Feb
ruar
y
Mar
ch
Ap
ril
May
Jun
e
July
Au
gust
Sep
tem
be
r
Oct
ob
er
No
vem
ber
Dec
emb
er
Jan
uar
y
Feb
ruar
y
Mar
ch
Ap
ril
May
Jun
e
July
Au
gust
Sep
tem
be
r
Oct
ob
er
No
vem
ber
Dec
emb
er
Jan
uar
y
Feb
ruar
y
Mar
ch
Ap
ril
May
Jun
e
July
Au
gust
Sep
tem
be
r
Oct
ob
er
No
vem
ber
Dec
emb
er
Jan
uar
y
Feb
ruar
y
Mar
ch
Ap
ril
May
Jun
e
July
Au
gust
Sep
tem
be
r
Oct
ob
er
No
vem
ber
Dec
emb
er
2010 2011 2012 2013 2014 2015*
Nu
mb
er
of
De
ath
s
Data as of 8/2017 8