neutralization of acidic discharges from abandoned
TRANSCRIPT
[fu 1946SI REPORT OF INVESTIGATIONS/1993
/
Neutralization of Acidic Discharges From Abandoned Underground Coal Mines by Alkaline Injection
By William W. Aljoe and Jay W. Hawkins
Borehole discharge
Vent
Portal seal
- Natlonal1nstitute for I . 1 ('"j~ety & -Healtb (l)ccupatlona1 ,),.!
Spokane Research Center B 315 Montgomery Ave •
. Spokane, W A 99201 IJibrary
W8
W3 W9
United States Department of the Interior
Bureau of Mines
U.S. Department o/the Interior Mission Statement
As the Nation's principal conservation agency, the Department of the Interior has responsibility for most of our nationally-owned public lands and natural resources. T11is includes fostering sound use of our land and water resources; protecting our fish, wildlife, and biological diversity; preserving the environmental and cultural values of our national parks and historical places: and providing for the enjoyment of life through outdoor recreation. The Department assesses our energy and mineral resources and works to ensure that their development is in the best interests of all our people by encouraging stewardship and citizen participation in their care. The Department also has a major responsibility for American Indian reservation communities and for people who live in island territories under U.S. administration.
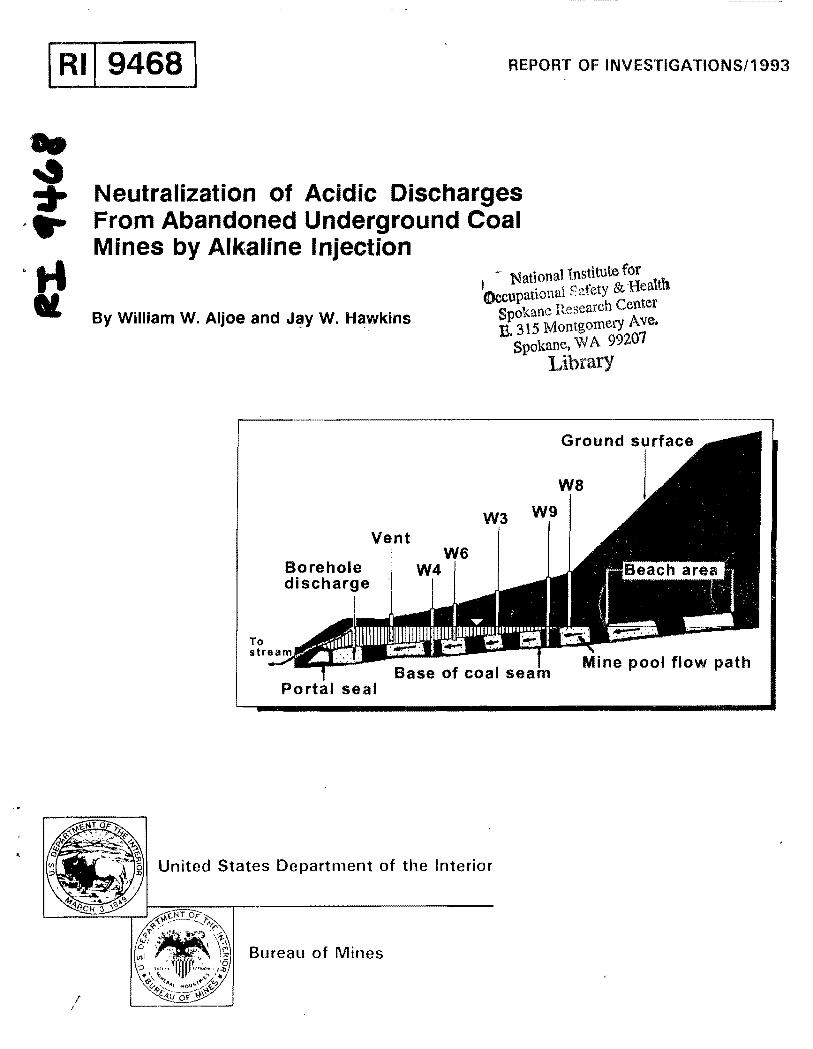
Cover Photograph: Mine poolflow system at alkaline injection study site.

Report of Investigations 9468
Neutralization of Acidic Discharges From Abandoned Underground Coal Mines by Alkaline Injection
By William W. Aljoe and Jay W. Hawkins
UNITED STATES DEPAR"rMENT OF THE INTERIOR Bruce Babbitt, Secretary
BUREAU OF MINES
Library of Congress Cataloging in Publication Data:
AJjoe, William W. Neutralization of acidic discharges from abandoned underground coal mines by
alkaline injection / by William W. A1joe and Jay W. Hawkins.
p. em. - (Report of investigations; 9468)
Includes bibliographical references (p. 36).
1. Acid mine drainage. 2. Neutralization (Ol.emistry). 3. Sodium hydroxide. 4. Abandoned coal mines-Pennsylvania. I. Hawkins, Jay W. ll. Title. ID. Series: Report of investigations (United States. Bureau of Mines); 9468.
TN23.N43 [TD899.M5] 622 s-dc20 [622' .5] 92-46322 CIP
CONTENTS Page
Abstract. . . . . . . . . . . . . . . . . . . . . . . . . . . . . . . . . . . . . . . . . . . . . . . . . . . . . . . . . . . . . . . . . . . . . . . . . . . 1 Introduction ................................................... , . . . . . . . . . . . . . . . . . . . . 2 Acknowledgments . . . . . . . . . . . . . . . . . . . . . . . . . . . . . . . . . . . . . . . . . . . . . . . . . . . . . . . . . . . . . . . . . . . . 3 Identification and description of study sites ................................................. 4
Site description-Keystone State Park ................................................... 4 Site description-Friendship IIiIl NHS . . . . . . . . . . . . . . . . . . . . . . . . . . . . . . . . . . . . . . . . . . . . . . . . . . . 6
Hydrologic evaluation of mine pools-Keystone State Park . . . . . . . . . . . . . . . . . . . . . . . . . . . . . . . . . . . . . . 7 Data from mine sealing report ........................................................ 7 Estimate of mine pool size . . . . . . . . . . . . . . . . . . . . . . . . . . . . . . . . . . . . . . . . . . . . . . . . . . . . . . . . . . . 8 Drilling and installation of monitoring wells . . . . . . . . . . . . . . . . . . . . . . . . . . . . . . . . . . . . . . . . . . . . . . . 8 Conceptual flow system ............................................................. 9 Mine discharge flow rates and pool levels ................................................ 11 Response of mine pool to precipitation . . . . . . . . . . . . . . . . . . . . . . . . . . . . . . . . . . . . . . . . . . . . . . . . . . 11 Water quality considerations. . . . . . . . . . . . . . . . . . . . . . . . . . . . . . . . . . . . . . . . . . . . . . . . . . . . . . . . . . 13 Tracer test . . . . . . . . . . . . . . . . . . . . . . . . . . . . . . . . . . . . . . . . . . . . . . . . . . . . . . . . . . . . . . . . . . . . . . . 16
Hydrologic evaluation of mine pools-Friendship IIiIl NHS ..................................... 19 Drilling and installation of monitoring wells . . . . . . . . . . . . . . . . . . . . . . . . . . . . . . . . . . . . . . . . . . . . . . . 19 Conceptual flow system ............................................................. 20 Mine discharge flow rates and pool levels ................................................ 21 Response to precipitation ............................................................ 24 Water quality considerations . . . . . . . . . . . . . . . . . . . . . . . . . . . . . . . . . . . . . . . . . . . . . . . . . . . . . . . . . . 24 Tracer test .. . . . . . . . . . . . . . . . . . . . . . . . . . . . . . . . . . . . . . . . . . . . . . . . . . . . . . . . . . . . . . . . . . . . . . 26
Alkaline injection ........ . . . . . . . . . . . . . . . . . . . . . . . . . . . . . . . . . . . . . . . . . . . . . . . . . . . . . . . . . . . . 29 Selection of test site . . . . . . . . . . . . . . . . . . . . . . . . . . . . . . . . . . . . . . . . . . . . . . . . . . . . . . . . . . . . . . . . 29 Application of alkaline solution . . . . . . . . . . . . . . . . . . . . . . . . . . . . . . . . . . . . . . . . . . . . . . . . . . . . . . . . 29 Water quality in alkaline injection wells. . . . . . . . . . . . . . . . . . . . . . . . . . . . . . . . . . . . . . . . . . . . . . . . . . 30 Water quality at mine discharge ....................................................... 30 Postinjection efforts ................................................................ 35
Summary and discussion . . . . . . . . . . . . . . . . . . . . . . . . . . . . . . . . . . . . . . . . . . . . . . . . . . . . . . . . . . . . . . . 36 References . . . . . . . . . . . . . . . . . . . . . . . . . . . . . . . . . . . . . . . . . . . . . . . . . . . . . . . . . . . . . . . . . . . . . . . . . 36
ILLUSTRATIONS
1. Study sites for alkaline injection project ................................................ 3 2. Geologic structure of Keystone site ................................................... 4 3. Approximate boundaries of deep mine and mine pool, Keystone site .... . . . . . . . . . . . . . . . . . . . . . . . 5 4. Pipe network at mine discharge, Keystone site ........................................... 5 5. Geologic structure of Friendship Hill site ........ . . . . . . . . . . . . . . . . . . . . . . . . . . . . . . . . . . . . . . . 6 6. Approximate locations of mine entries and coal outcrop (1929 mine map), Friendship Hill site. . . . . . . . 6 7. Mine floor contours and pool limit, Keystone site . . . . . . . . . . . . . . . . . . . . . . . . . . . . . . . . . . . . . . . . . 8 8. Monitoring well locations, Keystone site . . . . . . . . . . . . . . . . . . . . . . . . . . . . . . . . . . . . . . . . . . . . . . . . 9 9. Mine pool monitoring well construction ................................................ 10
10. Cross section of mine pool, Keystone site . . . . . . . . . . . . . . . . . . . . . . . . . . . . . . . . . . . . . . . . . . . . . . . 10 11. Mine discharge flows and pool elevations, Keystone site .................................... 11 12. Linear regression-mine pool level versus flow, Keystone site ... ',' . . . . . . . . . . . . . . . . . . . . . . . . . . . 12 13. Mine pool response to precipitation, Keystone site ........................................ 12 14. Acidity concentrations at mine discharge, Keystone site. . . . . . . . . . . . . . . . . . • . . . . . . . . . . • • . • . • • . 13 15. Linear regression-flow versus acidity loading, Keystone site ................................. 14 16. Interval sampler used in mine voids ................................................... 14 17. Average water quality in monitoring wells and mine discharge, Keystone site. . . . . . . . . . . . . . . . . . . . . 15 18. Alternate mine pool flow path, Keystone site ............................................ 16

ii
ILLUSTRATIONS-Continued Page
19. Stratification of water quality in mine voids, Keystone site. . . . . . . . . . . . . . . . . . . . . . . . . . . . . . . . . . . 17 20. Estimated flow path of bromide tracer, Keystone site ...................................... 17 21. Decline of bromide concentrations at well 3, Keystone site .................................. 18 22. Estimated seat clay contours, Friendship Hill site ......................................... 19 23. Water elevation contours, Friendship Hill site. . . . . . . . . . . . . . . . . . . . . . . . . . . . . . . . . . . . . . . . . . . . 20 24. Cross section of mine pool, Friendship Hill site .......................................... 21 25. Mine discharge flow rates, Friendship Hill site ........................................... 22 26. Linear regression-flow rate at main discharge versus secondary discharge, Friendship Hill site ....... 22 27. Water elevations in monitoring wells, Friendship Hill site ................................... 23 28. Response of mine pool to precipitation, Friendship Hill site ................................. 24 29. Acidity and sulfate concentrations at main discharge, Friendship Hill site . . . . . . . . . . . . . . . . . . . . . . . . 25 30. Iron concentrations, ferrous percentages, and pH at main discharge, Friendship Hill site ............ 26 31. Average water quality in monitoring wells and mine discharges, Friendship Hill site. . . . . . . . . . . . . . . . 27 32. Comparison of water quality parameters in well 6 and main discharge, Friendship Hill site . . . . . . . . . . . 28 33. Decline of bromide concentrations at tracer injection well and monitoring well, Friendship Hill site .... 29 34. Potential flow paths of injected alkaline solution, Keystone site ............................... 30 35. Sulfate and acidity concentrations in alkaline injection wells, Keystone site. . . . . . . . . . . . . . . . . . . . . . . 31 36. Acidity and total iron concentrations at mine discharge, Keystone site ............ . . . . . . . . . . . . . . 32 37. Aluminum, manganese, and sodium concentrations at mine discharge, Keystone site ............... 32 38. Arrival of injected sodium at mine discharge, Keystone site . . . . . . . . . . . . . . . . . . . . . . . . . . . . . . . . . . 33 39. Diagram of hypothetical sodium mixing process, Keystone site ............................... 34 40. Sodium loading at mine discharge after alkaline injection, Keystone site ........................ 35
TABLES
1. Monitoring well data, Keystone State Park .............................................. 9 2. Monitoring well data, Friendship Hill NHS . . . . . . . . . . . . . . . . . . . . . . . . . . . . . . . . . . . . . . . . . . . . . . 20 3. Rationale for selection of alkaline injection site .......................................... 29
UNIT OF MEASURE ABBREVIATIONS USED IN THIS REPORT
ft foot gpm gallon per minute
ft2 square foot h hour
ft/d foot per day in inch
ft3/d cubic foot per day kg kilogram
ft/min foot per minute mg/L milligram per liter
gal gallon
NEUTRALIZATION OF ACIDIC DISCHARGES FROM ABANDONED UNDERGROUND COAL MINES BY ALKALINE INJECTION
By William W. Aljoe1 and Jay W. Hawkins2
ABSTRACT
The hydrologic characteristics of two abandoned underground coal mine sites, near Latrobe, PA, and Uniontown, PA, were investigated by the U.s. Bureau of Mines for possible implementation of alkaline injection into the mine pools as a means of abating their acid discharges. The Latrobe site was chosen for a one-time application of alkaline injection to achieve a partial, short-term neutralization of a limited portion of~e mine pool. A quantity of alkaline reagent (sodium hydroxide) sufficient for a one-time neutralization of the water in this portion of the pool was added. Although nearly all of the neutralizing reagent had moved away from the injection wells within 6 weeks, no evidence of neutralization was noted at the mine discharge during the study period. This lack of neutralization probably occurred because the injection wells did not intercept a primary flow path through the mine. Criteria for successful application of alkaline injection at this or other sites include (1) positive identification of the primary flow paths through the mine pool and (2) addition of quantities of alkaline reagent sufficient to neutralize the entire volume of the pool along the primary flow path.
lEnvironmental engineer. 2Hydrologist. Pittsburgh Research Center, U.S. Bureau of Mines, Pittsburgh, PA.

2
INTRODUCTION
Discharges from abandoned underground coal mines contribute 70% to 75% of the acidic drainage from abandoned or inactive coal mines in Appalachia (1-2).3 These acid discharges degrade the quality of streams and ground water by decreasing the pH and contributing dissolved metals and sulfate, thereby negatively affecting aquatic life (3). In addition, acid stream water can add to the cost of water resource development. In certain areas, special construction techniques, corrosion-resistant materials, and special reservoir operation schedules must be used to moderate low-flow acid degradation extremes (4).
Water treatment generally alleviates the problem of acid discharges from active mines, but the cost of building and maintaining treatment facilities and associated sludge disposal operations makes this solution impractical for abandoned mines. In an abandoned mine, the acidic water is derived from dissolution of acid-forming salts formed at closure and stored in the mine pool and from ongoing pyrite oxidation in the mine void, roof fractures, and underclay. Even if pyrite oxidation was to cease, the large quantity of stored acidity in the mine pool could take many years to discharge completely (5).
To control and mitigate the effect of acid mine drainage, the V.S. Bureau of Mines and other organizations have conducted research to determine the viability of alkaline injection as a method of abating acidic mine pool discharges. Alkaline injection, as its name implies, involves injecting an alkaline solution through boreholes from the surface into carefully selected portions of the mine void. A study by Poissant and Caruccio (6) suggested that addition of alkalinity to underground mine pools may have the potential to neutralize stored acidity, precipitate metals from solution, and reduce further pyrite oxidation by inhibiting bacterial activity. Also, since the precipitates form and remain in situ, the problem of sludge disposal would be less severe. An earlier study by Stoddard (7) found that, under appropriate flow conditions, precipitates that formed during injection of hydrated lime and limestone would settle out and remain in the mine while neutral or alkaline water discharged. The precipitates were also found to seal or reduce flow through a sand barrier in a simulated mine adit. The subsequent field study to investigate the sealing capability of the precipitate showed limited success because the water flow was only stopped for a short time. An important byproduct of the investigation, though, was continued neutralization of the mine water.
Injection of alkaline fluids into surface mine spoils as a means of abating acidic discharges from toe-of-spoil seeps
3(talic numbers in parentheses refer to items in the list of references at the end of this report.
was attempted by at least six mining companies or contractors in the early 1980's (8). None of these attempts was successful in achieving a significant improvement in spoil water quality; however, the documentation of these efforts was insufficient to derme with certainty the reasons for failure. Part of the problem may have been the use of concentrated lime slurries as the source of alkalinity, coupled with the low ground water flow velocities within the spoil. Inefficient mixing of the lime slurries with the spoil water may have resulted in the settlement of suspended lime, inhibiting the desired neutralization reactions. Surface coatings of iron hydroxide precipitates also may have prevented the settled lime from reacting further with spoil water.
In at least one case (9), acidic discharges were mitigated by flooding an underground mine with alkaline solutions upon closure. Prior to flooding in 1984, seals were installed at three mine portals to control discharge, and phosphate rock dust was applied to the physically accessible entries in the vicinity of the anticipated pool. (A study by Stiller (10) previously had shown that phosphate can remove substantial quantities of ferric iron (Fe3+) from solution as an insoluble precipitate (FeP04), inhibiting the oxidation of pyrite by Fe3+.) A lime slurry then was introduced through a pipe in one of the seals, and a sodium hydroxide solution was injected through boreholes near the anticipated updip edge of the mine pool until the mine was partially inundated. Lime slurry injection continued until 1988, and discharge contaminant concentrations remained below effluent limits until the spring of 1989. At that time, although pH and acidity levels remained acceptable, iron concentrations rose from less than 1 to about 15 mg/L. However, this still represented a considerable improvement compared with the original poor water quality. The sealing and flooding effort proved cost-effective, with a total cost of $1.3 million compared with a projected 4O-year treatment cost of $4.7 million.
The success of an alkaline injection system during mine closure was encouraging. but its potential for use at abandoned mines was still questionable. In abandoned mines, a potentially large pool of acidic water has already formed. Since the water in the pool fluctuates, and can act as both a source of water for pyrite oxidation and a means for flushing contaminants from pyritic surfaces, it may be necessary to neutralize the pool completely before the alkaline conditions needed for bacterial inhibition can be achieved. More importantly, neutralization minimizes the adverse effect that mine pools can have on local ground water quality. However, physical access to the mine is usually impossible, and initial estimates of pool size and location must be based on old, often inadequate
mine maps. Although boreholes can be used to help delineate pool limits, their number and location are often limited by cost and/or surface accessibility. Finally, even if the mine pool can be located and neutralized, periodic retreatment may be necessary to maintain neutralization due to continued acid formation in the unflooded mine sections. Therefore, the cost of implementing alkaline. injection at an abandoned site would probably be greater than at a mine undergoing closure. However, the longterm cost still may be less than that of conventional treatment, especially when considering sludge disposal costs, so a study directed toward the application of alkaline injection at an abandoned mine appeared to be warranted.
In 1986-87, the Bureau initially investigated the feasibility of alkaline injection at an abandoned underground mine. Although substantial quantities of water were found in the mine during a 1983 underground survey, six of the seven wells drilled in 1987 failed to intercept a flow path with measurable water levels. The mine-discharge to mine-area ratio was on the order of 10-8, and a single-well tracer test revealed a flow rate on the order of 0.1 to 0.2 ft/d. Because of this low flow rate, the results would not have been recognized at the discharge point for 10 to 20 years. Although alkaline injection would most likely have been effective, the project was discontinued because it would not be practical to monitor a research project for such a long tilne period. The advantage of a low flow velocity, though, would be achieving long-term neutralization and potential inhibition of pyrite oxidation with fewer injection episodes.
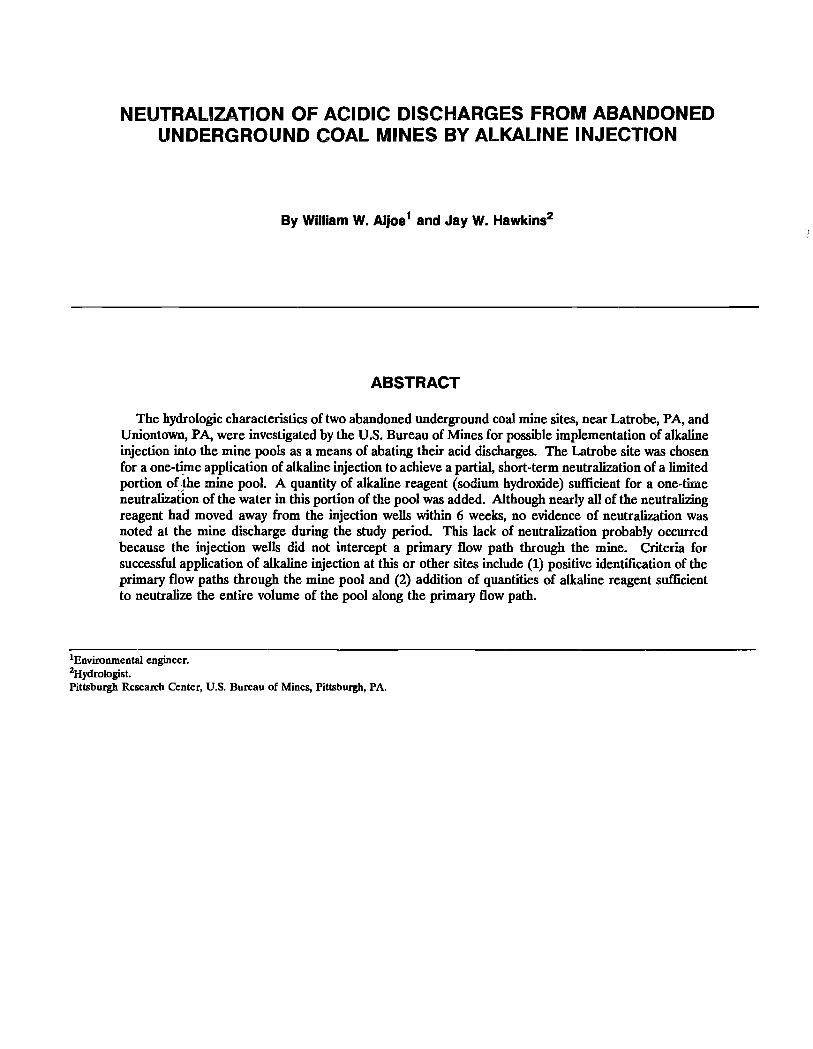
The study described in this report was designed to investigate the hydrologic factors that would control the implementation of alkaline injection in an abandoned underground mine. An initial survey of known abandoned mine discharges was made to locate several sites that had potential for alkaline injection. Background data on these sites were then reviewed, and two sites in western Pennsylvania subsequently were determined to be worthy of further hydrologic investigations. These two sites were at Keystone State Park, near Latrobe, PA, and Friendship Hill National Historic Site (NHS), near Uniontown, PA, (fig. 1). These hydrologic investigations consisted of
o I
t N
Scale, miles
Washington •
Pittsburgh ,.
PENNSYLVANIA
WEST VIRGINIA
.uniontown
• Latrobe
FRIENDSHIP HILL NATIONAL HISTORIC SITE
Figure 1.-Study sites for alkaline Injection project.
3
(1) monitoring mine discharge flow and quality, (2) drilling and installing wells for mine pool monitoring and possible alkaline injection points, (3) monitoring water levels and quality in the wells, and (4) performing tracer tests to determine mine pool flow rates, flow paths, and pool volume turnover time. From these investigations, the Keystone State Park site was chosen for a one-time application of alkaline injection to achieve a partial, short-term neutralization of the mine pool. Given the high initial cost of alkaline injection during mine closure, the results of the hydrologic investigation at the Keystone site (described in this report), and the added uncertainty associated with this abandoned mine, it was recognized that a full-scale field demonstration could not be attempted. However, it was believed that the results of the initial application at the Keystone site would provide valuable information that could be used to evaluate the general feasibility of the technique in the future at this and other sites.
ACKNOWLEDGMENTS
The authors thank the following individuals for coordinating field activities and collecting mine discharge water samples and flow rates during the course of this study: Michael Bucheit, superintendent, and Jay Burns,
maintenance foreman, Pennsylvania Department of Environmental Resources (DER), Keystone State Park; and Steve Linderer, site manager, and Del Barton, park ranger, U.S. National Park Service, Friendship Hill NHS.
4
IDENTIFICATION AND DESCRIPTION OF STUDY SITES
The existence of a distinct, continuous, measurable mine pool was the most important factor governing the selection of potential study sites. In abandoned mines, such a pool is most likely to be found behind the portal of a sealed, updip drift mine. The initial site selection plan was to identify one or more mine sites with pools of this type, conduct preliminary hydrologic studies, and select the one site at which alkaline injection would be most likely to succeed. Initial site selection was based on the existence of a measurable acidic discharge at a discrete point or points, availability of mine maps, a high discharge flow rate per unit mine area, and a relatively shallow overburden. In order to identify mines that met these criteria, geologic and mine map data were obtained for several sites known to contain acidic underground mine discharges. Mining permit files of the Bureau of Mining and Reclamation, Pennsylvania DER, Greensburg, PA, office, were also reviewed for potential sites.
The two field sites selected for initial hydrologic evaluation were in Keystone State Park, near Latrobe, PA, and Friendship Hill NHS, near Uniontown, PA, (fig. 1). These two sites met all the preliminary site selection criteria, and had the advantage of being located on public property. At the Keystone site, the portal seals were installed deliberately with the intent of flooding the mine. At Friendship Hill, the portals became sealed as the result of roof collapses and emplacement of strip mine spoils. The following sections describe these study sites in terms of their geologic settings, mining history, and potential viability for alkaline injection.
SITE DESCRIPTION-KEYSTONE STATE PARK
One of the advantages of the Keystone site was its relatively well-documented history compared with most abandoned mine sites. The primary source of information was a report on an attempt to develop and use a gel material for sealing one of the mine portals (11).
Documentation of subsequent mine reclamation projects was obtained from the Bureau of Abandoned Mine Reclamation, Pennsylvania DER. Keystone Park personnel also provided mine maps and valuable information on previous activities dealing with the abandoned mine.
The mine at Keystone State Park, which was originally known as the Salem No. 2 Mine of the Atlantic Crushed Coke Co., was developed in the Upper Freeport Coal Seam using room-and-pillar methods. According to former mine workers, mining began in 1938 and ceased during the 1950's. Available maps showed that the mined area covered approximately 300 acres, most of which was
located beneath park property. Seam thickness ranged from 4 to 6 ft.
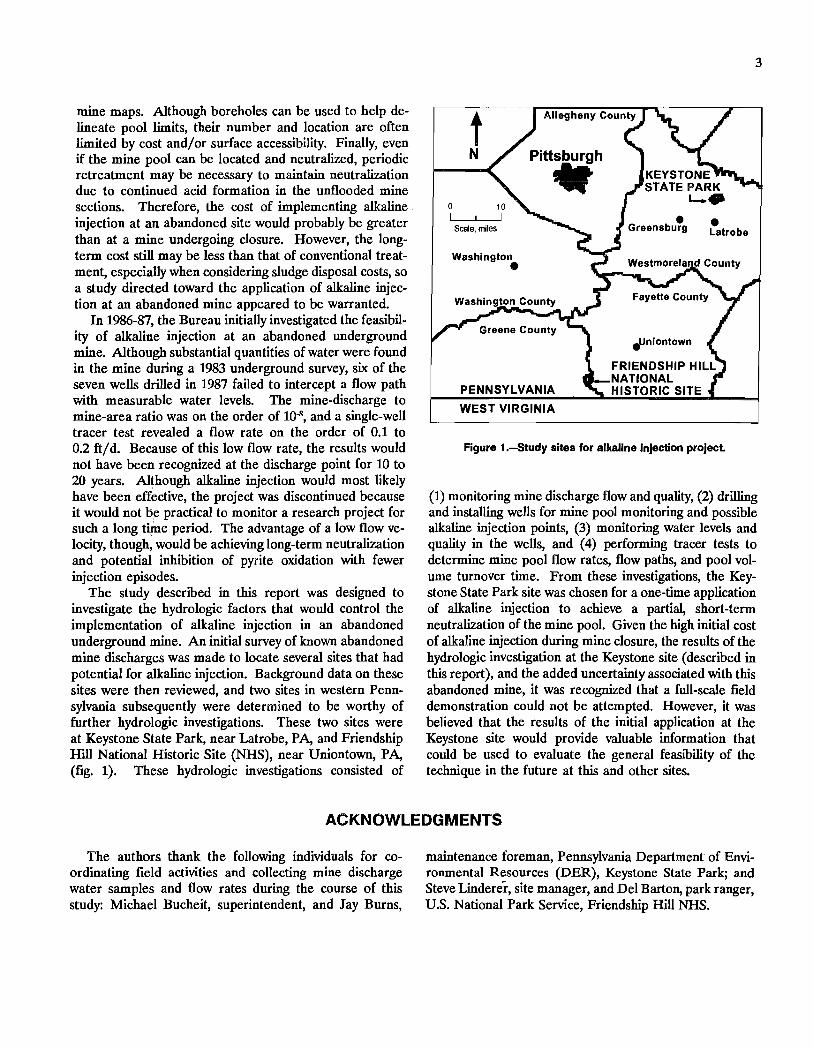
Figure 2 illustrates the general geologic structure in the vicinity of the Keystone site (12) and fJ.gUl"e 3 depicts the overall extent of the mine workings. Most of the mine workings were situated on the northwest limb of the Fayette anticline, although southeast portions of the mine crossed the anticlinal axis. According to a mine map dated 1941, the main mine entries were driven upgradient from an outcrop at a structural low point of the coal seam. Most of the initial mine development occurred to the east and southeast of the mains, also slightly upgradient with respect to geologic structure. A few panel headings were driven to the southwest, approximately along strike, but these were much shorter in length and did not support extensive room development. This pattern of mining suggests that the entries were laid out such that water would drain away from the working faces and toward the portals. When the mains reached the axis of the Fayette anticline, extensive sets of panel entries and rooms could be driven
Scale, miles
2 I
Figure 2.-Oeologlc structure of Keystone site; structure contours on Upper Freeport Coal.
to both the southeast and southwest without causing adverse water conditions at the faces.
The most recent map available for the mine, dated 1971, included existing roads and topography but did not contain mine floor elevations. This map was prepared in connection with the previously cited mine sealing report. In that project, the east and west main entries were sealed with double-bulkhead concrete and aggregate seals commonly used at that time. A concrete wall seal with a pipe drain at its base was placed in the center entry, from which most of the mine drainage emanated. The purpose of the pipe drain was to allow the mine to be temporarily free-draining while an experimental grout and fly ash seal was installed behind the concrete wall. The experimental seal failed, and the mine drainage continued to discharge freely through the pipe in the center entry.
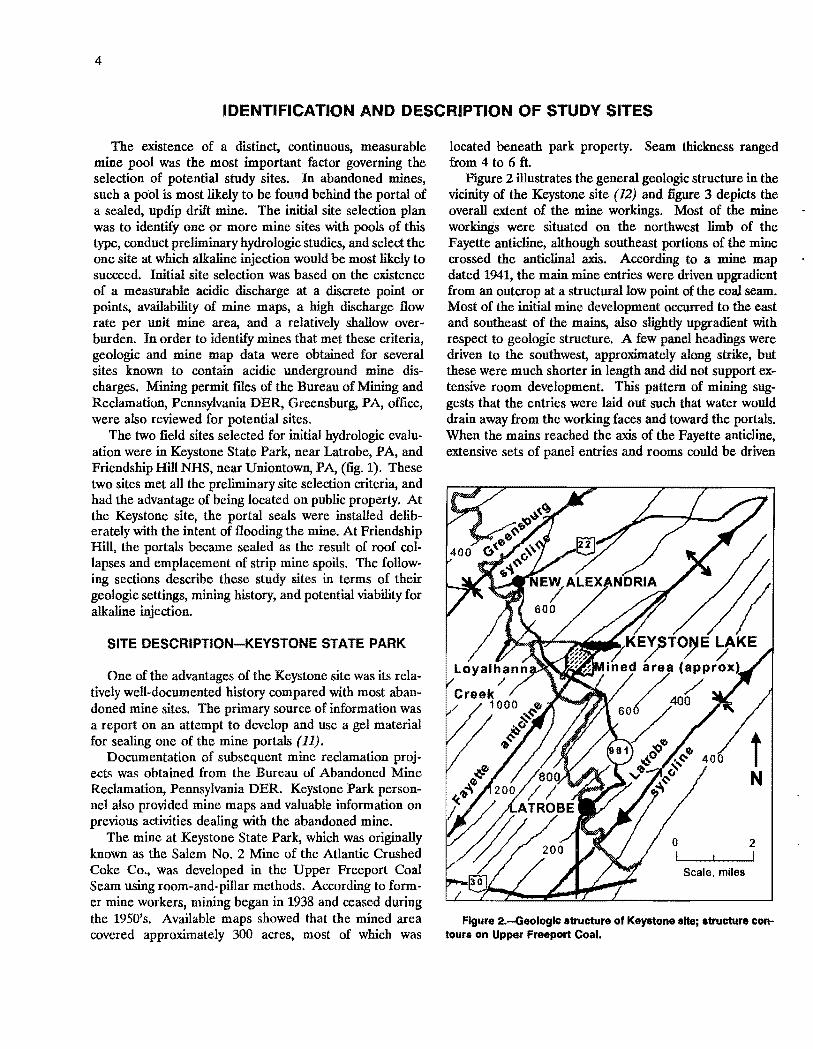
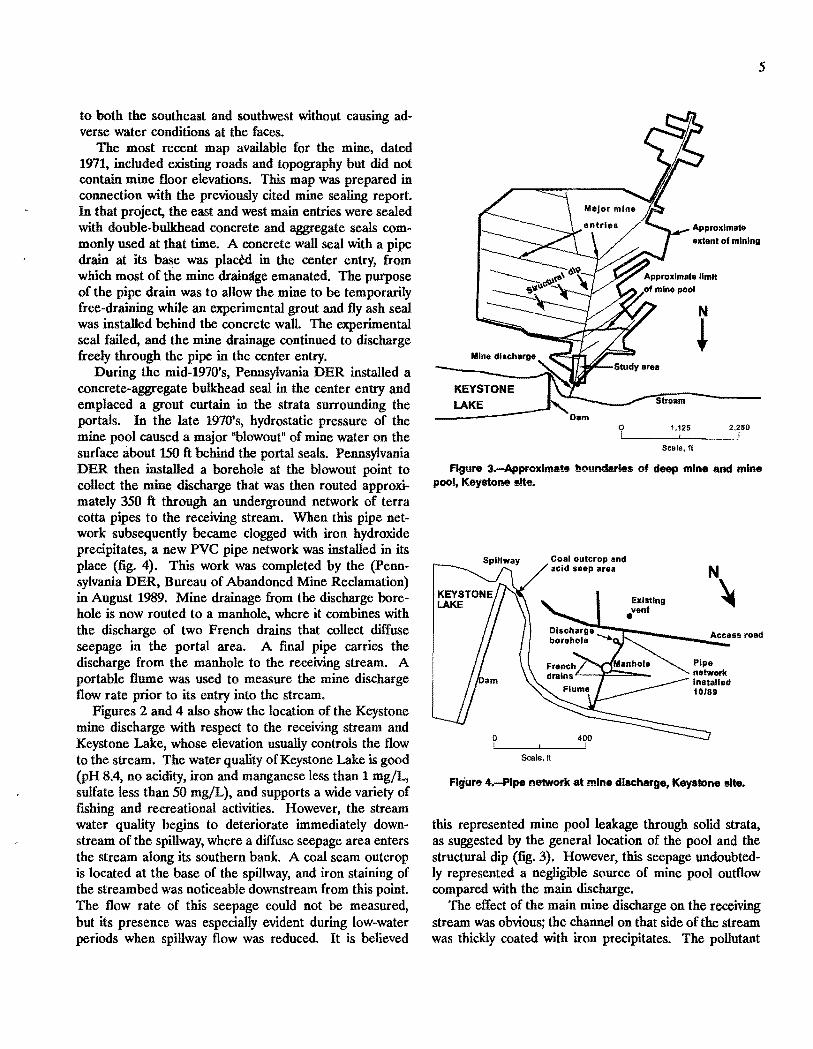
During the mid-1970's, Pennsylvania DER installed a concrete-aggregate bulkhead seal in the center entry and emplaced a grout curtain in the strata surrounding the portals. In the late 1970's, hydrostatic pressure of the mine pool caused a major "blowout" of mine water on the surface about 150 ft behind the portal seals. Pennsylvania DER then installed a borehole at the blowout point to collect the mine discharge that was then routed approximately 350 ft through an underground network of terra cotta pipes to the receiving stream. When this pipe network subsequently became clogged with iron hydroxide precipitates, a new PVC pipe network was installed in its place (fig. 4). This work was completed by the (pennsylvania DER, Bureau of Abandoned Mine Reclamation) in August 1989. Mine drainage from the discharge borehole is now routed to a manhole, where it combines with the discharge of two French drains that collect diffuse seepage in the portal area. A fmal pipe carries the discharge from the manhole to the receiving stream. A portable flume was used to measure the mine discharge flow rate prior to its entry into the stream.
Figures 2 and 4 also show the location of the Keystone mine discharge with respect to the receiving stream and Keystone Lake, whose elevation usually controls the flow to the stream. The water quality of Keystone Lake is good (pH 8.4, no acidity, iron and manganese less than 1 mg/L, sulfate less than 50 mg/L), and supports a wide variety of fishing and recreational activities. However, the stream water quality begins to deteriorate immediately downstream of the spillway, where a diffuse seepage area enters the stream along its southern bank. A coal seam outcrop is located at the base of the spillway, and iron staining of the streambed was noticeable downstream from this point. The flow rate of this seepage could not be measured, but its presence was especially evident during low-water periods when spillway flow was reduced. It is believed
KEYSTONE LAKE
Scale. ft
5
N
+
Figure 3.-Approxlmate boundaries of deep mine and mine pool, Keystone alte.
Coal outcrop and acid seep area N
~ e:::::t:::::--__ ......!A~c~cee88 road
Scale.ft
Figure 4.-Plpe network at mine discharge, Keystone alte.
this represented mine pool leakage through solid strata, as suggested by the general location of the pool and the structural dip (fig. 3). However, this seepage undoubtedly represented a negligIble source of mine pool outflow compared with the main discharge.
The effect of the main mine discharge on the receiving stream was obvious; the channel on that side of the stream was thickly coated with iron precipitates. The pollutant
6
concentration downstream of the mine discharge depends largely on the amount of water released at the spillway. For most of the year, the stream flow released by the spillway is sufficient to assimilate the mine discharge. In very dry summer periods, however, the lake level drops below the top of the spillway, eliminating flow to the receiving stream. At these times, the acid seep and mine discharge are the dominant sources of water in the stream, and the resulting high contaminant concentrations cannot be tolerated by most aquatic species.
SITE DESCRIPTION-FRIENDSHIP HILL NHS
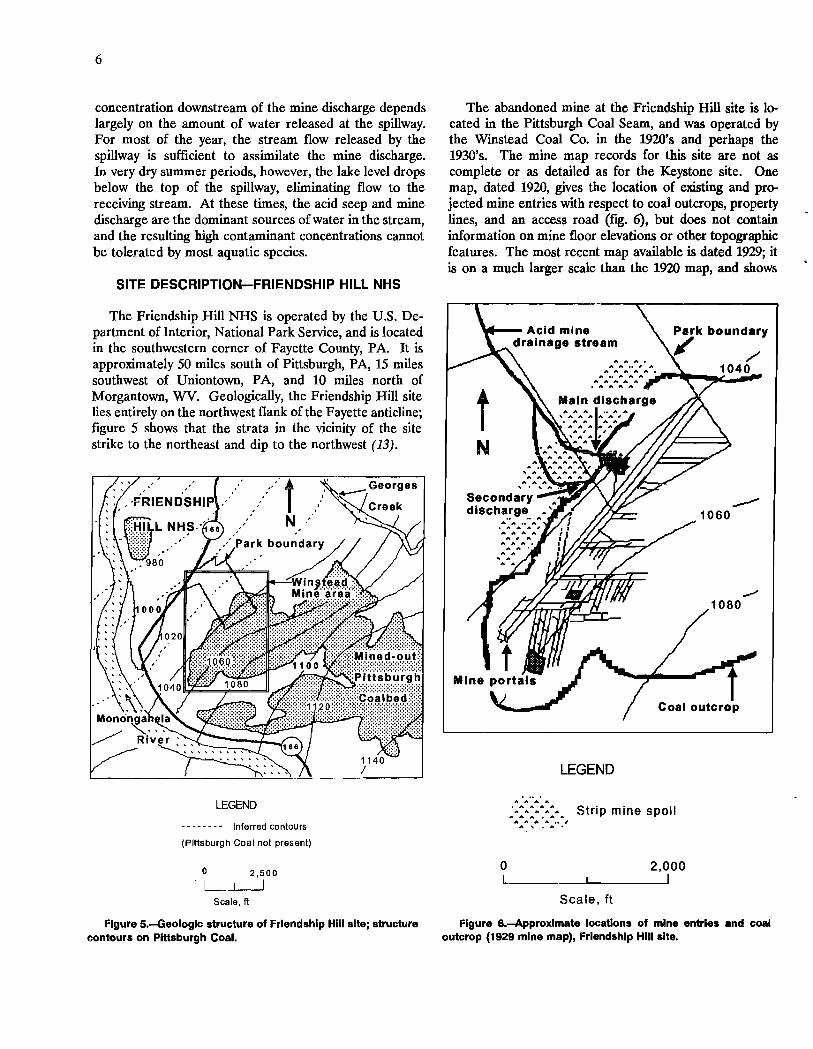
The Friendship Hill NHS is operated by the U.S. Department of Interior, National Park Service, and is located in the southwestern corner of Fayette County, P A. It is approximately 50 miles south of Pittsburgh, PA, 15 miles southwest of Uniontown, PA, and 10 miles north of Morgantown, WV. Geologically, the Friendship Hill site lies entirely on the northwest flank of the Fayette anticline; figure 5 shows that the strata in the vicinity of the site strike to the northeast and dip to the northwest (13).
LEGEND
- - - - • - - - Inferred contours
(Pittsburgh Coal not present)
o I
Scale, ft
2,500
I
Figure 5.-Geologlc structure of Friendship Hili site; structure contours on Pittsburgh Coal.
The abandoned mine at the Friendship Hill site is located in the Pittsburgh Coal Seam, and was operated by the Winstead Coal Co. in the 1920's and perhaps the 1930's. The mine map records for this site are not as complete or as detailed as for the Keystone site. One map, dated 1920, gives the location of existing and projected mine entries with respect to coal outcrops, property lines, and an access road (fig. 6), but does not contain information on mine floor elevations or other topographic features. The most recent map available is dated 1929; it is on a much larger scale than the 1920 map, and shows
~-- Acid mine drainage stream
t N
Secondary dlsch~~g~. ,,"
It. A .. A • ,. It. ,. ,
It. A A A .. , ..
,. ,. It. ,.
LEGEND
• A A A A ,. A It. A ,.
,. It. A • A A A A A A •• ,
A , • A •
Strip mine spoil
o
Scale, ft
2,000 I
-"'" 1060
Figure 6.-Approxlmate locations of mine entries and coal outcrop (1929 mine map), Friendship Hili alte.
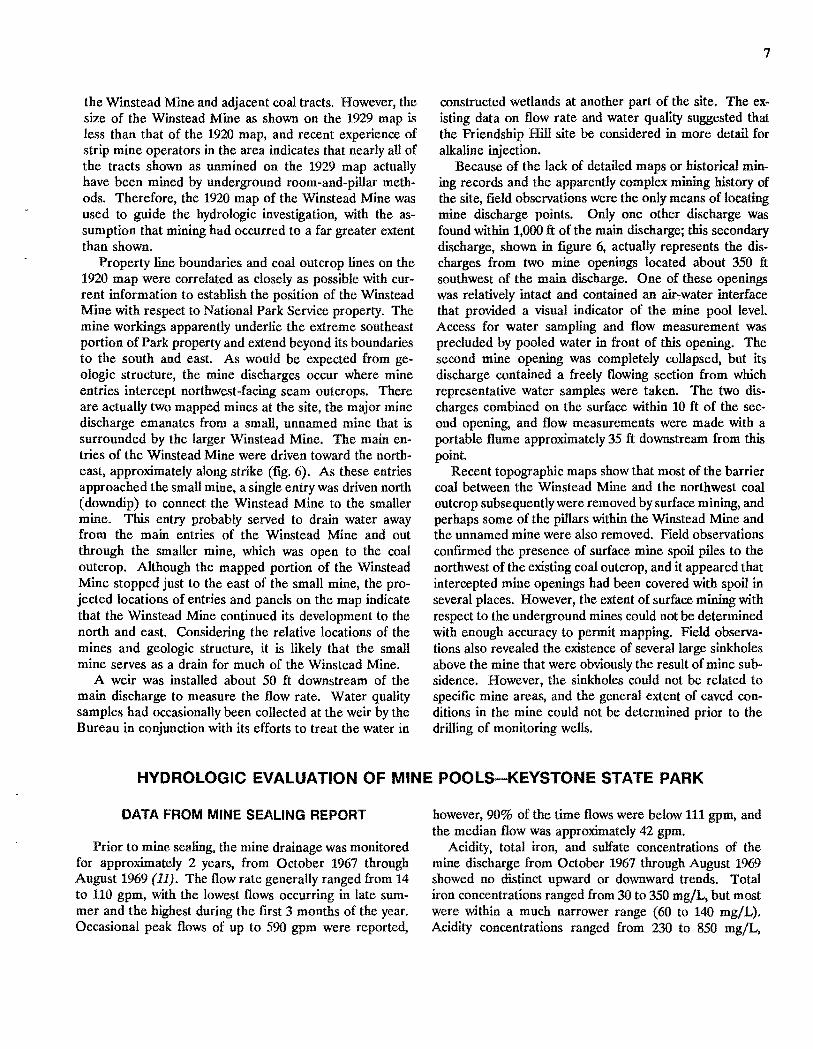
the Winstead Mine and adjacent coal tracts. However, the size of the Winstead Mine as shown on the 1929 map is less than that of the 1920 map, and recent experience of strip mine operators in the area indicates that nearly all of the tracts shown as unmined on the 1929 map actually have been mined by underground room-and-pillar methods. Therefore, the 1920 map of the Winstead Mine was used to guide the hydrologic investigation, with the assumption that mining had occurred to a far greater extent than shown.
Property line boundaries and coal outcrop lines on the 1920 map were correlated as closely as possible with current information to establish the position of the Winstead Mine with respect to National Park Service property. The mine workings apparently underlie the extreme southeast portion of Park property and extend beyond its boundaries to the south and east. As would be expected from geologic structure, the mine discharges occur where mine entries intercept northwest-facing seam outcrops. There are actually two mapped mines at the site, the major mine discharge emanates from a small, unnamed mine that is surrounded by the larger Winstead Mine. The main entries of the Winstead Mine were driven toward the northeast, approximately along strike (fig. 6). As these entries approached the small mine, a single entry was driven north (downdip) to connect the Winstead Mine to the smaller mine. This entry probably served to drain water away from the main entries of the Winstead Mine and out through the smaller mine, which was open to the coal outcrop. Although the mapped portion of the Winstead Mine stopped just to the east of the small mine, the projected locations of entries and panels on the map indicate that the Winstead Mine continued its development to the north and east. Considering the relative locations of the mines and geologic structure, it is likely that the small mine serves as a drain for much of the Winstead Mine.
A weir was installed about 50 ft downstream of the main discharge to measure the flow rate. Water quality samples had occasionally been collected at the weir by the Bureau in conjunction with its efforts to treat the water in
7
constructed wetlands at another part of the site. The existing data on flow rate and water quality suggested that the Friendship Hill site be considered in more detail for alkaline injection.
Because of the lack of detailed maps or historical mining records and the apparently complex mining history of the site, field observations were the only means of locating mine discharge points. Only one other discharge was found within 1,000 ft of the main discharge; this secondary discharge, shown in figure 6, actually represents the discharges from two mine openings located about 350 ft southwest of the main discharge. One of these openings was relatively intact and contained an air~water interface that provided a visual indicator of the mine pool level. Access for water sampling and flow measurement was precluded by pooled water in front of this opening. The second mine opening was completely collapsed, but its discharge contained a freely flowing section from which representative water samples were taken. The two discharges combined on the surface within 10 ft of the second opening, and flow measurements were made with a portable flume approximately 35 ft downstream from this point.
Recent topographic maps show that most of the barrier coal between the Winstead Mine and the northwest coal outcrop subsequently were removed by surface mining, and perhaps some of the pillars within the Winstead Mine and the unnamed mine were also removed. Field observations confirmed the presence of surface mine spoil piles to the northwest of the existing coal outcrop, and it appeared that intercepted mine openings had been covered with spoil in several places. However, the extent of surface mining with respect to the underground mines could not be determined with enough accuracy to permit mapping. Field observations also revealed the existence of several large sinkholes above the mine that were obviously the result of mine subsidence. However, the sinkholes could not be related to specific mine areas, and the general extent of caved conditions in the mine could not be determined prior to the drilling of monitoring wells.
HYDROLOGIC EVALUATION OF MINE POOLS-KEYSTONE STATE PARK
DATA FROM MINE SEALING REPORT
Prior to mine sealing, the mine drainage was monitored for approximately 2 years, from October 1967 through August 1969 (11). The flow rate generally ranged from 14 to 110 gpm, with the lowest flows occurring in late summer and the highest during the first 3 months of the year. Occasional peak flows of up to 590 gpm were reported,
however, 90% of the time flows were below 111 gpm, and the median flow was approximately 42 gpm.
Acidity, total iron, and sulfate concentrations of the mine discharge from October 1967 through August 1969 showed no distinct upward or downward trends. Total iron concentrations ranged from 30 to 350 mg/L, but most were within a much narrower range (60 to 140 mgJL). Acidity concentrations ranged from 230 to 850 mgJL,
8
mostly within 350 to 600 mg/L. Sulfate concentrations ranged from 600 to 2,500 mg/L, mostly within 1,000 to 1,800 mg/L. However, the total pollution load was more closely related to flow than to concentration; peak loads generally corresponded to peak flows. This indicated that the mine drainage was being released primarily from storage during the peak flow periods, and was not being diluted with significant quantities of cleaner surface water at these times. The increased flows probably resulted from increased infiltration at some distance away from the portal area, which would increase the pool elevations and flows without immediately affecting contaminant concentrations at the discharge.
ESTIMATE OF MINE POOL SIZE
Beginning in late 1988, efforts were made to locate the upgradient limit of the mine pool (the "beach" area) prior to drilling in order to guide the placement of holes that eventually would be used for alkaline injection. By injecting in the beach area, the maximum volume of pool water would be exposed to alkaline material. Also, the air-water interface and the cyclic wetting and drying conditions in the beach area made it a likely area of pyrite oxidation and subsequent acid production. If predominantly alkaline conditions could be created in the beach area, alkaline injection could serve as both a treatment and a preventive technique.
Unfortunately, no data were available on mine pool elevations, discharge rates, or water quality during and after the portal sealing effort (1969 through 1988). The only available indicator of the pool level was a steel-cased vent hole located approximately 250 ft behind the portal area. The mine sealing report showed that this hole once had penetrated a crosscut in the mine, but field observations indicated that it had been plugged subsequently in some manner. Water quality in the vent hole was somewhat less acidic than that of the mine discharge; however, the water level did not drop appreciably when bailed. This indicated that the vent hole was hydrologically connected to a strong recharge source, probably the mine pool. Also, the electrical conductivity of the water in the vent hole increased steadily during bailing, indicating that the incoming water was of poorer quality than the standing water. This supported the assumption that the vent hole was hydrologically connected to the mine pool, despite the apparent lack of a direct physical connection with the mine void.
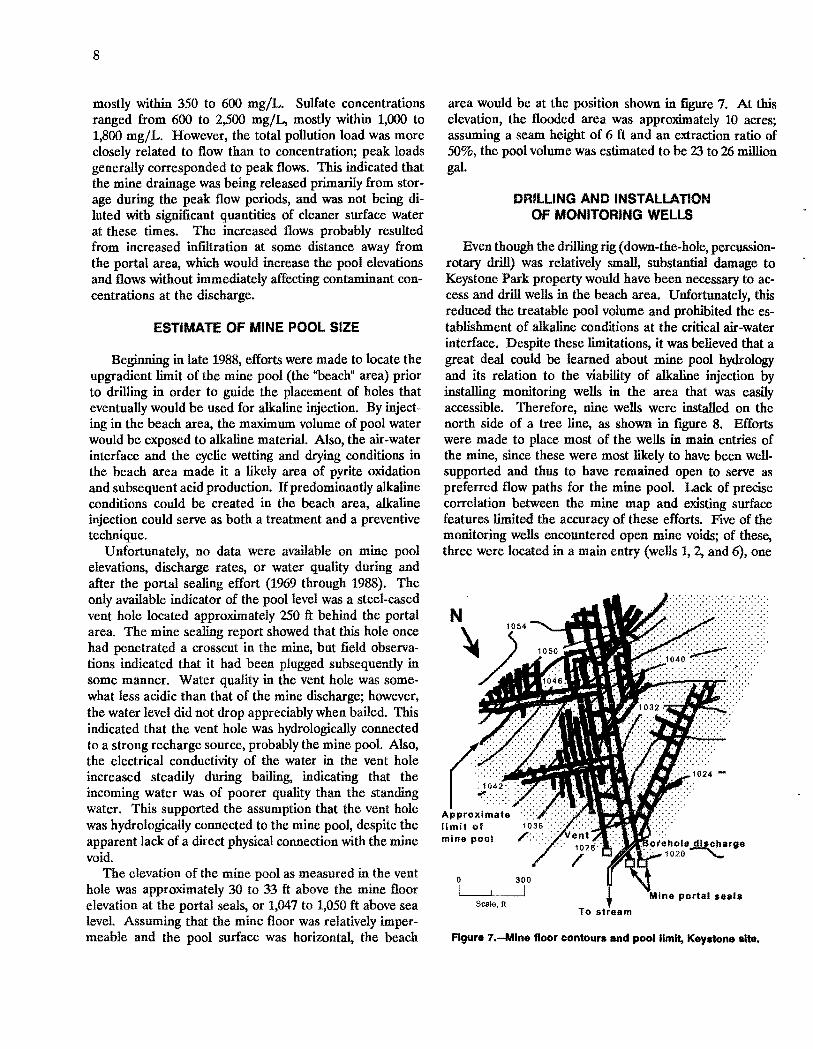
The elevation of the mine pool as measured in the vent hole was approximately 30 to 33 ft above the mine floor elevation at the portal seals, or 1,047 to 1,050 ft above sea level. Assuming that the mine floor was relatively impermeable and the pool surface was horizontal, the beach
area would be at the position shown in figure 7. At this elevation, the flooded area was approximately 10 acres; assuming a seam height of 6 ft and an extraction ratio of 50%, the pool volume was estimated to be 23 to 26 million gal.
DRILLING AND INSTALLATION OF MONITORING WELLS
Even though the drilling rig (down-the-hole, percussionrotary drill) was relatively small, substantial damage to Keystone Park property would have been necessary to access and drill wells in the beach area. Unfortunately, this reduced the treatable pool volume and prohibited the establishment of alkaline conditions at the critical air-water interface. Despite these limitations, it was believed that a great deal could be learned about mine pool hydrology and its relation to the viability of alkaline injection by installing monitoring wells in the area that was easily accessible. Therefore, nine wells were installed on the north side of a tree line, as shown in figure 8. Efforts were made to place most of the wells in main entries of the mine, since these were most likely to have been wellsupported and thus to have remained open to serve as preferred flow paths for the mine pooL Lack of precise correlation between the mine map and existing surface features limited the accuracy of these efforts. Five of the monitoring wells encountered open mine voids; of these, three were located in a main entry (wells 1, 2, and 6), one
Approximate limit of mine pool
o I I
Scale, ft e portal seals
To stream
Figure 7.-Mlne floor contour. and pool limit, Keystone alte.

o 300
I I Scale, It
Figure 8.-Monltoring well locations, Keystone site.
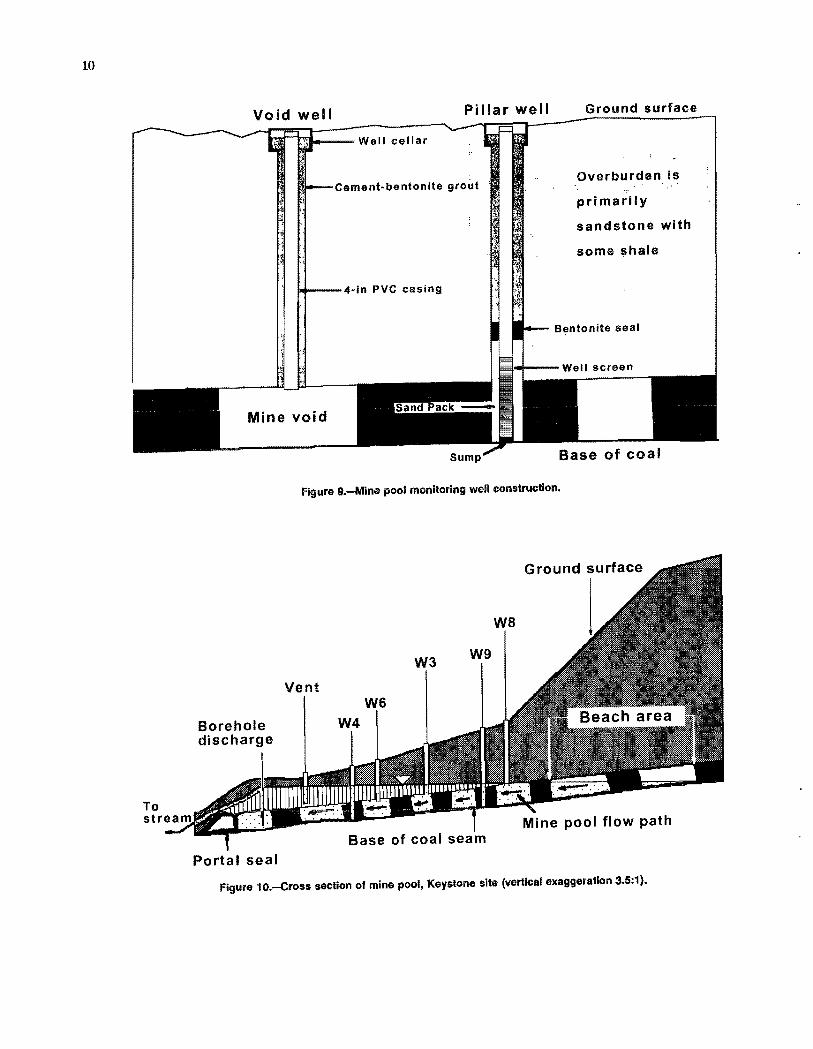
was in a submain (well 3), and one was in a room entry (well 8). Four of the wells penetrated solid coal (wells 4, 5, 7, and 9). AILdrill holes had a 6-1/4 in diam and were cased with 4-in diam PVC pipe. In void wells, the annulus between the casing and hole was grouted completely from the top of the mine void to the surface. In wells penetrating solid coal (pillar wells), 10-ft-Iong screens with annular sand packs were installed through the coal and isolated from the grout by a il-ft layer of bentonite. Figure 9 illustrates the general construction of the wells, and table 1 lists their elevations and depths.
CONCEPTUAL FLOW SYSTEM
One of the most important tasks of the hydrologic investigation was to characterize the nature of the subsurface flow system. Unlike a typical ground water system, which
9
has a regular, lateral hydraulic potential gradient that governs the rate and direction of flow, the Keystone mine pool had a horizontal piezometric surface; i.e., the water levels in all void wells were essentially the same (table 1). Figure 10 is a cross section of the Keystone site showing the conceptual pool flow system. This system is somewhat analogous to a surface water reservoir with an underdrain discharge; flow occurs because the drains (mine voids) are open to the atmosphere (via the discharge borehole) at an elevation that is somewhat lower than that of the pool surface. Lateral flow occurs primarily through the open mine entries at the base of the system in a direction generally perpendicular to the geologic structure contours due to the location of the discharge borehole. The immeasurably small flow of the acidic seep at the base of the spillway suggested that lateral flow through the overburden and solid coal was relatively insignificant. Flow through the saturated overburden was vertically downward toward the voids. The absence of surface subsidence and the fact that no caved conditions were encountered during drilling suggested that all voids shown in figure 10 remained completely open and were equally likely to serve as conduits for mine pool flow.
Water elevations in pillar wells (table 1) were close to those in the voids except for wells 7 and 9, whose elevations were slightly higher. The pillar wells generally recharged very slowly when water was removed, compared with the instantaneous recharge of the void wells. Based on these data and the substantial differences in water quality between the void wells and the pillar wells (see "Water Quality Considerations" section), it was determined that flow to the pillar wells came primarily from the overburden and that comparatively little pool flow was occurring through the pillars. Further studies on the interrelationship between the void and pillar wells currently are underway; in this report, emphasis is placed on the void wells because they were most important in terms of performing alkaline injection.
Table 1.-Monitoring well data, Keystone State Park
Well Surface Type Depth to top of Depth to under- Mean water elev, ft coal or void, ft clay, ft elev, ftl
1,076.56 Void ...... 40 49 1,049.07 2 1,081.59 · .do. 46 52 1,049.07 3 1,083.37 · .do. 45 50.6 1,049.05 4 1,065.20 Pillar 33 38 1,049.01 5 1,071.51 · .do. 41 45 1,049.04 6 1,070.02 Void ...... 37 44 1,049.06 7 1,062.88 Pillar . . . . . 37 41 1,049.39 8 1,097.78 Void ...... 57 62 1,049.00 9 1,091.72 Pillar ..... 50 56 1,049.68 Vent .. 1,059.90 Unknown .. NAp NAp 1,049.08 NAp Not applicable. IAverage water elevation, 10/10/89 - 12/18/90.
10
Void well Pillar well
nJM:~-- Well cellar
Cement· be nton ite grout
.... --4·ln pvc casing
Mine void
Figure 9.-Mlne pool monitoring well construction.
Ground surface
Overburden Is
pri marily
sandstone with
some ,hale
Ground surface
Borehole discharge
Portal seal
Vent
W8
W3 W9
W6
Base of coal seam
Figure 10.-Cross section of mine pool. Keystone site (vertical exaggeration 3.5:1).
MINE DISCHARGE FLOW RATES AND POOL LEVELS
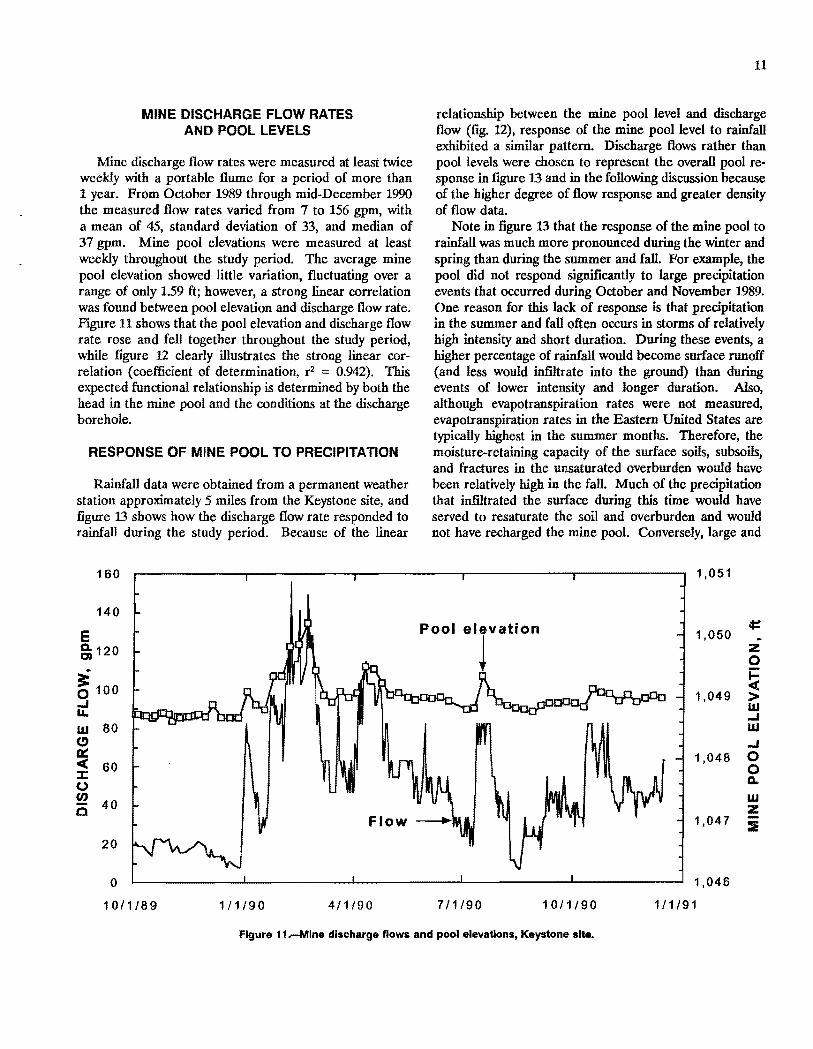
Mine discharge flow rates were measured at least twice weekly with a portable flume for a period of more than 1 year. From October 1989 through mid-December 1990 the measured flow rates varied from 7 to 156 gpm, with a mean of 45, standard deviation of 33, and median of 37 gpm. Mine pool elevations were measured at least weekly throughout the study period. The average mine pool elevation showed little variation, fluctuating over a range of only 1.59 ft; however, a strong linear correlation was found between pool elevation and discharge flow rate. Figure 11 shows that the pool elevation and discharge flow rate rose and fell together throughout the study period, while figure 12 clearly illustrates the strong linear correlation (coefficient of determination, r2 = 0.942). This expected functional relationship is determined by both the head in the mine pool and the conditions at the discharge borehole.
RESPONSE OF MINE POOL TO PRECIPITATION
Rainfall data were obtained from a permanent weather station approximately 5 miles from the Keystone site, and figure l3 shows how the discharge flow rate responded to rainfall during the study period. Because of the linear
160
140
E ~ 120
~ 100 ...J I&.
W 80 C) 0:: « 60 ::J: o fI) 40 Q
20
o 10/1/89 111190 4/1/90
11
relationship between the mine pool level and discharge flow (fig. 12), response of the mine pool level to rainfall exhibited a similar pattern. Discharge flows rather than pool levels were chosen to represent the overall pool response in figure 13 and in the following discussion because of the higher degree of flow response and greater density of flow data.
Note in figure 13 that the response of the mine pool to rainfall was much more pronounced during the winter and spring than during the summer and fall. For example, the pool did not respond significantly to large precipitation events that occurred during October and November 1989. One reason for this lack of response is that precipitation in the summer and fall often occurs in storms of relatively high intensity and short duration. During these events, a higher percentage of rainfall would become surface runoff (and less would infiltrate into the ground) than during events of lower intensity and longer duration. Also, although evapotranspiration rates were not measured, evapotranspiration rates in the Eastern United States are typically highest in the summer months. Therefore, the moisture-retaining capacity of the surface soils, subsoils, and fractures in the unsaturated overburden would have been relatively high in the fall. Much of the precipitation that infiltrated the surface during this time would have served to resaturate the soil and overburden and would not have recharged the mine pool. Conversely, large and
Pool elevation
l
7/1/90 1011/90
1,051
1,050
1,049
1,048
1,047
1,046
1/1191
~
z o ~ > W ...J W ...J o o Q.
W z ::E
Figure 11.-Mlne discharge flows and pool elevations, Keystone site.

12
160
140
E 120 a. 0)
~ 100
o 0.942 IJ IlJ
0 ..J U- 80 W C) 0= 60 « ::E: 0 40 ~ C
20
a 1,048.6 1,049.0 1,049.4 1,049.8 1,050.2
MINE POOL ELEVATION, ft
Figure 12.-Unear regresslon--mlne pool level versus now, Keystone site, 10/89·12/90.
2.0 ~--------~----------~----------~---------r----------,-----~160
1.8
1.6 c:
..J 1.4
..J <I( ~
Z ;( a=
1.2
1.0
>- .8 ..J ;( C .6
.4
.2
o 8/1/89
Ra nfall
11/1/89
140 E .... ---Flow
120
100
80
60
40
20
o 2/1/90 5/1/90 8/1/90 11/1/90 111191
e Q. CD
Figure 13.-Mlne pool response to precipitation, Keystone site; events A and B denote winter response; events C, D, and E denote summer·fall response.
rapid pool responses coincided with rainfall and snowmelt events on December 26, 1989 through January 2, 1990, and January 18-22, 1990, (events A and B in figure 13), despite the fact that these events were no larger than those that had occurred during the fall. Prior to these responses, a steady series of rainfall and snowmelt events may have combined with lower evapotranspiration rates to allow the moisture content of the overburden to approach field capacity. The onset of additionctl precipitation and infiltration then would have caused rapid recharge to the mine pool and the subsequent increases in pool level and flow. This pattern of large, rapid pool responses continued through April 1990.
During May and June 1990 increased evapotranspiration (longer days and new plant activity) reduced the moisture content of the soil and overburden. The resulting decrease in pool recharge rate was probably responsible for the observed decline in flow during this period, since precipitation remained fairly consistent. However, during early July, September, and October 1990, rainfall events were apparently large and frequent enough to achieve the level of resaturation necessary to permit a noticeable pool response (events C, D, and E in figure 13). Note, however, that the magnitude of the pool response during events A and B was much larger than in events C, D, and E, despite the larger magnitude of precipitation in the latter three events. This supports the notion that the mine pool level
160
140
i 120 CD
~ 100 o ..J U. 80 w CJ ~ 60 ::I: o !! 40 Q
20
13
and flow rate were controlled more by seasonal differences in infutration than by the magnitUde of antecedent precipitation.
WATER QUALITY CONSIDERATIONS
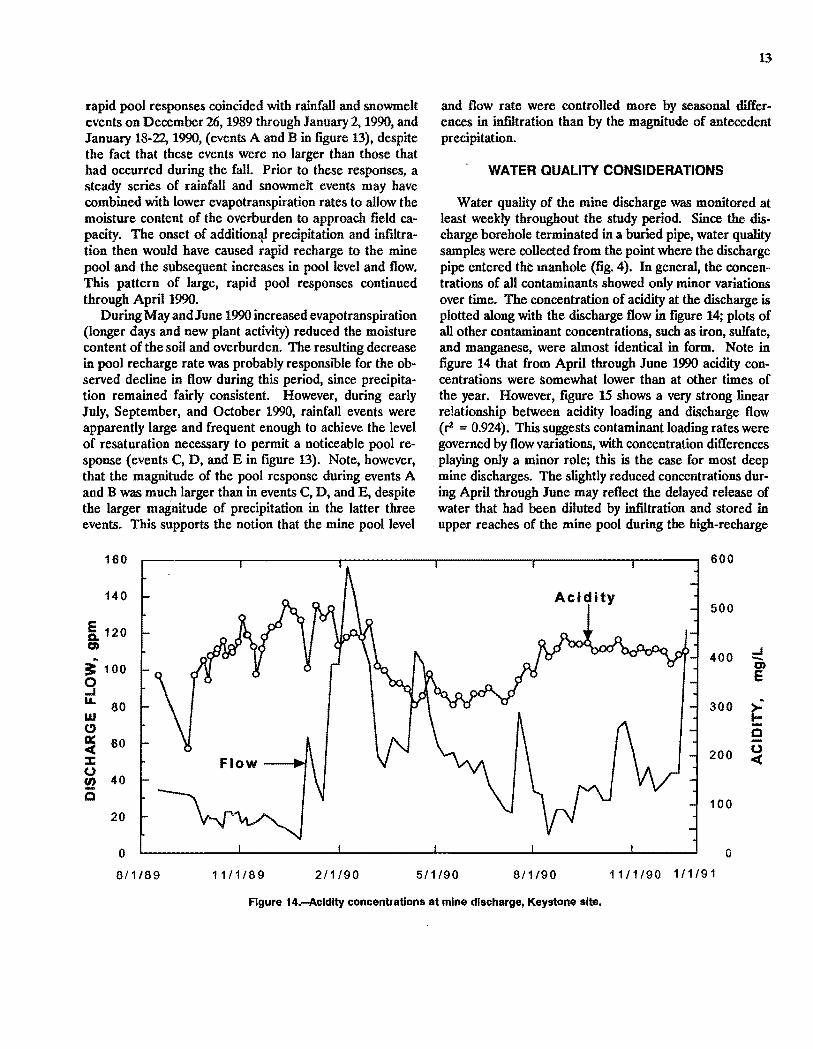
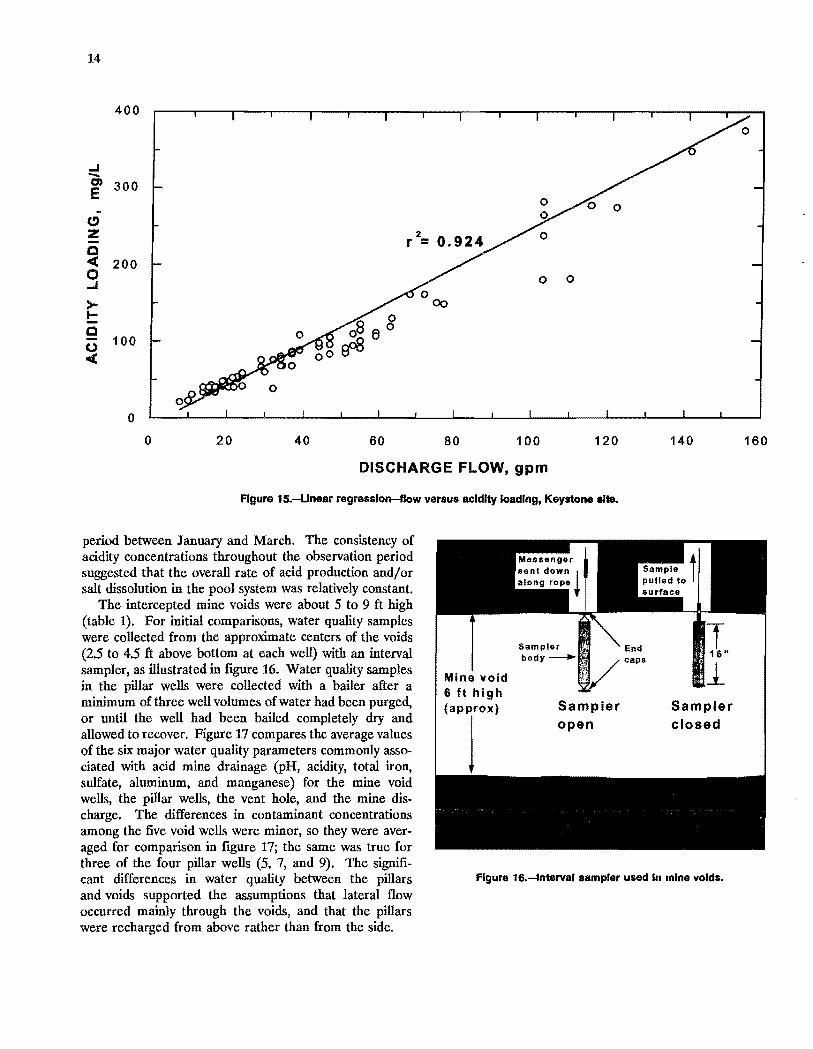
Water quality of the mine discharge was monitored at least weekly throughout the study period. Since the discharge borehole terminated in a buried pipe, water quality samples were collected from the point where the discharge pipe entered the manhole (fig. 4). In general, the concentrations of all contaminants showed only minor variations over time. The concentration of acidity at the discharge is plotted along with the discharge flow in figure 14; plots of all other contaminant concentrations, such as iron, sulfate, and manganese, were almost identical in form. Note in figure 14 that from April through June 1990 acidity concentrations were somewhat lower than at other times of the year. However, figure 15 shows a very strong linear relationship between acidity loading and discharge flow (r2 = 0.924). This suggests contaminant loading rates were governed by flow variations, with concentration differences playing only a minor role; this is the case for most deep mine discharges. The slightly reduced concentrations during April through June may reflect the delayed release of water that had been diluted by infiltration and stored in upper reaches of the mine pool during the high-recharge
600
Acidity 500
400 ..J -CD E
300
200
100
o o 8/1/89 1111189 2/1/90 511/90 8/1/90 1111/90 111191
Figure 14.-Acldlty concentrations at mine discharge, Keystone site.
14
400
...I -CD 300 E ~
C) z e c( 200 0 ...I
>-t-e 0 100 c(
o o 20 40 60 80 100 120
DISCHARGE FLOW. gpm
Figure 15.-Unear regresslon-flow versus acidity loading. Keystone alte.
period between January and March. The consistency of acidity concentrations throughout the observation period suggested that the overall rate of acid production and/or salt dissolution in the pool system was relatively constant.
Mine void 6 ft high (aPr)
Sampler body - .... I~I
Sampler open
140
Sampler closed
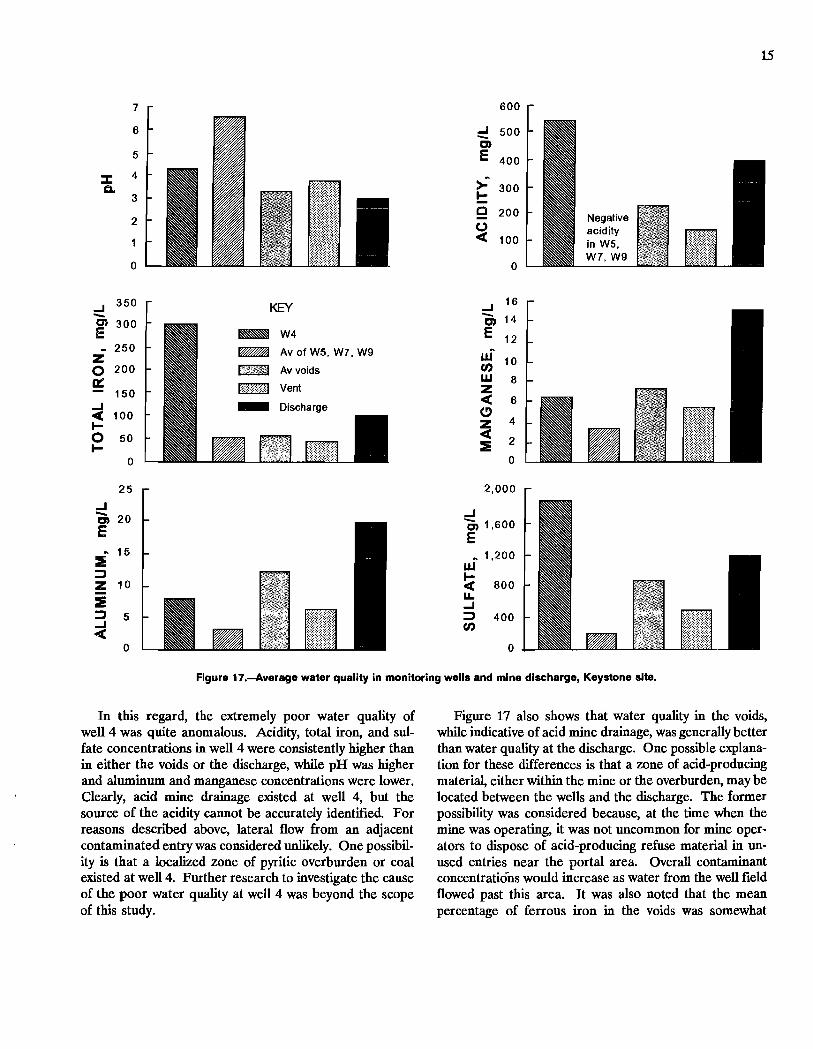
The intercepted mine voids were about 5 to 9 ft high (table 1). For initial comparisons, water quality samples were collected from the approximate centers of the voids (2.5 to 4.5 ft above bottom at each well) with an interval sampler, as illustrated in figure 16. Water quality samples in the pillar wells were collected with a bailer after a minimum of three well volumes of water had been purged, or until the well had been bailed completely dry and allowed to recover. Figure 17 compares the average values of the six major water quality parameters commonly associated with acid mine drainage (pH, acidity, total iron, sulfate, aluminum, and manganese) for the mine void wells, the pillar wells, the vent hole, and the mine discharge. The differences in contaminant concentrations among the five void wells were minor, so they were averaged for comparison in figure 17; the same was true for three of the four pillar wells (5, 7, and 9). The significant differences in water quality between the pillars and voids supported the assumptions that lateral flow occurred mainly through the voids, and that the pillars were recharged from above rather than from the side.
Figure 16.-Interval sampler used In mine voids.
160
15
7 600
6 ..J 500 -en 5 E 400
::I: 4 >" Q. 300
3 l-e 200
2 0 « 100
0 0
..J 350 KEY ..J 16 - - 14 en 300 en
E ~ W4 E 12 ~ 250 ~ Av of W5, W7, W9 Z W 10
0 200 [::J:!£:iNSJ Av voids VJ a::: W 8
150 I:::::::::::~:::::::I Vent Z ..J - Discharge « 6
« 100 C)
I- Z 4
0 50 « 2 I- ::IE
0 0
25 2,000
..J ..J - 20 en t;, 1,600 E E
15 ~ 1,200 ::E W ~
~ Z 10 800
::E u.. ..J
~ 5 ~ 400 ..J VJ «
0 0
Figure 17.-Average water quality in monitoring wells and mine discharge, Keystone site.
In this regard, the extremely poor water quality of well 4 was quite anomalous. Acidity, total iron, and sulfate concentrations in well 4 were consistently higher than in either the voids or the discharge, while pH was higher and aluminum and manganese concentrations were lower. Clearly, acid mine drainage existed at well 4, but the source of the acidity cannot be accurately identified. For reasons described above, lateral flow from an adjacent contaminated entry was considered unlikely. One possibility is that a localized zone of pyritic overburden or coal existed at well 4. Further research to investigate the cause of the poor water quality at well 4 was beyond the scope of this study.
Figure 17 also shows that water quality in the voids, while indicative of acid mine drainage, was generally better than water quality at the discharge. One possible explanation for these differences is that a zone of acid-producing material, either within the mine or the overburden, may be located between the wells and the discharge. The former possibility was considered because, at the time when the mine was operating, it was not uncommon for mine operators to dispose of acid-producing refuse material in unused entries near the portal area. Overall contaminant concentrations would increase as water from the well field flowed past this area. It was also noted that the mean percentage of ferrous iron in the voids was somewhat
16
higher than at the discharge (86% versus 75%). Under the scenario above, this difference may have occurred N because of conditions within the discharge borehole and \ • the 135-ft length of PVC pipe that connected the borehole ~ discharge to the sampling point. Here, the turbulent flow conditions and exposure to the atmosphere would allow oxidation of some of the iron from the ferrous to the ferric state.
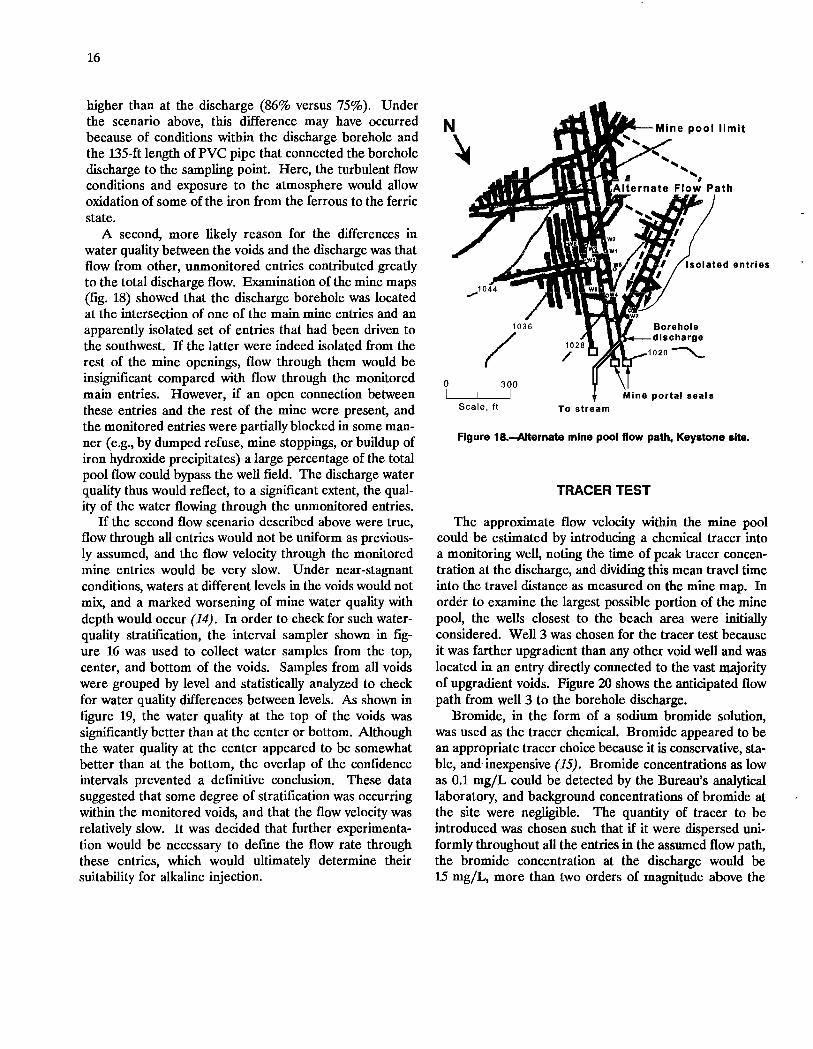
A second, more likely reason for the differences in water quality between the voids and the discharge was that flow from other, unmonitored entries contributed greatly to the total discharge flow. Examination of the mine maps (fig. 18) showed that the discharge borehole was located at the intersection of one of the main mine entries and an apparently isolated set of entries that had been driven to the southwest. If the latter were indeed isolated from the rest of the mine openings, flow through them would be insignificant compared with flow through the monitored main entries. However, if an open connection between these entries and the rest of the mine were present, and the monitored entries were partially blocked in some manner (e.g., by dumped refuse, mine stoppings, or buildup of iron hydroxide precipitates) a large percentage of the total pool flow could bypass the well field. The discharge water quality thus would reflect, to a significant extent, the qual-ity of the water flowing through the unmonitored entries.
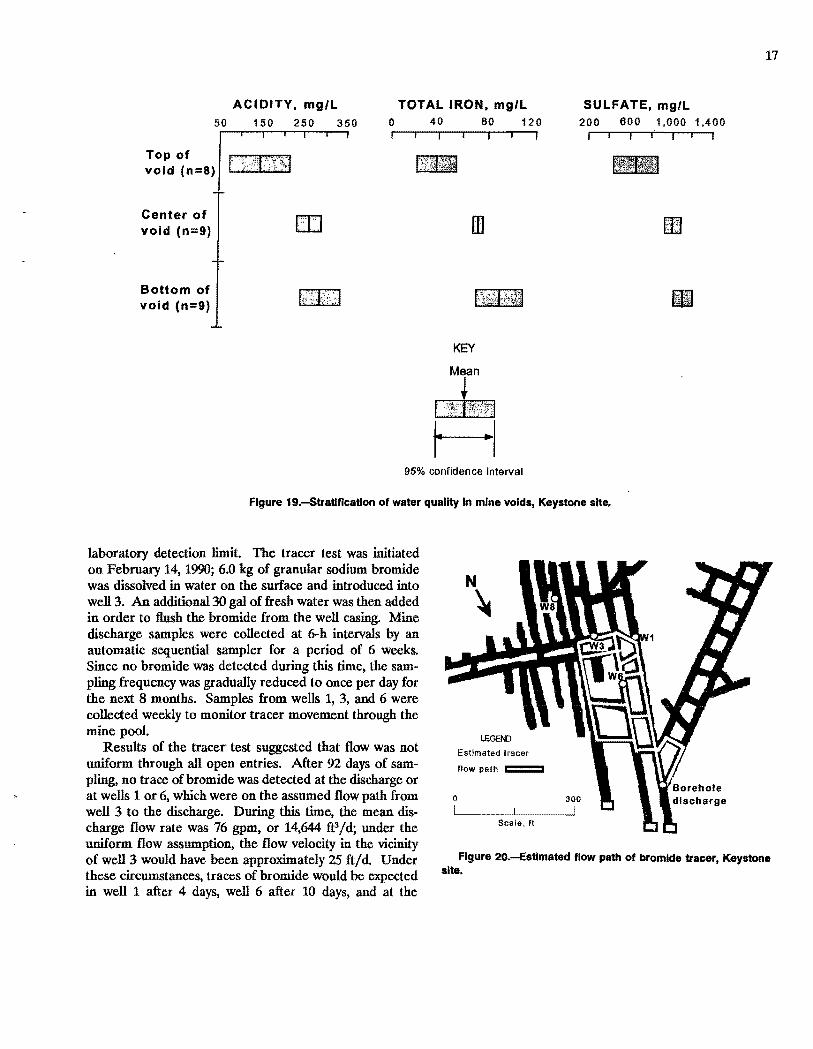
If the second flow scenario described above were true, flow through all entries would not be uniform as previously assumed, and the flow velocity through the monitored mine entries would be very slow. Under near-stagnant conditions, waters at different levels in the voids would not mix, and a marked worsening of mine water quality with depth would occur (14). In order to check for such waterquality stratification, the interval sampler shown in figure 16 was used to collect water samples from the top, center, and bottom of the voids. Samples from all voids were grouped by level and statistically analyzed to check for water quality differences between levels. As shown in figure 19, the water quality at the top of the voids was significantly better than at the center or bottom. Although the water quality at the center appeared to be somewhat better than at the bottom, the overlap of the confidence intervals prevented a definitive conclusion. These data suggested that some degree of stratification was occurring within the monitored voids, and that the flow velocity was relatively slow. It was decided that further experimentation would be necessary to defme the flow rate through these entries, which would ultimately determine their suitability for alkaline injection.
o 300 I I I
Scale, It To stream
Figure 18.-Alternate mine pool flow path, Keystone aHe.
TRACER TEST
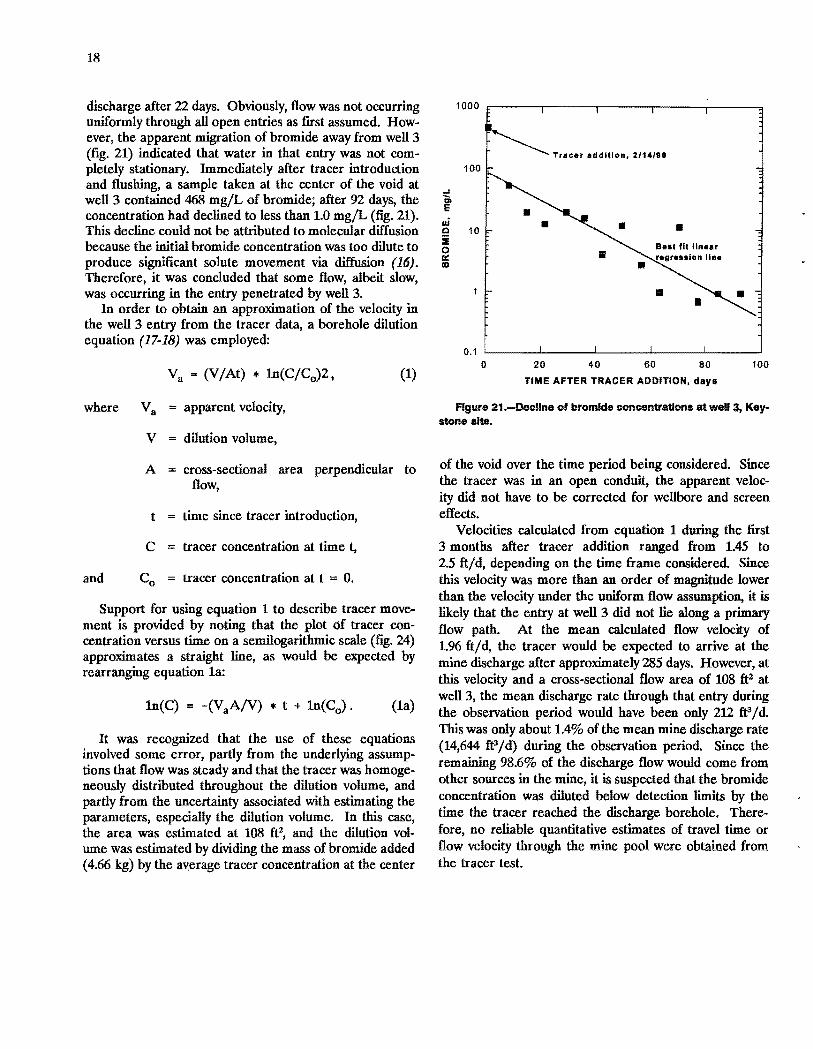
The approximate flow velocity within the mine pool could be estimated by introducing a chemical tracer into a monitoring well, noting the time of peak tracer concentration at the discharge, and dividing this mean travel time into the travel distance as measured on the mine map. In order to examine the largest possible portion of the mine pool, the wells closest to the beach area were initially considered. Well 3 was chosen for the tracer test because it was farther upgradient than any other void well and was located in an entry directly connected to the vast lIUljority of upgradient voids. Figure 20 shows the anticipated flow path from well 3 to the borehole discharge.
Bromide, in the form of a sodium bromide solution, was used as the tracer chemical. Bromide appeared to be an appropriate tracer choice because it is conservative, stable, and· inexpensive (15). Bromide concentrations as low as 0.1 mg/L could be detected by the Bureau's analytical laboratory, and background concentrations of bromide at the site were negligible. The quantity of tracer to be introduced was chosen such that if it were dispersed uniformly throughout all the entries in the assumed flow path, the bromide concentration at the discharge would be 15 mg/L, more than two orders of magnitUde above the
50
Top of void (n=8)
Center of void (n=9)
Bottom of void (n=9)
ACIDITY, mg/l
150 250 350 o TOTAL I RON, mg/l SULFATE, mg/l
40 80 120 200 600 1,000 1,400 j'
m
KEY
Mean
r :$.i~m t--1
95% confidence interval
Figure 19.-Stratlficatlon of water quality In mine voids, Keystone site.
laboratory detection limit. The tracer test was initiated on February 14,1990; 6.0 kg of granular sodium bromide was dissolved in water on the surface and introduced into we1l3. An additional 30 gal of fresh water was then added in order to flush the bromide from the well casing. Mine discharge samples were collected at 6-h intervals by an automatic sequential sampler for a period of 6 weeks. Since no bromide was detected during this time, the sampling frequency was gradually reduced to once per day for the next 8 months. Samples from wells 1, 3, and 6 were collected weekly to monitor tracer movement through the mine pool.
o
LEGEND
Estimated tracer
flo w pat h c:::::::::I
Scale, ft
300
17
Results of the tracer test suggested that flow was not uniform through all open entries. After 92 days of sampling, no trace of bromide was detected at the discharge or at wells 1 or 6, which were on the assumed flow path from well 3 to the discharge. During this time, the mean discharge flow rate was 76 gpm, or 14,644 ft3/d; under the uniform flow assumption, the flow velocity in the vicinity of well 3 would have been approximately 25 ft/d. Under these circumstances, traces of bromide would be expected in well 1 after 4 days, well 6 after 10 days, and at the
Figure 2O.-EsUmated flow path of bromide tracer, Keystone site.
18
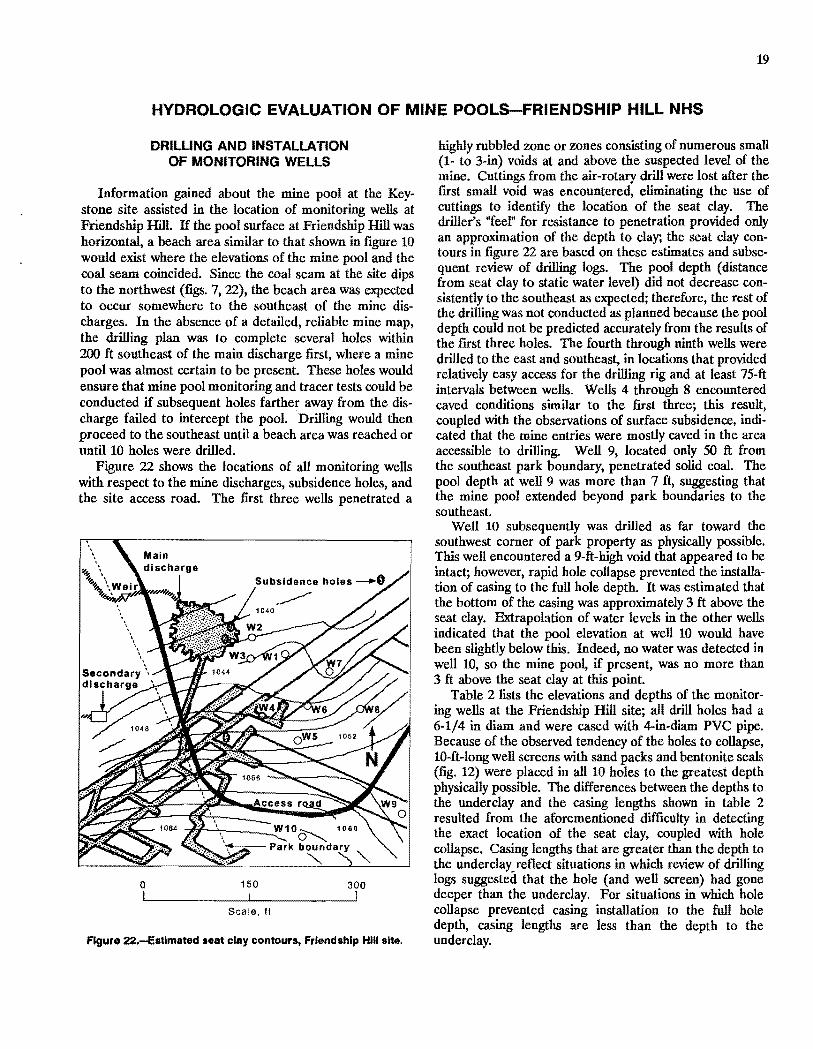
discharge after 22 days. Obviously, flow was not occurring uniformly through all open entries as ftrst assumed. How~ ever, the apparent migration of bromide away from well 3 (ftg. 21) indicated that water in that entry was not com~ pletely stationary. Immediately after tracer introduction and flushing, a sample taken at the center of the void at well 3 contained 468 mg/L of bromide; after 92 days, the concentration had declined to less than 1.0 mg/L (ftg. 21). This decline could not be attributed to molecular diffusion because the initial bromide concentration was too dilute to produce significant solute movement via diffusion (16). Therefore, it was concluded that some flow, albeit slow, was occurring in the entry penetrated by well 3.
In order to obtain an approximation of the velocity in the well 3 entry from the tracer data, a borehole dilution equation (17~18) was employed:
(1)
where Va = apparent velocity,
V dilution volume,
A cross~sectional area perpendicular to flow,
t time since tracer introduction,
C tracer concentration at time t,
and Co tracer concentration at t = O.
Support for using equation 1 to describe tracer mov~ ment is provided by noting that the plot of tracer concentration versus time on a semilogarithmic scale (ftg. 24) approximates a straight line, as would be expected by rearranging equation 1a:
In(C) = -(VaA/V) * t + 1n(Co)' (1a)
It was recognized that the use of these equations involved some error, partly from the underlying assump~ tions that flow was steady and that the tracer was homogeneously distributed throughout the dilution volume, and partly from the uncertainty associated with estimating the parameters, especially the dilution volume. In this case, the area was estimated at 108 fe, and the dilution volume was estimated by dividing the mass of bromide added (4.66 kg) by the average tracer concentration at the center
1000 ~-----.-----.------~----~----~
100
....I
r w Q 10 i o IIIi: !XI
0.1 o
Tracer addition, 2/14/110
• • •
•
20 40 60 80 100
TIME AFTER TRACER ADDITION, day.
Figure 21.-Decllne of bromide concentrations at well 3, Keystone site.
of the void over the time period being considered. Since the tracer was in an open conduit, the apparent velocity did not have to be corrected for wellbore and screen effects.
Velocities calculated from equation 1 during the fIrst 3 months after tracer addition ranged from 1.45 to 2.5 ft/ d, depending on the time frame considered. Since this velocity was more than an order of magnitude lower than the velocity under the uniform flow assumption, it is likely that the entry at well 3 did not lie along a primary flow path. At the mean calculated flow velocity of 1.96 ft/d, the tracer would be expected to arrive at the mine discharge after approximately 285 days. However, at this velocity and a cross-sectional flow area of 108 ft2 at well 3, the mean discharge rate through that entry during the observation period would have been only 212 ft3/d. This was only about 1.4% of the mean mine discharge rate (14,644 ft3/d) during the observation period. Since the remaining 98.6% of the discharge flow would come from other sources in the mine, it is suspected that the bromide concentration was diluted below detection limits by the time the tracer reached the discharge borehole. Therefore, no reliable quantitative estimates of travel time or flow velocity through the mine pool were obtained from the tracer test.
19
HYDROLOGIC EVALUATION OF MINE POOLS-FRIENDSHIP HILL NHS
DRILUNG AND INSTALLATION OF MONITORING WELLS
Information gained about the mine pool at the Keystone site assisted in the location of monitoring wells at Friendship Hill. If the pool surface at Friendship Hill was horizontal, a beach area similar to that shown in figure 10 would exist where the elevations of the mine pool and the coal seam coincided. Since the coal seam at the site dips to the northwest (figs. 7,22), the beach area was expected to occur somewhere to the southeast of the mine discharges. In the absence of a detailed, reliable mine map, the drilling plan was to complete several holes within 200 ft southeast of the main discharge first, where a mine pool was almost certain to be present. These holes would ensure that mine pool monitoring and tracer tests could be conducted if subsequent holes farther away from the discharge failed to intercept the pool. . Drilling would then proceed to the southeast until a beach area was reached or until 10 holes were drilled.
Figure 22 shows the locations of all monitoring wells with respect to the mine discharges, subsidence holes, and the site access road. The first three wells penetrated a
. . ,
~ \ "t-to \ . ~ "Weir ~Vfi
, , , . , , , ,
Secondary \. discharge '
150
Scale, It
Figure 22.-Estlmated seat clay contours, Friendship Hili site.
highly rubbled zone or zones consisting of numerous small (1- to 3-in) voids at and above the suspected level of the mine. Cuttings from the air-rotary drill were lost after the frrst small void was encountered, eliminating the use of cuttings to identify the location of the seat clay. The driller's "feel" for resistance to penetration provided only an approximation of the depth to clay; the seat clay contours in figure 22 are based on these estimates and subsequent review of drilling logs. The pool depth (distance from seat clay to static water level) did not decrease consistently to the southeast as expected; therefore, the rest of the drilling was not conducted as planned because the pool depth could not be predicted accurately from the results of the frrst three holes. The fourth through ninth wells were drilled to the east and southeast, in locations that provided relatively easy access for the drilling rig and at least 7S-ft intervals between wells. Wells 4 through 8 encountered caved conditions similar to the frrst three; this result, coupled with the observations of surface subsidence, indicated that the mine entries were mostly caved in the area accessible to drilling. Well 9, located only 50 ft from the southeast park boundary, penetrated solid coal. The pool depth at well 9 was more than 7 ft, suggesting that the mine pool extended beyond park boundaries to the southeast.
Well 10 subsequently was drilled as far toward the southwest corner of park property as physically possible . This well encountered a 9-ft-high void that appeared to be intact; however, rapid hole collapse prevented the installation of casing to the full hole depth. It was estimated that the bottom of the casing was approximately 3 ft above the seat clay. Extrapolation of water levels in the other wells indicated that the pool elevation at well 10 would have been slightly below this. Indeed, no water was detected in well 10, so the mine pool, if present, was no more than 3 ft above the seat clay at this point.
Table 2 lists the elevations and depths of the monitoring wells at the Friendship Hill site; all drill holes had a 6-1/4 in diam and were cased with 4-in-diam PVC pipe. Because of the observed tendency of the holes to collapse, 10-ft-Iong well screens with sand packs and bentonite seals (fig. 12) were placed in all 10 holes to the greatest depth physically possible. The differences between the depths to the underclay and the casing lengths shown in table 2 resulted from the aforementioned difficulty in detecting the exact location of the seat clay, coupled with hole collapse. Casing lengths that are greater than the depth to the underclay_reflect situations in which review of drilling logs suggested that the hole (and well screen) had gone deeper than the underclay. For situations in which hole collapse prevented casing installation to the full hole depth, casing lengths are less than the depth to the underclay.

20
Table 2.-Monltoring well data, Friendship Hill NHS
Well Surface Type Depth to top of elev, ft coal or void, ft
1 1,104.83 Caved .. NAp 2 1,094.26 · .do. NAp 3 1,098.38 · .do. NAp 4 1,105.93 · .do. NAp 5 1,114.59 · .do. NAp 6 1,114.70 · .do. NAp 7 1,114.32 · .do. NAp 8 1,123.87 · .do. NAp 9 1,140.88 Pillar 75.0 10 .. 1,106.56 Void .... 35.0
NAp Not applicable. IAverage water elevation, 11/02/89 - 11/09/90.
CONCEPTUAL FLOW SYSTEM
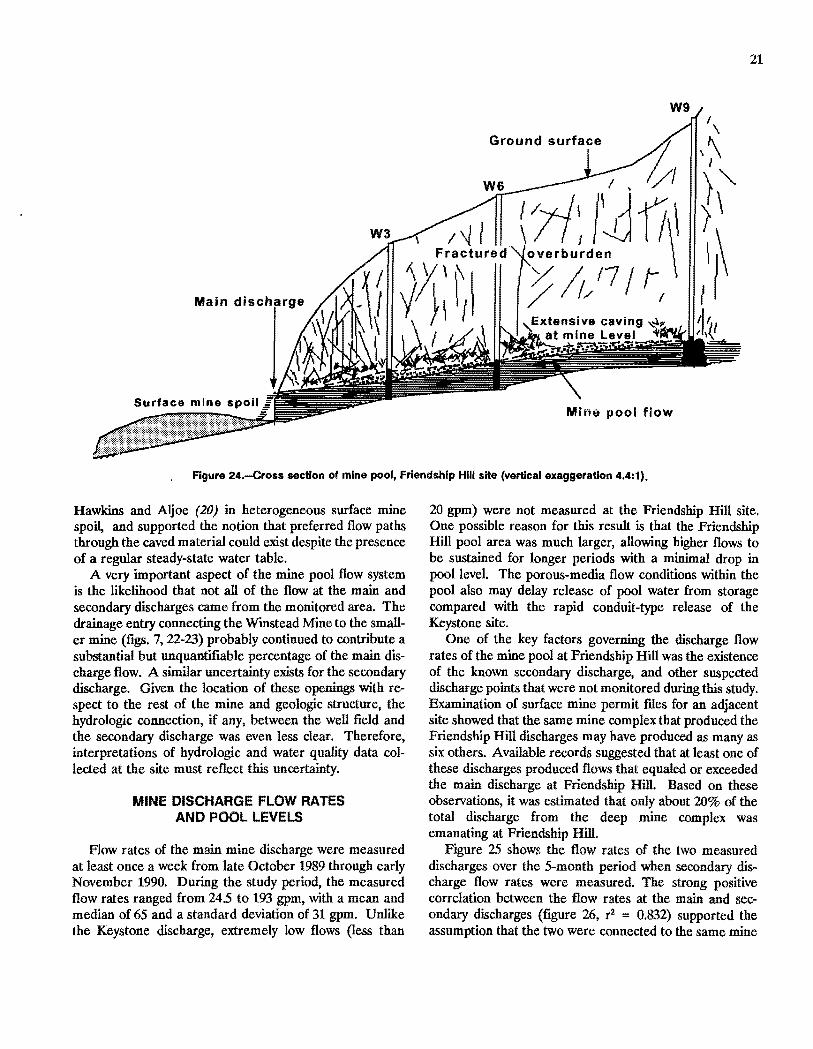
As with the Keystone site, the fIrst task after completion of well drilling at Friendship Hill was to characterize the nature of the subsurface flow system. As mentioned above, however, the piezometric surface at Friendship Hill was not horizontal, but had a distinct, regular hydraulic gradient as shown in fIgure 23. Figure 24 is a cross section through the well fIeld at the Friendship Hill site that illustrates the conceptual flow system. Because of the water surface gradient, the flow system in the well fIeld at Friendship Hill was more like that of a water table aquifer than that of a reservoir with an underdrain. However, the nature of this water table was quite different than it would have been had mining not occurred. In un mined conditions, the water table would have roughly paralleled the surface topography and existed in a series of perched aquifers. After mining, the increase in vertical ground water flow resulting from widened overburden fractures and mine pumpage probably desaturated the overburden. Even after mine pumpage ceased and the deep strata collapsed into the mine openings, the overall porosity and permeability of the caved zone still would have been much greater than that of the overlying fractured overburden. Although the caved material appears to have provided enough resistance to flow to allow the development of a water table gradient, its capability to store water and transmit it to the free drain (mine opening) at the low point of the flow system appears to have been great enough to suppress the redevelopment of the premining water table. Thus, the current flow system may represent an equilibrium condition between high recharge to an aquifer of high transmissivity and storativity (the caved material), and discharge from a free drain at its base.
One factor complicating the flow system through the well field was the inherent heterogeneity of the aquifer formed by the caved material. The caving process did not occur uniformly, and some entries or portions of entries
Depth to under- Length of well Mean water clay, ft casing, ft elev, ftl
60.5 58.7 1,050.82 53.0 49.7 1,049.75 52.0 51.4 1,049.75 55.0 57.9 1,055.66 63.0 60.6 1,058.05 68.0 62.3 1,056.51 71.0 72.1 1,055.60 73.5 71.5 1,057.86 85.0 86.6 1,063.49 44.0 41.2 NAp
that were better supported than others would remain partially open to serve as preferred flow paths. This was evident in preliminary aquifer tests (slug withdrawal) that were conducted in four of the wells. In wells 6 and 7, water level recoveries occurred so rapidly that conventional analytical methods were not appropriate. In wells 4 and 8, recovery occurred as expected; hydraulic conductivities calculated by the Bouwer and Rice (19) method were 3.9 x 10⁻⁵ ft/min and 2.6 x 10⁻³ ft/min, respectively, which were not unexpected for this material. The vast differences in well responses were similar to those observed by
o I
150
Scale, ft
300 J
Figure 23.-Water elevation contours, Friendship Hili site.
21
Main discharge
Figure 24.-Cross section of mine pool, Friendship Hili site (vertical exaggeration 4.4:1).
Hawkins and Aljoe (20) in heterogeneous surface mine spoil, and supported the notion that preferred flow paths through the caved material could exist despite the presence of a regular steady-state water table.
A very important aspect of the mine pool flow system is the likelihood that not all of the flow at the main and secondary discharges came from the monitored area. The drainage entry connecting the Winstead Mine to the smaller mine (figs. 7, 22-23) probably continued to contribute a substantial but nnquantifiable percentage of the main discharge flow. A similar nncertainty exists for the secondary discharge. Given the location of these openings with respect to the rest of the mine and geologic structure, the hydrologic connection, if any, between the well field and the secondary discharge was even less clear. Therefore, interpretations of hydrologic and water quality data collected at the site must reflect this uncertainty.
MINE DISCHARGE FLOW RATES AND POOL LEVELS
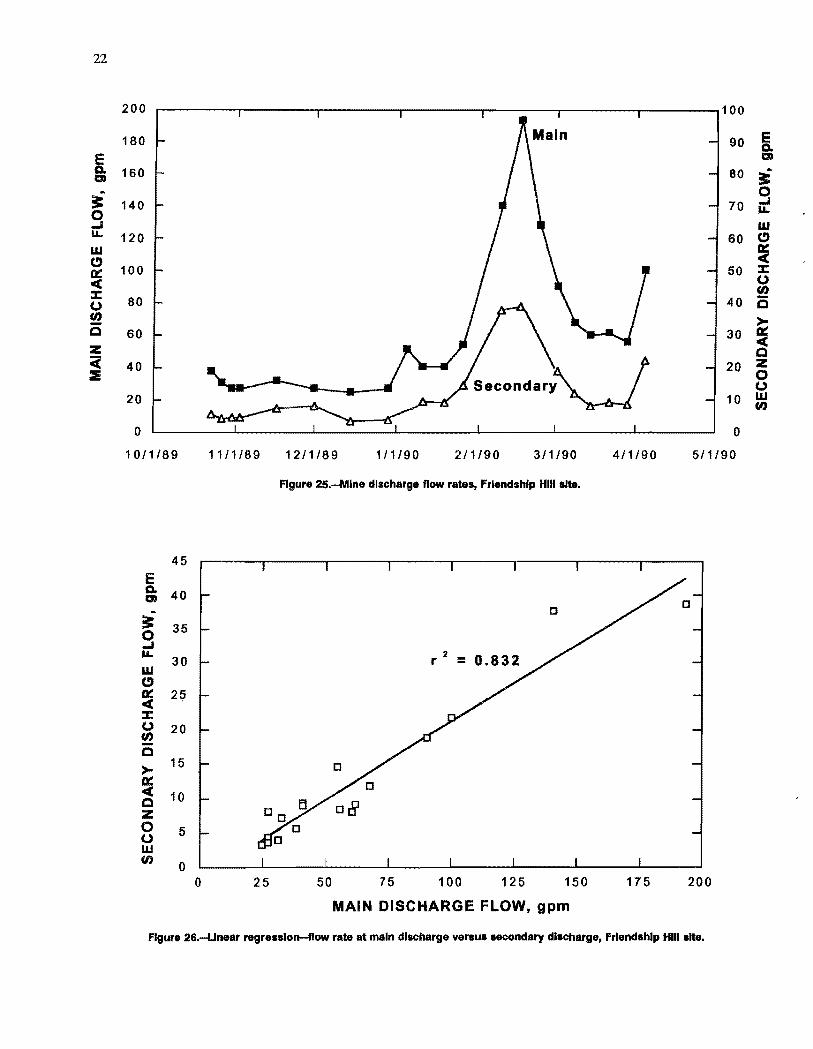
Flow rates of the main mine discharge were measured at least once a week from late October 1989 through early November 1990. During the study period, the measured flow rates ranged from 24.5 to 193 gpm, with a mean and median of 65 and a standard deviation of 31 gpm. Unlike the Keystone discharge, extremely low flows (less than
20 gpm) were not measured at the Friendship Hill site. One possible reason for this result is that the Friendship Hill pool area was much larger, allowing higher flows to be sustained for longer periods with a minimal drop in pool level. The porous-media flow conditions within the pool also may delay release of pool water from storage compared with the rapid conduit-type release of the Keystone site.
One of the key factors governing the discharge flow rates of the mine pool at Friendship Hill was the existence of the known secondary discharge, and other suspected discharge points that were not monitored during this study. Examination of surface mine permit files for an adjacent site showed that the same mine complex that produced the Friendship Hill discharges may have produced as many as six others. Available records suggested that at least one of these discharges produced flows that equaled or exceeded the main discharge at Friendship Hill. Based on these observations, it was estimated that only about 20% of the total discharge from the deep mine complex was emanating at Friendship Hill.
Figure 25 shows the flow rates of the two measured discharges over the 5-month period when secondary discharge flow rates were measured. The strong positive correlation between the flow rates at the main and secondary discharges (figure 26, r2 = 0.832) supported the assumption that the two were connected to the same mine
22
200 100
180 90 &. E ." 0. 160 80 :t ."
~ 0
140 70 ....I 0 II.
....I W II. 120 60 " W ~ " 0:: 100 50 ::c 'II( 0 ::c fA 0 80 40 i5 fA
~ C 60 30 'II( Z C C( 40 20 Z :& 0
0 20 10 W
fA
0 0
10/1/89 11/1/89 12/1/89 111190 2/1/90 3/1/90 4/1/90 5/1/90
Figure 2S.-Mlne discharge flow rates, Friendship Hili sHe.
45 E 0. 40 ."
3: 35 0 ....I II.
W 30
" ~ 25 'II( ::c 0 20 fA C
>- 15 ~ 'II( 10 C Z 0 5 0 w fI)
0 0 25 50 75 100 125 150 175 200
MAIN DISCHARGE FLOW, gpm
Figure 26.-Unear regresslon-ftow rate at main discharge versus secondary discharge, Friendship Hili site.
pool. Note in figures 22 and 23 that the topographic and water surface elevations of the secondary discharge are higher than those of the main discharge. Therefore, it is possible that the secondary discharge functions as a type of relief valve for the mine pool, especially since one of the mine openings at this discharge appeared to be unrestricted. The effect of the secondary discharge, along with other unmonitored discharges, would be to limit the maximum flow rate of the main discharge during high-flow periods.
If the secondary discharge were a preferred outlet for the mine pool during high recharge periods, it would be expected that the percentage contribution of the secondary discharge to the total discharge (secondary plus main) would increase with total discharge. Very little correlation between these two variables was found (Rxr = 0.295); furthermore, the greatest percentage contribution of the secondary discharge did not occur when the measured flows were highest. The lack of a strong correlation may be related to the small size of the data set (19 samples) and
1,064
1,062
it=
Z 1,060
0
~ 1,058 > W ..J W 1,056 ..J 0 0 1,054 D-
w Z
1,052 ::liE
1,050
1,048
10/1/89 1211/89 211190 4/1/90
23
the inaccuracy of flow measurements made with the portable flume at the secondary discharge. However, it is also possible that other mine openings not discovered during field reconnaissance serve to limit the maximum flow of the secondary discharge, limiting its contribution to the total measured flow.
Water levels in all nine water-bearing monitoring wells were measured weekly from November 1989 through March 1990. After three of the wells were vandalized beyond repair in early April 1990, monitoring frequency was gradually decreased to twice monthly, but continued until early November 1990. The most remarkable rmding was that the water levels in all wells remained almost the same throughout the study period despite the wide variations in discharge flow (fig. 27). This contrasted markedly from the Keystone site, where pool level fluctuations were small but easily detected. It appears that the large size and storage capacity of the pool and the presence of multiple discharge points may have rendered the changes in the mine pool level undetectable. Preliminary estimates of
200
180
160 E Do gJ
140 :l: 0
120 ..J LL
W C) 100 0:: «
80 :::t: 0 en
60 C
Z ~ 40 :::IE
20
0
6/1/90 8/1190 10/1/90 12/1/90
KEY -0- W1
~W3
-0- W4
-x- W5
--- W6
-+- W7
-I!r- W8
-<>- W9
Figure 27.-Water elevations In monitoring wells, Friendship Hili site.
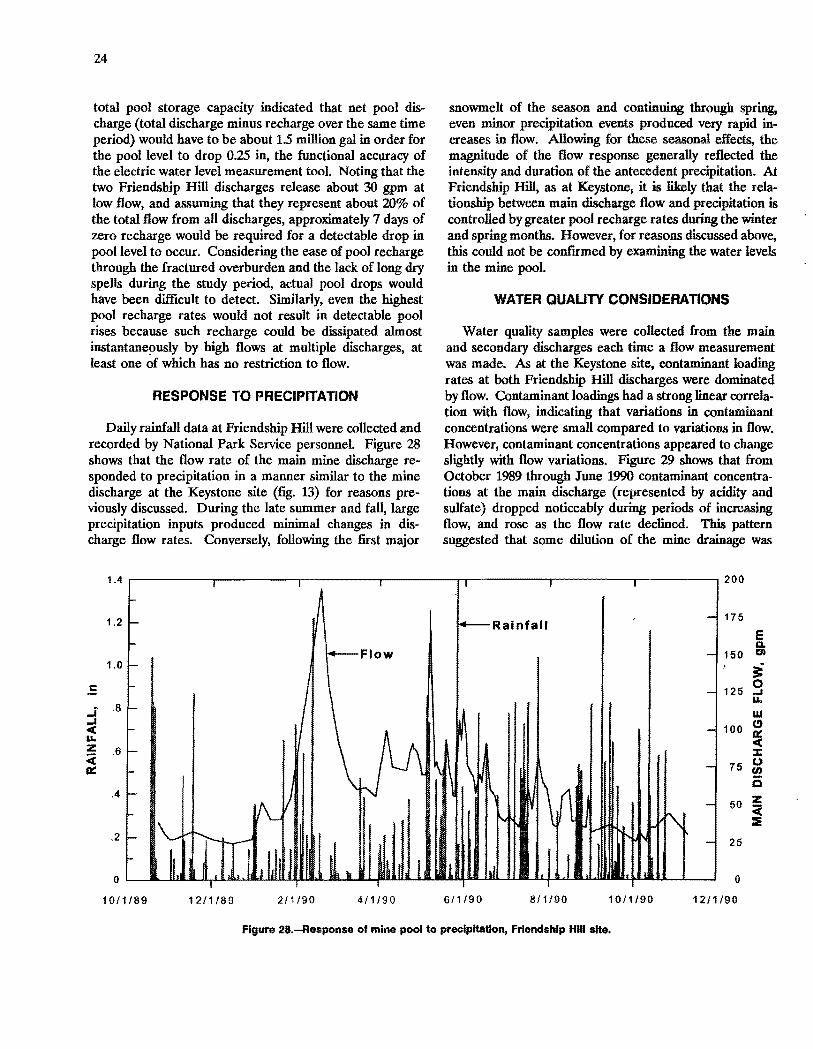
24
total pool storage capacity indicated that net pool discharge (total discharge minus recharge over the same time period) would have to be about 1.5 million gal in order for the pool level to drop 0.25 in, the functional accuracy of the electric water level measurement tool. Noting that the two Friendship Hill discharges release about 30 gpm at low flow, and assuming that they represent about 20% of the total flow from all discharges, approximately 7 days of zero recharge would be required for a detectable drop in pool level to occur. Considering the ease of pool recharge through the fractured overburden and the lack of long dry spells during the study period, actual pool drops would have been difficult to detect. Similarly, even the highest pool recharge rates would not result in detectable pool rises because such recharge could be dissipated almost instantane~usly by high flows at multiple discharges, at least one of which has no restriction to flow.
RESPONSE TO PRECIPITATION
Daily rainfall data at Friendship Hill were collected and recorded by National Park Service personnel. Figure 28 shows that the flow rate of the main mine discharge responded to precipitation in a manner similar to the mine discharge at the Keystone site (fig. 13) for reasons previously discussed. During the late summer and fall, large precipitation inputs produced minimal changes in discharge flow rates. Conversely, following the first major
snowmelt of the season and continuing through spring, even minor precipitation events produced very rapid increases in flow. Allowing for these seasonal effects, the magnitude of the flow response generally reflected the intensity and duration of the antecedent precipitation. At Friendship Hill, as at Keystone, it is likely that the relationship between main discharge flow and precipitation is controlled by greater pool recharge rates during the winter and spring months. However, for reasons discussed above, this could not be confirmed by examining the water levels in the mine pool.
WATER QUAUTY CONSIDERATIONS
Water quality samples were collected from the main and secondary discharges each time a flow measurement was made. As at the Keystone site, contaminant loading rates at both Friendship Hill discharges were dominated by flow. Contaminant loadings had a strong linear correlation with flow, indicating that variations in contaminant concentrations were small compared to variations in flow. However, contaminant concentrations appeared to change slightly with flow variations. Figure 29 shows that from October 1989 through June 1990 contaminant concentrations at the main discharge (represented by acidity and sulfate) dropped noticeably during periods of increasing flow, and rose as the flow rate declined. This pattern suggested that some dilution of the mine drainage was
1.4 r-----------------~-----------------.----------------~----------------_rr_--------------~----------------_.--------------_, 200
1.2 Rainfall 175
E &:L
150 II:»
1.0 ~ 125
0 -I U.
.8 W
100 C!)
~ .6 :c
75 (J
!! Q
.4 50 Z
:it :Ii
.2 25
o L-__ ~llU~~~~LnWU~~~~~~~Lia.~~~ru-~~~~.u~ 0
10/1/89 12/1/89 2/1/90 4/1/90 6/1/90 8/1/90 10/1/90 12/1/90
Figure 28.-Response of mine pool to preCipitation, Friendship Hili site.
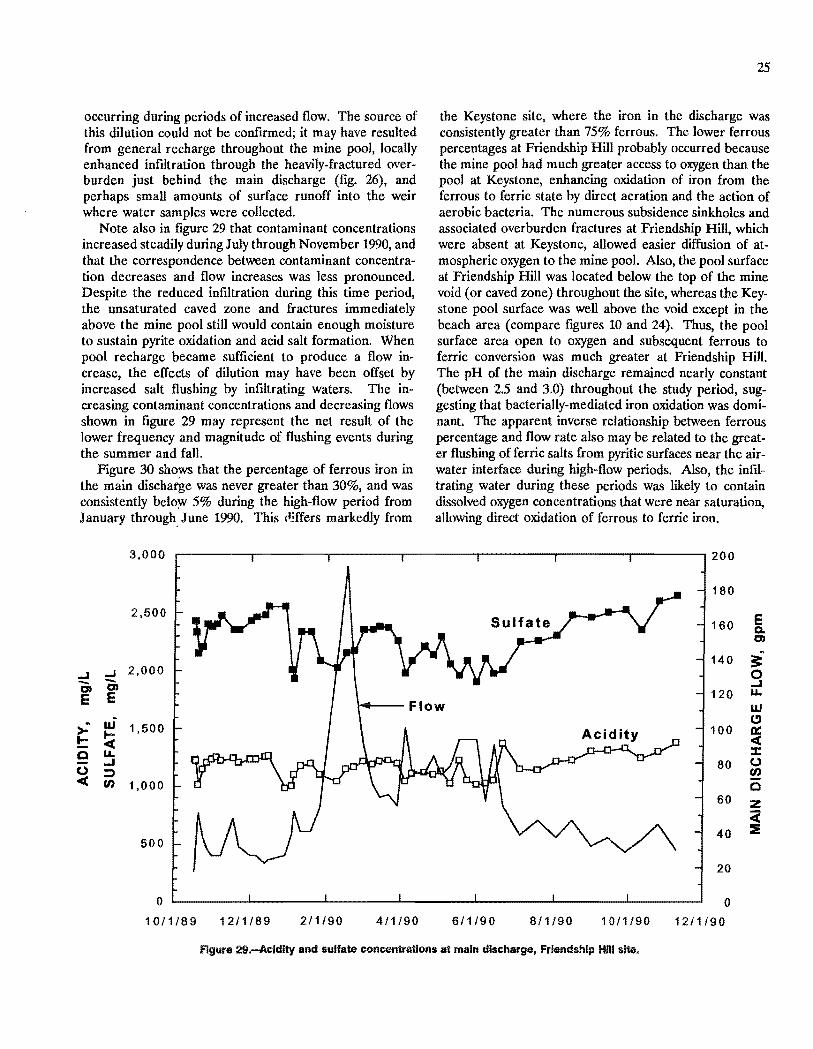
occurring during periods of increased flow. The source of this dilution could not be confirmed; it may have resulted from general recharge throughout the mine pool, locally enhanced infiltration through the heavily-fractured overburden just behind the main discharge (fig. 26), and perhaps small amounts of surface runoff into the weir where water samples were collected.
Note also in figure 29 that contaminant concentrations increased steadily during July through November 1990, and that the correspondence between contaminant concentration decreases and flow increases was less pronounced. Despite the reduced infiltration during this time period, the unsaturated caved zone and fractures immediately above the mine pool still would contain enough moisture to sustain pyrite oxidation and acid salt formation. When pool recharge became sufficient to produce a flow increase, the effects of dilution may have been offset by increased salt flushing by infiltrating waters. The increasing contaminant concentrations and decreasing flows shown in figure 29 may represent the net result of the lower frequency and magnitude of flushing events during the summer and fall.
Figure 30 shows that the percentage of ferrous iron in the main discharge was never greater than 30%, and was consistently belo~ 5% during the high-flow period from January through June 1990. This ".lffers markedly from
..J ...J - -O'J O'J
E E .
>' w !:: !;;c Q LL
..J 0 ::::) c( (f)
3,000
2,500
2,000
1,500
1,000
500
o 10/1/89 1211/89 211190 411190
25
the Keystone site, where the iron in the discharge was consistently greater than 75% ferrous. The lower ferrous percentages at Friendship Hill probably occurred because the mine pool had much greater access to oxygen than the pool at Keystone, enhancing oxidation of iron from the ferrous to ferric state by direct aeration and the action of aerobic bacteria. The numerous subsidence sinkholes and associated overburden fractures at Friendship Hill, which were absent at Keystone, allowed easier diffusion of atmospheric oxygen to the mine pool. Also, the pool surface at Friendship Hill was located below the top of the mine void (or caved zone) throughout the site, whereas the Keystone pool surface was well above the void except in the beach area (compare figures 10 and 24). Thus, the pool surface area open to oxygen and subsequent ferrous to ferric conversion was much greater at Friendship Hill. The pH of the main discharge remained nearly constant (between 2.5 and 3.0) throughout the study period, suggesting that bacterially-mediated iron oxidation was dominant. The apparent inverse relationship between ferrous percentage and flow rate also may be related to the greater flushing of ferric salts from pyritic surfaces near the airwater interface during high~flow periods. Also, the infiltrating water during these periods was likely to contain dissolved oxygen concentrations that were near saturation, allowing direct oxidation of ferrous to ferric iron.
200
180
E 160 Q. O'J
140 ~~
0 ..J
120 LL
W CJ
100 ~ c( ::J:
80 0 (f)
Q 60 Z
c(
40 ::E
20
0
6/1/90 8/1/90 1011/90 12/1/90
Figure 29.--Acldlty and sulfate concentrations at main discharge, Friendship Hili site.

26
The concentrations of all acid mine drainage contaminants were consistently higher at the secondary discharge than at the main discharge. However, the same relationships between concentration, flow, ferrous percentage, and pH discussed above (figs. 29-30) were also found at the secondary discharge. This supported the assumption that both discharges drained the same large pool, but suggested that significant water quality differences may have been present in different areas of the pool.
A regular, comprehensive well sampling program was not conducted at Friendship Hill, primarily because it became clear that the Keystone site was more suitable for alkaline injection. As shown in figure 31, the water quality in the eight wells that were completed in caved material varied widely; note the wide confidence intervals (95% level) around the mean. This suggested that although all areas of the pool produced acid mine drainage, some locations were more active than others. For example, the worst individual sample (wellS, March 15, 1990) contained an acidity concentration of' 7,393 mg/L, total iron of 2,032 mg/L, and sulfate of 8,775 mg/L. This variability, if indicative of conditions in the entire pool, could be responsible for the observed water quality differences between the main and secondary discharges. In general, the water quality in the wells was much poorer than at the discharge. However, contaminant concentrations in well 6 were closer to those of the main and secondary
discharges than most of the other wells, and showed the same behavior over time as the main discharge (fig. 32). Ferrous iron percentages in well 6 were relatively low (less than 40%), but were consistently higher than at the main discharge. The steady increase in ferrous percentage from July through October 1990 was consistent with the previous evidence of less pool dilution and less ferric salt flushing during the low-recharge periods of late summer and early fall.
"rRACER TEST
It was determined that a bromide tracer test similar to the one at Keystone could be conducted at Friendship Hill despite the vandalism and reduced sampling schedule. Well 6 was chosen for tracer introduction because it was hydrologically upgradient and within 100 ft of two of the remaining accessible monitoring wells (4 and 7). Also, its water level had recovered almost instantaneously after slug withdrawal, suggesting that it may have intercepted a preferred flow path in the caved zone, and its water quality was similar to that of the main discharge. Because of the large size of the overall pool and porous-medium characteristics of the pool flow system in the well field, flow velocities were expected to be relatively slow. For example, if it were assumed that (1) flow occurred entirely by porous-media methods, (2) the hydraulic conductivity
30 ~--------r---------~------~--------~---------r---------r--~~--,300
~ 0
z 0 ~ tn :E: ::J Q.
0 « « W LL
25 250
20 200
15 150
10 100
5 50
o ~--------~--------~~----~--------~--~----~--------~------~ o 1211/90 1011/89 12/1/89 211190 411190 6/1/90 8/1/90 10/1/90
Figure 30.-lron concentrations, ferrous percentages, and pH at main discharge, Friendship Hili site.
E Q. CJJ
...I 0,3: E 9 ~ LL
Z o W Il: C)
Il: ...I c( c( :E: t- O 0 tn t- O
z <C :::E

27
All wells in Main Secondary caved zone W6 discharge discharge
(n = 16) (n = 21) (n = 62) (n = 23) 3,000
...J 2,500 I- --C)
E 2,000 I- -
> t-1,500
C - -0 0(
1,000 r- --
500
900
...J 800 - ;--- --m E " 700 - -~
Z 600 0 I- -
a: -500 I- -
...J 0(
400 I- -t-O t- 300 I- E3 -
200 -
4,500 ...J --m 4,000 E
r- -
~ 3,500 r- -W -t-
3,000 r- -0( U. ...J
2,500 ::» r- -en -
2,000
KEY
-8195
% Mean ?>nfidence
interval
Figure 31.-Average water quality In monitoring wells and mine discharges, Friendship Hili site.
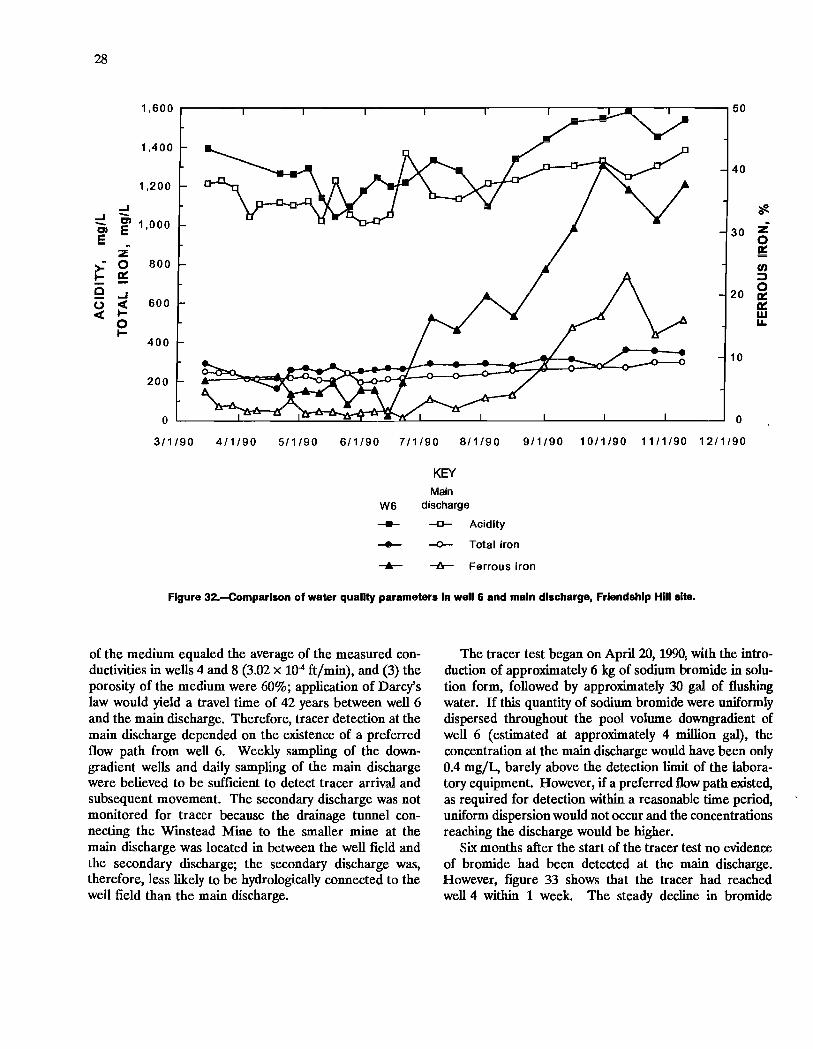
28
1,600 ._------r-------._------._----~------_,--------._----_.r_ __ --_,------~50
...J ...J -- m m E E
z >' 0 t- o:: C ...J 0 c:r: c:r: t-
O t-
1,400
1,200
1,000
800
600
400
200
o L-______ L-______ ~ ____ ~L-~~~~ ____ ~ ________ L_ ______ ~ ____ ~~ ____ ~
40
30 Z
~ tn :::l
20 ~
10
o
0:: w u..
311190 4/1/90 5/1/90 6/1/90 711190 811/90 9/1/90 1011/90 11/1/90 12/1/90
KEY Main
W6 discharge
--- -0- Acidity
..-....- ~ Total iron
......... -b- Ferrous iron
Figure 32.-Comparlson of water qualHy parameters In well 6 and main discharge, Friendship Hili site.
of the medium equaled the average of the measured conductivities in wells 4 and 8 (3.02 x 10⁻⁴ ft/min), and (3) the porosity of the medium were 60%; application of Darcy's law would yield a travel time of 42 years between well 6 and the main discharge. Therefore, tracer detection at the main discharge depended on the existence of a preferred flow path from well 6. Weekly sampling of the downgradient wells and daily sampling of the main discharge were believed to be sufficient to detect tracer arrival and subsequent movement. The secondary discharge was not monitored for tracer because the drainage tunnel connecting the Winstead Mine to the smaller mine at the main discharge was located in between the well field and the secondary discharge; the secondary discharge was, therefore, less likely to be hydrologically connected to the well field than the main discharge.
The tracer test began on April 20, 1990, with the introduction of approximately 6 kg of sodium bromide in solution form, followed by approximately 30 gal of flushing water. If this quantity of sodium bromide were uniformly dispersed throughout the pool volume downgradient of well 6 (estimated at approximately 4 million gal), the concentration at the main discharge would have been only 0.4 ing/L, barely above the detection limit of the laboratory equipment. However, if a preferred flow path existed, as required for detection within a reasonable time period, uniform dispersion would not occur and the concentrations reaching the discharge would be higher.
Six months after the start of the tracer test no evidence of bromide had been detected at the main discharge. However, figure 33 shows that the tracer had reached well 4 within 1 week. The steady decline in bromide
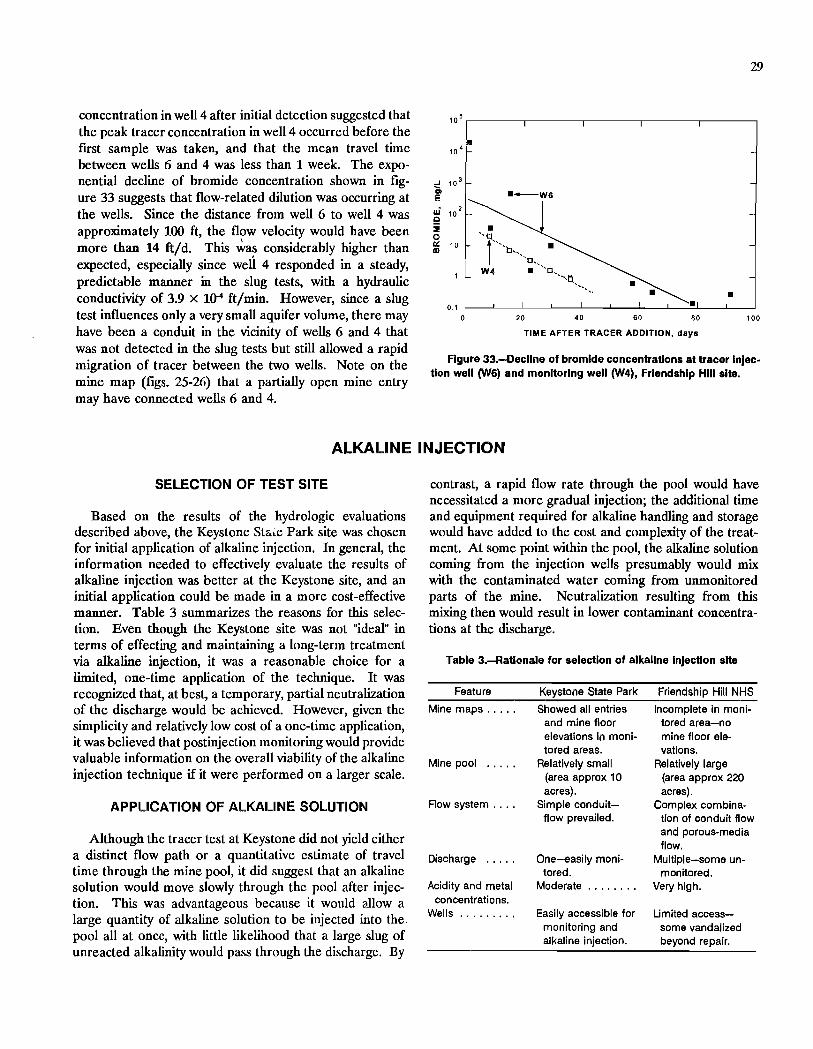
concentration in well 4 after initial detection suggested that the peak tracer concentration in well 4 occurred before the first sample was taken, and that the mean travel time between wells 6 and 4 was less than 1 week. The exponential decline of bromide concentration shown in figure 33 suggests that flow-related dilution was occurring at the wells. Since the distance from well 6 to well 4 was approximately 100 ft, the flow velocity would have been more than 14 ft/d. This ~as considerably higher than expected, especially since well 4 responded in a steady, predictable manner in the slug tests, with a hydraulic conductivity of 3.9 X 10"4 ft/min. However, since a slug test influences only a very small aquifer volume, there may have been a conduit in the vicinity of wells 6 and 4 that was not detected in the slug tests but still allowed a rapid migration of tracer between the two wells. Note on the mine map (figs. 25-26) that a partially open mine entry may have connected wells 6 and 4.
29
105
10 4 •
...J 10 3
Ii> ·-W6 E u.i 2
0 10
i • 0 'T' II: 10 "b" • m
"0", W4 • '0,
',,0. '"
'" • 0.1 •
0 20 40 60 80 100
TIME AFTER TRACER ADDITION, days
Figure 33.-Decllne of bromide concentrations at tracer InJection well (W6) and monitoring well (W4), Friendship Hili site.
ALKALINE INJECTION
SELECTION OF TEST SITE
Based on the results of the hydrologic evaluations described above, the Keystone Stale Park site was chosen for initial application of alkaline injection. In general, the information needed to effectively evaluate the results of alkaline injection was better at the Keystone site, and an initial application could be made in a more cost-effective manner. Table 3 summarizes the reasons for this selection. Even though the Keystone site was not "ideal" in terms of effecting and maintaining a long-term treatment via alkaline injection, it was a reasonable choice for a limited, one-time application of the technique. It was recognized that, at best, a temporary, partial neutralization of the discharge would be achieved. However, given the simplicity and relatively low cost of a one-time application, it was believed that postinjection monitoring would provide valuable information on the overall viability of the alkaline injection technique if it were performed on a larger scale.
APPLICATION OF ALKALINE SOLUTION
Although the tracer test at Keystone did not yield either a distinct flow path or a quantitative estimate of travel time through the mine pool, it did suggest that an alkaline solution would move slowly through the pool after injection. This was advantageous because it would allow a large quantity of alkaline solution to be injected into the. pool all at once, with little likelihood that a large slug of unreacted alkalinity would pass through the discharge. By
contrast, a rapid flow rate through the pool would have necessitated a more gradual injection; the additional time and equipment required for alkaline handling and storage would have added to the cost and complexity of the treatment. At some point within the pool, the alkaline solution coming from the injection wells presumably would mix with the contaminated water coming from unmonitored parts of the mine. Neutralization resulting from this mixing then would result in lower contaminant concentrations at the discharge.
Table 3.-Ratlonale for selection of alkaline Injection site
Feature Keystone State Park Friendship Hill NHS
Mine maps ..... Showed all entries Incomplete in moni-and mine floor to red area-no elevations in moni- mine floor ele-tored areas. vations.
Mine pool ..... Relatively small Relatively large (area approx 10 (area approx 220 acres). acres).
Row system .... Simple conduit- Complex combina-flow prevailed. tion of conduit flow
and porous-media flow.
Discharge ..... One-easily moni- Multiple-some un-tored. monitored.
Acidity and metal Moderate ........ Very high. concentrations.
Wells ......... Easily accessible for Limited access-monitoring and some vandalized alkaline injection. beyond repair.
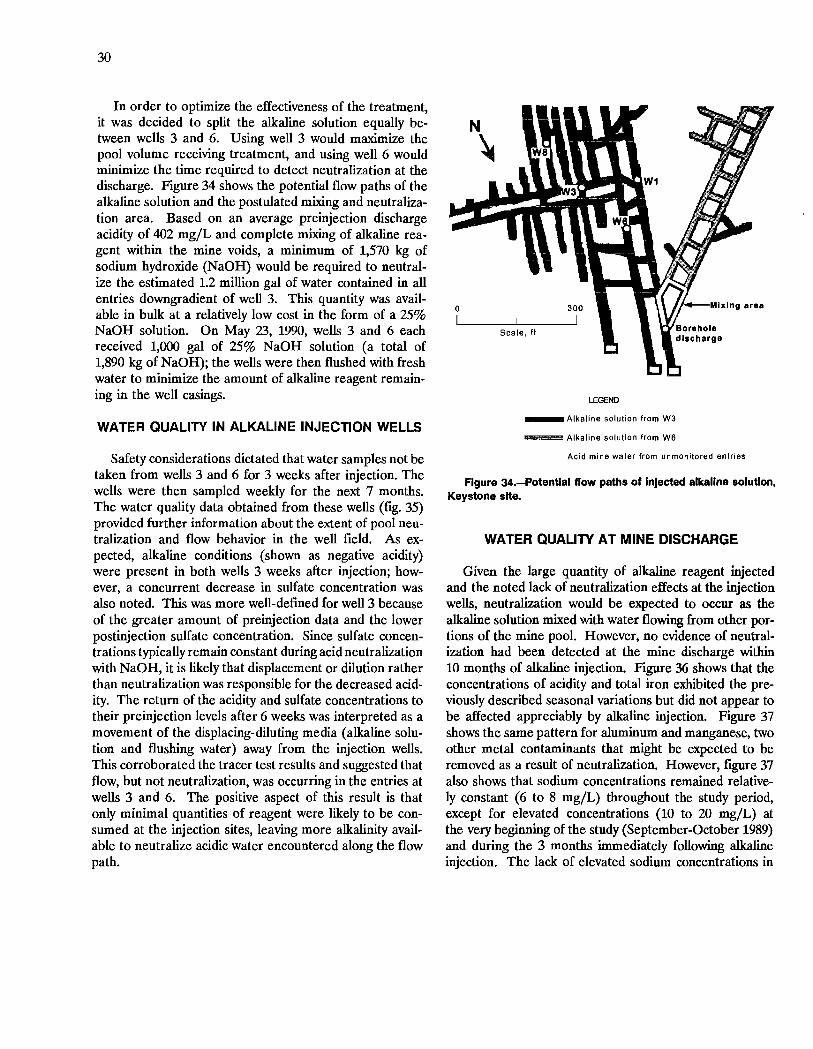
30
In order to optimize the effectiveness of the treatment, it was decided to split the alkaline solution equally between wells 3 and 6. Using well 3 would maximize the pool volume receiving treatment, and using well 6 would minimize the time required to detect neutralization at the discharge. Figure 34 shows the potential flow paths of the alkaline solution and the postulated mixing and neutralization area. Based on an average preinjection discharge acidity of 402 mg/L and complete mixing of alkaline reagent within the mine voids, a minimum of 1,570 kg of sodium hydroxide (NaOH) would be required to neutralize the estimated 1.2 million gal of water contained in all entries downgradient of well 3. This quantity was available in bulk at a relatively low cost in the form of a 25% NaOH solution. On May 23, 1990, wells 3 and 6 each received 1,000 gal of 25% NaOH solution (a total of 1,890 kg of NaOH); the wells were then flushed with fresh water to minimize the amount of alkaline reagent remaining in the well casings.
WATER QUALITY IN ALKALINE INJECTION WELLS
Safety considerations dictated that water samples not be taken from wells 3 and 6 for 3 weeks after injection. The wells were then sampled weekly for the next 7 months. The water quality data obtained from these wells (fig. 35) provided further information about the extent of pool neutralization and flow behavior in the well field. As expected, alkaline conditions (shown as negative acidity) were present in both wells 3 weeks after injection; however, a concurrent decrease in sulfate concentration was also noted. This was more well-defined for well 3 because of the greater amount of preinjection data and the lower postinjection sulfate concentration. Since sulfate concentrations typically remain constant during acid neutralization with NaOH, it is likely that displacement or dilution rather than neutralization was responsible for the decreased acidity. The return of the acidity and sulfate concentrations to their preinjection levels after 6 weeks was interpreted as a movement of the displacing-diluting media (alkaline solution and flushing water) away from the injection wells. This corroborated the tracer test results and suggested that flow, but not neutralization, was occurring in the entries at wells 3 and 6. The positive aspect of this result is that only minimal quantities of reagent were likely to be consumed at the injection sites, leaving more alkalinity available to neutralize acidic water encountered along the flow path.
LEGEND
_ Alkaline solution from W3
_ Alkaline solution from W6
Acid mine water from unmonitored entries
Figure 34.-Potentlal flow paths of Injected alkaline solution, Keystone site.
WATER QUALITY AT MINE DISCHARGE
Given the large quantity of alkaline reagent injected and the noted lack of neutralization effects at the injection wells, neutralization would be expected to occur as the alkaline solution mixed with water flowing from other portions of the mine pool. However, no evidence of neutralization had been detected at the mine discharge within 10 months of alkaline injection. Figure 36 shows that the concentrations of acidity and total iron exhibited the previously described seasonal variations but did not appear to be affected appreciably by alkaline injection. Figure 37 shows the same pattern for aluminum and manganese, two other metal contaminants that might be expected to be removed as a result of neutralization. However, figure 37 also shows that sodium concentrations remained relatively constant (6 to 8 mg/L) throughout the study period, except for elevated concentrations (10 to 20 mg/L) at the very beginning of the study (September-October 1989) and during the 3 months immediately following alkaline injection. The lack of elevated sodium concentrations in

....I -en E ~
>-l-e 0 <t
600
500
400
300
200
100
0
-100
600
500
400
300
200
100
0
-100
-200
-300
r-------r------.------_.--~--_.----__ _.------_.------_,1,200
1,000
800
600
400
200 ....I -en o E
~
W
Alkaline injection -- 5/23/90 ~ r---------------~-~-------------------------__, 1,200 LL
W6
....I 1,000 ::J
tn 800
600
400
200
o
11/1/89 1/1190 3/1/90 5/1/90 7/1/90 9/1/90 1111/90 111191
KEY CJ Acidity
• Sulfate
Figure 35.-Sulfate and acidity concentrations In alkaline InJection wells (W3 and W6), Keystone site.
31
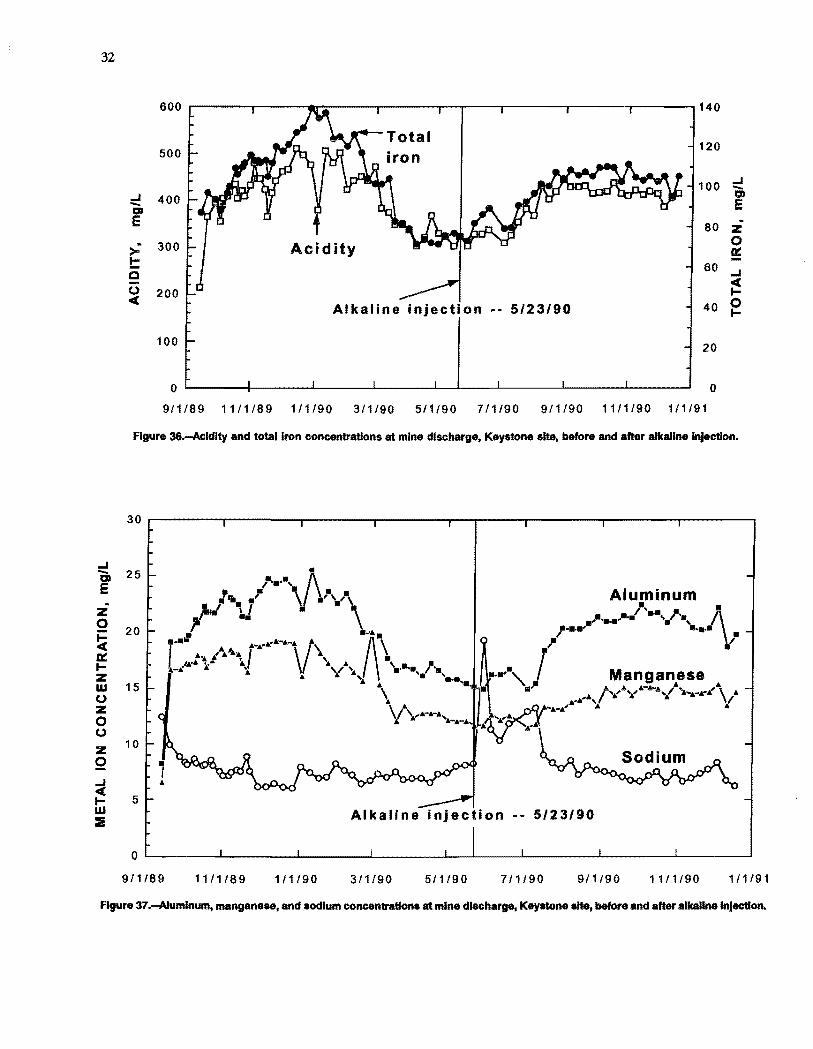
32
...J -CD E
z o ~ a: IZ W o Z o o z o
~ w ::IE
600 140
500 120
...J 400 -aJ
100 ...J -aJ E
E 80 Z
>' 300 l-e 0 200 c(
Acidity 0 a:
60 ...J
~ 40 0
I-Alkaline injection •• 5/23/90
100 20
o o 9/1189 1111/89 111190 3/1/90 5/1/90 7/1/90 9/1/90 1111/90 111191
Figure 36.-AcIdlty and total Iron concentrations at mine discharge, Keystone site, before and after alkaline injection.
30 r--------r--------.--------r--------r-~----~--------,_------~r_------,
25
20
15
10
5 Alkaline injection •• 5/23/90
o L-______ ~ ______ ~ ________ L-______ ~ __ L_ __ ~ ________ ~ ______ ~ ______ ~
9/1189 1111/89 1/1/90 3/1/90 5/1/90 7/1/90 911190 1111/90 111191
Figure 37.-Alumlnum, manganese, and sodium concentrations at mine discharge. Keystone site, before and after alkaUne Inlectlon.
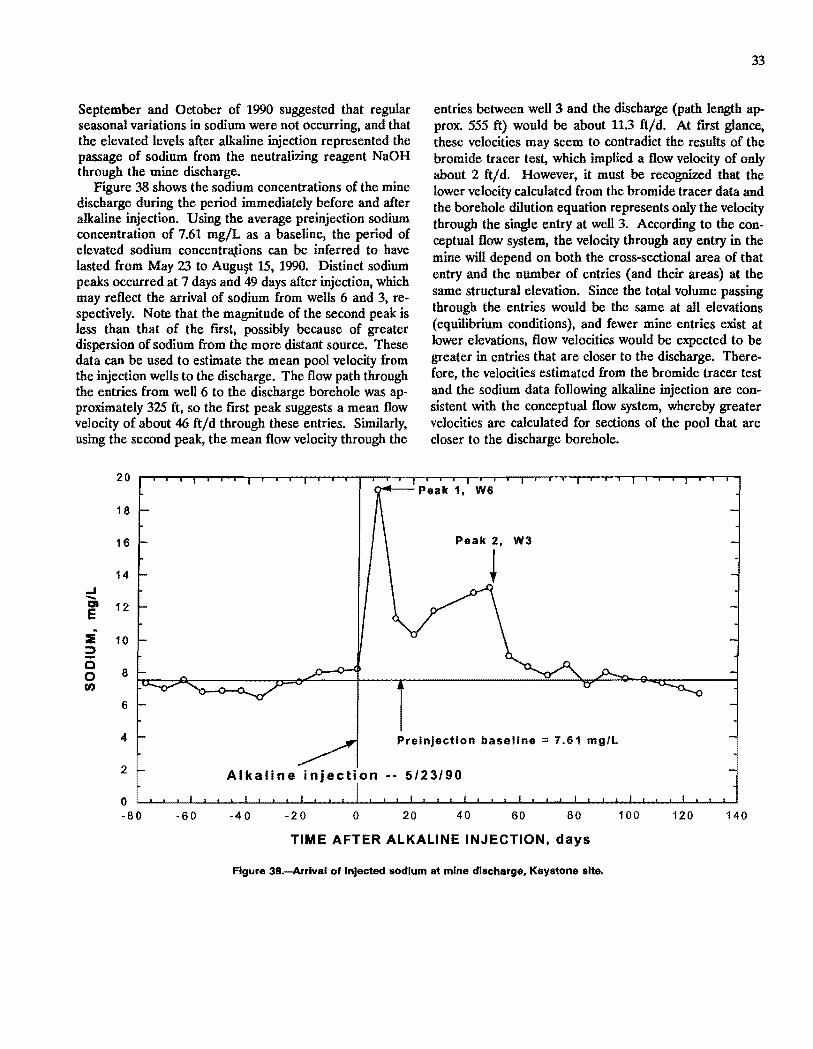
September and October of 1990 suggested that regular seasonal variations in sodium were not occurring, and that the elevated levels after alkaline injection represented the passage of sodium from the neutralizing reagent NaOH through the mine discharge.
Figure 38 shows the sodium concentrations of the mine discharge during the period immediately before and after alkaline injection. Using the average preinjection sodium concentration of 7.61 mg/L as a baseline, the period of elevated sodium concentra,tions can be inferred to have lasted from May 23 to Augu~t 15, 1990. Distinct sodium peaks occurred at 7 days and 49 days after injection, which may reflect the arrival of sodium from wells 6 and 3, respectively. Note that the magnitude of the second peak is less than that of the frrst, possibly because of greater dispersion of sodium from the more distant source. These data can be used to estimate the mean pool velocity from the injection weUs to the discharge. The flow path through the entries from well 6 to the discharge borehole was approximately 325 ft, so the first peak suggests a mean flow velocity of about 46 ft/d through these entries. Similarly, using the second peak, the mean flow velocity through the
20
18
16
14 .... -aD 12 E
:IE 10 ::::J -Q
8 0 fI)
6
33
entries between well 3 and the discharge (path length approx. 555 ft) would be about 11.3 ft/d. At first glance, these velocities may seem to contradict the results of the bromide tracer test, which implied a flow velocity of only about 2 ft/ d. However, it must be recognized that the lower velocity calculated from the bromide tracer data and the borehole dilution equation represents only the velocity through the single entry at well 3. According to the conceptual flow system, the velocity through any entry in the mine will depend on both the cross-sectional area of that entry and the number of entries (and their areas) at the same structural elevation. Since the total volume passing through the entries would be the same at all elevations (equilibrium conditions), and fewer mine entries exist at lower elevations, flow velocities would be expected to be greater in entries that are closer to the discharge. Therefore, the velocities estimated from the bromide tracer test and the sodium data following alkaline injection are consistent with the conceptual flow system, whereby greater velocities are calculated for sections of the pool that are closer to the discharge borehole.
4 Preinjection baseline = 7.61 mg/L
2 Alkaline injection .- 5/23/90
0 -80 -60 -40 -20 o 20 40 60 80 100 120 140
TIME AFTER ALKALINE INJECTION, days
Figure 3B.-Arrlval of Injected sodium at mine discharge, Keystone site.
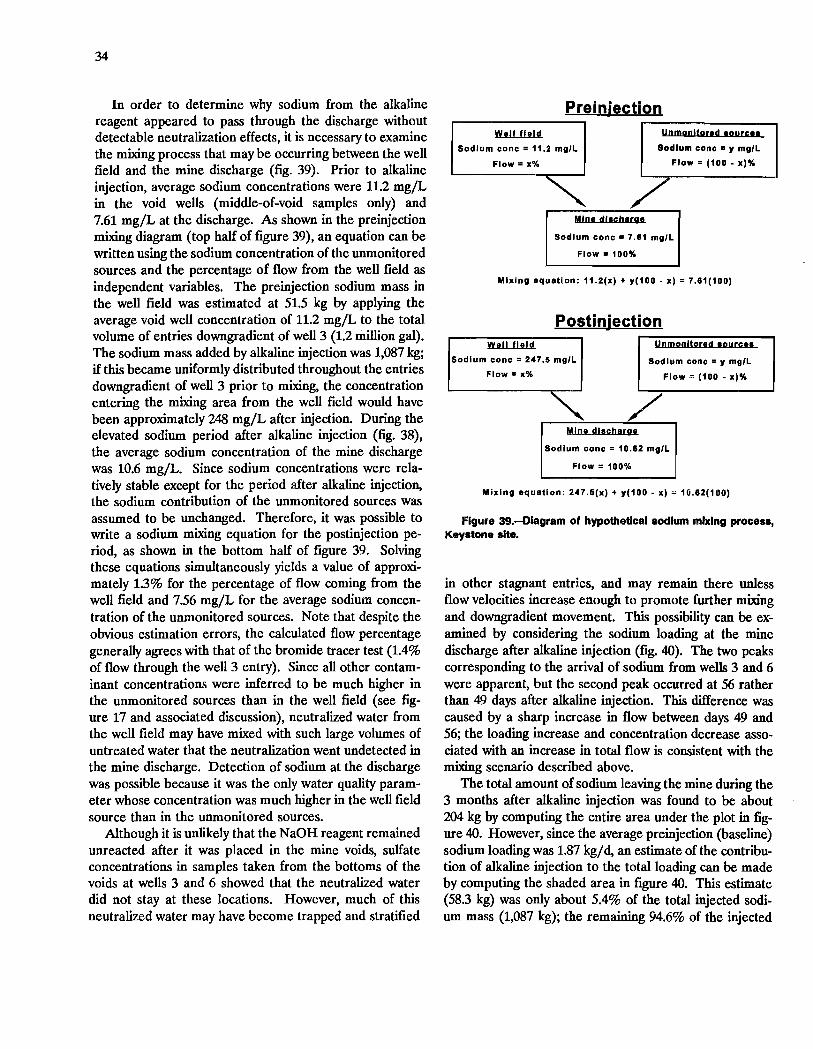
34
In order to determine why sodium from the alkaline reagent appeared to pass through the discharge without detectable neutralization effects, it is necessary to examine the mixing process that may be occurring between the well field and the mine discharge (fig. 39). Prior to alkaline injection, average sodium concentrations were 11.2 mgjL in the void wells (middle-of-void samples only) and 7.61 mgjL at the discharge. As shown in the preinjection mixing diagram (top half of figure 39), an equation can be written using the sodium concentration of the unmonitored sources and the percentage of flow from the well field as independent variables. The preinjection sodium mass in the well field was estimated at 51.5 kg by applying the average void well concentration of 11.2 mgjL to the total volume of entries downgradient of well 3 (1.2 million gal). The sodium mass added by alkaline injection was 1,087 kg; if this became uniformly distributed throughout the entries downgradient of well 3 prior to mixing, the concentration entering the mixing area from the well field would have been approximately 248 mgjL after injection. During the elevated sodium period after alkaline injection (fig. 38), the average sodium concentration of the mine discharge was 10.6 mgjL. Since sodium concentrations were relatively stable except for the period after alkaline injection, the sodium contribution of the unmonitored sources was assumed to be unchanged. Therefore, it was possible to write a sodium mixing equation for the postinjection period, as shown in the bottom half of figure 39. Solving these equations simultaneously yields a value of approximately 1.3% for the percentage of flow coming from the well field and 7.56 mgjL for the average sodium concentration of the unmonitored sources. Note that despite the obvious estimation errors, the calculated flow percentage generally agrees with that of the bromide tracer test (1.4% of flow through the well 3 entry). Since all other contaminant concentrations were inferred to be much higher in the unmonitored sources than in the well field (see figure 17 and associated discussion), neutralized water from the well field may have mixed with such large volumes of untreated water that the neutralization went undetected in the mine discharge. Detection of sodium at the discharge was possible because it was the only water quality parameter whose concentration was much higher in the well field source than in the unmonitored sources.
Although it is unlikely that the NaOH reagent remained unreacted after it was placed in the mine voids, sulfate concentrations in samples taken from the bottoms of the voids at wells 3 and 6 showed that the neutralized water did not stay at these locations. However, much of this neutralized water may have become trapped and stratified
Preinjection Will (11111 UomSiDlisUld IIUI['I.
Sodium cone = 11.2 mg/l Sodium cone" 'I mg/l
Flow = x% Flow = (100 • x)%
'" /' MIDI IIlallb.rgl
Sodium cone = 7.81 mg/l
Flow = 100%
Mixing equation: 11.2(x) + '1(100 • x) = 7.81(100)
Postinjection WIll fllill IIDmg nltor.d loure,.
Sodium cone = 247.5 mg/l Sodlu m cone = 'I mg/l
w=(100.x)% Flow = x% Flo
'" / MIDI 1I1111bl[91l
Sodium cone = 10.82 mg/l
Flow = 1000/0
Mixing equation: 247.5(x) + '1(100 • x) = 10.82(100)
Figure 39.-Olagram of hypothetical sodIum mIxing process, Keystone site.
in other stagnant entries, and may remain there unless flow velocities increase enough to promote further mixing and downgradient movement. This possibility can be examined by considering the sodium loading at the mine discharge after alkaline injection (fig. 40). The two peaks corresponding to the arrival of sodium from wells 3 and 6 were apparent, but the second peak occurred at 56 rather than 49 days after alkaline injection. This difference was caused by a sharp increase in flow between days 49 and 56; the loading increase and concentration decrease associated with an increase in total flow is consistent with the mixing scenario described above.
The total amount of sodium leaving the mine during the 3 months after alkaline injection was found to be about 204 kg by computing the entire area under the plot in figure 40. However, since the average preinjection (baseline) sodium loading was 1.87 kgj d, an estimate of the contribution of alkaline injection to the total loading can be made by computing the shaded area in figure 40. This estimate (58.3 kg) was only about 5.4% of the total injected sodium mass (1,087 kg); the remaining 94.6% of the injected
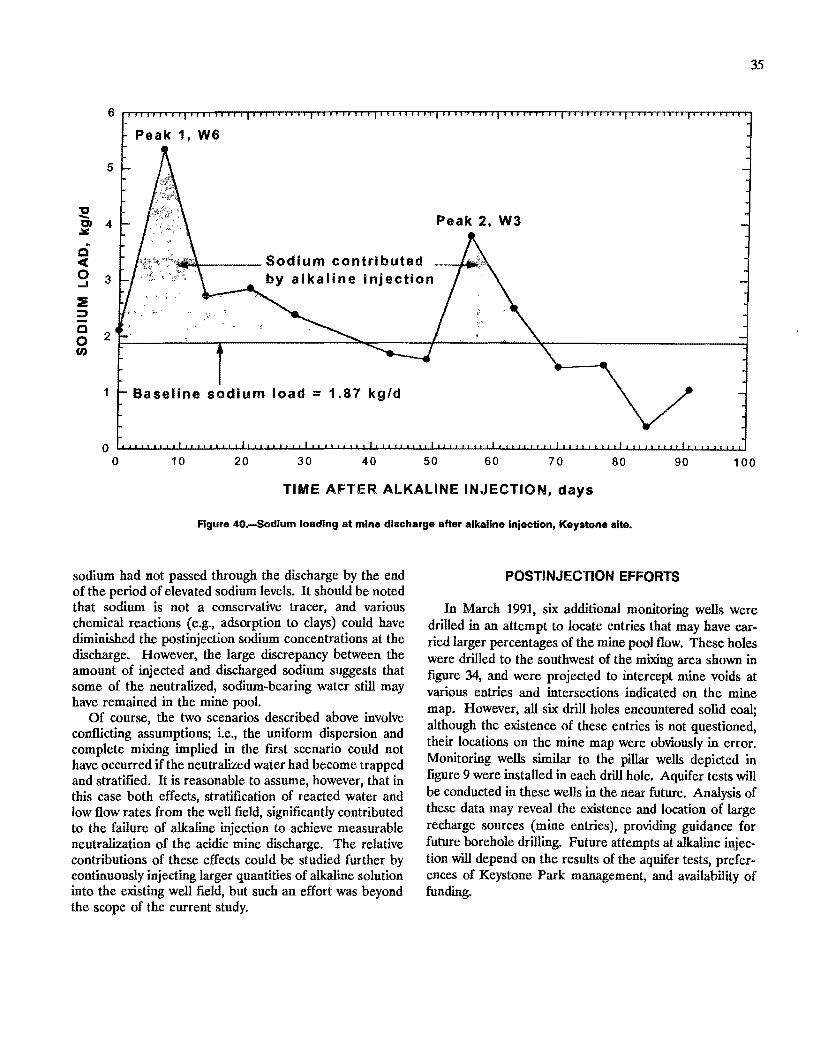
35
6
Peak 1, W6
5
'C -g) ..lII::
4
Q Sodium contributed c(
0 3 -J
:IE ~ P' •
Q 2 0
U)
1 Baseline sodium load = 1.87 kg/d
o ~~~~~~~~~~~~~~~~~~~~~~~~wu~~~~~~~~~~~~ o 10 20 30 40 50 60 70 80 90 100
TIME AFTER ALKALINE INJECTION, days
Rgure 40.-Sodlum loading at mine discharge after alkaline Injection, Keystone alte.
sodium had not passed through the discharge by the end of the period of elevated sodium levels. It should be noted that sodium is not a conservative tracer, and various chemical reactions (e.g., adsorption to clays) could have diminished the postinjection sodium concentrations at the discharge. However, the large discrepancy between the amount of injected and discharged sodium suggests that some of the neutralized, sodium-bearing water still may have remained in the mine pool.
Of course, the two scenarios described above involve conflicting assumptions; i.e., the uniform dispersion and complete mixing implied in the fIrst scenario could not have occurred if the neutralized water had become trapped and stratified. It is reasonable to assume, however, that in this case both effects, stratification of reacted water and low flow rates from the well field, signifIcantly contributed to the failure of alkaline injection to achieve measurable neutralization of the acidic mine discharge. The relative contributions of these effects could be studied further by continuously injecting larger quantities of alkaline solution into the existing well fIeld, but such an effort was beyond the scope of the current study.
POSTINJECTION EFFORTS
In March 1991, six additional monitoring wells were drilled in an attempt to locate entries that may have carried larger percentages of the mine pool flow. These holes were drilled to the southwest of the mixing area shown in fIgure 34, and were projected to intercept mine voids at various entries and intersections indicated on the mine map. However, all six drill holes encountered solid coal; although the existence of these entries is not questioned, their locations on the mine map were obviously in error. Monitoring wells similar to the pillar wells depicted in figure 9 were installed in each drill hole. Aquifer tests will be conducted in these wells in the near future. Analysis of these data may reveal the existence and location of large recharge sources (mine entries), providing guidance for future borehole drilling. Future attempts at alkaline injection will depend on the results of the aquifer tests, preferences of Keystone Park management, and availability of funding.
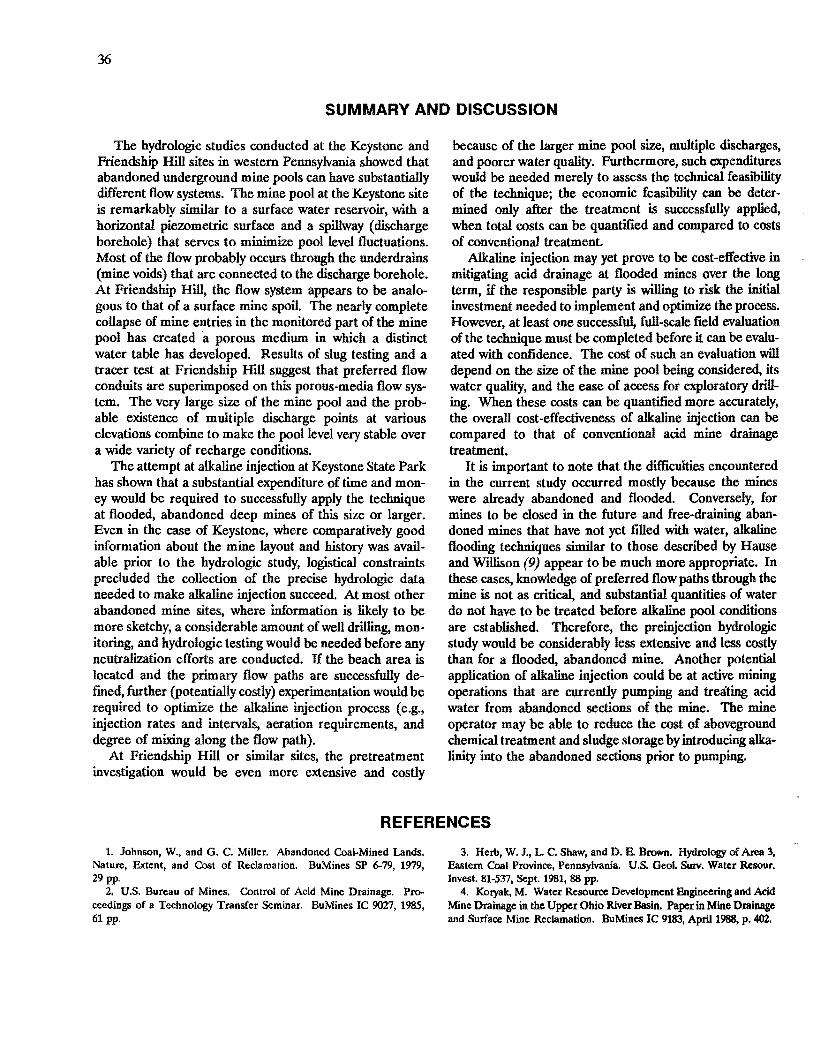
36
SUMMARY AND DISCUSSION
The hydrologic studies conducted at the Keystone and Friendship Hill sites in western Pennsylvania showed that abandoned underground mine pools can have substantially different flow systems. The mine pool at the Keystone site is remarkably similar to a surface water reservoir, with a horizontal piezometric surface and a spillway (discharge borehole) that serves to minimize pool level fluctuations. Most of the flow probably occurs through the underdrains (mine voids) that are connected to the discharge borehole. At Friendship Hill, the flow system appears to be analogous to that of a surface mine spoil. The nearly complete collapse of mine entries in the monitored part of the mine pool has created 'a porous medium in which a distinct water table has developed. Results of slug testing and a tracer test at Friendship Hill suggest that preferred flow conduits are superimposed on this porous-media flow system. The very large size of the mine pool and the probable existence of multiple discharge points at various elevations combine to make the pool level very stable over a wide variety of recharge conditions.
The attempt at alkaline injection at Keystone State Park has shown that a substantial expenditure of time and money would be required to successfully apply the technique at flooded, abandoned deep mines of this size or larger. Even in the case of Keystone, where comparatively good information about the mine layout and history was available prior to the hydrologic study, logistical constraints precluded the collection of the precise hydrologic data needed to make alkaline injection succeed. At most other abandoned mine sites, where information is likely to be more sketchy, a considerable amount of well drilling, monitoring, and hydrologic testing would be needed before any neutralization efforts are conducted. H the beach area is located and the primary flow paths are successfully defined, further (potentially costly) experimentation would be required to optimize the alkaline injection process (e.g., injection rates and intervals, aeration requirements, and degree of mixing along the flow path).
At Friendship Hill or similar sites, the pretreatment investigation would be even more extensive and costly
because of the larger mine pool size, multiple discharges, and poorer water quality. Furthermore, such expenditures would be needed merely to assess the technical feasibility of the technique; the economic feasibility can be determined only after the treatment is successfully applied, when total costs can be quantified and compared to costs of conventional treatment.
Alkaline injection may yet prove to be cost-effective in mitigating acid drainage at flooded mines over the long term, if the responsible party is willing to risk the initial investment needed to implement and optimize the process. However, at least one successful, full-scale field evaluation of the technique must be completed before it can be evaluated with confidence. The cost of such an evaluation will depend on the size of the mine pool being considered, its water quality, and the ease of access for exploratory drilling. When these costs can be quantified more accurately, the overall cost-effectiveness of alkaline injection can be compared to that of conventional acid mine drainage treatment.
It is important to note that the difficulties encountered in the current study occurred mostly because the mines were already abandoned and flooded. Conversely, for mines to be dosed in the future and free-draining abandoned mines that have not yet filled with water, alkaline flooding techniques similar to those described by Hause and Willison (9) appear to be much more appropriate. In these cases, knowledge of preferred flow paths through the mine is not as critical, and substantial quantities of water do not have to be treated before alkaline pool conditions are established. Therefore, the preinjection hydrologic study would be considerably less extensive and less costly than for a flooded, abandoned mine. Another potential application of alkaline injection could be at active mining operations that are currently pumping and treating acid water from abandoned sections of the mine. The mine operator may be able to reduce the cost of aboveground chemical treatment and sludge storage by introducing alkalinity into the abandoned sections prior to pumping.
REFERENCES
1. Johnson, W., and G. C. Miller. Abandoned Coal-Mined ~nds. Nature, Extent, and Cost of Reclamation. BuMines SP 6-79, 1979, 29pp.
2. U.S. Bureau of Mines. Control of Acid Mine Drainage. Proceedings of a Technology Transfer Seminar. BuMines IC 9027, 1985, 61 pp.
3. Herb, W. J., L. C. Shaw, and D. B. Brown. Hydrology of Area 3, Eastern Coal Province, Pennsylvania. U.s. Geol. SulV. Water Resour. Invest. 81-537, Sept. 1981,88 pp.
4. Koryak, M. Water Resource Development Engineering and Acid Mine Drainage in the Upper Ohio River Basin. Paper in Mine Drainage and Surface Mine Reclamation. BuMines IC 9183, April 1988, p. 402.

5. Ladwig, K J., P. M. Erickson, R L. P. Kleinmann, and E. T. Posluszny. Stratification in Water Quality in Inundated Anthracite Mines, Eastern Pennsylvania. BuMines RI 8837, 19M, 35 pp.
6. Poissant, S. A., and F. T. Caruccio. The Occurrence and Viability of Thiobacillus Ferrooxidans Under Varied Geochemical Conditions in Upshur and Lewis Counties, West Virginia. Paper in Proceedings, 1986 Symposium on Surface Mining, Hydrology, Sedimentology, and Reclamation, Lexington, KY, Dec. 8-11, 1986, ed. by D. H. Graves. Univ. KY, Lexington, KY, 1986, pp. 141-146.
7. Stoddard, C. K Abatement of Mine Drainage Pollution by Underground Precipitation. U.S. EPA, EPA-670j2-73-092, 1973, 125 pp.
8. Ladwig, K J., P. M. Erickson, and R L. P. Kleinmann. Alkaline Injection: An Overview of Recent Work. Paper in Control of Acid Mine Drainage. BuMines IC 9027, 1985, pp. 35-40.
9. Hause, D. R, and L. R Willison. Deep Mine Abandonment Sealing and Underground Treatment to Preclude Acid Mine Drainage. Pres. at 7th Annual WV Surf. Mine Drain. Task Force Symp., Morgantown, WV, Apr. 1-2, 1986. WV Surf. Min. Reclam. Assoc., Charleston, WV, prcprint, 1986.
10. Stiller, A. H. A Method for Prevention of Acid Mine Drainage. Pres. at 3d Annual WV Surf. Mine Drain. Task Force Symp., Clarksburg, WV, May 17, 1982. WV Surf. Min. Reclam. Assoc., Charleston, WV, preprint. 1982.
11. Chung, N. K, 1973. Investigation of Use of Gel Material for Mine Sealing. U.S. EPA Rep. No. R2-73-135. Jan. 1973, 67pp.
12. Skema, V. W. (ed.). Coal Resources of Westmoreland County, Pennsylvania. PA Geo!. Surv., Miner. Resour. Rep. 94, Part I, 1988, 'l27pp.
37
13. Hickok, W.O., and F. T. Moyer. Geology and Mineral Resources of Fayette County, Pennsylvania. PA Geol. SUN., County Rep. 26, 1940 (reprinted 1973). 530 pp.
14. Hem, J. D. Study and Interpretation of the Chemical Characteristics of Natural Water. U.S. Geo!. SUN. Water-Supply Pap. 2254, 1985. 264 pp.
15. Davis, S. N.. D. J. Campbell, H. W. Bentley, and T. J. Flynn. Ground Water Tracers. Nat. Water Well Assoc., Columbus, OH, 1988, 200 pp.
16. Lide, D. R (ed.). Handbook of Chemistry and Physics. CRC Press, 71st ed., 1990-91, Sec. 6, pp. 151.
17. Drost, W., D. Klotz, A. Koch, H. Moser, F. Neumaier, and W. Rauert. Point Dilution Methods of Investigating Ground Water Flow by Means of Radioisotopes. Water Resour. Res., v. 4, No. I, 1968, pp.l25.
18. Grisak, G. E., W. F. Merritt, and D. W. Williams. A Fluoride Borehole Dilution Apparatus for Groundwater Velocity Measurements. Can. Geotech. J., v. 14, 1977, pp. 554-557.
19. Bouwer, H., and R C. Rice. A Slug Test for Determining Hydraulic Conductivity of Unconfined Aquifers with Completely or Partially Penetrating Wells. Water Resour. Res., v. 12, No.3, pp. 423-428.
20. Hawkins, J. W., and W. W. A1joe. Hydrologic Characteristics of a Surface Mine Spoil Aquifer. Paper in Proceedings, Second International Conference on the Abatement of Acidic Drainage, Montreal, Canada, Sept. 16-18, 1991. CANMET, Ottawa, Ontario, 1991, pp. 47-68.
INT.BU.OF MINES,PGH.,PA 29766
*U.S.G.P.O.: 1993--709-008/80022