neuroscience databases: a practical guide chapter...
TRANSCRIPT
Neuroscience Databases: A Practical Guide
Chapter 19
Federation of Brain Data through Knowledge-guidedMediation
Maryann E. Martone1, Amarnath Gupta2, Bertram Ludäscher2 , IlyaZaslavsky2 and Mark H. Ellisman1, 2
1National Center for Microscopy and Imaging Research and Department of Neurosciences,University of California, San Diego, San Diego CA, 2San Diego Supercomputer Center,University of California, San Diego, San Diego CA. E-mail: [email protected]
Abstract: In this chapter, we describe a data integration framework for multi-resolution dataand some of the tools we have created for achieving integration of distributed datasources. The chapter is divided into two parts. In the first part, we describe arecently developed database for high resolution 3D data on cell structure andprotein localization, the Cell Centered Database or CCDB. In the second part, wedescribe how we can link data sources such as the CCDB to other databases usinga mediation-based approach. By incorporating additional knowledge into thesystem, we are able to link together sources that are related conceptually, even ifthey do not contain similar elements in their schemata. For each of the tools andresources described, we indicate its current state of development and availability.
Key words: database, electron tomography, protein localization, confocal microscopy, electronmicroscopy
1. INTRODUCTION
The grand goal in neuroscience research is to understand how the interplayof structural, chemical and electrical signals in nervous tissue gives rise tobehavior. Experimental advances of the past decades have given theindividual neuroscientist an increasingly powerful arsenal for obtaining data,from the level of molecules to entire nervous systems. Scientists have begunthe arduous process of adapting and assembling neuroscience data at all scalesof resolution and across disciplines into computerized databases and othereasily accessed sources (Wong and Koslow, 2001). These databases willcomplement the vast structural and sequence databases created to catalogue,organize and analyze gene sequences and protein products. The utility ofsuch databases has been amply demonstrated, as an entire new field,bioinformatics, has been inaugurated to organize and mine the data (Persidis,
Chapter 19
1999, 2000). The question of whether equal rewards will accrue from similarefforts for histological data, whole brain imaging, physiological data, etc.,remains to be answered. Nevertheless, at the very least, neuroinformaticsefforts will provide organizing frameworks and computational tools tomanage neuroscience data, from the lab notebook to published data (Gardneret al., 2001; Miller et al., 2001). In the best case, it will provide newopportunities to integrate large amounts of biological data into unifiedtheories of function and aid in the discovery process (Chicurel, 2000; Fox andLancaster, 2002).
In this chapter, we describe a data integration framework for multi-resolution and multi-disciplinary data and some of the tools we have createdfor achieving integration of distributed data sources. The chapter is dividedinto two parts. In the first part, we describe a recently developed database forhigh resolution 3D data on cell structure and protein localization, the CellCentered Database or CCDB (Martone et al., in press). In the second part, wedescribe how we can link data sources such as the CCDB to other databasesusing a mediation-based approach. In a mediated system, the user does notinteract directly with an individual data source but poses a query to amediator, which then breaks down the query and retrieves data from theindividual sources. By incorporating additional knowledge into the system,we are able to link together sources conceptually so that information can belinked and assembled from disparate sources to achieve integration ofbiological data across scales and disciplines. For each of the tools andresources described, we indicate its current state of development andavailability.
2. THE CELL CENTERED DATABASE
2.1 Data Modeling and Structure of the CCDB
The CCDB was created for high resolution 3D light and electronmicroscopic reconstructions of cells and subcellular structures. It contains 3Dstructural and protein distribution information from confocal, multiphoton andelectron microscopy, including correlated microscopy. Many of the data setsare derived from electron tomography, a powerful 3D reconstructiontechnique for electron microscopic specimens. Electron tomography is similarin concept to medical imaging techniques like CAT scans and MRI in that itderives a 3D volume from a series of 2D projections through a structure. Inthis case, the structures are contained in sections prepared for electronmicroscopy, which are tilted through a limited angular range. Projectionsthrough the section are captured at regular tilt increments, aligned to acommon origin and then back projected into a 3D volume (McEwen andFrank, 2001). When combined with high voltage electron microscopy,

Neuroscience Databases: A Practical Guide
detailed reconstructions can be made of relatively large expanses of tissue atEM resolution. For example, the CCDB contains reconstructions of extendedstructures such as spiny dendrites from selectively stained neurons containedwithin 2-5 µm thick sections (Fig. 1). Single reconstructions can contain upto a 20 µm stretch of dendrite with upwards of 60 spines. Electrontomography is also providing new insights in the 5–40 nm range. Structuralfeatures in this range have traditionally been difficult to study because theyare smaller than the thickness of a thin section produced for electronmicroscopy (60-100 nm thick) and so tend to be obscured within the depths ofthe section. In electron tomography, computed sections through a volume canbe generated with an effective resolution of 5-10 nm, thereby uncoveringstructural detail within this range. Tomography has led to a complete revisionof our understanding of even well-studied structures such as mitochondria(Perkins et al., 1997; Mannella et al., 1997) and the neuromuscular junction(Harlow et al., 2001).
The CCDB is built on anobject-relational frameworkusing Oracle 8i. The currentCCDB has over 80 tablescontaining a large amount ofdescriptive data. It models theentire process of 3Dreconstruction, from specimenpreparation to segmentationand analysis. A volumereconstruction is stored alongwith all of the raw images andthe processing details requiredto reconstruct the volume fromthe raw data. Each objectsegmented from the 3Dvolume is stored as a separateobject indexed to the parentreconstruction. Four types ofsegmented objects arecurrently modeled in theCCDB: 1) surface objects:polygonal surface meshesrepresenting 3D objects in thereconstruction, extracted usingeither isosurfacing methods ormanual contouring; 2)contour objects: a series of2D contours defining anobject; 3) volume objects:
Figure 1. Examples of tomographic data sets in theCCDB. A and B show a selectively stained spinydendrite from a Purkinje cell. A is a projection of thevolume reconstruction (dendrite appears as whiteagainst dark background). B is the segmenteddendrite. C and D show a tomographicreconstruction of the node of Ranvier. C is a singlecomputed slice through the volume. D is a surfacereconstruction of the various components comprisingthe node. Scale bar in B = 1 µm; in C = 0.5 µm

Chapter 19
subvolumes containing an object of interest; and 4) tree objects: skeletons ofbranching objects like dendrites and axons, derived from Neurolucida(Microbrightfield, Colchester, VT, USA). Each object is stored along withany measurements like surface area, volume, length, number and labelingintensity. Whenever possible, parsers are written for the output of analysisprograms so that results can be uploaded directly into the CCDB. Forexample, measurement summaries for tree objects are uploaded directly fromthe output of NeuroExplorer, an analysis program for Neurolucida-deriveddata.
The data contained in the CCDB will be derived from both published andunpublished data. A constant concern in creating and maintaining databasesof experimental information is the quality of data retrieved from a query. Inthe CCDB, the evaluation of the quality and accuracy of morphometric orprotein distribution modeling is up to the user. Thus, the CCDB containsseveral features to aid in this process including: 1) the inclusion ofmorphometric data stored with the objects to allow the user to compare thestatistics of a given data set to other stored and published data to determinewhether they fall within expected ranges; 2) access to the raw data along withall the imaging and processing steps to allow the accuracy and quality of thefinal reconstruction to be assessed by an experienced user; 3) field to indicatewhether the data come from published studies; 4) evaluation tables for usersto store estimations of the quality of experimental, imaging, protein labelingand reconstruction results; and 5) the ability for users to supply additional oralternative interpretations of a given data set, which will be retrieved alongwith the data. In this way, the CCDB can serve as an interactive forum fordata interpretation.
2.1 Accessing the CCDB
The CCDB can be accessed at http://www.ncmir.ucsd.edu/CCDB. Thehome page is shown in Fig. 2. The CCDB is still under development but isavailable on-line for limited use. We welcome feedback from interestedusers, although some of the functions described in this chapter may not befully implemented by the time of publication. Information on the currentfunctionality and updates to the site are available from the “Status/Update”link off of the main page. The main page also contains links to a descriptionof the CCDB and to visualization and analysis tools available for datacontained in the CCDB. The CCDB itself is accessed by the “Enter thedatabase” link which takes the user to the log in page. The log in page allowsusers to create new accounts, log in to the database or view the CCDBschema by clicking on the appropriate links. Some sample query results arealso available. The CCDB is freely accessible, although users must registerfor an account. Accounts are created by clicking on “Create Account.”

Neuroscience Databases: A Practical Guide
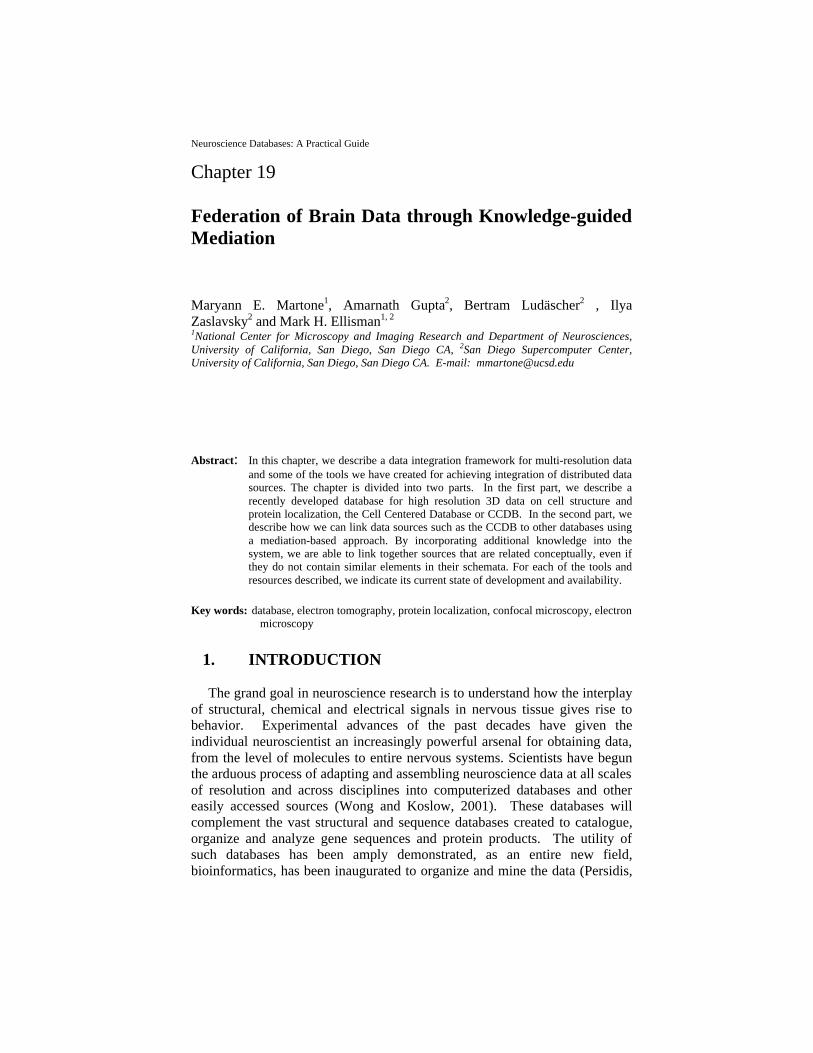
Upon logging in, the user is presented with a simple query interface shownin Fig. 3. Users may query on a limited number of descriptive fields such ascell type or structure, by typing in values or selecting from the pull downmenus. More advanced query interfaces are currently being developed for theCCDB which will take advantage of the rich data model of the CCDB toretrieve data based on morphometric features contained in the data. Anexample of such a query form is shown in Fig. 3 (right panel) for neuronalbranching data contained in Neurolucida files. Users can retrieve neuron databased on branching patterns, tortuosity of dendrites and other metrics. Thisform can be viewed, along with sample queries, by clicking on the “AdvancedQuery Form” from the “Enter the database” page, although at the time ofwriting, this form is not linked to the CCDB. From these types of featurebased queries, one can begin to look at relationships among various data sets.We might ask, for example, whether variability in neuronal branching patternscorrelates with any subject characteristic.
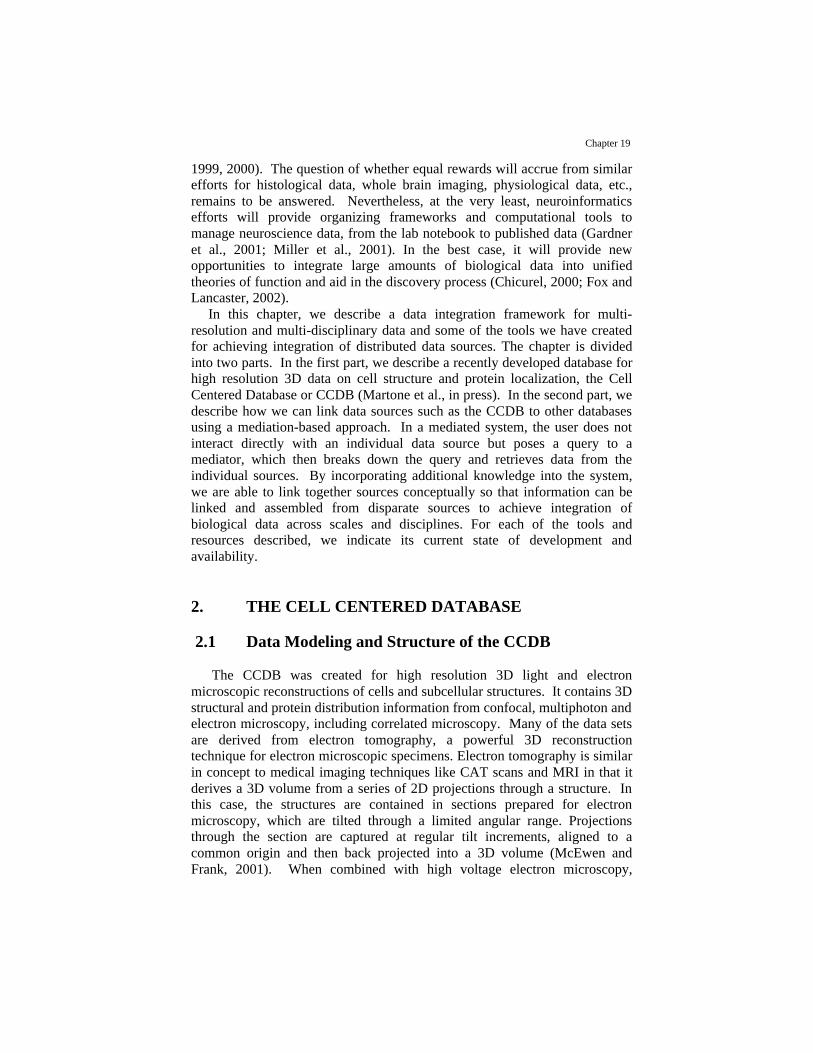
In response to a query, the CCDB informs the user of the total number ofdata sets matching the criteria and presents a short set of descriptors. For eachdata set returned, the CCDB presents thumbnails of the types of image dataavailable for that particular result (Fig. 4). The user may view a 2D image byclicking on the thumbnail or may download the data. In the current version ofthe CCDB, the image data itself is not stored directly in the database; that isthe actual voxel values and spatial arrays are not stored in the database.
Figure 2. Home page of the CCDB. Clicking on “Enter the database” takes the user to thelog in page.
Chapter 19
Instead, the descriptive and analysis data are stored along with pointers to theimage file. To store the images for the CCDB, we have opted to use theStorage Resource Broker (SRB), a data management system for storing andaccessing distributed data (http://www.npaci.edu/DICE/SRB/). The SRB is
sophisticated client-servermiddleware that provides auniform interface forconnecting to dataresources over a network.Unlike conventional accessmethods, e.g., file servers,ftp, or http, SRB is grid-based software providingtransparent access to data,relieving the user fromdealing with aspects suchas physical location ofimaging data, concretestorage devices, anddevice-dependent accessprotocols. Thus, regardlessof where the data lives,whether in a single locationor distributed acrossseveral databases, filesystems, and high-performance storagesystems, SRB providesaccess to the data via an
Figure 3. Simple query form for the CCDB (left). An example of the type of advancedquery forms being developed for attribute queries is shown on the right.
Figure 4. Return of query results from the CCDB. Allof the types of image files associated with a given dataset are listed at the bottom. “Atlas Map” shows thelocation of a data set with respect to a brain atlas (seebelow).
Neuroscience Databases: A Practical Guide
SRB identifier. When a user requests a file from the CCDB, the file isretrieved via its SRB ID. Eventually, the SRB will handle additional functionslike file format conversions so that the user can request the data in mostcommon formats. The CCDB acts as a single client of the SRB, so thatseparate SRB authentications and accounts do not have to be obtained foreach user.
Data in the CCDB are stored in a variety of formats currently used atNCMIR and may be viewed with tools available for download. A list of thesetools is available under the “Visualization Tools” link on the CCDB mainpage (visible in Fig. 2), which provides the platform dependencies of eachtool along its utility for the different types of data available (volumes,contours, tree structures and surfaces). A general purpose java-based viewerfor CCDB data, Jviewer, is being developed, which can be used to viewimages in the CCDB directly from the web interface. Also available at thebottom of the Visualization Tools web page is a link to file format convertersavailable through NCMIR.
2.3 Spatial and Semantic Indexing of Data in the CCDB
One of the goals of our work, and informatics in general, is to developsystems for integration of data across scales and disciplines. In our case, wewish to relate the cellular level data in the CCDB to data acquired at the tissueand molecular levels. In order to achieve this goal, we must develop sharedframeworks in which to place individual data sets so that they can be relatedto data taken in other experiments. One obvious framework is spatial, usingstandard brain atlases to provide registration to a common coordinate system.A second is semantic, taking advantage of efforts in various communities todevelop shared ontologies. An ontology can be thought of as a network ofterms, concepts and the relationships between them.
To aid in the registration of data in databases like the CCDB, we aredeveloping a web-based tool for situating brain data in both a spatial andsemantic context. The Spatial Mark Up and Rendering Atlas Tool (“SmartAtlas”), based on a geographical mapping tool, is a web-based tool that allowsusers to define polygons on a series of 2D vector images and annotate themwith names, relationships and ontology concept IDs. Using this tool, we arecreating a “Smart Atlas” and spatial database for neuroscience data using abrain atlas as the interface. For the purposes of demonstrating the utility ofthis tool, we are using a commercially available brain atlas, Paxinos andWatson (1998), as the interface. Because the atlas is a commercial product,the web page is password protected. The Smart Atlas tool, itself, though willbe made available to other scientists for use with their own atlases. Therefore,we describe its utility in some detail below. A demonstration page is beingset up and will be available from the log in page of the CCDB.

Chapter 19
The Smart Atlas interface is illustrated in Fig. 5. The Adobe Illustratorfiles supplied with the atlas were converted into SVG format using a plug-inavailable at http://www.adobe.com/support/downloads/. The spatialcoordinates of the line segments in each image were stored in an Oracledatabase, which serves as the back end of the Smart Atlas. The user then“marks up” the atlas using the Smart Atlas tool. First, the user selects thoseline segments comprising a brain region to define a polygon (Fig. 5). Theuser then annotates the polygon with the name of the brain region. Inaddition, the user links the brain region to one or more ontologies through abrowsing tool accessed through the Smart Atlas. In the case of the CCDB, weare using the Unified Medical Language System (UMLS), developed forbiomedical sciences by the National Library of Medicine (Ingenerf et al.,2001). Strictly speaking, the UMLS is a metathesaurus, but for manypurposes it can be used like an ontology. The user browses the UMLS andselects the relevant concept. The polygon is now tagged with both the nameof the region and the UMLS concept.
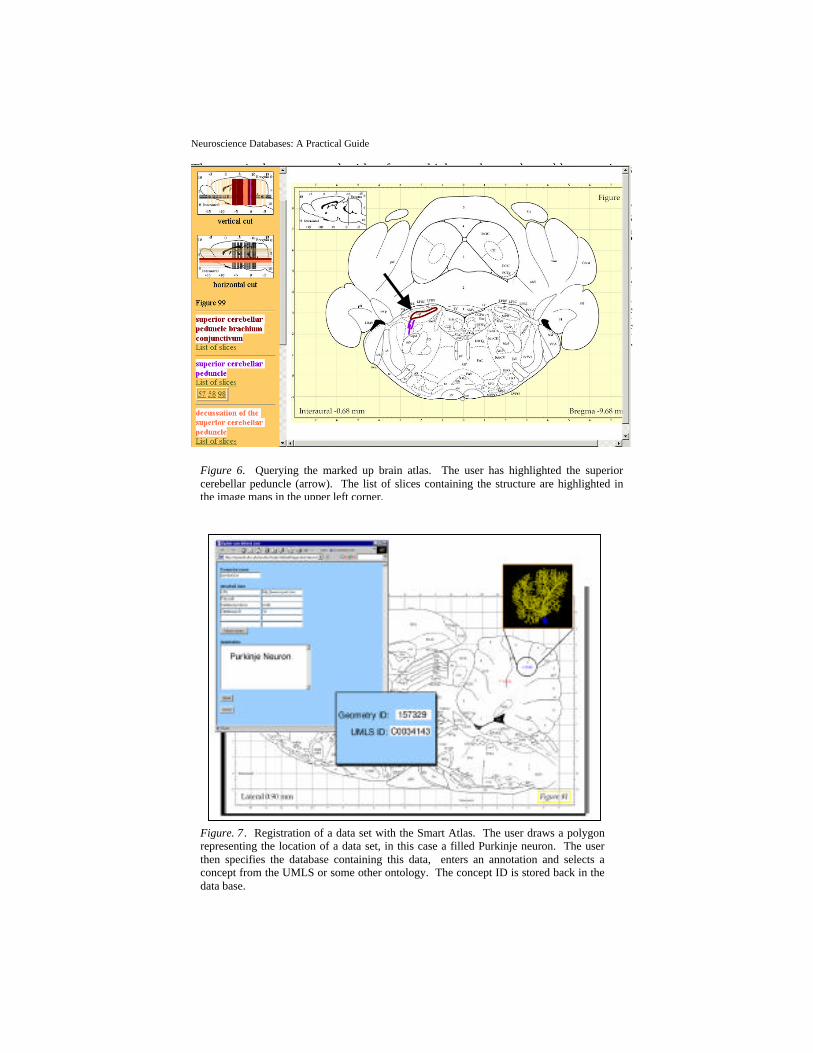
Once the atlas has been marked up, it can be queried from the samebrowser. Clicking on any point in the atlas will return the stereotaxiccoordinates. Clicking on a brain region will return the name of that region,along with any synonyms, and highlight all planes containing that structure(Fig. 6).
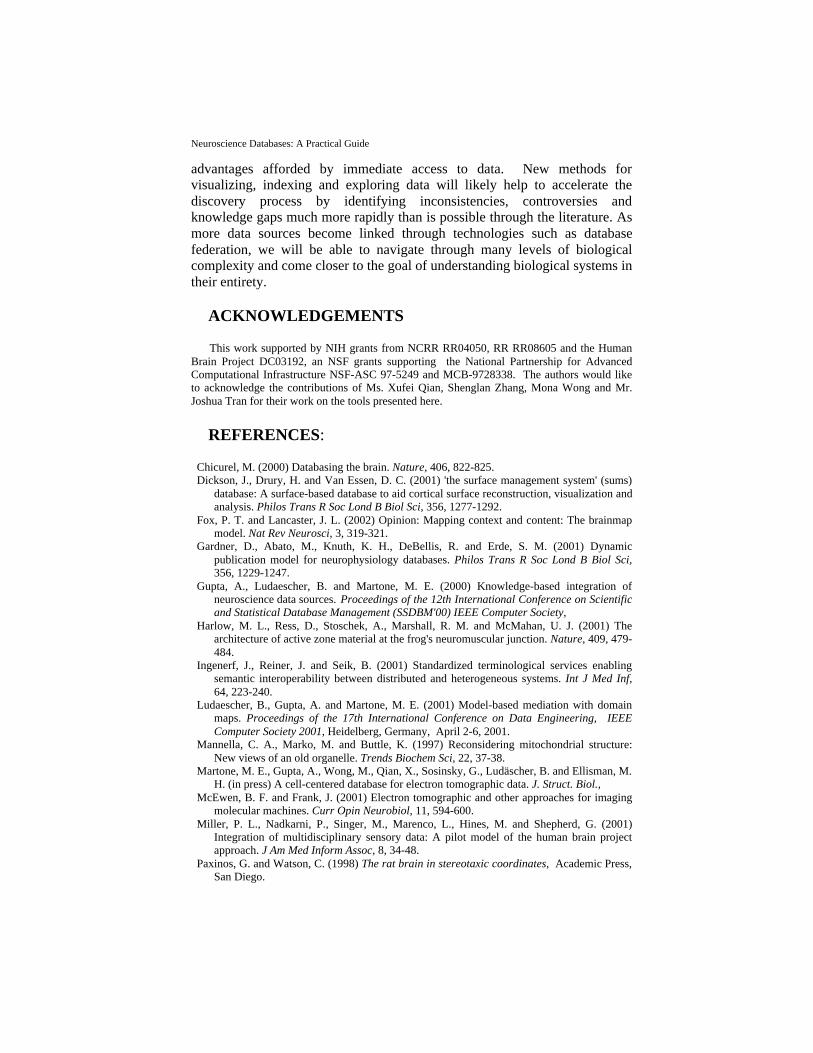
The Smart Atlas can now be used to register a researcher’s data to aspecific spatial location. In this case, the user draws an arbitrary polygonrepresenting the approximate data location on one of the atlas planes (Fig. 7).
Figure 5. Spatial Mark Up and Rendering Tool for spatial and semantic registrationof brain data. The atlas slice shown is from the Paxinos and Watson rat brain atlas.The user has defined cerebellar lobule iii and attached the concept ID from theUMLS.
Neuroscience Databases: A Practical Guide
The user is then presented with a form which can be used to add annotationsor to link to an ontology concept. Although the UMLS is used in the examplesshown here, the user will eventually be able to use multiple ontologies,including those of their own creation, for semantically indexing data. Toolsare also being developed to define new terms and relationships in existingontologies.
The utility of indexing data in a database using the Smart Atlas tool isseveral fold. By using an ontology concept ID for indexing CCDB data, theuser is relieved from having to specify multiple terms to characterize the data.Once the concept is chosen, the data set inherits the parents and children ofthis node and is thereby placed in a larger semantic context. The full utility ofthis system will be illustrated in the next section, which describes ourapproach to linking brain databases into a federated, cross-queriable system.
Figure. 7 . Registration of a data set with the Smart Atlas. The user draws a polygonrepresenting the location of a data set, in this case a filled Purkinje neuron. The userthen specifies the database containing this data, enters an annotation and selects aconcept from the UMLS or some other ontology. The concept ID is stored back in thedata base.
Figure 6. Querying the marked up brain atlas. The user has highlighted the superiorcerebellar peduncle (arrow). The list of slices containing the structure are highlighted inthe image maps in the upper left corner.

Chapter 19
Spatial indexing of data to a coordinate system will allow the user to posespatial queries, e.g., find data associated with this region; find all structureswithin 1 mm of this area. It also allows the user to take advantage of effortsto develop spatial transformations and alternative representations of braintopology, e.g., flat maps of cortex and cerebellar cortex (Dickson et al., 2001;Van Essen et al., 2001). The locations of filled or immunolabeled neuronsfrom the CCDB can be mapped onto these flat maps to give additionalinformation on the distribution of neuronal classes or compare features suchas dendritic arbor size as a function of location. Thus, by indexing to acommon coordinate system, we can facilitate interoperability of informaticstools.
3. FEDERATION OF BRAIN DATA
No matter how sophisticated and complete the CCDB is in modeling andquerying the data, it only covers a very small portion of the biologicalspectrum. The oft stated goal of informatics research is to create computer-based approaches to allow scientists to integrate and relate data obtained atdifferent scales, experimental systems and sub-disciplines. To tackle such anambitious goal, various approaches have been taken. These approaches rangefrom data warehousing, where data is gathered from multiple souces anddeposited into a larger database (Rachedi et al., 2000), to the creation of“virtual federations” where individual data sources remain separate but are“wrapped” in a standard language such as XML (extensible markup language)that allows their content to be understood by a federation engine known as amediator. The mediator is responsible for selecting, restructuring, andmerging information from autonomous sources and for providing an
integrated view of theinformation.
Although mediator-basedsystems have been aroundfor some time, their use tointegrate biologicaldatabases presents achallenge. When one islinking databases containingsimilar information, e.g.,gene sequence databases, thelinkage between datasources are straightforwardand can be expressed asrelatively simple structuralstatements which identify
Figure 8. Overview of the prototypeKIND mediator. The lower iconsrepresent 3 different sources linked to themediator. The box in the upper panelrepresents the mediator layer.

Neuroscience Databases: A Practical Guide
common elements in their respective schemata. The task becomes moredifficult, however, when attempting to relate data sources which cannot bejoined on a purely structural level but which nevertheless contain relevantdata. For example, a database at Montana State University on sensory neuronsencoding wind direction in the cricket may not share any attributes incommon with a database of anatomical structures in the monkey visual cortex.Despite the lack of common semantic links, most neuroscientists can easilyrelate these two data sources at the conceptual level, by recognizing that theyboth are sensory systems and may share certain aspects of population codingof sensory stimuli. In fact, neuroscientists usually can navigate with relativeease from the level of individual molecules to brains and across experimentaldisciplines, because they possess the requisite knowledge to conceptuallyrelate data at each level. We have developed a novel mediator-basedintegration paradigm which exploits such expert knowledge to begin toaddress the problem of data integration of heterogeneous neuroscience data, asystem which we call “knowledge-guided or model-based mediation”.
An overview of the prototype mediator, called the KIND (KnowledgeIntegration of Neuroscience Data) mediator, is shown in Fig. 8 and isdescribed in more detail in Gupta et al., (2000) and Ludaescher et al., (2001).Additional references and demonstrations are provided athttp://www.npaci.edu/DICE/Neuro/. There are two places in the systemwhere additional knowledge is incorporated. At the source level, the wrapperlanguage exports a conceptual model (CM) of each data source containinginformation about relationships, classes and values using an object-orientedlanguage, F-logic, as the deductive engine. At the mediator level, conceptualknowledge is encoded in the form of a semantic network of terms andrelationships which we call a “domain map”. Domain maps can be thought ofas ontologies with more formal logic-based semantics. The purpose of thedomain map is to provide a declarative means for specifiying additionalknowledge that is not present in the source but is required to bridge twoinformation sources. When a standard SQL query is launched, the mediatorbreaks it down into its component parts, accesses the appropriate data sourcesusing knowledge sources contained in the wrapper or the domain map, andreassembles the results of the query into an integrated view.
In the following examples, we illustrate the utility of the KIND mediatorfor answering queries which require bridging of multiple data sources,ranging from retrieval of multi-resolution data to true data integration where anew piece of information is derived by combining data from two sources.The current system consists of the KIND mediator with the following sourcesregistered: 1) a prototype of the CCDB; 2) the EF-Hand Calcium bindingprotein database, a database of sequence data available from VanderbiltUniversity (http://structbio.vanderbilt.edu/cabp_database/); 3) the NeuronDBdatabase from the SenseLab project (Shepherd et al., 1998; Miller et al.,2001); 4) TAXON, a database created from taxonomy information availablefrom the National Center for Biotechnology Informatics (NCBI).
:

Chapter 19
The queries below are written in natural language for the sake of clarity, butin all cases were executed in standard SQL. Similar demo queries can befound at: http://www.npaci.edu/DICE/Neuro/ (go to “Demonstrations:Knowledge based mediation” and click on “Protein Localization Query”) andmust be executed with an XML-capable browser such as Internet Explorer.
3.1 Examples of data federation using the KIND mediator
3.1.1 Retrieval and navigation through multi-scale data
An example of how the mediator is used in conjunction with the SmartAtlas is shown in Fig. 9. In this case, the user launches a simple query fromthe Smart Atlas Tool by clicking on the cerebellum in order to find all dataassociated with this brain region. It turns out that there are no sources hookedto the mediator which have data indexed under the term “cerebellum”, but theCCDB has data on Purkinje neurons and other structures found within thecerebellum. The mediator locates the terms under “cerebellum” in the domainmap, queries the sources and returns the relevant portion of the domain map tothe user with the available data placed in context. In this way, the user canimmediately see how the available data relates to the concept they chose. Theuser then clicks on the data node to retrieve the data.

Neuroscience Databases: A Practical Guide
3.1.2 Making use of ancillary data sources to increase efficiency ofdata retrieval
“What is the cerebellar distribution of proteins with 90% homology tohuman NCS-1 in the rat? In all rodents?” To answer this query with singlesources, the researcher would first go to the calcium binding protein databaseand retrieve the sequences with 90% homology to human NCS-1. Eachretrieved protein would then have to be used to query the available histologicaldata sources. Using the KIND mediator, however, the researcher specifies theprotein, degree of homology and anatomical region in the mediator andlaunches the query. First, the mediator retrieves the list of proteins withhomology to NCS-1 from the Calcium Binding Protein database, probes theavailable sources and then returns the results. Because the user specified“cerebellum”, all structures defined as belonging to cerebellum are retrieved.To retrieve results for all rodents, the mediator goes to the taxonomy databaseto retrieve species under “rodents” and re-probes the sources.
3.1.3 Integrating information from multiple sources
“What is the overlap between the parallel fiber input into the Purkinjeneuron and the distribution of ryanodine receptor?” In the third example, weshow how knowledge-based mediation can answer a query by integratinginformation across sources to derive information that is not present in anysingle source. Two registered sources have information about Purkinjeneurons, the CCDB and the Senselab Neuron database. The CCDB hasinformation on the distribution of the ryanodine receptor, but no informationon connectivity. The Senselab database has information on connectivity, but
Figure 9. Results of query launched from Smart Atlas. The ovals represent concepts from theUMLS and the diamonds where data is found. Clicking on the diamond returns the data.

Chapter 19
no information on the ryanodine receptor. To address this query, an integratedview definition must be created which structurally and conceptually links thetwo data sources at the level of the domain map. First, the mediator retrievesdata from the SenseLab database on the distribution of the parallel fibers. Itthen locates the relevant portion of the domain map and queries the CCDB viathe domain map to find the intersection. The full demonstration of this querycan be viewed at: http://www.npaci.edu/DICE/Neuro/, under “Demonstrations:Knowledge-based mediation” by clicking on “Protein Localization Query (withdomain map)” and viewing query #3.
3.2 Extending the Domain Map
We have been extending the concept of the domain map to include moredynamic processes such as signal transduction. In a process map, the nodesrepresent states and the edges represent transitions. For example, we havetaken some of the pathways involved in the production of long termpotentiation and represented them in a graphical form. As ontologies andprocess maps are developed, they become not only a useful adjunct to databaseindexing and data management, but an important source of knowledge in theirown right. To take advantage of these graphical bodies of knowledge, we havedeveloped a tool for browsing, querying and tying data to these process maps.The Knowledge Map Explorer Tool (Know-Me) is shown in Fig. 10 and can bedemonstrated at http://pamina2.sdsc.edu:18080/knowme/pm.jsp. Users canselect nodes to elaborate processes, execute queries like “compute the shortestpathway between two nodes” and query for experimental evidence supportinga given relationship.
4 CONCLUSIONS
The KIND mediator is a prototype system, but will form the informationintegration strategy employed by the newly created the BiomedicalInformatics Research Network (http://www.birn.ncrr.gov/) or BIRN. TheBIRN project will ultimately link together technology development resourcessupported by the National Center for Research Resources of the NIH into avirtual data grid, where data can be shared and accessed through a mediator-based system over Internet2. Initiatives like the BIRN will serve as test bedsfor creating the infrastructure necessary for scientists to adapt the scientificprocess to the new electronic forum enabled by network connectivity and highperformance computing. The challenges involved in adapting the scientificenterprise for this global forum are many. They range from sociologicalissues involved in data sharing to issues of curation and validation to technicalissues of interoperability and moving large data sets (Kotter, 2001; Toga,2002). However, we should not let these challenges blind us to the
Fig. 10: The Know Me Tool: Part of the process map for long term potentiation is shownin the main window. Each step in the process is identified by a number while the edges arelabeled with the process name. In the example shown , the “compute shortest pathway”function was used to determine the shortest pathway between step 14 and12.
Neuroscience Databases: A Practical Guide
advantages afforded by immediate access to data. New methods forvisualizing, indexing and exploring data will likely help to accelerate thediscovery process by identifying inconsistencies, controversies andknowledge gaps much more rapidly than is possible through the literature. Asmore data sources become linked through technologies such as databasefederation, we will be able to navigate through many levels of biologicalcomplexity and come closer to the goal of understanding biological systems intheir entirety.
ACKNOWLEDGEMENTS
This work supported by NIH grants from NCRR RR04050, RR RR08605 and the HumanBrain Project DC03192, an NSF grants supporting the National Partnership for AdvancedComputational Infrastructure NSF-ASC 97-5249 and MCB-9728338. The authors would liketo acknowledge the contributions of Ms. Xufei Qian, Shenglan Zhang, Mona Wong and Mr.Joshua Tran for their work on the tools presented here.
REFERENCES:
Chicurel, M. (2000) Databasing the brain. Nature, 406, 822-825.Dickson, J., Drury, H. and Van Essen, D. C. (2001) 'the surface management system' (sums)
database: A surface-based database to aid cortical surface reconstruction, visualization andanalysis. Philos Trans R Soc Lond B Biol Sci, 356, 1277-1292.
Fox, P. T. and Lancaster, J. L. (2002) Opinion: Mapping context and content: The brainmapmodel. Nat Rev Neurosci, 3, 319-321.
Gardner, D., Abato, M., Knuth, K. H., DeBellis, R. and Erde, S. M. (2001) Dynamicpublication model for neurophysiology databases. Philos Trans R Soc Lond B Biol Sci,356, 1229-1247.
Gupta, A., Ludaescher, B. and Martone, M. E. (2000) Knowledge-based integration ofneuroscience data sources. Proceedings of the 12th International Conference on Scientificand Statistical Database Management (SSDBM'00) IEEE Computer Society,
Harlow, M. L., Ress, D., Stoschek, A., Marshall, R. M. and McMahan, U. J. (2001) Thearchitecture of active zone material at the frog's neuromuscular junction. Nature, 409, 479-484.
Ingenerf, J., Reiner, J. and Seik, B. (2001) Standardized terminological services enablingsemantic interoperability between distributed and heterogeneous systems. Int J Med Inf,64, 223-240.
Ludaescher, B., Gupta, A. and Martone, M. E. (2001) Model-based mediation with domainmaps. Proceedings of the 17th International Conference on Data Engineering, IEEEComputer Society 2001, Heidelberg, Germany, April 2-6, 2001.
Mannella, C. A., Marko, M. and Buttle, K. (1997) Reconsidering mitochondrial structure:New views of an old organelle. Trends Biochem Sci, 22, 37-38.
Martone, M. E., Gupta, A., Wong, M., Qian, X., Sosinsky, G., Ludäscher, B. and Ellisman, M.H. (in press) A cell-centered database for electron tomographic data. J. Struct. Biol.,
McEwen, B. F. and Frank, J. (2001) Electron tomographic and other approaches for imagingmolecular machines. Curr Opin Neurobiol, 11, 594-600.
Miller, P. L., Nadkarni, P., Singer, M., Marenco, L., Hines, M. and Shepherd, G. (2001)Integration of multidisciplinary sensory data: A pilot model of the human brain projectapproach. J Am Med Inform Assoc, 8, 34-48.
Paxinos, G. and Watson, C. (1998) The rat brain in stereotaxic coordinates, Academic Press,San Diego.
Chapter 19
Perkins, G., Renken, C., Martone, M. E., Young, S. J., Ellisman, M. and Frey, T. (1997)Electron tomography of neuronal mitochondria: Three-dimensional structure andorganization of cristae and membrane contacts. J Struct Biol, 119, 260-272.
Persidis, A. (1999) Bioinformatics. Nat Biotechnol, 17, 828-830.Persidis, A. (2000) Data mining in biotechnology. Nat Biotechnol, 18, 237-238.Rachedi, A., Rebhan, M. and Xue, H. (2000) Gabaagent: A system for integrating data on
gaba receptors. Bioinformatics, 16, 301-312.Shepherd, G. M., Mirsky, J. S., Healy, M. D., Singer, M. S., Skoufos, E., Hines, M. S.,
Nadkarni, P. M. and Miller, P. L. (1998) The human brain project: Neuroinformatics toolsfor integrating, searching and modeling multidisciplinary neuroscience data. TrendsNeurosci, 21, 460-468.
Toga, A. (2002) Neuroimage databases: The good, the bad and the ugly. Nat Rev Neurosci, 3,302-308.
Van Essen, D. C., Drury, H. A., Dickson, J., Harwell, J., Hanlon, D. and Anderson, C. H.(2001) An integrated software suite for surface-based analyses of cerebral cortex. J AmMed Inform Assoc, 8, 443-459.
Wong, S. T. and Koslow, S. H. (2001) Human brain program research progress in biomedicalimaging/neuroscience, 2001. J Am Med Inform Assoc, 8, 510-511.