neuroprotective effects of sulforaphane on oxygen/glucose ... · 1.1 cerebral palsy ... schematic...
TRANSCRIPT

Neuroprotective Effects of Sulforaphane on Oxygen/Glucose Deprived Neurons and Astrocytes
By
Jenny Ji Young Yoon
A thesis submitted in partial fulfillment of the requirements for the degree of
Master of Science
Medical Sciences – Paediatrics
University of Alberta
©Jenny Ji Young Yoon, 2016
Abstract
Cerebral Palsy (CP) constitutes the primary outcome of premature nerve injury. Impairment of
oxygen and glucose supply during pregnancy to the fetus can induce neuron damage and death.
Mental retardation, seizures, learning disabilities, and other mental diseases can occur as a result
of this insufficient nutrient delivery to the fetus. Therapeutic interventions that are efficacious for
the injured newborn are limited mainly because the majority of insults (90%) resulting in CP
occur during pregnancy and current therapies only address those injuries that occur during labor
and delivery or after birth, therefore addressing only 10% of the injured newborns. This
investigation was aimed to determine neuroprotective effects of sulforaphane. Sulforaphane is an
isothiocyanate found in vegetables such as broccoli sprouts, Brussels sprouts, and cabbage that
have anti-inflammatory, anti-oxidant, anti-apoptotic effects.
Neurons and astrocyte cell death was decreased with sulforaphane treatment during oxygen-
glucose deprivation. Cell death was analyzed through trypan blue viability assay, lactate
dehydrogenase assay, 3-(4,5-dimethylthiazol-2-yl)-2,5-diphenyltetrazolium bromide assay, DNA
quantification, and FAM-DEVD-FMK caspase 3 and 7 inhibitor immunofluorescence
quantification.
This study demonstrates neuroprotective effects of sulforaphane for neurons and astrocytes and
its potential as a preventative treatment for pregnant mothers.
ii

Dedicated to family and friends
iii

Acknowledgements
I would like to thank my supervisor Dr. Sujata Persad who has been my mentor since I was a
summer student in her lab many years ago. Thank you for always going taking that extra step to
help your students. I would also like to thank my co-supervisor, Dr. Jerome Yager for his
guidance and support. Thank you Dr. Elena Posse de Chaves for your expertise and knowledge
that helped strengthened this study.
Thank you to the members of the past and present Persad Laboratory Research Team. Holly,
Jacqueline and Geetha, without your support my experience would not have been the same. To
Yager and Posse de Chaves Lab, I thank you for your guidance as well.
To my parents who have sacrificed so much so that I can pursue higher education and achieve
my dreams, I would not be here without everything you have done for me.
This study was supported by funds from the University of Alberta, Faculty of Medicine and
Dentistry, Department of Paediatrics, Maternal and Child Health graduate program.
iv

Table of Contents
1.0 Introduction ............................................................................................................................... 2
1.1 Cerebral Palsy (CP) ............................................................................................................... 2
1.1.1 Definition ........................................................................................................................ 2
1.1.2 Diagnosis ........................................................................................................................ 2
1.1.3 Classifications ................................................................................................................. 3
1.1.4 Clinical Outcome Measures ............................................................................................ 6
1.1.5 Aetiology ........................................................................................................................ 6
1.2 Pathology of Hypoxic-Ischemic Brain Damage.................................................................. 10
1.2.1 Cytoplasmic Acidification ............................................................................................ 10
1.2.2 Necrosis and Apoptosis ................................................................................................ 10
1.2.3 Microglial Activation ................................................................................................... 11
1.2.4 Reactive Oxygen Species (ROS) .................................................................................. 12
1.3 Therapeutic options for CP and their Limitations ............................................................... 14
1.3.1 Prenatal Therapies ........................................................................................................ 14
1.3.2 Postnatal Therapies ....................................................................................................... 15
1.4 Natural Health Products ...................................................................................................... 16
1.4.1 Cruciferous Vegetables ................................................................................................. 17
1.5 Sulforaphane (SFN)............................................................................................................. 18
1.5.1 Mechanism of Action ................................................................................................... 18
1.5.2 SFN’s effect on activity and integrity of neurological system ..................................... 23
1.6 Hypothesis ........................................................................................................................... 27
1.7 Objectives ............................................................................................................................ 27
2.0 Materials and Methods ............................................................................................................ 29
2.1 Isolation of Neurons ............................................................................................................ 29

2.2 Isolation of Astrocytes ........................................................................................................ 29
2.2.1 Method 1 ....................................................................................................................... 29
2.2.2 Method 2 ....................................................................................................................... 30
2.3 Hypoxic-Ischemic Insult ..................................................................................................... 30
2.4 Recovery.............................................................................................................................. 30
2.5 Drug Treatment ................................................................................................................... 31
2.5.1 SFN ............................................................................................................................... 31
2.5.2 Treatment of cells with SFN ......................................................................................... 31
2.5.3 Staurosporine induced cell death .................................................................................. 31
2.6 Preparation of Cell Lysates ................................................................................................. 31
2.7 Immunoblotting ................................................................................................................... 31
2.8 Trypan Blue Viability Assay ............................................................................................... 32
2.9 LDH Cytotoxicity Assay ..................................................................................................... 32
2.9.1. LDH Cytotoxicity Calculation Method 1 .................................................................... 33
2.9.2. LDH Calculation Method 2 ......................................................................................... 34
2.10 MTT Cell Viability Assay ................................................................................................. 34
2.11 Fam-DEVD-fmk................................................................................................................ 34
2.12 DNA quantification ........................................................................................................... 35
2.13 Statistical Analysis ............................................................................................................ 36
3.0 Results ..................................................................................................................................... 38
3.1 Neuronal and Astrocyte Cultures ........................................................................................ 38
3.2 Determination of optimal times for Oxygen Glucose Deprivation (OGD) and treatment
with Sulforaphane (SFN). ......................................................................................................... 42
3.2.1 LD50: OGD .................................................................................................................. 42
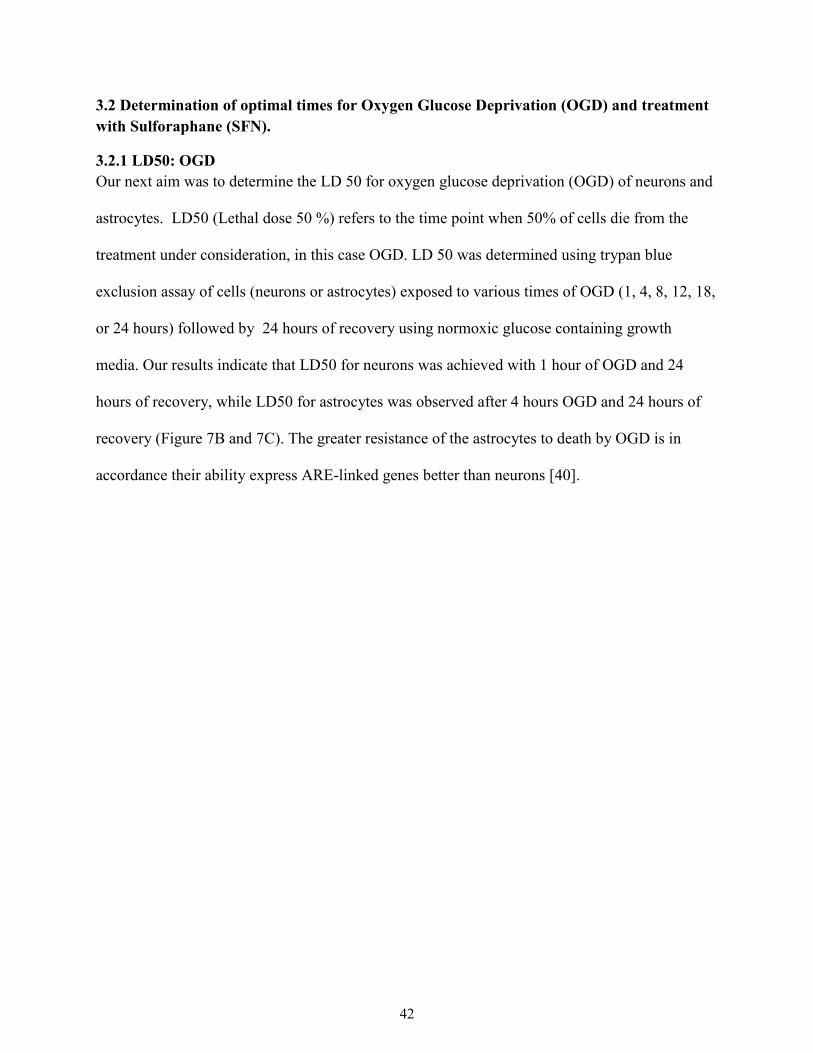
3.2.2 SFN treatment during OGD only vs. OGD and recovery ............................................. 44

3.3 Assessment of SFN’s effects on Normoxic Neurons and Astrocytes ................................. 46
3.3.1 Effects of SFN on Neurons during Normoxic Condition ............................................. 46
3.3.2 Effects of SFN on Astrocytes during Normoxic Condition ......................................... 49
3.3.3 Effects of SFN on Apoptosis of Normoxic Neurons and Astrocytes ........................... 51
3.4 Assessment of SFN’s effects on Hypoxic-Ischemic Neurons and Astrocytes .................... 53
3.4.1 Effects of SFN on Neurons in OGD condition ............................................................. 53
3.4.2 Effects of SFN on Astrocytes in OGD condition ......................................................... 55
3.4.3 Effects of SFN on Apoptosis of Hypoxic-Ischemic Neurons and Astrocytes .............. 57
4.0 Discussion ............................................................................................................................... 60
5.0 Future Directions .................................................................................................................... 68
5.1 Improvements for current study .......................................................................................... 68
5.1.1 Additional analysis of purity of neuronal and astrocyte cell cultures .......................... 68
5.1.2 Alternative approaches to degassing glucose free DMEM .......................................... 68
5.1.3 Alternative approaches to harvesting cells ................................................................... 69
5.1.4 Optimization of FAM FLICA caspase 3 & 7 detection................................................ 69
5.2 Prospective Studies ............................................................................................................. 69
5.2.1 Protective effects of SFN on other glial cells ............................................................... 69
5.2.2 Examining effects of SFN on co-cultures of neurons and glial cells ........................... 70
5.2.3 The effects of SFN on Autophagy ................................................................................ 71
5.2.4 Clinical implications and conclusions .......................................................................... 72
6.0 Bibliography ........................................................................................................................... 73
Appendix ....................................................................................................................................... 80
A1: LDH Cytotoxicity Calculation ........................................................................................... 81
A2: Control group requires separate incubator from the hypoxia chamber. ............................. 83

Tables and Figures
Table1
Figure 1
Figure 2
Figure 3
Figure 4
Figure 5
Figure 6
Figure 7
Figure 8
Figure 9
Figure 10
Figure 11
Figure 12
Figure 13
Figure 14
LDH cytotoxicity calculation formulas
Schematic representation of hydrogen peroxide formation
Schematic representation of activation of the Nrf2 pathway
Schematic representation of LDH release and subsequent
reactions
Schematic representation of experimental timeline
Western blot analysis of cortical neuronal and astrocyte
cultures
Isolation of astrocytes with correct morphology requires fetal
bovine serum (FBS) in the growth media
Effects of OGD on neuronal and astrocyte cell death
SFN treatment during OGD only vs OGD and recovery
Effects of SFN treatment on neurons in normoxic conditions
Effects of SFN treatment on astrocytes in normoxic
conditions
Quantification of caspase 3 and 7 fluorescence of normoxic
neurons and astrocytes
Effects of SFN treatment on neurons exposed to OGD
Effects of SFN treatment on astrocytes exposed to OGD
Quantification of caspase 3 and 7 fluorescence of OGD
neurons and astrocytes

Figure 15
Schematic representation of a biphasic response

List of Abbreviations
ADHD
AEDs
AMPK
ARE
ATP
BBB
BDNF
BrSps
CAM
CMV
CP
EMG
EPIIs
ERK
FBS
GFAP
GSH
Hb
HI
HIE
ITCs
Hp
Attention deficit hyperactivity disorder
Antiepileptic drugs
AMP-activated protein kinase
Antioxidant-response element
Adenosine triphosphate
Blood brain barrier
Brain-derived neurotrophic factor
Broccoli sprouts
Complementary and alternative medicine
Cytomegalovirus
Cerebral palsy
Electromyography
Phase II detoxifying enzymes
Extracellular signal-regulated kinase
Fetal bovine serum
Glial fibrillary acidic protein
Glutathione
Haemoglobin
Hypoxia ischemia
Hypoxia ischemic encephalopathy
Isothiocyanates
Haptoglobin
HO-1
H2O2
Keap 1
LBW
LDH
LP
MACS
MCAO
MEK
MgSO4
MMPs
MRI
mTOR
MTT
NHE
NMDA
NHPs
Nrf2
NSE
OGD
PARP
PDL
PIS
Heme oxygenase -1
Hydrogen peroxide
Kelch-like ECH –associated protein
Low birth weight
Lactate dehydrogenase
Lipid peroxidation
Manual ability classification system
Middle cerebral artery occlusion
Mitogen protein kinase
Magnesium sulphate
Matrix metalloproteinases
Magnetic resonance imaging
Mammalian target of rapamycin
(3-(4,5-dimethylthiazol-2-yl)-2,5-diphenyltetrazolium
bromide
Na+/H+ exchanger
N-methyl-D-aspartate
Natural Health Products
Nuclear factor (erythroid-derived 2)-like
Neuronal Specific Enolase
Oxygen glucose deprivation
Poly ADP ribose polymerase
Poly-D-lysine
Prenatal Ischemic Stroke

ROS
SFN
TRLs
TNF – α
TSC1/2
VEGF
4-HNE
Reactive oxygen species
Sulforaphane
Toll-like receptors
Tumour necrosis factor – α
Tuberous sclerosis complex 1/2
Vascular endothelial growth factor
4-hydroxy-2-nonenal

1
Chapter 1
Introduction
2
1.0 Introduction
1.1 Cerebral Palsy (CP)
1.1.1 Definition
Cerebral palsy (CP) is a life-long neurodevelopmental disorder caused by non-progressive
disturbances that occur in the developing fetal or infant brain. The end results are disorders in the
development of movement and posture, which includes disturbances of sensation, cognition,
communication, perception, behaviour, and seizures [1]. Lifetime costs associated with a person
with CP is approximately $1,300,000 for males and $1,200,000 for females, and the economic
cost associated with CP is $11.5 billion [2, 3].
Children born with very low birth weight (LBW) after neonatal complications are more likely to
develop neurosensory disorders including CP [4, 5]. LBW, in accordance with the World Health
Organization, is defined as an infant born weighing <2500g [6]. Children born with normal birth
weights (2500 – 5000 g) can also develop CP [7]. However, normal birth weight children with
CP are more likely to have severe motor impairments [8].
Frequency of CP in newborns is relatively stable despite significant advances in obstetric and
neonatal care [9]. Overall prevalence of CP is reported to be about 2 per 1000 live births for full
term infants while it ranges from 55 to 150 per 1000 live births for preterm infants [10], where
preterm infants are defined as those born at <37 weeks from the first day of the last menstrual
period [6].
1.1.2 Diagnosis
There are two early detection tools of CP: General Movements Assessment (GMS) and Test of
Infant Motor Performance (TIMP). Using the classification systems can provide a more in-depth
and holistic understanding and how CP is affecting the patient.
3
1.1.2.1 General Movements Assessment (GMS)
The GSM is a qualitative analysis of videotapes of spontaneous or self-initiated movements of
preterm and term infants used for CP diagnosis. Healthy infants at 6 to 9 weeks after birth are
able to move their neck, trunk, and limbs in small circular ways to execute goal-oriented tasks. In
contrast, children who have suffered brain injuries have rigid limb and trunk movements [11].
1.1.2.2 Test of Infant Motor Performance (TIMP)
TIMP has high interrater reliability and validity and can identify motor delays early as 7 days
after birth. It is successful in diagnosing 80% of children with CP by 2 months. Diagnosis is
made through evaluation of children’s functional motor control and organization of posture and
movements [12]. After diagnosis, the severity of CP can be classified through movement and
clinical classifications.
1.1.3 Classifications
1.1.3.1 Movement Classification
Positive and negative signs clinically characterize movement disorders. Positive signs are
abnormalities due to absence of inhibition from cortical circuits which includes spasticity,
dyskinesia, hyper-reflexia, retained developmental reactions, and secondary musculoskeletal
malformation. Negative signs reflect poor coordination of movement, balance, absent or loss of
proper sensorimotor control mechanisms [13]. The positive and negative signs manifest in
children with CP as disturbed motor control during walking.
1.1.3.2 Walking Classification
In those with CP, the cortical neurons that project from the motor cortex to limbs were altered or
did not develop properly, which resulted in impairments of voluntary movements [14].
Difficulties in walking/walking dysfunction arise from insufficient activation of agonist muscles

4
with hyper activation of antagonist muscles. Quantification of electromyography (EMG) activity
can be used to evaluate relative contributions of paresis, spasticity, excessive co-activation, or
hypoextensibility of walking. These analyses are used to classify walking patterns as to
hemiplegic or diplegic.
Although walking classifications are useful in individualizing therapeutic approaches, they do
not provide insight into the underlying dysfunction, which limits its use as a clinical
classification instrument. However, gait analysis can be used to evaluate physiotherapy or
surgical intervention effectiveness [13].
1.1.3.3 Clinical Classifications
Gross Motor Function Classification Systems (GMFCS) and Manual Ability Classification
System (MACS) are used to classify and categorize motor functions in children with CP. These
classification systems help to ensure that the care provided is appropriate.
1.1.3.3.1 Gross Motor Function Classification System (GMFCS)
The Gross Motor Function Classification System (GMFCS) is a standardized, clinically
applicable system that is based on sitting, walking, and the need for assistive devices. GMFCS is
used internationally to best represent the child’s abilities and limitations using a five-level
system. Children in Level I can walk without restrictions with limited advanced motor skills,
while children in Level V have very limited movement even with the use of assistive technology
[13].
Relationship between Brain Magnetic Resonance Imaging (MRI) and GMFCS
MRI is the imaging system of choice for defining relationships between brain structure and
motor outcomes in children with CP. MRI analysis revealed that brain malformations occur
during the first and second trimesters resulted in spastic hemiplegia, followed by spastic

5
quadriplegia, spastic diplegia, then non-spastic CP subtypes. Brain malformations make up 9%
of all lesions and subjects were classified as GMFCS III-V.
The most common brain lesions are those in the white matter during early third trimester or in
preterm infants, which make up 46% of all lesions. White matter lesions resulted in spastic
diplegia, spastic hemiplegia, spastic quadriplegia, and then non-spastic subtypes. Two thirds of
these children had mild functional disabilities in the level I and II of the GMFCS.
Grey matter injuries accounting for 25% of all lesions and the majority of patients with grey
matter lesions were classified as GMFCS III-V. Prenatal strokes and other postnatally acquired
lesions make up 1% of all classified lesions. 12% of patients with CP who had normal MRI
findings were most likely to have mild motor impairment with over two-thirds in the GMFCS I-
II group [15].
In addition, MRI has also helped in revealing the association between location and extent of
brain injury and functional motor deficits. Lesions in both grey and white matter has been shown
to lead to more severe motor disabilities compared to those with lesions in either grey or white
matter. Also, more severe injuries with greater reduction in white matter lead to significantly
lower limb function [15].
1.1.3.3.2 Manual Ability Classification System (MACS)
MACS is a five level system that classifies the ability of children with CP to handle every-day
objects. Those in Levels I and II are more independent while Levels III require assistance.
Children in Levels IV and V require additional support and assistance. MACS helps in
developing therapies for children to maximize rehabilitation outcomes. Although MACS,
GMFCS, and typical diagnostic classifications are independent of one another, MACS and
GMFCS levels are highly correlated with one another [13, 16]. Thus, using both classification

6
systems can provide a more holistic picture of children with CP for clinical, therapeutic, and
research purposes.
1.1.4 Clinical Outcome Measures
After diagnosis and initial classification of the severity of CP, Gross Motor Function Measure
(GMFM) can be used for long-term clinical evaluation. GMFM is a test with high intra- and
interrater reliability that quantifies the changes in gross motor abilities over time and thus can be
used to evaluate effectiveness of therapy or surgery. It is composed of 88 items that is measured
by observation [17].
1.1.5 Aetiology
CP results from synergy of predisposing factors, prenatal and postnatal events to alter the
developing and maturing brain. Prenatal risks factors are associated with 70-80% of CP, while
intra-partum complications make up 10-20% [18]. Fetal brain injury from prenatal and postnatal
complication account for roughly 40% of all cases of intellectual disability or global
developmental delay [19].
1.1.5.1 Prenatal Hypoxic-Ischemic Insult
Prenatal brain damage from hypoxia-ischemia (HI) and/or inflammation is one of the leading
causes of lifelong disabilities including CP, seizure disorders, sensory impairment, and cognitive
limitations [20]. A late prenatal or prenatal hypoxic-hemodynamic insult is one of the major
contributors of CP [21]. Children who suffered prenatal brain injury show increased incidence of
developmental delays, motor disabilities, anxiety disorders, and autism spectrum disorders [22].
The ischemia results from decreased cardiac output as a result of decreased myocardial
contractility from severe hypoxemia [18]. Hypoxemia can be caused by prenatal arterial

7
ischemic stroke, which is defined as to occur between 28 weeks gestation and 28 days of
postnatal life [23]. Prenatal ischemic stroke (PIS) arises as a result of fetal or maternal arterial or
venous thrombosis or embolization in the fetus. PIS is 17 times more likely to occur in the
prenatal period due to a combination of maternal, neonatal, and placental conditions [24]. Some
maternal risk factors include smoking, preeclampsia, and thrombophilia, while fetal risk factors
include congenital heart disease, hypoglycaemia, and infection [25]. Placental risk factors, which
include placental lesions, abruption, and chorioamnionitis that reduce perfusion, have been
associated with prenatal stroke, hypoxia ischemia encephalopathy (HIE) and CP [26]. A
combination of these risks factors that reduce blood flow and result in ischemic insult, can result
in motor, cognitive, or behavioural difficulties can arise including CP [24].
The etiology of more than half of all children with CP is related to some form of cerebrovascular
focal or global insult. In preterm infants, hypoxic-ischemic injury adversely affects white-matter
tract development and predisposes the brain to periventricular white-matter injury and CP.
Subplate neurons, transient during human fetal brain development, are vulnerable to HI in
preterm babies with long-term consequences. In full term newborns, the striatum, thalamus, and
cortex are vulnerable and often affected [26]. More mature fetuses are less vulnerable to white
matter injury or are differentially vulnerable depending on the type of insult [18].
1.1.5.2 Birth Asphyxia
Birth asphyxia is the interruption of placental blood flow during labour [27]. Up to 60%
reduction of blood flow can occur leading to intra-partum hypoxia [28]. For “near total
asphyxia”, a brief but intense insult injures cerebral cortex, basal ganglia, and the brainstem
leading to rigidity of movement [18]. Lesions of the extrapyramidal tracks in the basal ganglia
and the subsequent disruption of the neurological circuits involved in motor activation are
8
responsible for the rigidity of movements [29]. On the other hand for less severe but sustained
asphyxia, referred to as “partial or prolonged asphyxia”, injury is more multifocal and diffuse
within the cerebral cortex. Partial asphyxias cause less prominent neuronal damage, and are more
restricted to subcortical white matter resulting in spastic movements and upper motor neuron
abnormalities involving the four extremities [18]. Cortical upper neurons affected in partial
asphyxia disinhibit thalamocortical projections leading to hyperkinetic spastic movements [29].
1.1.5.3 Infection &Inflammation during Pregnancy and Birth
Both bacterial and viral infections can lead to CP. Bacterial chorioamnionitis associated with E.
Coli or group B streptococci infection is most frequently associated with CP. Almost 30% of CP
is attributed to chorioamnionitis in preterm infants [30]. Cytomegalovirus (CMV) is the most
frequent virus implicated in brain damage during pregnancy. The viral exposure may be
associated with hypertensive disorders, preterm delivery, and CP [31]. The infections from
bacterial chorioamnionitis and CMV cause inflammation, and inflammation of the foetal
membranes has been associated with CP [9].
Inflammation is caused by oxidative stress, brought on by PIS and asphyxia, when there is an
imbalance between oxidant production and scavenging [32]. During inflammation, there is an
up-regulation of inflammatory cytokines. To this end, IL-1β and TNF-α have been shown to be
upregulated in the brains of human newborns afflicted with CP. The molecular cascade
associated with IL-β and TNF-α has been predicted to lead to prenatal brain damages [30].
Mechanistically, cytokines released from endotoxin-activated macrophages or by glial cells
activate monocytes infiltrating the brain. The cytokine-activated cells release reactive oxygen
species (ROS) and toxic granules enhancing cellular and tissue damage. Cytokines can also
activate cytotoxic T cells, natural killer cells, and lymphokine-activated cells [20]. The cytokines
released within the brain leads to apoptosis of oligodendrocytes, microglial activation,
9
haemorrhage, and myelin damage [30]. The neurotoxic effects of cytokines are due to
potentiation of noxious effects of excitotoxic cascades or oxidative stress by converting a sub
threshold insult to a seriously damaging event [31].
Preterm infants are more highly susceptible to ischemic related inflammatory pathway activation
with higher prevalence rate of developmental disabilities such as CP [33].
1.1.5.4 Genetic factors of CP
There is an increased risk of CP in some families. Although uncommon, familial CP accounts for
almost 2% of all CP cases [34]. Thrombophilia has underlying genetic basis that involves
polymorphic variations of Factor V Leiden, Prothrombin G20210A, and
MethylenetetrahydrofolateReductase C677T genes [35]. Those with predisposing genetic factors
to thrombophilia are more likely to suffer from thrombosis, and in turn, stroke. About half the
infants who suffered a stroke were found to be thrombophilic. Underlying genetics factors
involved in thrombophilia in combination with viral or bacterial infection causes vascular
thrombosis leading to prenatal strokes and secondary CP. In addition, preterm birth, placental
abruption, preeclampsia have also been shown to have genetic association [36]. Further,
polymorphisms of genes encoding inflammatory proteins and coagulation factors are also
associated with CP in some children [31]. During pregnancy, coagulation factors such as von
Willebrand factor, and plasma fibrinogen concentrations are found at a higher concentration in
the mother’s blood to protect against haemorrhage during delivery [37]. Genetic polymorphisms
of prothrombotic factors such as methylene tetrahydrofolatereductase (MTHFR), Factor V
Leiden, and prothrombin increase risk of neonatal stroke. Further, mutations in COL4A1, a gene
that encodes the α-1 subunit of collagen type IV has been shown to be increase incidences of
intracerebral haemorrhages [26].

10
1.2 Pathology of Hypoxic-Ischemic Brain Damage
1.2.1 Cytoplasmic Acidification
Insufficient oxygen supply serves as a switch from aerobic to anaerobic metabolism which
increases lactate formation. This results in acidification of cellular cytoplasm, which hyper
activates the Na+/H+ exchangers (NHE). Hyper activation of NHE leads to alkaline shift in pH
which results in a Na+ overload with increased Ca2+ entry and subsequent cell death. Increased
intracellular Ca2+ leads to generation of oxygen and nitrogen free radicals, and other toxic free
radicals, which promotes apoptosis, and necrosis [38].
1.2.2 Necrosis and Apoptosis
Necrosis is considered as the predominant early neuronal death mechanism immediately
following ischemic insult, while apoptosis and autophagy has been related to delayed cell death
[26].
The first phase of brain cell death, necrosis, involves energy depletion, excitotoxicity, and free
radical damage. Insufficient oxygen and energy depletes high-energy phosphate compounds such
as phosphocreatinine and adenosine triphosphate (ATP). Without ATP, ion gradients cannot be
maintained resulting in influx of Na+ and Ca2+. Water follows the influx of these ions resulting in
cytotoxic oedema and the subsequent cell rupture lysis [39]. Also, the hypoxic-ischemic brain
releases large amounts of the excitatory amino acid, glutamate. Activation of glutamate receptors
found to peak in the early neonatal period in both neuronal and glial cells, leads to excessive
depolarization, NaCl and water influx, swelling, and cell death. N-methyl-D-aspartate (NMDA)
receptors, a type of glutamate receptor, are predominant mediators for calcium-mediated
exocitotoxicity in neonatal hypoxic-ischemic brain injury. Influx of Ca2+through NMDA
receptors activates phospholipase A2 and free radicals from arachidonic acid damaging the
cellular membrane [21].
11
The second phase of cell death, which occurs hours to days post injury is apoptosis. Ischemia
triggers apoptosis by stimulating caspase or BAX activation. BAX is a member of the Bcl-2 gene
family with proapoptotic functions that regulates and release of cytochrome C from the
mitochondria to contribute to apoptosis [39]. Up regulation of the FAS death receptor and over
activation poly ADP ribose polymerase (PARP) also play a role in triggering apoptosis. Free
radicals that are formed during the first phase of cell death causes mitochondrial dysfunction
activating the intrinsic apoptotic pathway by activating proapoptotic genes [31].Neuronal
apoptosis is more commonly observed in the immature brain as apoptotic pathways are more
readily activated in the immature brain [26].
During reperfusion, reactions from primary ischemic insult are exacerbated including excess
oxygen free radicals, intracellular Ca2+ accumulation, microvascular endothelial dysfunction,
nitric oxide formation, and activation of apoptotic pathways. Reperfusion and oxygenation can
also promote further mitochondrial injury and neuronal apoptotic death [27]. Infarct region of 8
hours of reperfusion compared to 2 hours after 60 minutes of middle cerebral artery occlusion
(MCAO) was found to be significantly greater in mice [40].
1.2.3 Microglial Activation
Microglia make up 10% of overall number of cells in the brain during development. Microglia
can be activated by various factors including cytokines, by-products of bacteria, and disruption
of the tissue after trauma, and release of intracellular contents after ischemia [41]. In turn, the
activated microglia produces inflammatory mediators, free radicals, and other toxic molecules to
promote the immune response, which is injurious in the ischemic brain [26]. For example, matrix
metalloproteinases (MMPs) and plasminogen activators that digest damaged tissue, cytokines
and chemokines that increase proliferation of microglia, and toll-like receptors (TLRs) that
12
increase cytokine and chemokine productions are activated and up-regulated after upon
microglial activation [41].
Inhibition of microglia activation was found to have beneficial effects. The anti-inflammatory
drug, minocycline, which inhibits microglial activation, was shown to reduce levels of
inflammatory mediators (IL-1β, TNF-α), reduced neuro-inflammation and brain tissue loss after
HI in neonatal rats [42].
However, a second role of microglia in phagocytosis is beneficial in repairing the extracellular
matrix after stroke [43]. Microglial phagocytosis of dead cells after HI/stroke event helps to limit
and prevent further inflammation and hence limits extension to unaffected regions [41]. Thus,
microglia may have a dual role after ischemic injuries.
1.2.4 Reactive Oxygen Species (ROS)
Cerebral ischemia leads to accumulation of ROS. ROS include compounds such as hydrogen
peroxide (H2O2), peroxynitrite (ONOO-), peroxynitrous acid (ONOOH), nitrosoperoxocarbonate
(ONOOCO2-), oxygen free radical, hydroxyl radical, nitrogen dioxide radical, and carbonate
radical. H2O2 is formed through NADPH oxidase that catalyzes the reaction of oxygen and
NADPH to superoxide (O2-), hydrogen ion, and NADPH+. As shown in Figure 1, once oxygen is
reduced to superoxide, it can react with itself to form H2O2 [44]. ROS production also causes
peroxidation of lipids, protein oxidation, DNA cleavage, mitochondrial dysfunction and altered
signal transduction. Collectively, these events are referred to as ROS-mediated oxidative stress,
which can culminate into cell death of all brain cells [45].
ROS is a crucial facet of microglial activation as well. Upon microglial activation, chemotactic
molecules, metalloproteases, and pro-inflammatory cytokines are produced. Furthermore,
activated microglia can itself also release ROS through activation of NADPH oxidase, which

13
results in further expression of pro-inflammatory cytokines. Persistent ROS and cytokine release
activates apoptotic programs leading to neuronal death [46].
Figure 1 – Schematic representation of hydrogen peroxide formation
ROS mediated lipid peroxidation (LP)
LP involves oxidation of polyunsaturated fatty acids that subsequently undergoes phospholipase-
mediated hydrolysis. LP is normally initiated by a radical species interacting with
polyunsaturated fatty acids that removes an allylic carbon to form an alkyl radical. The alkyl
radical then reacts with oxygen to form a lipid peroxyl radical, which then reacts with another
allylic carbon to form a second generation of alkyl radical and a lipid hydroperoxide. Once lipid
hydroperoxides are formed, either ferrous iron (Fe++) or ferric iron (Fe+++) reacts to form
alkoxyls or a peroxyl radicals, respectively [47]. The result of LP is severe disruption/damage of
cellular membranes due to the loss of membrane phospholipid architecture, loss of proper
function of phospholipid-dependent enzymes, ion channels, and structural proteins.
The presence of a peroxidized fatty acid breakdown product, 4-hydroxy-2-nonenal (4-HNE) is
indicative of oxidative stress induced LP [48]. 4-HNE is highly reactive with amino acids and
mitochondria to impair cellular proteins and mitochondrial respiration. 4-HNE is able to react
O2 NADP(H)
O2- H2O2
O2-
-
H2

14
with basic and sulfhydryl groups in amino acids and directly inhibit mitochondrial respiration by
binding to mitochondrial proteins. Specifically in the mitochondria, 4-HNE targets pyruvate
dehydrogenase and complex-I mitochondrial redox carrier associated proteins [49]. Free radical-
mediated oxidative damages in CNS injuries result in protein oxidation and mitochondria
dysfunctions [50].
1.3 Therapeutic options for CP and their Limitations
1.3.1 Prenatal Therapies
Some clinical trials have suggested that antenatal maternal administration of magnesium sulphate
(MgSO4) protected babies born preterm against CP. MgSO4, taken by pregnant women at high
risk of early preterm delivery was shown to reduce CP rates by 32% compared to the placebo-
trial group [51]. However, long-term motor, cognitive, and behavioural outcomes in children
were insignificant. MgSO4’s protective mechanisms of reducing neural dysfunction are still
unclear [52]. A possible mechanism of neuroprotection is initiated by brain-derived neurotrophic
factor (BDNF). BDNF inhibits of apoptosis and inflammation and increases neurogenesis. Cord
blood BDNF level drawn from preterm infants was higher with MgSO4 administration before
birth compared to preterm infants born without antenatal MgSO4. BDNF acts as the first line of
defense against CP in premature infants by preventing the release of cytokines like IL-1β, IL-6,
and TNF-α by binding to NDMA receptors to prevent glutamate binding [53].
In contrast, using other types of NMDA receptor antagonists have shown to have detrimental
effects. For example, when NMDA receptor antagonists, MK-801, phencyclidine, ketamine, or
carboxypiperzain-4-yl-propyl-phosphoric acid (CPP) were injected to neonatal rat pups,
neurodegeneration was potentiated negatively affecting neurodevelopment [54]. Ketamine

15
administration on postnatal day 10 mice induced cortical cell degeneration lead to deficits in
learning, retention of memory, and motor capabilities [55].
Similarly, antiepileptic drugs (AEDs) that inhibit glutamatergic neurotransmission by blocking
NMDA receptors have been used for CP [56]. Most commonly used AEDs have been shown to
have undesirable effects. AEDs cause neurons to undergo apoptotic death in the developing rat
brain affecting intellectual skills [57]. Depending on the stage of brain development, AEDs can
have consequences on the developmental mechanisms of neuronal circuitry and, eventually the
expression of neurobehavioral disorders, such as attention deficit hyperactivity disorder (ADHD)
[55].
In addition to inconclusive and negative findings of prenatal therapies, the public resistance to
any risk from prescribed pharmaceuticals during pregnancy and the rigorous licensing procedure
add to the difficulty of finding effective prenatal therapeutics for CP[58].
1.3.2 Postnatal Therapies
Therapies available for CP in the posnatal period are very limited in their efficacy. The main
reason for this is that currently used therapeutics at this stage address putative recovery after
brain injury has already occurred.
The introduction of assisted ventilation of preterm infants born with CP was shown to increase
their survival in the early 1980s. Postnatal steroids and lung surfactant therapies have also been
introduced but their long-term outcomes on development have not been studied [9]. Although
postnatal administration of corticosteroids was shown to be partially protective against early
death, treatment may be associated with long-term risks with abnormal neurological exam and
CP [9]. Hydrocortisone is a corticosteroid that is administered to preterm infants for its anti-

16
inflammatory effects. Infants who were administered with hydrocortisone had significantly lower
mean full-scale intelligence quotient (IQ) compared to the control group not treated with
hydrocortisone at 5 years of age[59]. Corticosteroids are believed to reduce myelin basic protein
expression, which results in neurological deficits through the processes of hypomyelination [60].
Hypothermia is currently the only neuroprotective treatment for injury resulting from HIE.
Hypothermia has been demonstrated to reduce mortality without increasing major disability in
survivors, and its effectiveness has been shown from mice to sheep. Cooling of the brain is
thought to potentially induce anti-inflammatory effects [26]. However, there seems to be no
consensus yet concerning the extent and degree of cooling required for neuroprotection.
Hypothermia has been shown to significantly improve short-term outcomes including reducing
rate of severe neuromotor disability but long-term outcomes has not been reported [9]. Despite
reduction in death and disability with therapeutic hypothermia, only 40% of infants survive with
normal neurodevelopmental functions [38].
1.4 Natural Health Products
Natural health products (NHPs) are defined as vitamins and mineral supplements, herbal
therapies, traditional medicines, probiotics, dietary supplements, or drugs [61]. They are
considered to be natural because they contain ingredients that occur naturally from plants,
mammals, and microorganisms. Use of NHPs for the prevention of injury for the fetal and
newborn brain offers an innovative way to prevent prenatal brain injury with great promise for
success. NHPs are considered to be safe for consumption during pregnancy by nurses,
obstetricians, and midwives [62]. NHPs can be given prophylactically to mothers during
pregnancy to prevent injury. Complementary and alternative medicine (CAM) is defined as the
use of products and practices outside the conventional allopathic drugs and practices, which

17
includes NHPs [63]. CAM is already used by 57% of pregnant women for various reasons [64].
CAM is considered to be safe, pregnant women want to be in control of their own health, and
they may be worried about side effects of pharmaceuticals [65]. Uses of CAMs are also
considered safe and advocated by the majority of obstetricians [62]. In addition, because CAM
are not subjected to the same rigorous and strict regulations of conventional pharmaceuticals,
they are more accessible and available. In Canada, there are over 70,000 NHPs that have been
licensed by Health Canada [61].
1.4.1 Cruciferous Vegetables
Cruciferous vegetables such as cauliflower, broccoli, cabbage, and Brussels sprouts have been
shown to contain high amounts of antioxidants, vitamins, and fibre. Broccoli contains high
amounts of selenium and glucosinolates such as glucoraphanin and isothiocyanate sulforaphane
(SFN). Glucosinolates are hydrolyzed into isothiocyanates (ITCs) by myrosinase [66]. SFN is the
isothiocyanate metabolite of the glucosinolate [67]. SFN can induce the antioxidant Nrf2/ARE
pathway [32], and it is an inducer of enzymes important in protecting cells against oxidative
stress such as heme oxygenase-1 (HO-1), glutathione (GSH) reductase, and GSH peroxidase
[68]. Thus, SFN has potential use in the setting of a compromised fetal environment.
Benefits of ingesting broccoli have been demonstrated in rats. When rats were fed with broccoli
for 30 days, the broccoli fed group appeared to rescue cardiomyocytes in the ischemic reperfused
heart. An involvement of the PIK3-Akt survival pathway was implicated in this protective
mechanism. Cardio protection was evident by improvement of ventricular function, reduction of
myocardial infarction and apoptosis compared to the control. Broccoli fed animal heart tissue
showed increased phosphorylation of Akt, which in turn likely blocked cell death [32]. Broccoli
ingestion was also shown to decrease inflammation in kidney and cardiovascular tissues of
hypertensive stroke-prone rats. After 14 weeks of broccoli ingestion, the rats had greater

18
glutathione levels, reduced number of infiltrating macrophages, and lower blood pressure which
indicates improved renal function and hemodynamics [69].
1.5 Sulforaphane (SFN)
NHPs such as broccoli sprouts (BrSps) have been widely studied in the field cancer,
cardiovascular disease, and hypertension. These diseases are also associated with enhanced
inflammation and oxidative stress. BrSps have been identified as the richest source of SFN, an
isothiocyanate produced by the action of myrosinase on the glucosinolate, glucoraphanin,
compared to other crucifers. Sulforaphane is known to act as a cytoprotective agent in multiple
organ systems in models of oxidative stress and inflammation, including cancer, cardiovascular
disease and stroke.
1.5.1 Mechanism of Action
SFN is a powerful anti-inflammatory and anti-oxidant. Mechanistically, SFN enhances
endogenous anti-oxidant capabilities by activating nuclear factor (erythroid-derived 2)-like
(Nrf2). SFN’s interaction with the Nrf2 pathway in turn induces phase II detoxifying enzymes
(EPII) and anti-oxidant enzymes that are important in protecting cells against oxidative stress.
Nrf2 pathway
The brain has an endogenous defense mechanism against effects of ROS, and Nrf2 plays an
important role in this defense [40]. Under resting conditions, Nrf2 is sequestered in the
cytoplasm, repressed by Kelch-like ECH-associated protein (Keap1). Keap1 sends Nrf2 for
proteasomal degradation via ubiquitination.
However, oxidative stress and Nrf2 inducers can cause alterations in Keap1 structure, which
leads to dissociation of Nrf2-Keap1 complex and altered E3 ubiquitin ligase function to reduce
Nrf2 degradation. Some examples of Nrf2 inducers include curcumin, plumbagin, and tert-

19
butylhydroquinone. Alternatively, phosphorylation of serine/threonine residues in Nrf2 also
allows it to dissociate from Keap1 [40]. Nrf2 is released from Keap1 by a hinge-latch mechanism
that allows for nuclear translocation into the nucleus where it heterodimerizes with small
musculoaponeurotic fibrosarcoma (Maf) proteins and binds to induce transcription and
consequent production of defense proteins [50].
In the nucleus, Nrf2 induces phase II antioxidant defense enzymes like heme oxygenase-1 and
glutathione (Figure 2). Protective genes regulated by Nrf2, protects astrocytes and neurons by
regulating expression of inflammatory markers and antioxidant enzymes [40]. These genes
contain a common cis-acting promoter element called antioxidant-response element (ARE) that
assists the binding to Nrf2[50, 70].

20
Figure 2 – Schematic representation of activation of the Nrf2 pathway
Keap1
Nrf2
Nrf2
Nrf2
Nrf2 Small
Maf
P
P
P
ARE
Anti-oxidant
proteins
Keap1
Oxidative Stress & NRf2 inducers

21
SFN & Nrf2 pathway
SFN crosses the blood brain barrier (BBB) and is a well-known activator of Nrf2 [40]. SFN
interacts with thiol groups of Keap1 in a concentration-dependent manner to change
conformation, resulting in dissociation of Nrf2-Keap1 complex, and Nrf2 transition into the
nucleus [48]. The conformational changes results from the reaction of the highly electrophilic
central carbon atom of SFN with the sulfhydryl groups of cysteine residues called the
diothiocarbamate group in Keap1. Formation of dithiocarbamate results in the disruption of
Keap-1 Nrf2 interactions and induction of ARE genes [71]. Nrf2 is essential for EPII expression
by SFN [48].
SFN’s mechanism of action through the Nrf2 pathway
Nrf2 is up regulated with oxidative stress resulting in increased production of target antioxidants
and enzymes that protect against apoptosis in both neurons and astrocytes[72].
Activation of Nrf2-ARE decreases lipid peroxidation (LP) and this is significant as neuronal
mitochondria are highly susceptible to LP-mediated oxidative damage. SFN was shown to
increase expression of HO-1 mRNA through the Nrf2-ARE pathway. As a result, it decreased the
level of 4-hydroxynonenal (4-HNE), a neurotoxic byproduct of LP [50]. SFN also suppressed
LPS-mediated expression of cytokines such as IL-1β, IL-6, and TNF-α in addition to decreasing
the release of inducible nitric oxide synthase (iNOS), COX-2, and NO from LPS-stimulated
microglia [73].
Protein levels of Nrf2-regulated genes encoding antioxidant enzymes, HO-1 and NAD(P)H
dehydrogenase quinone 1 (NQO1), were up regulated with SFN treatment in rats. As a result of
this increase in detoxifying and antioxidant enzymes through SFN, rats had reduced neuronal
death, contusion volume, and neurological dysfunction after cortical injury[45]. On the other

22
hand, Nrf2 knock out mice did not benefit from SFN treatment but rather had more severe
injuries from ischemia.
SFN induction of Nrf2 pathway is also beneficial to microglia and the BBB. In one study, LPS
induced inflammation in mouse hippocampus. SFN administration for 4 days resulted in
decreased microglial activation compared to the Nrf2-knock out mice. The decreased number of
activated microglia attenuated microglial inflammation as evident by reduced levels of IL-6 and
TNF-α[46]. SFN induction of Nrf2 also helps to reduce the loss of endothelial cell makers and
tight-junctions proteins to preserve BBB function [74].
1.5.1.1 Mitochondria
Mitochondria under oxidative stress and exposure to elevated levels of Ca2+ leads to opening of
mitochondrial permeability transition pore (PTP). PTP opening inhibits ATP formation as a
result of membrane depolarization, uncoupling of oxidative phosphorylation, and mitochondrial
osmotic swelling resulting in metabolic failure [75]. In addition, the release of mitochondrial
pro-apoptotic proteins such as BAX and BID results in cell death [76]. SFN increases resistance
of brain mitochondria to inner membrane permeability transition pore (PTP), which are
responsible for causing bioenergetics failure and subsequent cell death [75].
1.5.1.2 Phase II Enzymes (EPIIs)
EPIIs, which include NADPH quinoneoxidoreductase 1 (NQO-1), epoxyde hydrolase (EPHX),
glutathione reductase, glutathione-S-transferase, glutathione peroxidase, thioredoxinreductase,
and Heme oxygenase-1 (HO-1), play a central role against oxidant and inflammatory injuries
[48, 77].
HO-1, one of the EPIIs is an endogenous antioxidant that serves as the first rate-limiting enzyme
in catabolism of heme [78]. HO-1 cleaves heme to biliverdin, consequently forming carbon
monoxide (CO) and releasing chelated Fe2+. Biliverdin is reduced to bilirubin, which serves as a

23
free radical scavenger to protect against oxidative stress [79]. HO-1 increases the rate of free
heme catabolism to inhibit apoptosis and has been shown to be cytoprotective for neurons and
other types of cells [78, 80]. Overexpression of HO-1 in cerebral neurons was shown to increase
resistance to glutamate toxicity as a result of oxidative stress [81].
Increase in HO-1 expression with SFN pre-treatment was shown in rats exposed to hepatic
ischemic reperfusion injury (HIRI) [82]. Similar findings were observed in retinal ischemia-
reperfusion rat models where administration of SFN 24 hours before ischemia elevated level of
HO-1 expression [83]. SFN’s ability to increase levels of HO-1 can be observed in other types of
oxidative stress caused by doxorubicin, a chemotherapeutic agent [84].
1.5.2 SFN’s effect on activity and integrity of neurological system
1.5.2.1 SFN on Neurons
SFN has been shown to have protective properties against cytotoxic and ischemic insult of
neuronal cell cultures. 24 hour pre-treatment with SFN protected primary neuronal cultures from
rat striatum against treatment with H2O2. SFN increased cell viability likely through inducing an
increase in nuclear translocation of Nrf2. Increased nuclear levels of Nrf2 increased the
expression of γ-glutamylcysteine synthetase (γ-GCS), a rate-limiting enzyme for glutathione
synthesis. SFN also increased HO-1 expression in neurons [79]. In another study, mouse
hippocampal neurons were exposed to oxygen glucose deprivation (OGD). OGD was achieved
by transferring neurons to an incubator with 0% O2, 10% H2, 5% CO2, 85% N2 and using a
glucose free media. When SFN was added for 24 hours during recovery, there was an increase in
the mRNA levels of Nrf2/ARE genes, NQO1 and HO-1 compared to the control [85]. Similarly
in primary cortical neurons, SFN treatment during OGD and recovery increased cell viability,
24
decreased percentage of dead/dying cells, decreased cleaved caspase-3 and increased anti-
apoptotic protein Bcl-2 [86].
SFN treatment in animal models also shows neuronal protection. 7-day rat pups were subjected
to left common carotid artery ligation and hypoxia. The effect of intraperitoneal SFN
administration, prior to the insult, was examined in the cortex and hippocampus. SFN increased
expression of Nrf2 and HO-1 while reducing caspase-3 activity and LP. The area of damage was
significantly reduced with SFN treatment when infarct regions were visualized using 2, 3, 5-
triphenyltetrazolium chloride (TCC) staining [87].
1.5.2.2 SFN on Astrocytes
Astrocytes have important roles in BBB function, metabolism, uptake of glutamate, and
formation of glial scars during injury [88]. They also play an important role in axonal
development, secretion of growth factors, regulating ions and neurotransmitters, and providing
energy substrates for neurons [76].
Astrocytes are more efficient in synthesis of glutathione and antioxidant response element
(ARE)-linked gene expressions, thus more protected than neurons against basal levels of
oxidative stress. They provide protection to neurons by releasing glutathione (GSH) and
glutamine, which serves as a precursor for GSH synthesis in neurons [40]. In addition, activation
of ARE is seen predominantly in astrocytes as ARE-genes are preferentially activated[89, 90].
SFN was shown to activate ARE in astrocytes [89]. 48 hour SFN preconditioning followed by
treatment after 4 hours of OGD protected rat cortical astrocytes against death. SFN increased
nuclear localization of Nrf2 which through the Nrf2-ARE pathway increased mRNA and protein
levels of NQO1 and HO-1. Increased levels of antioxidant genes were then able to protect
astrocytes from cell death [91]. Further, even brief SFN treatment lead to accumulation of HO-1,

25
which then remained elevated for over 24 hours to protect astrocytes against peroxide-induced
damage [92].
1.5.2.3 SFN on Microglia
SFN administration has also been shown to suppress activation of microglia. When 7-day old rat
pups were administered with SFN 30 minutes before HI insult the numbers of activated
microglial cells were significantly reduced. Suppression of microglial activation has beneficial
role, as microglial activation is responsible for generation of ROS and inflammatory cytokines
[87].
In addition, 30 minute SFN pre-treatment was shown to reduce microglial activation in response
to LPS. Primary rat microglial cells had suppressed expression of IL-1β, IL-6, and TNF-αwith
SFN treatment. The cytokines activate NF-κB, which in turn further potentiates expression of
cytokines by a positive feedback loop. SFN is able to reduce NF-κB activation and levels of
inflammatory cytokines by inhibiting ERK1/2 and JNK phosphorylation [73].
Upon injury, microglia undergo morphological change from a ramified shape to an amoeboid
shape. 1 hour of pre-treatment with SFN before LPS in primary microglial cultures, reduced the
number of microglia in the more rounded amoeboid shape caused by LPS administration,
indicating decreased microglial activation [93].
1.5.2.4 SFN on Oligodendrocytes
Secondary injuries such as stroke that culminate after primary brain injuries play an important
role in causing oedema and worsening of neurological damages. Key contributors of secondary
brain damage are components released upon lysis of red blood cells (RBCs). RBCs lyse to
release haemoglobin (Hb), which degrades into heme and iron, and cytotoxins. Hb acts as a
neurotoxin damaging cellular components including DNA, lipids, and proteins. Hb is also able to
26
induce apoptosis, BBB disruption, and neuronal death. When Hb binds to haptoglobin (Hp) to
form the Hb-Hp complex, it prevents oxidative and cytotoxic effects of Hb.
SFN has been shown to induce production of Hp in oligodendrocytes by activating the Nrf2
pathway, which in turn upregulates the Hp gene in oligodendrocytes. Upregulation of the Hp
gene is not observed in neurons, astrocytes, or microglia [94].
Because of the benefits of SFN on neurons, astrocytes, microglia, and oligodendrocytes in
hypoxic ischemic environment in vitro, investigation of SFN’s potential use to minimize the in
utero hypoxic-ischemic insult to the fetal brain is warranted. However, because SFN also has
been used to cause apoptosis of cancer cells, query into cytotoxicity of SFN in the OGD
environment also needs to be investigated.
27
1.6 Hypothesis
i. SFN protects neurons and astrocytes against oxygen-glucose deprivation (OGD).
ii. SFN may be cytotoxic to neurons and astrocytes at a certain dosages.
1.7 Objectives
i. To determine the optimal OGD times for neurons and astrocytes.
ii. To determine effect of SFN on neurons and astrocytes under normal conditions.
iii. To determine effect of SFN dosages on neurons and astrocytes exposed to OGD.

28
Chapter 2
Materials and Methods

29
2.0 Materials and Methods
2.1 Isolation of Neurons
Rat cortical neurons were prepared from postnatal day 2 Long-Evan rats of either sex (Health
Science Lab Animal Services, U of Alberta). Brains were dissected and cortices were isolated.
Cortical tissues were enzymatically digested by 1mg/ml papain for 10 minutes at 37°C. DNase
was added to the digestion mix in the last 5 minutes of incubation. After mechanical dissociation
using a flame polished Pasteur pipette, the cell suspension was filtered through a cell strainer (40
μm Nylon; Falcon), neurons were plated on poly-D-lysine-coated wells at a density of 1.5 x 10⁵
cells/well in 24 well plates. The cell culture medium used consisted of NeurobasalA medium
(Gibco, Cat# 10888-022) supplemented with B27 (Gibco, #17504-044), penicillin Streptomycin
(Gibco, #3505-061). Experiments started at day 7 in culture.
2.2 Isolation of Astrocytes
2.2.1 Method 1
Postnatal day 2 Long-Evans cortices are isolated and transferred to a Petri dish containing
calcium and magnesium free (CMF) Hank’s Balanced Salt Solution (HBSS). Cortices are
digested using DNase and trypsin and incubated at 37°C for 5 minutes. Cortices are triturated
using a glass Pasteur pipette and incubated at 37°C for 5 minutes again. Growth media
containing 10% horse serum, 30% w/v D-glucose in Minimum Essential Media (MEM) added to
the cortices to filter through a 70 μm cell strainer. Cell suspension is centrifuged and re-
suspended in 1 mL of growth media. Astrocytes are plated at a cell density of 2 x 10⁴ cells/well.
Media is changed 24 hours after plating, and every 3 days after for 2 weeks.
30
2.2.2 Method 2
Rat cortical astrocytes were prepared postnatal day 2 Long-Evan rats of either sex (Health
Science Lab Animal Services, U of Alberta). Rat cortices were washed with PBS and dissociated
with 0.1% (w/v) trypsin at 37°C for 5 minutes. BME-glucose media with 10% FBS was added to
stop the action of trypsin. The cortices were then mechanically dissociated using a Pasteur
pipette. Cells were filtrated through a cell strainer (70μm Nylon; Falcon) and plated 8 x 10⁴
cells/well in 24 well plates. After 24 hours, BME-glucose media was replaced with BME-
glucose-free media supplemented with sorbitol and 10% FBS. Media was changed every 3 days
and experiments started at day 12 in culture.
2.3 Hypoxic-Ischemic Insult
The oxygen sensor (Pro Ox: 110, BioSpherix) for the hypoxia chamber is set at 0% oxygen level.
Oxygen in the incubator is replaced by a mixture of gas that is 95% nitrogen and 5% carbon
dioxide at 37°C. Regular growth media is replaced by DMEM with no glucose during the
hypoxic-ischemic insult. DMEM is degassed for an hour using a vacuum to remove the oxygen
within the media. Once the oxygen has been removed from the both incubator and the media, the
plates of cells are then placed in the hypoxia chamber for the appropriate amount of time.
Oxygen levels were monitored throughout with an oxygen sensor. At all times, oxygen level was
below 1%.
2.4 Recovery
DMEM is replaced with regular growth media then the cells are placed in an incubator at 37°C
with 5% carbon dioxide and 95% air.
31
2.5 Drug Treatment
2.5.1 SFN
R, S-Sulforaphane, not dissolved in any solvent, is obtained from LKT Laboratories, Inc. 25mM
stock, which was diluted using ddH2O stored at -20°C. From the 25 mM stock, 5mM aliquots are
diluted with ddH2O. 5mM stocks are diluted again into appropriate concentrations for each
experiment.
2.5.2 Treatment of cells with SFN
Cells were treated with SFN at various dosages of 0.5, 1, 2, 2.5, 5, 10, 25, and 50μM. SFN is
added to degassed DMEM for OGD and added to regular growth media for recovery.
2.5.3 Staurosporine induced cell death
100 nM of staurosporine was added to induce massive cell death. Staurosporine was diluted from
1 mM stock and incubated with cells for 25 hours at 37 °C.100 nM of staurosporine was reported
to induce 70 to 80% cell death in neurons and glial cells [95, 96].
2.6 Preparation of Cell Lysates
Cells were scrapped with a mini-cell scraper (Biotium) then washed twice with phosphate
buffered saline (PBS). PBS containing protease inhibitor was added to prevent protein
degradation. Cells and PBS were collected then homogenized with a 26 gauge syringe,
centrifuged at 4°C for 5 minutes at 13.2 rpm. The pellet was discarded and the supernatant was
collected for protein concentration determination.
2.7 Immunoblotting
Equivalent amount of proteins were resolved by 8% Tricine polyacrylamide gel electrophoresis.
Proteins were then transferred onto polyvinylidenedifluoride (PVDF) membranes (Milipore).

32
After the transfer, membranes were blocked in 3% Bovine Serum Albumin (BSA) and incubated
with various antibodies at 4°C overnight. Membranes are then washed with TBST then incubated
with secondary antibodies (GE Healthcare UK Limited) at 37°C for an hour. Western blots were
visualized using Western Lightning® Plus-ECL (PerkinElmer, LAS Inc.). Antibodies to the
following proteins were used for this study: Anti-Neuronal Specific Enolase (Abcam®), Anti-
Glial Fibrillary Acidic Protein (Abcam®), and Actin (Santa Cruz Biotechnology Inc.).
2.8 Trypan Blue Viability Assay
Trypan blue viability assay is used to determine number of viable and non-viable cells. Viable
cells with intact cell membranes exclude the dye, while cells with compromised cell membranes
are unable exclude the dye and appear blue. Briefly, cells are collected gently by using a mini-
cell scraper. The media containing the scrapped cells placed in a 1ml eppendorf tube then
centrifuged for 2 minutes at 200g. Supernatant is removed then 1:1 trypan blue and PBS is
added. Cells are gently triturated using a pipette. Dead and live cells are counted using a
haemocytometer.
2.9 LDH Cytotoxicity Assay
Upon injury, cell membranes are damaged, rupture and become permeable and LDH leaks from
the injured cells. This permeability also allows fluids to enter the cells resulting in cell swelling,
rupture and necrosis. The rupturing of intracellular organelles and the deterioration of the plasma
membrane allow LDH to be released to the cytosol [97]. The LDH that is released can be
measured and quantified. LDH converts lactate into pyruvate. During this conversion, NAD+ is
reduced into NADH. In the calorimetric assay for LDH quantification, WST-1 tetrazolium dye is
reduced as NADH is oxidized back to NAD+. Because WST-1 is cell impermeable, reduction

33
occurs outside the cell membrane. WST-1 tetrazolium dye reduction generates an orange/yellow
color, and the intensity (read by a spectrometer at 450 nm) of which is directly proportional to
amount of LDH released (Figure 3).
Figure 3 – Schematic representation of LDH release and subsequent reactions
LDH Cytotoxicity Assay Kit II was obtained from Abcam®. For high control, 10 μL of Cell
Lysis Solution was added per 100 μL of cells. Low control cells were untreated cells. 10μl of cell
media is transferred into a 96-well plate. 100ul of LDH reaction mix is added and allowed to
react for 30 minutes at room temperature. LDH is measured using VersaMaxMicroplate readerat
450nm.
2.9.1. LDH Cytotoxicity Calculation Method 1
The following formula was provided by Abcam®:
𝐶𝑦𝑡𝑜𝑡𝑜𝑥𝑖𝑐𝑖𝑡𝑦 (%) = (𝑇𝑒𝑠𝑡 𝑆𝑎𝑚𝑝𝑙𝑒 − 𝐿𝑜𝑤 𝐶𝑜𝑛𝑡𝑟𝑜𝑙)
(𝐻𝑖𝑔ℎ 𝐶𝑜𝑛𝑡𝑟𝑜𝑙 − 𝐿𝑜𝑤 𝐶𝑜𝑛𝑡𝑟𝑜𝑙)𝑥 100%
Test sample is the absorbance level for each SFN dosages, low control represents the untreated
cells, and high control represents the cells treated with cell lysis solution. However, the formula
does not allow for comparison between 0 µM and other SFN dosages. The “low control” that is
referred by Abcam®’s formula is the 0 µM group in this study. Thus, because 0 µM is used as the
“low control”, comparisons can be only made between 0.5, 1, 2, 2.5, 5, 10, 25, and 50 µM. For
34
statistical comparison between SFN dosages to 0 µM, cytotoxicity calculation was modified to
subtract the background LDH levels from just the cell media.
2.9.2. LDH Calculation Method 2
Cytotoxicity calculation was adjusted to allow for comparison between untreated to treated cells.
𝐶𝑦𝑡𝑜𝑡𝑜𝑥𝑖𝑐𝑖𝑡𝑦 (%) =[(𝑇𝑒𝑠𝑡 𝑆𝑎𝑚𝑝𝑙𝑒 − 𝐵𝑎𝑐𝑘𝑔𝑟𝑜𝑢𝑛𝑑)]
[(𝐻𝑖𝑔ℎ 𝐶𝑜𝑛𝑡𝑟𝑜𝑙 − 𝐵𝑎𝑐𝑘𝑔𝑟𝑜𝑢𝑛𝑑)]𝑥 100%
Using the new LDH cytotoxicity formula, calculations were redone, which allowed for one-way
ANOVA analysis of all the dosages.
2.10 MTT Cell Viability Assay
MTT (3-(4,5-dimethylthiazol-2-yl)-2,5-diphenyltetrazolium bromide) penetrates viable
eukaryotic cells to reduce tetrazolium into the colored formazan product. Unviable cells are
unable to convert tetrazolium into formazan. The intensity of signal is proportional to the number
of viable cells present (Assay Guidance Manual, Eli Lilly & Company and the National Center
for Advancing Translational Sciences, 2004).
Cells are plated on 96-well plates. After exposing them to experimental conditions, 12nM MTT
(Sigma) was added per well and incubated for 4 hours at 37°C. After incubation, 50 μL of
DMSO was added to dissolve formazan. The sample was read at 540 nm on JennsMTT protocol
available on the PerkinElmer software usingFLUOstar OMEGA Multi-mode microplate reader
(BMG Labtech).
2.11 Fam-DEVD-fmk
Carboxyfluorescein Fluorescent Labelled Inhibitor of Caspases (FAM FLICATM) detects active
caspase 3 and 7. The fluorescent inhibitor FAM-DEVD-FMK labels caspases that can be

35
analyzed using a fluorescent plate reader. Green fluorescent probes carboxyfluorescein (FAM)
and fluoromethylketone (FMK) binds and interacts with amino sequences of aspartic acid-
glutamic acid-valine-aspartic acid (DEVD) of the caspases.
Cells were stained with FAM FLICATM Caspase-3 & 7 Assay Kit (ImmunoChemistry
Technologies LLC). After insult and recovery, cells are harvested and centrifuged at 200 g for 5
minutes with the media. 30X FLICA is added at 1:30 and incubated for 60 minutes at 37°C.
Cells are washed with 1X Apoptosis Wash Buffer, centrifuged, and re-suspended after the
removal of supernatant. After repeating the previous step, cells are incubated for 10 minutes at
37°C. Cells are centrifuged again at 200 g and re-suspended in 500 μL of PBS. Cell density is
adjusted to be > 3 x 10⁶ cells/mL. Three 100 μL/well of the solution is transferred into a 96 well
black microtiter plate. Endpoint read was performed with the excitation wavelength at 488 nm
and emission wavelength at 530 nm with a VersaMax Microplate reader.
2.12 DNA quantification
Nucleic acids absorb ultraviolet light, which can be measured using a spectrophotometer at 260
nm. Higher the absorbance from the sample corresponds to higher concentration of nucleic acids
that are present. After SFN treatment during OGD and recovery, amount of DNA is quantified
using a VersaMax Microplate reader at 260 nm.

36
Figure 4 – Schematic representation of experimental time line
2.13 Statistical Analysis
GraphPad Prism 5 and 6 computer software was used. Data were from 3 to 6 experiments with
triplicates per experiment. Values were expressed as means SE. Statistical significance was
analyzed using Ordinary one-way ANOVA with Tukey’s multiple comparisons test. Significance
is indicated by * (p<0.05), ** (p<0.01), or *** (p<0.001).

37
Chapter 3
Results
38
3.0 Results
3.1 Neuronal and Astrocyte Cultures
Western blot analysis showed that neuronal cell cultures were successfully isolated without
astrocytes contamination (Figure 5A). Neuronal cells did not react with the astrocyte marker,
anti-Glial Fibrillary Acidic Protein (GFAP) antibody. On the other hand, astrocytes cell cultures
appeared to be contaminated with neuronal cells. Staining of astrocyte cultures using neuronal
cell markers, anti-Neuronal Specific Enolase (NSE) and anti-β-tubulin III, demonstrated that
astrocytes cultures reacted positively with neuronal antibodies (Figure 5B and 5C). To eliminate
growth of neurons in astrocyte cultures, we used an alternate isolation technique with a different
growth media to enhance astrocyte growth and supress neuronal growth. Initially, astrocytes
were isolated using a glucose containing minimal essential growth medium (MEM). However,
both neurons and astrocytes are able to utilize glucose as a source of energy, which enable the
neurons to grow in the glucose containing astrocyte media leading to neuronal contamination of
the astrocyte culture. In the alternate method of astrocyte isolation we used glucose-free growth
media supplemented with sorbitol. Astrocytes are able to utilize different types of glucose
sources including monosaccharide glucose, mannose, fructose, and sorbitol. In primary cultures,
only astrocytes can survive in glucose-free medium supplement with sorbitol [98]. Neurons and
other glial cells cannot be cultured in sorbitol without glucose [99]. Western blot analysis
showed that astrocyte cultures were now free of contaminating neuronal cells (Figure 5D).
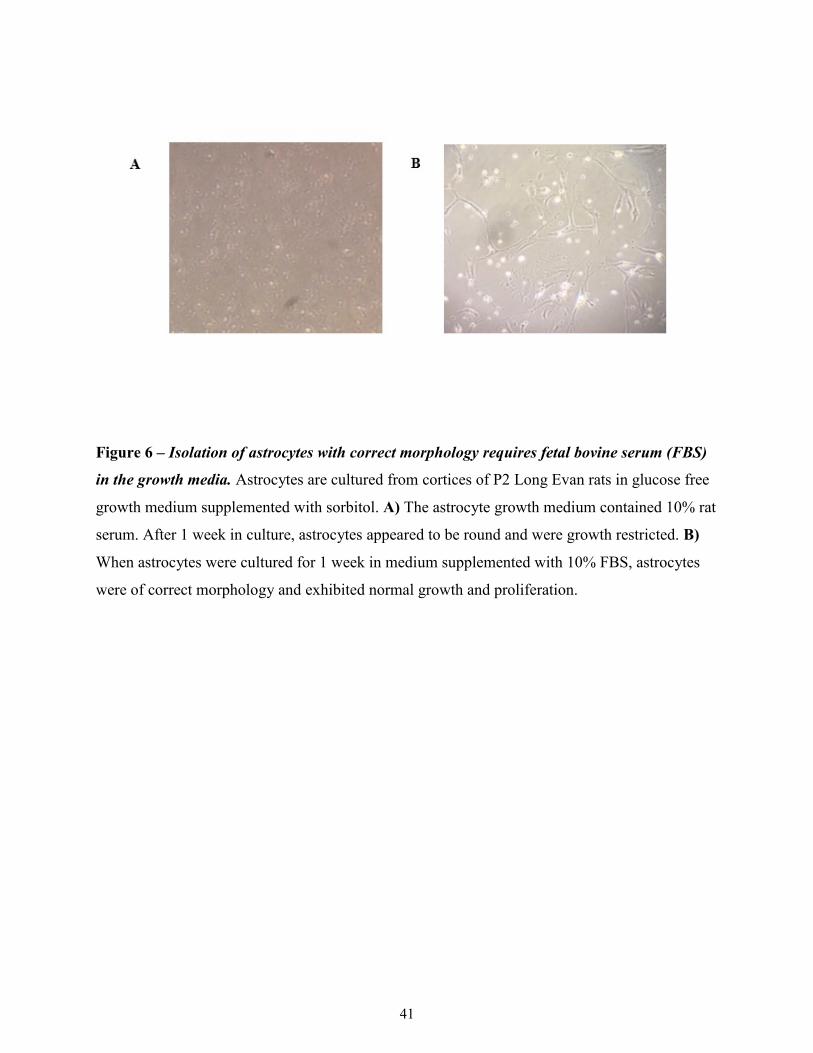
Astrocyte Growth Media Serum Selection
While switching to the use of glucose-free media for astrocyte culturing gave us non-
contaminated astrocyte cultures, the isolated astrocytes did not have the correct morphological
shape (Figure 6A). Our original protocol suggested the use of rat serum. As an alternative
method for the isolation of healthy astrocyte cultures of correct morphology, we changed to

39
using fetal bovine serum (FBS) (Figure 6B). Using 10% FBS in the glucose-free media
supplemented with sorbitol, we were successful in isolating and culturing contamination free
astrocytes of correct morphology.

40
Figure 5 – Western blot analysis of cortical neuronal and astrocyte cultures. Neurons were
cultured for 1 week and astrocytes for 12 days prior to lysis and Western blot analysis of cell
specific markers. β-actin was used as a loading control. Results are from 3 separate cultures. A)
Neuronal and astrocyte cultures were probed with anti-glial fibrillary acidic protein (GFAP) for
astrocyte detection. Only the astrocyte cultures reacted with the GFAP antibody. There was no
GFAP staining in the neuronal cultures, indicating they were not contaminated with astrocytes. B
& C) Neuronal cultures reacted positively with neuronal markers, anti-Neuronal Specific
Enolase (NSE) and anti-β-tubulin III antibodies. However, the astrocyte cultures grown in
glucose-containing media also reacted positively with anti-NSE and anti-β-tubulin indicating
contaminating neurons in the astrocyte cultures. D) Astrocyte cultures were free of neuronal
cells, and did not react with anti-NSE antibody.
41
Figure 6 – Isolation of astrocytes with correct morphology requires fetal bovine serum (FBS)
in the growth media. Astrocytes are cultured from cortices of P2 Long Evan rats in glucose free
growth medium supplemented with sorbitol. A) The astrocyte growth medium contained 10% rat
serum. After 1 week in culture, astrocytes appeared to be round and were growth restricted. B)
When astrocytes were cultured for 1 week in medium supplemented with 10% FBS, astrocytes
were of correct morphology and exhibited normal growth and proliferation.
42
3.2 Determination of optimal times for Oxygen Glucose Deprivation (OGD) and treatment
with Sulforaphane (SFN).
3.2.1 LD50: OGD
Our next aim was to determine the LD 50 for oxygen glucose deprivation (OGD) of neurons and
astrocytes. LD50 (Lethal dose 50 %) refers to the time point when 50% of cells die from the
treatment under consideration, in this case OGD. LD 50 was determined using trypan blue
exclusion assay of cells (neurons or astrocytes) exposed to various times of OGD (1, 4, 8, 12, 18,
or 24 hours) followed by 24 hours of recovery using normoxic glucose containing growth
media. Our results indicate that LD50 for neurons was achieved with 1 hour of OGD and 24
hours of recovery, while LD50 for astrocytes was observed after 4 hours OGD and 24 hours of
recovery (Figure 7B and 7C). The greater resistance of the astrocytes to death by OGD is in
accordance their ability express ARE-linked genes better than neurons [40].

43
Figure 7 – Effects of OGD on neuronal and astrocyte cell death. After culturing neurons for 1
week and astrocytes for 12 days, respectively, each cell type was exposed to OGD. Cell death
was evaluated using trypan blue exclusion assay to evaluate cell viability. Neurons and
astrocytes were exposed to 1, 4, 8, 12, 18, or 24 hours of OGD with 24 hours of recovery. A)
LD50 for neurons was achieved with 1 hour of OGD and 24 hours of recovery and B) LD50 for
astrocytes was achieved with 4 hours of OGD and 24 hours of recovery. C) 1 and 4 hours of
OGD with 24 hours of recovery was compared between neurons and astrocytes. At both 1hour
and 4-hour time points of OGD astrocytes exhibited significantly less cell death compared to
neurons. * indicates significance in comparison to 0 µM of SFN *p<0.05. **p<0.01.
***p<0.001.

44
3.2.2 SFN treatment during OGD only vs. OGD and recovery
Having determined the LD50 for neurons and astrocytes during OGD and OGD/ recovery, our
next aim was to determine the ideal time for treatment with SFN. We compared the efficacy of
SFN to limit or prevent changes in cell death due to OGD only, or during OGD followed by
recovery with oxygen and glucose containing media. Cell viability was assessed with trypan blue
exclusion assay. Figures 8A and 8B demonstrate that regardless of whether SFN was used during
OGD or OGD/recovery, neuronal protection from cell death was evident and significant at a SFN
dosage of 2.5 µM. Protection of neurons from cell death by 2.5 µM SFN was statistically
comparable under both treatment regimens. In addition, based on this finding, all the following
experiments were carried out with SFN added during OGD and recovery period.
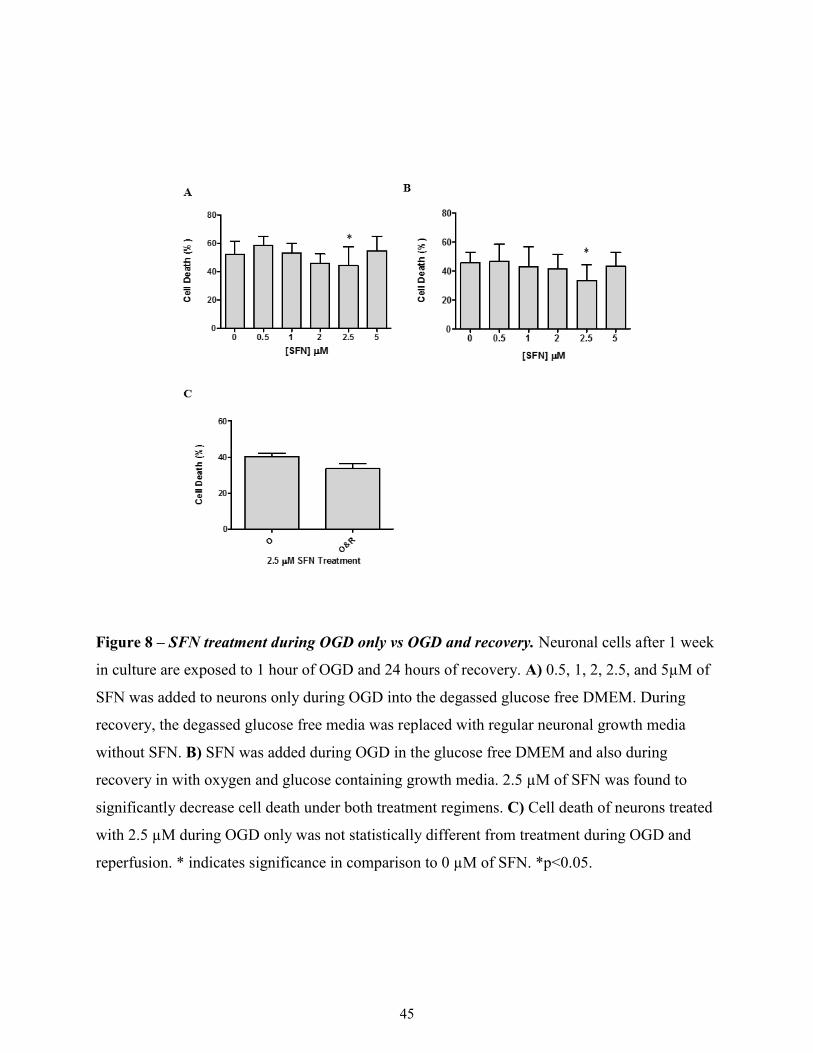
45
Figure 8 – SFN treatment during OGD only vs OGD and recovery. Neuronal cells after 1 week
in culture are exposed to 1 hour of OGD and 24 hours of recovery. A) 0.5, 1, 2, 2.5, and 5µM of
SFN was added to neurons only during OGD into the degassed glucose free DMEM. During
recovery, the degassed glucose free media was replaced with regular neuronal growth media
without SFN. B) SFN was added during OGD in the glucose free DMEM and also during
recovery in with oxygen and glucose containing growth media. 2.5 µM of SFN was found to
significantly decrease cell death under both treatment regimens. C) Cell death of neurons treated
with 2.5 µM during OGD only was not statistically different from treatment during OGD and
reperfusion. * indicates significance in comparison to 0 µM of SFN. *p<0.05.

46
3.3 Assessment of SFN’s effects on Normoxic Neurons and Astrocytes
Having successfully completed culturing of neurons and astrocytes, determination of time course
for LD50 and recovery, we next wanted to determine the effect of SFN’s on cell cultures under
normoxic condition of 37 °C and 95% O2/5% CO2. This would highlight potential effects of SFN
under conditions of normal pregnancy. Assessments were done using four different assays:
trypan blue viability assay, LDH cytotoxicity assay, MTT viability assay, and FAM FLICA
caspase 3 & 7 apoptosis marker assay.
Trypan blue exclusion assay is one of the most frequently used methods for assessing cell death.
It allows dead/damaged cells to be distinguished from viable cells as dead/damaged cells are
stained dark blue [100]. Similarly, the integrity of the cell membrane is measured through the
amount of LDH released into the media. To observe the effects of SFN on cell viability, MTT
assay was utilized. MTT determines cell viability by measuring its ability to convert tetrazolium
salts into formazan crystals. The crystals are dissolved using DMSO, and the resulting color
change can be quantified [101]. The amount of DNA was quantified for neurons astrocytes to
determine whether SFN increased cell viability by increasing the number of astrocytes through
proliferation or decreasing number of cell death. In addition to analyzing necrosis, overall cell
death, and viability, FAM FLICATM caspase 3 and 7 assay was used to study putative apoptosis
in neurons and astrocytes.
3.3.1 Effects of SFN on Neurons during Normoxic Condition
Trypan blue viability assay
Dosages of 0.5, 1, 2, 2.5, 5, 10 and 25 μM of SFN did not have any effect on cell death measured
by Trypan blue exclusion assay of normoxic neurons. However, 50 μM SFN did cause
47
significant increase in normoxic neuronal cell death. Significant decrease in overall cell death
was observed with 10 μM (Figure 9A).
MTT viability assay
Neuronal viability under normoxic conditions did not appear to be affected by SFN (Figure 9B).
A slight decrease in viability was observed with 50 μM but this was not significant.
LDH cytotoxicity assay
No cytotoxic effects were observed at 0.5, 1, 2, 2.5, 5, 10 and 25 μM of SFN treatment of
normoxic neurons. The only exception was 50 μM SFN where we observed a significant increase
in LDH cytotoxicity (Figure 9C).
DNA quantification
There was no alteration on DNA content with SFN treatment indicating that SFN did not affect
proliferation of cortical neurons (Figure 9D).

48
Figure 9 – Effects of SFN treatment on neurons in normoxic conditions. After 1 week in
culture, assays are performed without exposure to OGD. Neurons treated with 100 nM of
staurosporine served as a control. A) Neuronal cell death was assed using trypan blue exclusion
assay. B) Cell viability was assessed using MTT. C) LDH released into the media is represented
as cytotoxicity index. D) DNA amount was quantified at 260 nm. S: culture treated with 100 nM
of staurosporine to induce massive cell death. * indicates significance in comparison to 0 µM of
SFN, while # indicates significance between S and 0 µM of SFN. *p<0.05. **p<0.01.
***p<0.0001. ###<0.0001.
A
C

49
3.3.2 Effects of SFN on Astrocytes during Normoxic Condition
Trypan blue viability assay
Non-significant decrease in cell death was seen with 0.5, 1, 2, and 5 μM of SFN compared to
control (0 μM SFN). At 25 and 50 μM, cell death was significantly increased (Figure 10A).
MTT viability assay
0.5, 1, 2, and 2.5 μM SFN was seen to significantly increase cell viability of astrocytes. Dosages
of 0.5 to 2.5 μM increased absorbance by almost 2 fold compared to untreated astrocytes (0 μM).
However, significant reduction in cell viability was observed at 50 μM (Figure 10B).
LDH cytotoxicity assay
Dosages of 0.5, 1, 2, 2.5, 5, and 10 μM were shown to have a significant beneficial effect upon
cell death of normoxic neurons as measured by LDH secretion which was decreased significantly
upon treatment with these doses of SFN. However, at 25 and 50 μM of SFN, LDH cytotoxicity
significantly increased compared to the control (Figure 10C).
DNA quantification
Similarly to neurons, SFN did not alter DNA content in astrocytes indicating that SFN does not
affect astrocyte proliferation in normoxic conditions (Figure 10D).
50
Figure 10 – Effects of SFN treatment on astrocytes in normoxic conditions. After 12 days in
culture, assays are performed without exposure to OGD. Astrocytes treated with 100 nM of
staurosporine and normoxic astrocytes served as controls. A) Astrocyte cell death was assed
using trypan blue exclusion assay. B) Cell viability was assessed using MTT. C) LDH released
into the media was converted into cytotoxicity. D) DNA amount was quantified at 260 nm. S:
culture treated with 100 nM of staurosporine to induce massive cell death. * indicates
significance in comparison to 0 µM of SFN, while # indicates significance between S and 0 µM
of SFN. *p<0.05. **p<0.01. ***p<0.0001. ###<0.0001.

51
3.3.3 Effects of SFN on Apoptosis of Normoxic Neurons and Astrocytes
Amount of apoptosis activity was evaluated to determine whether SFN affected neurons and
astrocytes under normoxic conditions. Cultures treated with staurosporine were used as positive
controls of massive cell death.
Neurons
Under normoxic conditions, SFN appeared to increase apoptotic activity. Significant increase in
active caspase 3 and 7 fluorescence was observed at 2.5 and 50 μM (Figure 11A).
Astrocytes
SFN appeared to increase apoptosis in normoxic astrocytes as well. There was a significant
increase in fluorescence levels with 1 and 10 μM of SFN (Figure 11B).
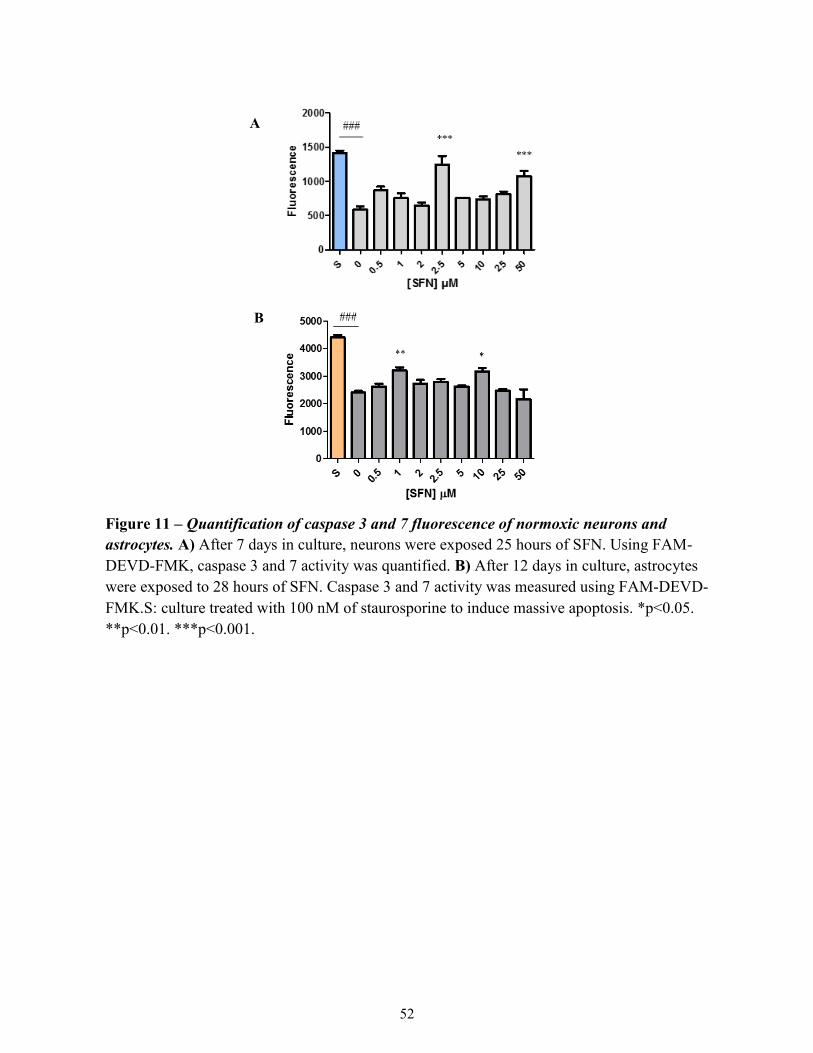
52
Figure 11 – Quantification of caspase 3 and 7 fluorescence of normoxic neurons and
astrocytes. A) After 7 days in culture, neurons were exposed 25 hours of SFN. Using FAM-
DEVD-FMK, caspase 3 and 7 activity was quantified. B) After 12 days in culture, astrocytes
were exposed to 28 hours of SFN. Caspase 3 and 7 activity was measured using FAM-DEVD-
FMK.S: culture treated with 100 nM of staurosporine to induce massive apoptosis. *p<0.05.
**p<0.01. ***p<0.001.
A
B

53
3.4 Assessment of SFN’s effects on Hypoxic-Ischemic Neurons and Astrocytes
Having successfully completed culturing of neurons and astrocytes, determination of time course
for LD50 and recovery, and determining the effects of SFN in the normoxic condition, we next
wanted to determine the effect of SFN’s on cell cultures under the OGD condition. This
assessment was done using four different assays: LDH cytotoxicity assay, trypan blue viability
assay, MTT viability assay, and FAM FLICA caspase 3 & 7 apoptosis marker assay.
3.4.1 Effects of SFN on Neurons in OGD condition
Trypan blue
Trypan blue staining of neurons was quantified in the presence or absence of various doses of
SFN as shown in Figure 11A. We observed a significant reduction in cell death in the presence
of 10 µM of SFN compared to untreated control (0 µM SFN). Interestingly, cell death increased
in the presence of 50 µM SFN (Figure 12A).
MTT viability assay
MTT cell viability assay of neurons was quantified in the presence or absence of various doses of
SFN as shown in Figure 11B. Treatment with 0.5 to 10µM of SFN was seen to increase cell
viability significantly in neurons (Figure 12B). Although there was an increase with 25 µM, it
was not significant. At 50 µM, cell viability was significantly reduced.
LDH cytotoxicity assay
LDH release by neurons was quantified in the presence or absence of various doses of SFN as
shown in Figure 10C. SFN dosages of 2, 2.5, 5, and 10 µM were shown to reduce cytotoxicity
compared to no SFN treatment (0 µM SFN) (Figure 12C).
DNA quantification
There was no alteration on DNA content with SFN treatment indicating that SFN did not affect
proliferation of cortical neurons in the OGD condition (Figure 12D).

54
Figure 12 – Effects of SFN treatment on neurons exposed to OGD. After 1 week in culture,
neuronal cells are exposed to 1 hour of OGD and 24 hours of recovery with oxygen and glucose
containing media. Neurons treated with 100 nM of staurosporine and normoxic neurons served as
controls. A) Neuronal cell death was assed using trypan blue exclusion assay. B) Neuronal cell
viability was assessed using MTT. C) LDH released into the media was converted into
cytotoxicity index. D) DNA amount was quantified at 260 nm. S: culture treated with 100 nM of
staurosporine to induce massive apoptosis. C: culture that is not exposed to any OGD or SFN. *
indicates significance in comparison to 0 µM of SFN, while # indicates significance between S and
C, and C and 0 µM of SFN. *p<0.05. **p<0.01. ***p<0.0001. ###<0.0001.

55
3.4.2 Effects of SFN on Astrocytes in OGD condition
Trypan blue viability assay
Trypan blue staining of astrocytes was quantified in the presence or absence of various doses of
SFN as shown in Figure 13A. Non-significant decreases in overall cell death were observed with
doses of 0.5 to 10µM of SFN. Similar to neurons, at 50 µM, cell death of astrocytes was
increased compared to control (0 µM SFN) (Figure 13A).
MTT viability assay
MTT cell viability assay of astrocytes was quantified in the presence or absence of various doses
of SFN as shown in Figure 12B. Treatment with 0.5 to 2.5 µM of SFN also increased cell
viability of astrocytes. At doses greater than 5 μM, cellular viability appeared to show a trend
towards decreasing. However, cell viability was decreased significantly only at 50 µM (Figure
13B).
LDH cytotoxicity assay
LDH release by astrocytes was quantified in the presence or absence of various doses of SFN as
shown in Figure 10D. SFN doses of 0.5 1, 2, 2.5, 5, and 10 µM significantly reduced LDH
cytotoxicity (Figure 13C).
DNA quantification
Astrocytes respond to ischemic injury by proliferating, and some are even capable of forming
self-renewing multipotent cells [102]. However, DNA quantification revealed that SFN was not
protecting astrocytes through increasing cell proliferation (Figure 13D). The constant quantified
DNA absorbance suggests that increase in astrocyte viability is not a result of astrocyte
proliferation, but decreased number of cell death.

56
Figure 13 – Effects of SFN treatment on astrocytes exposed to OGD. After 12 days in culture,
astrocytes are exposed to 4 hours of OGD and 24 hours of recovery with oxygen and glucose
containing media. Astrocytes treated with 100 nM of staurosporine and normoxic astrocytes
served as controls. A) Astrocyte cell death was assed using trypan blue exclusion assay. B) Cell
viability was assessed using MTT. C) LDH released into the media was converted into
cytotoxicity index. D) DNA amount was quantified at 260 nm. S: culture treated with 100 nM of
staurosporine to induce massive cell death. C: culture that is not exposed to any OGD or SFN. *
indicates significance in comparison to 0 µM of SFN, while # indicates significance between S
and C, and C and 0 µM of SFN. *p<0.05. **p<0.01. ***p<0.0001. ###<0.0001.
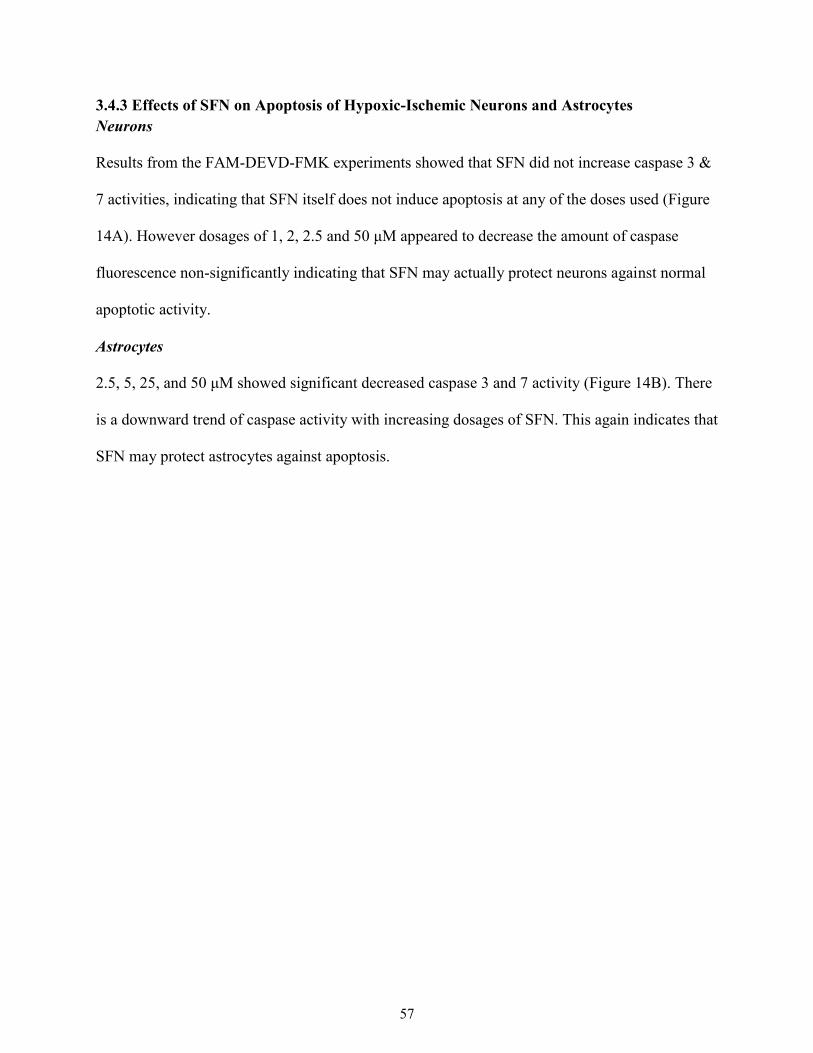
57
3.4.3 Effects of SFN on Apoptosis of Hypoxic-Ischemic Neurons and Astrocytes
Neurons
Results from the FAM-DEVD-FMK experiments showed that SFN did not increase caspase 3 &
7 activities, indicating that SFN itself does not induce apoptosis at any of the doses used (Figure
14A). However dosages of 1, 2, 2.5 and 50 μM appeared to decrease the amount of caspase
fluorescence non-significantly indicating that SFN may actually protect neurons against normal
apoptotic activity.
Astrocytes
2.5, 5, 25, and 50 μM showed significant decreased caspase 3 and 7 activity (Figure 14B). There
is a downward trend of caspase activity with increasing dosages of SFN. This again indicates that
SFN may protect astrocytes against apoptosis.

58
Figure 14 – Quantification of caspase 3 and 7 fluorescence of OGD neurons and
astrocytes. A) After 7 days in culture, neurons were exposed to 1 hour of OGD then 24 hours
of recovery. Using FAM-DEVD-FMK, caspase 3 and 7 activity was quantified. B) After 12
days in culture, astrocytes were exposed to 4 hours of OGD then 24 hours of recovery.
Caspase 3 and 7 activity was measured using FAM-DEVD-FMK.S: culture treated with 100
nM of staurosporine to induce massive apoptosis. C: culture that is not exposed to any OGD
or SFN. * indicates significance in comparison to 0 µM of SFN, while # indicates significance
between S and C, and C and 0 µM of SFN. *p<0.05. **p<0.01. ***p<0.0001. #<0.05.
###<0.0001.

59
Chapter 4
Discussion
60
4.0 Discussion
Asphyxia, placental abruption, and prenatal stroke lead to shortage of oxygen and glucose to the
fetal brain. Insufficient blood supply to the fetus increases the risk of CP. Despite numerous
factors and conditions that can lead to hypoxia-ischemia in the fetal brain, the current
preventative and post-partum treatments remain limited. The anti-apoptotic, anti-inflammatory
effects of SFN may potentially represent preventative measures that can be used by expectant
mothers to protect the fetus against the development of CP. This study first determined the
optimal time for SFN treatment under conditions that simulate hypoxia-ischemia and then
evaluated its effects under OGD and normoxic conditions using trypan blue exclusion assay,
MTT viability assay, LDH cytotoxicity assay, and FAM-DEVD-FMK caspase 3 and 7 assay.
LD50 determination experiment revealed that neurons are more vulnerable than astrocytes to
OGD. Neurons achieved LD50 with 1 hour of OGD compared to 4 hours for astrocytes,
demonstrating higher sensitivity of neurons to hypoxia and glucose deprivation. The use of
longer OGD times for astrocytes is consistent with other studies that model hypoxia-ischemia in
vitro [85, 91, 103, 104]. Soane et al. (2010) exposed neurons to 1 hour of OGD, while Danilov et
al. (2009) exposed astrocytes to 4 hours of OGD. Both studies determined effects of SFN in
OGD induced death. Similarly, in other oxidative stress-induced studies, Kim et al. (2012) used 1
hour of OGD for neurons for examining neuroprotective effects of L-carnitine against OGD, and
Zhou et al. (2015) used 4 hours of OGD to study protective effect of sulfiredoxin 1, an
antioxidant protein, on astrocytes.
Astrocyte’s higher resistance to models of cerebral ischemia is a result of greater glutathione
(GSH) synthesis, which allows them to remain viable and functional [92]. GSH is an important
cofactor in eliminating free radicals. O2- is converted into H2O2 by reacting with Cu/Zn-

61
superoxide dismutase (SOD). H2O2 is removed by GSH. GSH is oxidized into GSSG to reduce
H2O2 into H2O. GSSG is then reduced again back to GSH [105].
The present study found that SFN is able to protect neurons and astrocytes under OGD/ recovery
conditions using Trypan Blue exclusion assay and LDH cytotoxicity assay. Both assays measure
cells with permeabilized membranes. This permeabilization of the membrane is a key marker of
necrosis. Necrosis is known to occur during and shortly after the oxidative insult. Taken
together, these results suggest that SFN rescues neurons and astrocytes during OGD through
attenuating necrosis.
The single most beneficial SFN dose for both neurons and astrocytes under OGD-Recovery
condition appears to be 2.5 µM. Neurons and astrocytes exposed to OGD were observed to with
significant increase in cell viability and decrease LDH release in the presence of 2.5 µM of SFN.
OGD-treated astrocytes also showed significant decrease in apoptosis in the presence of 2.5 µM
of SFN. In addition, normoxic astrocytes had increased viability and decrease LDH cytotoxicity.
Interestingly, treatment of normoxic neurons with 2.5 µM of SFN resulted in a significant
increase in apoptosis as demonstrated by the increased activity of caspase 3 & 7 in the SFN
treated normoxic neurons compared to untreated. The increase in apoptosis may be associated
with the fact that immature fetal brains have higher expressions of apoptotic players to
counteract neuronal overproduction [26]. To this end it is reported that partial inhibition of
caspase-3 protects neonatal brain against HI, while complete inhibition of caspase-3 or lack of
caspase-3 is injurious due to amplification of necrosis and caspase-3-independent injury. [26].

62
Thus, SFN’s inhibition of apoptotic pathways may actually exacerbate apoptotic cell death in
neurons.
There are two main pathways of apoptosis: the extrinsic and the intrinsic pathway. The extrinsic
pathway begins via activation of death receptors. Upon activation, the death domain of the
receptor is able to transmit the signal from the cell membrane to the inside of the cell. Additional
adaptor proteins are recruited through the death domain of the receptor. For example, once
tumour necrosis factor (TNF)-α binds to TNF receptor 1, adaptor protein TRADD recruits
FADD and RIP. FADD is then able to associate with procaspase-8 to form the death-inducing
signaling complex (DISC). DISC is able to cause autocatalytic activation of procaspase-8.
The intrinsic pathway is triggered by intracellular signals. Various stimuli of intracellular origin
induce the mitochondrial permeability transition (MPT) pores to open, which subsequently
results in the release of pro-apoptotic proteins into the cytosol. Once Cytochrome c is released it
activates Apaf-1 and procaspase-8 to form the apoptosome in the cytosol. There is also an
aggregation of procaspase-9 which leads to caspase-9 activation [106].
The active caspase 8 from the extrinsic pathway and the active caspase 9 from the intrinsic
pathway converge to activate caspases 3 and 7, which triggers morphological and biochemical
changes of apoptosis [107].
We used MTT viability assay to further investigate OGD-induced cell death and the protective
effects of SFN. Astrocyte viability increased under both OGD and normoxic conditions in the
presence of 2.5 µM of SFN. To distinguish between increase in viability as a result of
astrogliosis and decrease in astrocyte death, amount of DNA was quantified. Astrogliosis is the

63
increase in number of astrocytes after injury such as trauma, infection, ischemia, and stroke. The
increase in viability also could be due to reduction in astrocyte death, which would not increase
the number of astrocytes. The stable amount of DNA in all doses of SFN treatment suggests that
SFN does not increase astrocyte proliferation. This may be beneficial in the fetal brain as
inhibition of astrogliosis is reported having positive outcomes. Glial fibrillary acidic protein is an
intermediate protein important in activating astrocytes and thus astrogliosis. Mice deficient in
glial fibrillary acidic protein (GFAP-/-) exposed to prenatal hypoxic-ischemic episode had better
neuro-regeneration than wild type mice post day 4 after injury [108]. In addition, astrocytes are
also reported to limit regeneration of synapses and axons that help brain recovery after an injury
[109, 110]. The hypertrophy of astrocytic processes after injury may contribute to the inhibition
of CNS regeneration. The constant amount of DNA in astrocytes with all doses of SFN
demonstrates that the protective mechanism of SFN is not due to enhancing astrogliosis. It is also
interesting to note that SFN is able to increase cell viability compared to the control in normoxic
condition. The significant in increase in astrocyte viability suggests SFN’s protective role in
oxidative stress injuries.
Under normoxic conditions, up to 25 µM SFN did not have any effect on survival of neurons,
while it had positive/beneficial effects on survival of astrocytes. The absence of cytotoxic effects
of SFN from 0 to 25 µM suggests that SFN containing vegetable or SFN as a supplement is safe
for ingestion pregnant women. However, it is important to note the significant detrimental effect
of SFN at the high dose of 50 µM. During control/normoxic and OGD conditions, 50 µM of SFN
appears to be cytotoxic for both neurons and astrocytes. The significant increase in cell death is
demonstrated with trypan blue exclusion assay, increased LDH release, decreased cell viability,

64
and increase active caspase 3 and 7 activity. In fact the negative effects trend of SFN can already
be observed at doses of 25 µM although it is not significant at this dose.
SFN displays a biphasic dose response characterized by neuroprotection seen at low dosages but
cytotoxicity at high dosages (Figure 15). Cytotoxicity of SFN at higher dosages has been
observed in other studies. In primary hippocampal neurons, 24 hours of 2 and 5 µM of SFN
under normoxic condition significantly decreased cell death [85]. However, others have reported
that 10 and 100 µM of SFN treatment for 48 hours under normoxic conditions significantly
decreased rat striatal cell viability compared to no treatment [79]. Cytotoxic effects of SFN are
also observed in astrocytes. Danilov et al. found that when astrocytes were treated with 0.1, 0.5,
1.0, 5.0, and 10 µM SFN 48 hours prior to OGD, 5.0µM significantly decreased cell death.
However, 10 µM increased cell death compared to 5.0 µM when measured with propidium
iodide (PI) staining [91].
Figure 15 – Schematic representation of a biphasic response
50 µM of SFN is cytotoxic was shown to be cytotoxic for both neurons and astrocytes in our
study. In this context it is important to consider the pharmacokinetic properties including the
absorbance and clearance rates of SFN in biological systems. In this study, neurons and
Rep
onse
Dose
65
astrocytes are exposed for a finite amount of time to SFN, 25 and 28 hours, respectively.
However, in in vivo situations where animals and humans, the absorbance and excretion of SFN
ingest SFN need to be considered. Isothiocyanates (ITC) react with 1, 2-benzenedithiol
producing 1, 3-benzodithiole-2-thione which can be quantified. Because negligible amounts of
ITC itself are excreted unless humans consume cruciferous vegetables, quantification of 1, 3-
benezodithiole-2-thione is a reliable way to obtain information regarding isothiocyanates and
glucosinolates in vegetables. Human subjects who received 200 μmol of broccoli sprout reached
a peak concentration in plasma, serum and erythrocytes after 1 hour [111]. Similarly in rats, after
0.5 mg/kg of SFN oral administration, SFN concentration was found to peak at 1 hour.
Subsequently, concentration of SFN decreased steeply, by 90%, within 2 hours. Therefore, the
time of exposure in vivo would be less than in vitro experiments. In addition, higher dose of SFN
(50mg/kg) in rats resulted in decrease rate of absorption and bioavailability. At 0.5mg/kg of oral
SFN ingestion, bioavailability was 82% while at 50mg/kg of oral SFN ingestion, bioavailability
was 20% [112] . Thus, the detrimental effects of 50 μM of SFN would be less applicable in
humans with less time of exposure and decreased rate of absorption and bioavailability of SFN.
In conclusion, this study demonstrated the potential use of SFN to prevent CP in children as a
result of a hypoxic-ischemic episode in utero. We were able to reveal both positive and negative
effects of SFN on neurons and astrocytes in normoxic and simulated hypoxic-ischemic
conditions. Protective effects of SFN are mainly through the attenuation necrotic cell death,
while the cytotoxic effect found at higher dose may be through potentiation of apoptosis.
Although modulation of cell death through other pathways like autophagy by SFN remains to be
established, the four different assays used in this study provide an overview of mechanism of

66
protection. Overall cell death was assessed through trypan blue exclusion assay, necrosis was
assessed through MTT viability assay and LDH cytotoxicity assay, and apoptosis was assessed
through FAM-DEVD-FMK caspase 3 and 7 assay.

67
Chapter 5
Future Directions

68
5.0 Future Directions
5.1 Improvements for current study
5.1.1 Additional analysis of purity of neuronal and astrocyte cell cultures
In addition to using Western blot analysis to check for contamination in cell cultures (Figure 1),
we can also carry out immunocytochemical-staining analysis in future studies. Also,
contamination by other types of glial cells like microglia and oligodendrocytes should be
examined for both neuronal and astrocyte cultures. Glial fibrillary acidic protein (GFAP), ionized
calcium binding adaptor molecule (IBA 1), 2’3-cyclic nucleotide 3’-phosphodiesterase
(CNPase), and neuron nuclear antigen (NeuN) markers can be used for astrocytes, microglia,
oligodendrocytes, and neurons, respectively. This can be used to determine a more accurate
representation of the purity of our cell cultures. Our findings can also be quantified by the
determination of percent contamination by each brain cell types.
5.1.2 Alternative approaches to degassing glucose free DMEM
In this study, glucose free DMEM was degassed using a vacuum for one hour at room
temperature prior to its use for OGD. As an alternative, the medium can be placed in the hypoxia
chamber for 24 hours prior to OGD post 1 hour of degassing as described above. This approach
would allow for longer period of degassing and also for the medium to be maintained at 37 ºC.
Additionally, the dissolved oxygen level in the medium can be evaluated using optical sensor.
TheSensorDish reader is a device that is able to read oxygen levels in the medium from the
fluorescent metal complex located on the bottom of each well that is sensitive to oxygen levels
[113].

69
5.1.3 Alternative approaches to harvesting cells
Neurons and astrocytes are plated in wells and flasks that are coated with poly-D-lysine (PDL).
The PDL coating facilitates cell attachment, growth, survival, and morphology by providing
more sites for cell binding [114]. As a result, using trypsin, which is normally used to facilitate
cell detachment from wells, is not as effective. In addition, trypsin can lead to cell damage as
well. To harvest cells, cell scrapers were used to gently remove cells from the wells. Although
this was effective, using mechanical methods could potentially have damaged the cells in the
process. Since assessment of cell death was prominent importance in this study, any method that
could lead to increased cell death should be avoided. Accutase™ is a possible alternative to using
trypsin and cell scrapper. It is added to wells for 5 to 10 minutes at room temperature and allows
cells to be detached with minimal damage.
5.1.4 Optimization of FAM FLICA caspase 3 & 7 detection
Generally, trypan blue, LDH cytotoxicity assay, and MTT assay showed congruent significant
results. Although similar trends are found with FAM FLICA, the results are not significant. For
example, decrease in active caspase 3 & 7 activities can be observed in neurons exposed to OGD
with 1, 2, 2.5 µM of SFN (Figure 14A). However, these reductions were not significant to the
0µM. Additional optimization and experiments are required.
5.2 Prospective Studies
5.2.1 Protective effects of SFN on other glial cells
This study examines neurons and astrocytes in separate cultures. Although neurons and
astrocytes comprise the majority of cell types in the brain, it is important to study the effects of
OGD and/or SFN on other glial cells such as oligodendrocytes and microglia. Oligodendrocytes
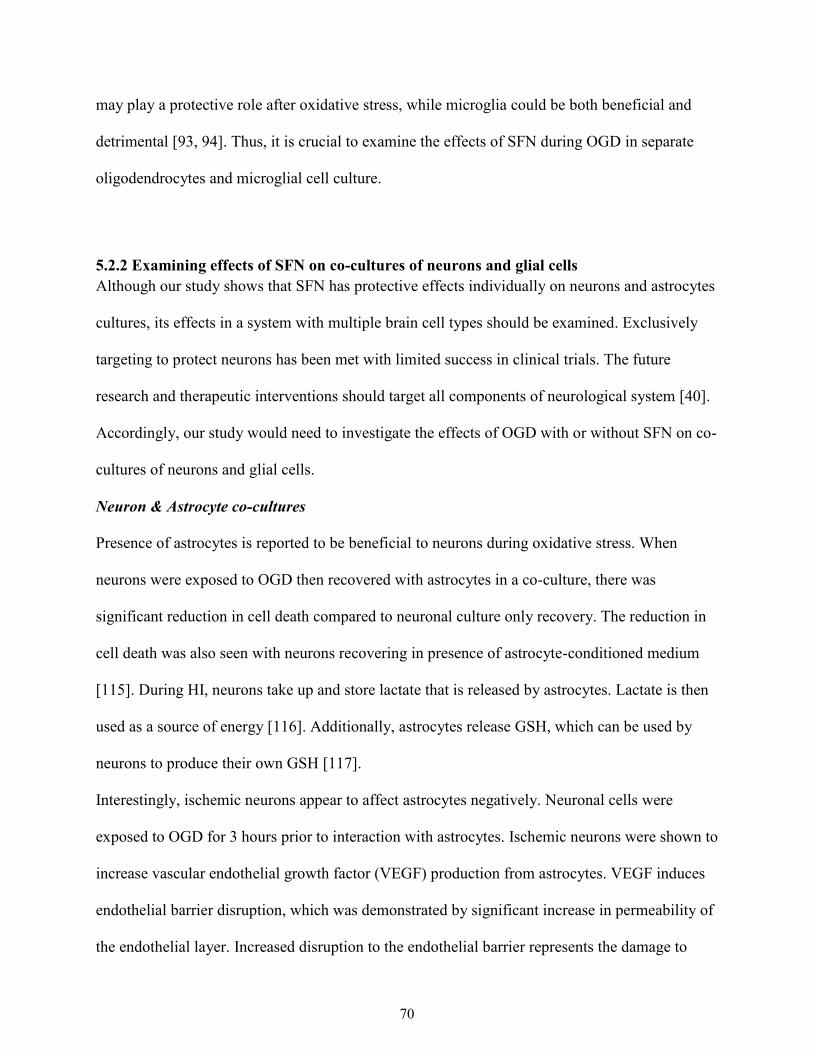
70
may play a protective role after oxidative stress, while microglia could be both beneficial and
detrimental [93, 94]. Thus, it is crucial to examine the effects of SFN during OGD in separate
oligodendrocytes and microglial cell culture.
5.2.2 Examining effects of SFN on co-cultures of neurons and glial cells
Although our study shows that SFN has protective effects individually on neurons and astrocytes
cultures, its effects in a system with multiple brain cell types should be examined. Exclusively
targeting to protect neurons has been met with limited success in clinical trials. The future
research and therapeutic interventions should target all components of neurological system [40].
Accordingly, our study would need to investigate the effects of OGD with or without SFN on co-
cultures of neurons and glial cells.
Neuron & Astrocyte co-cultures
Presence of astrocytes is reported to be beneficial to neurons during oxidative stress. When
neurons were exposed to OGD then recovered with astrocytes in a co-culture, there was
significant reduction in cell death compared to neuronal culture only recovery. The reduction in
cell death was also seen with neurons recovering in presence of astrocyte-conditioned medium
[115]. During HI, neurons take up and store lactate that is released by astrocytes. Lactate is then
used as a source of energy [116]. Additionally, astrocytes release GSH, which can be used by
neurons to produce their own GSH [117].
Interestingly, ischemic neurons appear to affect astrocytes negatively. Neuronal cells were
exposed to OGD for 3 hours prior to interaction with astrocytes. Ischemic neurons were shown to
increase vascular endothelial growth factor (VEGF) production from astrocytes. VEGF induces
endothelial barrier disruption, which was demonstrated by significant increase in permeability of
the endothelial layer. Increased disruption to the endothelial barrier represents the damage to

71
BBB after ischemic stroke [118]. Due to the complex and dynamic nature to brain cell
interaction, future studies of SFN in co-cultures will be beneficial.
5.2.3 The effects of SFN on Autophagy
SFN also has been shown to be involved in autophagy in addition to necrosis and apoptosis.
Autophagy is a process that degrades damaged and misfolded proteins and cellular proteins
through lysosomes. SFN is reported to induce autophagy by activating AMP-activated protein
kinase (AMPK). AMPK activates tuberous sclerosis complex 1/2 (TSC1/2), which in turn blocks
a negative regulator of autophagy, mammalian target of rapamycin (mTOR). By indirectly
blocking mTOR, SFN induces autophagy. SFN increases AMPK activity by increasing
phosphorylation of AMPK. SFN’s ability to induce autophagy has been demonstrated by
increasing levels of LC3-II and p62, proteins of autophagy, with SFN treatment. The role of
autophagy is unclear as it may trigger apoptosis to worsen brain injury, but clearance cellular
debris can be neuroprotective [119].
In addition to AMPK pathway, SFN may increase levels of LC3-II through extracellular signal-
regulated kinase (ERK) activation in neuronal cells. When immortalized mouse cortical cells
were treated with SFN, LC3-II levels rose after 24 hours. LC3-II levels increased as a result of
increase in phosphorylation of a mitogen-activated protein kinase (MAPKs), ERK1/2. When
mitogen protein kinase (MEK) inhibitors were used before SFN treatment, MEK inhibitors
blocked the increase in LC3-II levels and phosphorylation of ERK1/2 [120]. From the results of
these findings, SFN’s effects on autophagic players in neuronal and/or astrocyte cultures after
exposure to OGD can be studied in the future.

72
5.2.4 Clinical implications and conclusions
From the results of the study, SFN, which is found in broccoli and other cruciferous vegetables,
seem to be protective against oxidative stress. However, the use of commercially available
broccoli may not be able to provide the necessary benefits to mothers. The active enzyme in
broccoli and broccoli sprouts is myrosinase. Myrosinase converts glucosinolate glucoraphanin
into sulforaphane. However, during a common blanching process for frozen vegetable processing
in order to increase shelf-live, 90% of the enzyme is degraded [121]. Using ingestion of fresh
BrSps on the other hand shows clinical potential. 12 healthy subjects with 1-week intake of
100g/day of BrSps were shown to have decreased oxidative stress makers. Subjects had
decreased amounts of phopshatidylcholinehydroperoxide (PCOOH), an indicator of lipid
oxidation and organ damage, and increased amounts of CoQ10H2, which is an antioxidant [122].
However, because BrSps contain other isothiocyanates, direct correlation between SFN and
neuroprotection cannot be assumed [77].

73
Chapter 6
Bibliography
1. Bax, M., et al., Proposed definition and classification of cerebral palsy, April 2005. Dev
Med Child Neurol, 2005. 47(8): p. 571-6.
2. Economic costs associated with mental retardation, cerebral palsy, hearing loss, and
vision impairment--United States, 2003. MMWR Morb Mortal Wkly Rep, 2004. 53(3): p.
57-9.
3. Kruse, M., et al., Lifetime costs of cerebral palsy. Dev Med Child Neurol, 2009. 51(8): p.
622-8.
4. Litt, J., et al., Learning disabilities in children with very low birthweight: prevalence,
neuropsychological correlates, and educational interventions. J Learn Disabil, 2005.
38(2): p. 130-41.
5. Hack, M., et al., Chronic conditions, functional limitations, and special health care needs
of school-aged children born with extremely low-birth-weight in the 1990s. JAMA, 2005.
294(3): p. 318-25.
6. Goldenberg, R.L. and J.F. Culhane, Low birth weight in the United States. Am J Clin
Nutr, 2007. 85(2): p. 584s-590s.
7. Madigan, S., et al., Birth Weight Variability and Language Development: Risk,
Resilience, and Responsive Parenting. J Pediatr Psychol, 2015.
8. Surman, G., et al., Children with cerebral palsy: severity and trends over time. Paediatr
Perinat Epidemiol, 2009. 23(6): p. 513-21.
9. Blair, E. and L. Watson, Epidemiology of cerebral palsy. Semin Fetal Neonatal Med,
2006. 11(2): p. 117-25.
10. Robertson, C.M., M.J. Watt, and Y. Yasui, Changes in the prevalence of cerebral palsy
for children born very prematurely within a population-based program over 30 years.
Jama, 2007. 297(24): p. 2733-40.
11. Prechtl, H.F., et al., An early marker for neurological deficits after perinatal brain
lesions. Lancet, 1997. 349(9062): p. 1361-3.
12. Campbell, S.K. and D. Hedeker, Validity of the Test of Infant Motor Performance for
discriminating among infants with varying risk for poor motor outcome. J Pediatr, 2001.
139(4): p. 546-51.
13. Richards, C.L. and F. Malouin, Cerebral palsy: definition, assessment and rehabilitation.
Handb Clin Neurol, 2013. 111: p. 183-95.
14. Vandermeeren, Y., et al., Functional reorganization of brain in children affected with
congenital hemiplegia: fMRI study. Neuroimage, 2003. 20(1): p. 289-301.
15. Arnfield, E., A. Guzzetta, and R. Boyd, Relationship between brain structure on
magnetic resonance imaging and motor outcomes in children with cerebral palsy: a
systematic review. Res Dev Disabil, 2013. 34(7): p. 2234-50.
16. Hidecker, M.J., et al., Inter-relationships of functional status in cerebral palsy: analyzing
gross motor function, manual ability, and communication function classification systems
in children. Dev Med Child Neurol, 2012. 54(8): p. 737-42.
17. Russell, D.J., et al., Improved scaling of the gross motor function measure for children
with cerebral palsy: evidence of reliability and validity. Phys Ther, 2000. 80(9): p. 873-
85.

74
18. Johnston, M.V. and A.H. Hoon, Jr., Cerebral palsy. Neuromolecular Med, 2006. 8(4): p.
435-50.
19. Shevell, M.I., A 'global' approach to global developmental delay and intellectual
disability? Dev Med Child Neurol, 2011. 53(2): p. 105-6.
20. Ofek-Shlomai, N. and I. Berger, Inflammatory injury to the neonatal brain - what can we
do? Front Pediatr, 2014. 2: p. 30.
21. Lou, H.C., Hypoxic-hemodynamic pathogenesis of brain lesions in the newborn. Brain
Dev, 1994. 16(6): p. 423-31.
22. Salmaso, N., S. Tomasi, and F.M. Vaccarino, Neurogenesis and maturation in neonatal
brain injury. Clin Perinatol, 2014. 41(1): p. 229-39.
23. Nelson, K.B., The epidemiology of cerebral palsy in term infants. Ment Retard Dev
Disabil Res Rev, 2002. 8(3): p. 146-50.
24. Lehman, L.L. and M.J. Rivkin, Perinatal Arterial Ischemic Stroke: Presentation, Risk
Factors, Evaluation, and Outcome. Pediatr Neurol, 2014. 51(6): p. 760-768.
25. Lee, J., et al., Maternal and infant characteristics associated with perinatal arterial
stroke in the infant. JAMA, 2005. 293(6): p. 723-9.
26. Fernandez-Lopez, D., et al., Mechanisms of perinatal arterial ischemic stroke. J Cereb
Blood Flow Metab, 2014. 34(6): p. 921-32.
27. Perlman, J.M., Interruption of placental blood flow during labor: potential systemic and
cerebral organ consequences. J Pediatr, 2011. 158(2 Suppl): p. e1-4.
28. Prior, T. and S. Kumar, Expert review - identification of intra-partum fetal compromise.
Eur J Obstet Gynecol Reprod Biol, 2015. 190: p. 1-6.
29. Johnston, M.V. and A.H. Hoon, Jr., Possible mechanisms in infants for selective basal
ganglia damage from asphyxia, kernicterus, or mitochondrial encephalopathies. J Child
Neurol, 2000. 15(9): p. 588-91.
30. Girard, S., et al., Role of perinatal inflammation in cerebral palsy. Pediatr Neurol, 2009.
40(3): p. 168-74.
31. Marret, S., C. Vanhulle, and A. Laquerriere, Pathophysiology of cerebral palsy. Handb
Clin Neurol, 2013. 111: p. 169-76.
32. Mukherjee, S., H. Gangopadhyay, and D.K. Das, Broccoli: a unique vegetable that
protects mammalian hearts through the redox cycling of the thioredoxin superfamily. J
Agric Food Chem, 2008. 56(2): p. 609-17.
33. Arpino, C., et al., Brain damage in preterm infants: etiological pathways. Ann Ist Super
Sanita, 2005. 41(2): p. 229-37.
34. Hemminki, K., et al., High familial risks for cerebral palsy implicate partial heritable
aetiology. Paediatr Perinat Epidemiol, 2007. 21(3): p. 235-41.
35. Ziakas, P.D., et al., Thrombophilia and venous thromboembolism in pregnancy: a meta-
analysis of genetic risk. Eur J Obstet Gynecol Reprod Biol, 2015. 191: p. 106-11.
36. Nelson, K.B., Causative factors in cerebral palsy. Clin Obstet Gynecol, 2008. 51(4): p.
749-62.
37. Bremme, K.A., Haemostatic changes in pregnancy. Best Pract Res Clin Haematol, 2003.
16(2): p. 153-68.
38. Uria-Avellanal, C. and N.J. Robertson, Na(+)/H(+) exchangers and intracellular pH in
perinatal brain injury. Transl Stroke Res, 2014. 5(1): p. 79-98.
75
39. Gluckman, P.D., C.S. Pinal, and A.J. Gunn, Hypoxic-ischemic brain injury in the
newborn: pathophysiology and potential strategies for intervention. Semin Neonatol,
2001. 6(2): p. 109-20.
40. Alfieri, A., et al., Targeting the Nrf2-Keap1 antioxidant defence pathway for
neurovascular protection in stroke. J Physiol, 2011. 589(Pt 17): p. 4125-36.
41. Chew, L.J., A. Takanohashi, and M. Bell, Microglia and inflammation: impact on
developmental brain injuries. Ment Retard Dev Disabil Res Rev, 2006. 12(2): p. 105-12.
42. Wixey, J.A., et al., Efficacy of post-insult minocycline administration to alter long-term
hypoxia-ischemia-induced damage to the serotonergic system in the immature rat brain.
Neuroscience, 2011. 182: p. 184-92.
43. Zhao, B.Q., et al., Role of matrix metalloproteinases in delayed cortical responses after
stroke. Nat Med, 2006. 12(4): p. 441-5.
44. Babior, B.M., Phagocytes and oxidative stress. Am J Med, 2000. 109(1): p. 33-44.
45. Hong, Y., et al., The role of Nrf2 signaling in the regulation of antioxidants and
detoxifying enzymes after traumatic brain injury in rats and mice. Acta Pharmacol Sin,
2010. 31(11): p. 1421-30.
46. Innamorato, N.G., et al., The transcription factor Nrf2 is a therapeutic target against
brain inflammation. J Immunol, 2008. 181(1): p. 680-9.
47. Hall, E.D., R.A. Vaishnav, and A.G. Mustafa, Antioxidant therapies for traumatic brain
injury. Neurotherapeutics, 2010. 7(1): p. 51-61.
48. Artaud-Macari, E., et al., Nuclear factor erythroid 2-related factor 2 nuclear
translocation induces myofibroblastic dedifferentiation in idiopathic pulmonary fibrosis.
Antioxid Redox Signal, 2013. 18(1): p. 66-79.
49. Vaishnav, R.A., et al., Lipid peroxidation-derived reactive aldehydes directly and
differentially impair spinal cord and brain mitochondrial function. J Neurotrauma, 2010.
27(7): p. 1311-20.
50. Miller, D.M., et al., Administration of the Nrf2-ARE activators sulforaphane and
carnosic acid attenuates 4-hydroxy-2-nonenal-induced mitochondrial dysfunction ex
vivo. Free Radic Biol Med, 2013. 57: p. 1-9.
51. Rouse, D.J. and K.J. Gibbins, Magnesium sulfate for cerebral palsy prevention. Semin
Perinatol, 2013. 37(6): p. 414-6.
52. Chollat, C., et al., School-age outcomes following a randomized controlled trial of
magnesium sulfate for neuroprotection of preterm infants. J Pediatr, 2014. 165(2): p. 398-
400.e3.
53. Bachnas, M.A., et al., Influence of antenatal magnesium sulfate application on cord
blood levels of brain-derived neurotrophic factor in premature infants. J Perinat Med,
2014. 42(1): p. 129-34.
54. Ikonomidou, C., et al., Blockade of NMDA receptors and apoptotic neurodegeneration in
the developing brain. Science, 1999. 283(5398): p. 70-4.
55. Fredriksson, A., et al., Neurofunctional deficits and potentiated apoptosis by neonatal
NMDA antagonist administration. Behav Brain Res, 2004. 153(2): p. 367-76.
56. Meldrum, B.S., Update on the mechanism of action of antiepileptic drugs. Epilepsia,
1996. 37 Suppl 6: p. S4-11.
57. Bittigau, P., M. Sifringer, and C. Ikonomidou, Antiepileptic drugs and apoptosis in the
developing brain. Ann N Y Acad Sci, 2003. 993: p. 103-14; discussion 123-4.

76
58. Lachmann, P.J., The penumbra of thalidomide, the litigation culture and the licensing of
pharmaceuticals. Qjm, 2012. 105(12): p. 1179-89.
59. Peltoniemi, O.M., et al., Randomised trial of early neonatal hydrocortisone demonstrates
potential undesired effects on neurodevelopment at preschool age. Acta Paediatr, 2015.
60. Zia, M.T., et al., Postnatal glucocorticoid-induced hypomyelination, gliosis, and
neurologic deficits are dose-dependent, preparation-specific, and reversible. Exp Neurol,
2015. 263: p. 200-13.
61. Smith, A., S. Jogalekar, and A. Gibson, Regulation of natural health products in Canada.
J Ethnopharmacol, 2014. 158 Pt B: p. 507-10.
62. Gaffney, L. and C.A. Smith, Use of complementary therapies in pregnancy: the
perceptions of obstetricians and midwives in South Australia. Aust N Z J Obstet
Gynaecol, 2004. 44(1): p. 24-9.
63. Moran, M.S., et al., A prospective, multicenter study of complementary/alternative
medicine (CAM) utilization during definitive radiation for breast cancer. Int J Radiat
Oncol Biol Phys, 2013. 85(1): p. 40-6.
64. Hall, H.R. and K. Jolly, Women's use of complementary and alternative medicines during
pregnancy: a cross-sectional study. Midwifery, 2014. 30(5): p. 499-505.
65. Kalder, M., et al., Use of complementary and alternative medicine during pregnancy and
delivery. Arch Gynecol Obstet, 2011. 283(3): p. 475-82.
66. Clarke, J.D., et al., Metabolism and tissue distribution of sulforaphane in Nrf2 knockout
and wild-type mice. Pharm Res, 2011. 28(12): p. 3171-9.
67. Noyan-Ashraf, M.H., Z. Sadeghinejad, and B.H. Juurlink, Dietary approach to decrease
aging-related CNS inflammation. Nutr Neurosci, 2005. 8(2): p. 101-10.
68. Sayed, R.H., et al., Sulforaphane increases the survival rate in rats with fulminant
hepatic failure induced by d-galactosamine and lipopolysaccharide. Nutr Res, 2014.
34(11): p. 982-9.
69. Wu, L., et al., Dietary approach to attenuate oxidative stress, hypertension, and
inflammation in the cardiovascular system. Proc Natl Acad Sci U S A, 2004. 101(18): p.
7094-9.
70. Chen, G., et al., Role of the Nrf2-ARE pathway in early brain injury after experimental
subarachnoid hemorrhage. J Neurosci Res, 2011. 89(4): p. 515-23.
71. Magesh, S., Y. Chen, and L. Hu, Small molecule modulators of Keap1-Nrf2-ARE
pathway as potential preventive and therapeutic agents. Med Res Rev, 2012. 32(4): p.
687-726.
72. Kensler, T.W., N. Wakabayashi, and S. Biswal, Cell survival responses to environmental
stresses via the Keap1-Nrf2-ARE pathway. Annu Rev Pharmacol Toxicol, 2007. 47: p.
89-116.
73. Brandenburg, L.O., et al., Sulforaphane suppresses LPS-induced inflammation in primary
rat microglia. Inflamm Res, 2010. 59(6): p. 443-50.
74. Zhao, J., et al., Enhancing expression of Nrf2-driven genes protects the blood brain
barrier after brain injury. J Neurosci, 2007. 27(38): p. 10240-8.
75. Greco, T. and G. Fiskum, Brain mitochondria from rats treated with sulforaphane are
resistant to redox-regulated permeability transition. J Bioenerg Biomembr, 2010. 42(6):
p. 491-7.
76. Ouyang, Y.B. and R.G. Giffard, Changes in astrocyte mitochondrial function with stress:
effects of Bcl-2 family proteins. Neurochem Int, 2004. 45(2-3): p. 371-9.
77
77. Angeloni, C., et al., Modulation of phase II enzymes by sulforaphane: implications for its
cardioprotective potential. J Agric Food Chem, 2009. 57(12): p. 5615-22.
78. Barbagallo, I., et al., Potential therapeutic effects of natural heme oxygenase-1 inducers
in cardiovascular diseases. Antioxid Redox Signal, 2013. 18(5): p. 507-21.
79. Mizuno, K., et al., Glutathione biosynthesis via activation of the nuclear factor E2-
related factor 2 (Nrf2)--antioxidant-response element (ARE) pathway is essential for
neuroprotective effects of sulforaphane and 6-(methylsulfinyl) hexyl isothiocyanate. J
Pharmacol Sci, 2011. 115(3): p. 320-8.
80. Gozzelino, R., V. Jeney, and M.P. Soares, Mechanisms of cell protection by heme
oxygenase-1. Annu Rev Pharmacol Toxicol, 2010. 50: p. 323-54.
81. Chen, K., K. Gunter, and M.D. Maines, Neurons overexpressing heme oxygenase-1 resist
oxidative stress-mediated cell death. J Neurochem, 2000. 75(1): p. 304-13.
82. Chi, X., et al., Sulforaphane reduces apoptosis and oncosis along with protecting liver
injury-induced ischemic reperfusion by activating the Nrf2/ARE pathway. Hepatol Int,
2015. 9(2): p. 321-9.
83. Pan, H., et al., Sulforaphane protects rodent retinas against ischemia-reperfusion injury
through the activation of the Nrf2/HO-1 antioxidant pathway. PLoS One, 2014. 9(12): p.
e114186.
84. Li, B., et al., Sulforaphane prevents doxorubicin-induced oxidative stress and cell death
in rat H9c2 cells. Int J Mol Med, 2015. 36(1): p. 53-64.
85. Soane, L., et al., Sulforaphane protects immature hippocampal neurons against death
caused by exposure to hemin or to oxygen and glucose deprivation. J Neurosci Res, 2010.
88(6): p. 1355-63.
86. Wu, X., et al., Sulforaphane protects primary cultures of cortical neurons against injury
induced by oxygen-glucose deprivation/reoxygenation via antiapoptosis. Neurosci Bull,
2012. 28(5): p. 509-16.
87. Ping, Z., et al., Sulforaphane protects brains against hypoxic-ischemic injury through
induction of Nrf2-dependent phase 2 enzyme. Brain Res, 2010. 1343: p. 178-85.
88. Teo, J.D., M.J. Morris, and N.M. Jones, Hypoxic postconditioning reduces microglial
activation, astrocyte and caspase activity, and inflammatory markers after hypoxia-
ischemia in the neonatal rat brain. Pediatr Res, 2015. 77(6): p. 757-64.
89. Kraft, A.D., D.A. Johnson, and J.A. Johnson, Nuclear factor E2-related factor 2-
dependent antioxidant response element activation by tert-butylhydroquinone and
sulforaphane occurring preferentially in astrocytes conditions neurons against oxidative
insult. J Neurosci, 2004. 24(5): p. 1101-12.
90. Vargas, M.R. and J.A. Johnson, The Nrf2-ARE cytoprotective pathway in astrocytes.
Expert Rev Mol Med, 2009. 11: p. e17.
91. Danilov, C.A., et al., Sulforaphane protects astrocytes against oxidative stress and
delayed death caused by oxygen and glucose deprivation. Glia, 2009. 57(6): p. 645-56.
92. Bergstrom, P., et al., Repeated transient sulforaphane stimulation in astrocytes leads to
prolonged Nrf2-mediated gene expression and protection from superoxide-induced
damage. Neuropharmacology, 2011. 60(2-3): p. 343-53.
93. Yang, L.P., X.A. Zhu, and M.O. Tso, Minocycline and sulforaphane inhibited
lipopolysaccharide-mediated retinal microglial activation. Mol Vis, 2007. 13: p. 1083-
93.

78
94. Zhao, X., et al., Neuroprotective role of haptoglobin after intracerebral hemorrhage. J
Neurosci, 2009. 29(50): p. 15819-27.
95. Snider, B.J., et al., Conditioning heat stress reduces excitotoxic and apoptotic
components of oxygen-glucose deprivation-induced neuronal death in vitro. J
Neurochem, 1998. 70(1): p. 120-9.
96. Wie, M.B., et al., Phenidone attenuates oxygen/glucose deprivation-induced
neurotoxicity by antioxidant and antiapoptotic action in mouse cortical cultures.
Neurosci Lett, 1999. 272(2): p. 91-4.
97. Juurlink, B.H., L. Hertz, and J.Y. Yager, Astrocyte maturation and susceptibility to
ischaemia or substrate deprivation. Neuroreport, 1992. 3(12): p. 1135-7.
98. Wiesinger, H., B. Hamprecht, and R. Dringen, Metabolic pathways for glucose in
astrocytes. Glia, 1997. 21(1): p. 22-34.
99. Wiesinger, H., U. Thiess, and B. Hamprecht, Sorbitol pathway activity and utilization of
polyols in astroglia-rich primary cultures. Glia, 1990. 3(4): p. 277-82.
100. Giordano, G., et al., Measurements of cell death in neuronal and glial cells. Methods Mol
Biol, 2011. 758: p. 171-8.
101. Hayon, T., et al., Appraisal of the MTT-based assay as a useful tool for predicting drug
chemosensitivity in leukemia. Leuk Lymphoma, 2003. 44(11): p. 1957-62.
102. Pekny, M. and M. Pekna, Astrocyte reactivity and reactive astrogliosis: costs and
benefits. Physiol Rev, 2014. 94(4): p. 1077-98.
103. Kim, Y.J., et al., Neuroprotective effects of L-carnitine against oxygen-glucose
deprivation in rat primary cortical neurons. Korean J Pediatr, 2012. 55(7): p. 238-48.
104. Zhou, Y., et al., Sulfiredoxin-1 exerts anti-apoptotic and neuroprotective effects against
oxidative stress-induced injury in rat cortical astrocytes following exposure to oxygen-
glucose deprivation and hydrogen peroxide. Int J Mol Med, 2015. 36(1): p. 43-52.
105. Fernandez-Fernandez, S., A. Almeida, and J.P. Bolanos, Antioxidant and bioenergetic
coupling between neurons and astrocytes. Biochem J, 2012. 443(1): p. 3-11.
106. Elmore, S., Apoptosis: a review of programmed cell death. Toxicol Pathol, 2007. 35(4):
p. 495-516.
107. Moffitt, K.L., S.L. Martin, and B. Walker, From sentencing to execution--the processes
of apoptosis. J Pharm Pharmacol, 2010. 62(5): p. 547-62.
108. Jarlestedt, K., et al., Attenuation of reactive gliosis does not affect infarct volume in
neonatal hypoxic-ischemic brain injury in mice. PLoS One, 2010. 5(4): p. e10397.
109. Wilhelmsson, U., et al., Absence of glial fibrillary acidic protein and vimentin prevents
hypertrophy of astrocytic processes and improves post-traumatic regeneration. J
Neurosci, 2004. 24(21): p. 5016-21.
110. Wang, X., et al., Axonal regeneration induced by blockade of glial inhibitors coupled
with activation of intrinsic neuronal growth pathways. Exp Neurol, 2012. 237(1): p. 55-
69.
111. Ye, L., et al., Quantitative determination of dithiocarbamates in human plasma, serum,
erythrocytes and urine: pharmacokinetics of broccoli sprout isothiocyanates in humans.
Clin Chim Acta, 2002. 316(1-2): p. 43-53.
112. Hanlon, N., et al., Absolute bioavailability and dose-dependent pharmacokinetic
behaviour of dietary doses of the chemopreventive isothiocyanate sulforaphane in rat. Br
J Nutr, 2008. 99(3): p. 559-64.

79
113. Naciri, M., D. Kuystermans, and M. Al-Rubeai, Monitoring pH and dissolved oxygen in
mammalian cell culture using optical sensors. Cytotechnology, 2008. 57(3): p. 245-50.
114. Kim, Y.H., et al., Enhancement of neuronal cell adhesion by covalent binding of poly-D-
lysine. J Neurosci Methods, 2011. 202(1): p. 38-44.
115. Griffin, S., J.B. Clark, and L. Canevari, Astrocyte-neurone communication following
oxygen-glucose deprivation. J Neurochem, 2005. 95(4): p. 1015-22.
116. Gao, C., et al., Monocarboxylate transporter-dependent mechanism confers resistance to
oxygen- and glucose-deprivation injury in astrocyte-neuron co-cultures. Neurosci Lett,
2015. 594: p. 99-104.
117. Wang, X.F. and M.S. Cynader, Astrocytes provide cysteine to neurons by releasing
glutathione. J Neurochem, 2000. 74(4): p. 1434-42.
118. Li, Y.N., et al., Ischemic neurons activate astrocytes to disrupt endothelial barrier via
increasing VEGF expression. J Neurochem, 2014. 129(1): p. 120-9.
119. Lee, J.H., J.K. Jeong, and S.Y. Park, Sulforaphane-induced autophagy flux prevents
prion protein-mediated neurotoxicity through AMPK pathway. Neuroscience, 2014. 278:
p. 31-9.
120. Jo, C., et al., Sulforaphane induces autophagy through ERK activation in neuronal cells.
FEBS Lett, 2014. 588(17): p. 3081-8.
121. Dosz, E.B. and E.H. Jeffery, Commercially produced frozen broccoli lacks the ability to
form sulforaphane. Journal of Functional Foods, 2013. 5(2): p. 987-990.
122. Murashima, M., et al., Phase 1 study of multiple biomarkers for metabolism and oxidative
stress after one-week intake of broccoli sprouts. Biofactors, 2004. 22(1-4): p. 271-5.

80
Appendix
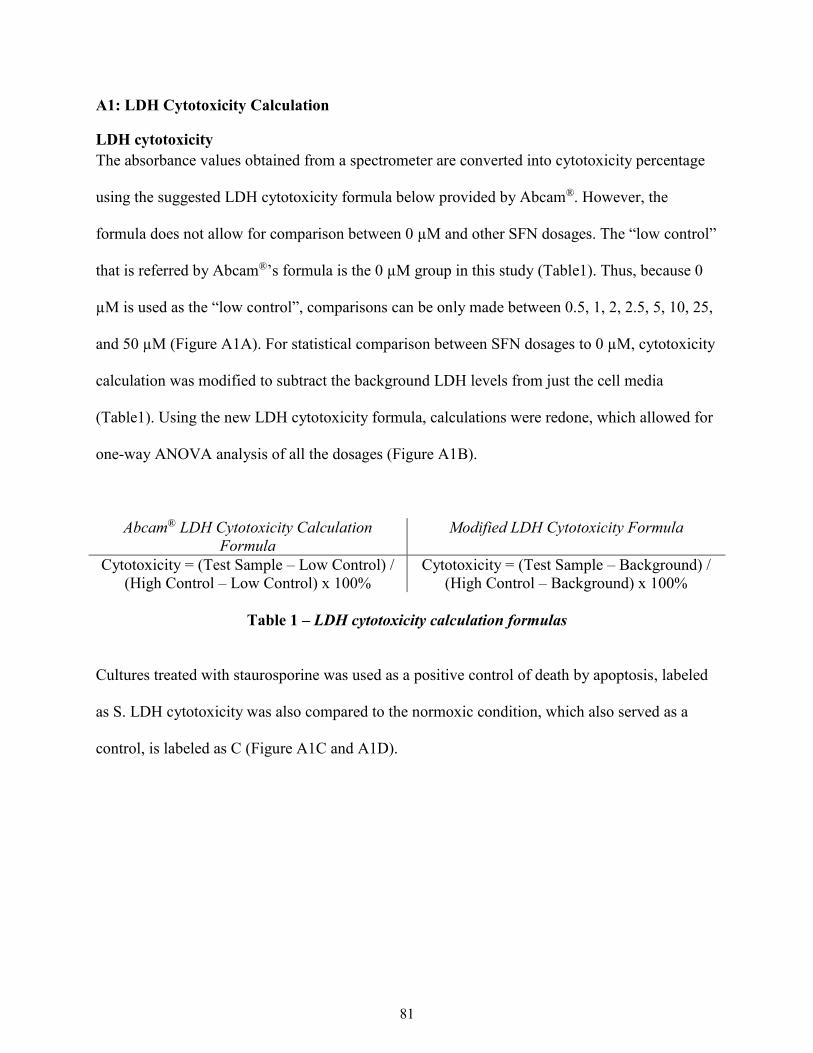
81
A1: LDH Cytotoxicity Calculation
LDH cytotoxicity
The absorbance values obtained from a spectrometer are converted into cytotoxicity percentage
using the suggested LDH cytotoxicity formula below provided by Abcam®. However, the
formula does not allow for comparison between 0 µM and other SFN dosages. The “low control”
that is referred by Abcam®’s formula is the 0 µM group in this study (Table1). Thus, because 0
µM is used as the “low control”, comparisons can be only made between 0.5, 1, 2, 2.5, 5, 10, 25,
and 50 µM (Figure A1A). For statistical comparison between SFN dosages to 0 µM, cytotoxicity
calculation was modified to subtract the background LDH levels from just the cell media
(Table1). Using the new LDH cytotoxicity formula, calculations were redone, which allowed for
one-way ANOVA analysis of all the dosages (Figure A1B).
Abcam® LDH Cytotoxicity Calculation
Formula
Modified LDH Cytotoxicity Formula
Cytotoxicity = (Test Sample – Low Control) /
(High Control – Low Control) x 100%
Cytotoxicity = (Test Sample – Background) /
(High Control – Background) x 100%
Table 1 – LDH cytotoxicity calculation formulas
Cultures treated with staurosporine was used as a positive control of death by apoptosis, labeled
as S. LDH cytotoxicity was also compared to the normoxic condition, which also served as a
control, is labeled as C (Figure A1C and A1D).
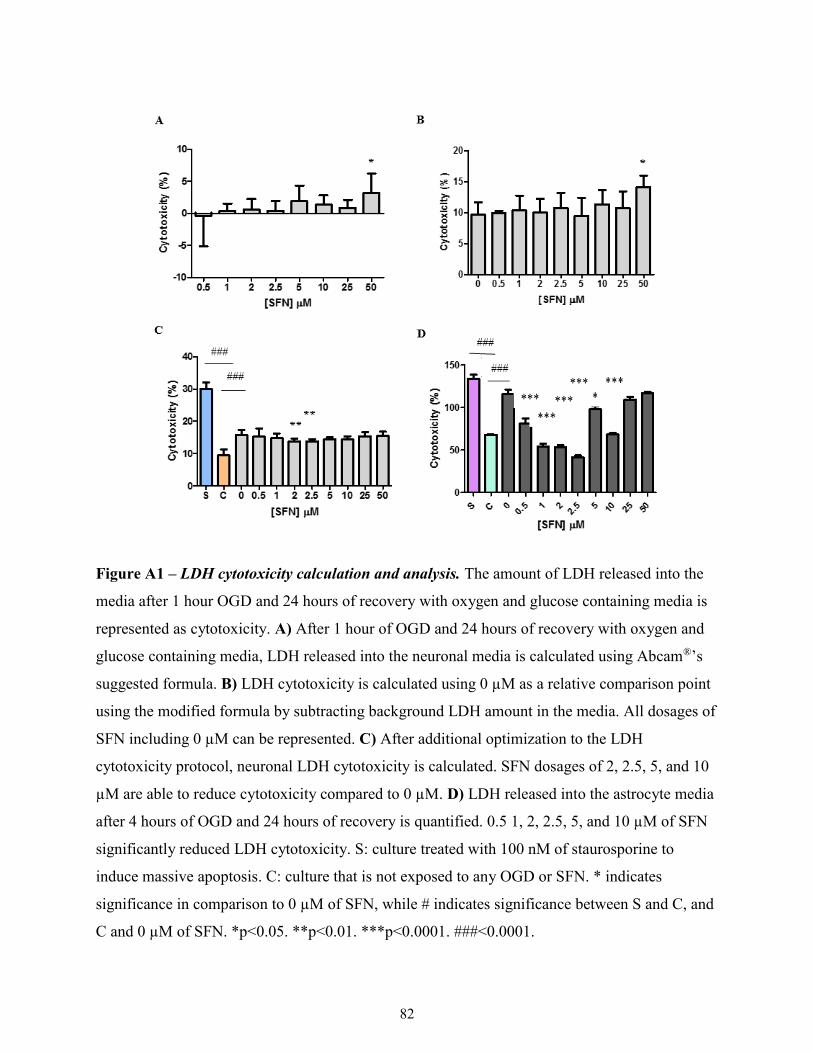
82
Figure A1 – LDH cytotoxicity calculation and analysis. The amount of LDH released into the
media after 1 hour OGD and 24 hours of recovery with oxygen and glucose containing media is
represented as cytotoxicity. A) After 1 hour of OGD and 24 hours of recovery with oxygen and
glucose containing media, LDH released into the neuronal media is calculated using Abcam®’s
suggested formula. B) LDH cytotoxicity is calculated using 0 µM as a relative comparison point
using the modified formula by subtracting background LDH amount in the media. All dosages of
SFN including 0 µM can be represented. C) After additional optimization to the LDH
cytotoxicity protocol, neuronal LDH cytotoxicity is calculated. SFN dosages of 2, 2.5, 5, and 10
µM are able to reduce cytotoxicity compared to 0 µM. D) LDH released into the astrocyte media
after 4 hours of OGD and 24 hours of recovery is quantified. 0.5 1, 2, 2.5, 5, and 10 µM of SFN
significantly reduced LDH cytotoxicity. S: culture treated with 100 nM of staurosporine to
induce massive apoptosis. C: culture that is not exposed to any OGD or SFN. * indicates
significance in comparison to 0 µM of SFN, while # indicates significance between S and C, and
C and 0 µM of SFN. *p<0.05. **p<0.01. ***p<0.0001. ###<0.0001.
83
A2: Control group requires separate incubator from the hypoxia chamber.
In our initial studies, when neuronal cells were treated with SFN under normoxic condition, we
noted unusually high levels (approximately 50%) of cell death (Figure A2A). Querying this
anomaly, we discovered that this might be because we were culturing our normoxic controls in
the same incubator that housed the hypoxia chamber, which was inadvertently affecting the
oxygen levels in the incubator. Since the hypoxia chamber is not completely sealed, there was
leakage of nitrogen from this chamber to the surrounding incubator, which effectively decreased
the oxygen level within the incubator as oxygen was being replaced, by nitrogen. This resulted in
abnormal levels of cell death in the control group Neurons. To confirm that this was indeed the
case, we compared cell death of neurons growing in the incubator containing the hypoxia
chamber with cells growing in a separate incubator. Neuronal cell death was evaluated to be 20-
25% when placed in a separate incubator compared to 50% for the neurons being cultured in the
incubator containing the hypoxia chamber (Figure A2B).
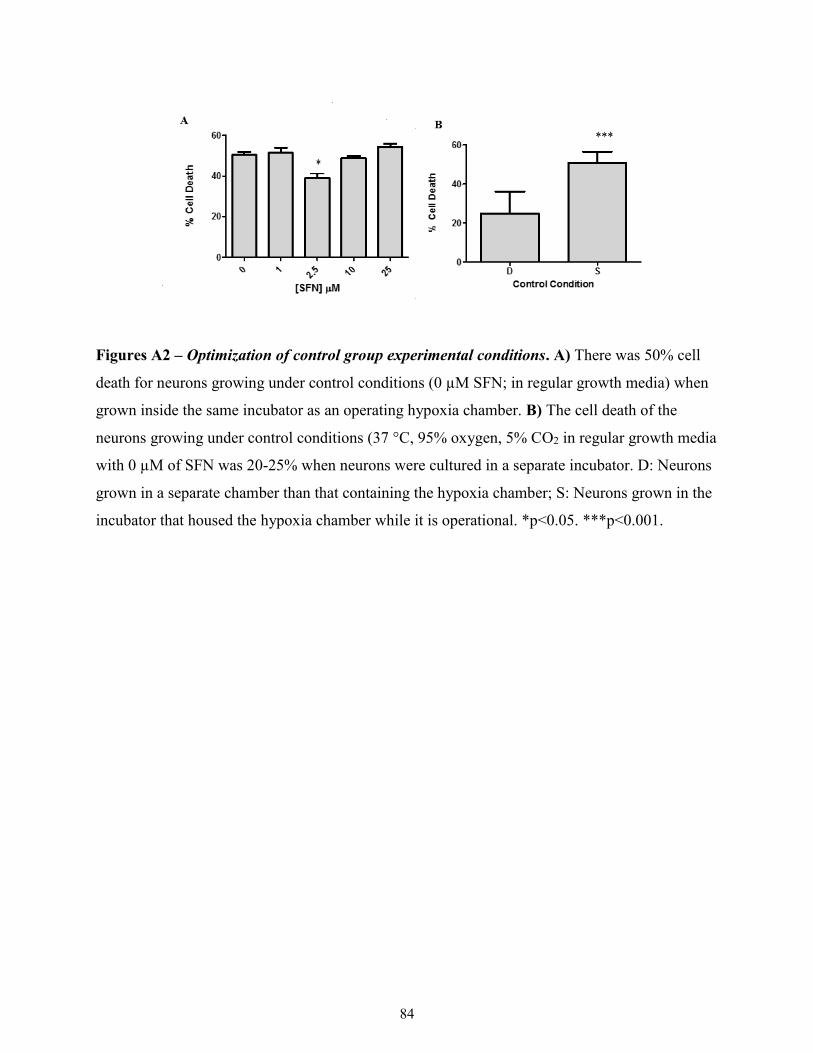
84
Figures A2 – Optimization of control group experimental conditions. A) There was 50% cell
death for neurons growing under control conditions (0 µM SFN; in regular growth media) when
grown inside the same incubator as an operating hypoxia chamber. B) The cell death of the
neurons growing under control conditions (37 °C, 95% oxygen, 5% CO2 in regular growth media
with 0 µM of SFN was 20-25% when neurons were cultured in a separate incubator. D: Neurons
grown in a separate chamber than that containing the hypoxia chamber; S: Neurons grown in the
incubator that housed the hypoxia chamber while it is operational. *p<0.05. ***p<0.001.