neuroimage - freesurfer l. voets, morgan hough, ... neuroimage received date: 8 april 2008 revised...
TRANSCRIPT

�������� ����� ��
Evidence for abnormalities of cortical development in Adolescent-OnsetSchizophrenia
Natalie L. Voets, Morgan Hough, Gwenaelle Douaud, Paul M. Matthews,Anthony James, Louise Winmill, Paula Webster, Stephen Smith
PII: S1053-8119(08)00933-6DOI: doi: 10.1016/j.neuroimage.2008.08.013Reference: YNIMG 5652
To appear in: NeuroImage
Received date: 8 April 2008Revised date: 12 August 2008Accepted date: 14 August 2008
Please cite this article as: Voets, Natalie L., Hough, Morgan, Douaud, Gwenaelle,Matthews, Paul M., James, Anthony, Winmill, Louise, Webster, Paula, Smith, Stephen,Evidence for abnormalities of cortical development in Adolescent-Onset Schizophrenia,NeuroImage (2008), doi: 10.1016/j.neuroimage.2008.08.013
This is a PDF file of an unedited manuscript that has been accepted for publication.As a service to our customers we are providing this early version of the manuscript.The manuscript will undergo copyediting, typesetting, and review of the resulting proofbefore it is published in its final form. Please note that during the production processerrors may be discovered which could affect the content, and all legal disclaimers thatapply to the journal pertain.

ACC
EPTE
D M
ANU
SCR
IPT
ACCEPTED MANUSCRIPTVoets, N.L. et al.
1
TITLE PAGE1
2
Evidence for abnormalities of cortical development in Adolescent-Onset3
Schizophrenia4
5
Natalie L. Voets*1,3 , Morgan Hough*1, Gwenaelle Douaud1, Paul M. Matthews1,3,4, Anthony. James2,6
Louise Winmill2, Paula Webster2, Stephen Smith17
* these authors contributed equally to this work8
9
10
1FMRIB Centre, Department of Clinical Neurology, University of Oxford112Highfield Adolescent Unit, Warneford Hospital, Oxford12
3 GlaxoSmithKline Clinical Imaging Centre, Clinical Pharmacology and Discovery Medicine,13
Hammersmith Hospital, London144 Department of Clinical Neurosciences, Imperial College, London15
16
Corresponding author: [email protected]
Corresponding address: FMRIB Centre, John Radcliffe Hospital, Headington, Oxford OX3 9DU18
Tel: 020 8008 605119
Fax: +44 (0) 1865 222 71720
21
Abstract: 21022
Article Word Count: 471323
Figures: 4 (+ 3 supplementary)24
Tables: 825
26
Keywords: schizophrenia, MRI, cortical thinning, density, surface area27
ACC
EPTE
D M
ANU
SCR
IPT
ACCEPTED MANUSCRIPTVoets, N.L. et al.
2
ABSTRACT28
29
Voxel-Based Morphometry (VBM) identifies differences in grey matter brain structure in patients with30
schizophrenia relative to healthy controls, with particularly prominent differences found in patients with the31
more severe, adolescent-onset form of the disease. However, as VBM is sensitive to a combination of32
changes in grey matter thickness, intensity and folding, specific neuropathological interpretations are not33
possible. Here, we attempt to more precisely define cortical changes in 25 adolescent-onset schizophrenic34
patients and 25 age- and sex-matched healthy volunteers using Surface-Based Morphometry (SBM) to35
disambiguate the relative contributions of cortical thickness and surface area differences to changes in36
regional grey matter (GM) density measured with VBM. Cortical changes in schizophrenia were37
widespread, including particularly the prefrontal cortex and superior temporal gyrus. Nine regions of38
apparent reduction in GM density in patients relative to healthy matched controls were found using VBM39
that were not found with SBM-derived cortical thickness measures. In Regions of Interest (ROIs) derived40
from the VBM group results, we confirmed that local surface area differences accounted for these VBM41
changes. Our results emphasize widespread, but focally distinct cortical pathology in adolescent-onset42
schizophrenia. Evidence for changes in local surface area (as opposed to simply cortical thinning) is43
consistent with a neurodevelopmental contribution to the underlying neuropathology of the disease.44
45

ACC
EPTE
D M
ANU
SCR
IPT
ACCEPTED MANUSCRIPTVoets, N.L. et al.
3
INTRODUCTION46
47
Neuropathological changes have been an increasing focus of research in efforts to understand the aetiology48
of schizophrenia. Several detailed reviews highlight the current knowledge concerning the neurobiological49
basis of the disease (e.g. e.g. Harrison 1999; Harrison & Weinberger 2005; Glantz et al 2006).50
Histopathological studies report changes in neuron size and/or number in several regions, including the51
hippocampus, anterior cingulate cortex and dorsolateral prefrontal cortex (see Harrison 1999). Alterations52
in neuronal presynaptic markers and dendritic density (arborisation) and altered GABAergic, glutamatergic53
and dopaminergic neurotransmission have been interpreted as evidence for impaired functional54
connectivity, possibly arising from abnormal neurodevelopment (Roberts 1990, Harrison 1997, 1999,55
Lewis & Lieberman 2000). There are associated microscopic grey and white matter structural changes, but56
evidence for larger-scale patterns of cortical volume loss has been less consistent. Postmortem results have57
suggested prefrontal and anterior cingulate cortical density changes (see Glantz et al 2006 ), with58
inconsistent reports of reduced volume in thalamic subregions, the temporal lobes and cerebellum, and59
increased volume of the basal ganglia (for a review see Harrison 1999, Shapiro 1993). Attempts to relate60
specific brain structural changes to disease symptoms or progression have been equivocal (Harrison &61
Wienberger 2005, Harrison 1999).62
63
Since the advent of non-invasive imaging techniques (Magnetic Resonance Imaging (MRI) in particular),64
several hundred studies examining volumetric brain changes in schizophrenic populations have been65
reported. A review of 15 studies published in 2004 alone revealed large heterogeneity in reported structural66
changes as detected using voxel-based morphometric (VBM) analyses of MRI data collected in67
schizophrenic subjects (Honea et al., 2005). The review highlighted that, of over 50 reportedly affected68
regions, only 2 regions were noted consistently in more than 50% of the studies: the left medial temporal69
lobe and the left superior temporal gyrus. Half of the studies also found grey matter (GM) density70
reductions in patients relative to controls in the left inferior and medial frontal gyri, left parahippocampal71
gyrus and right superior temporal gyrus.72
73

ACC
EPTE
D M
ANU
SCR
IPT
ACCEPTED MANUSCRIPTVoets, N.L. et al.
4
Limitations in both data acquisition (e.g. resolution) and analysis approaches (e.g. intensity-based74
segmentation techniques, optimal smoothing and biologically-meaningful spatial normalisation between75
subjects) may confound interpretation of MRI-derived atrophy estimates. VBM analyses in particular are76
sensitive to the degree of smoothing, differences in registration and choice of normalization template (Jones77
et al., 2005; Bookstein, 2001; Park et al., 2004). Surface-Based Morphology (SBM) analysis approaches78
have been put forward as an alternative method for probing cortical grey matter group changes, and79
additionally allow the contributions of grey matter thinning and regional surface area (which are80
confounded in VBM approaches) to be defined independently. Another source of variability in cortical81
volume changes in schizophrenic subjects is choice of patient population. Gender (Im et al. 2006, Walder et82
al., 2007), age at onset (Narr et al., 2005a; Nugent et al., 2007) and medication (Glenthoj et al. 2007; Gur et83
al 1998; Khorram et al 2006; Lang et al., 2004; McClure et al., 2006), for example, have all been shown to84
influence cortical volume (Walder et al 2006, 2007; Narr et al 2005a, Nugent et al 2007; Glenthoj et al85
2007, Lang et al 2004, Gur et al 1998, McClure et al 2006, Khorram et al 2006).86
87
In this study, we assess cortical changes in schizophrenic patients (selected for recent, adolescent-onset to88
minimise population heterogeneity) relative to age- and gender-matched healthy controls. Results from89
surface-based and voxel-based morphometry analysis approaches are compared to differentiate cortical90
thinning from local changes in surface area in regions where disease-associated GM changes were found.91
We first present results of separate SBM-derived cortical thickness and VBM-derived density analyses that92
contrast adolescent-onset patients with healthy volunteers. Subsequently, we describe global and regional93
SBM measures of surface area change, and relate these to the cortical density change results. Finally, we94
test the power of SBM and VBM measures to discriminate between healthy controls and patients.95
96
MATERIALS AND METHODS97
Subjects98
Twenty-five adolescent-onset schizophrenics (18 males, aged 13 to 18, mean age 16.25 (stdev 1.4)) were99
recruited from the Oxford Regional Adolescent Unit and surrounding units. All met DSM IV (APA, 1994)100
criteria for schizophrenia, based on the Kiddie Schedule for Affective Disorders and Schizophrenia101

ACC
EPTE
D M
ANU
SCR
IPT
ACCEPTED MANUSCRIPTVoets, N.L. et al.
5
(Kaufman et al, 1997). Age at onset of symptoms ranged from 11-17 years (mean: 15 ± 1.5 years). All102
patients were receiving atypical neuroleptics. Twenty-five age and sex-matched healthy volunteers were103
also recruited (17 men, age range: 13-19 years, mean age 16 (+/- 1.5)). Handedness was assessed with the104
Edinburgh Handedness Questionnaire (Olfield, 1971). All participants attended normal schools. Subjects105
with a history of substance abuse or pervasive developmental disorder, significant head injury, neurological106
disorder or major medical disorder were excluded. Full score IQ differed significantly between the groups107
(p<0.001). Participant demographics are presented in Table 1.108
109
The study was approved by the Oxford Psychiatric Research Ethics Committee. Informed written consent110
was obtained from all participants or their legal custodian.111
112
Data Acquisition113
T1-weighted whole-brain structural images were acquired for all subjects on a 1.5 T Siemens Sonata MR114
scanner using a 3D FLASH sequence (TR 12ms, TE 5.6ms, matrix 256×256x208, 1x1x1mm resolution, 1115
average).116
117
Image Analysis118
Cortical surface generations and thickness estimation119
Surface-based analysis was conducted using FreeSurfer tools (http://surfer.nmr.mgh.harvard.edu/) (Dale et120
al., 1999; Fischl et al. 1999 a,b). . Individual subject’s T1 volumes were linearly aligned to the MNI 305121
average brain template, bias corrected, skull stripped, and segmented into tissue types. The segmented122
white matter (WM) volume was used to derive a tessellated surface representing the gray-white boundary.123
The surface was automatically corrected for topology defects, and expanded to model the pial-gray124
boundary to produce a second, linked mesh surface. The distance between the grey-white matter boundary125
and the pial mesh was used to estimate cortical thickness. The grey-white surface was then inflated to form126
a sphere and warped (on the sphere) to match curvature features across subjects (Dale et al., 1999; Fischl et127
al. 1999 a,b).. After alignment to the spherical-space standard curvature template, the cortex was128
partitioned using an automated Bayesian segmentation procedure designed to replicate the neuroanatomical129

ACC
EPTE
D M
ANU
SCR
IPT
ACCEPTED MANUSCRIPTVoets, N.L. et al.
6
parcellation defined in (Desikan et al., 2006).. Each processing step was verified through: a) visual130
verification of segmentation and label outputs; (b) visual verification of alignment by (i) back-projection of131
average template sulcal ROIs to individual subject T1s and (ii) back-projection of a smaller ROI of132
significant group difference in the post-central region from the average template to individual subject T1133
images; (c) searching for patient outliers in regional cortical thickness measures; and (d) spherical134
visualization of curvature after alignment. Poor data quality, limiting surface reconstruction, led to the135
exclusion of 1 patient and 3 control subjects from the SBM analysis.136
137
Following surface extraction, a mean group template was generated for the 46 subjects. The gray-white138
surface from each subject was inflated to a sphere (Dale et al., 1999a) and nonlinearly aligned to a study-139
derived spherical template formed from the curvature-based registration of the subjects (Fischl et al.,140
1999a) . The contribution of potential gender and handedness differences within the complete dataset of 46141
participants was assessed by creating a template for a subset of only right-handed male subjects (15142
controls/15 patients), as this specific template might be expected to improve alignment by better matching143
curvature asymmetries within this gender subgroup.144
145
A cross-subject general linear model (GLM), fit at each vertex, was used to test group-wise differences in146
surface measures between schizophrenic patients and healthy volunteers. Individual subject thickness147
measures were smoothed using a full width half maximum (FWHM) kernel of 10mm, and compared with148
results for 5mm, 15mm, 20mm, 25mm and 30mm. Group difference t-stat maps were false-discovery-rate149
(FDR) corrected (for multiple comparisons across vertices) at p<0.05 (Genovese et al., 2002). .GLM150
analysis was also repeated in the patient group using neuroleptic dose (chlorpromazine equivalent dose) as151
a regressor to examine potential drug effects on cortical thickness (see Bezchlibnyk-Butler and Jeffries152
(2000)).153
154
Surface-based parcellation155
Subject-specific cortical parcellations were automatically generated through nonlinear surface registration156
of each subject’s curvature measures to a reference surface template generated from 40 healthy subjects157

ACC
EPTE
D M
ANU
SCR
IPT
ACCEPTED MANUSCRIPTVoets, N.L. et al.
7
(Desikan et al., 2006), with subsequent Bayesian segmentation of the surface features based on the statistics158
extracted from the manually labelled regions, optimised for each subjects’ specific curvature, to the aligned159
surface (for a more detailed description, see Fischl et al. 2004a). This automated parcellation was used to160
report results, provide a regional decomposition for surface area testing, and constrain subject161
discrimination to regions of significant disease effects.162
163
Surface-based metric distortion analysis164
Subject-specific spherical deformation measures were generated from each individual subject’s surface165
warp field, reflecting – at each point on the inflated surface mesh – the extent of local area166
expansion/contraction required to align the individual’s surface to the group average template. Metric167
distortion measures were smoothed with a 10mm FWHM kernel and tested for group differences both using168
the raw values, and after scaling (normalizing) by the ratio of the global surface area change.169
170
Surface area analysis171
Smoothness constraints in the nonlinear surface warp may render metric distortion relatively insensitive to172
subject-wise variations in local surface area. Regional surface area measures are complementary and173
derived from native images; these were obtained from the cortical parcellations described above. The174
average surface area of the white and pial surfaces was computed and used to approximate the midway175
surface area, which was then summed for each parcellation.176
177
VBM-style analyses178
A detailed description of a VBM-style analysis of the same subjects is reported in Douaud et al. (2007) .179
Briefly, whole-brain voxel-wise differences in GM morphometry between adolescent schizophrenic180
patients and healthy volunteers were tested using an “optimised” FSL-based VBM approach using FSL181
tools (Good et al., 2002; Smith et al., 2004, www.fmrib.ox.ac.uk/fsl), compensating for possible contraction182
or enlargement due to the nonlinear element of data alignment. The individual modulated normalised GM183
density images were smoothed with an isotropic Gaussian kernel of approximately 8 mm FWHM.184
Differences in the distribution of GM between the patient and healthy volunteer groups were examined185

ACC
EPTE
D M
ANU
SCR
IPT
ACCEPTED MANUSCRIPTVoets, N.L. et al.
8
using permutation-based non-parametric inference testing (Nichols et al., 2002) . Results were considered186
significant at p<0.05 (5000 permutations, initial cluster-forming thresholding at P-uncorrected=0.05), fully187
corrected for multiple comparisons. This analysis was repeated, including a regression analysis with188
medication (chlorpromazine equivalent dose) to test for effects of atypical neuroleptics on measures of189
structural abnormality.190
191
Surface Scaling Factors192
As differences in brain size may bias cortical thickness estimates (Luders et al. 2006), we analyzed the data193
with and without corrections for individual differences in brain size. The scaling of a subject’s skull-194
stripped brain to the template was calculated from the linear transformation matrix produced by FSL’s195
FLIRT (Jenkinson and Smith, 2002) and used to provide global scaling/normalisation for some of the196
surface-based results (e.g. cortical thickness). As average scaling is a 3D measure of brain size, cortical197
thickness was corrected with the 1/3rd power of average scaling while area was corrected with the 2/3rd198
power.199
200
An additional measure of overall brain size is FreeSurfer’s intracranial volume (ICV) estimate based on201
Buckner et al. (2004). Both brain size measures were tested for between-group differences. Surface models202
also provide overall cortical estimates such as total surface area and global mean cortical thickness, which203
may be better suited to scale regional SBM-derived measures. Mean cortical thickness was also used to204
normalise the surface-based measures and assess the differences with traditional volumetric scaling.205
206
All statistical tests were conducted using Walsh’s t-test in R (Venables & Ripley 1999).207
208
VBM ROI rendering onto SBM-derived average surface209
VBM-style approaches are sensitive to a combination of cortical thickness, surface area and shape210
measures. SBM, on the other hand, uses an explicit model of the neocortex, offering independent measures211
of thickness, surface area and folding patterns. Thus, areas of significant difference in VBM GM density212
may be found without a corresponding change in SBM-derived cortical thickness. To visualise differences213

ACC
EPTE
D M
ANU
SCR
IPT
ACCEPTED MANUSCRIPTVoets, N.L. et al.
9
in anatomical location of GM group changes between the two analysis methods, the thresholded VBM-214
derived group difference t-statistic map was rendered onto the SBM-based average surface template by first215
“inverse-warping” the VBM group difference map to the native-space T1 structural image of each of the 46216
individual subjects used in the SBM analysis. Subsequently, for each subject, the resulting ROI was217
forward-warped to spherical surface standard space through the same transformation used to bring218
individual subjects’ grey matter into alignment with the average template.219
220
SBM and VBM Discriminant Testing221
Linear discriminant analysis (LDA) was conducted on SBM-derived thickness and metric distortion222
estimates and the smoothed and modulated GM images. Multivariate VBM, and both univariate and223
multivariate SBM discriminant testing was conducted voxel/vertex-wise using a leave-one-out cross-224
validation (LOOCV) approach to form a discriminant scalar or vector from N-1 subjects and testing this on225
the subject left out (Hastie et al., 2001).226
227
In order to assess the spatial sparsity of the discrimination, mean cortical thickness, curvature, surface area228
and volume measures derived from each of the 32 cortical regions of the Desikan template (Desikan et al.,229
2006) were paired with the same estimate from each of the other regions following Lerch et al. (2006), and230
LDA was performed as a simple 2D multivariate discriminant analysis.231
As a secondary surface-based discriminant analysis, we also subdivided the largest parcellation areas (IT,232
MT, ST, PreC, PostC, and Superior and Rostral Frontal) into 3 - or in the case of the “superior frontal”233
label - 4 regions of equal area along the principal axis of the parcel in order to improve the spatial234
sensitivity of the LDA discriminant analysis.235
236
RESULTS237
Surface-based Morphometry (SBM) results: global summary measures and scaling factors238
Significant differences in volumetric brain size were found between the patient and control groups (Table239
2). There were also significant differences in GM volume, WM surface area, mean cortical thickness and240
the ratio of gyral-sulcal WM surface.241

ACC
EPTE
D M
ANU
SCR
IPT
ACCEPTED MANUSCRIPTVoets, N.L. et al.
10
242
Surface-based Morphometry results: Cortical volume changes243
Group t-stat maps derived from surface-based analysis revealed significantly decreased cortical thickness in244
adolescent-onset schizophrenic patients relative to healthy controls in several cortical regions across the245
brain. These included bilateral caudal middle frontal, precuneus, superior parietal, superior temporal,246
lingual, postcentral and paracentral regions. Left hemisphere thinning was localised to pars opercularis,247
lateral orbitofrontal sulcus, cuneus, inferior parietal sulcus, and an unlabelled region in the insula. Right248
hemisphere cortical thinning was observed in the lateral occipital gyrus, posterior inferior temporal gyrus,249
rostral middle frontal, superior frontal, posterior cingulate gyrus and an unlabelled region in the parietal250
operculum/ postcentral border (Figure 1, Table 3). No regions of increased thickness were found in patients251
relative to controls. The overall spatial distribution of cortical thinning was independent of smoothing252
kernels between 5-30mm FWHM.253
254
We tested for independent effects of neuroleptic medication by modelling chlorpromazine equivalent dose255
as an explanatory variable in the SBM GLM model. No significant medication-related cortical thickness256
differences were found. Modelling IQ as an explanatory variable reduced the overall effect size of the257
results (as IQ differed significantly between the groups) but did not alter the spatial distribution of the258
results.259
260
Voxel-based morphometry results261
Detailed voxel-based morphometry results were reported previously (Douaud et al., 2007) and are262
reproduced here (Figure 2A) for comparison with SBM results (Figure 2B). No regions of increased GM263
density were found for patients relative to controls.264
265
VBM-SBM comparisons: co-localisation of significant results266
Comparison of SBM and VBM results identified overlapping density (decreased in patients) and cortical267
thickness changes (thinning in patients) (Figure 2, Table 4a) in the left hemisphere superior268
parietal/postcentral border, pars opercularis, superior temporal/insula border, precuneus and269

ACC
EPTE
D M
ANU
SCR
IPT
ACCEPTED MANUSCRIPTVoets, N.L. et al.
11
precuneus/paracentral border. In the right hemisphere, regions of overlap were found in the rostral middle270
frontal/superior frontal gyri, superior temporal/insula border, inferior temporal sulcus/gyrus border,271
superior parietal cortex, medial superior frontal sulcus/gyrus border, posterior cingulate and precuneus272
regions.273
274
Comparison of SBM and VBM group difference maps also revealed regions of VBM GM density change in275
which no corresponding evidence of cortical thinning was seen with SBM in the bilateral inferior/middle276
temporal gyrus, medial superior frontal gyrus (SMA), pre/postcentral gyrus (primary motor mouth area),277
posterior parietal operculum/transverse temporal (Heschl’s) gyrus and rostral anterior cingulate/medial278
superior frontal cortex (Figure 2) (Table 4b).279
280
VBM-SBM comparisons: metric distortion281
As changes in local surface area might explain discrepancies between VBM and SBM measures, we first282
tested relative local distortion measures for potential group differences. Spherical deformation maps283
revealed differences in the expansion/contraction of the warp field between patients and controls (Figure 3),284
but did not survive multiple comparisons correction. Employing alternative smoothing levels (5-35mm285
smoothing FWHM) did not significantly affect the results.286
287
The analysis was extended by testing whether the combined measure of cortical thickness and metric288
distortion approximated VBM density changes (see supplementary material). While the combined289
measures maps better approximated the VBM maps, significant differences remained (supplementary290
Figure S1).291
292
VBM-SBM comparison: surface area measures293
The lack of clear correspondence between the vertex-wise SBM measures and VBM-density measures294
suggests that metric distortion alone may not offer a sufficiently sensitive measure of underlying surface295
area change. We therefore used regional surface area measures extracted from the Desikan template296
parcellations in the native structural images to test for differences between adolescent-onset schizophrenics297
ACC
EPTE
D M
ANU
SCR
IPT
ACCEPTED MANUSCRIPTVoets, N.L. et al.
12
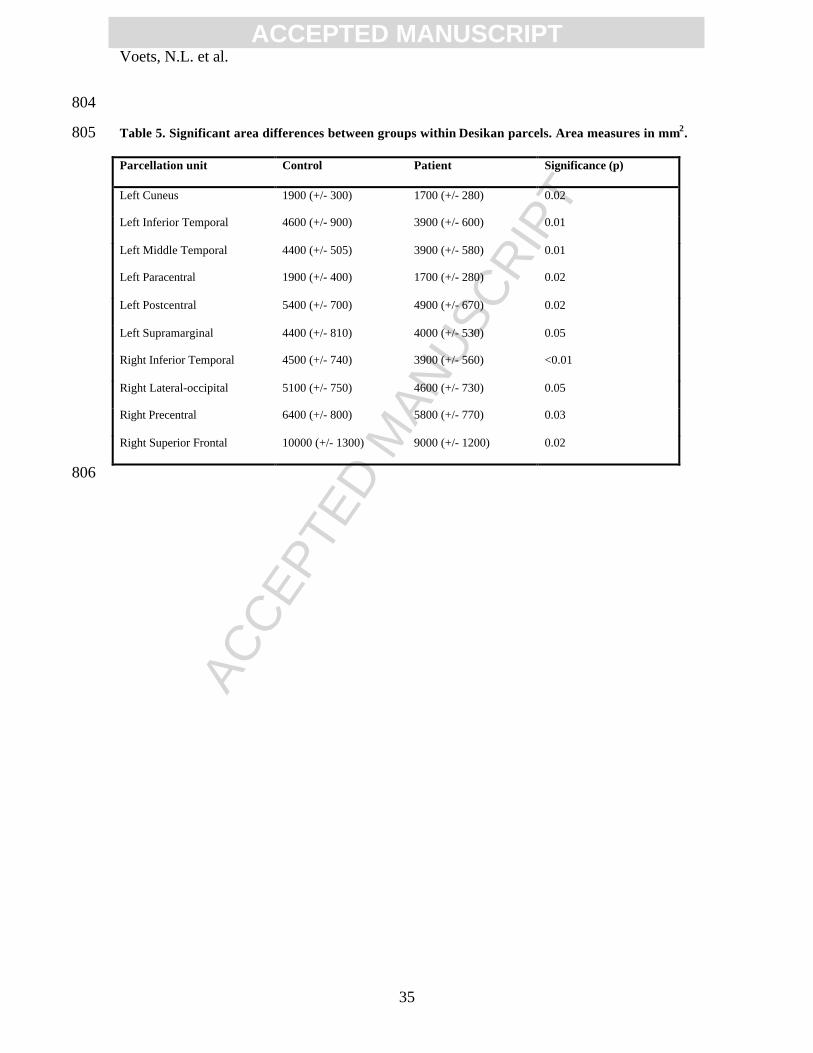
and healthy volunteers. This revealed significant surface area differences between the groups in several298
regions co-localising with those showing VBM density changes but no corresponding SBM thickness299
change (Table 5). More refined localisation to test whether surface area changes underlie, for instance, the300
VBM SMA result, was limited by the lack of spatial detail provided by the large template parcellations.301
302
VBM ROI-constrained Analysis of SBM estimates to derive local cortical area303
Due to the lack of spatial specificity of parcellation-derived surface area measures, we finally sampled304
surface area directly within regions of interest (ROI) defined based on the VBM results. Each of the 9305
VBM regions not showing group-wise SBM thickness change was unwarped back to each subject’s native306
(T1) image. The native space ROIs were then projected onto the midthickness surface, spatially normalised307
via nonlinear spherical registration, and averaged (across subjects). (An example of the VBM Heschl’s ROI308
is depicted in Supplementary Material Figure S2). Within each projected ROI, surface measures were309
sampled from the GM mid-surface estimates (Table 6a,b). Thickness measures were also sampled as310
before. T-tests conducted on surface area measures sampled from VBM ROIs revealed significant311
differences in schizophrenic patients relative to healthy volunteers in all 9 regions distinguished in the312
VBM- and SBM-based patient-control contrast.313
314
The effect of global disease-related cortical volume decreases on local estimates315
As brain sizes differed significantly between patients and controls, surface area measures sampled from316
VBM-derived ROIs could be confounded by global size differences. The computed mask size, reflecting317
the size of the ROI created on the MNI template, applied to the individual control and patient brains, might318
therefore differ between the two populations. However, scaled mask sizes remained significantly different319
between patients and controls, suggesting global size difference alone did not account for the local mask320
size differences in these regions.321
322
Discriminant Analysis323
The observation of structural differences between brains of patients with schizophrenia and healthy controls324
at the group level suggested that individual subjects could be classified based on these differences.325

ACC
EPTE
D M
ANU
SCR
IPT
ACCEPTED MANUSCRIPTVoets, N.L. et al.
13
Multivariate discriminant analysis using the VBM smoothed modulated GM images yielded 84% accuracy326
in classifying subjects as healthy volunteer or adolescent schizophrenic patient (42/50 subjects correctly327
classified), with 88% sensitivity and 80% specificity. Surface-based discriminant analysis was performed328
using two approaches. Vertex-wise discrimination using cortical thickness yielded 84% accuracy (Figure329
4). The second approach, using cortical thickness measures derived from paired, or subdivided Desikan330
parcels, offered a similar level of discrimination (82% accuracy between groups using paired parcels; up to331
87% using sub-divided parcels).332
333
334
DISCUSSION335
336
We set out to determine specific measures contributing to altered cortical density in adolescent-onset337
schizophrenic patients relative to age- and sex-matched healthy volunteers. By estimating surface-derived338
thickness and surface area changes, we anticipated being able to interpret VBM-derived density changes339
more precisely. We hypothesized that VBM density analysis would reveal additional regions of group-340
wise change compared with SBM thickness measures, due to the confound of local area change in the VBM341
density estimate. Consistent with this, we observed both common regions of cortical change using SBM342
and VBM analysis methods (pre/postcentral, temporal and frontal lobe regions), and regions in which VBM343
group density changes were found that were not accompanied by corresponding SBM thickness change.344
Smoothing levels, metric distortion analysis, or analysis using a volume change estimate to approximate345
VBM results were unable to fully account for the differences in results between the methods. However,346
local surface area was significantly different in all regions showing VBM-density but not SBM thickness347
change in adolescent-onset schizophrenia. These results (i) highlight that surface-based methods can348
provide sensitive, relatively interpretable, indices of disease-related structural changes, and (ii) demonstrate349
that both relative cortical thinning and local surface area changes characterise the neuropathology of350
adolescent-onset schizophrenia. The latter are consistent with underlying neurodevelopmental differences351
between schizophrenia and healthy controls.352
353

ACC
EPTE
D M
ANU
SCR
IPT
ACCEPTED MANUSCRIPTVoets, N.L. et al.
14
Grey matter changes found with both VBM and SBM are consistent with cortical thinning354
Grey matter cortical changes independent of the analysis method used involved the left hemisphere355
prefrontal cortex and precuneus, and right hemisphere precuneus and superior/middle temporal regions.356
This suggests cortical thinning as the primary measure underlying cortical changes in these regions, and is357
consistent with recent reports of prefrontal lobe cortical thinning (Kuperberg et al 2003, Narr et al 2005a,358
b), potentially also involving temporal and parietal regions (see Greenstein et al., 2006). Our findings of359
cortical thinning in left hemisphere prefrontal, and right hemisphere superior/middle temporal regions are360
consistent with reports of progressive frontal and temporal lobe volume loss (Farrow et al., 2005; Gur et al.361
1998; Mathalon et al., 2001, see Nakamura et al. 2007 for review), and progressive changes exceeding362
those seen in non-psychotic siblings (Honea et al., 2007). As SBM measures of cortical thinning,363
consistent with VBM density change in these regions, may reflect cortical lamination changes (Makris et364
al., 2006), our results are consistent with thalamo-cortical neurodevelopmental abnormalities preferentially365
affecting medial dorsal thalamus connections with frontal and temporal cortical regions (Mitelman et al.,366
2005c).367
368
It is likely that these cortical changes have behavioural correlates. Functional-anatomical correlates of369
structural measures with symptoms of schizophrenia have been found in superior temporal (Wright et al.,370
1995, Mitelman et al., 2005a) and frontal lobe (e.g. Mitelman et al., 2005b) regions. Previously, we found371
changes in white matter integrity along the arcuate fasciculus consistent with changes in both VBM density372
(Douaud et al., 2007) and SBM thickness in left inferior frontal gyrus, a region potentially implicated in373
auditory hallucinations (Garcia-Marti et al., 2007, but see Gaser et al., 2004).374
375
Grey matter changes detected with VBM but not SBM suggest locally reduced cortical surface area in376
patients377
Measures of grey matter density in VBM are a mixture of thickness, surface area and folding differences.378
SBM, in contrast, fits surfaces to the gray/white and pial boundaries, and for each hemisphere separately.379
Our second observation of bilateral GM density changes in VBM, not detected with SBM, suggests380
regional differences in local cortical surface area in adolescent-onset schizophrenic patients relative to381

ACC
EPTE
D M
ANU
SCR
IPT
ACCEPTED MANUSCRIPTVoets, N.L. et al.
15
controls. We used four approaches to test this theory. The Jacobian of the warp field demonstrated382
regional change in some of the VBM density change regions, but did not survive FDR thresholding. More383
directly approximating the VBM-derived density measure using an additional measure of volume change -384
obtained by dividing cortical thickness by change in metric distortion at every vertex - improved sensitivity385
relative to analysis using each measure separately, but did not fully explain the difference between VBM386
and SBM results. A surface area measure derived from the anatomic labels on the surface template387
identified significant surface area differences in several of the labels. However, the large extent of each388
parcellation region precluded more precise localisation of the significant surface area results. Repeating389
this analysis using surface area measures derived directly from each subject’s native space within VBM-390
defined ROIs identified highly significant local surface area changes in each of the ROIs, even when these391
were corrected for group differences in brain size. Thus, VBM density changes in schizophrenia, not392
supported by cortical thinning, were attributable to altered surface area in these regions. We hypothesized393
that these local area changes were not seen in the FreeSurfer-derived localised measure of area change394
(warp field of the Jacobian) because of constraints on scale of spatial integration, affected by factors such395
as spatial smoothing, effective smoothness of the surface registration, and accuracy of the surface396
registration.397
398
These findings support the hypothesis that abnormal cortical development contributes to the aetiology of399
schizophrenia. They further suggest regionally variable development of local cytoarchitectonical fields, a400
concept consistent with previous work (Vogeley et al 2000, Harris et al 2004a, b, Kulynuch et al 1997,401
Sallett et al 2003; see Wisco et al, 2007). Gyrification changes, a potential consequence of local402
cytoarchitectonical field abnormalities, have recently been reported in the left hemisphere pars triangularis403
(Wisco et al., 2007). Harris et al (2007) found right a prefrontal cortex gyrification index was highly404
predictive of schizophrenia risk.405
406
Local disease-specific cortical changes can discriminate adolescent-onset schizophrenic patients from407
healthy volunteers408
ACC
EPTE
D M
ANU
SCR
IPT
ACCEPTED MANUSCRIPTVoets, N.L. et al.
16
This latter study, our recent work (Douaud et al., (2007)), and that of others, suggests that cortical patterns409
may provide phenotypic markers specific for schizophrenia. Bilateral Heschl’s gyrus/planum temporale410
changes may provide a consistent index. Changes in these regions have been reported at first presentation411
of schizophrenia, while left hemisphere Heschl’s gyrus shows progressive change with disease duration412
(Kasai et al 2007). Moreover, structural changes correlate with both severity of auditory hallucinations413
(Gaser et al 2004) and progressive changes in mismatch negativity (Salisbury et al. 2007). The relevance of414
altered shape compared with cortical thickness in this region to schizophrenia risk and symptoms415
presentation warrants further investigation.416
417
We investigated this hypothesis here more generally. Our discriminant analysis results suggested that418
patients and healthy controls could be discriminated well based on either VBM (84%) or SBM (84%)419
measures. For the SBM parcel-based approach, eleven regions (paired parcels) showed high discriminant420
ability between patients and controls. In various combinations, these were the banks of the superior421
temporal sulcus (BSTS), lingual gyrus, medial orbital frontal, pars opercularis, posterior cingulate gyrus422
and precuneus. The highest discrimination was obtained with the combination of left BSTS with right423
paracentral region, left cuneus with right BSTS, and left medial orbitofrontal with right posterior cingulate424
labels. This is consistent with a central role for superior medial temporal thickness pathology in425
schizophrenia (Lawrie 2007).426
427
Methodological considerations428
The sample size of our study is relatively small compared with adult-onset schizophrenia studies, limiting429
the interpretation of our findings in the wider context of the neuropathology of schizophrenia. However,430
the prevalence of schizophrenia in our onset-group is lower than in adulthood. Our sample may therefore be431
relatively characteristic, and is comparable to other studies in this population. Future studies in larger432
samples will be needed to determine possible relationships between disease symptoms and local structural433
changes. Cortical folding differences may exist between male and female subjects, particularly in the left434
frontal lobe (Im et al. 2006, Luders et al. 2007). Although our subject groups were matched for sex, subtle435
gender-specific spatial registration differences or sex-by-disease trait interactions remain possible. In our436

ACC
EPTE
D M
ANU
SCR
IPT
ACCEPTED MANUSCRIPTVoets, N.L. et al.
17
previous study, we repeated density analysis on the same analysis on a 15 control/15 patient subset of right-437
handed males (Douaud et al., 2007). Repeating the SBM thickness analysis using the same subset of male438
subjects revealed the same distribution of cortical thinning as seen in the mixed-sex larger group, albeit439
with reduced significance due to the smaller number of subjects. Including gender as an additional440
regressor in the GLM analysis did not significantly alter the spatial distribution of thinning results.441
Neuroleptics have also previously been reported to impact on cortical density measures. Neuroleptic dose,442
however, was not correlated significantly with either local cortical density or local thickness measures in443
our analyses.444
445
Reduced brain size in schizophrenic patients relative to controls may confound local estimates of volume446
change. We attempted to address this in our study through correction of locally-sampled measures by447
scaling mask sizes using the overall measure of brain size (scaling factor) derived from linearly registering448
skull-stripped volumes. This measure is more appropriate than skull-derived measures in cases where CSF449
differences exist (such as in schizophrenia) However, the scaling factor lacks tissue differentiation, and450
therefore may not correct for developmental biases in tissue volume (grey versus white matter).451
452
Conclusions453
In this study, we identified significant, regionally variable cortical pathology in adolescent-onset454
schizophrenia, consistent with anatomically specific neurodevelopmental impairments. Anatomically455
distinct changes in local cortical surface area and cortical thinning offer evidence for potentially regionally456
distinct neurodevelopmental consequences – thinning (perhaps related to loss of neuropil or altered457
pruning) and altered regional cytoarchitectonic area. We further demonstrated the potential for these458
changes to discriminate patients from healthy controls. Evidence from a range of reports suggests that459
symptom presentation may be related to heterogeneity in the pattern of brain changes. In future work it will460
be important to define the longitudinal trajectory of these abnormalities and their relationship to disease461
symptomatology.462
463
ACKNOWLEDGEMENTS464

ACC
EPTE
D M
ANU
SCR
IPT
ACCEPTED MANUSCRIPTVoets, N.L. et al.
18
We would like to thank the UK Medical Research Council (MRC) for funding this research, the patients465
and volunteers who took part in this study, Bruce Fischl and, Paul Harrison for helpful suggestions on466
analysis methods and this manuscript. NV and PMM are fulltime employees of GlaxoSmithKline.467

ACC
EPTE
D M
ANU
SCR
IPT
ACCEPTED MANUSCRIPTVoets, N.L. et al.
19
REFERENCES468
469
Bezchlibnyk-Butler KZ and Jeffries JJ, editors (2000): Clinical Handbook of Psychotropic Drugs, 10th ed.470
Seattle: Hogrefe & Huber Publishers, pp.84-88471
472
Bookstein FL. (2001). " Voxel-based morphometry" should not be used with imperfectly registered images.473
Neuroimage, 14(6):1454-62.474
475
Buckner et al. (2004) A unified approach for morphometric and functional data analysis in young, old, and476
demented adults using automated atlas-based head size normalization: reliability and validation against477
manual measurement of total intracranial volume. NeuroImage 23:724-738.478
479
Dale, AM, Fischl, B, Sereno, MI. (1999). Cortical Surface-Based Analysis I: Segmentation and Surface480
Reconstruction. NeuroImage 9(2):179-194481
482
Desikan RS, Segonne F, Fischl B, Quinn BT, Dickerson BC, Blacker D, Buckner RL, Dale AM, Maguire483
RP, Hyman BT, Albert MS, Killiany RJ. An automated labeling system for subdividing the human cerebral484
cortex on MRI scans into gyral based regions of interest. Neuroimage. 2006 Jul 1;31(3):968-80.485
486
Douaud G, Smith S, Jenkinson M, Behrens T, Johansen-Berg H, Vickers J, James S, Voets N, Watkins K,487
Matthews PM, James A. (2007). Anatomically related grey and white matter abnormalities in adolescent-488
onset schizophrenia. Brain. 130(Pt 9):2375-86.489
490
Farrow TF, Whitford TJ, Williams LM, Gomes L, Harris AW. (2005). Diagnosis-related regional gray491
matter loss over two years in first episode schizophrenia and bipolar disorder. Biol Psychiatry, 58(9):713-492
23.493
494
495

ACC
EPTE
D M
ANU
SCR
IPT
ACCEPTED MANUSCRIPTVoets, N.L. et al.
20
Fischl, B, Sereno, MI, Dale, AM. (1999a). Cortical Surface-Based Analysis II: Inflation, Flattening, and a496
Surface-Based Coordinate System. NeuroImage, 9(2):195-207.497
498
Fischl B, Sereno MI, Tootell RB, Dale AM. High-resolution intersubject averaging and a coordinate system499
for the cortical surface. Hum Brain Mapp. 1999b;8(4):272-84.500
501
Fischl, B, A. van der Kouwe, Destrieux C, Halgren E, Segonne F, Salat D, Busa E, Seidman L, Goldstein J,502
Kennedy D, Caviness V, Makris N, Rosen B, and Dale AM. (2004a). Automatically Parcellating the503
Human Cerebral Cortex. Cerebral Cortex, 14:11-22.504
505
Garcia-Marti G, Aguilar EJ, Lull JJ, Marti-Bonmati L, Escarti MJ, Manjon JV, Moratal D, Robles M,506
Sanjuan J. (2007). Schizophrenia with auditory hallucinations: A voxel-based morphometry study.507
Prog Neuropsychopharmacol Biol Psychiatry.508
509
Gaser C, Nenadic I, Volz HP, Buchel C, Sauer H. (2004). Neuroanatomy of "hearing voices": a510
frontotemporal brain structural abnormality associated with auditory hallucinations in schizophrenia. Cereb511
Cortex, 14(1):91-6.512
513
Genovese CR, Lazar NA, Nichols T. (2002) Thresholding of statistical maps in functional neuroimaging514
using the false discovery rate. Neuroimage, 15(4):870-8.515
516
Giedd JN, Blumenthal J, Jeffries NO, Castellanos FX, Liu H, Zijdenbos A, Paus T, Evans AC, Rapoport LJ517
(1999). Brain development during childhood and adolescence: a longitudinal MRI study. Nature518
Neuroscience 2(10): 861-863.519
520
Glantz LA, Gilmore JH, Lieberman JA, Jarskog LF. (2006). Apoptotic mechanisms and the synaptic521
pathology of schizophrenia. Schizophr Res. 81(1):47-63.522
523

ACC
EPTE
D M
ANU
SCR
IPT
ACCEPTED MANUSCRIPTVoets, N.L. et al.
21
Glenthoj A, Glenthoj BY, Mackeprang T, Pagsberg AK, Hemmingsen RP, Jernigan TL, Baare WF (2007).524
Basal ganglia volumes in drug-naïve first-episode schizophrenia patients before and after short-term525
treatment with either a typical or an atypical antipsychotic drug. Psychiatry Res 154(3): 199-208.526
527
Good CD, Scahill RI, Fox NC, Ashburner J, Friston KJ, Chan D, Crum WR, Rossor MN, Frackowiak RS528
(2002). Automatic differentiation of anatomical patterns in the human brain: validation with studies of529
degenerative dementias. Neuroimage 17(1): 29-46.530
531
Greenstein D, Lerch J, Shaw P, Clasen L, Giedd J, Gochman P, Rapoport J, Gogtay N (2006). Childhood532
onset schizophrenia: cortical brain abnormalities as young adults. J Child Psychol and Psychiatry 47(10):533
1003-1012.534
535
Gur RE, Maany V, Mozley PD, Swanson C, Bilker W, Gur RC (1998). Subcortical MRI volumes in536
neuroleptic-naïve and treated patients with schizophrenia. Am J Psychiatry 155(12): 1711-7.537
538
Hamilton LS, Narr KL, Luders E, Szeszko PR, Thompson PM, Bilder RM, Toga AW. (2007).539
Asymmetries of cortical thickness: effects of handedness, sex, and schizophrenia. Neuroreport. 2007 Sep540
17;18(14):1427-31.541
542
Harris JM, Moorhead TW, Miller P, McIntosh AM, Bonnici HM, Owens DG, Johnstone EC, Lawrie SM.543
(2007). Increased prefrontal gyrification in a large high-risk cohort characterizes those who develop544
schizophrenia and reflects abnormal prefrontal development. Biol Psychiatry, 62(7):722-9.545
546
Harris JM, Whalley H, Yates S, Miller P, Johnstone EC, Lawrie SM (2004). Abnormal cortical folding in547
high-risk individuals: a predictor of the development of schizophrenia? Biol Psychiatry 56(3): 182-9.548
549
Harrison P.J. (1999). The neuropathology of schizophrenia. Brain 122(Pt4): 593-624550
551

ACC
EPTE
D M
ANU
SCR
IPT
ACCEPTED MANUSCRIPTVoets, N.L. et al.
22
Harrison P.J. (1997). Schizophrenia: a disorder of neurodevelopment? Curr Opin Neurobiol. 7(2):285-9.552
553
Harrison P.J. & Weinberger D.R. (2005). Schizophrenia genes, gene expression and neuropathology: on the554
matter of their convergence. Mol Psychiatry 10(1): 40-68555
556
Hastie T, Tibshirani R, Friedman J. (2001). The Elements of Statistical Learning: Data Mining, Inference,557
and Prediction, Springer558
559
Honea RA, Meyer-Lindenberg A, Hobbs KB, Pezawas L, Mattay VS, Egan MF, Verchinski B, Passingham560
RE, Weinberger DR, Callicott JH. (2007). Is Gray Matter Volume an Intermediate Phenotype for561
Schizophrenia? A Voxel-Based Morphometry Study of Patients with Schizophrenia and Their Healthy562
Siblings. Biol Psychiatry.563
564
Honea R, Crow TJ, Passingam D, Mackay CE (2005). Regional deficits in brain volume in schizophrenia :565
a meta-analysis of voxel-based morphometry studies. Am J Psych 162 (12): 2233-2245.566
567
Im K, Lee JM, Lee J, Shin YW, Kim IY, Kwon JS, Kim SI. (2006). Gender difference analysis of cortical568
thickness in healthy young adults with surface-based methods. Neuroimage. 31(1):31-8.569
570
Jenkinson M, Smith S. (2001). A global optimisation method for robust affine registration of brain images.571
Med Image Anal. 5(2):143-56.572
573
Jones DK, Symms MR, Cercignani M, Howard RJ. (2005). The effect of filter size on VBM analyses of574
DT-MRI data. Neuroimage. 26(2):546-54.575
576
Kasai K, McCarley RW, Salisbury DF, Onitsuka T, Demeo S, Yurgelun-Todd D, Kikinis R, Jolesz FA,577
Shenton ME. (2004). Cavum septi pellucidi in first-episode schizophrenia and first-episode affective578
psychosis: an MRI study. Schizophr Res., 71(1):65-76.579

ACC
EPTE
D M
ANU
SCR
IPT
ACCEPTED MANUSCRIPTVoets, N.L. et al.
23
580
Kaufman J, Birmaher B, Brent D, Rao U, Flynn C, Moreci P, Williamson D, Ryan N. (1997). Schedule for581
Affective Disorders and Schizophrenia for School-Age Children-Present and Lifetime Version (K-SADS-582
PL): initial reliability and validity data. J Am Acad Child Adolesc Psychiatry. 36(7):980-8.583
584
Khorram B, Lang DJ, Kopala LC, Vandorpe RA, Rui Q, Goghari VM, Smith GN, Honer WG (2006).585
Reduced thalamic volume in patients with chronic schizophrenia after switching from typical antipsychotic586
medications to olanzapine. Am J Psychiatry 163(11): 2005-7587
588
Kulynych JJ, Luevano LF, Jones DW, Weinberger DR. (1997). Cortical abnormality in schizophrenia: an in589
vivo application of the gyrification index. Biol Psychiatry, 41(10):995-9.590
591
Kuperberg GR, Broome MR, McGuire PK, David AS, Eddy M, Ozawa F, Goff D, West WC, Williams SC,592
van der Kouwe AJ, Salat DH, Dale AM, Fischl B. (2003). Regionally localized thinning of the cerebral593
cortex in schizophrenia. Arch Gen Psychiatry, 60(9):878-88.594
595
Lang DJ, Kopala LC, Vandorpe RA, Rui Q, Smith GN, Goghari VM, Lapointe JS, Honer WG (2004).596
Reduced basal ganglia volumes after switching to olanzapine in chronically treated patients with597
schizophrenia. Am J Psychiatry 161(10): 1829-36.598
599
Lawrie S (2007). Distinguishing vulnerability, prediction, and progression in the preschizophrenic brain.600
Arch Gen Psychiatry 64: 250-251.601
602
Lerch JP, Pruessner J, Zijdenbos AP, Collins DL, Teipel SJ, Hampel H, Evans AC. Automated cortical603
thickness measurements from MRI can accurately separate Alzheimer's patients from normal elderly604
controls. Neurobiol Aging. 2006.605
606

ACC
EPTE
D M
ANU
SCR
IPT
ACCEPTED MANUSCRIPTVoets, N.L. et al.
24
Lewis DA, Lieberman JA. Catching up on schizophrenia: natural history and neurobiology. Neuron.607
28(2):325-34.608
609
Luders E, Narr KL, Thompson PM, Rex DE, Woods RP, Deluca H, Jancke L, Toga AW. (2006). Gender610
effects on cortical thickness and the influence of scaling. Hum Brain Mapp., 27(4):314-24.611
Luders E, Narr KL, Bilder RM, Szeszko PR, Gurbani MN, Hamilton L, Toga AW, Gaser C (2007).612
Mapping the relationship between Cortical Convolution and Intelligence: Effects of Gender. Cereb Cortex613
(in press)614
615
Makris N, Kaiser J, Haselgrove C, Seidman LJ, Biederman J, Boriel D, Valera EM, Papadimitriou GM,616
Fischl B, Caviness VS Jr, Kennedy DN (2006). Human cerebral cortex: a system for the integration of617
volume- and surface-based representations. Neuroimage 33(1):139-53618
619
Mathalon DH, Sullivan EV, Rawles JM, Pfefferbaum A. (1993). Correction for head size in brain-imaging620
measurements. Psychiatry Res., 50(2):121-39.621
622
Mathalon DH, Sullivan EV, Lim KO, Pfefferbaum A. (2001). Progressive brain volume changes and the623
clinical course of schizophrenia in men: a longitudinal magnetic resonance imaging study. Arch Gen624
Psychiatry, 58(2):148-57.625
626
McClure RK, Phillips R, Jazayerli R, Barnett A, Coppola R, Weinberger DR (2006). Regional change in627
brain morphometry in schizophrenia associated with antipsychotic treatment. Psychiatry Res 148(2-3):628
121-32.629
630
Mitelman SA, Brickman AM, Shihabuddin L, Newmark R, Chu KW, Buchsbaum MS (2005c).631
Correlations between MRI-assessed volumes of the thalamus and cortical Brodmann’s areas in632
schizophrenia. Schizophrenia Research 75: 265-281.633
634

ACC
EPTE
D M
ANU
SCR
IPT
ACCEPTED MANUSCRIPTVoets, N.L. et al.
25
Mitelman SA, Shihabuddin L, Brickman AM, Buchsbaum MS (2005a). Cortical intercorrelations of635
temporal area volumes in schizophrenia. Schizophr Res 76(2-3): 207-29.636
637
Mitelman SA, Buchsbaum MS, Brickman AM, Shihabuddin L (2005b). Cortical intercorrelations of638
frontal area volumes in schizophrenia. Neuroimage 27(4): 753-70639
640
Nakamura M, Salisbury DF, Hirayasu Y, Bouix S, Pohl KM, Yoshida T, Koo MS, Shenton ME, McCarley641
RW. (2007). Neocortical gray matter volume in first-episode schizophrenia and first-episode affective642
psychosis: a cross-sectional and longitudinal MRI study. Biol Psychiatry, 62(7):773-83.643
644
Narr KL, Bilder RM, Luders E, Thompson PM, Woods RP, Robinson D, Szeszko PR, Dimtcheva T,645
Gurbani M, Toga AW. (2007). Asymmetries of cortical shape: Effects of handedness, sex and646
schizophrenia. Neuroimage. 34(3):939-48.647
648
Narr KL, Bilder RM, Toga AW, Woods RP, Rex DE, Szeszko PR, Robertson D, Sevy S, Gunduz-Bruce H,649
Wang Y-P, DeLuca H, Thompson PM (2005a). Mapping cortical thickness and gray matter concentration650
in first episode schizophrenia. Cerebral Cortex 15:708-719.651
652
Narr KL, Toga AW, Szeszko P, Thompson PM, Woods RP, Robinson D, Sevy S, Wang Y, Schrock K,653
Bilder RM. (2005b). Cortical thinning in cingulate and occipital cortices in first episode schizophrenia. Biol654
Psychiatry, 1;58(1):32-40.655
656
Nichols TE, Holmes AP.(2002). Nonparametric permutation tests for functional neuroimaging: a primer657
with examples. Hum Brain Mapp. 15(1):1-25.658
659
Nugent TF, Herman DH, Ordonez A, Greenstein D, Hayashi KM, Lenane M, Clasen L, Jung D, Toga AW,660
Giedd JN, Rapoport JL, Thompson PM, Gogtay N (2007) . Dynamic mapping of hippocampal development661
in childhood onset schizophrenia. Schizophrenia Research 90(1-3): 62-70.662

ACC
EPTE
D M
ANU
SCR
IPT
ACCEPTED MANUSCRIPTVoets, N.L. et al.
26
663
Oldfield RC. (1971). The assessment and analysis of handedness: the Edinburgh inventory.664
Neuropsychologia. 9(1):97-113.665
666
Park HJ, Levitt J, Shenton ME, Salisbury DF, Kubicki M, Kikinis R, Jolesz FA, McCarley RW (2004). An667
MRI study of spatial probability brain map differences between first-episode schizophrenia and normal668
controls. Neuroimage 22(3):1231-46.669
670
Rapoport J, Giedd JN, Blumenthal J, Hamburger S, Jeffries N, Fernandez T., Nicolson R, Bedwell J,671
Lenane M, Zijdenbos A, Paus T, Evans A (2007). Progressive cortical change during adolescence in672
childhood-onset schizophrenia. Arch Gen Psychiatry 56 : 649-654673
674
Roberts GW. (1990). Schizophrenia: the cellular biology of a functional psychosis. Trends Neurosci.675
13(6):207-11.676
677
Rueckert D, Sonoda LI, Hayes C, Hill DL, Leach MO, Hawkes DJ. (1999) Nonrigid registration using free-678
form deformations: application to breast MR images. IEEE Trans Med Imaging. 18(8):712-21.679
680
Salisbury DF, Kuroki N, Kasai K, Shenton ME, McCarley RW. (2007). Progressive and interrelated681
functional and structural evidence of post-onset brain reduction in schizophrenia. Arch Gen Psychiatry,682
64(5):521-9.683
684
Sallet PC, Elkis H, Alves TM, Oliveira JR, Sassi E, Campi de Castro C, Busatto GF, Gattaz WF. (2003).685
Reduced cortical folding in schizophrenia: an MRI morphometric study. Am J Psychiatry, 160(9):1606-13.686
687
Segonne F, Dale AM, Busa E, Glessner M, Salat D, Hahn HK, Fischl B. (2004). A hybrid approach to the688
skull stripping problem in MRI. Neuroimage. 22(3):1060-75.689
690

ACC
EPTE
D M
ANU
SCR
IPT
ACCEPTED MANUSCRIPTVoets, N.L. et al.
27
Shapiro RM. (1993). Regional neuropathology in schizophrenia: where are we? Where are we going?691
Schizophr Res. 10(3):187-239.692
693
Smith SM. (2002). Fast robust automated brain extraction. Hum Brain Mapp., 17(3):143-55.694
695
Smith SM, Jenkinson M, Woolrich MW, Beckmann CF, Behrens TE, Johansen-Berg H, Bannister PR, De696
Luca M, Drobnjak I, Flitney DE, Niazy RK, Saunders J, Vickers J, Zhang Y, De Stefano N, Brady JM,697
Matthews PM. (2004). Advances in functional and structural MR image analysis and implementation as698
FSL. Neuroimage. 23 Suppl 1:S208-19.699
700
Venables W.N. and Ripley B.D. (19999). Modern Applied Statistics with S-PLUS. Third Edition. Springer701
702
Vogeley K, Schneider-Axmann T, Pfeiffer U, Tepest R, Bayer TA, Bogerts B, Honer WG, Falkai P. (2000).703
Disturbed gyrification of the prefrontal region in male schizophrenic patients: A morphometric postmortem704
study. Am J Psychiatry, 157(1):34-9.705
706
Walder DJ, Seidman LJ, Makris N, Tsuang MT, Kennedy DN, Goldstein JM (2007). Neuroanatomic707
substrates of sex differences in language dysfunction in schizophrenia: a pilot study. Schizophrenia708
Research 90(1-3): 295-301709
710
Walder DJ, Seidman LJ, Cullen N, Su J, Tsuang MT, Goldstein (2006). Sex Differences in language711
dysfunction in schizophrenia. Am J Psychiatry 163(3): 470-7.712
713
Whitford TJ, Grieve SM, Farrow TF, Gomes L, Brennan J, Harris AW, Gordon E, Williams LM. (2006).714
Progressive grey matter atrophy over the first 2-3 years of illness in first-episode schizophrenia: a tensor-715
based morphometry study. Neuroimage, 32(2):511-9.716
717

ACC
EPTE
D M
ANU
SCR
IPT
ACCEPTED MANUSCRIPTVoets, N.L. et al.
28
Wisco JJ, Kuperberg G, Manoach D, Quinn BT, Busa E, Fischl B, Heckers S, Sorensen AG (2007).718
Abnormal cortical folding patterns within Broca's area in schizophrenia: Evidence from structural MRI.719
Schizophr Res. 94 (1-3): 317-37720
721
Wright IC, McGuire PK, Poline JB, Travere JM., Murray RM., Frith CD., Frackowiak RS., Friston KJ722
(1995). A voxel-based method for the statistical analysis of gray and white matter density applied to723
schizophrenia. Neuroimage 2(4): 244-52.724
725
726
727
728
729
730
731

ACC
EPTE
D M
ANU
SCR
IPT
ACCEPTED MANUSCRIPTVoets, N.L. et al.
29
TABLE/FIGURE LEGENDS732
733
Figure 1: SBM-based cortical thickness change in adolescent-onset schizophrenia relative to matched734
healthy controls.735
Figure 1 Legend: group-wise GLM analysis of cortical thickness (using globally-normalised thickness736
values) in adolescent-onset schizophrenia compared with age- and gender-matched healthy volunteers737
demonstrated significant grey matter thinning in patients relative to controls in many regions of cortex738
(Table 3) (FDR-corrected to p<0.05).739
740
Figure 2: VBM GM density group difference map rendered onto SBM average surface741
Figure 2 Legend: A. Projection of the VBM-based cortical density group difference result onto the SBM-742
derived group average surface. B. SBM thickness group difference map (FDR-corrected, p<0.05). White743
circles denote regions of density change using VBM not demonstrating reduced thickness with SBM. Green744
boxes identify regions of cortical change consistent between VBM (density reduction in patients) and SBM745
measures (thinning in patients).746
747
Figure 3: Group difference spherical deformation (metric distortion) map748
Figure 3 Legend: Blue: increased metric distortion (increased Jacobian values) in adolescent-onset749
schizophrenic patients relative to healthy volunteers. Red: larger Jacobian values in healthy volunteers750
relative to patients (p<0.05 uncorrected). White circles denote regions where VBM density changes were751
observed but no SBM thinning in patients relative to controls.752
753
Figure 4: SBM discriminative accuracy using scaled thickness754
Figure 4 Legend: Linear Discriminant Analysis using leave-one-out cross-validation on vertex-wise755
thickness measures (across subjects) projected onto the average surface template. Red-yellow regions756
represent areas able to discriminate adolescent-onset schizophrenic patients from healthy controls with757
>70% accuracy (maximum 84%).758
759
RHRH

ACC
EPTE
D M
ANU
SCR
IPT
ACCEPTED MANUSCRIPTVoets, N.L. et al.
30
APPENDICES760
SUPPLEMENTARY MATERIAL761
Figure S1: SBM group analysis using volume change to better approximate VBM density762
Figure S1 Legend: SBM analysis using a volume change measure (thickness divided by metric distortion)763
as a closer approximation to grey matter density estimates used by VBM. Group-wise SBM volume change764
results surprisingly did not match VBM results, suggesting thickness and metric distortion measures are765
not the primary components of VBM density estimates.766
767
Figure S2: Probability map of the average mask of the posterior operculum cluster projected to the768
study-derived average template.769
Figure S2 legend: This region spanned multiple labels of the Desikan template. The VBM left hemisphere770
Heschl’s ROI, when projected to the surface average, consisted of three regions distinct in surface space,771
but clustered together in volume space. Projection of VBM ROIs to the average SBM group surface772
template demonstrated differences in modelling of each method’s raw measures might contribute to773
discrepancy in findings in some of these regions.774
775
Figure S3: SBM group cortical thickness, scaled for global mean cortical thickness776
Figure S3 Legend: Vertex-wise cortical thickness results (FDR-corrected p<0.05) using global mean777
cortical thickness as a regressor of no interest. Red-yellow regions confirm cortical thinning in778
schizophrenic patients relative to controls. Regions of apparent thickening in patients relative to controls779
(blue) emerged when using this alternate scaling approach780

ACC
EPTE
D M
ANU
SCR
IPT
ACCEPTED MANUSCRIPTVoets, N.L. et al.
31
Tables781
Table 1: Patient and healthy volunteer demographics782
Patients Healthy Controls
Gender (Male/Female) 18/7 17/8
Age (mean, standard deviation) 16, +/- 1.4 16 +/- 1.5
IQ (mean, standard deviation) 87 +/- 14 108 +/- 15
Handedness (Right/Left) 20/5 21/4
Age at onset of symptoms Range: 11-17
Mean: 15
+/- 1.6
NA
Disease Duration Mean 1.4 +/- 0.7 NA
Medication 6/25 clozapine,
3/25 quetiapine, 3/25
risperidone,
16/25 olanzapine
NA
Mean duration of treatment
(years)
1.1 +/- 0.7 NA
Chlorpro-mazine equivalents* 340 +/- 180 NA
783
Footnote: Details regarding chlorpromazine equivalents can be found in [77] Bezchlibnyk-Butler and784
Jeffries (2000).785

ACC
EPTE
D M
ANU
SCR
IPT
ACCEPTED MANUSCRIPTVoets, N.L. et al.
32
Table 2: Summary SBM-derived measures of brain differences between patients and controls786
Measure Control Patient Significance (p)
3D volumetric Scaling factor from
native to standard space
1.06 (+/- 0.03) 1.08 (+/- 0.03) 0.03
IntraCranial Volume (mm3) 2110000 (+/- 297000) 1804000 (+/- 341000) <0.01
Left area scaling factor (k) 1.09 (+/- 0.11) 1.15 (+/- 0.11) 0.07
Left White Matter Volume (mm3) 282739 (+/- 40800) 267668 (+/- 31500) 0.18
Left Grey Matter Volume 309231 (+/- 31800) 282550 (+/- 36000) 0.01
Left White Matter Surface area (mm2) 109021 (+/- 10700) 103581 (+/- 9600) 0.08
Left Mean Cortical Thickness (mm) 2.49 (+/- 0.07) 2.40 (+/- 0.15) 0.01
Left Gyral/Sulcal ratio 0.52 (+/- 0.01) 0.51 (+/- 0.01) 0.03
Right area scaling factor (k) 1.09 ( +/- 0.11) 1.15 (+/- 0.11) 0.08
Right White Matter Volume (mm3) 283765 (+/- 37000) 268755 (+/- 32100) 0.15
Right Grey Matter Volume 309550 (+/- 30050) 282888 (+/- 36000) 0.01
Right White Matter Surface area
(mm2)
109184 (+/- 10300) 103849 (+/- 9800) 0.08
Right Mean Cortical Thickness (mm) 2.50 (+/- 0.08) 2.40 (+/- 0.14) 0.01
Right Gyral/Sulcal ratio 0.52 (+/- 0.01) 0.51 (+/- 0.01) 0.02
787
Footnote: metric distortion = k* area of a triangle on a registered sphere /area of triangle on gray/white788
interface surface.789

ACC
EPTE
D M
ANU
SCR
IPT
ACCEPTED MANUSCRIPTVoets, N.L. et al.
33
790
Table 3: Surface-based differences in group thickness791
Left Hemisphere Label t-
stat
MNI 305 coordinates
(x, y, z)
Right Hemisphere
Label
t-
stat
MNI 305 coordinates
(x, y, z)
Lateral wall Lateral wall
Bank of Superior
Temporal Sulcus
4.8 -50.9, -44.2, 4.98 Lateral Occipital 5.4 47.9, -71.7, 4.7
Caudal Middle Frontal 3.7 -25.4, -0.03, 43.9 Rostral Middle Frontal 4.2 28.9, 49.9, -1.84
Inferior/Superior Parietal
border
4.1 -29.1, -60.1, 41.3 Inferior Temporal 4.4 46.4, -57.1, 0.2
Pars Opercularis 4.7 -38.9, 18.1, 19.9 Caudal Middle Frontal 3.2 37.8, 1.8, 36.5
Inferior Parietal 4.1 -31.7, -75.1, 28.3 Superior Temporal 4.0
3.6
38.4, -13.8, -4.5
58.3, -33.1, 19.7
Postcentral/supramarginal 3.9 -39.4, -27, 38.4 Superior Parietal 3.6 20, -64.9, 41.7
Lateral orbitofrontal 3.2 -31.2, 29.5, -1.7 Postcentral/Superior
Parietal
3.9 25.4, -37.5, 51.8
Postcentral 3.0 64.1, -7.4, 17.5
Supramarginal 4.2 41.3, -35.9, 39.9
Medial wall Medial wall
Precuneus 6.2 -4.9, -50.8, 46.3 Precuneus 6.0
4.7
6.2
5.7, -63.9, 32.2
19.7, -62.9, 32.2
11.3, -47.3, 41.3
Lingual 4.5 -13.5, -49.8, -2.7 Lingual 5.3 5.2, -62.9, 7.3
Paracentral 3.4 -10.9, -30.2, 47.3 Paracentral 4.0 13.3, -32.6, 48.8
Cuneus 3.2 -4.9, -81.3, 37.1 Superior Frontal 3.9 10.9, 26.7, 29.8
Posterior cingulate 3.9 4.9, -0.3, 36.8
Table 3 Legend: LH = Left Hemisphere, RH = Right Hemisphere, MNI = Montreal Neurological Institute792
Footnote: Label terms are those of the Desikan template, based on gyral boundaries commonly employed793
in manual segmentations. For further information on labels,see [28].794

ACC
EPTE
D M
ANU
SCR
IPT
ACCEPTED MANUSCRIPTVoets, N.L. et al.
34
795
Table 4a: Anatomical location of regions showing corresponding VBM-based grey matter density796
reductions and SBM-based cortical thinning in patients relative to controls797
Left Hemisphere Label MNI coordinates
(x, y, z)
Right Hemisphere Label MNI coordinates
(x, y, z)
Superior Parietal/Post
central
-30.8, -35.9, 40.8 Rostral Middle
Frontal/Superior Frontal
25.1, 42.9, 19.2
Pars Opercularis -52.4, 13.3, 15.6 Superior Temporal/Insula 39.8, -10.9, -7.1
Superior temporal/Insula -39.4, -14.3, -6.9 Superior Parietal 26.8, -67.5, 32.2
Precuneus -16.4, -70, 38.1 Inferior Temporal 49.3, -51.9, -7.3
Precuneus/Paracentral -10.7, -51.4, 38.7 Posterior Cingulate 6.2, -2.8, 37.9
Precuneus 21.4, -66.4, 32
Footnote: MNI coordinates are presented based on the Montreal Neurological Institute MNI 305798
template.799
800
Table 4b: Anatomical location of regions showing VBM-based grey matter density reductions but no801
corresponding SBM-based cortical thinning in patients relative to controls802
Left Hemisphere Label MNI coordinates
(x, y, z)
Right Hemisphere Label MNI coordinates
(x, y, z)
Inferior Temporal -61.9, -20.9, -10.3 Middle Temporal 57.9, -7.5, -14.4
Superior Frontal -6.9, 17.7, 45.1 Superior Frontal 5.9, 7.6, 53.9
Parietal operculum -47.2, -17.5, 8.5 Parietal operculum 48.0, -19.9, 7.46
Pre/postcentral -49.9, -10.6, 25.9 Pre/postcentral 55.8, -18.4, 25.6
Rostral Anterior
Cingulate/Medial Superior
Frontal
12.7, 43.8, 14.2
803
ACC
EPTE
D M
ANU
SCR
IPT
ACCEPTED MANUSCRIPTVoets, N.L. et al.
35
804
Table 5. Significant area differences between groups within Desikan parcels. Area measures in mm2.805
Parcellation unit Control Patient Significance (p)
Left Cuneus 1900 (+/- 300) 1700 (+/- 280) 0.02
Left Inferior Temporal 4600 (+/- 900) 3900 (+/- 600) 0.01
Left Middle Temporal 4400 (+/- 505) 3900 (+/- 580) 0.01
Left Paracentral 1900 (+/- 400) 1700 (+/- 280) 0.02
Left Postcentral 5400 (+/- 700) 4900 (+/- 670) 0.02
Left Supramarginal 4400 (+/- 810) 4000 (+/- 530) 0.05
Right Inferior Temporal 4500 (+/- 740) 3900 (+/- 560) <0.01
Right Lateral-occipital 5100 (+/- 750) 4600 (+/- 730) 0.05
Right Precentral 6400 (+/- 800) 5800 (+/- 770) 0.03
Right Superior Frontal 10000 (+/- 1300) 9000 (+/- 1200) 0.02
806

ACC
EPTE
D M
ANU
SCR
IPT
ACCEPTED MANUSCRIPTVoets, N.L. et al.
36
Table 6a: Left hemisphere masked SBM results (p values) between adolescent-onset schizophrenic807
patients and healthy controls.808
Measure Left Posterior
Operculum
Left Inferior
Temporal
Left M1 Left SMA
Unscaled
Mask size <0.001 0.005 0.008 0.015
Surface area <0.001 0.001 0.005 0.004
Metric distortion 0.015 0.670 0.003 0.870
Mean thickness 0.089 0.360 0.027 0.420
Volume <0.001 <0.001 <0.001 0.002
Scaled
Scaled mask size 0.001 0.007 0.015 0.027
Scaled surface area <0.001 <0.001 0.046 0.012
Scaled metric distortion 0.075 0.514 0.020 0.510
Scaled thickness 0.150 0.240 0.042 0.540
Scaled volume <0.001 0.001 0.001 0.004
Scaled derived volume 0.007 0.390 0.001 0.980
809
Table 6b: Right hemisphere masked SBM results between adolescent-onset schizophrenic patients810
and healthy controls.811
Measure Right Posterior
Operculum
Right Middle
Temporal
Right M1 Right
SMA
Right medial
frontal/rACC
Unscaled
Mask size 0.003 0.004 0.001 0.020 0.004
Surface area 0.005 0.000 0.003 0.007 0.002
Metric distortion 0.195 0.490 0.110 0.080 0.203
Mean thickness 0.160 0.780 0.120 0.470 0.047
Volume <0.001 <0.001 <0.001 0.001 0.001
Scaled

ACC
EPTE
D M
ANU
SCR
IPT
ACCEPTED MANUSCRIPTVoets, N.L. et al.
37
Scaled mask size 0.005 0.006 0.002 0.030 0.006
Scaled surface area 0.047 0.000 0.140 0.060 0.015
Scaled metric distortion 0.450 0.170 0.220 0.200 0.093
Scaled thickness 0.230 0.670 0.170 0.580 0.001
Scaled volume 0.001 <0.001 <0.001 0.002 0.115
Scaled volume change 0.230 0.080 0.123 0.08 0.030
812
Table 6 Legend: Mask size: voxel count in native space. Volume: approximated mid-thickness area *813
thickness. Scaled mask size: mask size * average scaling. Scaled thickness: mean thickness * cube root of814
the average scaling. Scaled area: surface area divided by the mask size^2/3. Scaled volume: the SBM815
estimated volume * the average scaling. Scaled metric distortion: the mesh triangle area change from the816
white matter surface to the spherical surface scaled by the ratio of the total surface areas of these surfaces.817
Scaled volume change: scaled mean thickness divided by the scaled metric distortion. Significant volume818
differences were corrected for the mask size in the subject’s native space.819
820
821
822
823
824
825
826
827
828
829
830
831
832
833
834

ACC
EPTE
D M
ANU
SCR
IPT
ACCEPTED MANUSCRIPTVoets, N.L. et al.
38
835
836
837
838
839
840
841
842
843
844
845
846
847
848
849
850
851
852
853
854
855
856
857
858
859
860
861
862

ACC
EPTE
D M
ANU
SCR
IPT
ACCEPTED MANUSCRIPTVoets, N.L. et al.
39
863
864
865
866
867
868
869
870
871
872
873
874
875
876
877
878
879
880
881
882
883
884
885
886
887
888
889
890

ACC
EPTE
D M
ANU
SCR
IPT
ACCEPTED MANUSCRIPTVoets, N.L. et al.
40
891
892
893
894
895
896
897
898
899
900
901
902
903
904
905
906
907
908
909
910
911
912
913
914
915
916
917
918

ACC
EPTE
D M
ANU
SCR
IPT
ACCEPTED MANUSCRIPTVoets, N.L. et al.
41
919
920
921
922
923
924
925
926
927
928
929
930
931
932
933
934
935
936
937
938
939
940
941
942
943
944
945