neuroanatomic and functional correlates of depressed mood
TRANSCRIPT

American Journal of EpidemiologyCopyright © 1999 by The Johns Hopkins University School of Hygiene and Public HealthAll rights reserved
Vol. 150, No. 9Printed in U.S.A.
Neuroanatomic and Functional Correlates of Depressed Mood
The Cardiovascular Health Study
Reiko Sato,1 R. Nick Bryan,2 and Linda P. Fried13
Although a number of studies suggest an association between stroke and depression, few have examined therelation between magnetic resonance imaging (MRI)-identified lesions and depression among community-dwelling older adults. This cross-sectional study sought to assess the association between MRI infarcts in thebasal ganglia and non-basal-ganglia areas, potential functional consequences of these lesions, and depressivesymptomatology in 3,371 US men and women aged 65 years or older who participated in the CardiovascularHealth Study between 1992 and 1994. By using multiple linear regression models, the authors found that afteradjustment for age, gender, and stroke history, Center for Epidemiologic Studies Depression Scale scores wereindependently associated with non-basal-ganglia lesions (p = 0.04) but were not independently associated withbasal ganglia lesions (p = 0.11). When measures of physical disability and cognitive impairment were added tothe models, these measures displaced MRI-identified infarcts in their association with depressive symptoms. Inadditional models, hemispheric location and size of the basal ganglia lesion were found to have no relation todepression levels. These results suggest that the functional consequences of cerebrovascular disease may bethe causal pathway by which basal ganglia and non-basal-ganglia lesions are associated with depressivesymptomatology. Am J Epidemiol 1999;150:919-29.
aged; cerebral infarction; cerebrovascular disorders; depression; magnetic resonance imaging
Major depression afflicts an estimated 1-2 percent ofolder adults who live in the community, and another 10percent show symptoms of depression (1). Despite thefrequency of this condition, the causes of late-lifedepression are poorly understood. The few studies thathave examined late-life depression have not found anystrong evidence to suggest a genetic predisposition oralteration in psychosocial factors as the etiology (2-4).However, there is evidence that certain diseases maybe associated with depression, including stroke.
Imaging studies on selected depressed older patientshave shown that a high proportion of them have basalganglia lesions (5, 6). Studies on poststroke depression
Received for publication June 17, 1998, and accepted for publi-cation February 18, 1999.
Abbreviations: ADL, activities of daily living; CES-D, Center forEpidemiologic Studies Depression Scale; IADL, instrumental activi-ties of daily living; MRI, magnetic resonance imaging; 3MS, ModifiedMini-Mental State Examination.
1 Department of Epidemiology, The Johns Hopkins UniversitySchool of Hygiene and Public Health, Baltimore, MD.
2 Division of Neuroradiology, The Johns Hopkins MedicalInstitutions, Baltimore, MD.
3 Department of Medicine, Welch Center for Prevention,Epidemiology, and Clinical Research, The Johns Hopkins MedicalInstitutions, Baltimore, MD.
Reprint requests to Dr. Linda P. Fried, Departments of Medicineand Epidemiology, Welch Center for Prevention, Epidemiology, andClinical Research, 2024 East Monument Street, Suite 2-600,Baltimore, MD 21205-2223.
suggest that the relation between basal ganglia lesionsand depression is independent of physical and cogni-tive impairments (7, 8). Specific mechanisms hypoth-esized to link basal ganglia lesions and depression arebased on the unique anatomic position of the basalganglia and its role as a modulator of the limbic sys-tem (9). Direct injury to the midbrain monoamine neu-rons or disruption of their cortical projections isthought to affect mood by causing neurochemicalchanges (10). Thus, it is thought that an organic originof late-life depression has been supported in thesestroke studies. Despite these findings, previous studiesexamining the relation between basal ganglia lesionsand depression have had a number of limitations.These studies evaluated, fairly exclusively, small num-bers of patients with a history of stroke and/or fromneurologic and psychiatric centers, and there was alack of standardized imaging protocols and insufficientinformation on potentially confounding risk factors.Furthermore, the potential roles of basal ganglia andnon-basal-ganglia lesions in depression among com-munity-dwelling older adults were not delineated,although hypotheses have centered specifically onbasal ganglia lesions as the basis for depression instroke.
The Cardiovascular Health Study recently reportedthat 36 percent of community-dwelling older adults
919
Dow
nloaded from https://academ
ic.oup.com/aje/article/150/9/919/55274 by guest on 25 N
ovember 2021
920 Sato et al.
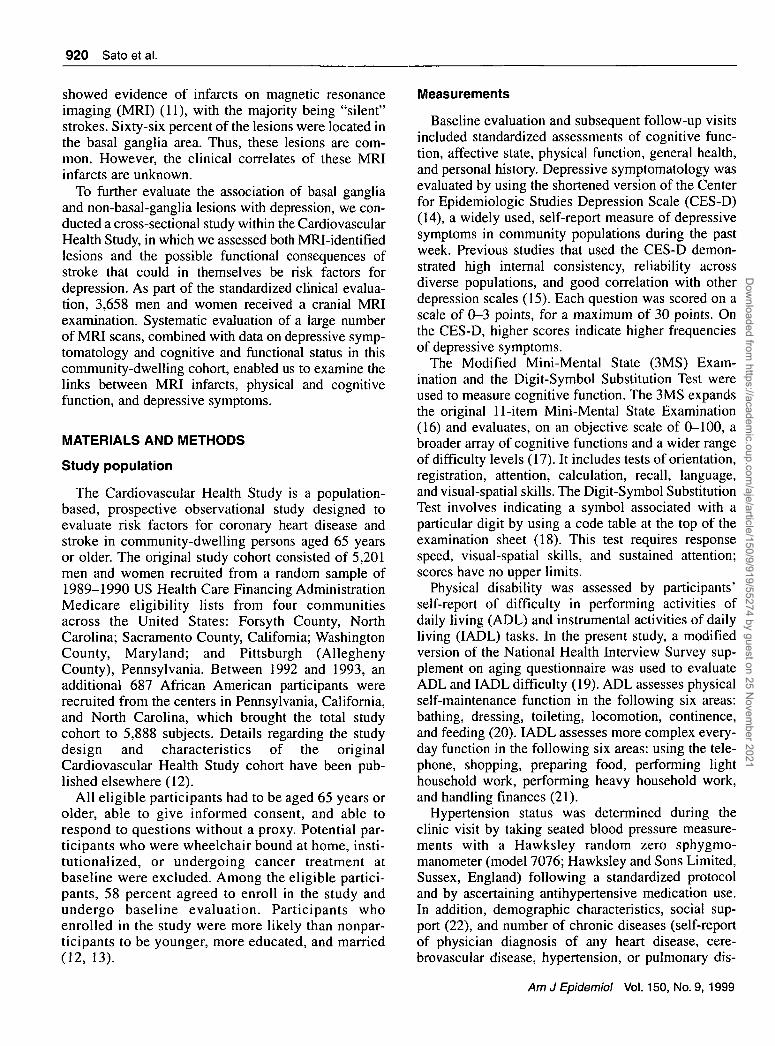
showed evidence of infarcts on magnetic resonanceimaging (MRI) (11), with the majority being "silent"strokes. Sixty-six percent of the lesions were located inthe basal ganglia area. Thus, these lesions are com-mon. However, the clinical correlates of these MRIinfarcts are unknown.
To further evaluate the association of basal gangliaand non-basal-ganglia lesions with depression, we con-ducted a cross-sectional study within the CardiovascularHealth Study, in which we assessed both MRI-identifiedlesions and the possible functional consequences ofstroke that could in themselves be risk factors fordepression. As part of the standardized clinical evalua-tion, 3,658 men and women received a cranial MRIexamination. Systematic evaluation of a large numberof MRI scans, combined with data on depressive symp-tomatology and cognitive and functional status in thiscommunity-dwelling cohort, enabled us to examine thelinks between MRI infarcts, physical and cognitivefunction, and depressive symptoms.
MATERIALS AND METHODS
Study population
The Cardiovascular Health Study is a population-based, prospective observational study designed toevaluate risk factors for coronary heart disease andstroke in community-dwelling persons aged 65 yearsor older. The original study cohort consisted of 5,201men and women recruited from a random sample of1989-1990 US Health Care Financing AdministrationMedicare eligibility lists from four communitiesacross the United States: Forsyth County, NorthCarolina; Sacramento County, California; WashingtonCounty, Maryland; and Pittsburgh (AlleghenyCounty), Pennsylvania. Between 1992 and 1993, anadditional 687 African American participants wererecruited from the centers in Pennsylvania, California,and North Carolina, which brought the total studycohort to 5,888 subjects. Details regarding the studydesign and characteristics of the originalCardiovascular Health Study cohort have been pub-lished elsewhere (12).
All eligible participants had to be aged 65 years orolder, able to give informed consent, and able torespond to questions without a proxy. Potential par-ticipants who were wheelchair bound at home, insti-tutionalized, or undergoing cancer treatment atbaseline were excluded. Among the eligible partici-pants, 58 percent agreed to enroll in the study andundergo baseline evaluation. Participants whoenrolled in the study were more likely than nonpar-ticipants to be younger, more educated, and married(12, 13).
Measurements
Baseline evaluation and subsequent follow-up visitsincluded standardized assessments of cognitive func-tion, affective state, physical function, general health,and personal history. Depressive symptomatology wasevaluated by using the shortened version of the Centerfor Epidemiologic Studies Depression Scale (CES-D)(14), a widely used, self-report measure of depressivesymptoms in community populations during the pastweek. Previous studies that used the CES-D demon-strated high internal consistency, reliability acrossdiverse populations, and good correlation with otherdepression scales (15). Each question was scored on ascale of 0-3 points, for a maximum of 30 points. Onthe CES-D, higher scores indicate higher frequenciesof depressive symptoms.
The Modified Mini-Mental State (3MS) Exam-ination and the Digit-Symbol Substitution Test wereused to measure cognitive function. The 3MS expandsthe original 11-item Mini-Mental State Examination(16) and evaluates, on an objective scale of 0-100, abroader array of cognitive functions and a wider rangeof difficulty levels (17). It includes tests of orientation,registration, attention, calculation, recall, language,and visual-spatial skills. The Digit-Symbol SubstitutionTest involves indicating a symbol associated with aparticular digit by using a code table at the top of theexamination sheet (18). This test requires responsespeed, visual-spatial skills, and sustained attention;scores have no upper limits.
Physical disability was assessed by participants'self-report of difficulty in performing activities ofdaily living (ADL) and instrumental activities of dailyliving (IADL) tasks. In the present study, a modifiedversion of the National Health Interview Survey sup-plement on aging questionnaire was used to evaluateADL and IADL difficulty (19). ADL assesses physicalself-maintenance function in the following six areas:bathing, dressing, toileting, locomotion, continence,and feeding (20). IADL assesses more complex every-day function in the following six areas: using the tele-phone, shopping, preparing food, performing lighthousehold work, performing heavy household work,and handling finances (21).
Hypertension status was determined during theclinic visit by taking seated blood pressure measure-ments with a Hawksley random zero sphygmo-manometer (model 7076; Hawksley and Sons Limited,Sussex, England) following a standardized protocoland by ascertaining antihypertensive medication use.In addition, demographic characteristics, social sup-port (22), and number of chronic diseases (self-reportof physician diagnosis of any heart disease, cere-brovascular disease, hypertension, or pulmonary dis-
Am J Epidemiol Vol. 150, No. 9, 1999
Dow
nloaded from https://academ
ic.oup.com/aje/article/150/9/919/55274 by guest on 25 N
ovember 2021

MRI Lesions and Depression 921
ease; self-report of cancer or arthritis) were consid-ered. To validate self-report of any cardiovasculardisease, a morbidity and mortality classification com-mittee followed standardized methods and reviewedmedical records and clinical adjudication (23).
MRI definition and grading
As part of the extended Cardiovascular Health Studyfollow-up protocol, all members of the cohort wereinvited to have cranial MRI scans during year 5 or 6 ofthe study (24, 25). Study participants who had no con-traindications to MRI scanning and were able to toler-ate the procedure underwent the standardized imagingprotocol. Contraindications included having metallicor electrical implants.
The MRI scans were performed by using 1.5 T scan-ners at three field centers and a 0.35 T instrument at thefourth field center (25). Midline sagittal images wereused to identify the anterior commissure-posteriorcommissure line along which subsequent oblique axialscans were aligned. By using a double spin echo tech-nique, spin density and T2 weighted (3,000, 30/90, 0.5or 1 (TR, TE, NEX)) images were obtained. By using asingle spin echo technique, Tl weighted (500, 20, 1 or2) images were also obtained. All images were obliqueaxial scans, extending from the vertex to the foramenmagnum. For both the Tl and T2 weighted images, aseries of sections 5 mm thick with no interslice gapswere obtained in the axial plane.
MRI infarcts were defined as focal, nonmasslesions with a vascular pattern that were hyperintenseto gray matter on both spin density and T2 weightedimages and were 3 mm or larger (11). Location of theMRI infarcts was classified as one or more of 23regions defined by gross anatomic location and vas-cular territory. For our study, basal ganglia includedthe caudate nucleus, lentiform nucleus, internal cap-sule, and thalamus. Lesion size was determined byusing electronic cursor methods. The maximumlesion dimension was recorded as the larger of theanterior-to-posterior or right-to-left measurements.To take into account those persons who had more thanone basal ganglia lesion, the maximum dimensions ofall basal ganglia lesions were summed to provide anoverall size. In addition, white matter grade andglobal brain atrophy, as reflected by ventricle and sul-cal size, were graded according to predefined visualstandards. White matter grade was assessed by grad-ing the extent of increased white matter signal inten-sity on the spin density images in the periventricularand subcortical white matter area. The grading scalecontains 10 points from 0 to 9. A higher score indi-cates a higher white matter grade or larger ventriclesor sulci (11, 26).
The MRI scans were reviewed by trained readersblinded to clinical data. These readers included boardcertified radiologists with subspecialty training in neu-roimaging as well as a proficient neuroimaging tech-nologist. All readers underwent an MRI interpretationtraining course specifically designed for theCardiovascular Health Study. For MRI infarcts of >3mm, the kappa statistics were 0.59 and 0.63 for inter-rater reliability and intrarater reliability, respectively(11).
Data analysis
A cross-sectional study design was used to investi-gate the association between depressive symptomatol-ogy and MRI infarcts in both the basal ganglia andnon-basal-ganglia regions. Since the MRI scans wereconducted over a period of 3 years, the CES-D scoreand other non-MRI variables that were evaluated foreach person were selected from the annual examina-
. tion just preceding but closest in time to the MRI scanconducted for that person. Excluded from the analysiswere participants with missing CES-D scores (n = 9),poor-quality scans (n - 51), incorrect MRI protocols(n = 211), and incomplete MRI data sets (n = 99). Forthe analysis, the cohort was subdivided into the fol-lowing four groups: group 1, no MRI infarct; group 2,MRI infarcts in the basal ganglia region only; group 3,MRI infarcts in the non-basal-ganglia region only; andgroup 4, MRI infarcts in both the basal ganglia andnon-basal-ganglia regions.
The data were first summarized with descriptive sta-tistics by using analysis of variance for continuousmeasures and the chi-square test for categorical data.The second phase of the analysis examined the bivari-ate associations of participants' medical, functional,and demographic variables with both MRI infarcts anddepression on the basis of a priori hypotheses. Oncebivariate analyses identified the significant variables,the independent association of basal ganglia and non-basal-ganglia lesions with CES-D score was deter-mined with multiple linear regression models. A for-ward sequential selection was performed by enteringall variables associated in the bivariate analyses withboth basal ganglia and non-basal-ganglia lesions andCES-D score. Dummy variables were used to enterlesion site. Additionally, to assess the potential impactof selection bias, each variable from the final modelwas removed one at a time, and the remaining modelwas reestimated to determine if the regression coeffi-cient and significance level changed.
Because distribution of the CES-D score was highlyskewed, a square root transformation was performed tonormalize the score. Similarly, the size of the basalganglia lesions was transformed by the natural loga-
Am J Epidemiol Vol. 150, No. 9, 1999
Dow
nloaded from https://academ
ic.oup.com/aje/article/150/9/919/55274 by guest on 25 N
ovember 2021

922 Sato et al.
rithm to achieve normality. We also centralized themean on all continuous variables to make the interceptreadily interpretable. Thus, the intercept would beinterpreted as the average square root of the CES-Dscore for the Cardiovascular Health Study cohortbased on the variables provided in the regressionmodel. Statistical Software for Social Sciences (SPSS)for Microsoft Windows was used for the analysis (27).
RESULTS
Of the 5,888 members of the Cardiovascular HealthStudy cohort, 3,658 (62 percent) completed the cranialMRI examination successfully. Among the 2,230remaining people, 2 percent died prior to MRI exami-nation, 19 percent had contraindications to having anMRI scan performed, 33 percent attempted but wereunable to complete MRI imaging, and 46 percentrefused to participate. A comparison of selected char-acteristics between participants who completed theMRI examination and those who did not have theexamination is shown in table 1. Participants whocompleted MRI scanning were significantly younger,were more functionally able, had a lower prevalence ofhypertension, and had less depressive symptomatologyaccording to CES-D score.
After participants with missing CES-D scores andmissing or poor-quality MRI data were excluded,3,371 subjects (57 percent) from the totalCardiovascular Health Study cohort were included inthe present study. Their characteristics at baseline arepresented in tables 2 and 3, stratified by the presenceand location of MRI infarcts. In the univariate analy-sis, the group with no lesions was significantlyyounger, more functionally able, and generally health-ier than the three groups with lesions. Among thosewith only one type of lesion, white matter grade wassignificantly higher in subjects with basal ganglialesions, while subjects with non-basal-ganglia lesionshad more physician-confirmed history of stroke.Otherwise, the two groups' characteristics were simi-lar. Participants with both types of lesions had theworst functional status, more MRI abnormalities, anda higher prevalence of hypertension compared with theremaining three groups.
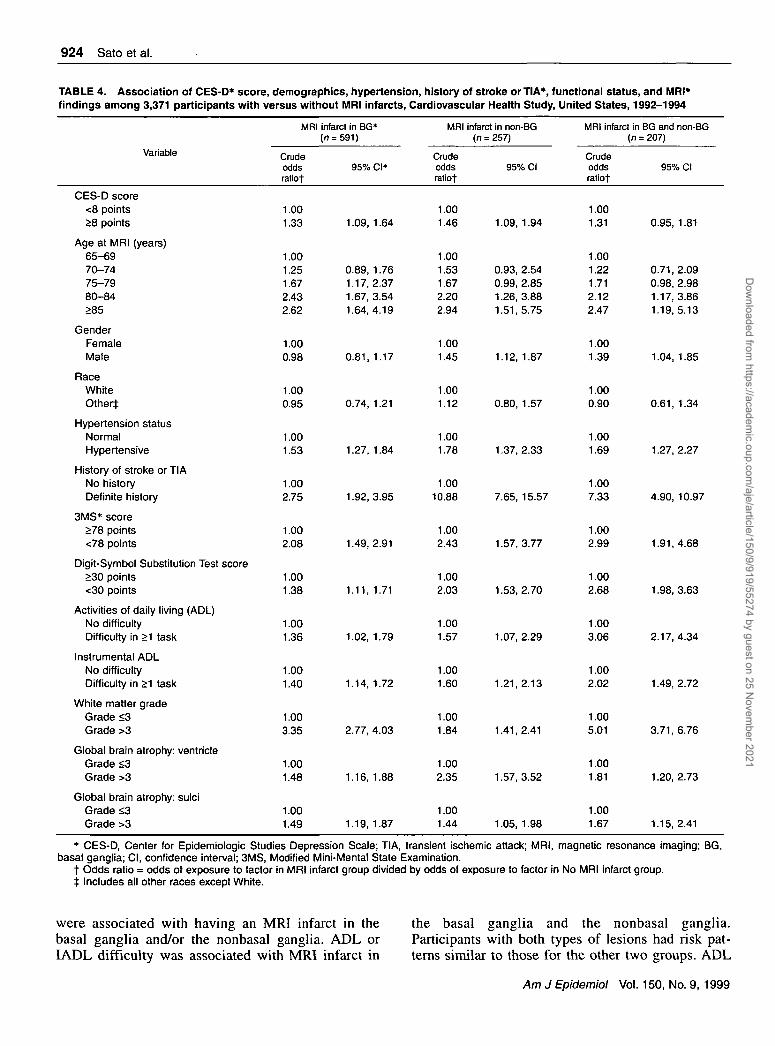
Table 4 displays the crude estimated risks of havingan MRI infarct in the basal ganglia and/or non-basal-ganglia regions, compared with those without anylesions, in relation to potentially associated character-istics. Increasing age, hypertension, history of strokeor transient ischemic attack, impaired cognition,greater brain atrophy, and higher white matter grade
TABLE 1. Baseline comparison of Center for Epidemiologic Studies Depression Scale (CES-D) scores and demographic,functional status, and general health status variables among Cardiovascular Health Study participants (n = 5,888) whounderwent magnetic resonance imaging (MRI) and those who did not, United States, 1989-1990
Variable
Age (years)
Difficulties in$Activities of daily living (ADL)Instrumental ADL
CES-D score
3MS* score
Digit-Symbol Substitution Test score
GenderMaleFemale
Hypertension statusNormalBorderlineHypertensive
History of stroke or TIA*No historyPossible historyDefinite history
MRI
Mean(SE«)
72.2 (0.085)
0.09 (0.007)0.29(0.010)
4.39 (0.072)
90.7 (0.133)
38.0 (0.217)
(n = 3,660)
No.(%)
1,528(41.7)2,132 (58.3)
1,629(44.6)533 (14.6)
1,489(40.8)
3,444(94.1)73 (2.0)
143 (3.9)
NoMRI(n =
Mean(SE)
73.7(0.133)
0.20(0.013)0.49 (0.019)
5.22 (0.105)
87.4 (0.262)
33.6 (0.307)
2,228)
No.(%)
967 (43.4)1,261 (56.6)
805 (36.2)338(15.2)
1,078(48.6)
2,066 (92.7)55 (2.5)
107 (4.8)
Test ofsignificance!
p value
<0.001
<0.001<0.001
<0.001
<0.001
<0.001
0.213
<0.001
0.115
* SE, standard error; 3MS, Modified Mini-Mental State Examination; TIA, transient ischemic attack.t f test for continuous variables, chi-square test for categorical variables.X Mean number of difficulties in performing ADL or instrumental ADL tasks (0-6 scale).
Am J Epidemiol Vol. 150, No. 9, 1999
Dow
nloaded from https://academ
ic.oup.com/aje/article/150/9/919/55274 by guest on 25 N
ovember 2021

MRI Lesions and Depression 923
TABLE 2. Distribution of demographic and general health status variables, by magnetic resonance imaging (MRI)infarct-defined groups, among 3,371 Cardiovascular Health Study participants, United States, 1992-1994
Variable
Total
GenderMaleFemale
RaceWhiteAfrican AmericanOther
General healthGood to excellentFair to poor
Hypertension statusNormalHypertensive
History of stroke or TIA*No historyDefinite or possible history
NoMRI infarct
No.
2,316
9421,374
1,938366
12
1,858451
1,2761,038
2,23680
%
100.0
40.659.4
83.815.70.5
80.519.5
55.144.9
96.53.5
MRI infarctinBG*
No.
591
237354
499884
466124
248343
53853
%
100.0
40.259.8
84.614.70.7
78.921.1
42.058.0
91.09.0
MRI infarctin non-BG
No.
257
128129
21143
3
18275
111146
18572
%
100.0
49.850.2
82.116.7
1.2
70.829.2
43.256.8
72.028.0
MRI infarct inBG and non-BG
No.
207
101106
176310
15156
85122
16443
%
100.0
48.851.2
85.015.00.0
72.927.1
41.158.9
79.220.8
Chi-square
testp value
0.006f
0.720
<0.001t
<0.0001t
<0.001§
* BG, basal ganglia; TIA, transient ischemic attack.t No significant differences between No MRI infarct and MRI infarct in BG groups (p > 0.05); significant differences between MRI infarct
in non-BG and MRI infarct in BG groups (p = 0.009 for gender and p = 0.010 for general health).t Significant differences between No MRI infarct and MRI infarct in BG groups (p < 0.0001); no significant differences among MRI infarct
in BG, MRI infarct in non-BG, and MRI infarct in both locations groups (p = 0.379).§ Borderline significance between MRI infarct in non-BG and MRI infarct in both types of lesions groups (p= 0.066); significant differences
in the remaining other combination of two groups (p < 0.001).
TABLE 3. Distribution of age, Center for Epidemiologic Studies Depression Scale (CES-D) score, functional status, andmagnetic resonance imaging (MRI) characteristics, by MRI infarct-defined groups, among 3,371 Cardiovascular HealthStudy participants, United States, 1992-1994
Variable
Age (years)
CES-D score
Functional statusActivities of daily living
(ADL)*Instrumental ADL*3MS* scoreDigit Symbol Substitution
Test score
MRI characteristics§White matter gradeGlobal brain atrophy:
ventricleGlobal brain atrophy:
sulci
Mear
74.5
4.8
NoMRI infarct(n = 2,316)
i 95% Cl*
74.3, 74.7
4.6, 5.0
0.12 0.10,0.140.26 0.23, 0.28
92.2
40.9
1.9
3.5
3.3
91.9, 92.5
40.3,41.4
1.9,2.0
3.4, 3.5
3.3, 3.4
MRI infarct
<•
Mean
76.0
5.5
0.180.39
90.9
37.5
3.0
3.7
3.5
in BG*r> = 591)
95% Cl
75.6, 76.5
5.1,5.9
0.13, 0.230.32, 0.4590.2,91.6
36.4, 38.6
2.8, 3.1
3.6, 3.8
3.4, 3.6
MRI infarctin(n
Mean
75.6
5.7
0.180.42
89.8
36.2
2.4
3.9
3.6
non-BG= 257)
95% Cl
74.9, 76.3
5.1, 6.4
0.11,0.250.31,0.5388.8, 90.7
34.5, 37.9
2.2, 2.6
3.7, 4.1
3.4, 3.8
MRI infarct inBG and non-BG
(n
Mean
75.9
5.2
0.320.48
89.3
34.3
3.1
3.9
3.7
= 207)
95% Cl
75.2, 76.7
4.5, 5.9
0.21,0.420.26, 0.6187.9, 90.7
32.4, 36.3
2.9, 3.3
3.7, 4.1
3.5, 3.8
ANOVA*,tcomparingMRI infarct
p value
0.761
0.433
0.00080.1830.017
0.014
<0.0001
0.017
0.213
* BG, basal ganglia; ANOVA, analysis of variance; Cl, confidence interval; 3MS, Modified Mini-Mental State Examination,t Simple factorial ANOVA used for age, CES-D score, 3MS score, and Digit-Symbol Substitution Test score; Kruskal-Wallis ANOVA used
for others. All ANOVAs compare the three groups with MRI infarcts.% Mean number of difficulties in performing ADL or instrumental ADL tasks (0-6 scale).§ The mean describes the degree of white matter signal intensity or brain atrophy (0-9 scale).
Am J Epidemiol Vol. 150, No. 9, 1999
Dow
nloaded from https://academ
ic.oup.com/aje/article/150/9/919/55274 by guest on 25 N
ovember 2021
924 Sato et al.
TABLE 4. Association of CES-D* score, demographics, hypertension, history of stroke orTIA*, functional status, and MRI*findings among 3,371 participants with versus without MRI infarcts, Cardiovascular Health Study, United States, 1992-1994
Variable
CES-D score<8 points>8 points
Age at MRI (years)65-6970-7475-7980-84>85
GenderFemaleMale
RaceWhiteOther):
Hypertension statusNormalHypertensive
History of stroke or TIANo historyDefinite history
3MS* score>78 points<78 points
Digit-Symbol Substitution Test score>30 points<30 points
Activities of daily living (ADL)No difficultyDifficulty in >1 task
Instrumental ADLNo difficultyDifficulty in >1 task
White matter gradeGrade <3Grade >3
Global brain atrophy: ventricleGrade £3Grade >3
Global brain atrophy: sulciGrade <3Grade >3
MRI
Crudeoddsratiot
1.001.33
1.001.251.672.432.62
1.000.98
1.000.95
1.001.53
1.002.75
1.002.08
1.001.38
1.001.36
1.001.40
1.003.35
1.001.48
1.001.49
infarct in BG*(n = 591)
95% Cl*
1.09, 1.64
0.89, 1.761.17,2.371.67,3.541.64,4.19
0.81, 1.17
0.74, 1.21
1.27, 1.84
1.92, 3.95
1.49,2.91
1.11, 1.71
1.02, 1.79
1.14, 1.72
2.77, 4.03
1.16, 1.88
1.19, 1.87
MRI
Crudeoddsratiot
1.001.46
1.001.531.672.202.94
1.001.45
1.001.12
1.001.78
1.0010.88
1.002.43
1.002.03
1.001.57
1.001.60
1.001.84
1.002.35
1.001.44
infarct in non-BG(n=257)
95% Cl
1.09,1.94
0.93, 2.540.99, 2.851.26,3.881.51,5.75
1.12, 1.87
0.80, 1.57
1.37,2.33
7.65, 15.57
1.57,3.77
1.53,2.70
1.07,2.29
1.21,2.13
1.41,2.41
1.57, 3.52
1.05, 1.98
MRI infarct in BG and non-BG(n = 207)
Crudeoddsratiot
1.001.31
1.001.221.712.122.47
1.001.39
1.000.90
1.001.69
1.007.33
1.002.99
1.002.68
1.003.06
1.002.02
1.005.01
1.001.81
1.001.67
95% Cl
0.95, 1.81
0.71,2.090.98, 2.981.17,3.861.19,5.13
1.04, 1.85
0.61, 1.34
1.27, 2.27
4.90, 10.97
1.91,4.68
1.98,3.63
2.17,4.34
1.49,2.72
3.71,6.76
1.20, 2.73
1.15,2.41
* CES-D, Center for Epidemiologic Studies Depression Scale; TIA, transient ischemic attack; MRI, magnetic resonance imaging; BG,basal ganglia; Cl, confidence interval; 3MS, Modified Mini-Mental State Examination.
t Odds ratio = odds of exposure to factor in MRI infarct group divided by odds of exposure to factor in No MRI infarct group.t Includes all other races except White.
were associated with having an MRI infarct in thebasal ganglia and/or the nonbasal ganglia. ADL orIADL difficulty was associated with MRI infarct in
the basal ganglia and the nonbasal ganglia.Participants with both types of lesions had risk pat-terns similar to those for the other two groups. ADL
Am J Epidemiol Vol. 150, No. 9, 1999
Dow
nloaded from https://academ
ic.oup.com/aje/article/150/9/919/55274 by guest on 25 N
ovember 2021

MRI Lesions and Depression 925
difficulties were much more strongly associated withthe presence of lesions in both the basal ganglia andnon-basal-ganglia areas (odds ratio = 3.06) comparedwith the risks for persons with lesions in just one area(odds ratios = 1.36 and 1.57, respectively; 95 percentconfidence limits did not include 1 for any of theseassociations).
We next evaluated the association of depressivesymptomatology, as measured by CES-D scores, withpotential confounders. Results of the bivariate analy-ses with CES-D score as an outcome and the variousfactors as the exposure are presented in table 5.Depressive symptomatology was associated with poorfunctional status, female gender, older age, and raceother than White. Among the MRI findings, white mat-ter grade, ventricular atrophy, and the presence of anyMRI lesion were significantly associated with depres-sive symptoms. A history of stroke or transientischemic attack as well as hypertension also were asso-ciated with depressive symptomatology.
Finally, we evaluated the characteristics that wereindependently associated with CES-D scores. Theresults of six different multiple linear regression mod-els, considered sequentially, are shown in table 6.Basal ganglia lesions were not associated with CES-D
TABLE 5. Association of Center for EpidemiologicStudies Depression Scale (CES-D) score* with demographic,functional status, and magnetic resonance imaging findingsamong 3,371 Cardiovascular Health Study participants, UnitedStates, 1992-1994
Warm NoVdilclUlU
Age (years)Gender§RaceH3MS$ scoreDigit-Symbol Substitution
Test scoreActivities of daily living (ADL)Instrumental ADLHistory of stroke or TIAtHypertensionWhite matter grade
Global brain atrophy:ventricle
Global brain atrophy:sulci
Any lesion
CES-D score
Betat (SE$)
0.018 (0.004)-0.364 (0.040)
0.212 (0.054)-0.019 (0.002)
-0.012 (0.001)0.403 (0.036)0.348 (0.026)0.256 (0.076)0.125(0.040)0.064(0.014)
0.034 (0.016)
0.005 (0.017)0.149 (0.043)
Significance
<0.0001<0.0001
0.0001<0.0001
<0.0001<0.0001<0.0001
0.00080.0017
<0.0001
0.0296
0.77590.0005
* CES-D was square root transformed.t Beta corresponds to the square root increase in the CES-D
score per unit increase in the covariate.t SE, standard error; 3MS, Modified Mini-Mental State Exami-
nation; TIA, transient ischemic attack.§ 0 = female, 1 = male.H 0 = White, 1 = other.
score (p = 0.07) when adjustments were made for MRIinfarcts in non-basal-ganglia regions, age, and gender(model 1). However, non-basal-ganglia lesions wereassociated with CES-D score (p = 0.005). Model 2 dis-plays the same model with the addition of history ofstroke or transient ischemic attack. The results wereconsistent with those from model 1. Next, white mat-ter grade was added to the model (model 3) and wasfound to be independently associated (p = 0.036).Interestingly, however, the association of white mattergrade itself with depression levels lost significance insubsequent models when variables reflecting distalconsequences of cerebrovascular disease were entered:impairments in cognitive and physical function.
In model 5, MRI infarcts, whether in the basal gangliaor non-basal-ganglia regions, were not associated withdepressive symptomatology when adjustments weremade for measures of physical and cognitive functionand for white matter grade. Difficulty in performing oneor more IADL tasks was the variable most stronglyassociated with depression levels. ADL difficulty, 3MSscore, and Digit-Symbol Substitution Test score all wereindependently significant predictors of CES-D scores,even though all of these functional measurements in ourstudy were highly correlated. Age was not related todepression levels after adjustment for functional mea-sures, while being female remained associated.
In model 6, we also adjusted for factors that otherstudies have associated with depressive symptomatol-ogy; income, social support, and number of chronicdiseases were each independently associated withdepressive symptomatology, but marital status wasnot. After adjustment for these potential confounders,depressive symptomatology remained associated withdifficulty in performing IADL and ADL tasks and with3MS score. A separate logistic regression modeldichotomizing the CES-D score (<8 vs. >8) led to sim-ilar results.
We also examined the association of any MRIinfarct with depressive symptomatology. The presenceof any MRI infarct was associated with depressivesymptomatology (p = 0.02, data not shown) afteradjustment for age, gender, and history of stroke ortransient ischemic attack; however, having any MRIinfarct was no longer associated after adjustment forthe variables in model 6 (p = 0.64).
We performed a similar multiple linear regressionanalysis to assess the association of size and lateralityof basal ganglia lesions with CES-D score. The analy-ses were restricted to the 798 participants who hadbasal ganglia lesions. No association was foundbetween size or hemispheric location of the basal gan-glia lesions and levels of depressive symptoms (p =0.19 for size, p = 0.82 for laterality). As was suggested
Am J Epidemiol Vol. 150, No. 9, 1999
Dow
nloaded from https://academ
ic.oup.com/aje/article/150/9/919/55274 by guest on 25 N
ovember 2021

926 Sato et al.
TABLE 6. Regression coefficients (beta) and their standard errors for multiple linear regression models of Center forEpidemiologic Studies Depression Scale (CES-D) score* in relation to MRIf infarct in basal ganglia (BG) and in non-BG,demographics, white matter grade, history of stroke or transient ischemic attack (TIA), and functional status among3,220* Cardiovascular Health Study participants, United States, 1992-1994
Variable(increment for beta§)
Model 1 ( f l z = 0.035)BetaStandard error of betap value
Model 2 ( f l * = 0.038)BetaStandard error of betap value
Model 3 (R2 = 0.039)BetaStandard error of betap value
Model 4 (R! = 0.074)BetaStandard error of betap value
Model 5 ( f l 2 = 0.095)BetaStandard error of betap value
Model 6 t t ( R 2 = 0.183)BetaStandard error of betap value
Intercept
2.0460.029
2.0400.029
2.0470.029
2.0450.029
2.0700.029
2.0500.043
MRIinfarct
inBGH
0.1000.0540.066
0.0870.0540.110
0.0570.0560.307
0.0310.0550.577
0.0240.0550.662
0.0710.0560.204
MRIinfarct
innon-BGH
0.2210.0780.005
0.1620.0800.044
0.1500.0800.062
0.1130.0780.154
0.0840.0780.281
0.1210.0820.137
Inter-actionforBG
andnon-BG
-O.2080.1230.092
-0.1730.1240.162
-0.1670.1240.178
-0.1600.1210.187
-0.1780.1200.138
-0.2160.1240.082
History ofstroke or
TIAH
0.2610.0820.001
0.2530.0820.002
0.1880.0810.020
0.1490.0800.063
0.0230.0870.787
Age(years)
atMRI
0.0180.004
<0.001
0.0180.004
<0.001
0.0150.004
<0.001
0.0100.0040.022
0.0010.0040.702
<0.0010.0050.935
Gender#
-0.3840.041
<0.001
-0.3930.041
<0.001
-0.3870.041
<0.001
-0.3200.041
<0.001
-0.3380.040
<0.001
-0.3280.045
<0.001
Whitemattergrade(0-9)
by MRI
0.0320.0150.036
0.0270.0150.071
0.0140.0150.344
-0.0060.0160.707
Instru-mental
A D L t , "
0.3360.030
<0.001
0.2450.036
<0.001
0.1680.038
<0.001
ADL**
0.1760.046
<0.001
0.1690.047
<0.001
3MStscore
-0.0140.003
<0.001
-0.0140.004
<0.001
Digit-Symbol
Sub-stitution
Testscore
-0.0050.0020.006
-0.0020.0020.399
* CES-D score was square root transformed.t MRI, magnetic resonance imaging; ADL, activities of daily living; 3MS, Modified Mini-Mental State Examination.t Includes participants with no missing data for any of the variables shown.§ Beta corresponds to the square root increase in the CES-D score per unit increase in the covariate.1] 1 = yes, 0 = no.# 1 = male, 0 = female.• • Number of difficulties.t t Adjusted for income, social support, number of chronic diseases (for each, all p < 0.001), and marital status (p = 0.65); n = 2,706 for this model.
in the multivariate model with the entire cohort, diffi-culty in performing IADL tasks was again highlyassociated with depression levels {p < 0.001 in bothmodels) in this subset.
DISCUSSION
The Cardiovascular Health Study provides a uniqueopportunity to examine the association between MRIinfarcts and depressive symptomatology in a largesample of community-dwelling older adults, whilealso considering function and other characteristics.When used to detect subcortical changes, MRI scanshave been shown to be more sensitive than computer-ized tomography, which was the predominant form ofassessment used in previous studies for patients withclinical stroke.
The central finding from this population-basedcross-sectional study of community-dwelling olderadults was that non-basal-ganglia lesions, comparedwith basal ganglia lesions, appear to be more strongly
associated with depressive symptoms after adjustmentfor age, gender, and history of stroke or transientischemic attack, although the confidence intervalsoverlapped. However, neither type of lesion was asso-ciated with depressive symptomatology after adjust-ment for deficits in cognitive and physical function.Impaired cognitive and physical function, versusMRI-identified anatomic lesions in the brain, emergedas the single most significant factor associated withdepressive symptoms. Our findings are consistentwith the interpretation that functional deficits may bethe causal pathway by which MRI infarcts are associ-ated with depressive symptoms. Alternatively, thelesions that affect cognition and function mostseverely are selectively associated with depressivesymptoms. Among the functional measures, IADLdifficulty independently exhibited the strongest asso-ciation, presumably because of the complex sensori-motor and cognitive coordination required to com-plete IADL tasks (28). Ultimately, however,
Am J Epidemiol Vol. 150, No. 9, 1999
Dow
nloaded from https://academ
ic.oup.com/aje/article/150/9/919/55274 by guest on 25 N
ovember 2021

MRI Lesions and Depression 927
interpretation of these results cannot distinguishdepressive symptoms that occur as a simple reactionto functional loss from lesions organically severe oranatomically specific enough to cause functional loss,thus leading to depressive symptoms.
The results from this study are quite contrary to whatthe literature has suggested is a direct and causal rela-tion between basal ganglia lesions and depression. Thediscrepancy may stem from a number of factors.Previous studies used a case-control design with smallsample sizes, in which clinically depressed and nonde-pressed subjects were compared (5, 6). These patientspresented with severe clinical depression that requiredelectroconvulsive therapy or hospitalization. Therefore,these studies had a greater selection bias than is presentin the Cardiovascular Health Study.
Other studies looked specifically at poststrokedepression in relation to lesion site (7, 8, 29). TheCardiovascular Health Study population differs fromthe patients in the poststroke depression studies in sev-eral ways. First, participants are community dwellingand have a broad range of depressive symptomatologyrather than clinically manifest depression. Second,most Cardiovascular Health Study participants withMRI infarcts do not have a history of clinical stroke(11). Given the finding from model 2 (table 6) of theassociation of non-basal-ganglia lesions with CES-Dscore, these supposedly "silent" lesions may actuallyimpact affective state to some degree. Finally, post-stroke depression studies were generally conductedwithin a short time frame after patients had theirstrokes, whereas Cardiovascular Health Study partici-pants could have had their strokes at any time in thepast. Given this difference in timeframe, the impactcould be to weaken the association found here and/orselective association with residual function as a resultof brain lesions. Thus, the results from this study mustbe interpreted within the context of a community pop-ulation rather than selected hospital patients. Ourresults should be more generalizable to the noninstitu-tionalized population of older adults.
Among the demographic variables, female genderand low income were significantly associated withincreased numbers of depressive symptoms. The crudeassociation between age and depressive symptoms dis-appeared after adjustment for functional status andgender. This finding is consistent with the study byBlazer et al. (30).
The strong association between white matter gradeand basal ganglia lesions in comparison to non-basal-ganglia lesions is of interest, since white matter abnor-malities and basal ganglia lesions are likely to resultfrom injuries to the long, penetrating, end arteries inthe brain (31). Moody et al. (32) demonstrated similar
microscopic white matter and basal ganglia arteriolarchanges associated with ischemic neuronal and whitematter changes. This "small vessel" pathology is dis-tinct from large vessel atherosclerosis and has beenfound in conjunction with MRI findings similar to oursregarding infarcts and white matter grade. It is likelythat MRI infarcts in the basal ganglia and white mattergrade are a consequence of the same pathophysiologicprocess but occur in different neuronal substrates. Inaddition, Longstreth et al. (31) reported an associationof white matter grade with impaired cognitive andlower extremity function. If white matter grade andbasal ganglia lesions represent similar biologicprocesses, associations of depression with basal gan-glia lesions in prior studies could potentially be a resultof confounding. Regardless, preventing small vesseldisease may have wider clinical implications that arerelated to functional ability and other manifestationsunknown at the present time.
The major limitation of our study is the potential forselection bias within this population-based study.Although the Cardiovascular Health Study providesdata on a population-based sample of community-dwelling older adults in four US communities, partici-pants who completed the MRI portion of the study gen-erally represented the healthier portion of the cohort.Conversely, those persons in the non-MRI group hadhigher numbers of depressive symptoms, had morefunctional impairment, and were older. All of these fac-tors were shown to be associated with basal ganglia andnon-basal-ganglia lesions in the present study. The factthat a substantial portion of the cohort (38 percent)either could not undergo or refused cranial MRI mayhave biased our results toward the conservative or nullfindings, which leaves the question of whether differentresults would have been obtained if the non-MRI grouphad participated. Our analysis selectively excluding fac-tors that were distributed differently between the MRIand non-MRI groups showed few differences in theregression estimates or significance levels. This findingleads us to believe that inclusion of the non-MRI groupwould not have changed the results substantially.
Another methodological question concerning thepresent study is whether misclassification associatedwith the outcome assessment may have occurredbecause an abbreviated version of the full CES-Dquestionnaire was used. However, since Shrout et al.(33) found that reducing the screening scale to as littleas the five-item CES-D scale resulted in a similar sen-sitivity and specificity compared with the full 20-itemCES-D scale, misclassification as a result of reducingthe CES-D scale should have been minimal.
Another potential limitation is that because the CES-D scale assesses depressive symptoms on the basis of
Am J Epidemiol Vol. 150, No. 9, 1999
Dow
nloaded from https://academ
ic.oup.com/aje/article/150/9/919/55274 by guest on 25 N
ovember 2021

928 Sato et al.
the past week's experience only, it is not possible todifferentiate between persons who truly had depressivesymptoms and those who just had an unpleasant weekby using such a screening methodology. The CES-Dwas designed to assess depressive symptoms forresearch purposes; it was never meant to be used as adiagnostic measure (15). However, Parikh et al. (34)reported a sensitivity of 86 percent and a specificity of90 percent when the full CES-D scale was used toidentify clinical depression in 80 patients followingstroke. Since the validity and reliability of the CES-Dscore has been extensively evaluated as a screeningtool in community surveys, high correlation betweenCES-D score and clinical diagnosis is more likely.
The final limitation concerns the cross-sectionalnature of this evaluation. The prevalence of poststrokedepression, whether major or minor, tends to rise as thetime from the stroke event increases and then toresolve within 2 to 3 years in most cases (35, 36).Therefore, the present study design may have underes-timated real associations if the depressive episodeoccurred too long ago or if the subjects were in theacute stage of stroke. These questions will beaddressed further when a follow-up MRI examinationis performed. The cross-sectional nature of the studyalso limits the causal inference because temporalitycould not be established definitively. Although the ideacannot be rejected that depressive symptoms could becaused by neurochemical changes as a result of MRIinfarct, depressive symptoms occurring as a reaction tofunctional limitations is plausible. The present datasuggest that in the absence of MRI infarct, functionalimpairment is independently associated with depres-sive symptomatology. Given that MRI infarcts are per-manent, functional impairment could be in the causalpathway leading to depressive symptomatology.
Despite limitations, the Cardiovascular Health Studyhas the major advantage of including a large population-based community sample of older adults with compre-hensive data on brain lesions and potentially associatedcharacteristics. The sample size for the present studywas at least 10 times larger than that of any reports pub-lished previously. Misclassification of lesion type orsize should have been minimized by a protocol-definedreview of all MRI scans and the exclusion of poor-quality scans. Response bias was highly unlikely sinceall data were collected in a standardized fashion.
The R2 values indicate that these multivariate modelsexplain only 18 percent of the variance in the levels ofdepressive symptoms, at best. This value is similar toone from a study examining the relation between oldage and CES-D scores (30). Factors examined in thisstudy that were reported to independently influencedepressive symptoms in older adults included number
of chronic illnesses, social support network, andincome status (30, 37). The results from this studyattest to the heterogeneous risk factors associated withlate-life depression.
In summary, our study of community-dwelling olderadults did not find an independent association betweenbasal ganglia lesions or any other MRI infarcts anddepressive symptoms after adjustment for physical andcognitive function. However, the latter were indepen-dently associated with depressive symptomatology.Results suggest that the functional consequences ofcerebrovascular disease may be part of the causalpathway by which basal ganglia and non-basal-ganglialesions are associated with depressive symptomatol-ogy. Alternatively, it may be that the lesions causingsuch impairments are related to depressive symptoms.Further investigation should consist of prospectivestudies that examine the complex interplay betweenbasal ganglia lesions, functional impairment, and otherrisk factors unexplored in the present study.
ACKNOWLEDGMENTS
The research reported on in this article was supported bycontracts NO1-HC-85079-NO1-HC-85086 from theNational Heart, Lung, and Blood Institute, and GeorgetownEcho RC - HL 35129 JHU MRI RC-HL 15103.
Institutions and principal staff participating in theCardiovascular Health Study are as follows: ForsythCounty, North Carolina: Bowman Gray School of Medicineof Wake Forest University—Gregory L. Burke, John Chen,Alan Elster, Walter H. Ettinger, Curt D. Furberg, GerardoHeiss, Sharon Jackson, Dalane Kitzman, Margie Lamb,David S. Lefkowitz, Mary F. Lyles, Cathy Nunn, WardRiley, and Beverly Tucker; Forsyth County, North Carolina:Wake Forest University-ECG Reading Center—FaridaRautaharju and Pentti Rautaharju; Sacramento County,California: University of California, Davis—CharlesBernick, William Bonekat, Michael Buonocore, Mary Haan,Calvin Hirsch, Lawrence Laslett, Marshall Lee, JohnRobbins, William Seavey, and Richard White; WashingtonCounty, Maryland: The Johns Hopkins University—M. JanBusby-Whitehead, Joyce Chabot, George W. Comstock,Adrian Dobs, Linda P. Fried, Joel G. Hill, Steven J. Kittner,Shiriki Kumanyika, David Levine, Joao A. Lima, Neil R.Powe, Thomas R. Price, Moyses Szklo, Melvyn Tockman,and Jeff Williamson; MRI Reading Center-WashingtonCounty, Maryland: The Johns Hopkins University—Norman Beauchamp, R. Nick Bryan, Douglas Fellows,Melanie Hawkins, Patrice Holtz, Naiyer Iman, MichaelKraut, Grace Lee, Carolyn C. Meltzer, Cynthia Quinn, LarrySchertz, Earl P. Steinberg, Scott Wells, Linda Wilkins, andNancy C. Yue; Allegheny County, Pennsylvania: Universityof Pittsburgh—Diane G. Ives, Charles A. Jungreis, LaurieKnepper, Lewis H. Kuller, Elaine Meilahn, Peg Meyer,
Am J Epidemiol Vol. 150, No. 9, 1999
Dow
nloaded from https://academ
ic.oup.com/aje/article/150/9/919/55274 by guest on 25 N
ovember 2021

MRI Lesions and Depression 929
Roberta Moyer, Anne Newman, Richard Schulz, VivienneE. Smith, and Sidney K. Wolfson; EchocardiographyReading Center (Baseline): University of California,Irvine—Hoda Anton-Culver, Julius M. Gardin, MargaretKnoll, Tom Kurosaki, and Nathan Wong; EchocardiographyReading Center (Follow-up): Georgetown Medical Center,Washington, DC—Judy Gay, John Gottdiener, Eva Hausner,Stephen Kraus, Sue Livengood, Retha Webb, and Mary AnnYohe; Ultrasound Reading Center: New England MedicalCenter, Boston, Massachusetts—Laurie Funk, Daniel H.O'Leary, and Joseph F. Polak; Central Blood AnalysisLaboratory: University of Vfermonf-Elaine Cornell, MaryCushman, and Russell P. Tracy; Pulmonary Reading Center:University of Arizona-Tucson—Paul Enright; CoordinatingCenter: University of Washington, Seattle—Alice Arnold,Paula Diehr, Scott Emerson, Annette L. Fitzpatrick, RichardA. Kronmal, Bonnie K. Lind, Will Longstreth, MaryannMcBurnie, Bruce M. Psaty, Lynn Shemanski, David S.Siscovick, Chuck Spiekerman, Cathy Tangen, PriscillaVelentgas, Patricia W. Wahl, and David Yanez; NHLBIProject Office, Bethesda, Maryland-Robin Boineau, Teri A.Manolio, Peter J. Savage, and Patricia Smith.
REFERENCES
1. Krishnan KRR. Neuroanatomic substrates of depression in theelderly. J Geriatr Psychiatry Neurol 1993; 1:39-58.
2. Blazer DG. Depression in late life. 2nd ed. St. Louis, MO:Mosby, 1993.
3. Hopkinson G. A genetic study of affective illness in patientsover 50. Br J Psychiatry 1964; 110:244-54.
4. Mendlewicz J, Baron M. Morbidity risks in subtypes of unipo-lar depressive illness: differences between early and late onsetforms. Br J Psychiatry 1981;139:463-6.
5. Rabins PV, Pearlson GD, Aylward E, et al. Cortical magneticresonance imaging changes in elderly inpatients with majordepression. Am J Psychiatry 1991;148:617-20.
6. Coffey CE, Figiel GS, Djang WT, et al. Subcortical hyperin-tensity on magnetic resonance imaging: a comparison of nor-mal and depressed elderly subjects. Am J Psychiatry 1990; 147:187-9.
7. Starkstein SE, Robinson RG, Berthier ML, et al. Differentialmood changes following basal ganglia vs thalamic lesions.Arch Neurol 1988;45:725-30.
8. Herrmann M, Bartels C, Schumacher M, et al. Poststrokedepression: is there a pathoanatomic correlate for depression inthe postacute stage of stroke? Stroke 1995;26:850-6.
9. Schneider JS. Basal ganglia role in behavior: importance ofsensory gating and its relevance to psychiatry. Biol Psychiatry1984;19:1693-710.
10. Mayberg SH. Frontal lobe dysfunction in secondary depres-sion. J Neuropsychiatry Clin Neurosci 1994;6:428^t2.
11. Bryan RN, Wells SW, Miller TJ, et al. Infarctlike lesions in thebrain: prevalence and anatomic characteristics at MR imagingof the elderly—data from the Cardiovascular Health Study.Radiology 1997;202:47-54.
12. Fried LP, Borhani NO, Enright P, et al. The CardiovascularHealth Study: design and rationale. Ann Epidemiol 1991; 1:263-76.
13. Tell GS, Fried LP, Hermanson B, et al. Recruitment of adults65 years and older as participants in the Cardiovascular HealthStudy. Ann Epidemiol 1993;3:358-66.
14. Radloff LS. The CES-D scale: a self-report depression scalefor research in the general population. Appl Psychol Meas
1977; 1:385-401.15. Radloff LS, Teri L. Use of the Center for Epidemiologic
Studies-Depression scale with older adults. Clin Gerontol1986;5:119-36.
16. Folstein MF, Folstein SE, McHugh PR. "Mini-mental state". Apractical method for grading the cognitive state of patients forthe clinician. J Psychiatr Res 1975;12:189-98.
17. Teng EL, Chui HC. The modified mini-mental state (3MS)examination. J Clin Psychiatry 1987;48:314-18.
18. Salthouse TA. The role of memory in the age decline in digit-symbol substitution performance. J Gerontol 1978;33:232-8.
19. Fitti JE, Kovar MG. Supplement on aging to the 1984 NationalHealth Interview Survey. National Center for Health Statistics.Vital Health Stat 1 (21), 1987. (DHHS publication no. (PHS)86-1323).
20. Katz S, Fort AB, Moskowitz RW, et al. Studies of illness in theaged: the index of ADL, a standardized measure of biologicaland psychosocial function. JAMA 1963;185:914-19.
21. Lawton MP, Brody EM. Assessment of older people: self-maintaining and instrumental activities of daily living.Gerontologist 1969;9:179-86.
22. Heitsmann CA, Kaplan RM. Assessment of methods for mea-suring social support. Health Psychol 1988;31:741-55.
23. Ives DG, Fitzpatrick AL, Bild DE, et al. Surveillance andascertainment of cardiovascular events. The CardiovascularHealth Study. Ann Epidemiol 1995;5:278-85.
24. Bryan RN, Manolio TA, Schertz LD, et al. A method for usingMR to evaluate the effects of cardiovascular disease on thebrain: the Cardiovascular Health Study. Am J Neuroradiol1994; 15:1625-33.
25. Manolio TA, Kronmal RA, Burke GL, et al. Magnetic reso-nance abnormalities and cardiovascular disease in older adults:the Cardiovascular Health Study. Stroke 1994;25:318-27.
26. Yue NC, Arnold AM, Longstreth WT, et al. Sulcal, ventricular,and white matter changes at MR imaging in the aging brain:data from the Cardiovascular Health Study. Radiology 1997;202:33-9.
27. SPSS Inc. SPSS for MS Windows, release 6.1.3. Chicago, IL:SPSS Inc, 1995.
28. Bernspang B, Fisher AG. Differences between persons withright or left cerebral vascular accident on the assessment ofmotor and process skills. Arch Phys Med Rehabil 1995;76:1144-51.
29. Morris PL, Robinson RG, Raphael B, et al. Lesion locationand poststroke depression. J Neuropsychiatry Clin Neurosci1996;8:399-403.
30. Blazer D, Burchett B, Service C, et al. The association of ageand depression among the elderly: an epidemiologic explo-ration. J Gerontol 1991;46:M210-15.
31. Longstreth WT, Manolio TA, Arnold A, et al. Clinical corre-lates of white matter findings on cranial magnetic resonanceimaging of 3,301 elderly people: the Cardiovascular HealthStudy. Stroke 1996,27:1274-82.
32. Moody DM, Bell MA, Challa VR. Features of the cerebral vas-cular pattern that predict vulnerability to perfusion or oxy-genation deficiency: an anatomic study. AJNR Am JNeuroradiol 1990; 11:431-9.
33. Shrout PE, Yager TJ. Reliability and validity of screeningscales: effect of reducing scale length. J Clin Epidemiol 1989;42:69-78.
34. Parikh RM, Eden DT, Price TR, et al. The sensitivity andspecificity of the Center for Epidemiologic Studies Depressionscale in screening for post-stroke depression. Int J PsychiatryMed 1988;18:169-81.
35. Starkstein SE, Robinson RG. Affective disorders and cerebralvascular disease. Br J Psychiatry 1989; 154:170-82.
36. Morris PL, Robinson RG, Raphael B. Prevalence and course ofdepressive disorders in hospitalized stroke patients. Int JPsychiatry Med 1990;20:349-64.
37. Harlow SD, Goldberg EL, Comstock GW. A longitudinal studyof risk factors for depressive symptomatology in elderly wid-owed and married women. Am J Epidemiol 1991;134:526—38.
Am J Epidemiol Vol. 150, No. 9, 1999
Dow
nloaded from https://academ
ic.oup.com/aje/article/150/9/919/55274 by guest on 25 N
ovember 2021