neural signature of fictive learning signals in a …camerer/pnas_neuralsigfctvlrngsgnl...neural...
TRANSCRIPT

Neural signature of fictive learning signals in a sequential investment task
Terry Lohrenz, Kevin McCabe, Colin F. Camerer, and P. Read Montague
doi:10.1073/pnas.0608842104 2007;104;9493-9498; originally published online May 22, 2007; PNAS
This information is current as of June 2007.
& ServicesOnline Information
www.pnas.org/cgi/content/full/104/22/9493etc., can be found at: High-resolution figures, a citation map, links to PubMed and Google Scholar,
Supplementary Material www.pnas.org/cgi/content/full/0608842104/DC1
Supplementary material can be found at:
References www.pnas.org/cgi/content/full/104/22/9493#BIBL
This article cites 42 articles, 13 of which you can access for free at:
www.pnas.org/cgi/content/full/104/22/9493#otherarticlesThis article has been cited by other articles:
E-mail Alerts. click hereat the top right corner of the article or
Receive free email alerts when new articles cite this article - sign up in the box
Rights & Permissions www.pnas.org/misc/rightperm.shtml
To reproduce this article in part (figures, tables) or in entirety, see:
Reprints www.pnas.org/misc/reprints.shtml
To order reprints, see:
Notes:

Neural signature of fictive learning signalsin a sequential investment taskTerry Lohrenz*†, Kevin McCabe‡, Colin F. Camerer§, and P. Read Montague*¶
*Department of Neuroscience and ¶Menninger Department of Psychiatry and Behavioral Sciences, Baylor College of Medicine, One Baylor Plaza,Houston, TX 77030; ‡Department of Economics, George Mason University, Fairfax, VA 22030; and §California Institute of Technology, Pasadena, CA 91125
Edited by Dale Purves, Duke University Medical Center, Durham, NC, and approved April 13, 2007 (received for review October 6, 2006)
Reinforcement learning models now provide principled guides fora wide range of reward learning experiments in animals andhumans. One key learning (error) signal in these models is expe-riential and reports ongoing temporal differences between ex-pected and experienced reward. However, these same abstractlearning models also accommodate the existence of another classof learning signal that takes the form of a fictive error encodingongoing differences between experienced returns and returns that‘‘could-have-been-experienced’’ if decisions had been different.These observations suggest the hypothesis that, for all real-worldlearning tasks, one should expect the presence of both experientialand fictive learning signals. Motivated by this possibility, we useda sequential investment game and fMRI to probe ongoing brainresponses to both experiential and fictive learning signals gener-ated throughout the game. Using a large cohort of subjects (n �
54), we report that fictive learning signals strongly predict changesin subjects’ investment behavior and correlate with fMRI signalsmeasured in dopaminoceptive structures known to be involved invaluation and choice.
counterfactual signals � decision-making � neuroeconomics �reinforcement learning
Neuroimaging experiments have begun to identify dynamicneural responses related to economic instincts including
risk, gains, losses, and errors in reward expectations (1–8). Usinginterpersonal economic exchanges with humans and computers,even fairness, deviations from fairness, and revenge responseshave produced an array of consistent neural correlates (9–12).Using event-related fMRI and a sequential investment game, weprobe a formerly underappreciated signal type, a fictive learningerror, predicted by a natural extension of a reinforcementlearning model called Q-learning (13, 14). These signals are anaugmentation to reinforcement learning models now used widelyto design and interpret neuroimaging experiments in a range ofreward-learning and economic decision-making tasks (Fig. 1A)(for a review, see ref. 15). We begin by introducing fictivelearning signals in relation to reward error models based onexperience, identify their connection to an older model ofregret-based choice, and justify the elements of our sequentialdecision-making game given to human subjects.
Experiments examining the neural basis of valuation haveidentified midbrain dopaminergic systems as central players forreward processing and for the valuations that underlie rewardprocessing and reward-guided choice (1–8, 16–22). This workassociates transient modulations in the activity of midbraindopamine neurons with reward prediction error signals (3–7,16–18), and has equated reward prediction errors with thetemporal difference (TD) error term that guides learning andaction choice in actor-critic models (6, 15).
One formulation of this model, called Q-learning, depicts theTD error term �t as
�t � r�a� � � maxa
Q�St�1, a� � Q�St, a� ,
where r(a) is the reward obtained for choosing action a, Q(St, a)is the value of action a in state St,
maxa
Q�St, a�
is the maximum of the Q values over all actions available fromstate St, and � is a discount factor (Fig. 1 A) (13, 14). It is thiserror signal that guides the learning of the value of states andactions based on actions actually taken (23). The general idea isillustrated in Fig. 1A. The animal is in a state St at time t, choosessome action to leave the state, ends up in a new state St�1 at timet � 1, and observes some reward r that depends on the actionchosen. At such transitions, the TD error can inform the systemabout which output states, and consequently which actions,should yield the best average long-term returns. This frameworkhas now been used extensively to understand a wide range ofreward processing and valuation experiments in humans (15, 20).
Reinforcement learning models like the Q-learning modelabove focus on updating stored internal values based solely onthe direct experience of the learner as indicated in Fig. 1 A (solidarrow); however, once an action is taken, it is often the case thatinformation becomes available that shows that another action(among those not taken; dashed arrow) would have been morevaluable. It is these ‘‘could have been’’ actions that provide extracriticism for updating the values of states and actions (i.e., the Qvalues); and just like the reward prediction errors associated withactual experience, there should be analogous learning signalsassociated with the actions not taken: fictive learning signals.
In this article, we use a sequential gambling task that probesthe ongoing difference between ‘‘what could have been ac-quired’’ and ‘‘what was acquired.’’ Fig. 1B shows the outline ofevents in the task. At time t, the player makes a new investmentallocation (bet) by moving a centrally placed slider bar to the newbet, and at time t � 1, the next snippet of market information isdisplayed (Fig. 1B). Two outcomes are possible at that moment:(i) the market goes up and all bets higher than the bet placed arebetter because they would have accrued greater gains or (ii) themarket goes down and all bets lower than the bet placed arebetter because they all would have accrued smaller losses.
At each decision point, bets can be set anywhere from 0% to100% in increments of 10%. Each player plays 10 differentmarkets and makes 20 decisions per market arranged at regularintervals as depicted in Fig. 1B. Fig. 1B displays the important
Author contributions: T.L., K.M., and P.R.M. designed research; T.L. performed research;T.L. and P.R.M. analyzed data; and T.L., K.M., C.F.C., and P.R.M. wrote the paper.
Conflict of interest statement: T.L. is Executive Vice President and Director of Research forComputational Management, Inc.
This article is a PNAS Direct Submission.
Freely available online through the PNAS open access option.
Abbreviations: PPC, posterior parietal cortex; TD, temporal difference.
†To whom correspondence should be addressed. E-mail: [email protected].
This article contains supporting information online at www.pnas.org/cgi/content/full/0608842104/DC1.
© 2007 by The National Academy of Sciences of the USA
www.pnas.org�cgi�doi�10.1073�pnas.0608842104 PNAS � May 29, 2007 � vol. 104 � no. 22 � 9493–9498
ECO
NO
MIC
SCIE
NCE
SN
EURO
SCIE
NCE

design features of the game to clarify when the fictive error signalis expected to change; the exact visual arrangement is shown inFig. 2A, and a time-line is shown in Fig. 2B. After each choice,the natural learning signal for criticizing the choice (the bet) isthe difference between the best return that ‘‘could have been’’obtained and the actual return, that is, the fictive error signal.
We now define the fictive error signal in this task and note herethat it is strongly related to a term in the ‘‘regret-based’’ theoryof decision-making under uncertainty proposed by Bell, Loomes,and Sugden in 1982 (24, 25). We avoid calling the signal regretbecause this term has a much broader, multidimensional mean-ing than we imply by fictive error (26).
Let the fractional change in the market (price) at time t be rt,and let the concurrent time series of bets be bt. At each time t,the amount gained due to the subject’s choice is bt � rt
� for positivefractional changes in the market rt
�, that is, rt� � (pt � pt�1)/(pt) �
0, where pt is the market price at time t. The amount lost is bt �rt� for similarly defined negative fractional changes in the market
rt�. After a decision, we take the fictive error to be the difference
between the best outcome that could have been achieved and theactual gain or loss. After an ‘‘experiential’’ gain, the fictive erroris ft
� � 1 � rt� � bt � rt
�; the best bet would have been 100%, i.e.,all invested. After an ‘‘experiential’’ loss, the associated fictiveerror is ft
� � 0 � rt� � bt � rt
�; the best bet would have been 0%,i.e., all ‘‘cashed out.’’
ResultsFifty-four healthy subjects (31 male, 23 female; ages 19–54) werescanned while performing the investment task outlined in Fig. 1Band Fig. 2. All players were initially endowed with $100. Eachsubject played 20 markets and made 20 decisions per market.The markets were presented in one of two conditions: (i) ‘‘Live,’’where the subject made money, and (ii) a condition called ‘‘NotLive,’’ which controlled for visuomotor aspects of the task. Halfthe markets were played live and half not live, and theseconditions occurred in a randomized order for each subject. Forall markets used in this task, the price histories were taken fromactual historical markets [see supporting information (SI) Fig. 7and SI Data Set for market details].
To determine the impact of the fictive error ( ft� � 1 � rt
� � bt
� rt�) on the subjects’ behavior, we performed multiple regression
analysis on the behavioral data and found that the fictive errorover gains emerges quite naturally as an important behavioralsignal determining the next bet. We regressed the next bet bt�1
against the previous bet bt, the previous market broken up intopositive and negative parts (rt
� and rt�, respectively), and the
return of the investor separated into gains and losses (bt � rt� and
bt � rt�):
bt�1 � c0 � c1bt � c2rt� � c3rt
� � c4bt � rt� � c5bt � rt
�.
The results of this multiple regression are shown in Table 1 (seeSI Table 2 for an alternative regression, SI Data Set for statisticson subjects’ performance, and SI Appendix for experience-related and reaction time data). The only term that does notemerge with a significant effect on the next bet is loss bt � rt
�.Not surprisingly, the three first-order terms (bt, rt
�, and rt�)
significantly predict the next bet bt�1: the last bet bt, positivechanges in the market rt
�, and negative changes in the market rt�.
These effects are modulated by a negative contribution from bt
� rt� (gain).
Fig. 1. Schematic of the idea of a fictive error and task design. (A) At time t,an agent in state St transitions to a new state St�1 by taking action at andobserves a reward rt. However, the agent also observes other rewards r�t thatcould have been received had alternative actions a�t been chosen. (B) Thefigure under time t � 1 shows the state of the task immediately after a snippetof market has been revealed. At time t the subject makes a new allocationbetween cash and stock (in this case increasing the bet). When the market goesup, bigger investments are immediately revealed as better choices, generatingthe fictive error ‘‘best choice � actual choice.’’ Likewise for market drops,smaller investments would have been better.
Fig. 2. Experiment screen and time line. (A) Screen like that seen by subject(the background was dark in the scanner). The subject has just lost 23.92%(right box), has a portfolio worth $139 (left box), has 50% invested in themarket (middle bar), and has nine choices remaining (from examining thescreen). (B) Time-line of experiment. After the market outcome is revealed,the middle bar (which indicates the bet size) is grayed out, and a new betcannot be submitted. The bar is illuminated 750 ms later, and the subject hasa free response period to submit a new bet. After the new bet is submitted, thenext snippet of market is revealed 750 ms later. The major regressors (includ-ing the fictive error) used in the fMRI analysis are time-locked to this event.
Table 1. Behavioral regression
Coefficient Estimate SE t value p value
c �0.026 0.013 �2.11 0.023bt 0.582 0.031 18.9 0.000rt� 5.56 0.651 8.54 0.000
rt� �3.76 0.529 �7.09 0.000
bt � rt� �2.91 1.16 �2.51 0.006
bt � rt� �1.55 1.23 �1.26 0.105
Results of linear multiple regression of bt�1, normalized next bet,on indicated variables: bt is normalized previous bet, rt
� � max(rt, 0), where rt
is the previous market return, rt� � max(�r, 0), and bt is the unnormalized
previous bet. bt � rt� is the actual investor return for the positive market case,
and similarly for bt � rt�. Random effects over subjects, n � 54.
9494 � www.pnas.org�cgi�doi�10.1073�pnas.0608842104 Lohrenz et al.
Consequently, the multiple regression results show that thenext bet can be explained by a weighted sum of (i) the last market(positive and negative) and (ii) a term proportional to (rt
� � bt
� rt�), which is exactly the fictive error over gains ft
� � 1 � rt� �
bt � rt�, as defined previously. This influence of the fictive error
on the next bet is depicted graphically in Fig. 3 for small,medium, and large values of the fictive error (see SI Fig. 8 forscatterplot).
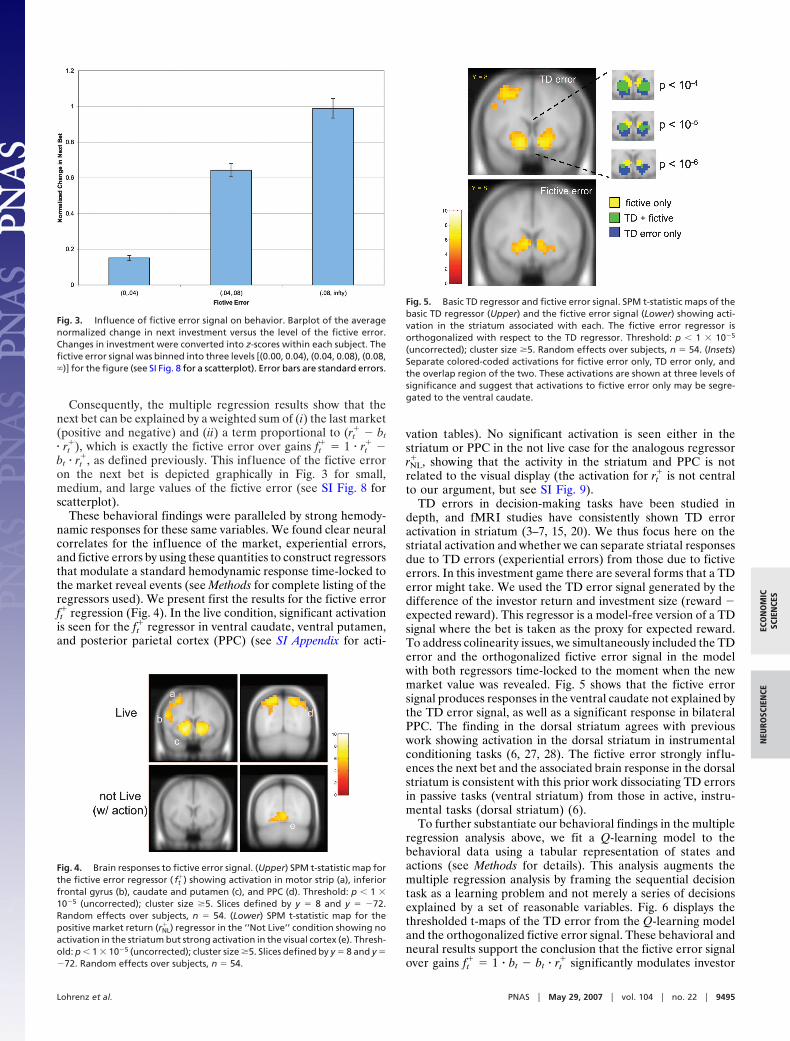
These behavioral findings were paralleled by strong hemody-namic responses for these same variables. We found clear neuralcorrelates for the influence of the market, experiential errors,and fictive errors by using these quantities to construct regressorsthat modulate a standard hemodynamic response time-locked tothe market reveal events (see Methods for complete listing of theregressors used). We present first the results for the fictive errorft� regression (Fig. 4). In the live condition, significant activation
is seen for the ft� regressor in ventral caudate, ventral putamen,
and posterior parietal cortex (PPC) (see SI Appendix for acti-
vation tables). No significant activation is seen either in thestriatum or PPC in the not live case for the analogous regressorrNL� , showing that the activity in the striatum and PPC is not
related to the visual display (the activation for rt� is not central
to our argument, but see SI Fig. 9).TD errors in decision-making tasks have been studied in
depth, and fMRI studies have consistently shown TD erroractivation in striatum (3–7, 15, 20). We thus focus here on thestriatal activation and whether we can separate striatal responsesdue to TD errors (experiential errors) from those due to fictiveerrors. In this investment game there are several forms that a TDerror might take. We used the TD error signal generated by thedifference of the investor return and investment size (reward �expected reward). This regressor is a model-free version of a TDsignal where the bet is taken as the proxy for expected reward.To address colinearity issues, we simultaneously included the TDerror and the orthogonalized fictive error signal in the modelwith both regressors time-locked to the moment when the newmarket value was revealed. Fig. 5 shows that the fictive errorsignal produces responses in the ventral caudate not explained bythe TD error signal, as well as a significant response in bilateralPPC. The finding in the dorsal striatum agrees with previouswork showing activation in the dorsal striatum in instrumentalconditioning tasks (6, 27, 28). The fictive error strongly influ-ences the next bet and the associated brain response in the dorsalstriatum is consistent with this prior work dissociating TD errorsin passive tasks (ventral striatum) from those in active, instru-mental tasks (dorsal striatum) (6).
To further substantiate our behavioral findings in the multipleregression analysis above, we fit a Q-learning model to thebehavioral data using a tabular representation of states andactions (see Methods for details). This analysis augments themultiple regression analysis by framing the sequential decisiontask as a learning problem and not merely a series of decisionsexplained by a set of reasonable variables. Fig. 6 displays thethresholded t-maps of the TD error from the Q-learning modeland the orthogonalized fictive error signal. These behavioral andneural results support the conclusion that the fictive error signalover gains ft
� � 1 � bt � bt � rt� significantly modulates investor
Fig. 3. Influence of fictive error signal on behavior. Barplot of the averagenormalized change in next investment versus the level of the fictive error.Changes in investment were converted into z-scores within each subject. Thefictive error signal was binned into three levels [(0.00, 0.04), (0.04, 0.08), (0.08,�)] for the figure (see SI Fig. 8 for a scatterplot). Error bars are standard errors.
Fig. 4. Brain responses to fictive error signal. (Upper) SPM t-statistic map forthe fictive error regressor ( ft
�) showing activation in motor strip (a), inferiorfrontal gyrus (b), caudate and putamen (c), and PPC (d). Threshold: p 1 10�5 (uncorrected); cluster size �5. Slices defined by y � 8 and y � �72.Random effects over subjects, n � 54. (Lower) SPM t-statistic map for thepositive market return (rNL
� ) regressor in the ‘‘Not Live’’ condition showing noactivation in the striatum but strong activation in the visual cortex (e). Thresh-old: p 1 10�5 (uncorrected); cluster size �5. Slices defined by y � 8 and y ��72. Random effects over subjects, n � 54.
Fig. 5. Basic TD regressor and fictive error signal. SPM t-statistic maps of thebasic TD regressor (Upper) and the fictive error signal (Lower) showing acti-vation in the striatum associated with each. The fictive error regressor isorthogonalized with respect to the TD regressor. Threshold: p 1 10�5
(uncorrected); cluster size �5. Random effects over subjects, n � 54. (Insets)Separate colored-coded activations for fictive error only, TD error only, andthe overlap region of the two. These activations are shown at three levels ofsignificance and suggest that activations to fictive error only may be segre-gated to the ventral caudate.
Lohrenz et al. PNAS � May 29, 2007 � vol. 104 � no. 22 � 9495
ECO
NO
MIC
SCIE
NCE
SN
EURO
SCIE
NCE

behavior and has a robust neural correlate in the ventral caudatethat is distinguishable from a standard experiential (TD) error.
DiscussionOur analysis shows that the fictive error signal ft
� is an importantdeterminant of choice behavior in a sequential decision-makinggame and has a clear neural correlate in the ventral caudate.Learning signals based on experiential rewards mediated by thedopamine system have been studied extensively (3–7, 16–18, 21,22, 29, 30). The experiential rewards that activate these circuitsrange from primary rewards, to money, to more abstract con-structs such as trust and revenge (11, 12). From these results itis clear that abstract concepts of reward can harness the dopa-mine system. The fictive error differs in that it involves rewardsnot received from actions not taken. From a biological perspec-tive, this generalization is compelling: more information ispreferable to less, assuming that the cost of getting and storingthe information is not too high.
Our fictive error signal is regret operationalized as in Bell,Loomes, and Sugden (24, 25). These authors developed a theoryof choice that formalized the impact of the emotion of regret byadding a term to the standard von Neumann–Savage expectedutility theory (EUT) that explicitly quantified the comparison ofthe outcomes obtained to outcomes foregone. Loomes, Sugden,and Bell’s theory accounts for many of the anomalies describedearlier by the prospect theory of Kahneman and Tversky (30). Alarge psychological literature chronicles the impact of counter-factuals, specifically regret, as well as emotions on choice (26, 32,33). We stress that the signal described above may or may nothave anything to do with the feeling of regret and that ourdefinition of a fictive error signal is defined as a function of twomeasurable quantities and is correlated with a (possibly covert,i.e., unconscious) signal in the brain.
Related concepts such as counterfactuals and regret havebeen studied behaviorally and in fMRI experiments (1, 8,34–36). Breiter et al. (1) report activity related to counterfactualprocessing (disappointment) in a passive gambling task. Camilleet al. (34) report on the lack of the influence of regret inorbitofrontal patients in a two-choice gambling game. Coricelliet al. (35) use a similar two-choice paradigm in normal subjects
in an fMRI study and report activity in the orbitofrontal cortexassociated with regret. Kuhnen and Knutson (8) use a three-choice task and report activity correlated with the differencebetween the obtained outcome and the outcome of the otherrisky choice in bilateral caudate. Camerer and Ho (36) useknowledge of rewards from actions not taken in their EWA(experience weighted attractions) model. In this model, actionsare taken according to probabilities that depend on attractionsthat are updated after choices are made. The attractions areupdated by adding a fraction of the reward that was received (inthe case of the chosen action) or could have been received (in thecase of the actions not taken). EWA has been successful inmodeling behavior in a multitude of games from experimentaleconomics (36, 37). Although EWA uses counterfactual infor-mation to update attractions, it does not explicitly include a termcomparing the foregone reward with the actual reward.
Our result also adds to the evidence pointing to a special rolefor the caudate in decision-making in trial-and-error tasksinvolving a diverse range of rewards, even including rewardsassociated with social exchange (6, 11, 27, 28). Broadly, theseprevious studies have reported caudate activation related to thepresentation of cues and receipt of reward in instrumental tasks.Indeed, in O’Doherty et al. (6) there was no activation in thecaudate in the purely passive condition, providing evidence fora dorsal/ventral dissociation between actor and critic. The fictiveerror can be related to an extended version of the actor–criticarchitecture introduced by Rosenstein and Barto (38), whocombine reinforcement and supervised learning in the actor’serror signal in the actor–critic structure. We interpret the fictiveerror as the report of an ‘‘endogenous supervisor.’’ Moreformally (following ref. 38 closely), if we denote the actor’s policyby �a(�), where � is a vector of parameters, then the actor’s policyparameter update is given by
�4 � � k�RL � �1 � k��SL.
Here, k � [0,1] is a parameter that measures the relative weightof the reinforcement versus supervised aspects of learning, �RL
is the standard reinforcement learning update, and �SL is thesupervised learning error term that can be related to the fictiveerror (see SI Appendix) by using steepest descent:
�SL � r��1 � a A���� A � r�a A��� A.
The first term on the right is the fictive error of this article, andthe second term is identical to loss, because ‘‘shorting’’ (negativebets) was not allowed.
Redish (39) captures (stylistically) several interesting aspectsof cocaine addiction using a maneuver related to the ‘‘endoge-nous supervisor.’’ He adds a term to the TD update equation forthe critic that models the synaptic dopamine concentrationincrease caused by cocaine. It is intriguing to speculate thatfictive error signals in the actor might have similar effects andunderlie components of compulsive gambling (40).
While we focused on the striatal activation in this work, theactivation in PPC associated with the fictive error signal overlapsthe activations in humans associated with delayed saccades inPPC (identified as intraparietal sulcus 2, IPS2) found inSchluppeck et al. (41). The homologous area of PPC in non-human primates, LIP, has been implicated in decision-making(42–44). The IPS2 activation in our task was not present in thenot live visual control condition, suggesting that IPS2 may playa role in humans similar to that of LIP in non-human primates.
There is now ample evidence for experiential signals encodedby the dopamine system in the form of TD errors. In this article,we have shown evidence for a type of signal, a fictive error signal,that, in our experiment, drives choice behavior and has a neuralcorrelate in the ventral caudate. It seems likely that situating
Fig. 6. Q-learning TD regressor and fictive error signal. SPM2 t-maps of theQ-learning TD regressor (Upper) and the fictive error signal (Lower) againshowing activation in the ventral striatum associated with the TD error, and inthe ventral caudate for the fictive error. The fictive error regressor is orthogo-nalized with respect to the TD regressor. Threshold: p 1 10�5 (uncor-rected); cluster size �5. Random effects over subjects, n � 54. (Insets) Separatecolored-coded activations for fictive error only, TD error only, and the overlapregion of the two. The area of overlap is larger for the Q-learning model andfictive error than for the TD regressor and fictive error (see Fig. 5).
9496 � www.pnas.org�cgi�doi�10.1073�pnas.0608842104 Lohrenz et al.
fictive error signals within the framework of machine learningmodels will provide additional insight into normal human be-havior as well as into diseases of decision-making.
MethodsTask Description. Subjects were scanned in accordance with aprotocol approved by the Baylor College of Medicine institutionalreview board. Exclusion criteria were claustrophobia, DSM-IVAxis I or II diagnosis, pregnancy, medications other than contra-ceptives, contraindications to MRI (metal objects in body), activemedical or neurological disorder, and history of alcohol or drugdependence. The subjects were between 19 and 54 years old (31males, 23 females). One recruited subject started the scanning butdid not finish. After being read the task instructions (SI Text), thesubjects were placed into the scanner (Allegra 3T; Siemens) andperformed the following task. Two conditions, ‘‘Live’’ and ‘‘NotLive,’’ alternated, with the ‘‘Not Live’’ condition appearing first.During the ‘‘Live’’ condition, subjects made investment decisions,and in the ‘‘Not Live’’ condition, they made visual discriminations.In both conditions, price histories of actual historical market priceswere shown to the subjects (Market data: weekly closing prices fromEconStats; see SI Fig. 7 and SI Data Set for market graphs andsummary statistics). At the beginning of a ‘‘Live’’ block, an initial10-unit segment of price history was presented. Each unit repre-sented four actual weeks of price history. The visual displayrepresented each unit by the four weekly price points. The priceswere normalized to 100, so that the initial price was 100. A subjectthen used a button box activated by one hand to move a slider bardepicted on the screen to indicate her percentage allocation to themarket. At 0%, none of the initial $100 endowment would beallocated to the market; at 100%, all would be subject to marketfluctuations. The slider moved in increments of 10%. After decid-ing her allocation, the subject used a button box activated by herother hand to submit the decision using another button box. Thehand assignments were balanced over subjects. After a delay of 750ms, the next unit of price history appeared on the screen (theprevious history remained displayed, but the history was recenteredto prevent telegraphing unintended information about the market),the portfolio value was updated, and the percentage profit/loss wasdisplayed. After a delay of 750 ms, the slider bar changed from grayto red, indicating the free response time for the portfolio allocationdecision (Fig. 2B). The process then repeated. Note that subjects’portfolios were automatically rebalanced after each return to retainthe previously selected asset allocation. Additionally, this allocationwas displayed on the slider bar before the next decision, for a totalof 20 allocation decisions per round. At the end of the ‘‘Live’’ round,the screen briefly disappeared, and a screen displaying ‘‘Not Live’’announced the beginning of the ‘‘Not Live’’ condition. During thiscondition the screen and events were similar in appearance, but avisual discrimination decision was made rather than an assetallocation decision: the subject used the same slider bar to answerwhether the current price was higher or lower than the pricetwo-segments previous. This was also repeated for 20 choices. Eachsubject saw a grand total of 10 ‘‘Live’’ and 10 ‘‘Not Live’’ markets.The 20 historical markets were divided into two groups of similarcharacteristics. Subjects were approximately balanced (26 for groupA, 28 for group B) across the two groups of markets for the ‘‘Live’’condition; the order of the markets for any particular subject wasrandom.
Image Acquisition and Preprocessing. High-resolution T1-weightedscans were acquired by using an MPRage sequence (Siemens).Functional run details: echo-planar imaging, gradient recalledecho; repetition time (TR) � 2,000 ms; echo time (TE) � 40 ms;flip angle � 90°; 64 64 matrix, 26 4-mm axial slices, yieldingfunctional 3.4 mm 3.4 mm 4.0 mm voxels. Preprocessing offunctional imaging data was performed with SPM2 (WellcomeDepartment of Imaging Neuroscience). Motion correction to the
first functional scan was performed by using a six-parameterrigid-body transformation (45). The average of the motion-corrected images was coregistered to each individual’s structuralMRI by using a 12-parameter affine transformation. Slice timingartifact was corrected, after which images were spatially nor-malized to the MNI template (46) by applying a 12-parameteraffine transformation, followed by a nonlinear warping usingbasis functions (47). Images were then smoothed with an 8-mmisotropic Gaussian kernel and high-pass-filtered in the temporaldomain (filter width 128 sec).
Statistical Analyses. Behavioral analysis and definitions. The timeseries of investments and market returns were extracted for eachsubject. The subjects’ investments were z-normalized withinsubject. The following multivariate regression was then per-formed in R (The R Foundation for Statistical Computing;function lme, random effects over subjects, n � 54):
bt�1
� 0 � 1bt� 2rt
� � 3rt� � 4bt � rt
� � 5bt � rt�.
Here, bt is the within-subject z-scored bet. The other terms havebeen defined in the main text. The initial reveal, first reveal, andfinal reveal data were excluded from the regression because forthe initial reveal there is no preceding investment decision, forthe first reveal the investment decision was in a different context(i.e., no previous investment), and for the final reveal there is noimmediately following investment decision. The results areshown in Table 1.General linear model analysis. Visual stimuli and motor responses(see SI Appendix for complete list of regressors) were entered ina general linear model (48) as separate regressors constructed byconvolving punctate events at the onset of each stimulus ormotor response with the fixed hemodynamic response functionimplemented within SPM2. Additional regressors were con-structed from the markets or from behavioral data. For example,the fictive error regressor was formed by multiplying (point-wisein time) the live reveal (punctuate) regressor by rt
�(1 � bt). Thebasic TD regressor was constructed as follows. At live reveal t,the z-normalized subject return was defined as rt � (rt �mean(r))/(stdev(r)), where the mean and standard deviation istaken over the subject returns already experienced. The subject’sz-normalized investment bt was defined similarly. The basic TDregressor was then defined as TDt � rt � bt. As in the case of thebehavioral data, the initial and first reveal data and the final lreveal data were omitted from the regressors. Orthogonalizationof the fictive error regressor with respect to the TD errorregressor was accomplished by subtracting the orthogonal pro-jection of the fictive error onto the TD error from the fictiveerror regressor. SPM2 beta maps were constructed for regressorsof interest and then entered into a random-effects analysis byusing the one sample t test function.
Dynamic Choice Models: Q-Learning. A Q-learning model (13, 14)was estimated by using a tabular representation of the statespace and actions. The state space was taken to be a productof a discrete representation of the last market return (6categories: (�100, �0.05], (�0.05, �0.025], (�0.025, 0], (0,0.025], (0.025, 0.05], (0.05, 100]), and the previous investment(11 categories). The space of actions A was taken to be the setof possible investments (0, 0.1, 0.2, . . . , 0.8, 0.9, 1). The rewardR after making an investment was r, where r was themarket return. The Q values were updated according to
Q�St, a�4 Q�St, a� � c1TD,
Lohrenz et al. PNAS � May 29, 2007 � vol. 104 � no. 22 � 9497
ECO
NO
MIC
SCIE
NCE
SN
EURO
SCIE
NCE

TD � R � � maxa
Q�St�1, a� � Q�St, a� .
Here, � � 0.99 is the discount parameter, and c1 is the learningrate (this TD was used for the regressor mentioned in above).The choice probabilities were then obtained from the Q valuesby the Boltzmann distribution
P�St, a� �eQ�St,a�
�eQ�St,b�,
where � 1/T is the inverse temperature, which measures howconcentrated the distribution is about the maximal Q value. Theinitial Q values were all taken to be zero, and the likelihood of
each subject’s choices was maximized over the learning rate andtemperature by subject.
We thank B. King-Casas, P. Chiu, and X. Cui for comments on thismanuscript; D. Eagleman for stimulating discussions; the HyperscanDevelopment Team at Baylor College of Medicine for software imple-mentation [NEMO (www.hnl.bcm.tmc.edu/nemo)]; N. Apple, K.Pfeiffer, J. McGee, C. Bracero, X. Cui [xjView (http://people.hnl.bcm.tmc.edu/cuixu/xjView)], and P. Baldwin for technical assistance; and thethree anonymous referees for their comments . This work was supportedby National Institute on Drug Abuse Grant DA11723 (to P.R.M.),National Institute of Neurological Disorders and Stroke GrantNS045790 (to P.R.M.), and the Kane Family Foundation (P.R.M.).P.R.M. was also supported by the Institute for Advanced Study (Prince-ton, NJ) for part of the work contained in this article.
1. Breiter HC, Aharon I, Kahneman D, Dale A, Shizgal P (2001) Neuron30:619–639.
2. Knutson B, Adams CS, Fong GW, Hommer D (2001) J Neurosci 21:RC159.3. Pagnoni G, Zink CF, Montague PR, Berns GS (2002) Nat Neurosci 5:97–98.4. McClure SM, Berns GS, Montague PR (2003) Neuron 38:339–346.5. O’Doherty JP, Dayan P, Friston K, Critchley H, Dolan RJ (2003) Neuron
28:329–337.6. O’Doherty JP, Dayan P, Schultz J, Deichmann R, Friston K, Dolan R (2004)
Science 304:452–454.7. Haruno M, Kuroda T, Doya K, Toyama K, Kimura M, Samejima K, Imamizu
H, Kawato M (2004) J Neurosci 24:1660–1665.8. Kuhnen CM, Knutson B (2005) Neuron 47:763–770.9. Sanfey AG, Rilling JK, Aronson JA, Nystrom LE, Cohen JD (2003) Science
300:1755–1758.10. Rilling JK, Gutman DA, Zeh TR, Pagnoni GP, Berns GS, Kilts CD (2002)
Neuron 35:395–405.11. King-Casas B, Tomlin D, Annen C, Camerer CF, Quartz SR, Montague PR
(2005) Science 308:78–83.12. Singer T, Seymour B, O’Doherty JP, Stephan KE, Dolan RJ, Frith CD (2006)
Nature 439:466–469.13. Watkins CJCH (1992) PhD thesis (Univ of Cambridge, Cambridge, UK).14. Watkins CJCH, Dayan P (1992) Mach Learn 8:279–292.15. Montague PR, King-Casas B, Cohen JD (2006) Annu Rev Neurosci 29:417–448.16. Montague PR, Dayan P, Sejnowski TJ (1996) J Neurosci 16:1936–1947.17. Schultz W, Dayan P, Montague PR (1997) Science 275:1593–1599.18. Schultz W, Dickinson A (2000) Annu Rev Neurosci 23:473–500.19. O’Doherty J (2004) Curr Opin Neurosci 14:769–776.20. Montague PR, Hyman SE, Cohen JD (2004) Nature 431:760–767.21. Waelti P, Dickinson A, Schulz W (2001) Nature 412:43–48.22. Bayer HM, Glimcher PW (2005) Neuron 47:129–141.23. Sutton RS, Barto AG (1998) Reinforcement Learning: An Introduction (MIT
Press, Cambridge, MA).24. Bell DE (1982) Oper Res 30:961–981.25. Loomes G, Sugden R (1982) Econ J 92:805–824.26. Rosen NJ, Olson JM, eds (1995) What Might Have Been—The Social Psychology
of Counterfactual Thinking (Erlbaum, Mahwah, NJ).
27. Haruno M, Kuroda, Doya K, Toyama K, Kimura M, Samejima K, Imamizu H,Kawato M (2004) J Neurosci 24:1660–1665.
28. Delgado MR, Miller MM, Inati S, Phelps EA (2005) NeuroImage 24:862–873.29. Daw ND, O’Doherty JP, Dayan P, Seymour B, Dolan RJ (2006) Nature
441:876–879.30. Li J, McClure SM, King-Casas B, Montague PR (2006) PLoS ONE 1:e103.31. Kahneman D, Tversky A (1979) Econometrica 47:263–292.32. Bechara A, Damasio H, Tranel D, Damasio AR (1997) Science 275:1293–
1295.33. Mellers B, Schwarz A, Ritov I (1999) J Exp Psychol Gen 128:332–345.34. Camille N, Coricelli G, Sallet J, Pradet-Diehl P, Duhamel JR, Sirigu A (2004)
Science 304:1167–1170.35. Coricelli G, Critchley H, Joffilty M, O’Doherty JP, Sirigu A, Dolan R (2005)
Nat Neurosci 8:1255–1262.36. Camerer CF, Ho TH (1999) Econometrica 67:827–874.37. Camerer CF (2002) Behavioral Game Theory: Experiments on Strategic Inter-
action (Princeton Univ Press, Princeton).38. Rosenstein MT, Barto AG (2004) in Learning and Approximate Dynamic
Programming: Scaling Up to the Real World, Si J, Barto A, Powell W, WunschD (Wiley, New York), pp 359–380.
39. Redish AD (2004) Science 306:1944–1947.40. Dodd ML, Klos KJ, Bower JH, Geda YE, Josephs KA, Ahlskog JE (2005) Arch
Neurol (Chicago) 62:1377–1381.41. Schluppeck D, Glimcher P, Heeger DJ (2005) J Neurophysiol 94:1372–1384.42. Platt ML, Glimcher PW (1999) Nature 400:233–238.43. Glimcher PW (2003) Annu Rev Neurosci 26:133–179.44. Sugrue L, Corrado GS, Newsome WT (2004) Science 304:1782–1787.45. Friston KJ, Williams S, Howar R, Frackowiak RSJ, Turner R (1996) Magn
Reson Med 35:346–355.46. Evans AC, Collins DL, Mills SR, Brown ED, Kelly RL, Peters TM (1993)
Nuclear Science Symposium and Medical Imaging Conference, 1993, 1993 IEEEConference Record (IEEE, Piscataway, NJ), pp 1813–1817.
47. Ashburner J, Friston KJ (1999) Hum Brain Mapp 7:254–266.48. Friston KJ, Holmes AP, Worsely KJ, Poline JP, Frith CD, Frackowiak RSJ
(1995) Hum Brain Mapp 2:189–210.
9498 � www.pnas.org�cgi�doi�10.1073�pnas.0608842104 Lohrenz et al.