network security and b2c on-line consumer behavior: an
TRANSCRIPT

61
Network Security and B2C On-Line Consumer Behavior: An Empirical
Investigation of Internet Transactions in Taiwan
Gee San and Chia-Yi Liu*
Institute of Industrial Economics and Department of Economics,
National Central University
and
Service Research Department, Industrial Economics and Knowledge Center, Industrial Technology Research
Institute, Taiwan, R.O.C.
* The authors are, respectively, Professor of Economics, Graduate Institute of Industrial Economics and
Department of Economics, National Central University and Associate Research Fellow, Service Research
Department, Industrial Economics and Knowledge Center, Industrial Technology Research Institute, Taiwan,
R.O.C.. This paper is written under the sponsorship from MOE Program for Promoting Academic Excellent of
Universities under the grant number 91-H-FA08-1-4. Correspondent: San Gee. Mailing address: Institute of
Industrial Economics, National Central University, 300 Jung-da Rd., Jung-li, Taoyuan County, Taiwan 320,
R.O.C. E-mail: [email protected]. Tel: 886-3-4275142, Fax: 886-3-422-3067.
Proceedings of the Second Workshop on Knowledge Economy and Electronic Commerce

62
Network Security and B2C On-Line Consumer Behavior: An Empirical
Investigation of Internet Transactions in Taiwan
Abstract
This study adopts the CATI approach to conduct telephone interviews so as to collect a
total of 1,197 representative samples from the population of Taiwan. A Heckman’s two-stage
estimation method is adopted to examine the mutual relationship between the demand for and
supply of security in Internet transactions. Our empirical results show that factors related to
the Internet consumers, such as a higher Internet security awareness, the greater their age,
or the more that they use “off-line payments” to complete their transactions, will all
negatively affect the amount of their on-line spending.
Keywords: on-line spending, network security, e-commerce, internet transactions
Proceedings of the Second Workshop on Knowledge Economy and Electronic Commerce

63
1. Introduction Along with the rise of the Internet, the world has quickly become a global village.
Moreover, the rapid development of e-commerce, together with the global competition has actually turned the Internet into “an ultimate shopping center.” In this shopping center, consumers are able to purchase all kinds of products from different markets and even from different countries. In addition, consumers in this “ultimate shopping center” can observe how it drastically differs from the traditional markets. In the traditional markets, consumers are frequently restricted by local suppliers’ limited capabilities while in the ultimate market, consumers are faced with an immense supply on the part of the suppliers. As such, the greatest challenge faced by suppliers in this “ultimate shopping center” lies in how to firmly grab the consumer’s attention in a very brief amount of time. This has in fact already become the key to determining whether or not a supplier can survive when faced with such keen market competition. Davenport and Beck (2002) in their book on attention economics emphasize that, when compared with other industries, e-commerce is the industry which places the most heavy emphasis on “attention”. However, while this may be the case, a highly sticky1 website may not guarantee its success; nevertheless, if a website is not sticky, it will certainly not be able to survive. For this reason, in the fiercely competitive Internet-market, whoever can be the first to win over and to continue to attract the consumer’s attention will be the winner in e-commerce. In this study, the main focus of our analysis lies in analyzing the consumer’s e-commerce behavior, and to facilitate this objective an econometric model will be set up to model the key intentions and inclinations that affect a consumer’s behavior, and thereby provide an explanation of consumers’ on-line consumption decisions.
In relation to the study of on-line consumption, Shiu and Dawson(2002)use Taiwan and U.K. data to compare the personal characteristics of Internet purchasers in the two countries. They find that the different degrees of urbanization in different areas of Taiwan give rise to differences in on-line consumption ratios that are more significant than in the case of the U.K.. Moreover, Lynch, Kent and Srinivasan (2001) conduct an investigation using data for 20 countries, and discover that factors such as different areas and different products, different levels of trust in websites, and different on-line buying experiences on the part of users all significantly influence on-line shoppers’ purchasing behavior. Donthu and Garcia (1999) and Bellman, Lohse, and Johnson (1999) also engage in cross-country comparisons of on-line consumer behavior. Similarly, there are studies in Taiwan which use simple regression approaches to study on-line consumer behavior in Taiwan, but these are less satisfactory for two main reasons. First, the data gathered and analyzed by the researchers are either too small or less scientific so that they cannot represent the population of Taiwan. Second, their data are subjectively selected and they are actually censored data. Thus, under such circumstances, it is necessary to use relevant econometric methods in order to obtain unbiased estimates. To overcome the difficulties mentioned above, in this study we especially adopt the Computer-Assisted Telephone Interview (CATI) approach to collect a valid representative sample that is capable of representing the population of Taiwan. We then apply Heckman’s (1979) two-stage estimation method to this data set to perform our empirical analysis in order to deal with the possible sample selection bias problem that is likely to be associated with the data set. Through such efforts, we believe that an unbiased estimate of Taiwan’s on-line consumers’ purchasing behavior can be obtained.
1 Stickiness refers to Internet attentiveness. When a website is able to attract Internet users with a high frequency, we refer to it as a highly sticky website.
Proceedings of the Second Workshop on Knowledge Economy and Electronic Commerce

64
This paper consists of a total of five sections. In Section 2, we explain the theoretical structure of the empirical work that follows. In Section 3, we report the descriptive statistics which show the specific characteristics of the data used in the model as well as their specifications. In Section 4, the main empirical results are then discussed, and our main findings and conclusions are then summarized in Section 5.
2. Theoretical Structure and Empirical Model By mailing out questionnaires to study the attitudes of on-line consumers towards
spending as well as their intentions and motives, Javenpaa and Todd (1996) discovered that the risk factor associated with Internet transactions was the key factor affecting the on-line consumer’s decision as to whether or not to engage in on-line transactions. At times when the risk associated with on-line transactions became greater, they found that it would have a significant negative influence on consumer spending. Amit, et al. (2000) then went a step further and shifted the focus to on-line transactions risk in an attempt to determine whether this accounted for the main difference between on-line purchasers and off-line purchasers. They found that the size of the on-line transactions risk had an effect on the sales of products, and that when on-line transactions risk was low, the extent of the competition in the on-line transactions market would significantly increase. In order to further ascertain the kind of influence that the demands of on-line consumers for Internet security might have as well as to specifically take into account the sample selection bias problem that arises with the data, in this study we adopt Heckman’s two-stage estimation model to set up our theoretical and empirical models.
To establish our model, let us regard the extent of the sales website’s actual security (WO) and the extent of the Internet users’ demand for Internet security (WR) as the two important decision variables. As such, the key factors as to whether or not Internet users willing to engage in on-line shopping will be determined by comparing the extent of the sales website’s actual security (WO) with the extent of the Internet users’ demand for Internet security (WR). When the former is greater than the latter (i.e. WO>WR), this study argues that those Internet users will engage in on-line consumption and become “on-line shoppers.” In this case, I=1, where I denotes the proxy variable whereby Internet users become on-line consumers. On the contrary, when the extent of the actual security provided by the sales website is limited and relatively smaller than the Internet users’ demand for Internet security (WO<WR), then this study argues that those Internet users will not use the Internet to engage in any purchasing, and for this reason I=0.
The above explanation can be expressed in the following mathematical model:
1=I if WRWO >
0=I otherwise (1)
From Equation (1) it can be seen that the key to determining whether or not Internet users will engage in on-line consumption lies in comparing these two variables, namely, WO which denotes the extent of the sales website’s actual security and WR which stands for the extent of the Internet users’ demand for Internet security. Since the individual characteristics of Internet users, such as the frequency with which they use the Internet (TIME), education (EDU), age (AGE), the extent to which they live in urban areas (URBAN), their awareness of Internet security (REG), and Internet users’ individual attitudes towards risk (RISK), as well as their income levels (INCOME) all directly affect those Internet users’ demand for Internet
Proceedings of the Second Workshop on Knowledge Economy and Electronic Commerce

65
security (WR), the model’s latent function for WR can then be set as
URBANBINCOMEBAGEBEDUBTIMEBBWR 543210 +++++= (2)
+ 176 uREGBRISKB ++
On the other hand, as to the extent of the sales websites’ actual security (WO), the key to whether or not Internet users will actually go on to become on-line shoppers lies in the extent to which they “trust” sales websites. As such, Taiwan’s famous search websites, including Yahoo and PChome, which include webpages for auctioning and purchasing goods over the Internet, have actively introduced business evaluation mechanisms, which consumers are encouraged to use to offer their opinions and evaluation after making on-line purchases. In addition, their search engines also engage in selecting and rewarding these “superior Internet shopping sites,” in the hope that the service quality of these sales websites can be significantly enhanced and Internet users encouraged to engage in more on-line spending activities. For these reasons, in this study we shall use both the consumer’s own evaluation and his/her payment behavior to measure the extent of the actual security of sales websites (WO).
The main reason why a consumer’s payment behavior can serve as a measure of the extent of the security of a website is mainly that if consumers believe that the extent of the actual security provided by the relevant on-line websites (WO) is sufficiently high, they will be more likely to choose on-line payment options when engaging in transactions. By contrast, if the opposite situation applies, they will be more likely to choose the off-line payment options when engaging in transactions2. Therefore, the types of payment options that consumers select can thus serve as important proxy variables to measure the extent of the actual Internet security (WO). For this reason, we can specify the extent of the sales website’s actual security (WO) function as follows:
23210 32 uEXPDDWO ++++= αααα (3)
where D2 is a dummy variable that indicates that, if consumers use the off-line payments approach to complete their on-line consumption, D2 is set as 1, and 0 otherwise. On the contrary, if consumers choose to directly adopt the on-line payments approach to complete their purchases, then D3 is set as 1, and 0 otherwise. Moreover, this study also predicts that the amount of on-line consumption (EXP) will affect the extent of the sales websites’ actual security.
Based on the above explanation, the key to whether or not Internet users can adopt on-line spending will depend on whether or not the sales websites’ actual security (WO) is larger than the extent of the Internet users’ demand for Internet security (WR). When those interviewed in the survey indicated that they had already engaged in on-line consumption, this suggested that the extent of the sales website’s actual security should have been greater than the awareness of and demand for Internet security on their part. Therefore, the 2 In this study we will categorize the methods by which consumers make payments into on-line payments and off-line payments. So-called on-line payments, such as making payments by credit card on-line, consist of making payments directly through the Internet, while off-line payments refer to traditional payment methods where consumers make payments through post offices, or use debit cards to transfer funds through banks or to purchase goods which they can pick up from convenience stores, in which tertiary logistical institutions act as middlemen in facilitating the payments, thereby ensuring the security of transactions, and reducing the risk that would arise from making transactions on-line.
Proceedings of the Second Workshop on Knowledge Economy and Electronic Commerce

66
probability of Internet users engaging in on-line consumption (I=1) can be set as:
)0Pr()Pr()1Pr( <−=<⇔= WOWRWOWRI (4)
Now we substitute equation (2), which represents the Internet users’ awareness of the extent of on-line security (WR), and equation (3), which represents the extent of the sales website’s actual security (WO), into equation (4) to obtain
INCOMEBAGEBEDUBTIMEBBWOWR 43210Pr()0Pr( ++++=<−
1765 uREGBRISKBURBANB ++++
)032 23210 <−−−−− uEXPDD αααα
and, )1Pr(1)0Pr( =−== II
where the above equation can be reduced to become
URBANBINCOMEBAGEBEDUBTIMEBBuu 54321021Pr( −−−−−−<−
)32 321076 EXPDDREGBRISKB αααα ++++−−
INCOMEBAGEBEDUBTIMEBBu 43210*Pr( −−−−−<⇒ (5)
)32 3210765 EXPDDREGBRISKBURBANB αααα ++++−−−
In addition, in the case where the condition WOWR = applies, we are able to reduce the on-line consumers’ total expenditure (EXP) function to bome
2321017
6543210
32 uEXPDDuREGBRISKBURBANBINCOMEBAGEBEDUBTIMEBB
++++=++++++++
αααα
therefore,
( )( ) ⎥
⎦
⎤⎢⎣
⎡−+−−++
+++++−=
212176
5432100
3 321
uuDDREGBRISKBURBANBINCOMEBAGEBEDUBTIMEBB
EXPαα
αα
(6)
and
( ))
321Pr()1Pr(
21765
432100
33
21⎥⎦
⎤⎢⎣
⎡+++++++++−
<−
==DDREGBRISKBURBANBINCOMEBAGEBEDUBTIMEBBuu
Iαα
ααα
(7)
The sample that we collected for this study includes both on-line consumers (I=1) and off-line consumers (I=0). As such the survey data are actually censored data and they are not normally distributed, therefore Heckman’s sample selection bias adjustment method should be applied in order to obtain consistent estimates. In doing so, we shall first use the Probit model to estimate the sample selection bias adjustment item, Lambda (which is also the reciprocal of Mill’s ratio). We can then proceed to use the OLS method to estimate the
Proceedings of the Second Workshop on Knowledge Economy and Electronic Commerce

67
equation which specifically includes Lambda. For this reason, equation (6) may be further amended to become equation (8):
( )⎥⎦
⎤⎢⎣
⎡−+−−++
+++++−=
)(321
212176
5432100
3 uuDDREGBRISKBURBANBINCOMEBAGEBEDUBTIMEBB
EXPαα
αα
( )
( )( )•∆Φ−
⎟⎠⎞
⎜⎝⎛ •∆
−+
1*12
22 δ
φ
δδδ
(8)
where Lambda is
( )
( )( )( )•∆Φ−
⎟⎠⎞
⎜⎝⎛ •∆
1δ
φ , and
( ) RISKBURBANBINCOMEBAGEBEDUBTIMEBB 6543210 −−−−−−−=•∆
EXPDDREGB 32107 32 αααα ++++−
Since equation (8) is the regression equation that has been adjusted for sample selection bias, we will then use it to conduct our empirical tests in order to identify the relevant factors affecting the behavior of on-line consumers.3
3. Explanation of the Data Set To obtain a representative data set for the population of Taiwan which can then be used
to conduct B2C behavior research analysis, we requested the Research Center for National Opinion and Election Studies of National Taipei University to use a computer-assisted telephone interview system (CATI) involving a WIN CATI telephone database system for the people in Taiwan to conduct a survey for all administrative districts in Taiwan. The WIN CATI survey was conducted from September 12 to 23, 2002, and was designed in such a way that the survey samples would be in proportion to the actual populations of each respective administrative district. In addition, during the survey when the surveyed household’s computer user was not at home, every effort was made to use the recall approach to make a further appointment. In the end, we obtained 1,197 effective samples that were used in the following analysis, and in relation to which 586 Internet users were interviewed, of which 212 had already engaged in on-line consumption.
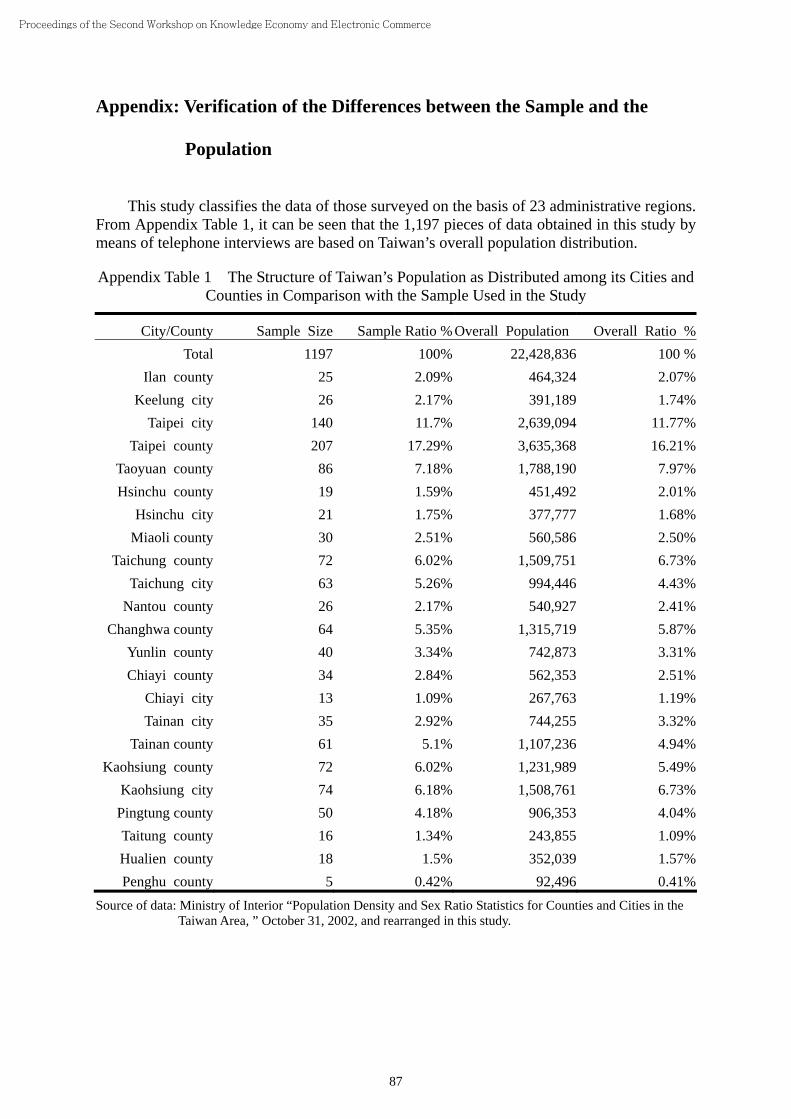
In order to verify whether the sample gathered in this study is capable of appropriately representing the population of Taiwan, we conducted a discrepancy test. The results, which are shown in the Appendix of this paper, suggest that the sample distribution structures for each of the administrative districts in our sample are not significantly different from the corresponding population structure of Taiwan.
3 We can use a similar procedure to obtain the frequency with which consumers engage in on-line consumption in each month (NUM) as a function of all the relevant explanatory variables in equation (8). A similar empirical test on NUM can be applied accordingly.
Proceedings of the Second Workshop on Knowledge Economy and Electronic Commerce

68
3.1 Definitions of the Variables and their Relevant Statistics It is important to note that by incorporating the sales website’s actual security system
(WO) as in equation (3) into equation (4) and we are able to obtain an actual estimated equation as in equation (8). In such empirical analysis, we may not need to know the value of the WO variable. However, in this study we seek a quantitative method that can specifically quantify the WO variable so that it can be directly used to enhance our analysis. We shall now explain in detail how the WO variable is compiled. Currently, the Taiwan government is using the “Secure Online Transaction Medal” to grade the security of all commercial websites. Under this grading scheme, there are 35 criteria which have been selected for evaluation. We can then utilize these criteria to grade each sales website’s actual security measure (WO) as used by the surveyed respondents. In terms of the actual measurement method adopted, we first search for the on-line transactions websites used by those surveyed, and then, based on these 35 “Secure Online Transaction Medal” criteria, to perform the examination. If the examined website meets a criterion of the item being evaluated, then one point will be awarded. However, since items such as those concerned with security policies cannot be observed directly, we then use either e-mail or telephone inquiries to obtain the relevant data from each of the websites. We are finally able to assign scores to the extent of the actual security (WO) of each website used by Taiwan’s on-line shoppers. These scores denoting the extent of each sales website’s actual security (WO) ranged from 0~37 and we may now estimate equation (3) directly.
In explaining the factors affecting (WO), in equation (3) we have incorporated the consumers’ payment method as an explanatory variable. Since many sales websites in Taiwan allow consumers to choose between on-line and off-line methods of payment, consumers can as a consequence, and based on their trust in these websites, choose the kind of payment method that they like. Therefore, we incorporate two dummy variables, D2 and D3, in equation (3), where D2 represents consumers that engage in on-line consumption by adopting an off-line payment approach, for example by making payments on delivery, obtaining goods in the case of convenience stores and then making fund transfers, and D3, conversely, represents those consumers that choose to make payments on-line, e.g., by using their credit card or making fund transfers through the Internet.
The variable representing the extent of the demand for Internet security on the part of the Internet users (WR) is mostly used to measure the extent of the Internet users’ demand for Internet security. In order to measure this variable, in the questionnaire we specifically ask those surveyed, when downloading files from the Internet, the extent of the caution that they exercised, in order to compile scores representing the extent of the demand for Internet security on the part of the respondents. There are three key questions included in the questionnaire that try to proxy the WR variable. These three questions are listed in Table 1 for reference.
(Table 1 about here)
From the choice of questions listed in Table 1, it can be seen that, in the case of the first question being selected in contrast to the third question, the extent of the caution exercised in Internet security is relatively low, and for this reason, when quantifying the respective demands for security, the squared values of 1, 3 and 5 are used as the quantitative scores.4 4 Lynch and Beck (2001) in studying the behavior of Internet consumers in 20 different countries, use five levels of strengths/weaknesses as a basis for measuring how consumers deal with issues such as the need for a brand name, and preferred language, etc. Moreover, Donthu and Garcia (1999) also use a similar method to
Proceedings of the Second Workshop on Knowledge Economy and Electronic Commerce

69
The higher the scores, the greater will be the amount of caution exercised by the Internet user when downloading files from the Internet. Therefore, this study predicts that those Internet users with higher demands for Internet security, as reflected by higher values for WR, will spend less through on-line shopping.
It is important to note that, based on the specifications of the empirical model used in this study, the two variables depicting the demand for Internet security (WR) and the extent of the actual Internet security (WO) are two important measurement variables that determine whether or not consumers will make purchases on line. For these reasons, when specifying the measurement of the WR variable, while at the same time taking into consideration the scope of the WO variable’s numerical value, the WR variable takes on a squared value. From Table 5 which follows later, it can be seen that the numerical value of the WO variable falls within the 12~31 range, while that of the WR variable lies in the 1~25 range. Therefore, based on these specifications, the ranges within which these two variables change are fairly close, and so the relevant magnitudes of these two variables are able to capture the decision-making process of the consumers.
Second, in terms of the extent of the Internet users’ awareness of Internet security (REG), this variable is used to measure the extent of Internet users’ knowledge of Internet security. In order to measure this variable (REG), we design five questions that are related to the REG variable in conducting the survey. We now summarize these five questions in relation to the REG variable in Table 2 for reference.
(Table 2 about here)
In regard to the measurement of the REG variable, Internet users are given 1, 2, 3, 4 or 5 points to reflect the extent to which they agree or disagree with the five statements presented in the survey. In calculating this REG variable based on the assigning of scores in relation to the above five statements, the squares of these scores are added together to arrive at a total, and thus, for this reason, the smallest value for the REG variable is 5, and the largest value is 125.
Furthermore, in terms of measuring the extent of the individual’s attitude towards risk (RISK), we also include three questions in the questionnaire that are used to measure the respondents’ willingness to bear risk. These three questions are presented in Table 3 for reference purposes:
(Table 3 about here)
When studying the behavior of Internet consumers, Lynch and Beck (2001) use five levels of strengths/weaknesses to measure attitudes toward risk. In addition, Donthu and Garcia (1999) use seven levels of strengths/weaknesses as a basis for measuring the attitude toward risk. However, in compiling the RISK variable statistics for our empirical study, we argue that the respondent’s attitude toward risk is a relative concept and, as such, it will be more appropriate to measure how the respondents’ attitudes are related rather than their being purely based on each respondent’s score in the questionnaire. As such, we first calculate the distributions of the scores for questions 1, 2 and 3 in Table 3, respectively. Then, we rank the distributions of the scores for each question in ascending order so that we can divide each distribution into three equal parts subsequently assigning the values 1, 3 and 5, respectively.
quantify individual preference variables as required by the research.
Proceedings of the Second Workshop on Knowledge Economy and Electronic Commerce

70
If a respondent is given a score of 5 (1) for a particular question, this suggests that the risk is at its highest (lowest).5 Finally, by adding up the scores for all three questions we can compile the RISK variable index.
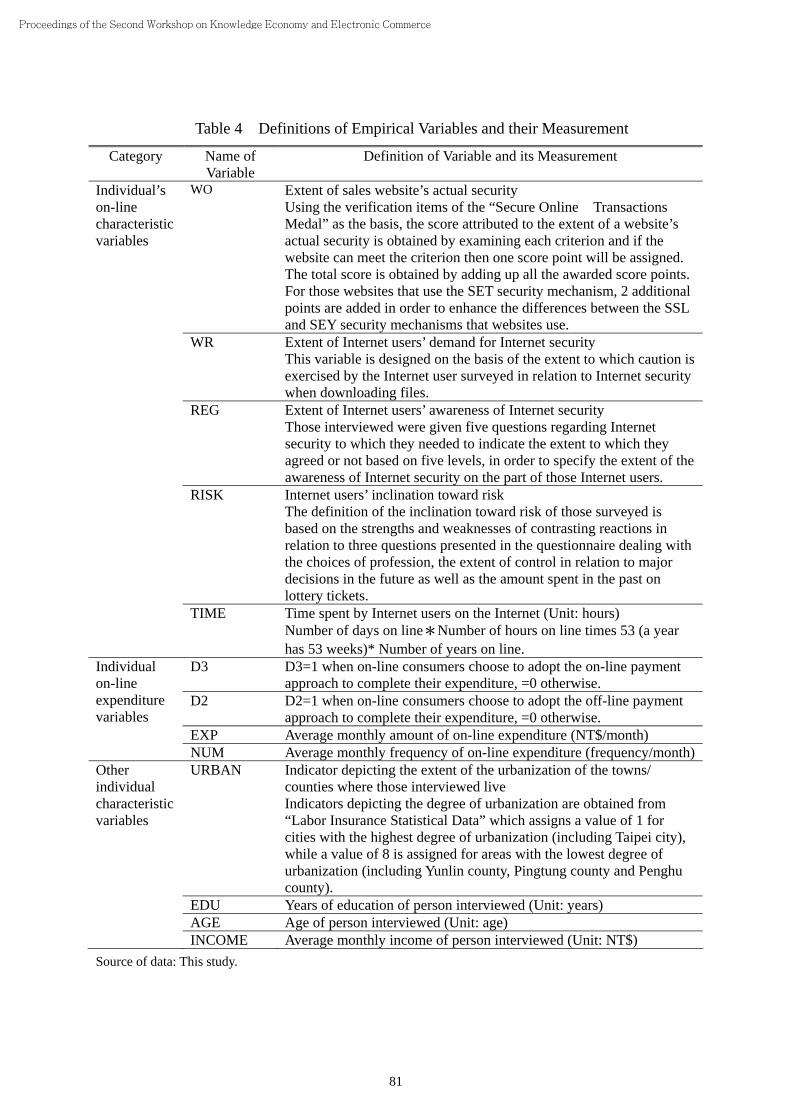
The definitions and the methods adopted to estimate the four variables, namely, WO, WR, REG and RISK as referred to above, are incorporated into Table 4 for reference. The relevant statistical values for each of the variables are presented in Table 5.
(Table 4 about here)
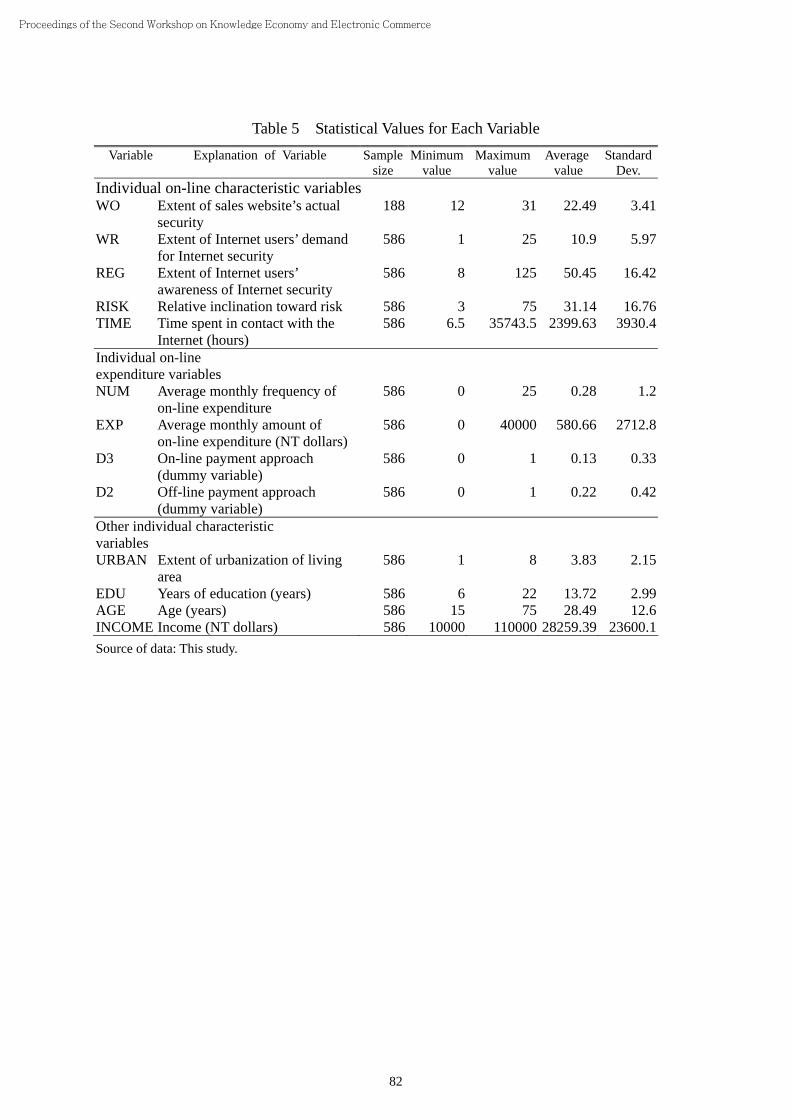
The statistics in Table 5 show that those interviewed in this study had an average age of 28.49, while their average monthly salary was in excess of NT$28,000 (roughly US$1=NT$34). In terms of the individual on-line experiences of those surveyed, the average time that Internet users had made contact with the Internet was approximately 3.33 months, while they had made, on average, 0.2 on line purchases. In addition, the average NT dollar amount that they spent on line was about NT$580 per month.6
(Table 5 about here)
3.2 The Tested Hypothesis
As we explained before, when the actual security of the sales website (WO) is greater than the Internet users’ demand for Internet security (WR), we shall observe that the respondent will engage in on-line consumption. Therefore it is expected that an increase in the website’s actual security (WO) will positively induce on-line consumption, However, an increase in the Internet users’ demand for Internet security (WR) will reduce the corresponding on-line consumption. In addition, the greater the Internet users’ awareness of Internet security (REG), the greater will be their awareness of the dangers that might arise from engaging in on-line consumption, and therefore the REG variable will be expected to exert a negative impact on on-line consumption. By contrast, the more risk loving a respondent is, the greater the likelihood that he will become an on-line consumer. Furthermore, if an on-line consumer decides to adopt the on-line (off-line) payment method to complete his/her purchases, this will indicate that he/she has more (less) trust in on-line shopping, and this will positively (negatively) affect both the amount (EXP) and frequency (NUM) of his/her on-line expenditure. For these reasons, the effect of D3 (D2) on EXP and NUM is expected to be positive (negative).
Many related studies on e-commerce indicate that the higher the on-line consumers’ years of education (EDU) and monthly income (INCOME), the greater the probability of their engaging in on-line consumption. This is due to the fact that they are relatively more familiar with the Internet environment, and they are relatively more capable of bearing the risks while engaging in on-line consumption. Moreover, the results of a study by Lynch, Kent, and Srinivasan (2001) indicate that the frequency of time spent on the Internet (TIME) has a positive impact on the likelihood that they will purchase goods on-line. For this reason, this
5 In Table 3, the specification of the score for question 2 is just the opposite. The lower (higher) the probability value of being successful by the surveyed respondent, the risk is higher (lower).
6 The above figures include the averages for all those who were surveyed (including all those who had never consumed on-line). Here we only examine the 212 surveyed who had already engaged in on-line consumption. In this case, the average amount of time they had been in contact with the Internet increased to 4.27 months; and they on average made 0.8 purchases on line each month. Their average monthly expenditure also increased to NT$1605.08.
Proceedings of the Second Workshop on Knowledge Economy and Electronic Commerce

71
study hypothesizes that the higher the frequency or the longer the period of time that a person makes contact with the Internet (TIME), the greater will be the amount of his/her on-line expenditure. In addition, because the popularity associated with the adoption of information technology (IT) differs quite significantly among different administrative districts in Taiwan, we thus predict that the higher the degree of urbanization in the areas in which the Internet users live, the greater will be the probability that they will engage in on-line consumption. For this reason, the URBAN variable is expected to have a negative impact on the probability, frequency and amount of on-line consumption7. Finally, we also predict that older people will experience greater problems in learning all the relevant Internet skills and will also have greater problems overcoming various obstacles in using Internet. As such, we predict that age will have a negative influence on the probability that an Internet user will become an on-line consumer as well as on the amount and frequency of on-line expenditure.
To sum up, we summarize the predicted effect of each variable on the probability, frequency and the amount of on-line consumer expenditure in Table 6 for reference.
(Table 6 about here)
4. Empirical Results As we indicated before, we adopt Heckman’s two-stage estimation method in our
empirical estimation. Therefore, in the first stage of our estimation we use the Probit model to obtain the sample selection adjustment term (Lambda), and then, in the second stage we include the estimated Lambda variable in order to unbiasedly estimate the relevant factors that will affect the Internet user’s on-line consumption value (EXP) and the corresponding on-line shopping frequency (NUM).
4.1 Results of the Probit Model Although e-commerce has developed very rapidly, a study by Lynch, Kent, and
Srinivasan (2001) that focused on U.S. and European countries has found that only 17% of Internet users really know how to use the Internet to engage in on-line purchases. What then are those key factors that will make those Internet users become on-line shoppers? To answer this question, we first use a Probit model to examine such a possibility as well as to obtain the estimates for the sample selection bias correction term, Lambda, and the model’s specification is shown as follows:
INCOMEbAGEbRISKbEDUbTIMEbbY 543210 +++++=
ε+++ URBANbREGb 76 (9)
where the explanatory variable Y is a dummy variable. In the case of those Internet users surveyed that have previously engaged in on-line consumption, Y is assigned a value of 1, while in all other cases it is assigned a value of 0. The model expressed by equation (9) above includes all the relevant explanatory variables related to the extent of the Internet users’ demand for Internet security (WR), but it does not include the extent of the sales website’s actual security (WO) and its explanatory variables (D2, D3, EXP), for two major reasons. First, the main purpose of the Probit model’s estimation is to explain the factors that are
7 According to the government statistics, the highest (lowest) degree of urbanization of an administration district has the score of 1 (8), therefore, the variable URBAN is predicted to have a negative impact on on-line consumption behavior.
Proceedings of the Second Workshop on Knowledge Economy and Electronic Commerce

72
relevant in terms of whether or not they influence the Internet users’ decision to engage in on-line consumption. As far as the extent to which consumers are concerned with the sales website’s actual security (WO), as well as the payment approach adopted by the consumers (D2, D3), and the amount of consumption (EXP), these will be dealt with in the second stage of the Heckman model. Secondly, for those Internet users surveyed that had previously never engaged in any on-line consumption, i.e. where Y=0, we will not have any data related to the WO, D2, D3 or EXP variables and, therefore, it will not be appropriate to incorporate these variables in the Probit model. The Probit model estimation is presented in Table 7 for reference.
(Table 7 about here)
From the results in Table 7, it can be seen that the more frequently that on-line consumers use the Internet (TIME), the more opportunities there are for engaging in on-line consumer behavior. Because the coefficients for the TIME variables in the Probit model are all positive and highly significant, these empirical results indicate that the more frequently that Internet users make contact with the Internet, the more familiar they will become with the Internet, and their anxiety and uncertainty with regard to on-line consumption will be reduced. Therefore, this will increase the likelihood of their engaging in on-line consumption. The above empirical results are also in accordance with the empirical results of Bellman, Lohse, and Johnson (1999). In their research, they find that higher annual incomes and the more time that these Internet users spent in contact with the Internet will positively and significantly influence the likelihood that they will engage in on-line consumption.
Due to the fact that in recent years Taiwan has actively promoted students’ understanding of and skills in relation to information-related technology, the use of computers and the Internet has already become very popular in all levels of schools. For this reason, we hypothesize that the more education (EDU) that a person has, the greater the understanding of and frequency of contact with the Internet that that person will have. The empirical results in Table 7 do in fact confirm that EDU exerts a positive and significant impact on the probability of engaging in on-line consumption.
As for risk preference (RISK), our empirical results also provide evidence that the more that individuals are characterized as risk lovers, the higher the probability that on-line users will become on-line consumers, a finding that also confirms our conjecture. Although the empirical results presented in Table 7 indicate that risk lovers are more likely to engage in on-line consumer behavior, whether or not they will also exert a positive influence on the amount spent on on-line consumption (EXP) will be the subject of the tests that follow.
In addition, the empirical results in Table 7 indicate that income (INCOME) does not positively and significantly influence the probability of being an on-line consumer as was previously expected. However, in order to distinguish between those whose incomes are particularly high and those that are not, we substitute the INCOME variable with a dummy variable (DINCOME),8 and rerun the regression of models 2 through 5. The empirical results in Table 7 indicate that the DINCOME variable is negative and highly significant, from which we can assert that Internet users with relatively low (high) incomes will have relatively fewer (more) opportunities to become on-line consumers, a finding that is also in accordance with our earlier predictions.
In models 3 through 5 in Table 7, we exclude three variables: age (AGE), the extent of 8 That is, monthly income is categorized according to whether it is more than NT$50,000 or less than NT$50,000. If monthly income is less than NT$50,000, we then specify DINCOME=1, otherwise it equals 0.
Proceedings of the Second Workshop on Knowledge Economy and Electronic Commerce

73
Internet users’ awareness of Internet security (REG), and the extent of urbanization (URBAN). Our results indicate that these three variables will not affect the probability that an Internet user will choose to become an on-line consumer. These insignificant results differ from what we originally expected.
After completing the first stage of the Probit model’s estimation, we engage in the second stage of estimation which focuses specifically on the amount of on-line spending (EXP) and its corresponding frequency (NUM) as we specified in equation (8). The results of the main estimation models are presented in Tables 8 and 9 for reference.
(Table 8 about here)
It is important to note that the results of the first two models in Table 8 are Heckman’s second stage of estimation results for log(EXP) where they contain the sample selection bias correction term – Lambda. As we can see from Model 1 Model 2 and Model 3, the greater the Internet users’ awareness of Internet security (REG), as well as the more that they understand the losses that might arise when making purchases over the Internet, the lower will be the amount that on-line consumers will spend making on-line purchases. The significant and negative influence of the REG variable on log(EXP) is consistent with our expectation.
The results in Table 8 also confirm that the more frequently that Internet users use the Internet (TIME), the more information they will obtain from the Internet, and therefore those users will tend to have relatively large amounts of on-line expenditure. The TIME variable is found to have both a positive and significant impact on log(EXP).
Furthermore, in relation to those individual factors such as (AGE), we believe that those who are older face greater obstacles in terms of accessing the Internet, and we argue that age will have a negative effect on on-line consumption levels. From the results of Model 1 and Model 2 in Table 8, it can be seen that the effect of age on log (EXP) is indeed negative, which is consistent with our predictions.
In view of the low cost and high effectiveness of using the Internet, as well as those with higher levels of education (EDU) being able to learn more rapidly and able to spend more, the extent to which they are able to accept on-line spending is also relatively high. For this reason, we predict that EDU will have both a positive and significant impact on the amount of on-line spending. This prediction is also supported by the results of models 1 through 3 in Table 8 in which the EDU variable is positive and highly significant.
In addition, the results of Model 1 and Model 2 in Table 8 indicate that an individual’s income (INCOME) will both significantly and positively influence the amount that such an on-line consumer expends on the Internet. This result is also consistent with our prediction.
Due to the fact that there exists significant differences in terms of the usage of computers in different administrative districts in Taiwan which also exhibit different degrees of urbanization, we hypothesize that the URBAN variable will negatively influence log (EXP). As shown in Model 1 and Model 2 of Table 8, the coefficient of the URBAN variable is negative and highly significant which does confirm that, for those counties and cities with lower levels of urbanization in Taiwan, the amount spent on on-line purchases will be significantly lower than in the case of the highly-urbanized areas.
In regard to the individual being a “risk lover” (RISK), we hypothesize that the more inclined toward risk that people are, the greater is the likelihood that they will use the Internet to engage in on-line consumption, and so we predict that (RISK) will positively influence log
Proceedings of the Second Workshop on Knowledge Economy and Electronic Commerce
74
(EXP). However, from the results of Model 1 and Model 2 of Table 8, it is seen that its influence is both negative and significant, which is contrary to our prediction. As such, we can only confirm that a risk lover will be more likely to engage in on-line shopping. However, we cannot confirm that he/she will spend more on on-line spending.
As far as the different payment methods are concerned, because on-line consumers can and will select their method of payment based on the extent of their trust in the websites involved, the payment method that the on-line consumer selects may reflect how much an on-line consumer trusts in websites. The empirical results of Model 1 and Model 2 confirm that, when on-line consumers decide to adopt the “off-line payment” (D2) method to conclude their on-line purchases, the estimated coefficient regarding the level of on-line consumption will be negative and highly significant. These empirical results suggest that when the level of trust on the part of consumers in the websites is low and people choose to use traditional payment methods to allay their concerns over the needed Internet security, consequently, the amount that they will spend on on-line purchasing will be lower. On the contrary, as shown in Table 8, if consumers use the “on-line payment mechanism” (D3) to make payments for goods, then the estimated coefficient will be shown to be both positive and significant. The empirical results of the D2 and D3 variables are consistent with our hypothesis: when the level of trust that consumers have in the website’s security is relatively high (low), it will positively (negatively) influence the amount of their on-line consumption.
In addition, by comparing each variable’s absolute t value and R2 between Model 2 and Model 3, we find that Model 3, which does not take into account the possible sample selection bias problem, has less explanatory power than the results of Model 2. Therefore, it is shown that the Heckman two-stage estimation method which is adopted in this study is more capable of explaining the consumer’s on-line expenditure behavior.
Finally, in Model 4 we perform another estimation by combining the model’s WR and WO variables with the sample selection bias-adjusted variable (Lambda). Table 8 indicates that the greater the extent of the sales website’s actual security (WO), on-line consumption will be positively influenced. By contrast, the greater the extent of the Internet users’ demand for Internet security (WR), the lower will be the amount of on-line consumption.
Generally speaking, the results in Table 8 indicate that an Internet user’s decision to become an on-line consumer critically depends on evaluating the extent of the sales website’s actual security (WO) and the extent of the Internet users’ demand for Internet security (WR) variables. When WR<WO, this indicates that Internet users will be more likely to use the Internet to engage in consumption. For this reason, we argue that the greater the Internet users’ demand for Internet security (WR), the less likely it is that Internet users will engage in on-line consumption. Moreover, this assertion is supported by the empirical results of Model 4, which indicate that WR (WO) has both a significant and negative (positive) influence on the amount of on-line expenditure (EXP).
Furthermore, the empirical results in Table 8 suggest that the amount of time spent on the Internet (TIME), the years of education (EDU), income (INCOME), and the extent of urbanization (URBAN) all positively and significantly affect on-line expenditure. By contrast, the greater the extent of the Internet users’ awareness of Internet security (REG), the older they are (AGE), and the more that on-line consumers choose the relatively traditional “off-line payment approach,” (D2), the resulting impact on on-line consumption levels will be significantly negative.
Having explained the amount of on-line expenditure, we will switch to using the
Proceedings of the Second Workshop on Knowledge Economy and Electronic Commerce

75
frequency of expenditure (NUM) as the new dependent variable to examine relevant factors in determining NUM. Our empirical results are listed in Table 9.
(Table 9 about here)
As we argued before, the REG variable may have a negative impact on on-line consumption behavior. As such, we predict that the REG variable will also reduce the frequency of on-line consumption. It can be seen from Table 9 that the REG variable will indeed both significantly and negatively affect the frequency of on-line consumption (Num) which confirms our conjecture. In addition, the empirical results for Model 2 (see Table 9) show that the more frequently that Internet users use the Internet (TIME), as well as the more frequently that consumers use the “on-line payment mechanism” (D3) to make payments for purchasing goods, our empirical results confirm that they all have a positive and significant impact on the frequency of consumption (NUM). By comparing Model 2 with Model 3 in Table 9, we can again see that the sample selection bias adjustment variable (Lambda) has a relatively significant adjustment effect and that the performance of the estimation in Model 2 is better than in Model 3. Finally, the results of Model 4 indicate that, although the influence of the WR and WO variables, as expected, have a negative and positive impact respectively on Num, the WR variable is not significant while the WO variable is highly significant.
To sum up, the results presented in Table 9 confirm that, when the sales website’s actual security (WO) is greater than the Internet users’ demand for Internet security (WR), the more likely it is that Internet users will choose to engage in on-line transactions. For this reason, the extent of the sales website’s actual security (WO) will both positively and significantly influence the frequency with which on-line consumers engage in on-line consumption.
5. Conclusion This study sets out to analyze whether an Internet user will take a further step and
become an on-line consumer. In our theoretical model, we have argued that the key factor is really whether the actual security provided by the sales website is greater than the Internet users’ demand for Internet security. We then infer that those Internet users will not use the Internet to engage in consumption if relatively little security is provided by the sales website, and vice versa. Based on such a theoretical argument, we then set up an empirical model and use the Heckman two-stage estimation method to conduct estimations in order to handle the sample selection bias problem. Our empirical results confirm our view that the more frequently Internet users make contact with the Internet, the more years of education they have, and the higher their incomes, the greater will be the likelihood that an Internet user will become an on-line consumer. In addition, these factors will also positively contribute to their on-line expenditure levels. Our empirical results also confirm that the higher the Internet users’ awareness of Internet security, the older these Internet users are, and the lower the extent of the urbanization in the cities or towns in which they live, the more likely it is that they will adopt the “off-line payment approach” for concluding their transactions, and the lower will be the levels of their on-line consumption.
As for the frequency of on-line consumption, our empirical evidence confirms that the longer these on-line consumers adopt the “on-line payment approach” and the longer that Internet users make contact with the Internet, the on-line frequency of purchases of these consumers will increase while the Internet users’ increased awareness of Internet security will lessen the frequency of their on-line consumption.
To sum up, the empirical results of this paper confirm that, as the demand for Internet
Proceedings of the Second Workshop on Knowledge Economy and Electronic Commerce

76
security on the part of Internet users increases, the amount expended on on-line transactions will decrease. By contrast, as the extent of the sales website’s actual security increases, the amount of on-line expenditure will also increase. Our empirical results generally support the theoretical model specified in this study.
The above empirical results clearly suggest that the most important factor affecting the development of e-commerce is Internet transactions security. Therefore, how to establish a safer Internet transactions environment so as to enhance or to restore consumers’ confidence in Internet transactions security has become an important task of the government. The establishment of a more secure Internet transactions environment requires the cooperation of both the Internet providers and the government. Only by drawing up various regulations to promote industrial self-compliance regulations among businesses, promoting Internet security self-evaluation as well as introducing relevant laws and regulations together with their strict enforcement, can a more satisfactory B2C transactions environment be established. In actual fact, the key to developing the B2C market at present may not lies in the development of faster or deeper computer technology, but rather in whether each of the interrelated transactions environments is sound, and whether or not consumers can have a more secure transactions environment.
Proceedings of the Second Workshop on Knowledge Economy and Electronic Commerce

77
References
Amit B., S. Misra, and H. Raghavrao “On Risk Convenience, and Internet Shopping Behavior,” Communications of the ACM, 43 (1), 2000, pp. 98-105.
Bellman, S., G.L. Lohse, and E.J. Johnson “Predictors of Online Buying Behavior,” Communications of the ACM, 42(12), 1999, pp. 32-38.
Davenport, T.H. and John C. Beck. The Attention Economy: Understanding the New Currency of Business, Harvard Business School Press, Boston, 2002.
Donthu, N. and A. Garcia “The Internet Shopper,” Journal of Advertising Research, 39(5), 1999, pp. 52-58.
Javenpaa, S.L. and P.A. Todd “Consumer Reactions to Electronic Shopping on the World Wide Web,” International Journal of Electronic Commerce, 1 (2), 1996, pp. 59-88.
Lee, Matthew K.O. and Turban, E. “A Trust Model for Consumer Internet Shopping,” International Journal of Electronic Commerce, 6(1), 2001, pp. 75-91.
Lynch, P.D. and J.C. Beck “Profiles of Internet Buyers in 20 Countries: Evidence for Region-Specific Strategies,” Journal of International Business Studies, 32(4), 2001, pp. 725-48.
Lynch, P.D., R.J. Kent, and S.S. Srinivasan “The Global Internet Shopper: Evidence from Shopping Tasks in Twelve Countries,” Journal of Advertising Research, 41(3), 2001, pp. 15-23.
Heckman, J.J. “Sample Selection Bias as a Specification Error,” Econometrica, 47, 1979, pp. 153-161.
Nakamura, A. and M. Nakamura “A Comparison of the Labor Force Behavior of Married Women in the United States and Canada, with Special Attention to the Impact of Income Taxes,” Econometrica, 49(2), 1981, pp. 451-89.
Shiu, E.C. and J.A. Dawson “Cross-National Consumer Segmentation of Internet Shopping for Britain and Taiwan,” The Service Industries Journal, 22(1), 2002, pp. 147-166.
Secure Online, http://www.secureonline.com.tw/
Proceedings of the Second Workshop on Knowledge Economy and Electronic Commerce

78
Table 1: Questions Designed to Proxy the Internet Users’ Demand for Internet Security (WR)
Name of variable
Measuring the Extent of the Demand for Security
Design of questionnaire
When you download files from the Internet, you hope which of the following will apply (of the following items displayed): □ Do not give warnings regarding security: it’s too troublesome □ When giving warnings regarding security, remind yourself to pay attention to
security when downloading files □ In order to ensure security, you normally do not download unknown files from the
Internet Note: The methods adopted to measure the variables signifying the extent of the demand for security are mostly
the squared values of 1, 3 and 5, respectively. Source of data: This study.
Proceedings of the Second Workshop on Knowledge Economy and Electronic Commerce

79
Table 2 Questions Relating to the Measurement of the Extent of Security Awareness (REG)
Variable Measuring the Extent of the Demand for Security Awareness Survey Design
1.For fear of forgetting my password, I always use my date of birth or ID card number as my password. □Fully agree□Agree□No opinion□Disagree□Fully disagree
2.I believe that passwords at best should all be based on certain rules, or that by using similar passwords it is relatively less easy to forget them. □Fully agree□Agree□No opinion□Disagree□Fully disagree
3. I feel that the Internet security mechanism is very complicated, and not very easy to understand. □Fully agree□Agree□No opinion□Disagree□Fully disagree
4. I feel that Internet security should be the responsibility of the merchant. □Fully agree□Agree□No opinion□Disagree□Fully disagree
5.I feel that Internet hacking or stealing passwords only happens in movies. □Fully agree□Agree□No opinion□Disagree□Fully disagree
Note: The design of the measurement of security awareness (REG) involves assigning scores of 1, 2, 3, 4 and 5 ranging from absolute agreement to absolute disagreement, in that order, and subsequently adding up the squares of these values to obtain a total.
Source of data: This study
Proceedings of the Second Workshop on Knowledge Economy and Electronic Commerce

80
Table 3 Questions Associated with Attitudes towards Risk (RISK)
Variable Questions Related to the Measurement of the Degree of Risk Aversion Design of Questionnaire
1. When you select a job in the future, what is your preference with regard to the following 5 possible choices? (please select one) □a career with a stable salary (e.g., a government employee) □a large private enterprise, in a career that is highly secure □a small private enterprise, with prospects for rapid promotion, but which is easily affected by economic conditions and hence does not offer much security □a salary based on performance in a career with considerable autonomy (e.g., an insurance representative or a professional broker) □establish my own company
2. As for those major decisions that may affect the way your life develops in the future, e.g., choice of career, choice of college or department, or choice of spouse, what probability ( ______%) of being successful will you need to be sure of before making such a decision?
3. At present government lotteries are extremely popular. In relation to the government lottery tickets issued up to the present time, how much have you spent on buying them _________? (If you can only think of a range, please write down the mid-value of this).
Note: First calculate all of the sample distributions, and divide them into three groups, assigning them squared values of 1, 3 and 5 based on their rank. After the scores for each item have been added together, we then have the estimated value of inclination toward risk (RISK).
Source of data: This study.
Proceedings of the Second Workshop on Knowledge Economy and Electronic Commerce
81
Table 4 Definitions of Empirical Variables and their Measurement
Category Name of Variable
Definition of Variable and its Measurement
Individual’s on-line characteristic variables
WO Extent of sales website’s actual security Using the verification items of the “Secure Online Transactions Medal” as the basis, the score attributed to the extent of a website’s actual security is obtained by examining each criterion and if the website can meet the criterion then one score point will be assigned. The total score is obtained by adding up all the awarded score points. For those websites that use the SET security mechanism, 2 additional points are added in order to enhance the differences between the SSL and SEY security mechanisms that websites use.
WR Extent of Internet users’ demand for Internet security This variable is designed on the basis of the extent to which caution is exercised by the Internet user surveyed in relation to Internet security when downloading files.
REG Extent of Internet users’ awareness of Internet security Those interviewed were given five questions regarding Internet security to which they needed to indicate the extent to which they agreed or not based on five levels, in order to specify the extent of the awareness of Internet security on the part of those Internet users.
RISK Internet users’ inclination toward risk The definition of the inclination toward risk of those surveyed is based on the strengths and weaknesses of contrasting reactions in relation to three questions presented in the questionnaire dealing with the choices of profession, the extent of control in relation to major decisions in the future as well as the amount spent in the past on lottery tickets.
TIME Time spent by Internet users on the Internet (Unit: hours) Number of days on line*Number of hours on line times 53 (a year has 53 weeks)* Number of years on line.
D3 D3=1 when on-line consumers choose to adopt the on-line payment approach to complete their expenditure, =0 otherwise.
D2 D2=1 when on-line consumers choose to adopt the off-line payment approach to complete their expenditure, =0 otherwise.
EXP Average monthly amount of on-line expenditure (NT$/month)
Individual on-line expenditure variables
NUM Average monthly frequency of on-line expenditure (frequency/month)Other individual characteristic variables
URBAN Indicator depicting the extent of the urbanization of the towns/ counties where those interviewed live Indicators depicting the degree of urbanization are obtained from “Labor Insurance Statistical Data” which assigns a value of 1 for cities with the highest degree of urbanization (including Taipei city), while a value of 8 is assigned for areas with the lowest degree of urbanization (including Yunlin county, Pingtung county and Penghu county).
EDU Years of education of person interviewed (Unit: years) AGE Age of person interviewed (Unit: age) INCOME Average monthly income of person interviewed (Unit: NT$) Source of data: This study.
Proceedings of the Second Workshop on Knowledge Economy and Electronic Commerce
82
Table 5 Statistical Values for Each Variable Variable Explanation of Variable Sample
size Minimum
value Maximum
value Average
value Standard
Dev. Individual on-line characteristic variables WO Extent of sales website’s actual
security 188 12 31 22.49 3.41
WR Extent of Internet users’ demand for Internet security
586 1 25 10.9 5.97
REG Extent of Internet users’ awareness of Internet security
586 8 125 50.45 16.42
RISK Relative inclination toward risk 586 3 75 31.14 16.76TIME Time spent in contact with the
Internet (hours) 586 6.5 35743.5 2399.63 3930.4
Individual on-line expenditure variables NUM Average monthly frequency of
on-line expenditure 586 0 25 0.28 1.2
EXP Average monthly amount of on-line expenditure (NT dollars)
586 0 40000 580.66 2712.8
D3 On-line payment approach (dummy variable)
586 0 1 0.13 0.33
D2 Off-line payment approach (dummy variable)
586 0 1 0.22 0.42
Other individual characteristic variables URBAN Extent of urbanization of living
area 586 1 8 3.83 2.15
EDU Years of education (years) 586 6 22 13.72 2.99AGE Age (years) 586 15 75 28.49 12.6INCOME Income (NT dollars) 586 10000 110000 28259.39 23600.1Source of data: This study.
Proceedings of the Second Workshop on Knowledge Economy and Electronic Commerce

83
Table 6 An Explanation of the Measurement of Each of the Variables and their Predicted Effect on the Probability and the Amount (EXP) and Frequency (NUM) of on-line
Expenditure
Name of Variable
Explanation of Variable Predicted Effect on the Probability
of Becoming an On-line Consumer
Predicted Effect on EXP and
NUM
WO Extent of sales website’s actual security + WR Extent of Internet users’ demand for Internet
security -
REG Extent of Internet users’ awareness of Internet security
- -
RISK Relative inclination toward risk + + TIME Time spent in contact with the Internet (Unit:
hours) + +
URBAN Extent of urbanization of living area - - EDU Years of education (years) + + AGE Age (years) - - INCOME On-line consumers’ average income (Unit: NT
dollars) + +
D2 On-line consumers’ choice of off-line payment approach
-
D3 On-line consumers’ choice of on-line payment approach
+
Source of data: This study.
Proceedings of the Second Workshop on Knowledge Economy and Electronic Commerce

84
Table 7 Empirical Results of the Probit Model
Variable model 1 model 2 model 3 model 4 model 5 Intercept -2.5578***
(40.4080) -2.6345*** (43.29)
-2.608*** (44.8824)
-2.724*** (59.8901)
-2.6832*** (65.062)
TIME 2.8e-5** (3.95)
2.71e-5* (3.69)
2.68e-5* (3.63)
2.59e-5* (3.42)
2.57e-5* (3.37)
EDU 1.395e-1*** (41.99)
1.406e-1*** (44.06)
1.417e-1***
(46.17) 1.1415e-1*** (46.05)
1.412e-1***
(45.9321)RISK 3.785e-2*
(3.49) 3.907*
(3.75) 3.964e-2* (3.89)
4.005e-2* (3.98)
3.991** (3.9695)
AGE 8.084e-4 (0.0205)
1.414e-3 (0.082)
-- -- --
INCOME -2.1593e-6 (0.5)
-- -- -- --
DINCOME -- -3.6282* (3.11)
-3.4378e-1* (3.11)
-3.4608e-1* (3.15)
-3.501e-1* (3.239)
REG -2.44e-3 (0.51)
-2.2088e-3 (0.42)
-2.233e-3 (0.48)
-- --
URBAN 1.07e-2 (0.158)
8.9047e-3 (0.12)
8.8355e-3 (0.119)
9.144e-3 (0.12)
--
Sample size
586 586 586 586 586
Log(L fn) -353.3079 -351.9861 -352.0273 -352.2677 -352.3317 Explanation: 1. The values included in the parentheses are 2χ values.
2.***denotes significance at the 1% level, **denotes significance at the 5% level,* denotes significance at the 10% level.
Proceedings of the Second Workshop on Knowledge Economy and Electronic Commerce

85
Table 8 Empirical Results of the Amount of On-line Expenditure (EXP). Explanatory Variable: log(EXP)
Variable model 1 model 2 model 3 model 4 Intercept 1.46629***
(6.16) 1.32492***
(5.75) -1.0533e-1
(0.32) 1.68350***
(7.58) WR -- -- -- -0.01065*
(1.87) REG -1.344e-2***
(6.56) -1.22e-2***
(6.07) -4.92e-3*
(1.7) --
TIME 4.658e-5*** (5.45)
4.308e-5*** (5.12)
3.861e-5*** (3.16)
--
EDU 3.504e-2*** (2.95)
2.975e-2** (2.5)
5.988e-2*** (3.49)
--
AGE -1.13e-2*** (3.41)
-1.015e-2***
(3.04) 4.6364e-4
(0.1) --
INCOME 5.12e-6*** (2.8)
4.69e-6*** (2.56)
-1.12e-6 (0.43)
--
URBAN -3.144e-2** (2.06)
-2.572e-2* (2.68)
2.665e-2 (1.21)
--
RISK -2.359e-2* (1.93)
-2.29e-2* (1.9)
-1.013e-2 (0.58)
--
WO -- -- -- 0.0338*** (5.05)
D2 -2.6518e-1** (2.3)
-- -- --
D3 -- 3.7622e-1*** (3.22)
1.77947*** (11.94)
--
Lambda 1.42682*** (22.91)
1.24849*** (25.17)
-- 0.88652*** (9.6)
n 586 586 586 586 Adj-R2 0.6427 0.6458 0.2522 0.606 Notes: 1. The values included in parentheses are absolute t values.
2.***denotes significance at the 1% level, **denotes significance at the 5% level, * denotes significance at the 10% level.
Proceedings of the Second Workshop on Knowledge Economy and Electronic Commerce

86
Table 9 The Empirical Results of the Frequency of On-line Consumption (Num)
model 1 model 2 model 3 model 4 Intercept 4.7767e-1
(1.38) 3.6778e-1
(1.09) -9.874e-2
(0.29) 0.16141 (1.28)
WR -- -- -- -0.0038 (0.48)
REG -7.1e-3* (2.38)
-6.15e-3** (2.09)
-3.77e-3 (1.26)
--
TIME 4.162e-5*** (3.34)
3.89e-5*** (3.16)
3.744e-5** (2.97)
--
EDU 2.206e-2 (1.27)
1.803e-2 (1.04)
2.786e-2 (1.57)
--
AGE -3.68e-3 (0.76)
4.88e-3 (0.57)
6.7386e-4 (0.14)
--
INCOME -8.3707e-7 (0.31)
-1.15e-6 (0.43)
-3.05e-6 (1.12)
--
URBAN 8.75e-3 (0.39)
1.305e-2 (0.58)
3.013e-2 (1.32)
--
RISK -9.27e-3 (0.52)
-8.62e-3 (0.49)
-4.45e-3 (0.25)
--
WO -- -- -- 0.02414** (2.58)
D2 -2.0671e-1 (1.23)
-- -- --
D3 -- 2.84e-1* (1.66)
7.4171e-1*** (4.81)
--
Lambda 5.4436e-1*** (5.99)
4.0723e-1*** (5.61)
-- 0.16764 (1.3)
n 586 586 586 586 Adj-R2 0.1029 0.1048 0.0569 0.0939 Notes: 1. The values included in parentheses are absolute t values.
2. * * *denotes significance at the 1% level, * *denotes significance at the 5% level, * denotes significance at the 10% level.
Proceedings of the Second Workshop on Knowledge Economy and Electronic Commerce
87
Appendix: Verification of the Differences between the Sample and the
Population
This study classifies the data of those surveyed on the basis of 23 administrative regions. From Appendix Table 1, it can be seen that the 1,197 pieces of data obtained in this study by means of telephone interviews are based on Taiwan’s overall population distribution.
Appendix Table 1 The Structure of Taiwan’s Population as Distributed among its Cities and Counties in Comparison with the Sample Used in the Study
City/County Sample Size Sample Ratio % Overall Population Overall Ratio %Total 1197 100% 22,428,836 100 %
Ilan county 25 2.09% 464,324 2.07%Keelung city 26 2.17% 391,189 1.74%
Taipei city 140 11.7% 2,639,094 11.77%Taipei county 207 17.29% 3,635,368 16.21%
Taoyuan county 86 7.18% 1,788,190 7.97%Hsinchu county 19 1.59% 451,492 2.01%
Hsinchu city 21 1.75% 377,777 1.68%Miaoli county 30 2.51% 560,586 2.50%
Taichung county 72 6.02% 1,509,751 6.73%Taichung city 63 5.26% 994,446 4.43%
Nantou county 26 2.17% 540,927 2.41%Changhwa county 64 5.35% 1,315,719 5.87%
Yunlin county 40 3.34% 742,873 3.31%Chiayi county 34 2.84% 562,353 2.51%
Chiayi city 13 1.09% 267,763 1.19%Tainan city 35 2.92% 744,255 3.32%
Tainan county 61 5.1% 1,107,236 4.94%Kaohsiung county 72 6.02% 1,231,989 5.49%
Kaohsiung city 74 6.18% 1,508,761 6.73%Pingtung county 50 4.18% 906,353 4.04%Taitung county 16 1.34% 243,855 1.09%Hualien county 18 1.5% 352,039 1.57%Penghu county 5 0.42% 92,496 0.41%
Source of data: Ministry of Interior “Population Density and Sex Ratio Statistics for Counties and Cities in the Taiwan Area, ” October 31, 2002, and rearranged in this study.
Proceedings of the Second Workshop on Knowledge Economy and Electronic Commerce

88
As to whether or not the sample used in this study accords with Taiwan’s overall population, can be verified by conducting the Chi-square test. It is found that
( )∑=
−=
K
i io
ioi
NPNPN
C1
2
=10.95124, while the Chi-square value is 9244.3322,05.02 =χ . Since
22,05.02χ<C , the null hypothesis can not be rejected, therefore the way in which the survey’s
sample is distributed among the cities and counties is not significantly different from the way in which Taiwan’s actual population is allocated.
Proceedings of the Second Workshop on Knowledge Economy and Electronic Commerce