network biology: a paradigm for modeling biological complex systems
TRANSCRIPT
Network BiologyA paradigm for modeling biological complex systems
Ganesh BaglerCenter for Computational Biology, IIIT-Delhi, New Delhi.

Center for Computational Biology

Modeling Living Systems
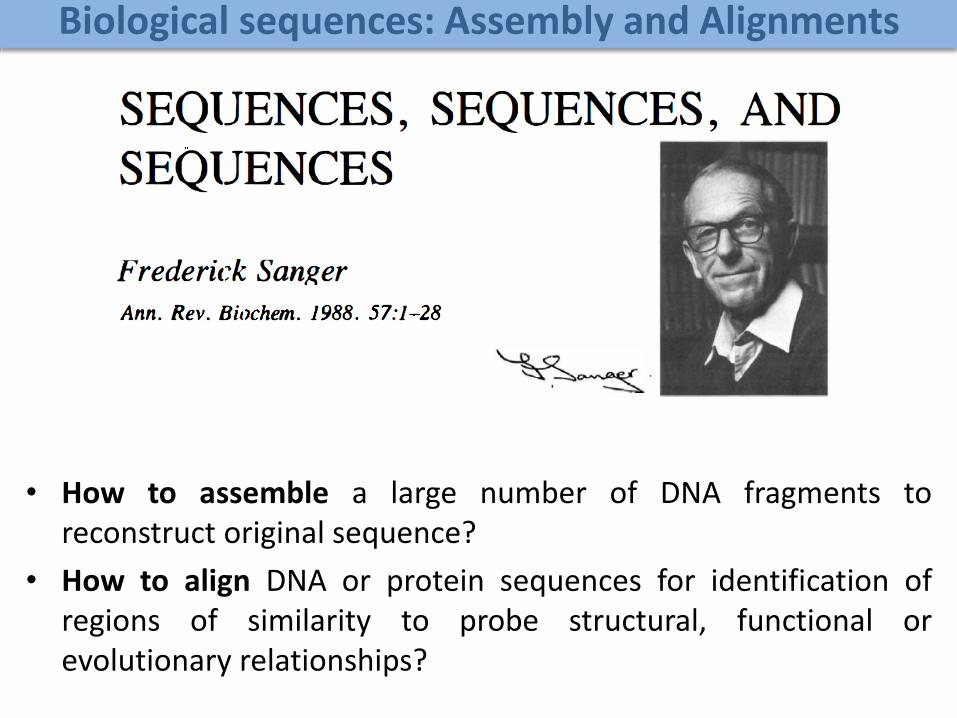
Biological sequences: Assembly and Alignments
• How to assemble a large number of DNA fragments toreconstruct original sequence?
• How to align DNA or protein sequences for identification ofregions of similarity to probe structural, functional orevolutionary relationships?

Protein: Structure, Function & Folding
• Proteins are polymer chains made of amino acids.
• The polypeptide folds into a functional three-dimensionalstructure.
• Starting from the sequence, prediction of protein structure isan open problem of practical importance.

MIT technology review

Can a biologist fix a radio?Need for integrative models of biological systems
Biological Complex SystemsModeling biological systems as networked entities
Networks in BiologyIntro to graph theory, key concepts, applications

Biological Complex Systems
A system comprising of large number of sophisticated functional elements,intricately connected with each other to perform specific tasks, which otherwise can not be executed by subsets of the system.
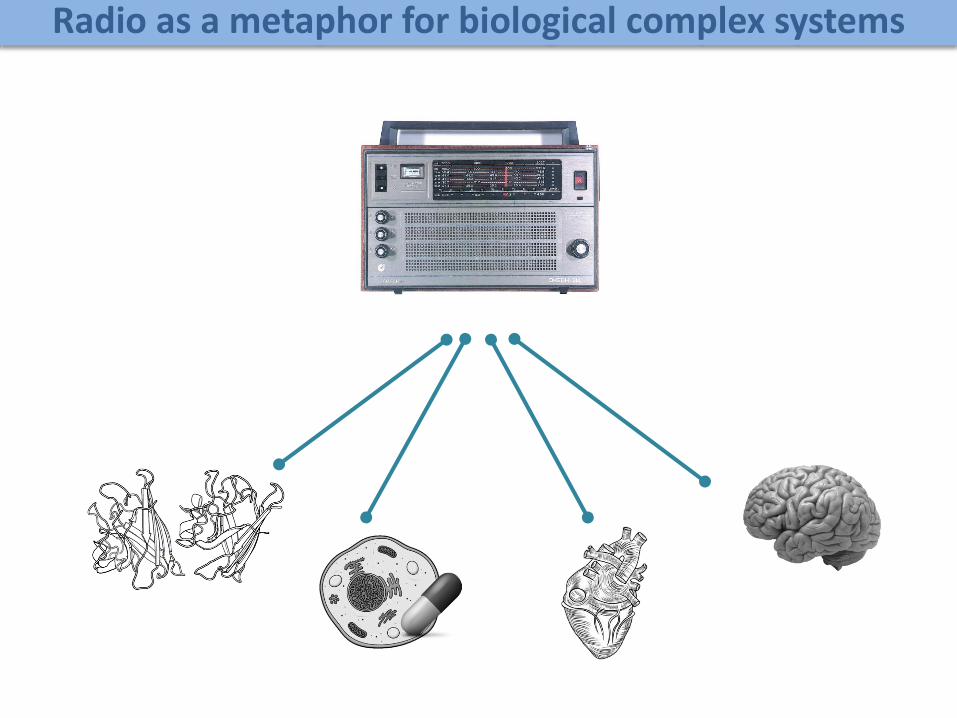
Radio as a metaphor for biological complex systems

Biologist finds a radio on an island

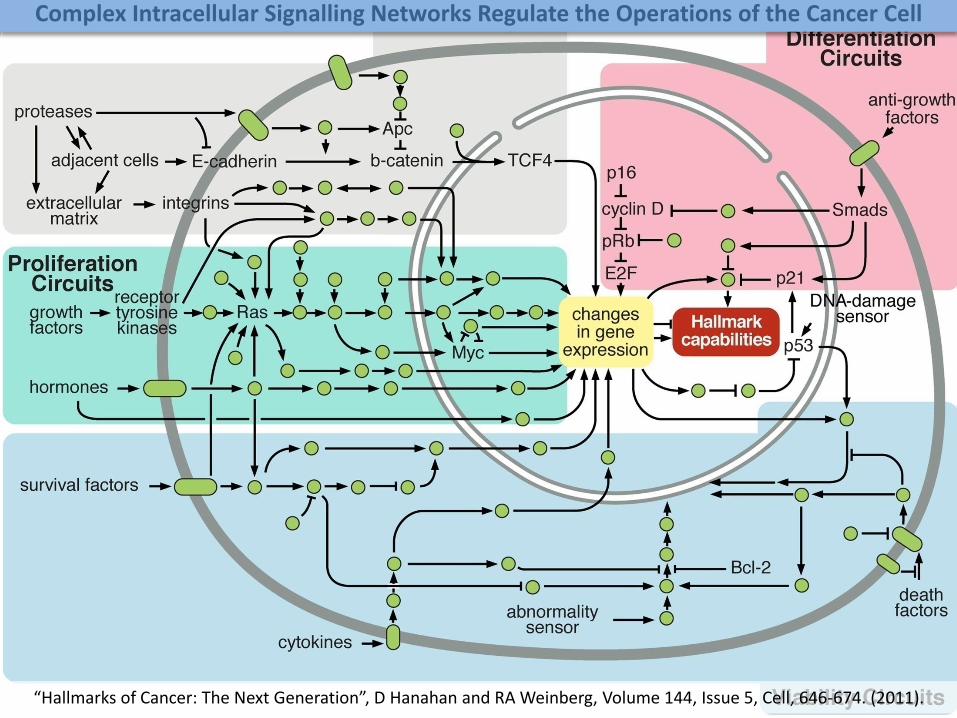
“Hallmarks of Cancer: The Next Generation”, D Hanahan and RA Weinberg, Volume 144, Issue 5, Cell, 646-674. (2011).
Complex Intracellular Signalling Networks Regulate the Operations of the Cancer Cell

*Lazebnik Y. A., Cancer CELL, Vol. 2, pp. 179-182 (2002).
Can a biologist fix a radio?*

Can a biologist fix a radio?Need for integrative models of biological systems
Biological Complex SystemsModeling biological systems as networked entities
Networks in BiologyIntro to graph theory, key concepts, applications

MIT technology review

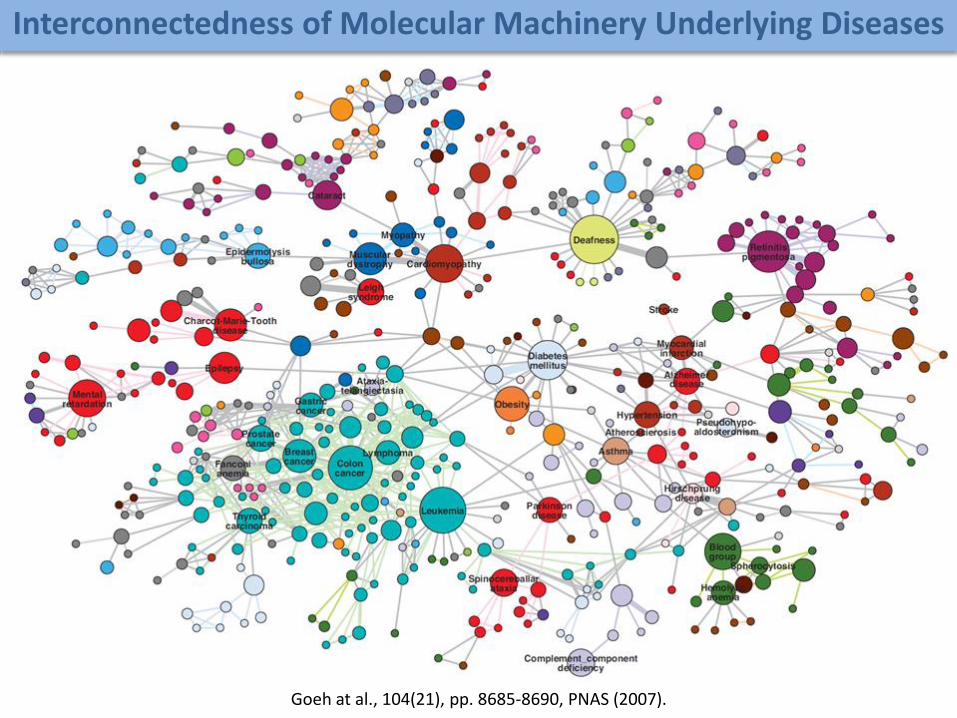
Goeh at al., 104(21), pp. 8685-8690, PNAS (2007).
Interconnectedness of Molecular Machinery Underlying Diseases

VISION
Somatosensation, Hearing, Language, Attention, and Spatial cognitionControl attention, Abstract thinking,
Behavior, Problem solving tasks and physical reactions and Personality
Auditory and visual memories, Language, Hearing (partly) and Speech.
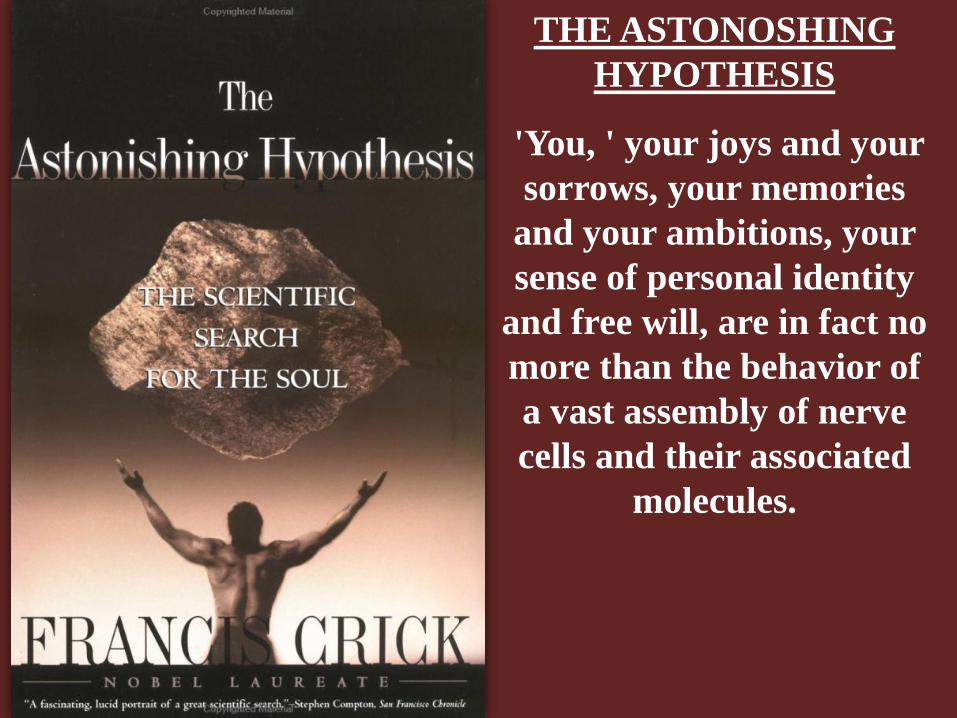
THE ASTONOSHING
HYPOTHESIS
'You, ' your joys and your
sorrows, your memories
and your ambitions, your
sense of personal identity
and free will, are in fact no
more than the behavior of
a vast assembly of nerve
cells and their associated
molecules.


Algorithms
Sequence alignment
Genome assembly
Gene identification
Machine LearningData analytics
Health informatics
Protein folding
Drug DiscoveryDocking simulationVirtual screening
Side effects predictionDrug Repurposing
Omics Data: genomics, proteomics, trascriptomics, metabolomics
Databases
Biomedical text mining
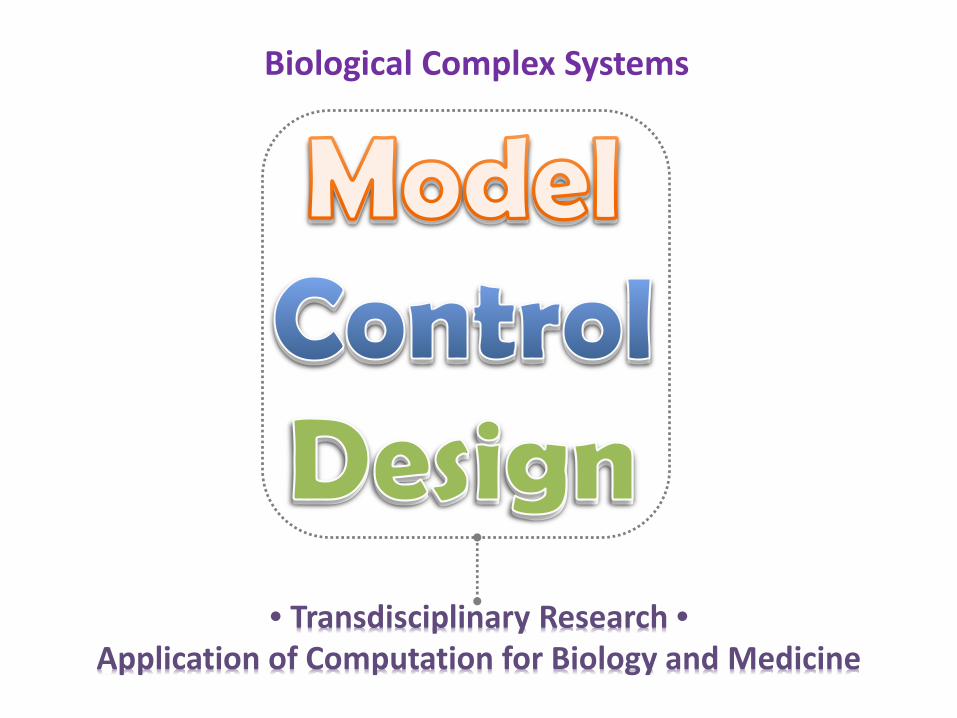
• Transdisciplinary Research •Application of Computation for Biology and Medicine
Biological Complex Systems

Residue Interaction Graph Models of Protein StructuresProteins: Structure, Function, Kinetics and Design
Bagler and Sinha, Bioinformatics (2007).Bagler* and Sinha, Physica A (2005).Bagler*, Nova, ISBN: 978-3-8433-5860-6.Lappe et al., Curr Opi Biotechnology (2009). Kumar et al., Scientific Reports (NPG) (2012).
Engineering a thermostable enzyme
• Small-world nature or protein structures • Discovery of assortative mixing and biological implication for rate of folding

“Engineering a thermo-stable superoxide dismutase functional at sub-zero to >50°C, which also tolerates autoclaving”, Arun Kumar et al.,Scientific Reports (Nature Publishing Group), 2 (387), 1-8 (2012).
Engineering a thermostable enzyme

Shikha Vashisht and Ganesh Bagler*, 7(11): e49401, PLoS ONE (2012). arXiv:1112.1510v2 [q-bio.MN]Vinay Randhawa and Ganesh Bagler*, OMICS: A Journal of Integrative Biology, 16 (10) , 2012.
V Randhawa, P Sharma, S Bhushan and G Bagler*, OMICS: A Journal of Integrative Biology, 17(6), 302-317 (2013).
A rational approach towards ‘complex diseases’.
Data: KEGG, OMIM, PubMed, protein interactomes, gene regulations, expression data.
Network Models of Complex DiseasesMolecular interactomes of diseases phenotypes: Modeling and control
Why
What
How
modelInteractomes,
Expression data
controltargets, drugs
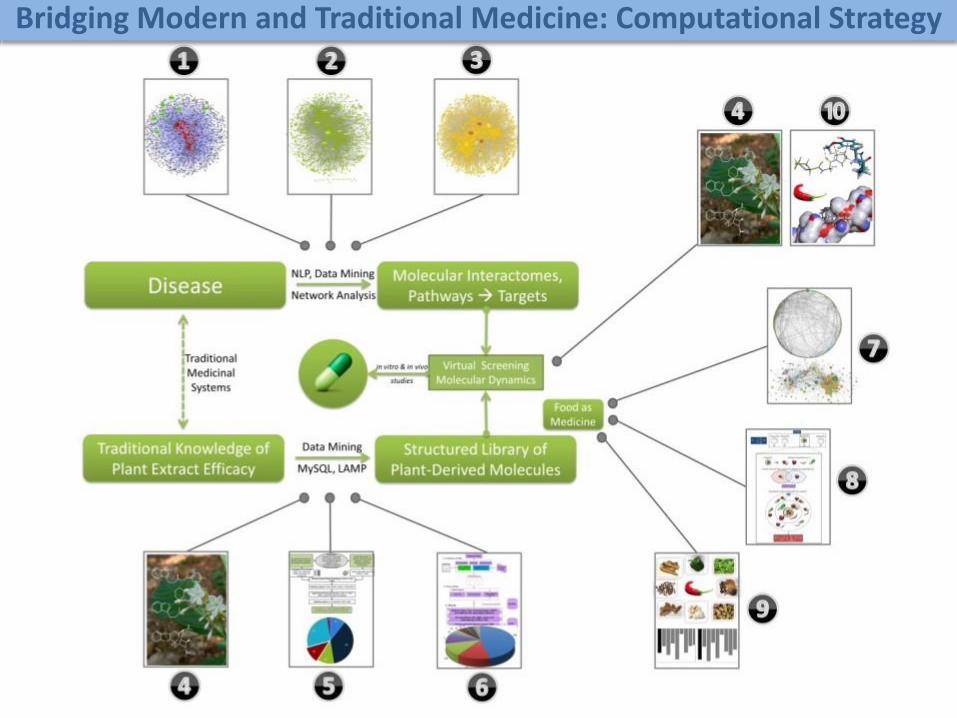
Bridging Modern and Traditional Medicine: Computational Strategy
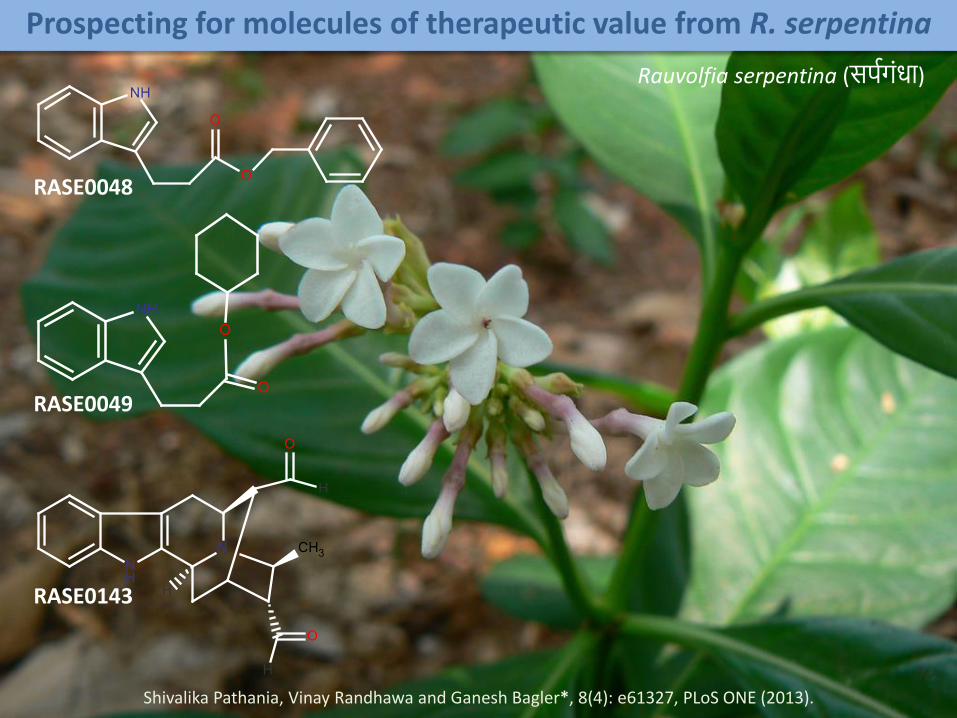
Prospecting for molecules of therapeutic value from R. serpentina
RASE0048
RASE0049
RASE0143
Rauvolfia serpentina (सर्पगंधा)
Shivalika Pathania, Vinay Randhawa and Ganesh Bagler*, 8(4): e61327, PLoS ONE (2013).
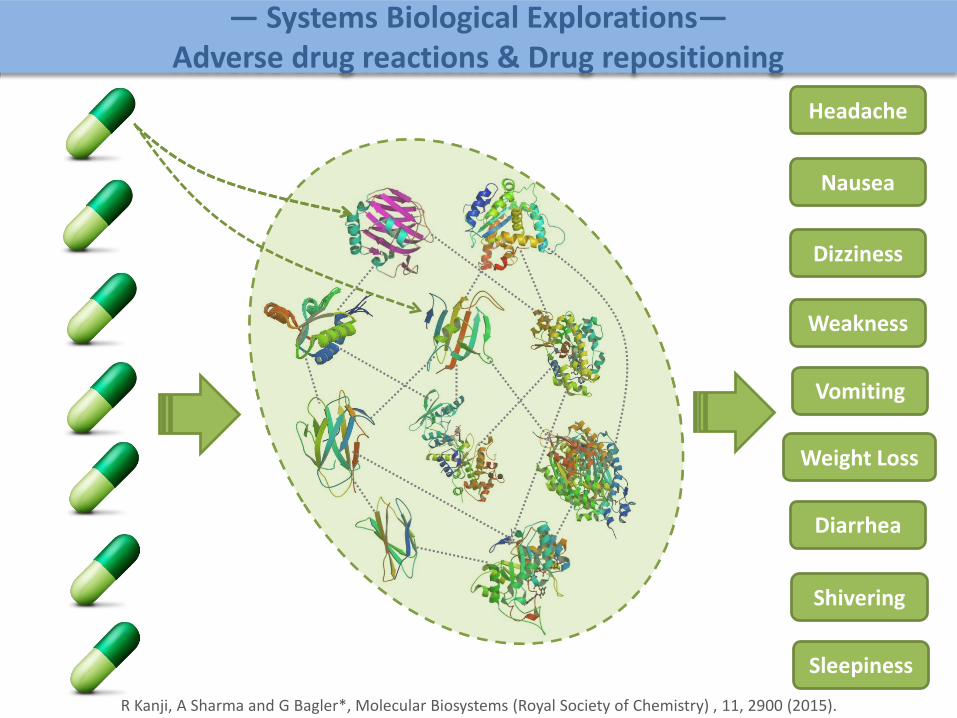
Headache
Nausea
Dizziness
Weakness
Vomiting
Weight Loss
Diarrhea
Shivering
Sleepiness
R Kanji, A Sharma and G Bagler*, Molecular Biosystems (Royal Society of Chemistry) , 11, 2900 (2015).
— Systems Biological Explorations—Adverse drug reactions & Drug repositioning

Knowledge Data
Applications
Methods, Tools
Hypothesis-Driven Questions Structured Databases

Can a biologist fix a radio?Need for integrative models of biological systems
Biological Complex SystemsModeling biological systems as networked entities
Networks in BiologyIntro to graph theory, key concepts, applications

Köningsberg, 1726

Köningsberg Problem: Origin of Graph Theory
Can one walk across the seven bridges and never cross the same one twice?
THEOREM:(A) If a graph has nodes of odd degrees, it has no path.(B) If a graph is connected and has no odd degree nodes, it has at
least one path.
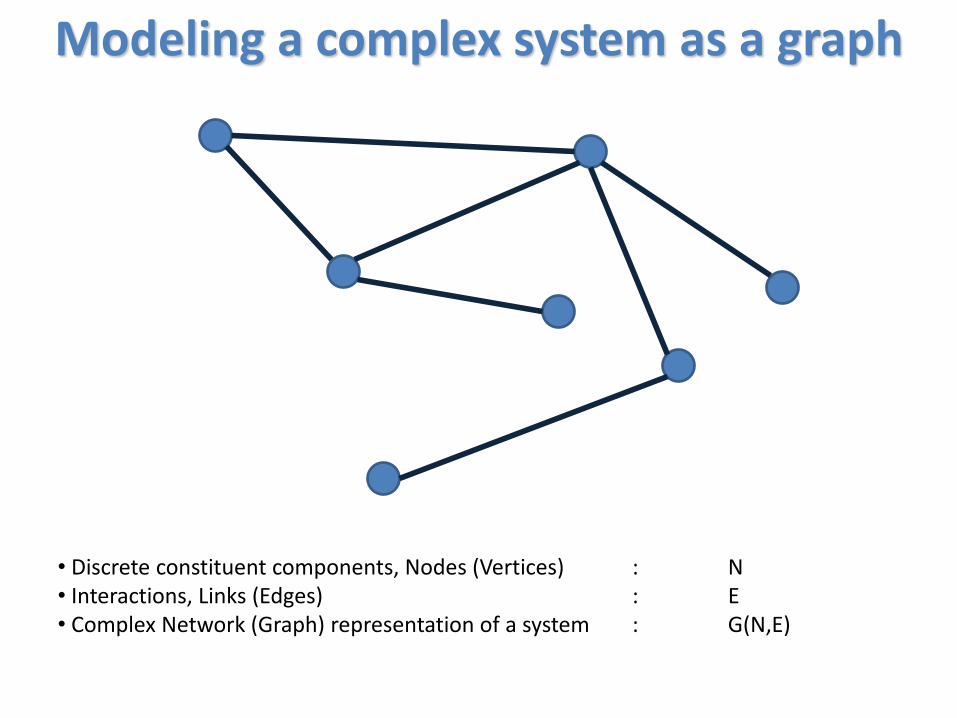
Modeling a complex system as a graph
• Discrete constituent components, Nodes (Vertices) : N• Interactions, Links (Edges) : E• Complex Network (Graph) representation of a system : G(N,E)

Altaf Vidya
Vijay
Arnab
friend
friendfriend
friend
Modeling a complex system as a graph
Protein 1 Protein 2
Protein 5
Protein 9
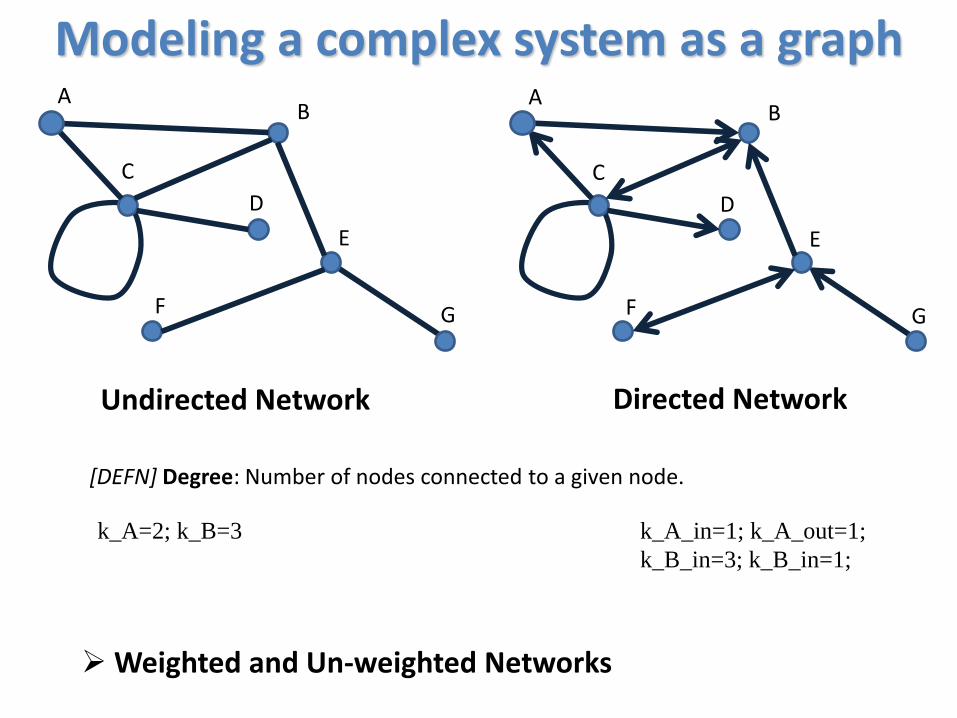
Modeling a complex system as a graph
Undirected Network Directed Network
[DEFN] Degree: Number of nodes connected to a given node.
AB
C
D
E
F G
AB
C
D
E
F G
k_A=2; k_B=3 k_A_in=1; k_A_out=1;
k_B_in=3; k_B_in=1;
Weighted and Un-weighted Networks
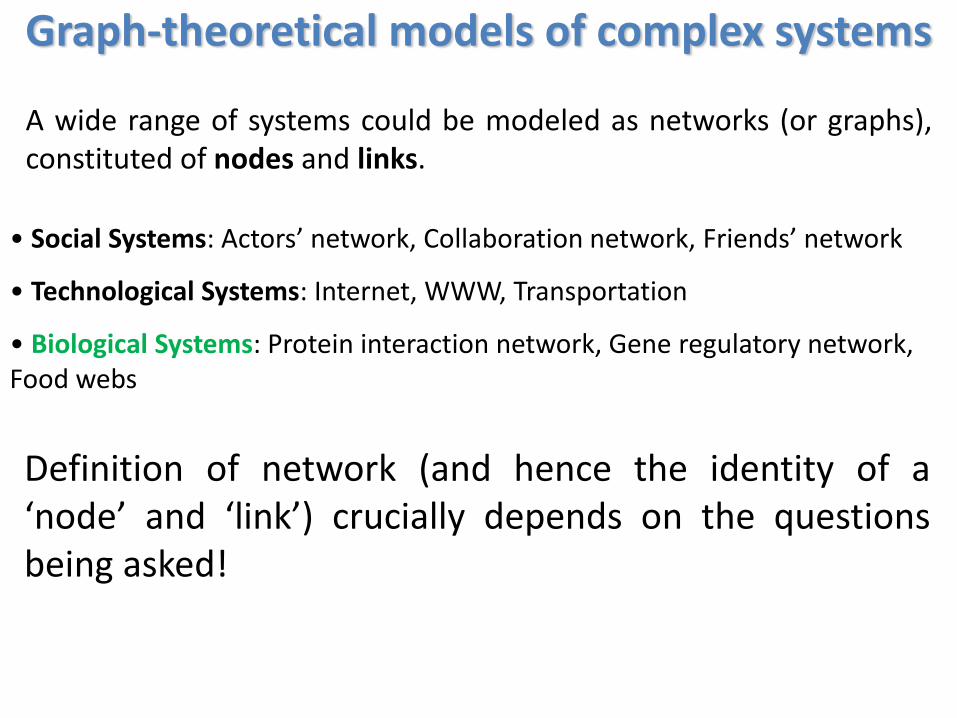
• Social Systems: Actors’ network, Collaboration network, Friends’ network
• Technological Systems: Internet, WWW, Transportation
• Biological Systems: Protein interaction network, Gene regulatory network, Food webs
A wide range of systems could be modeled as networks (or graphs),constituted of nodes and links.
Definition of network (and hence the identity of a‘node’ and ‘link’) crucially depends on the questionsbeing asked!
Graph-theoretical models of complex systems

Adjacency matrix and edge list are two of the important numerical (computational)representations of a graph/network.
Numerical Representation of a Graph
A B
CD
E
F
GA B C D E F G
A
B
C
D
E
F
G
node(i) node(j)
A B
A C
B C
B D
B F
C E
F G

S. cerevisiae protein–protein
interaction network
• Fads, Fashion, Spread of diseases (social networks)
• Information dissemination (SMS, emails), robustness of infrastructure (Internet, Power-Grid Networks, WWW, Airport Networks)
• Disaster assessment, Spread of diseases (Society, Health, Transportation Systems)
• Modeling and Control of systems (Protein interaction networks, Gene Regulatory Network, Metabolic Pathways Network, Neuronal Conectivity Network, Food webs)
Modelling at various levels of resolutions: Coarse-grained understanding vs. detailed modeling
Why study systems with network models?

• How many elements? How many interactions? (n,e)
• Directed/ undirected, weighted/ unweighted?
• What kind of connectivity? What kind of connectivitydistribution?
• Is there any special importance to a node or a group of nodesor a link?
• Is it important for the network to be together? Good(information dissemination) and bad (disease spread).
• How are the degree-degree correlations?
• Are there special motifs for performing specific functions?
• How to identify structural and functional modules?
What questions to ask?

Small World Networks

Small-World Networks
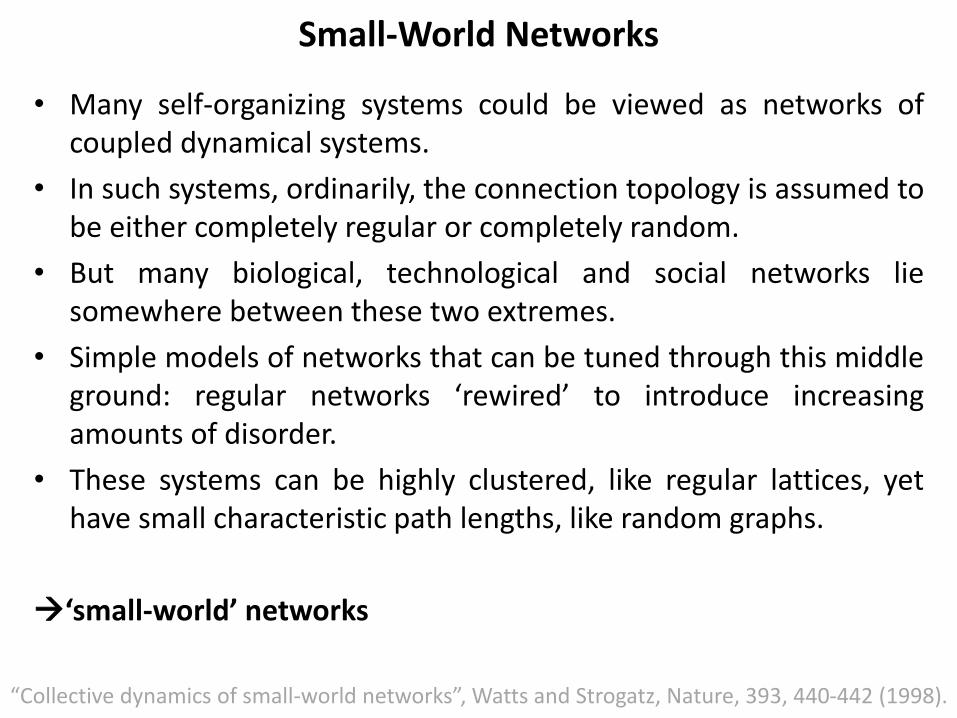
• Many self-organizing systems could be viewed as networks ofcoupled dynamical systems.
• In such systems, ordinarily, the connection topology is assumed tobe either completely regular or completely random.
• But many biological, technological and social networks liesomewhere between these two extremes.
• Simple models of networks that can be tuned through this middleground: regular networks ‘rewired’ to introduce increasingamounts of disorder.
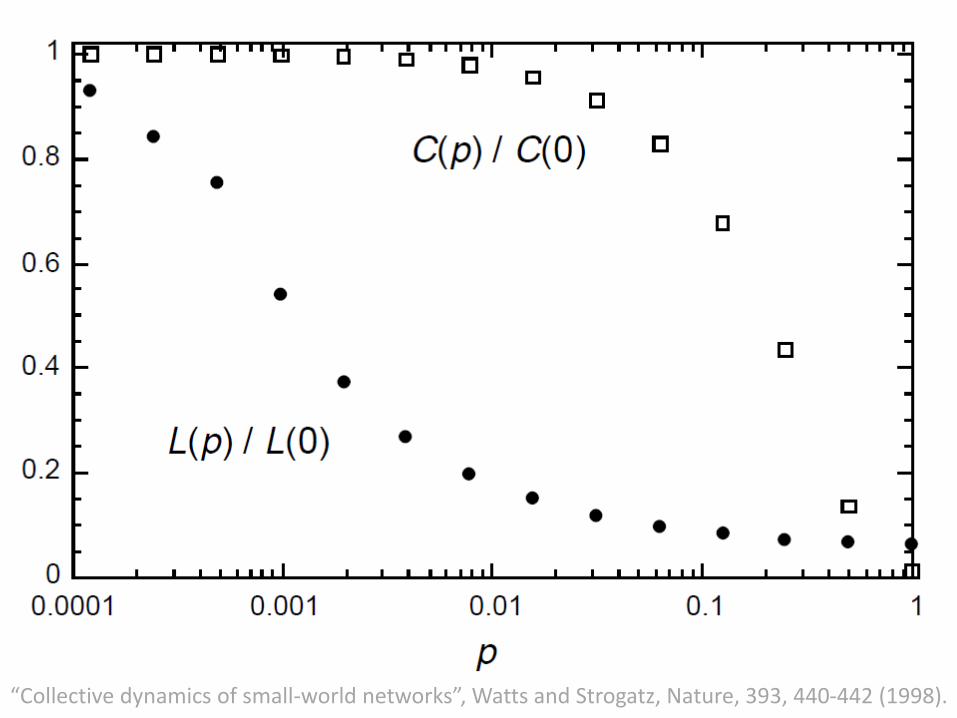
• These systems can be highly clustered, like regular lattices, yethave small characteristic path lengths, like random graphs.
‘small-world’ networks
“Collective dynamics of small-world networks”, Watts and Strogatz, Nature, 393, 440-442 (1998).
Small -World Networks
“Collective dynamics of small-world networks”, Watts and Strogatz, Nature, 393, 440-442 (1998).
Procedure used by Watts and Strogatz (Nature, 1998)
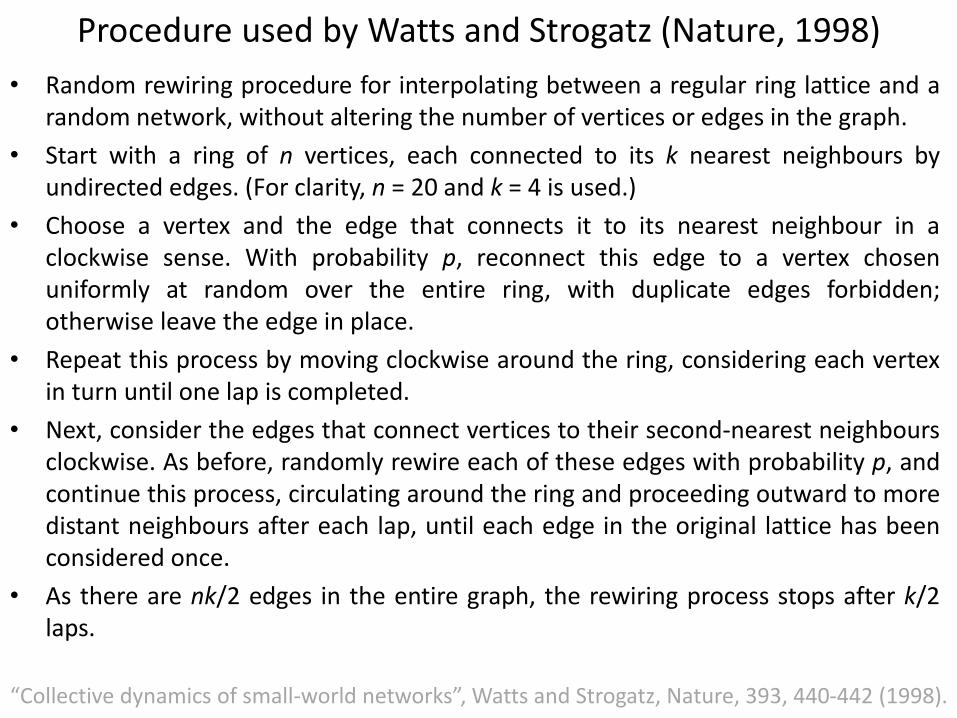
• Random rewiring procedure for interpolating between a regular ring lattice and arandom network, without altering the number of vertices or edges in the graph.
• Start with a ring of n vertices, each connected to its k nearest neighbours byundirected edges. (For clarity, n = 20 and k = 4 is used.)
• Choose a vertex and the edge that connects it to its nearest neighbour in aclockwise sense. With probability p, reconnect this edge to a vertex chosenuniformly at random over the entire ring, with duplicate edges forbidden;otherwise leave the edge in place.
• Repeat this process by moving clockwise around the ring, considering each vertexin turn until one lap is completed.
• Next, consider the edges that connect vertices to their second-nearest neighboursclockwise. As before, randomly rewire each of these edges with probability p, andcontinue this process, circulating around the ring and proceeding outward to moredistant neighbours after each lap, until each edge in the original lattice has beenconsidered once.
• As there are nk/2 edges in the entire graph, the rewiring process stops after k/2laps.
“Collective dynamics of small-world networks”, Watts and Strogatz, Nature, 393, 440-442 (1998).
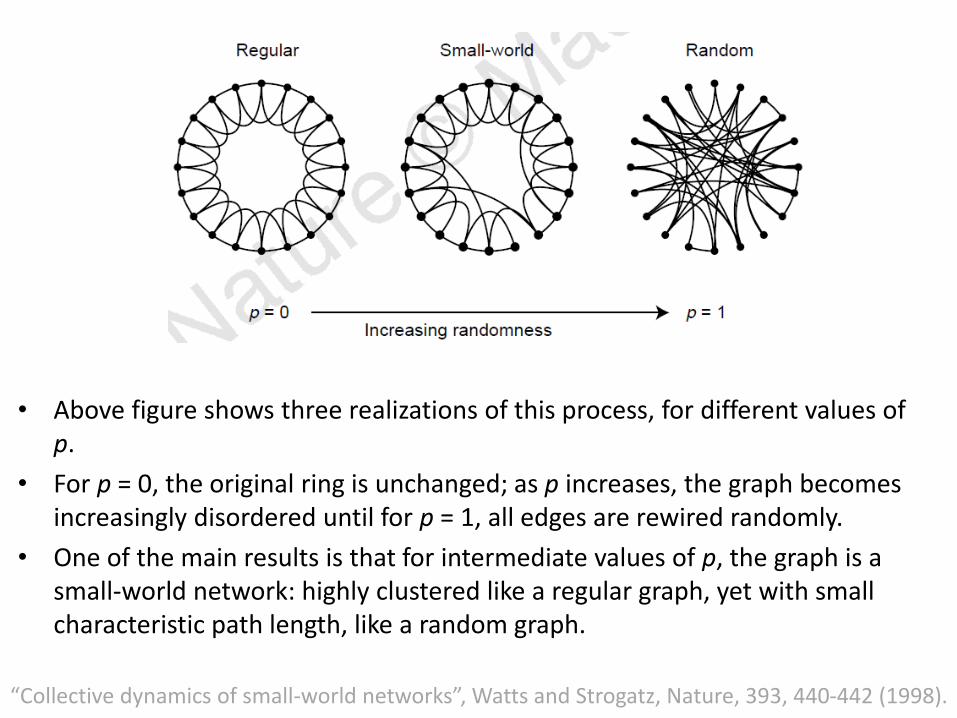
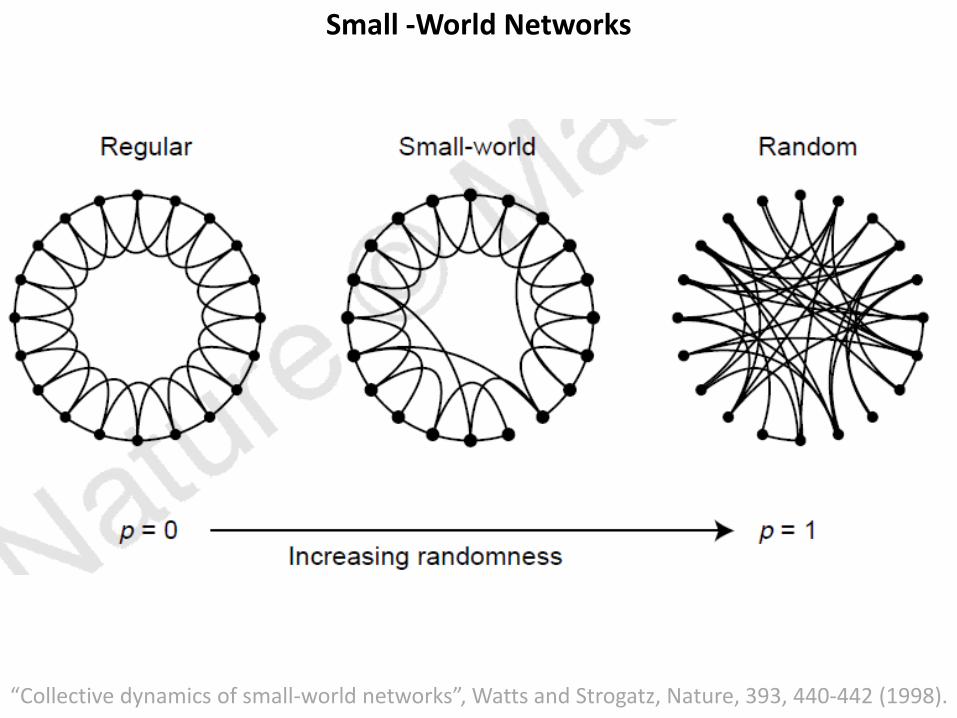
• Above figure shows three realizations of this process, for different values of p.
• For p = 0, the original ring is unchanged; as p increases, the graph becomes increasingly disordered until for p = 1, all edges are rewired randomly.
• One of the main results is that for intermediate values of p, the graph is a small-world network: highly clustered like a regular graph, yet with small characteristic path length, like a random graph.
“Collective dynamics of small-world networks”, Watts and Strogatz, Nature, 393, 440-442 (1998).
“Collective dynamics of small-world networks”, Watts and Strogatz, Nature, 393, 440-442 (1998).
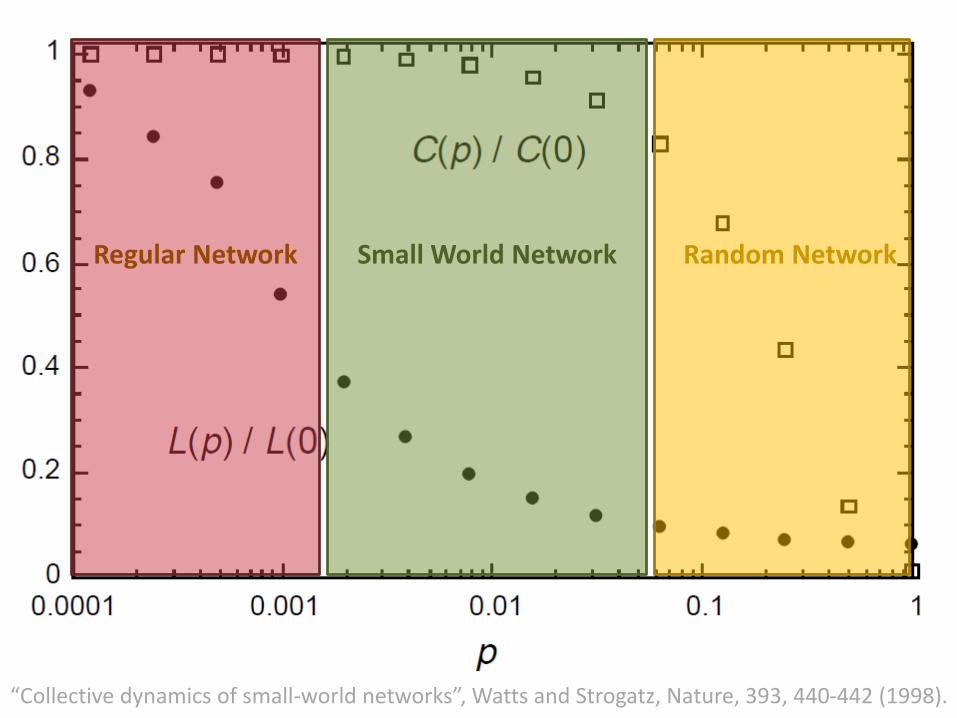
Regular Network Small World Network Random Network
“Collective dynamics of small-world networks”, Watts and Strogatz, Nature, 393, 440-442 (1998).
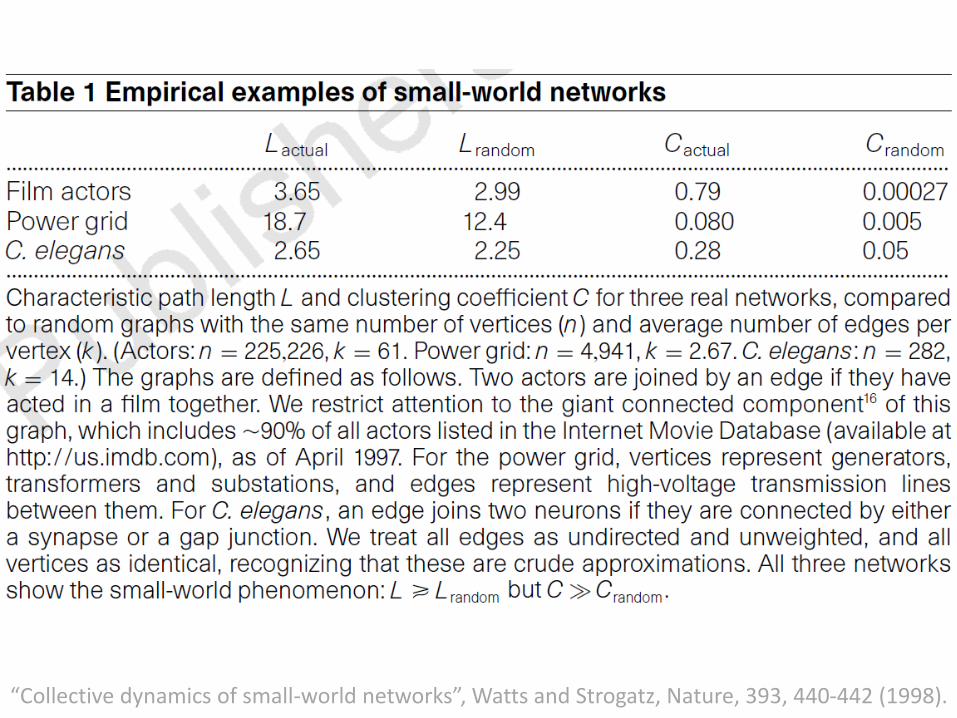
• The neural network of the wormCaenorhabditis elegans
• The power grid of the western United States
• The collaboration graph of film actors
“Collective dynamics of small-world networks”, Watts and Strogatz, Nature, 393, 440-442 (1998).
“Collective dynamics of small-world networks”, Watts and Strogatz, Nature, 393, 440-442 (1998).

Scale-Free Networks

Degree Distributions• Degree distributions dictate the topological and dynamical
properties of the network.
• Scale-free networks- Heterogeneous degree distributions- Importance of ‘hubs’- Hubs as control elements- Structural integrity vs. dynamic integrity
• Scale-free distributions and averages“Don’t cross the river if it on an average only 5 feet deep.”
• Mediocristan vs. Extremistan (NN Taleb)- How to become fat by eating heavily on one day?- How to get rich in one day?
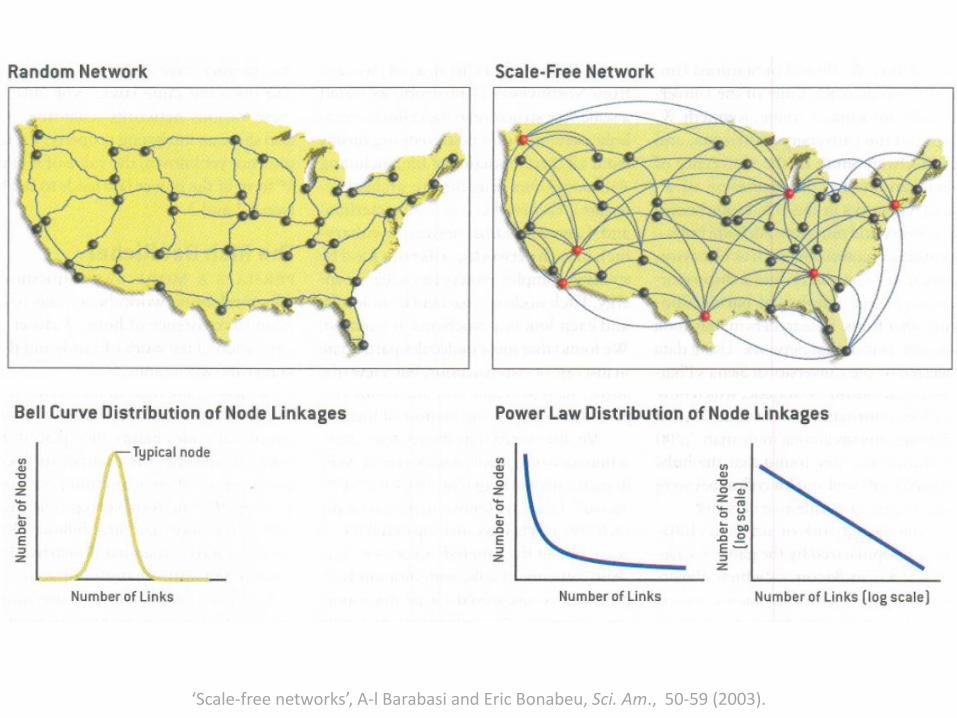
‘Scale-free networks’, A-l Barabasi and Eric Bonabeu, Sci. Am., 50-59 (2003).

‘Scale-free networks’, A-l Barabasi and Eric Bonabeu, Sci. Am., 50-59 (2003).
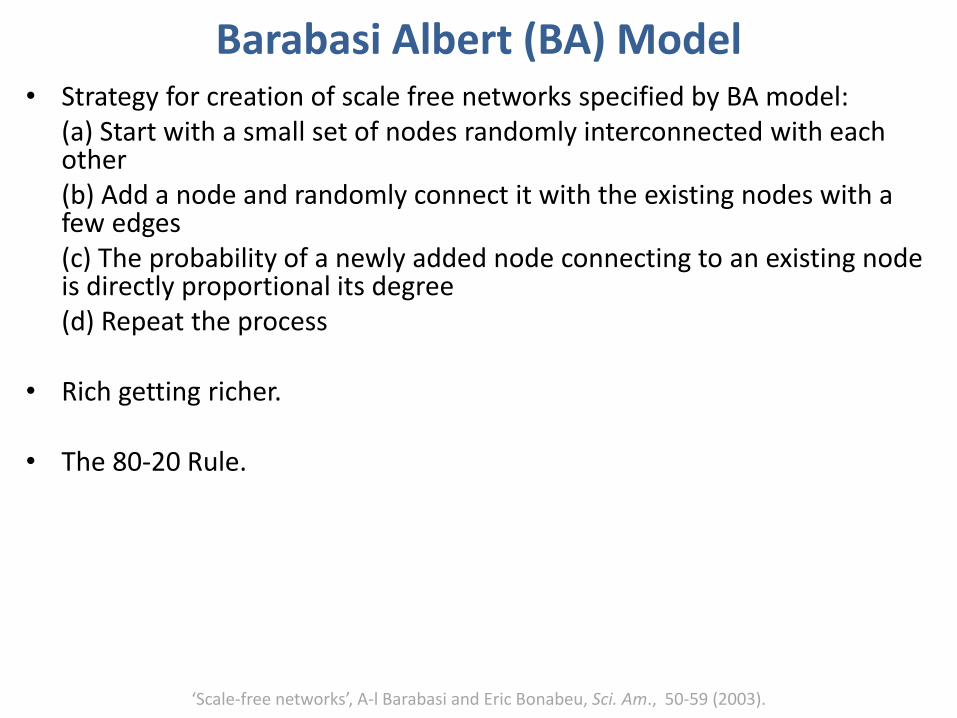
Barabasi Albert (BA) Model• Strategy for creation of scale free networks specified by BA model:
(a) Start with a small set of nodes randomly interconnected with each other(b) Add a node and randomly connect it with the existing nodes with a few edges(c) The probability of a newly added node connecting to an existing node is directly proportional its degree(d) Repeat the process
• Rich getting richer.
• The 80-20 Rule.
‘Scale-free networks’, A-l Barabasi and Eric Bonabeu, Sci. Am., 50-59 (2003).

Barabasi Albert (BA) Model
‘Scale-free networks’, A-l Barabasi and Eric Bonabeu, Sci. Am., 50-59 (2003).

Network Topology has functional basis.


Random Network Scale free network
Response of Random and Scale free networks to: - Random errors &- Targeted attacks.
Albert et al, “Error and attack tolerance of complex networks”, 406, Nature, 378-382 (2000).

Albert et al, “Error and attack tolerance of complex networks”, 406, Nature, 378-382 (2000).
Network fragmentation under random failures and attacks. The relative size of the largestcluster S (open symbols) and the average size of the isolated clusters <s> (filled symbols) as afunction of the fraction of removed nodes f for the same systems.

The cluster size distribution for various values of f when a scale-free network is subjected to random failures (a–c) or attacks (d–f).
Summary of the response of a network to failures or attacks.

‘Lethality and centrality in protein networks’, H Jeong, Sp Meson and A-LBarabasi, Nature 411, 41-42 (2001).
1870 proteins interacting with the
help of 2240 physical interactions
Red, lethal; Green, nonlethal;Orange, slow growth; Yellow, unknown.
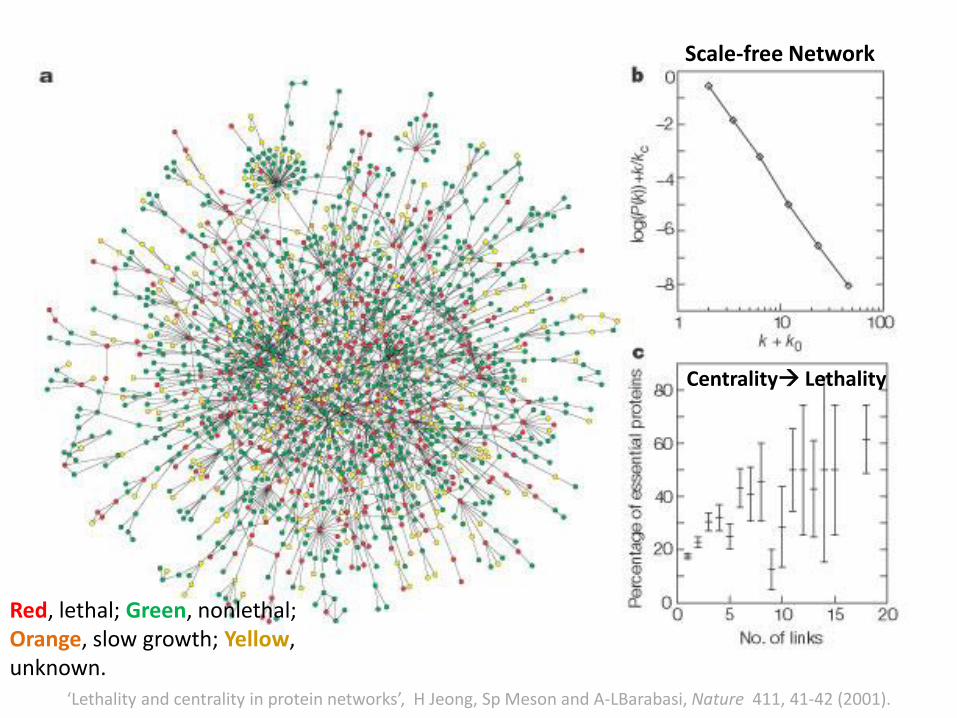
‘Lethality and centrality in protein networks’, H Jeong, Sp Meson and A-LBarabasi, Nature 411, 41-42 (2001).
Scale-free Network
Centrality Lethality
Red, lethal; Green, nonlethal;Orange, slow growth; Yellow, unknown.
• Scale-free networks are robust to random errors, but are vulnerable to targeted attacks.
• The response of exponential (random) networks for random errors and targeted attacks is indistinguishable.
• The hub proteins in the yeast protein interaction network tend to be most critical.

Network Motifs
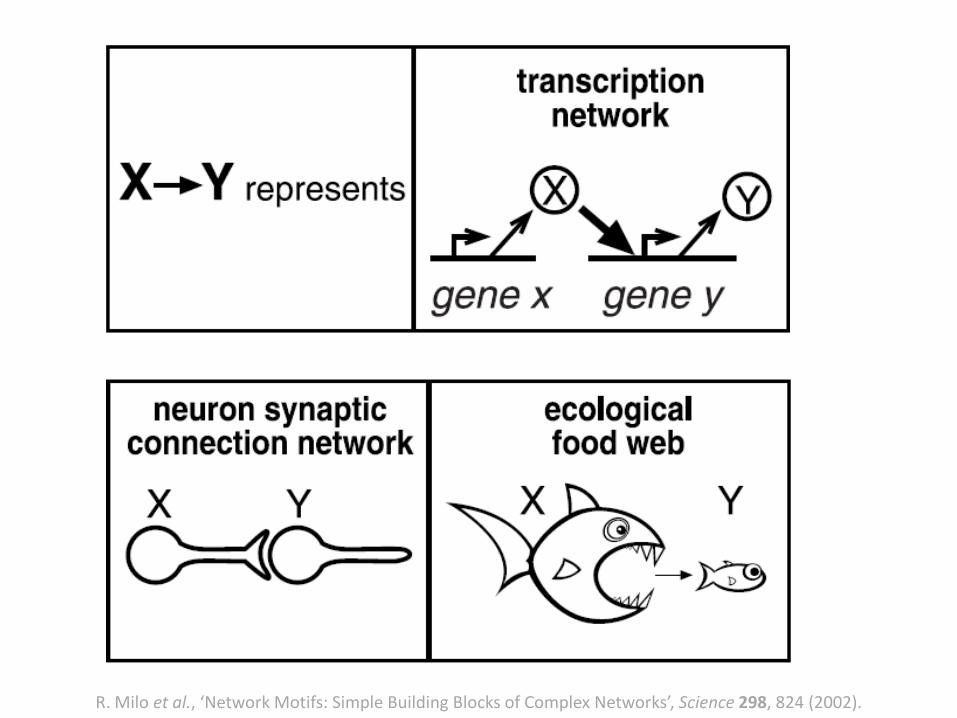
R. Milo et al., ‘Network Motifs: Simple Building Blocks of Complex Networks’, Science 298, 824 (2002).

13 types of three-node connected subgraphs.
R. Milo et al., ‘Network Motifs: Simple Building Blocks of Complex Networks’, Science 298, 824 (2002).

Network Motif Detection
R. Milo et al., ‘Network Motifs: Simple Building Blocks of Complex Networks’, Science 298, 824 (2002).

• The “network motifs” are those patterns forwhich the probability P of appearing in arandomized network an equal or greaternumber of times than in the real network islower than a cutoff value (P = 0.01).
• Patterns that are functionally important but not statistically significant could exist, which would be missed by this approach.
• Qualitative measure of statistical significance:
𝑍𝑠𝑐𝑜𝑟𝑒 =𝑁𝑟𝑒𝑎𝑙−𝑁𝑟𝑎𝑛𝑑
𝑆𝐷
Network Motif Detection
R. Milo et al., ‘Network Motifs: Simple Building Blocks of Complex Networks’, Science 298, 824 (2002).

• Transcription networks are biochemical networks responsible for regulating the expression of genes in cells.
• Directed graphs. Nodes genes. • Edges are directed from a gene that encodes for a transcription
factor protein to a gene transcriptionally regulated by that transcription factor.
• An eukaryote (the yeast, Saccharomyces cerevisiae) and a bacterium (Escherichia coli).
Network Motifs: Transcriptional Networks
R. Milo et al., ‘Network Motifs: Simple Building Blocks of Complex Networks’, Science 298, 824 (2002).
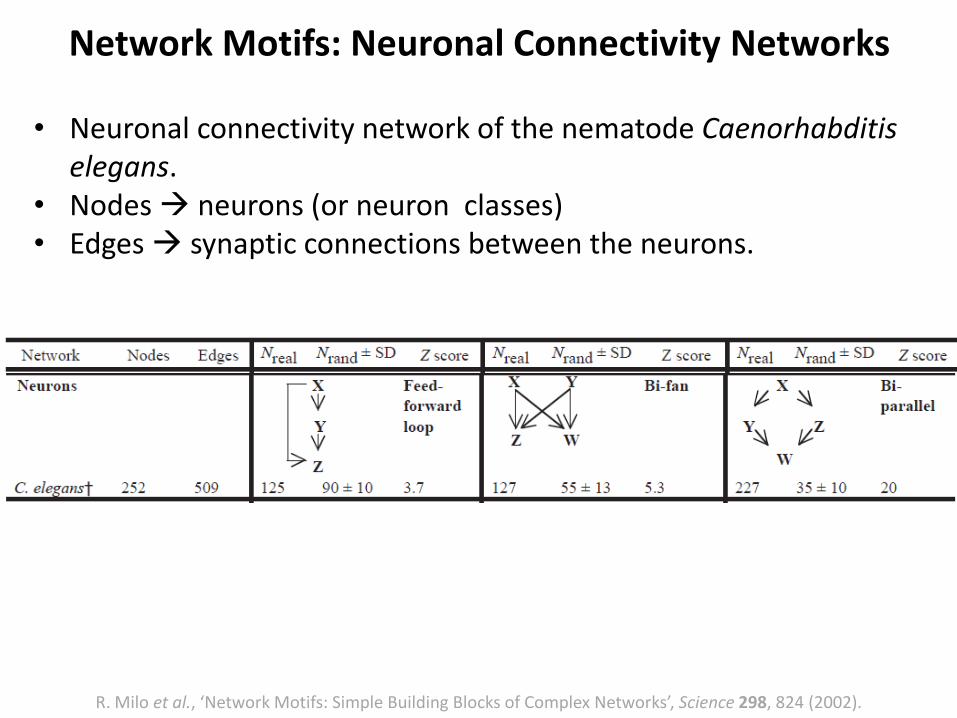
• Neuronal connectivity network of the nematode Caenorhabditiselegans.
• Nodes neurons (or neuron classes)• Edges synaptic connections between the neurons.
Network Motifs: Neuronal Connectivity Networks
R. Milo et al., ‘Network Motifs: Simple Building Blocks of Complex Networks’, Science 298, 824 (2002).

• These results suggests that motifs can define broad classes of networks, each with specific types of elementary structures.
• The motifs reflect the underlying processes that generatedeach type of network.
• For example, food webs evolve to allow a flow of energy from thebottom to the top of food chains, whereas gene regulation and neuron networks evolve to process information.
• Information processing seems to give rise to significantly different structures than does energy flow.
Why specific network motifs?
R. Milo et al., ‘Network Motifs: Simple Building Blocks of Complex Networks’, Science 298, 824 (2002).


Applications of network modeling in biomedicine
Ganesh BaglerCenter for Computational Biology, IIIT-Delhi, New Delhi.

Identification of Generic Cancer Genes: Cancer Genes Network (CGN)
Shikha Vashisht and Ganesh Bagler*, 7(11): e49401, PLoS ONE (2012). arXiv:1112.1510v2 [q-bio.MN]
• A protein interactome of interactions among cancer genes: Cancer Genes Network (CGN).
• Databases: CancerGenes Database, Human Protein Reference Database, KEGG-PIC.
• Central genes were identified using ‘degree’, ‘betweenness’ and ‘stress’ metrics.
11602 interactions among 2665
cancer proteins

Cancer Genes Network : Generic and Specific Cancer Genes
Shikha Vashisht and Ganesh Bagler*, 7(11): e49401, PLoS ONE (2012). arXiv:1112.1510v2 [q-bio.MN]
11602 interactions among 2665
cancer proteins
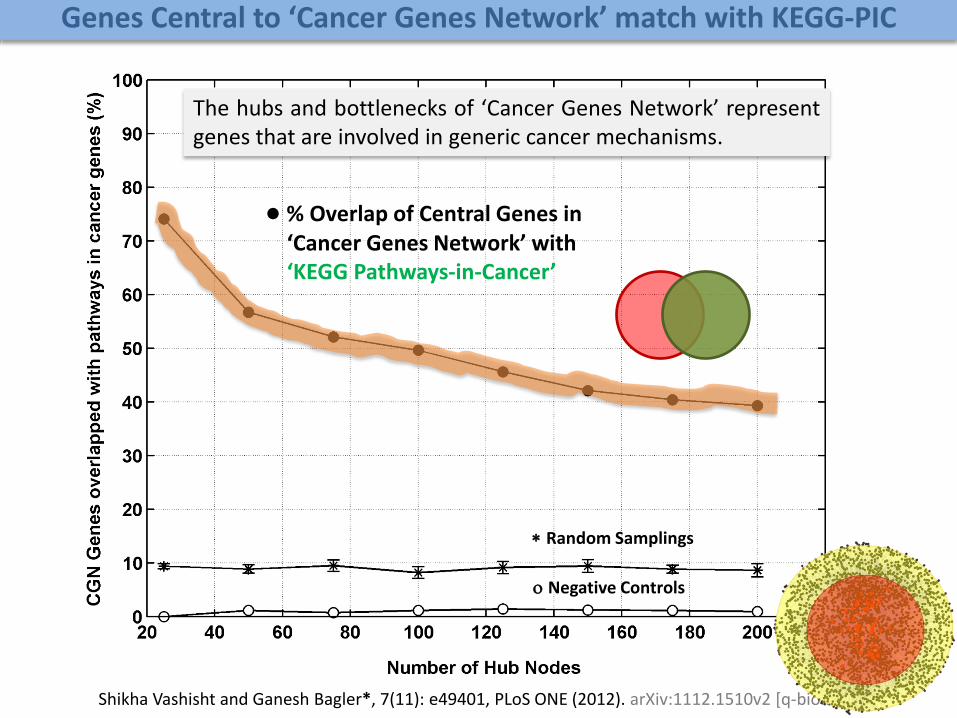
● % Overlap of Central Genes in ‘Cancer Genes Network’ with ‘KEGG Pathways-in-Cancer’
Random Samplings
Negative Controls
The hubs and bottlenecks of ‘Cancer Genes Network’ representgenes that are involved in generic cancer mechanisms.
Genes Central to ‘Cancer Genes Network’ match with KEGG-PIC
Shikha Vashisht and Ganesh Bagler*, 7(11): e49401, PLoS ONE (2012). arXiv:1112.1510v2 [q-bio.MN]

Hub Genes Random Samplings
1,2,3: Degree, Betweenness, Stress4,5: Neighborhood connectivity, Topological coefficient6,7 (data not shown): Clustering coeff., Average shortest path length
Around 50% of a total 2665 cancer genes of CGN, were ‘essential (1315)’.Mouse Genome Informatics (MGI) Phenotype Data.
Hubs of Cancer Genes Network (CGN) are ‘Biologically Essential’
Shikha Vashisht and Ganesh Bagler*, 7(11): e49401, PLoS ONE (2012). arXiv:1112.1510v2 [q-bio.MN]

Strategy for Identification of Targets Specific to Secondary Bone Cancer
Shikha Vashisht and Ganesh Bagler*, 7(11): e49401, PLoS ONE (2012). arXiv:1112.1510v2 [q-bio.MN]

(A) (B)
(C)Subsets comprising targets specific to ‘Secondary Bone Cancer’
Identification of Targets Specific to Secondary Bone Cancer
Shikha Vashisht and Ganesh Bagler*, 7(11): e49401, PLoS ONE (2012). arXiv:1112.1510v2 [q-bio.MN]
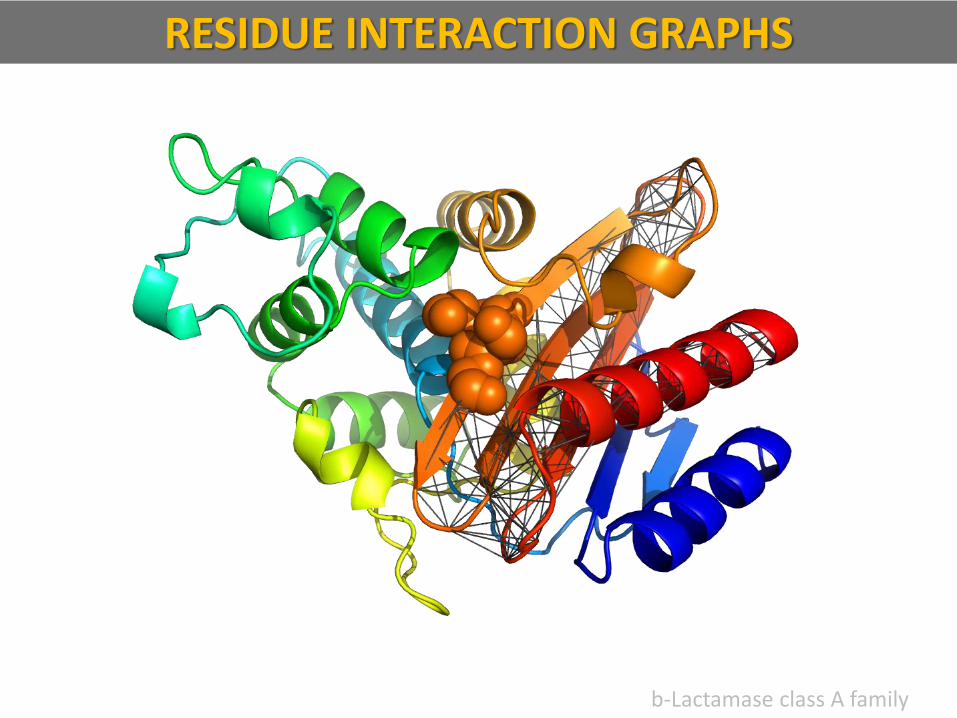
b-Lactamase class A family
RESIDUE INTERACTION GRAPHS
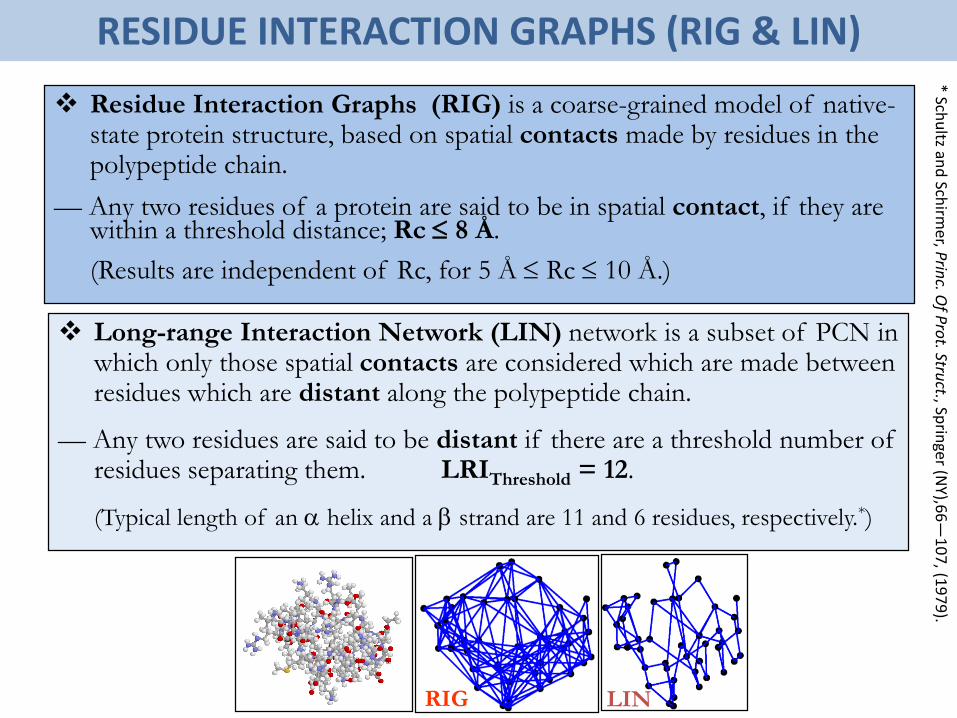
Long-range Interaction Network (LIN) network is a subset of PCN in which only those spatial contacts are considered which are made between residues which are distant along the polypeptide chain.
— Any two residues are said to be distant if there are a threshold number of residues separating them. LRIThreshold = 12.
(Typical length of an helix and a strand are 11 and 6 residues, respectively.*)
* Schu
ltz and
Schirm
er, Prin
c. Of P
rot. Stru
ct., Sprin
ger (NY),6
6—
10
7, (1
97
9).
Residue Interaction Graphs (RIG) is a coarse-grained model of native-state protein structure, based on spatial contacts made by residues in the polypeptide chain.
— Any two residues of a protein are said to be in spatial contact, if they are within a threshold distance; Rc 8 Å.
(Results are independent of Rc, for 5 Å Rc 10 Å.)
RESIDUE INTERACTION GRAPHS (RIG & LIN)
RIG LIN

BUILDING RESIDUE INTERACTION GRAPH MODELS
Residue Interaction Graphs (RIG)
-10-5
05
1015 -20
-100
1020-8
-6
-4
-2
0
2
4
6
8
-10-5
05
1015 -20
-100
1020-8
-6
-4
-2
0
2
4
6
8
NC
-10-5
05
1015 -20
-100
1020-8
-6
-4
-2
0
2
4
6
8
-10-5
05
1015 -20
-100
1020-8
-6
-4
-2
0
2
4
6
8
-10-5
05
1015 -20
-100
1020-8
-6
-4
-2
0
2
4
6
8
-10-5
05
1015 -20
-100
1020-8
-6
-4
-2
0
2
4
6
8
-10-5
05
1015 -20
-100
1020-8
-6
-4
-2
0
2
4
6
8
Illu
stra
tion o
f P
rote
in C
onta
ct N
etw
ork
(P
CN
) fo
r
a sm
all
pro
tein
, Acy
ltra
nsf
eras
e.

-10-5
05
1015 -20
-100
1020-8
-6
-4
-2
0
2
4
6
8
-10-5
05
1015 -20
-100
1020-8
-6
-4
-2
0
2
4
6
8
Long-range Interaction Network (LIN)
Long
-ran
ge
inte
ract
ions/
conta
cts
in A
cylt
ran
sfer
ase.
BUILDING RESIDUE INTERACTION GRAPH MODELS
-10-5
05
1015 -20
-100
1020-8
-6
-4
-2
0
2
4
6
8
1 2
3
43N C
1,2,3, ….. , 43
123 ...
43
-10-5
05
1015 -20
-100
1020-8
-6
-4
-2
0
2
4
6
8
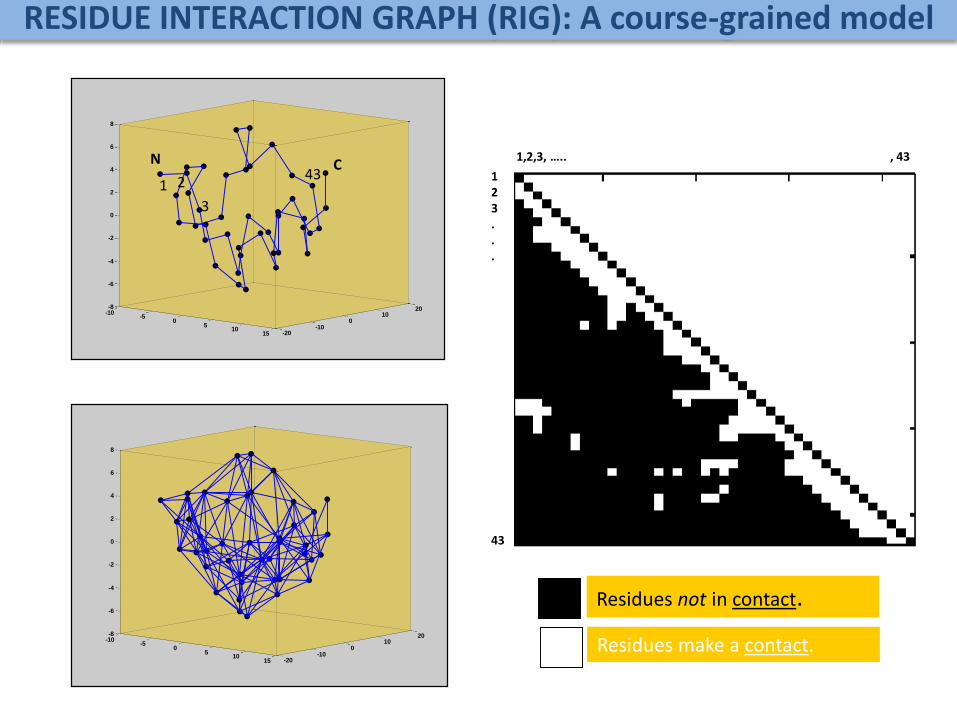
Residues not in contact.
Residues make a contact.
RESIDUE INTERACTION GRAPH (RIG): A course-grained model
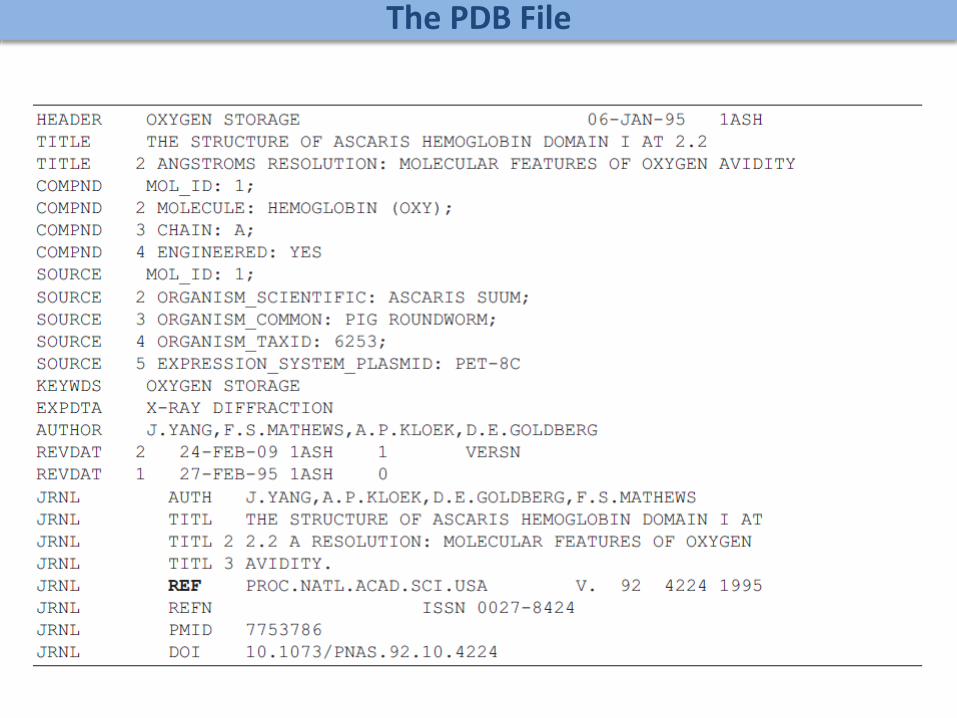
The PDB File

The PDB File

Noncovalent interactions in RIG model
Node: Amino acidLink: Noncovalent interactions
Noncovalent interactions gathered via spatial proximity capture electrostatic, hydrophobic, van der Waals forces, ionic interactions, hydrogen bonds etc.
• Non-covalent interactions are very weak in comparison with covalent bonds.
• They decay very quickly with the distance separating the interacting atoms. For instance, the energy of charge–charge interactions decays with 1 𝑟 , where 𝑟 is the distance separating the interacting species.
• However, dispersion and van der Waals forces decay with 1 𝑟6 and 1 𝑟12,
respectively. • Therefore, although the distance at which a pair of residues in a protein
interact changes according to the type of interaction taken into account, it is almost certain that such interactions do not exist for residues separated
at distances larger than 10 Å.

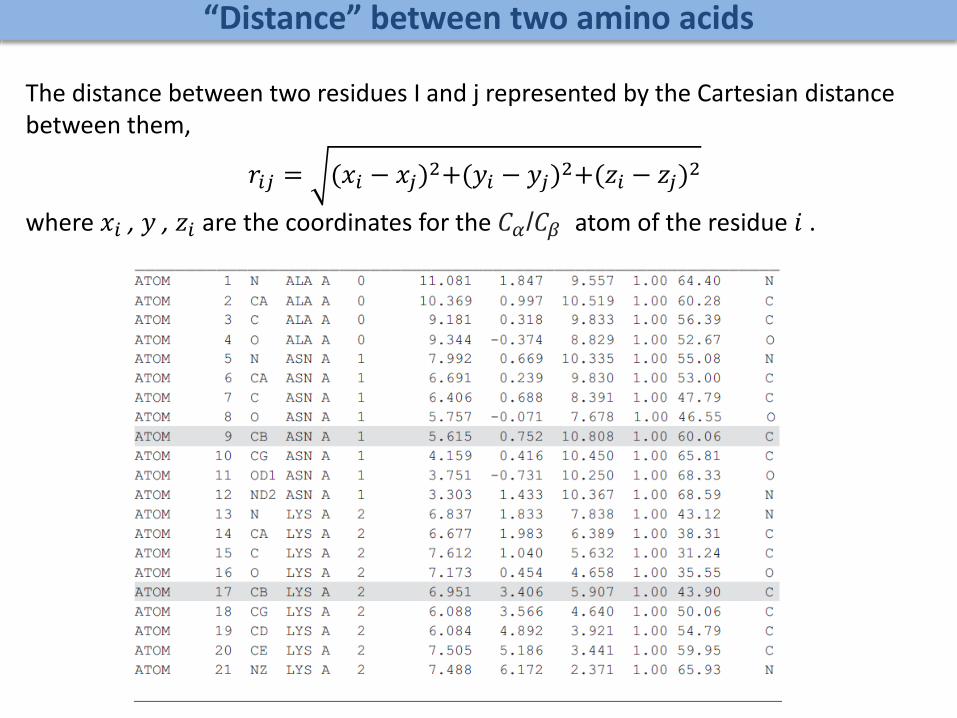
“Distance” between two amino acids
An amino acid (residue) is formed by several atoms, and we can define the distance between both residues in several different ways.
Different measures of inter-residue distances:
• Distances between 𝑪𝜶 atoms of two amino acids: This measure does not take
into account the proximity effects between atoms in the side chains of the
residues.
• Distances between the centres of residues. This measure takes into account
the proximity effects between side chains, but is more time-consuming than those
based on 𝐶𝛼 distance.
• Distances between 𝑪𝜷 of the residues: This measure attempts to transform the
information contained in the 3-D structure of a protein into a residue graph.
• Distances between centroids of residues: Instead of relying on a specific atom
in the residue, this measure identifies centroid of the residue, which is used as ts
positional representative.
“Distance” between two amino acids
The distance between two residues I and j represented by the Cartesian distance between them,
𝑟𝑖𝑗 = (𝑥𝑖 − 𝑥𝑗)2+(𝑦𝑖 − 𝑦𝑗)
2+(𝑧𝑖 − 𝑧𝑗)2
where 𝑥𝑖 , 𝑦 , 𝑧𝑖 are the coordinates for the 𝐶𝛼/𝐶𝛽 atom of the residue 𝑖 .

Small-World Nature of RIGs
REGULAR CONTROL PCN RANDOM CONTROL

A simple model for generating contact maps
Procedure for generating contact maps using Bartoli’s model:(i) Assign 1s to the first two diagonals (up and down the main diagonal) of theadjacency matrix in order to define the backbone contacts.(ii) Randomly select a pair of residues i and j with a probability that decreaseslinearly with the distance separating these residues in the protein sequence.(iii) Assign 1s to the entries of the adjacency matrix corresponding to all nineresidue pairs generated by the Cartesian product of {i − 1, i, i + 1} × { j − 1, j, j,+1}.(iv) Iterate the last procedure until the number of links in the random graph isclose to those of the real protein.
• The characteristic path length and clustering coefficient are not useful quantities for
“protein fingerprinting”,’ because they can be reproduced by using random
networks in which constraints similar to those induced by the backbone
connectivity are imposed.
• Perhaps that’s why the networks generated by using only long-range interactions
are indistinguishable from random graphs.

Degree distribution of RIGs: Separating core and surface
Atilgan et al. Small-world communication of residues and significance for protein dynamics, J. Biophys. J. 86, 85–91 (2004)

Closeness as a proxy for thermal fluctations

Folding
Time
kF [sec-1]ln (kF)
7.389 s0.1353-2
1 s1.000
0.1353 s7.392
18.32 ms54.604
2.479 ms403.436
33.55 ms2,981.008
0.4540 s22,026.0010
6.144 s16275.4712
RATE OF FOLDING—FOLDING TIME
Bagler and Sinha, Bioinformatics (2007)

Systems Biological Investigations of Brain Networks
R Badhwar and G Bagler*, PLoS ONE, 10(9), e0139204 (2015); R Badhwar and G Bagler*, Physica A, 469, 313-322 (2017).

Modeling Brain as a network
• Brain can be considered as a network of neurons (nodes) connected to each other via synapses (edges).
• Structural connectivity vs. Functional connectivity
• Nodes: Neurons/Brain Regions/ Voxels.
• Edges: Structural of functional connectivity.
• Study of brain as a networked system can yield important insights into its architecture, evolution and control.
E. Bullmore and O. Sporns, “Complex brain networks: graph theoretical analysis of structural and functional systems.,” Nat. Rev. Neurosci., 2009.E. T. Bullmore and D. S. Bassett, “Brain graphs: graphical models of the human brain connectome.,” Annu. Rev. Clin. Psychol., 2011.Sporns, O. Networks of the brain. MIT Press (2011).

• A soil dwelling nematode.
• Nervous system: dorsal nerve cord, ventral nerve cord and pharyngeal neuronal ring.
• Subtypes of neurons : functional roles, location within the body, span of the neuron axons.
J. G. White et. al., “The Structure of the Nervous System of the Nematode Caenorhabditis elegans,” Philos. Trans. R. Soc. B Biol. Sci., 314(1165), 1986.R. Badhwar and G. Bagler, “Control of neuronal network in Caenorhabditis elegans,” PLoS ONE, 10(9), 2015.
C. elegans nervous system

• 297 neurons and 2345 connections.
• Binary directed network.
• Specifies complex functions such as
mechanosensation, chemosensation,
precise movements and memory.
• Small world network, feedforward
motif saturation.
Y. Choe et. al., “Network connectivity analysis on the temporally augmented C. elegans web: A pilot study,” Soc. Neurosci. Abstr., 30(921.9), 2004.R. Badhwar and G. Bagler, “A distance constrained synaptic plasticity model of C. elegans neuronal network,” Physica A (2017).
C. elegans neuronal network (CeNN)

• If a system can be driven from any initial state to a desired final state in finite time is saidto controllable.
• Controllability in a network can be achieved if network contains ‘Cacti’ structure.
• Maximum matching criterion can be used for identification of driver neurons.
Ching-Tai Lin, “Structural controllability,” IEEE Trans. Automat. Contr., 19(3), 1974.Y.-Y. Liu, J.-J. Slotine, and A.-L. Barabási, “Controllability of complex networks.,” Nature, 473(7346), 2011.
Structural controllability

• Matching: a set of directed edges without common heads or tails.
• Matched node: the tail of matching edge.
J. E. Hopcroft and R. M. Karp, “An $n^{5/2} $ Algorithm for Maximum Matchings in Bipartite Graphs,” SIAM J. Comput., 2(4), 1973.
Maximum Matching
matched node
unmatched node
Hopcroft-Karp algorithm
Time complexity 𝑂( 𝑁𝐸)
Brute-force search
time complexity
(2𝑁−1)

• Erdös-Rényi (Random) control (ER): A completely randomconnectivity control.
• Degree distribution preserved control (DD): A random control inwhich degree of each vertex is preserved.
Graph theoretical properties of CeNN
CeNN ER DD
𝑪 0.17 0.03 0.07
𝑳 4.02 2.9 2.9
𝒏𝑭𝑭𝑴 3776 438.3 1699.6
𝒏𝑫 34 0.3 22.4
R. Badhwar and G. Bagler, “Control of neuronal network in Caenorhabditis elegans,” PLoS ONE, 10(9), 2015.

R. Badhwar and G. Bagler, “A distance constrained synaptic plasticity model of C. elegans neuronal network,” Physica A 2017; arXiv:1603.03867R. Milo, S. Shen-Orr, S. Itzkovitz, and N. Kashtan, “Network Motif: Simple Building Blocks of Complex Networks,” Science, 298(5594), 2002.S. Mangan and U. Alon, “Structure and function of the feed-forward loop network motif.,” PNAS, 100(21), 2003.
CeNN has saturation of Feed Forward Motifs (FFMs)
• Motifs: patterns of
interconnections among
neurons
• Structural motifs are known to
serve as functional building
blocks
• Among three-node-motifs,
FFMs are over-represented in
neuronal and gene regulatory
networks
• FFM acts as logical AND gate
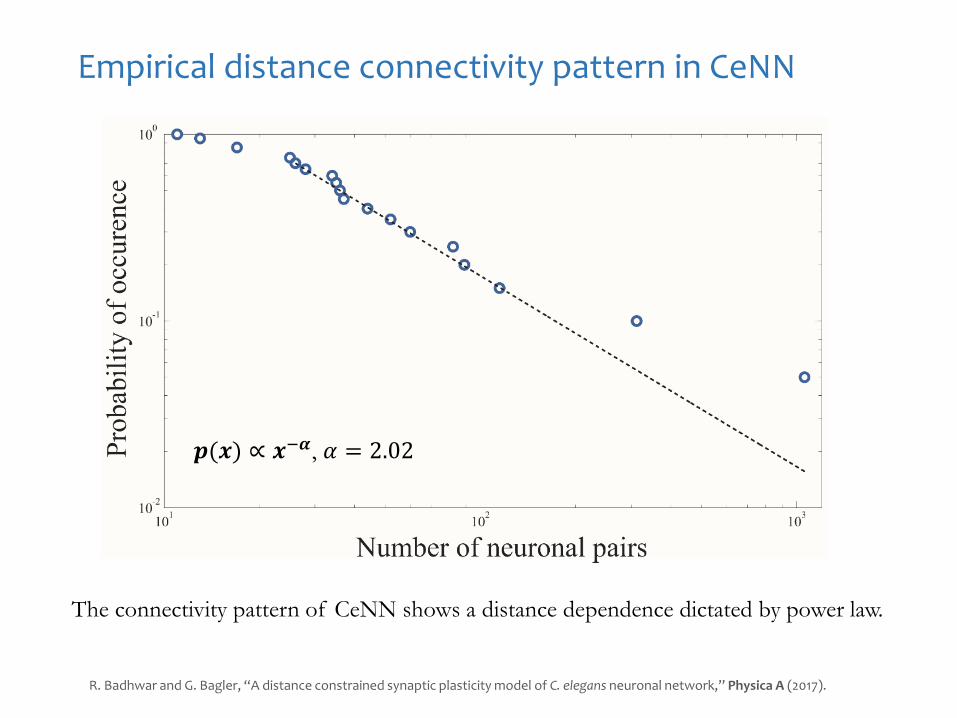
Empirical distance connectivity pattern in CeNN
The connectivity pattern of CeNN shows a distance dependence dictated by power law.
R. Badhwar and G. Bagler, “A distance constrained synaptic plasticity model of C. elegans neuronal network,” Physica A (2017).
𝒑(𝒙) ∝ 𝒙−𝜶, 𝛼 = 2.02

Distance Constrained Synaptic Plasticity Model
R. Badhwar and G. Bagler, “A distance constrained synaptic plasticity model of C. elegans neuronal network,” Physica A (2017).

𝐹1 =2𝑇𝑃
2𝑇𝑃 + 𝐹𝑃 + 𝐹𝑁
R. Badhwar and G. Bagler, “A distance constrained synaptic plasticity model of C. elegans neuronal network,” Physica A (2017).
Distance Constrained Synaptic Plasticity Model


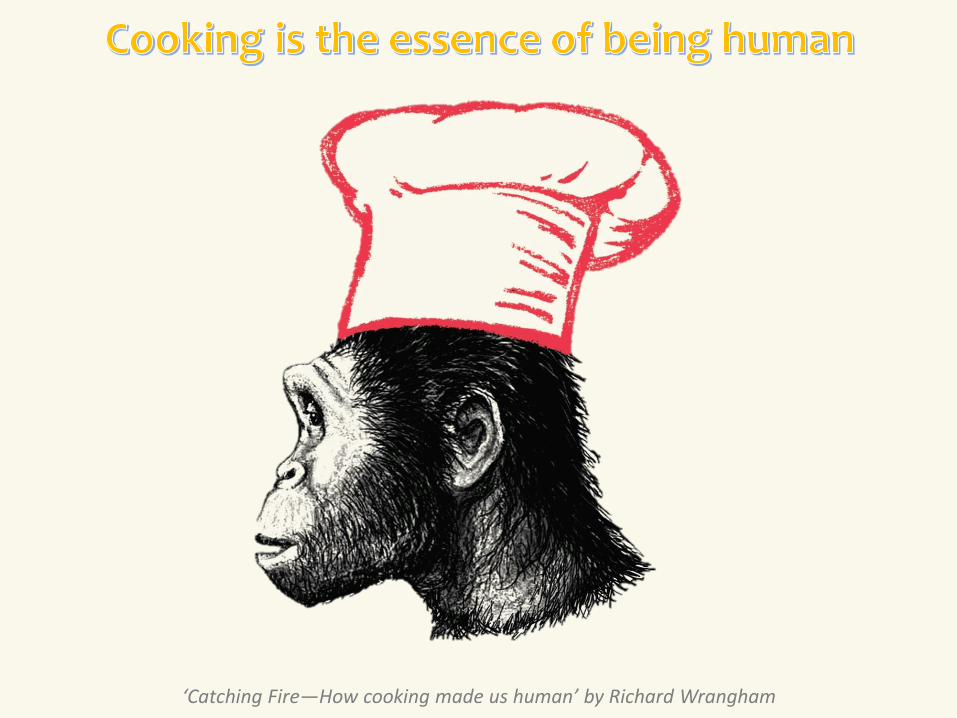
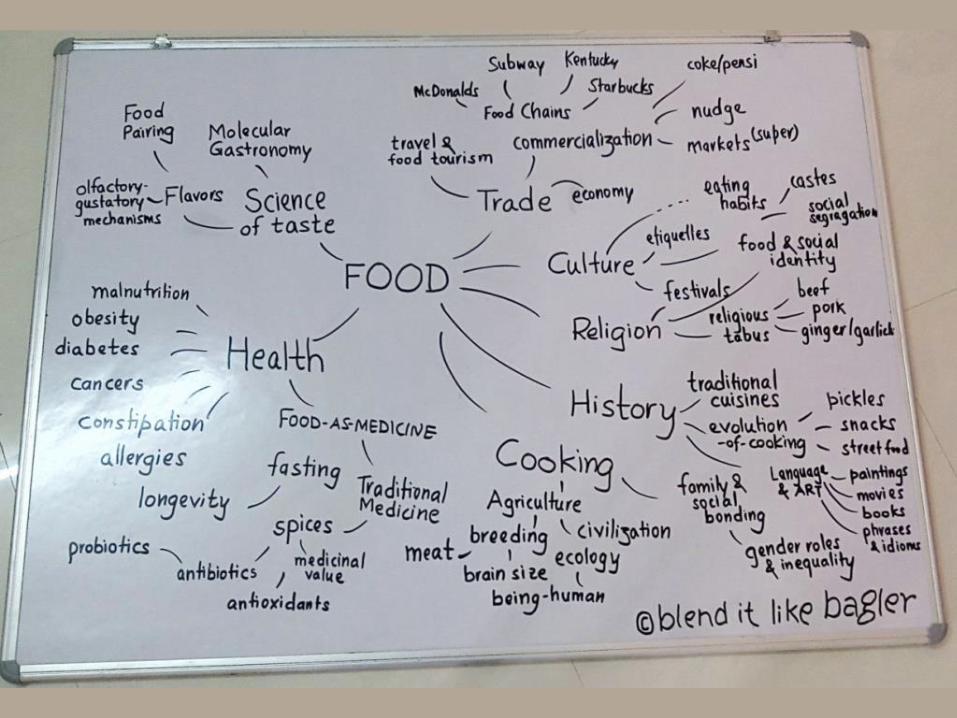
‘Catching Fire—How cooking made us human’ by Richard Wrangham

Why do we eat what we eat?

Why do we combine ingredients
in our recipes the way we do?

Food Pairing Hypothesis
Ingredients that taste similar tend to be used togetherin traditional recipes
Ahn et. al, “Flavor network and the principles of food pairing”, Scientific Reports (2011).A Jain, NK Rakhi, G Bagler*, “Spices form the basis of food pairing in Indian cuisine”, arXiv:1502.03815 (2015).

Recipes & Ingredients2543 Traditional Indian Recipes (TarlaDalal)
Regional cuisines: Bengali, Gujarati, Jain, Maharashtrian, Mughlai, Punjabi, Rajasthani, South Indian.
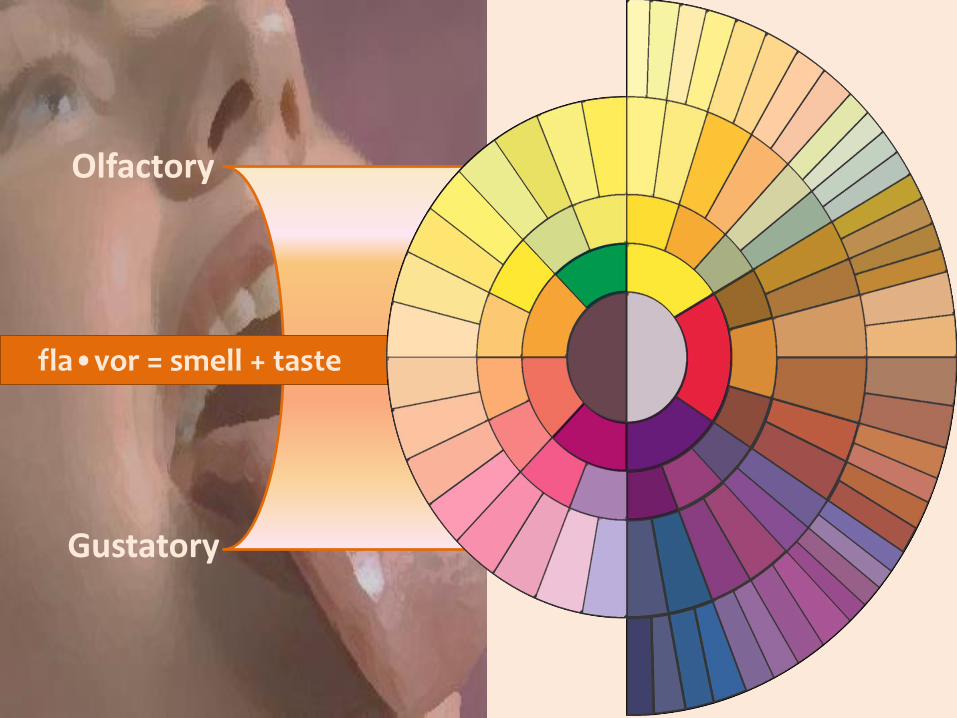
fla•vor = smell + taste
Olfactory
Gustatory

Fenaroli’s Handbook


Complex Systems Laboratory, G Bagler*
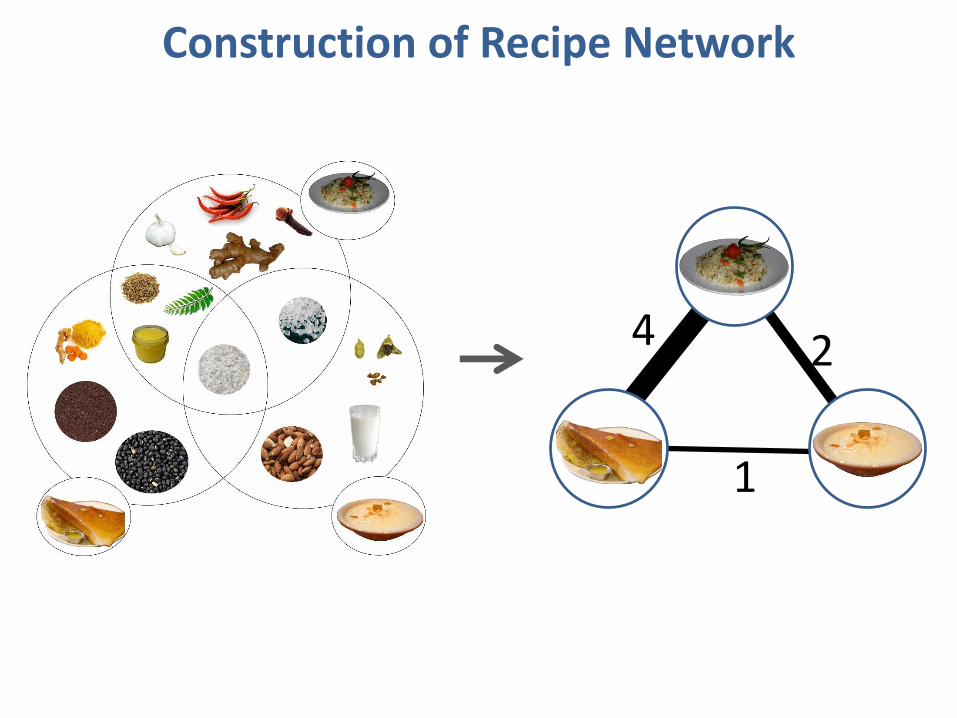
Networks in Recipes
4
1
2
In search of networks in recipes and flavor moleculesPatterns in traditional recipes
A Jain, NK Rakhi and G Bagler*, arXiv (2015); A Jain, NK Rakhi and G Bagler*, PLoS ONE (2015).

𝑅𝑎𝑛𝑑𝑜𝑚 𝐶𝑢𝑖𝑠𝑖𝑛𝑒
Western Cuisines
Ahn et. al, Sci.Rep. (2011)
Uniform Food Pairing
Indian Cuisine
Jain et. al, PLoS ONE (2015)
Contrasting Food Pairing

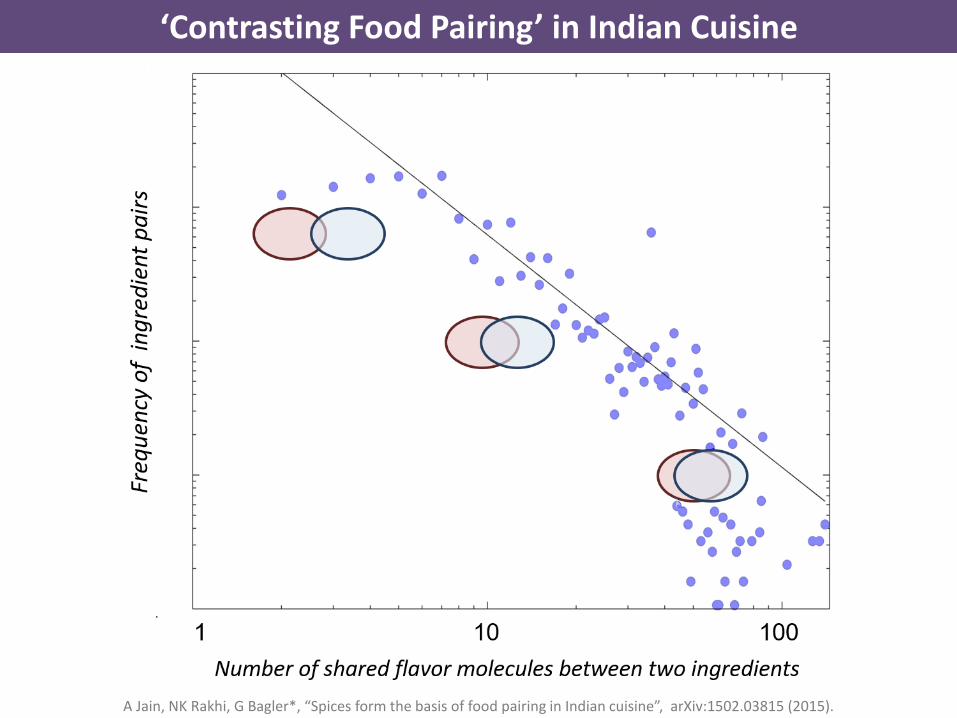
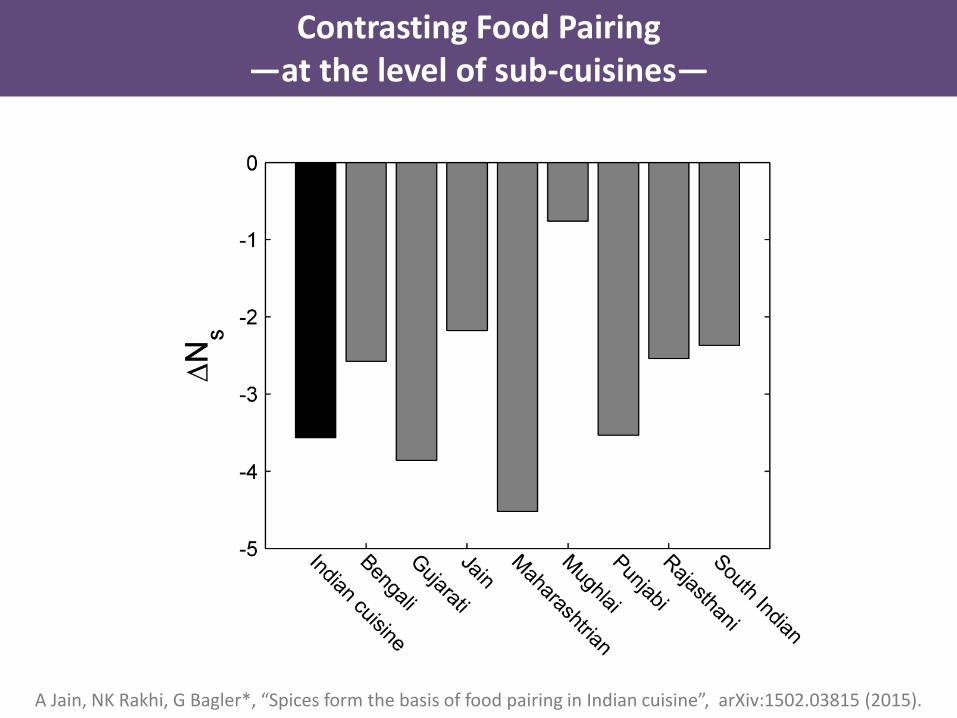
‘Contrasting Food Pairing’ in Indian Cuisine
A Jain, NK Rakhi, G Bagler*, “Spices form the basis of food pairing in Indian cuisine”, arXiv:1502.03815 (2015).

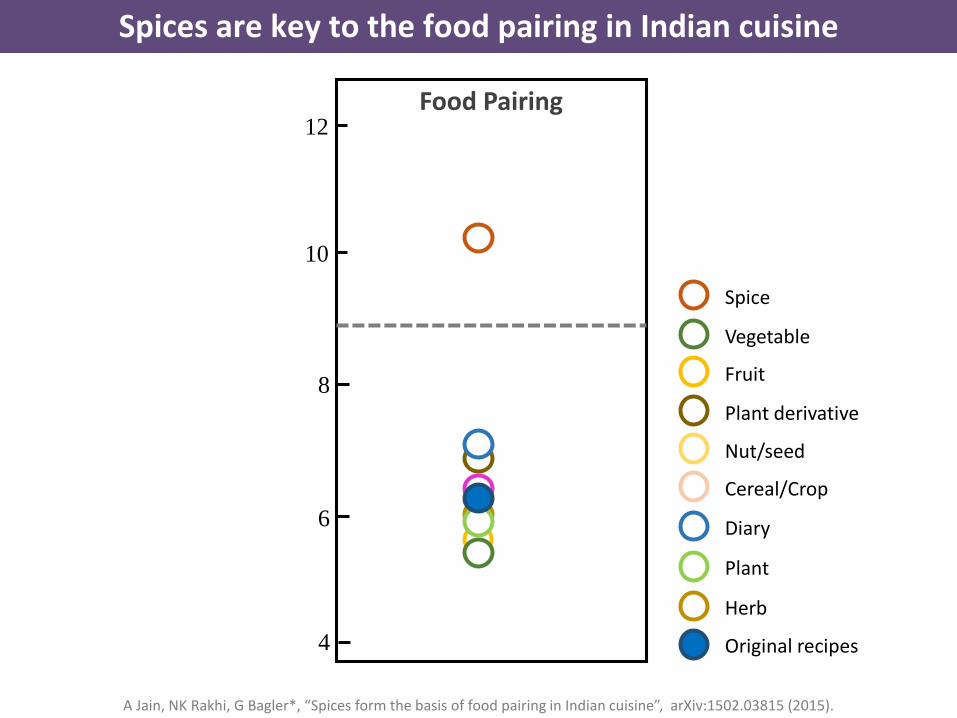
4
6
8
10
12Food Pairing
Original recipes
Herb
Plant
Diary
Cereal/Crop
Nut/seed
Plant derivative
Fruit
Vegetable
Spice
Spices are key to the food pairing in Indian cuisine
A Jain, NK Rakhi, G Bagler*, “Spices form the basis of food pairing in Indian cuisine”, arXiv:1502.03815 (2015).


SpiceThe Taste of India

A Jain, NK Rakhi and G Bagler*, arXiv (2015); A Jain, NK Rakhi and G Bagler*, PLoS ONE (2015).
Best of 2015MIT Technology Review


Molecular Essence
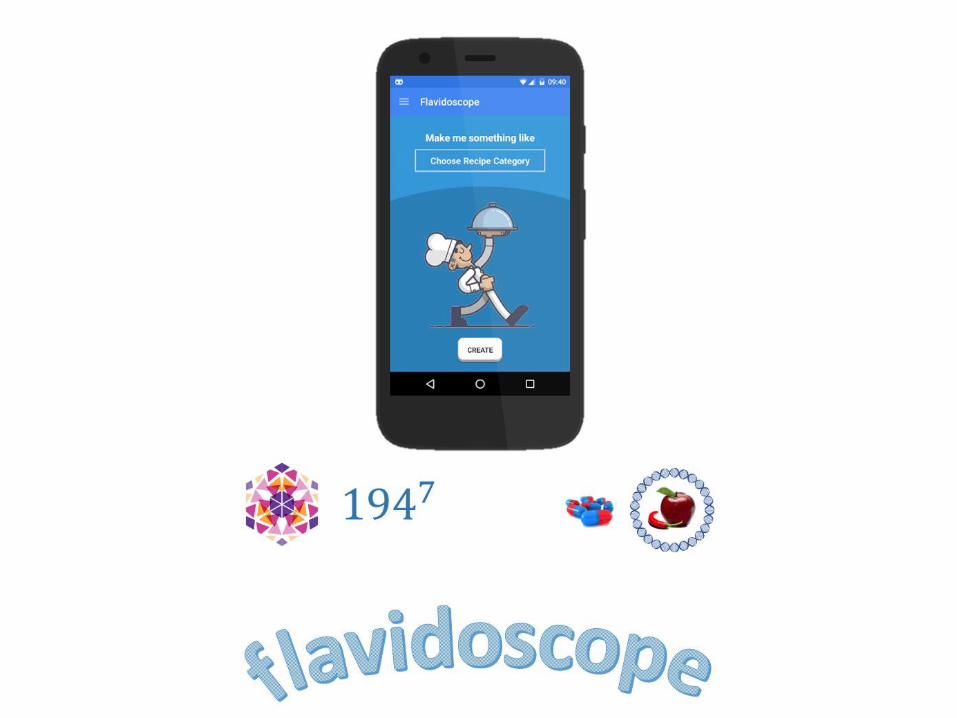
Novel Recipe Generation
Food Formulations
Food-Beverage
pairing
Hypothesis Generation & Testing
Nutri-Genomics
Food-Disease
Association

Navjot Singh and G Bagler*, unpublished (2017).

http://cosylab.iiitd.edu.in/flavordb

*
* under development
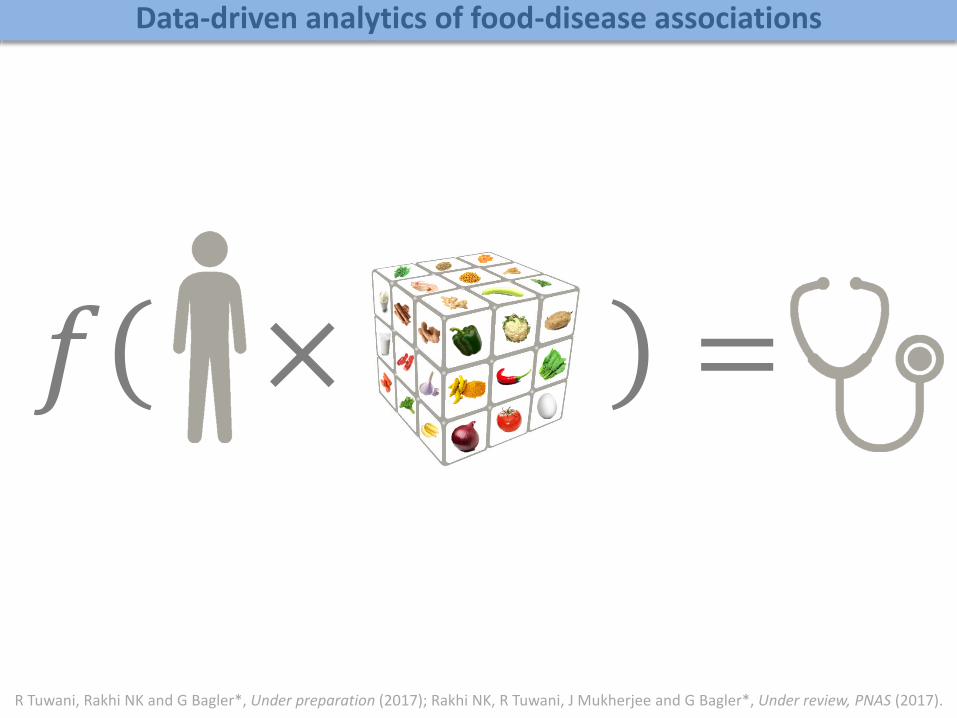
𝑓 × = 𝑧
R Tuwani, Rakhi NK and G Bagler*, Under preparation (2017); Rakhi NK, R Tuwani, J Mukherjee and G Bagler*, Under review, PNAS (2017).
Data-driven analytics of food-disease associations

Image Credits: Wikipedia, Google Images (wherever applicable)


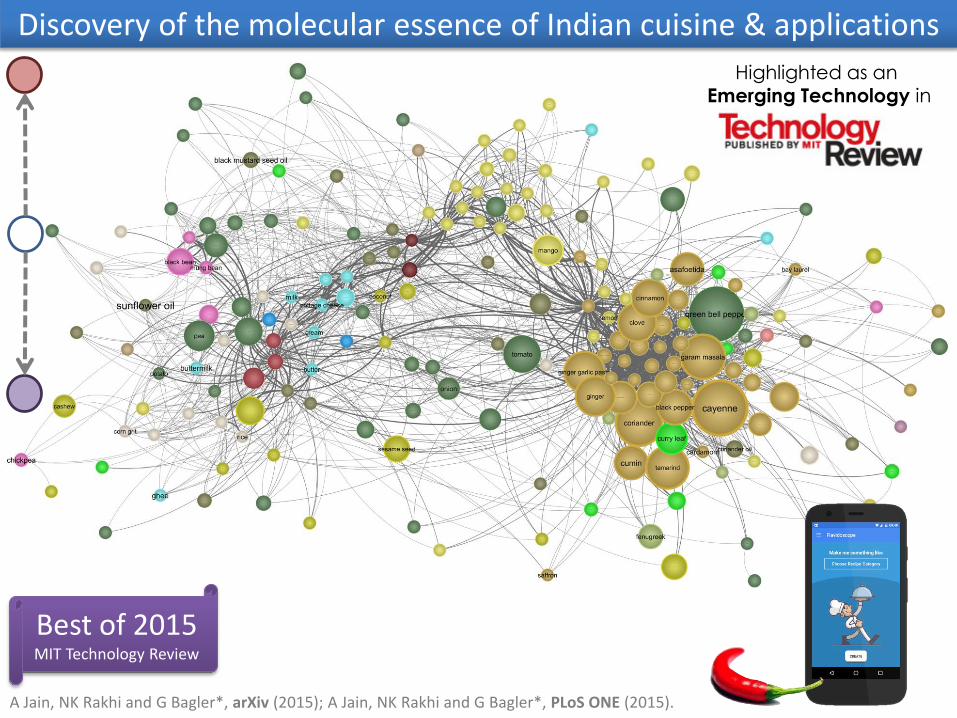
Discovery of the molecular essence of Indian cuisine & applications
Highlighted as an
Emerging Technology in
A Jain, NK Rakhi and G Bagler*, arXiv (2015); A Jain, NK Rakhi and G Bagler*, PLoS ONE (2015).
Best of 2015MIT Technology Review

1 0 1 0 1 0 1 0 1 0 1 0 1 0 1 0 1 0 1 0 1 0 1 0 1 0 1 0 1 0 1 0 1 0 1 0 1 0 1 0 1 0 1 0 1 0 1 0 1 0 1 0 1 0 1 0 1 0 1 0 1 0 1 0 1 0 1 0 1 0 1 0 1 0 1 0 1 0 1 0 1 0 1 0 1 0 1 0 1 0 1 0 1 0 1 0 1 0 1 0 1 0 1 0 1 0 1 0 1 0 1 0 1 0 1 0 1 0 1 0 1 0 1 0 1 0 1 01 0 1 0 1 0 1 0 1 0 1 0 1 0 1 0 1 0 1 0 1 0 1 0 1 0 1 0 1 0 1 0 1 0 1 0 1 0 1 0 1 0 1 0 1 0 1 0 1 0 1 0 1 0 1 0 1 0 1 0 1 0 1 01 0 1 0 1 0 1 0 1 0 1 0 1 0 1 0 1 0 1 0 1 0 1 0 1 0 1 0 1 0 1 0 1 0 1 0 1 0 1 0 1 0 1 0 1 0 1 0 1 0 1 0 1 0 1 0 1 0 1 0 1 0 1 01 0 1 0 1 0 1 0 1 0 1 0 1 0 1 0 1 0 1 0 1 0 1 0 1 0 1 0 1 0 1 0 1 0 1 0 1 0 1 0 1 0 1 0 1 0 1 0 1 0 1 0 1 0 1 0 1 0 1 0 1 0 1 01 0 1 0 1 0 1 0 1 0 1 0 1 0 1 0 1 0 1 0 1 0 1 0 1 0 1 0 1 0 1 0 1 0 1 0 1 0 1 0 1 0 1 0 1 0 1 0 1 0 1 0 1 0 1 0 1 0 1 0 1 0 1 0
1 0 1 0 1 0 1 0 1 0 1 0 1 0 1 0 1 0 1 0 1 0 1 0 1 0 1 0 1 0 1 0 1 0 1 0 1 0 1 0 1 0 1 0 1 0 1 0 1 0 1 0 1 0 1 0 1 0 1 0 1 0 1 0 1 0 1 0 1 0 1 0 1 0 1 0 1 0 1 0 1 0 1 0 1 0 1 0 1 0 1 0 1 0 1 0 1 0 1 0 1 0 1 0 1 0 1 0 1 0 1 0 1 0 1 0 1 0 1 0 1 0 1 0 1 0 1 01 0 1 0 1 0 1 0 1 0 1 0 1 0 1 0 1 0 1 0 1 0 1 0 1 0 1 0 1 0 1 0 1 0 1 0 1 0 1 0 1 0 1 0 1 0 1 0 1 0 1 0 1 0 1 0 1 0 1 0 1 0 1 01 0 1 0 1 0 1 0 1 0 1 0 1 0 1 0 1 0 1 0 1 0 1 0 1 0 1 0 1 0 1 0 1 0 1 0 1 0 1 0 1 0 1 0 1 0 1 0 1 0 1 0 1 0 1 0 1 0 1 0 1 0 1 01 0 1 0 1 0 1 0 1 0 1 0 1 0 1 0 1 0 1 0 1 0 1 0 1 0 1 0 1 0 1 0 1 0 1 0 1 0 1 0 1 0 1 0 1 0 1 0 1 0 1 0 1 0 1 0 1 0 1 0 1 0 1 01 0 1 0 1 0 1 0 1 0 1 0 1 0 1 0 1 0 1 0 1 0 1 0 1 0 1 0 1 0 1 0 1 0 1 0 1 0 1 0 1 0 1 0 1 0 1 0 1 0 1 0 1 0 1 0 1 0 1 0 1 0 1 0 1 0 1 0 1 0 1 0 1 0 1 0 1 0 1 0 1 0 1 0 1 0 1 0 1 0 1 0 1 0 1 0 1 0 1 0 1 0 1 0 1 0 1 0 1 0 1 0 1 0 1 0 1 0 1 0 1 0 1 0 1 0 1 0 1 0 1 0 1 0 1 0 1 0 1 0 1 0 1 0 1 0 1 0 1 0 1 0 1 0 1 0 1 0 1 0 1 0 1 0 1 0 1 0 1 0 1 0 1 0 1 0 1 0 1 0 1 0 1 0 1 0 1 0 1 0 1 01 0 1 0 1 0 1 0 1 0 1 0 1 0 1 0 1 0 1 0 1 0 1 0 1 0 1 0 1 0 1 0 1 0 1 0 1 0 1 0 1 0 1 0 1 0 1 0 1 0 1 0 1 0 1 0 1 0 1 0 1 0 1 01 0 1 0 1 0 1 0 1 0 1 0 1 0 1 0 1 0 1 0 1 0 1 0 1 0 1 0 1 0 1 0 1 0 1 0 1 0 1 0 1 0 1 0 1 0 1 0 1 0 1 0 1 0 1 0 1 0 1 0 1 0 1 01 0 1 0 1 0 1 0 1 0 1 0 1 0 1 0 1 0 1 0 1 0 1 0 1 0 1 0 1 0 1 0 1 0 1 0 1 0 1 0 1 0 1 0 1 0 1 0 1 0 1 0 1 0


• India has a culinary history of health-centric dietary practicesaimed at disease prevention and promotion of health.
• Food as a medicine: Traditionally, food has been treated as amedicinal agent in the Indian subcontinent.
Charaka Samhitā (चरक संहिता)
Susruta Samhitā (सुशृत संहिता)
Bhāvaprakāśa Nighaņțu (भावप्रकाश हिघणु्ट)
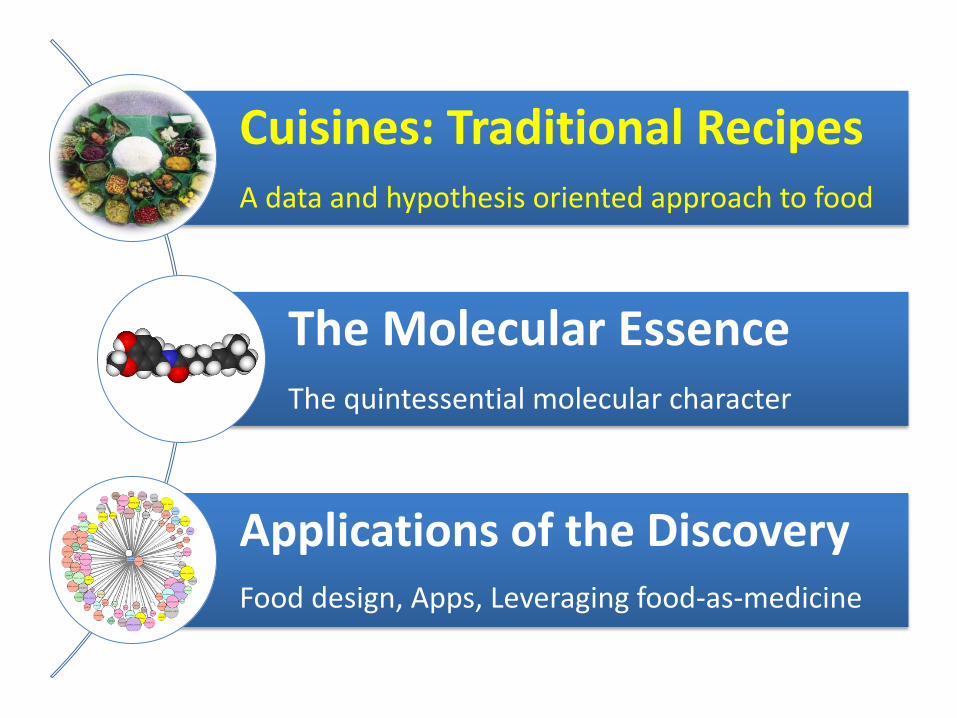
Cuisines: Traditional RecipesA data and hypothesis oriented approach to food
The Molecular EssenceThe quintessential molecular character
Applications of the DiscoveryFood design, Apps, Leveraging food-as-medicine

1,000,000,000+experiments per day

&well tasted
:: Data ::
well tested

2543 Traditional Indian Recipes (TarlaDalal)
Regional cuisines: Bengali, Gujarati, Jain, Maharashtrian, Mughlai, Punjabi, Rajasthani, South Indian.
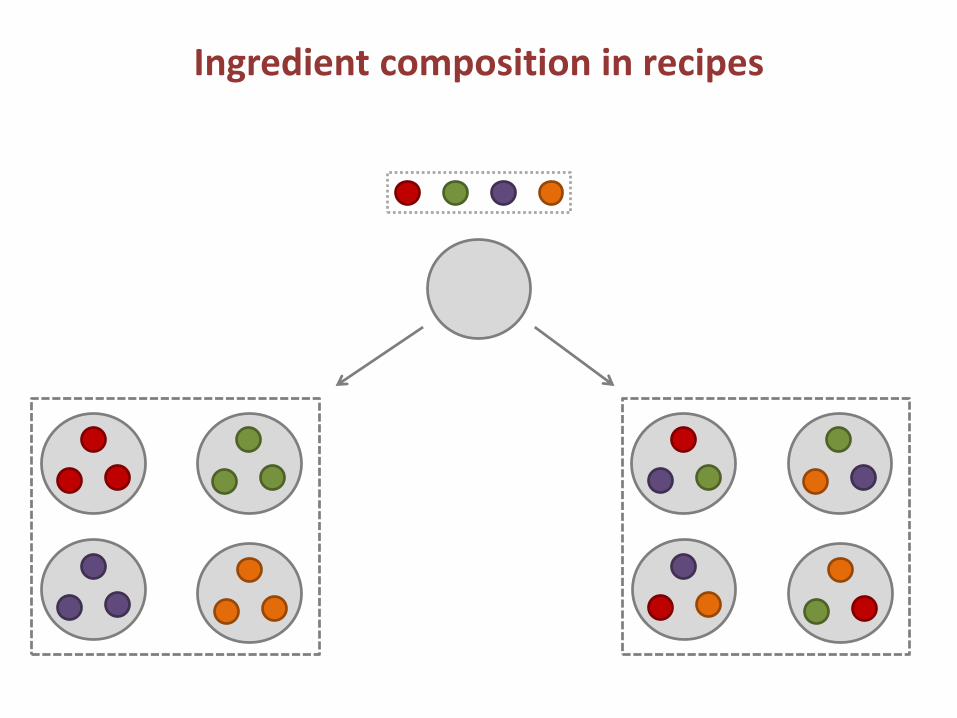
Ingredient composition in recipes

Cuisines: Traditional RecipesA data and hypothesis oriented approach to food
The Molecular EssenceThe quintessential molecular character
Applications of the DiscoveryFood design, Apps, Leveraging food-as-medicine

A Jain, NK Rakhi, G Bagler*, “Spices form the basis of food pairing in Indian cuisine”, arXiv:1502.03815 (2015).
Contrasting Food Pairing—at the level of cuisine—
A Jain, NK Rakhi, G Bagler*, “Spices form the basis of food pairing in Indian cuisine”, arXiv:1502.03815 (2015).
Contrasting Food Pairing—at the level of sub-cuisines—

Jain et. al, PLoS ONE (2015).
Culinary Fingerprinting of Regional Cuisines of India

A Jain, NK Rakhi, G Bagler*, “Spices form the basis of food pairing in Indian cuisine”, arXiv:1502.03815 (2015).
Spices are key to the food pairing in Indian cuisine

Positive (Uniform)Negative (Contrasting)
A Jain, NK Rakhi, G Bagler*, “Spices form the basis of food pairing in Indian cuisine”, arXiv:1502.03815 (2015).
Role of ingredients in biasing the food pairing

Low flavour sharing
Low occurrence of pairsHigh occurrence of pairs
High flavour sharingMedium flavour sharing
The Flavor Graph based on the Indian Cuisine
4
1
2
Construction of Recipe Network
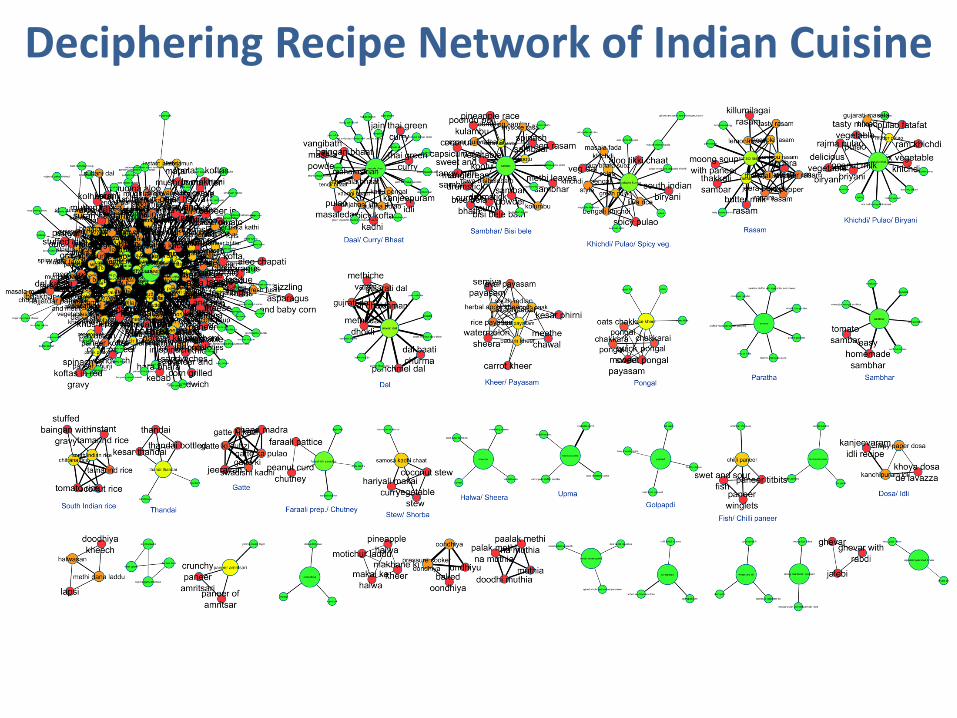
Deciphering Recipe Network of Indian Cuisine

Cuisines: Traditional RecipesA data and hypothesis oriented approach to food
The Molecular EssenceThe quintessential molecular character
Applications of the DiscoveryFood design, Apps, Leveraging food-as-medicine


Levels of glucose in the blood are measured in terms of “Postprandial Glycemic Response (PPGR)”.
Image Credits: HealthClinic

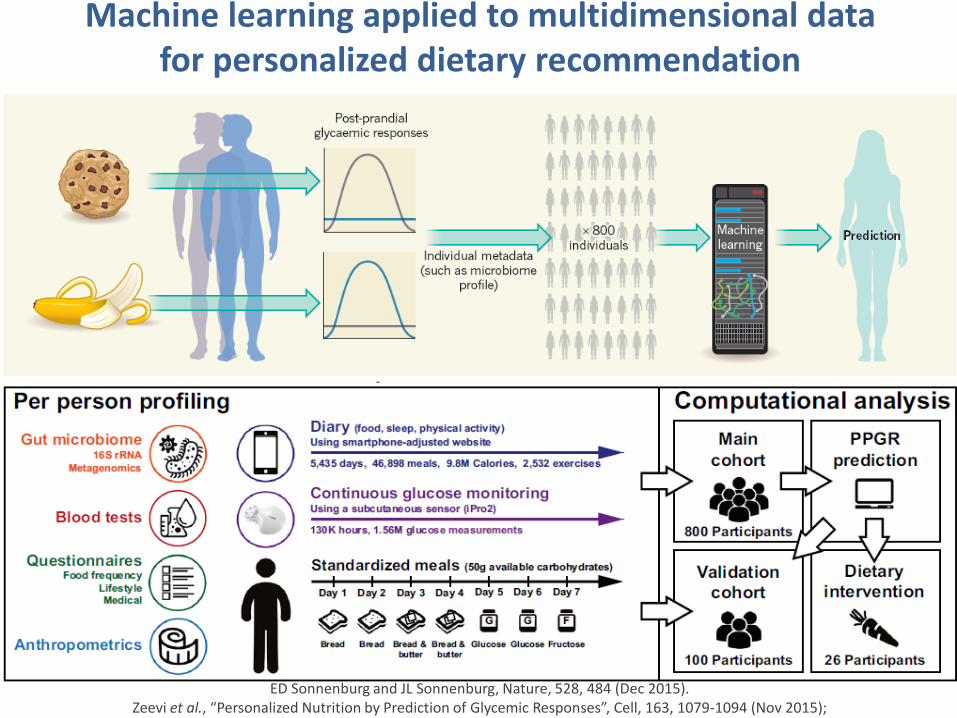
Machine learning applied to multidimensional data for personalized dietary recommendation
ED Sonnenburg and JL Sonnenburg, Nature, 528, 484 (Dec 2015).Zeevi et al., “Personalized Nutrition by Prediction of Glycemic Responses”, Cell, 163, 1079-1094 (Nov 2015);


Changes in diameter (Characteristic Path Length) of the network as a function of fraction of nodes removed. (a) Comparison between exponential (E) and scale-free (SF) network models. N = 10,000 and E = 20,000.
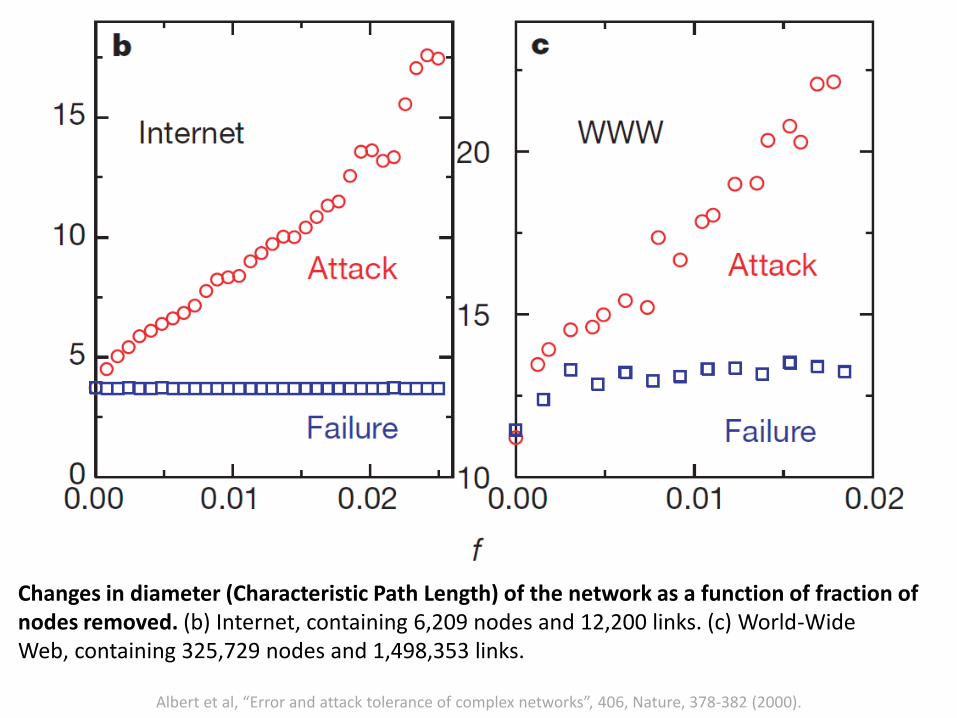
Albert et al, “Error and attack tolerance of complex networks”, 406, Nature, 378-382 (2000).
Albert et al, “Error and attack tolerance of complex networks”, 406, Nature, 378-382 (2000).
Changes in diameter (Characteristic Path Length) of the network as a function of fraction of nodes removed. (b) Internet, containing 6,209 nodes and 12,200 links. (c) World-WideWeb, containing 325,729 nodes and 1,498,353 links.
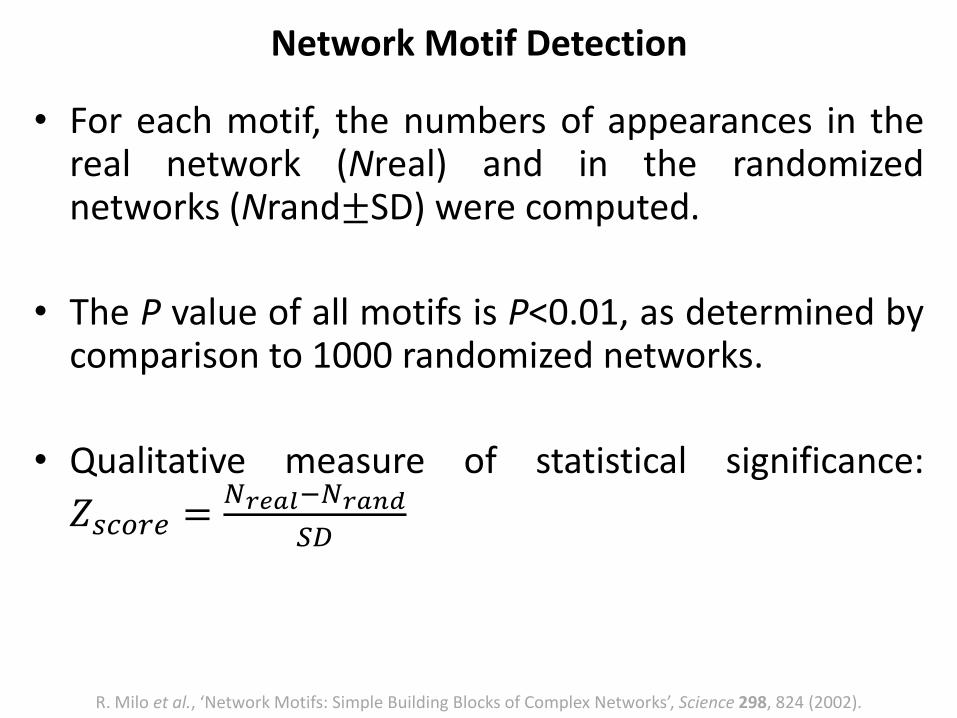
• For each motif, the numbers of appearances in thereal network (Nreal) and in the randomizednetworks (Nrand±SD) were computed.
• The P value of all motifs is P<0.01, as determined bycomparison to 1000 randomized networks.
• Qualitative measure of statistical significance:
𝑍𝑠𝑐𝑜𝑟𝑒 =𝑁𝑟𝑒𝑎𝑙−𝑁𝑟𝑎𝑛𝑑
𝑆𝐷
Network Motif Detection
R. Milo et al., ‘Network Motifs: Simple Building Blocks of Complex Networks’, Science 298, 824 (2002).

• Two of these motifs (feedforward loop and bi-fan) were found in both the transcriptional gene regulation networks as well as neuronal networks.
• This similarity in motifs may point to a fundamental similarity in the design constraints of the two types of networks.
• Both networks function to carry information from sensory components (sensory neurons/transcription factors regulated by biochemical signals) to effectors (motor neurons/structural genes).
• The feedforward loop motif common to both types of networks may play a functional role in information processing.
• One possible function of this circuit is to activate output only if the input signal is persistent and to allow a rapid deactivation when the input goes off.
• Indeed, many of the input nodes in the neural feedforward loops are sensory neurons, which may require this type of information processing to reject transient input fluctuations that are inherent in a variable or noisy environment.
Why common motifs?
R. Milo et al., ‘Network Motifs: Simple Building Blocks of Complex Networks’, Science 298, 824 (2002).

Bar
abas
iet
al, “
Net
wo
rk M
edic
ine:
A n
etw
ork
bas
ed a
pp
roac
h t
o h
um
an d
isea
se”,
Nat
ure
Rev
iew
s (2
00
2)
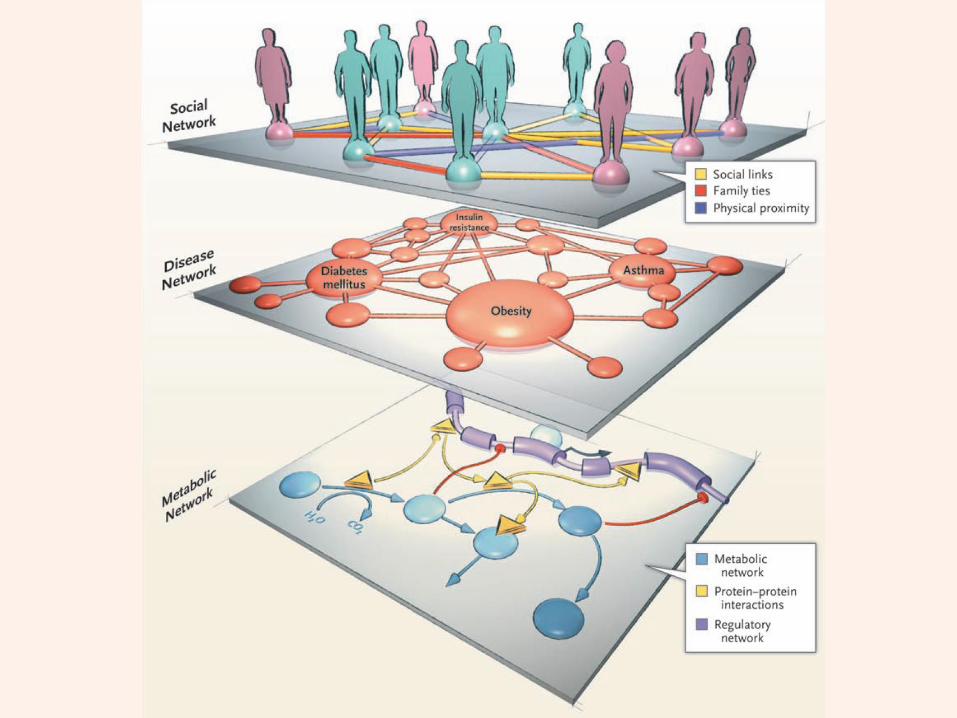
Barabasi et al, “Network Medicine: A network based approach to human disease”, Nature Reviews (2002)
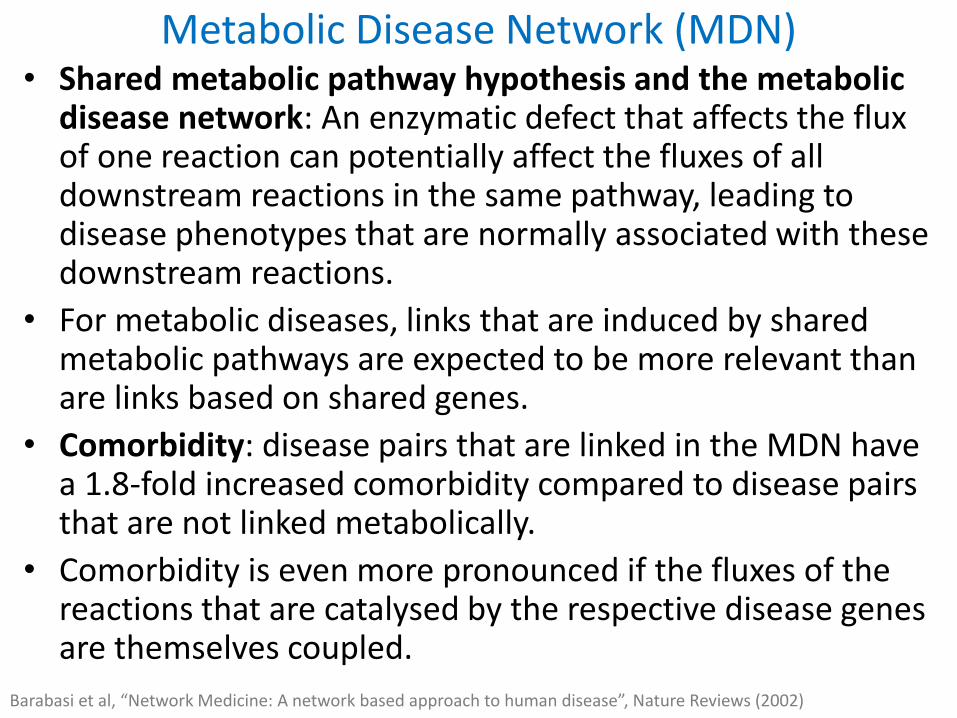
• Shared metabolic pathway hypothesis and the metabolic disease network: An enzymatic defect that affects the flux of one reaction can potentially affect the fluxes of all downstream reactions in the same pathway, leading to disease phenotypes that are normally associated with these downstream reactions.
• For metabolic diseases, links that are induced by shared metabolic pathways are expected to be more relevant than are links based on shared genes.
• Comorbidity: disease pairs that are linked in the MDN have a 1.8-fold increased comorbidity compared to disease pairs that are not linked metabolically.
• Comorbidity is even more pronounced if the fluxes of the reactions that are catalysed by the respective disease genes are themselves coupled.
Metabolic Disease Network (MDN)
Barabasi et al, “Network Medicine: A network based approach to human disease”, Nature Reviews (2002)

Barabasi et al, “Network Medicine: A network based approach to human disease”, Nature Reviews (2002)
Metabolic Disease Network

Drug-Protein Interaction Network

• The highly interconnected nature of the interactome implies that it is difficult to consider diseases as being consistently independent of one another at the molecular level.
• Diseasome: The systematic mapping of such network-based dependencies between pathophenotypes and their disease modules.
• Diseasome are disease maps whose nodes are diseases and whose links represent various molecular relationships between the disease-associated cellular components.
• Study of diseasome can help is better understanding of how different phenotypes are linked at the molecular level and their comorbidity insights
• This may yield new approaches to disease prevention, diagnosis and treatment.
• Diseasome-based approaches could also aid drug discovery, specifically for repurposing of drugs (use of approved drugs to treat molecularly linked diseases).
Human Diseasome
Barabasi et al, “Network Medicine: A network based approach to human disease”, Nature Reviews (2002)

• Shared gene hypothesis and the human disease network: In the obtained human disease network (HDN) of Goh et al., 867 of 1,284 diseases with an associated gene are connected to at least one other disease, and 516 of them belong to a single disease cluster.
• Comorbidity: a patient is twice as likely to develop a particular disease if that disease shares a gene with the patient’s primary disease.
• But, many disease pairs that share genes do not show significant comorbidity.
Human Diseasome
Barabasi et al, “Network Medicine: A network based approach to human disease”, Nature Reviews (2002)

Human Diseasome
Barabasi et al, “Network Medicine: A network based approach to human disease”, Nature Reviews (2002)

Network Medicine
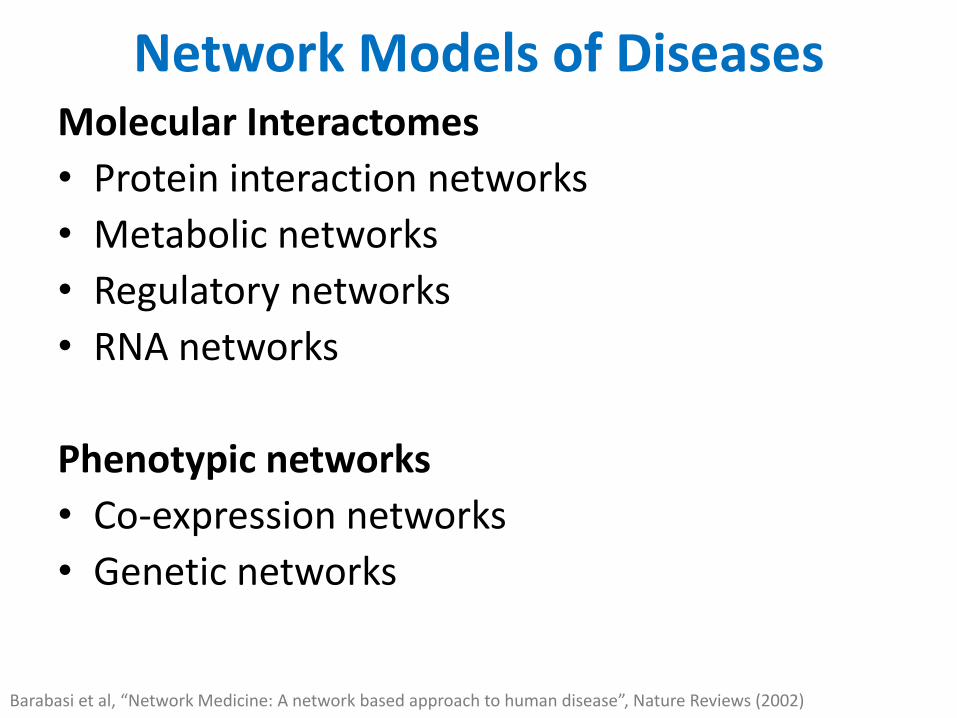
Network Models of DiseasesMolecular Interactomes
• Protein interaction networks
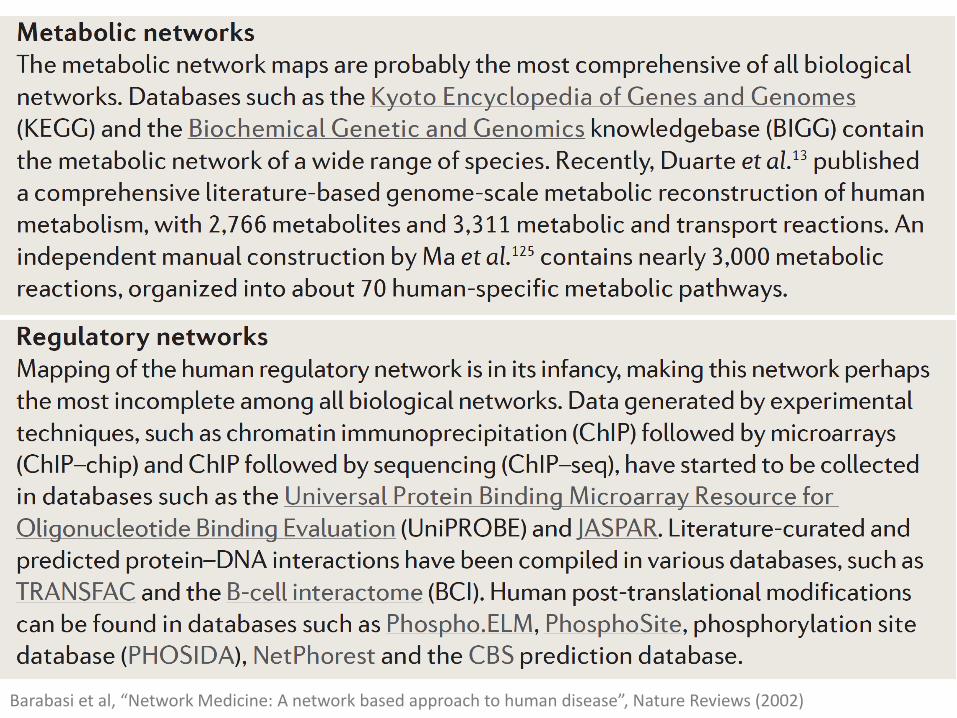
• Metabolic networks
• Regulatory networks
• RNA networks
Phenotypic networks
• Co-expression networks
• Genetic networks
Barabasi et al, “Network Medicine: A network based approach to human disease”, Nature Reviews (2002)

• The highly interconnected nature of the interactome implies that it is difficult to consider diseases as being consistently independent of one another at the molecular level.
• Diseasome: The systematic mapping of such network-based dependencies between pathophenotypes and their disease modules.
• Diseasome are disease maps whose nodes are diseases and whose links represent various molecular relationships between the disease-associated cellular components.
• Better understanding of how different phenotypes are linked at the molecular level and their comorbidity insights
• New approaches to disease prevention, diagnosis and treatment.
• Diseasome-based approaches could also aid drug discovery, specifically for repurposing of drugs (use of approved drugs to treat molecularly linked diseases).
Human Diseasome
Barabasi et al, “Network Medicine: A network based approach to human disease”, Nature Reviews (2002)

Application of network-based knowledge of disease
• Network Pharmacology- Since cellular dysfunction is limited to the disease module, knowledge of the latter can reduce the search for therapeutic agents.- Identification and testing of potential new antibacterial agents.- Therapies that involve multiple targets may be more effective in reversing the disease phenotype than ‘single drugs’.- Drug target networks.
• Disease classification using molecular correlates- Contemporary approaches to the classification of human disease are based on observational correlations between pathological analysis of the patient and existing knowledge of clinical syndromes
Barabasi et al, “Network Medicine: A network based approach to human disease”, Nature Reviews (2002)
Summary• Modeling biological entities as networked entities can provide
valuable insights into their mechanisms.
• Biological Networks: Protein Interactomes, Gene Regulatory Networks, Metabolic Networks, Brain Networks, Residue Interaction Graphs, Diseasomes…
• Small-world networks
• Scale-free networks
• Robustness and vulnerability of scale-free networks
• Centrality and lethality of hub proteins
• Network Medicine: Medical applications of network modeling

A simple model for co-expression networks

Genetic Networks
Gene Co-expression Networks• Association by virtue of co-expression• False positives
Gene Regulatory Networks• Nodes: Transcription factors Genes• Genes: Regulatory Genes and Target Genes

Architecture of Molecular Networks
• Is the scale-free, small-world architecture direct product of selection and thus functionally meaningful, merely a by-product of the requirements of function and of selection at other levels, or even a natural consequence of mechanisms such as gene duplication.
Previous models suggested to explain the architecture:• Selection on global properties such as robustness• Fast spread of perturbations• Phenomenological models (Duplication growth or hierarchical
architecture)
“The yeast coexpression network has a small-world, scale-free architecture and can be explained by a simple model”, Noort et al., EMBO Reports, 5(3), 2004.

Yeast Coexpression Network
• Although gene coexpression is a continuous observable, the underlying principle is discrete: the sharing of regulatory elements.
• Compared to protein interaction networks or metabolic networks, coexpression covers a more inclusive array of functional relations between gene products.
• Yeast Coexpression Network- 4077 genes and 65,430 coexpression relationships- Average Degree: 32- Degree Exponent 𝛾 ≈ 1- Average Clustering Coefficient = 0.6- Characteristic Path Length = 4
“The yeast coexpression network has a small-world, scale-free architecture and can be explained by a simple model”, Noort et al., EMBO Reports, 5(3), 2004.
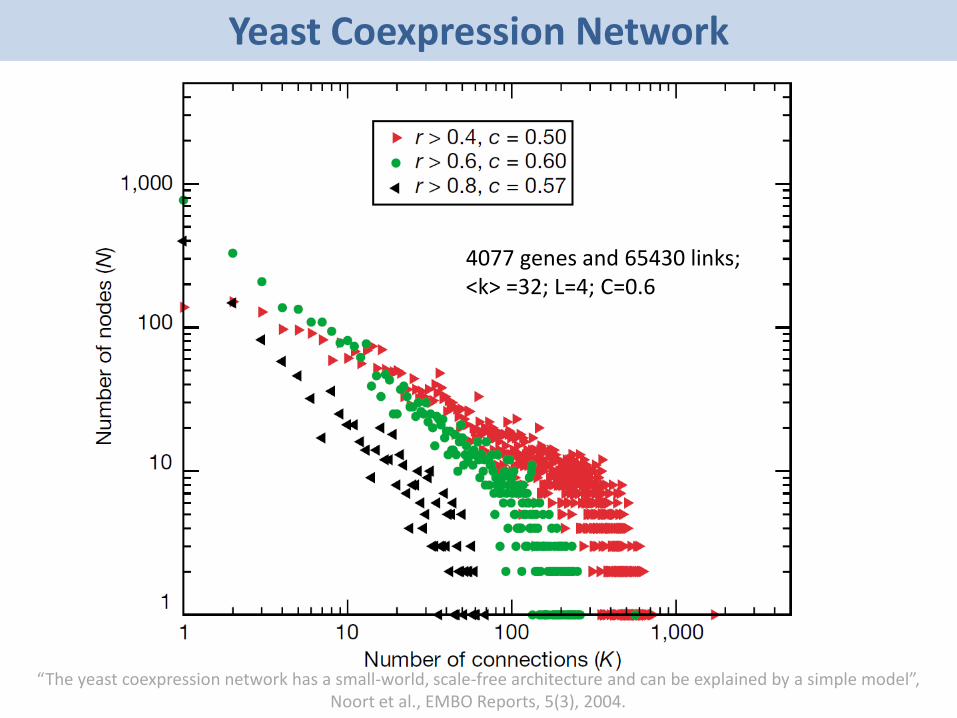
4077 genes and 65430 links; <k> =32; L=4; C=0.6
Yeast Coexpression Network
“The yeast coexpression network has a small-world, scale-free architecture and can be explained by a simple model”, Noort et al., EMBO Reports, 5(3), 2004.

Evolutionary model of transcription regulation
Gene: Transcription Factor Binding Sites & Coding Region
“The yeast coexpression network has a small-world, scale-free architecture and can be explained by a simple model”, Noort et al., EMBO Reports, 5(3), 2004.
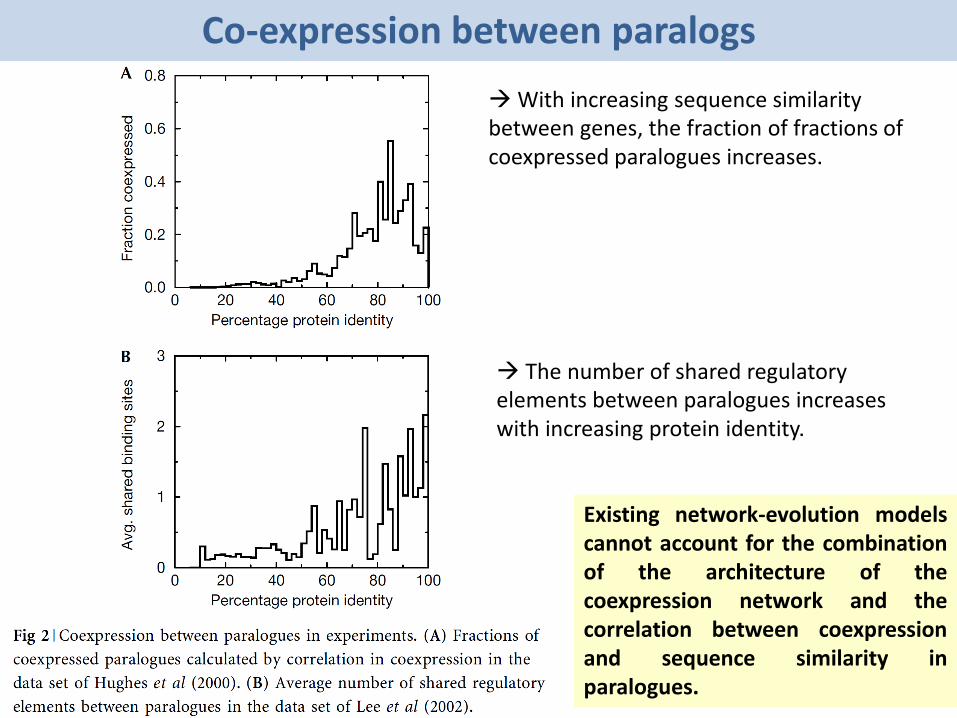
Co-expression between paralogs
With increasing sequence similarity between genes, the fraction of fractions ofcoexpressed paralogues increases.
The number of shared regulatory elements between paralogues increases with increasing protein identity.
Existing network-evolution modelscannot account for the combinationof the architecture of thecoexpression network and thecorrelation between coexpressionand sequence similarity inparalogues.
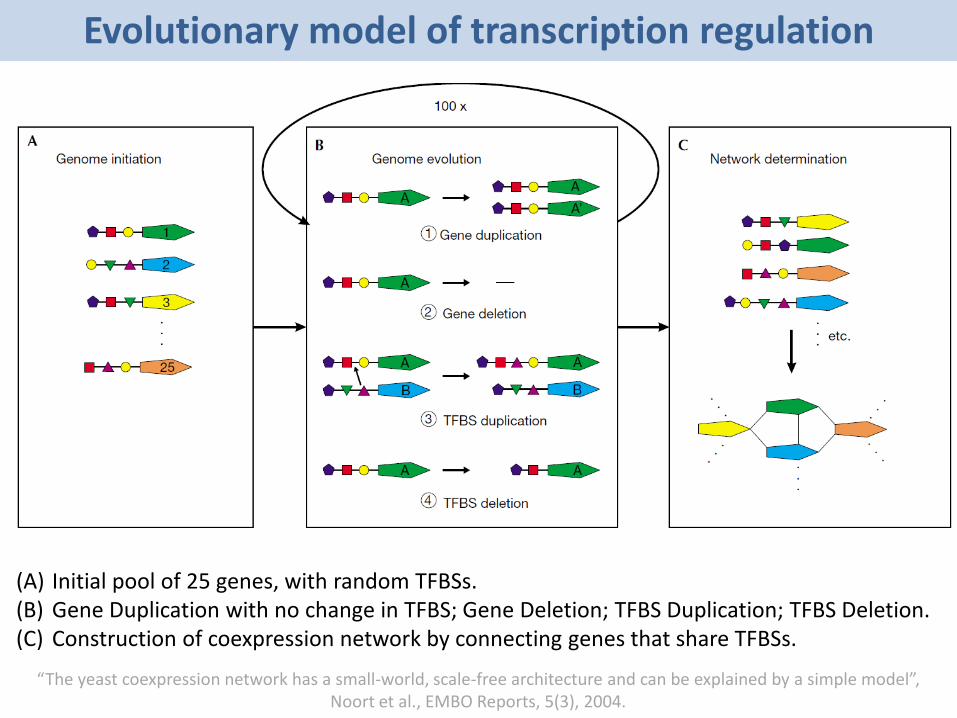
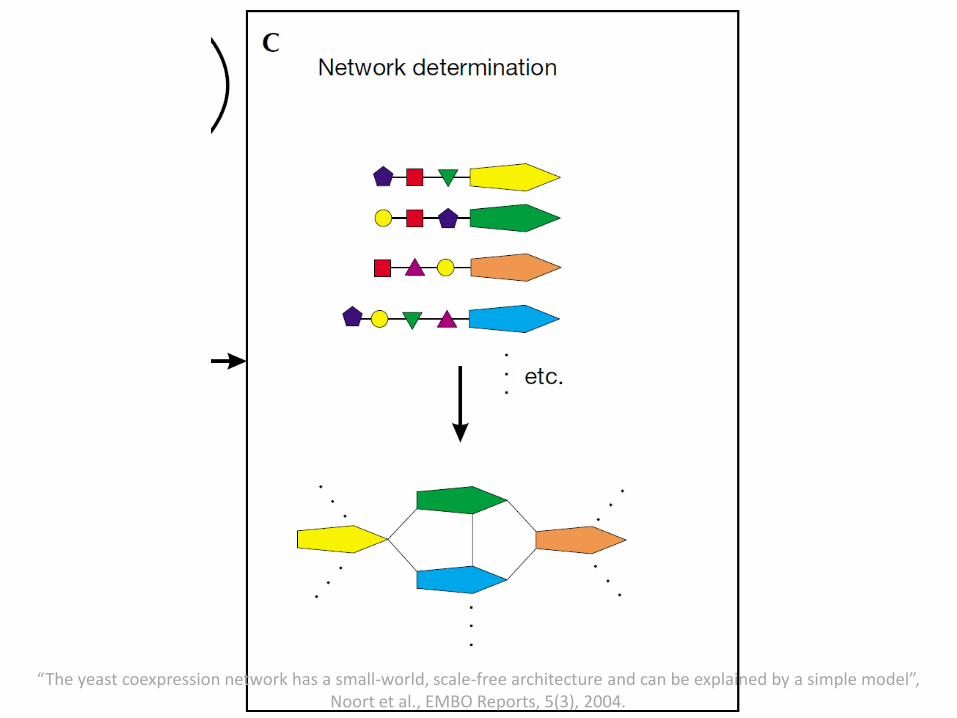
Evolutionary model of transcription regulation
(A) Initial pool of 25 genes, with random TFBSs.(B) Gene Duplication with no change in TFBS; Gene Deletion; TFBS Duplication; TFBS Deletion.(C) Construction of coexpression network by connecting genes that share TFBSs.
“The yeast coexpression network has a small-world, scale-free architecture and can be explained by a simple model”, Noort et al., EMBO Reports, 5(3), 2004.

Evolutionary model of transcription regulation
• The entities are genes that have a number of TFBSs. Connections between genes are established when they share a minimum number of TFBSs.
• Gene Duplication: At every time step, each gene has a probability of being duplicated, resulting in a new gene. In this case, the TFBSs are passed on to the duplicate gene, corresponding to a high likelihood of coexpression between recently duplicated paralogues in the experimental data.
• Gene Deletion: A gene may be deleted.• TFBS Duplication: A TFBS can be acquired from the pool of TFBSs of
all genes. The probability of obtaining a specific TFBS is proportional to its frequency in the genome, introducing connections between nonparalogous genes. New TFBSs are introduced at a low frequency.
• TFBS Deletion: All TFBSs have a probability of being deleted, giving rise to a decrease in connectivity between duplicates over time and balancing the number of TFBSs per gene.
“The yeast coexpression network has a small-world, scale-free architecture and can be explained by a simple model”, Noort et al., EMBO Reports, 5(3), 2004.

“The yeast coexpression network has a small-world, scale-free architecture and can be explained by a simple model”, Noort et al., EMBO Reports, 5(3), 2004.
“The yeast coexpression network has a small-world, scale-free architecture and can be explained by a simple model”, Noort et al., EMBO Reports, 5(3), 2004.

Degree distribution for the simulated model
“The yeast coexpression network has a small-world, scale-free architecture and can be explained by a simple model”, Noort et al., EMBO Reports, 5(3), 2004.

Comparison of degree distributions for the empirical data and simulated model
“The yeast coexpression network has a small-world, scale-free architecture and can be explained by a simple model”, Noort et al., EMBO Reports, 5(3), 2004.
