network availability kpi - office of rail and...
TRANSCRIPT

NETWORK AVAILABILITY KPI
Network Availability Reporting Suite(NARS) - Outline Technical Specification
November 2007
Prepared for: Prepared by:
Paul HadleyOffice of Rail Regulation
Steer Davies Gleave28-32 Upper GroundLondonSE1 9PD
+44 (0)20 7919 8500www.steerdaviesgleave.com


Network Availability Reporting Suite (NARS) - Outline Technical Specification
Contents
Contents Page
1. INTRODUCTION AND OBJECTIVES 3
Purpose of this document 3
Background and study objectives 3
Structure of this report 3
2. SUMMARY OF KEY PRINCIPLES AND MAIN FUNCTIONALITY 5
System role, objectives and scope 5
High level design 5
Network segmentation and reporting 6
Interfaces with existing systems 6
Required modifications to existing systems 7
Areas for development/Improvement 7
3. OVERVIEW OF NETWORK AVAILABILITY METRICS 9
Summary 9
Primary metrics 9
Secondary metrics 10
4. PASSENGER METRIC (EPJWVT) 12
Metric calculation 12
System overview 13
System outputs 13
System inputs and data dimensions 14
5. FREIGHT METRIC (TWF) 15
Metric calculation 15
System overview 15
System outputs 16
System inputs and data dimensions 17
6. UNIFIED METRIC (RR) 18
Metric calculation 18
System overview 19
System outputs 19
System inputs and data dimensions 20
7. SECONDARY METRICS 23
Rail Replacement Bus Hours (BusHRs) 23
Possession Notification by T-12 Timetable (N t-12) 23

Network Availability Reporting Suite (Nars) - Outline Technical Specification
2
Possession Notification Discount Factor (NDF) 23
Late Possession Cancellations (LPC) 24
Possessions Involving Whole Route Block (WRB) 24
Delay Minutes Due To Possession Overrun (ODM) 25
Cancellation Minutes Due To Possession Overrun (OCM) 25
System overview 26
System inputs and data dimensions 26
APPENDICES
A INDICATIVE DATABASE STRUCTURE
B DATA SYSTEMS AND CONTACT DETAILS
C GLOSSARY OF TERMS

Network Availability Reporting Suite (NARS) - Outline Technical Specification
3
1. INTRODUCTION AND OBJECTIVES
Purpose of this document
1.1 This document provides a high level functional specification for v0.1 of a NetworkAvailability KPI Reporting Suite (NARS). It provides an overview of proposedNetwork Availability KPI’s, a description of the required calculations, an outlinespecification of data required for these calculations, and an initial view on structure ofdata tables that may be required to develop a NARS database. An overview ofexternal process required to derive input parameters and interfaces with legacyIndustry Systems is also provided.
1.2 This report does not set out a detailed technical specification for the NARS. A fulltechnical specification will require direct access to legacy systems and confirmation ofthe format of available outputs which will enable refinement of data tables andcalculations. This outline technical specification assumes some data items will beavailable in the format as described, which is subject to confirmation with systemowners.
Background and study objectives
1.3 The Office of Rail Regulation (ORR) requires a measure of the impact on railwayusers of possessions causing disruption to rail services. While Network Rail alreadyproduces some possessions-related statistics on a four-weekly basis, these do notreflect their impact from the point of view of either rail operators or final customers.
1.4 Steer Davies Gleave has been commissioned by the ORR, in partnership with NetworkRail, to define a Key Performance Indicator (KPI) or group of KPIs that gives properweight to the different characteristics of possessions, in particular:
• The location and length of the route affected, recognising that any given possessionwill typically affect a much larger section of the network than that actually subjectto the engineering works; and
• Their timing, taking account of the fact that possessions during peak times willcause greater disruption to passenger services than at other times, while those atnight are likely to affect freight services disproportionately.
1.5 A key objective for the development of any such KPI was to use existing industry dataand systems as far as possible and to avoid unnecessarily complex or resource hungrycalculation processes.
Structure of this report
1.6 Section 2 of this report provides an overview of the proposed NARS includinginterfaces with existing systems and required modification
1.7 Section 3 presents the Network Availability Metrics/KPIs to be calculated
1.8 Sections 4-7 provide and outline specification for the calculation of each metric.

Network Availability Reporting Suite (Nars) - Outline Technical Specification
4
Network Availability Reporting Suite (NARS) - Outline Technical Specification
5
2. SUMMARY OF KEY PRINCIPLES AND MAIN FUNCTIONALITY
System role, objectives and scope
2.1 The purpose of the Network Availability Reporting System (NARS) is to calculate andreport Network Availability measures drawing on existing industry data, and reportingKPIs at a level of aggregation, and periodicity that allows meaningful analysis. TheNARS may be used to support the implementation of a regulated network availabilitytarget over the next control period.
2.2 Key development objectives are:
• To make the best use of existing industry data
• To develop a system that is easy to understand operate and maintain
High level design
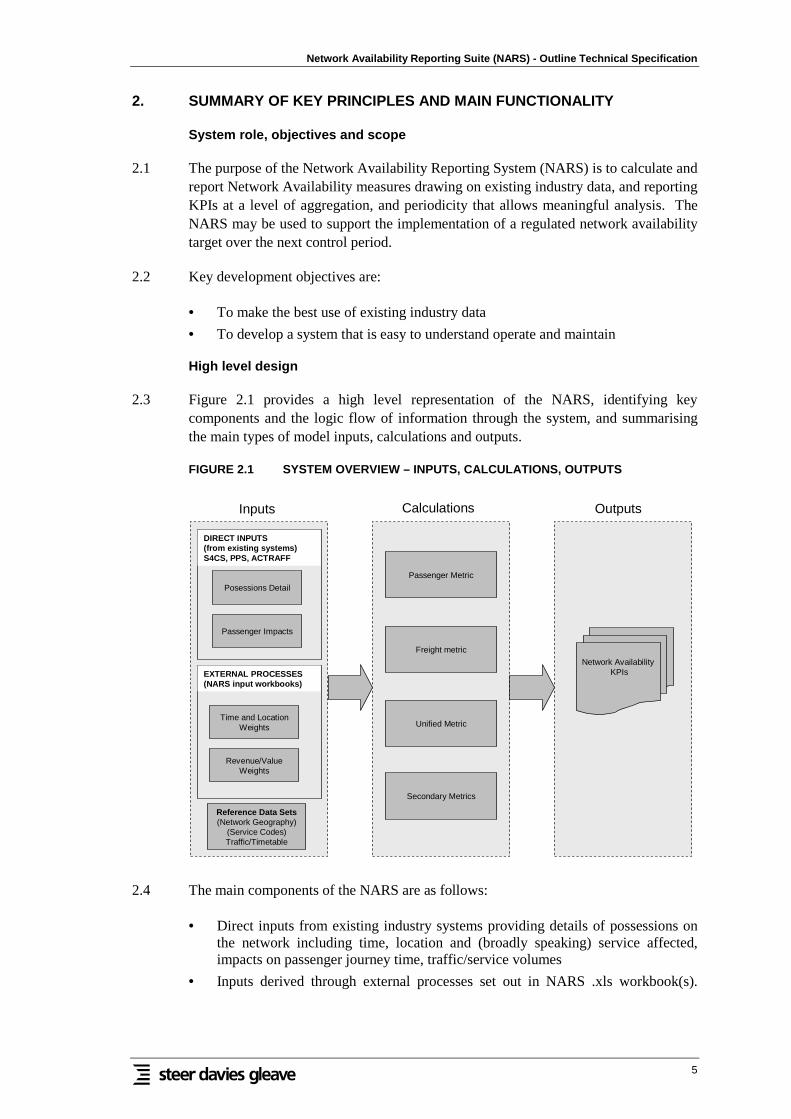
2.3 Figure 2.1 provides a high level representation of the NARS, identifying keycomponents and the logic flow of information through the system, and summarisingthe main types of model inputs, calculations and outputs.
FIGURE 2.1 SYSTEM OVERVIEW – INPUTS, CALCULATIONS, OUTPUTS
CalculationsInputs Outputs
DIRECT INPUTS(from existing systems)S4CS, PPS, ACTRAFF
EXTERNAL PROCESSES(NARS input workbooks)
Reference Data Sets(Network Geography)
(Service Codes)Traffic/Timetable
Network AvailabilityKPIs
Posessions Detail
Passenger Metric
Freight metric
Unified Metric
Secondary Metrics
Passenger Impacts
Time and LocationWeights
Revenue/ValueWeights
2.4 The main components of the NARS are as follows:
• Direct inputs from existing industry systems providing details of possessions onthe network including time, location and (broadly speaking) service affected,impacts on passenger journey time, traffic/service volumes
• Inputs derived through external processes set out in NARS .xls workbook(s).

Network Availability Reporting Suite (Nars) - Outline Technical Specification
6
These are periodically defined weights to take account of the relative impacts ofpossession on different locations on the network, at different times of day/days ofthe week and on different services.
• Reference data providing average traffic/service levels for the purposes ofnormalisation, network geography information such as track and route length andother required lookup values required for calculations or reporting.
• Internal database calculation of Primary and Secondary metrics, that may requirecreation and storage of intermediate data tables, differing by the level ofaggregation required for the outputs
• Output reports for each KPI at user selected levels of aggregation.
Network segmentation and reporting
2.5 There is a requirement to be able to report KPIs by network geography to assist inanalysis of performance of NR maintenance regions and allow comparison of therelative impacts of possessions on different operators.
2.6 The use of Strategic Route Sections was originally proposed as the basis of geographicdisaggregation. This geography is used within the NR Infrastructure Cost Model(ICM), the Industry Network Modelling Framework (NMF) and within RouteUtilisation Strategy/Strategic Business Plan publications. During development itbecame apparent that NR engineering systems do not capture data by this geography(and in particular the PPS system) and it proved difficult to find a consistent andusable mapping between geography’s, hence Engineering Line References (ELRs) areused as the basis of the network geography, and data is captured at this level. Thiscould be reviewed during detailed development.
2.7 All KPIs will be able to be reported by standard Rail Periods, or annually. Oncesufficient historical data is established, it will be possible to calculate moving averagesthat may assist in identifying trends and forecasting.
Interfaces with existing systems
2.8 As mentioned above, a key objective of the development of the NARS is to minimisecosts and resource by making use of existing systems where possible. Table 2.1 setsout proposed system interfaces. Appendix B provides a brief description of eachsystem and an industry contact for future enquiries.
TABLE 2.1 SYSTEM INTERFACES
System Information Owner
Direct Interface
Possession PlanningSystem (PPS)
Possession descriptions(time, location, curation etc)
Network Rail
Schedule 4 Costing System(S4CS)
Passenger impacts ofpossessions. Service groups
affected.Network Rail
PSS*Delay and cancellation
minutes by causation codeNetwork Rail
National Timetable Bus service hours. Network Rail
Network Availability Reporting Suite (NARS) - Outline Technical Specification
7
Database (TSDB)
Source Data
ACTRAFFNetwork Actual Traffic Data
by ELRNetwork Rail
LENNONTicket Sales Information,
Revenue by Service GroupATOC
MOIRADaily passenger demand
profilesDeltaRail
NETRAFFNetwork Planned Traffic
Data by ELRNetwork Rail
NPSPassenger journey purpose
splitsPassenger Focus
National TimetableDatabase (TSDB)
Scheduled traffic information Network Rail
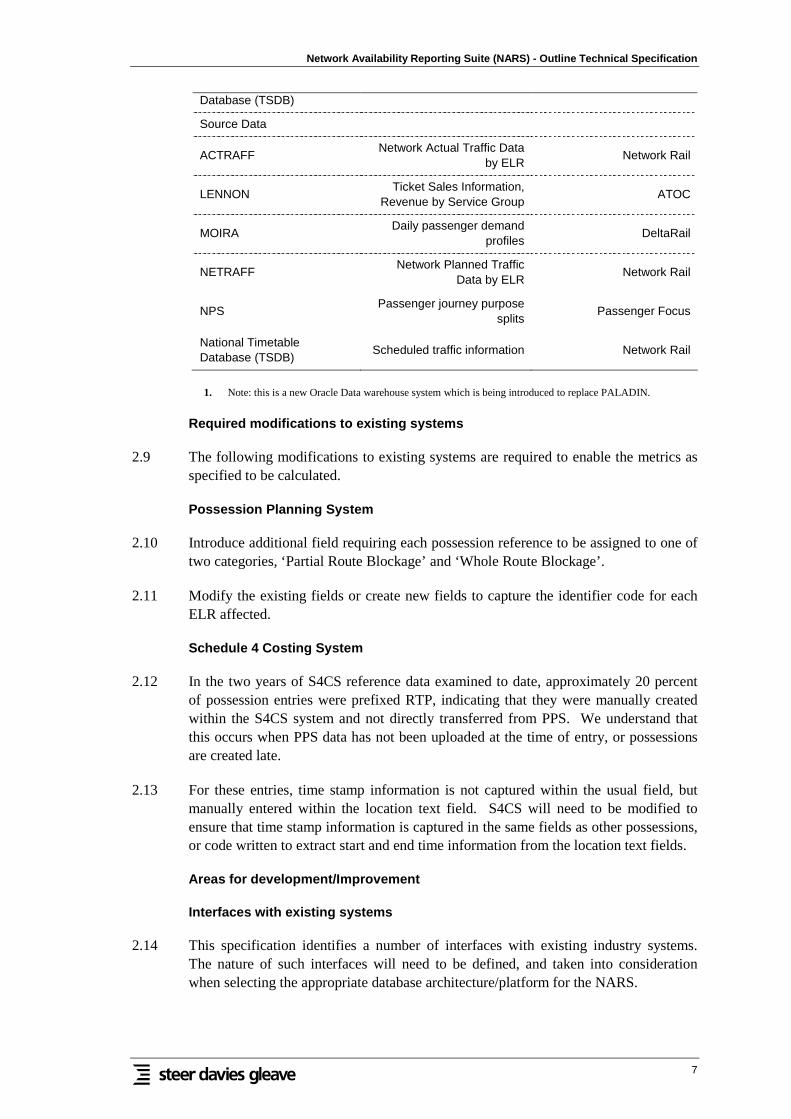
1. Note: this is a new Oracle Data warehouse system which is being introduced to replace PALADIN.
Required modifications to existing systems
2.9 The following modifications to existing systems are required to enable the metrics asspecified to be calculated.
Possession Planning System
2.10 Introduce additional field requiring each possession reference to be assigned to one oftwo categories, ‘Partial Route Blockage’ and ‘Whole Route Blockage’.
2.11 Modify the existing fields or create new fields to capture the identifier code for eachELR affected.
Schedule 4 Costing System
2.12 In the two years of S4CS reference data examined to date, approximately 20 percentof possession entries were prefixed RTP, indicating that they were manually createdwithin the S4CS system and not directly transferred from PPS. We understand thatthis occurs when PPS data has not been uploaded at the time of entry, or possessionsare created late.
2.13 For these entries, time stamp information is not captured within the usual field, butmanually entered within the location text field. S4CS will need to be modified toensure that time stamp information is captured in the same fields as other possessions,or code written to extract start and end time information from the location text fields.
Areas for development/Improvement
Interfaces with existing systems
2.14 This specification identifies a number of interfaces with existing industry systems.The nature of such interfaces will need to be defined, and taken into considerationwhen selecting the appropriate database architecture/platform for the NARS.
Network Availability Reporting Suite (Nars) - Outline Technical Specification
8
User interface
2.15 A user interface would be required to aid in operation and maintenance of the NARS,this could be web/HTML based, or via the standard interface of a software packagesuch as MS Access that may be chosen as the basis of the NARS.
Reporting suite
2.16 We have not specified the format and frequency of reports that could be generated bythe NARs. Report formats and reporting tools should be developed in conjunctionwith ORR/NR to ensure that current, and potential future requirements are met. Thespecification of outputs will to some extent drive the nature of the calculation requiredwithin the database.
NR systems under development
2.17 We are aware of initiatives within Network Rail to integrate or replace or betterintegrate existing information systems, some of which have been identified to providedata inputs within this specification. In particular, the development of TASR has beencited as a replacement/upgrade to GEOGIS and ACTRAFF/NETRAFF.
2.18 The scope of these initiatives should be understood, and opportunities explored beforefinalising a detailed specification of the NARS.
Other
2.19 Data on the possessions cancelled after issue of the Weekly Operating Notice arerequired for a proposed secondary metric (LPC). This information is currently onlyrecorded manually at area control centres. A new system will need to be designed toset out arrangements to capture this information in a way that enables the data to beaggregated in order to calculate this metric. It is not envisaged that this need beparticularly sophisticated and is likely to involve some new instructions to the relevantpersonnel together with some form of electronic pro forma to be completed andlogged centrally.
Network Availability Reporting Suite (NARS) - Outline Technical Specification
9
3. OVERVIEW OF NETWORK AVAILABILITY METRICS
Summary
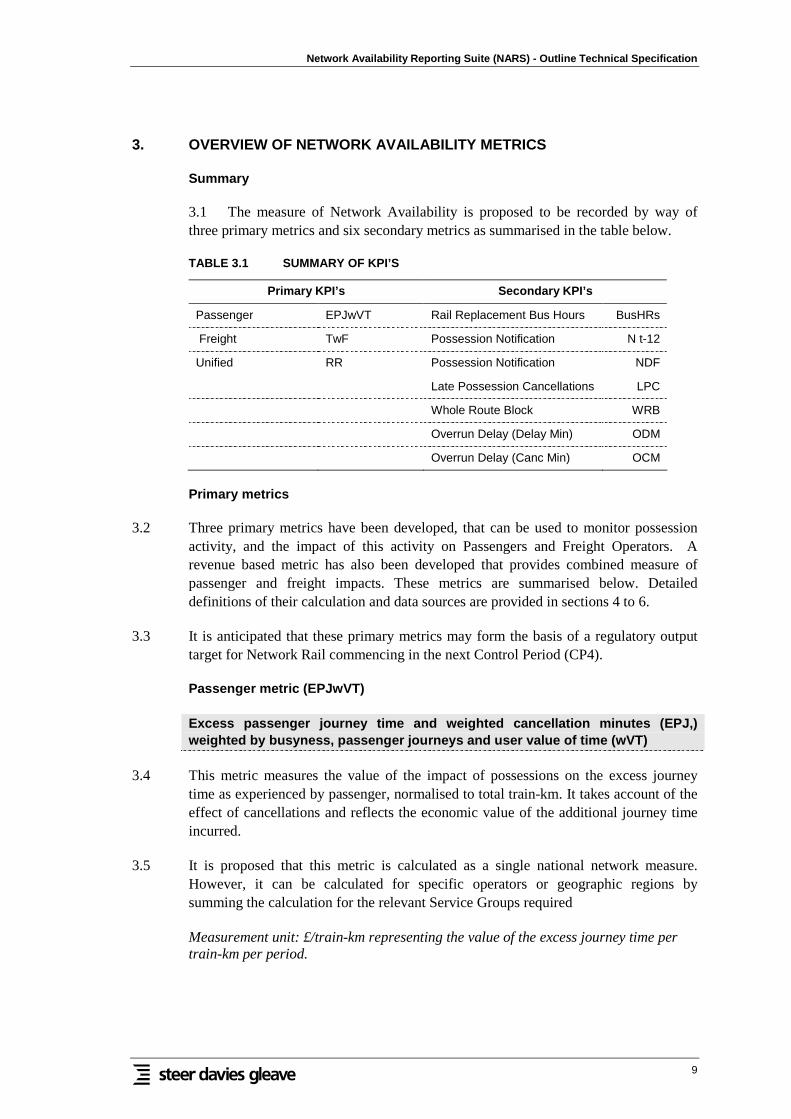
3.1 The measure of Network Availability is proposed to be recorded by way ofthree primary metrics and six secondary metrics as summarised in the table below.
TABLE 3.1 SUMMARY OF KPI’S
Primary KPI’s Secondary KPI’s
Passenger EPJwVT Rail Replacement Bus Hours BusHRs
Freight TwF Possession Notification N t-12
Unified RR Possession Notification NDF
Late Possession Cancellations LPC
Whole Route Block WRB
Overrun Delay (Delay Min) ODM
Overrun Delay (Canc Min) OCM
Primary metrics
3.2 Three primary metrics have been developed, that can be used to monitor possessionactivity, and the impact of this activity on Passengers and Freight Operators. Arevenue based metric has also been developed that provides combined measure ofpassenger and freight impacts. These metrics are summarised below. Detaileddefinitions of their calculation and data sources are provided in sections 4 to 6.
3.3 It is anticipated that these primary metrics may form the basis of a regulatory outputtarget for Network Rail commencing in the next Control Period (CP4).
Passenger metric (EPJwVT)
Excess passenger journey time and weighted cancellation minutes (EPJ,)weighted by busyness, passenger journeys and user value of time (wVT)
3.4 This metric measures the value of the impact of possessions on the excess journeytime as experienced by passenger, normalised to total train-km. It takes account of theeffect of cancellations and reflects the economic value of the additional journey timeincurred.
3.5 It is proposed that this metric is calculated as a single national network measure.However, it can be calculated for specific operators or geographic regions bysumming the calculation for the relevant Service Groups required
Measurement unit: £/train-km representing the value of the excess journey time pertrain-km per period.

10
Freight metric (FwT)
Track-km availability weighted by freight traffic level (TwF)
3.6 This metric measures the availability of track-km weighted by the level of freighttraffic operated over each ELR. The measure takes the level of non-availability byELR and applies a weighting to reflect the intensity of freight traffic scheduled overthat section on the relevant day of the week. It is calculated daily taking account of theproportion of freight traffic operating by day of the week and aggregated to give ameasure per period.
Measurement unit: Weighted percentage of track-km available per period
Unified metric (RR)
Revenue at risk (RR)
3.7 This metric aims to provide a single unified measure of Network Availability,weighted by passenger and freight user value. Given the lack of data to supportcompatible parameters for passenger and freight, a measure of ‘revenue at risk’ isproposed as a proxy for user value. It is designed to utilise available data sources.
The metric measures the average operator revenue at risk due to possessions:
Measurement unit: Weighted revenue (£) at risk per period
Secondary metrics
3.8 Seven Secondary metrics have been developed in conjunction with the primarymetrics. These secondary metrics will not form regulated targets, but are designed to:
• provide diagnostic monitors of factors relevant to operators which are not fullyreflected in the Primary Metrics;
• facilitate identification of possible underlying causes of trend;
• act as a check against any perverse behaviours that might result from strategiesdesigned to drive improvements against the Primary Metrics.
3.9 A summary of the metrics is set out below. Metrics are summarised below. Detaileddefinitions of their calculation and data sources are provided in section 7.
Rail Replacement Bus Hours (BusHRs)
3.10 This metric measures the rail replacement bus service hours operated due topossessions. It can be measured by extracting bus service hours by Service Code fromthe national timetable Train Service Database (TSDB). It will be possible to split themetric by geography or TOC by sifting by the relevant Service Code.
Measurement unit: Bus-hours per period

Network Availability Reporting Suite (NARS) - Outline Technical Specification
11
Possession Notification by T-12 Timetable (N t-12)
3.11 This metric is calculated as the number of possessions per period with a NotificationFactor discount (NFMRE) assigned in accordance with column C of Annex A to Part3 of Schedule 4 expressed as a percentage of the number of notified possessions in agiven period.
Measurement unit: Percentage of possessions per period
Possession Notification Discount Factor (NDF)
3.12 This metric records for each period the percentage of possessions falling into each ofthe three notification factor discount thresholds (NFMRE) as defined in columns C toE of Annex A to Part 3 of Schedule 4.
Measurement unit: Percentage of possessions per period for each of three values
Late Possession Cancellations (LPC)
3.13 This metric is measured as the number of possessions per period that were cancelledafter issue of the Weekly Operating Notice (WON).
Measurement unit: Percentage of possessions per period
Possessions Involving Whole Route Block (WRB)
3.14 This metric expresses the number of possessions recorded as ‘whole route blockage’as a percentage of the total number of possessions recorded in each period.
Measurement unit: Percentage of possessions per period
Delay Minutes Due To Possession Overrun (ODM)
3.15 This metric is measured as total delay minutes attributed to possession over-runs,divided by scheduled train-km, and expressed per period.
Measurement unit: Delay minutes per train-km per period
Cancellation Minutes Due To Possession Overrun (OCM)
3.16 This metric is measured as total cancellation minutes attributed to possession over-runs, divided by scheduled train-km, and expressed per period.
Measurement unit: Cancellation minutes per train-km per period

12
4. PASSENGER METRIC (EPJWVT)
Metric calculation
4.1 The measure is calculated as follows:
( ){ }∑
∑ ∑
••••+=
SGSG
SG dSGdSGdSGdSGdSG
PT
VoTToDWPASSBFWACMNREJT
EPJwVT,,,,
The first part of the measure is derived from the outputs of S4CS where:
NREJTSG,d is the average extended Journey Time per train as a result of apossession (Network Rail Restriction of Use) in respect of the relevantService Group(s) calculated daily; and
WACMSG,d is the weighted average of Cancellation Minutes per train for therelevant Service Group (s) calculated daily.
4.2 The values of NREJT and WACM are calculated as defined in Schedule 4, Part 3,paras 3.4 I and (b) respectively. These are derived from S4CS based on the valuesused to determine the Schedule 4 compensation payments to operators (i.e. a blend ofcomparisons of the Applicable Timetable with the First Working Timetable and theCorresponding Day Timetable).
4.3 The second part of the measure represents a weighting to reflect the number ofpassenger journeys affected for the relevant Service Group(s).
Individual terms are defined as follows:
BFSG, d is the busyness factor applicable to the relevant day and ServiceGroup(s), as defined as in Schedule 4, Part 3, para 3.4 (d); and
PASS SG, d is the average number of passenger journeys per day for therelevant Service Group(s) multiplied by a time of day weighting (ToDW).
Where ToDW is a pre-determined fraction representing the percentage ofpassenger journeys for the relevant Service Group during the time of day(average values for each hour of the day) and day of week (three averagevalues: for weekdays, Saturdays and Sundays) affected by the correspondingpossession.
The calculation for daily values is then aggregated for each Service Group by period.
4.4 In each case, the relevant calculation takes account of Monitoring Point weightings, asdefined in Schedule 8 of the Track Access Agreements, and hence these measuresreflect differing levels of passenger demand across individual Service Groups bylocation for the relevant day.
4.5 The aggregated daily values are then multiplied by the weighted value of time for therelevant Service Group(s) defined as follows:
Network Availability Reporting Suite (NARS) - Outline Technical Specification
13
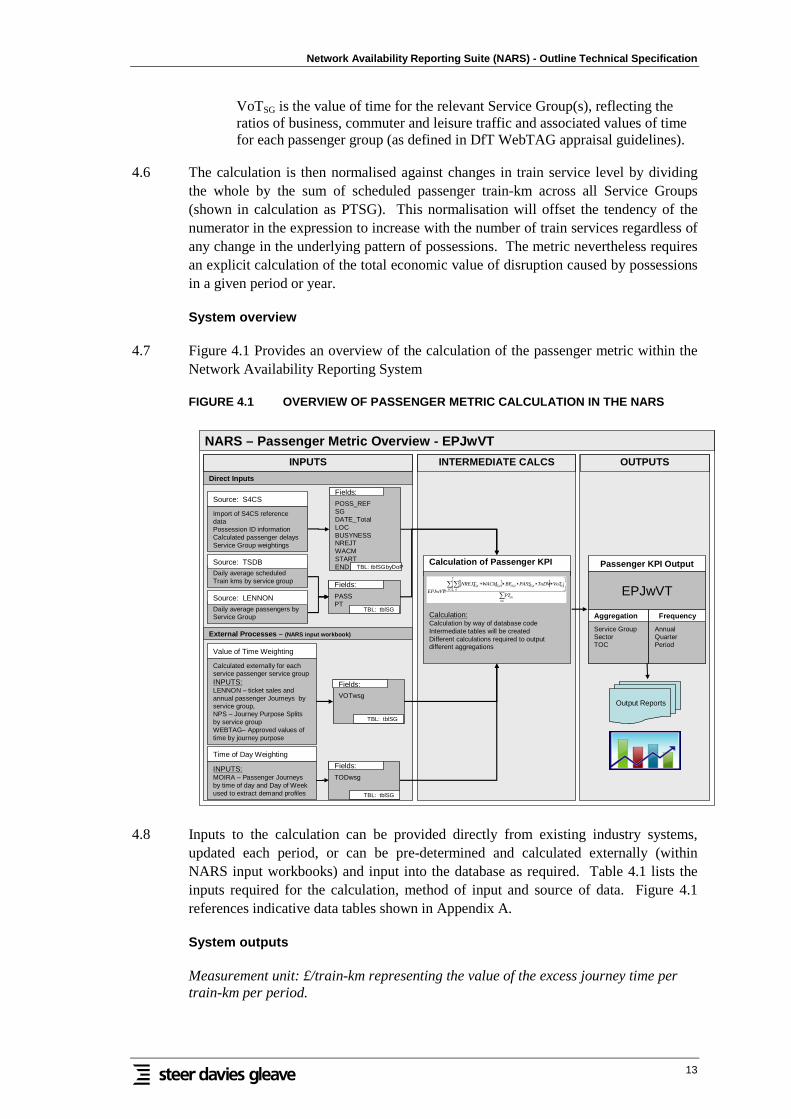
VoTSG is the value of time for the relevant Service Group(s), reflecting theratios of business, commuter and leisure traffic and associated values of timefor each passenger group (as defined in DfT WebTAG appraisal guidelines).
4.6 The calculation is then normalised against changes in train service level by dividingthe whole by the sum of scheduled passenger train-km across all Service Groups(shown in calculation as PTSG). This normalisation will offset the tendency of thenumerator in the expression to increase with the number of train services regardless ofany change in the underlying pattern of possessions. The metric nevertheless requiresan explicit calculation of the total economic value of disruption caused by possessionsin a given period or year.
System overview
4.7 Figure 4.1 Provides an overview of the calculation of the passenger metric within theNetwork Availability Reporting System
FIGURE 4.1 OVERVIEW OF PASSENGER METRIC CALCULATION IN THE NARS
INPUTS
External Processes – (NARS input workbook)
Direct Inputs
OUTPUTSINTERMEDIATE CALCS
NARS – Passenger Metric Overview - EPJwVT
POSS_REFSGDATE_TotalLOCBUSYNESSNREJTWACMSTARTEND TBL: tblSGbyDoP
Calculation of Passenger KPI
Calculation:Calculation by way of database codeIntermediate tables will be createdDifferent calculations required to outputdifferent aggregations
Passenger KPI Output
Service GroupSectorTOC
AnnualQuarterPeriod
Aggregation Frequency
EPJwVT
Fields:
VOTwsg
Fields:
TBL: tblSG
TODwsg
Fields:
TBL: tblSG
Import of S4CS referencedataPossession ID informationCalculated passenger delaysService Group weightings
Source: S4CS
Daily average passengers byService Group
Source: LENNON
Calculated externally for eachservice passenger service groupINPUTS:LENNON – ticket sales andannual passenger Journeys byservice group,NPS – Journey Purpose Splitsby service groupWEBTAG– Approved values oftime by journey purpose
Value of Time Weighting
INPUTS:MOIRA – Passenger Journeysby time of day and Day of Weekused to extract demand profiles
Time of Day Weighting
PASSPT
Fields:
TBL: tblSG
Output Reports
Daily average scheduledTrain kms by service group
Source: TSDB
( ){ }∑
∑∑
••••+=
SGSG
SG dSGdSGdSGdSGdSG
PT
VoTToDWPASSBFWACMNREJT
EPJwVT,,,,
4.8 Inputs to the calculation can be provided directly from existing industry systems,updated each period, or can be pre-determined and calculated externally (withinNARS input workbooks) and input into the database as required. Table 4.1 lists theinputs required for the calculation, method of input and source of data. Figure 4.1references indicative data tables shown in Appendix A.
System outputs
Measurement unit: £/train-km representing the value of the excess journey time pertrain-km per period.

14
4.9 This metric can be calculated as a single network wide value, or calculated forindividual service groups and output by Service Group, Operator or Sector.
4.10 Outputs can be calculated on an annual basis or per period.
4.11 A moving annual average aggregated at a Network level is proposed.
System inputs and data dimensions
4.12 Table 4.1 below summarises the inputs required for this metric and the source
TABLE 4.1 INPUT DATA
Element Dimensions DescriptionSource
Data
NREJTSG,d
Possession
DayDirect Input S4CS
WACMSG,d
Possession
DayDirect Input S4CS
BFSG, d
Service Group
DayDirect Input S4CS
PASS SG, d
Service Group
Day
Daily average of annual passengers per ServiceGroup derived from LENNON
LENNON
ToDW
Service Group
Day
Percentage of passenger journeys for the relevantService Group during the time of day and day ofweek affected by the corresponding possession.These weightings will be determined by distributionprofiles of passenger journeys for each ServiceGroup derived from MOIRA.
MOIRA
VoTSG
Service Group Predefined Input - Calculated in external module
The value of time as defined in DfT AppraisalGuidance (WebTAG) is weighted by journeypurpose (Business:Commuter:Leisure) for therelevant Service Group.
The split by journey purpose is determined fromNPS survey data which provides the split byjourney purpose and ticket type for each TOC.
The values for each TOC are then weighted to givevalues for each Service Group using the relativeproportion of tickets sold by type for each ServiceGroup (derived from LENNON) and applying thejourney purpose/ticket type ratio for the relevantTOC.
WebTAG
NPS
LENNON
PT SG
Service Group Periodic average of total annual scheduledpassenger train-km across all Service Groups. This can be derived from NETRAFF or S4CS.
NETRAFF
S4CS

Network Availability Reporting Suite (NARS) - Outline Technical Specification
15
5. FREIGHT METRIC (TWF)
Metric calculation
5.1 The measure is calculated as follows:
( )
( )
•
•
−=
∑ ∑
∑ ∑
ELR ddELRdELR
ELR ddELRdELR
FTWTT
FTWTU
TwF
,,
,,
1
Where:
TUELR,d is the track-km hours unavailable due to possessions for the relevantELR on the relevant day;
TTELR,d is the total track-km hours for the relevant ELR for the relevant day;
FTWELR,d is freight traffic weighting1, calculated as:
∑∑=
ELR ddELR
dELRdELR DwFT
DwFTFTW
,
,,
Where:DwFTELR is the average freight train movements per day attributed to arelevant ELR. The value is then weighted by the proportion of freight trainsoperated for the relevant day of the week for that ELR (such that the sum ofthe weightings for the seven days Sunday to Saturday would equal 1).
5.2 The values of DwFTELR,d would be pre-determined as a fixed input, although thesecould be updated from time to time to reflect changes in freight traffic flows.
System overview
5.3 Figure 4.1 Provides an overview of the calculation of the freight metric within theNetwork Availability Reporting System
1 Note that the value of FTWELR,d varies by ELR and day, and is multiplied by the corresponding value of TUELR,d orTTELR,d, as appropriate, before the summation across days and ELRs is applied.

16
FIGURE 5.1 OVERVIEW OF FREIGHT METRIC CALCULATION IN THE NARS
OUTPUTSINTERMEDIATE CALCS
NARS – Freight Metric Overview - FwT
Calculation:Calculation by way of database codeWill involve the creation of intermediatetables differing by aggregation
TUsg, TT calculated internallyPotential to add a single line workingweighting if PPS is modified
Calculation of Freight KPI
INPUTS
External Processes – (NARS input workbook)
Direct Inputs
POSS_REFDATE (day)SGLOCSTARTEND
TBL:tbl PPS
Fields:
FTW
Fields:
TBL: tblELR
Import reference data directlyfrom PPS for all possessionsto capture freight impacts
Source: PPS
Network Infrastructure
Information – ELR track and
route length
Source: ACTRAFF
Weigtings based on trafficvolumes calculated for each ELRby time of day – potential toextend this to traffic typeINPUTS:ACTRAFF – Number of trains byELR by time of day
Freight Traffic Weighting
TT
Fields:
TBL: tblELR
Output Reports
FOCSGELR
AnnualQuarterPeriod
Aggregation Frequency
FwT
Passenger KPI Output( )
( )
•
•
−=
∑ ∑
∑ ∑
ELR ddELRdELR
ELR ddELRdELR
FTWTT
FTWTU
TwF
,,
,,
1
5.4 Inputs to the calculation can be provided directly from existing industry systems,updated each period, or can be pre-determined and calculated externally (withinNARS input workbooks) and input into the database as required. Table 5.1 lists theinputs required for the calculation, method of input and source of data. Figure 5.1references indicative data tables shown in Appendix A.
System outputs
Measurement unit: Weighted percentage of track-km available per period
5.5 It is proposed that this metric is calculated as a single national network measure.However, it can be calculated by geographic regions by summing the calculation forthe relevant ELRs as required. It could also be calculated for specific operators bysifting the traffic level weighting (DwFTELR) to only include the relevant FOCs.
5.6 It could also be calculated by commodity type. However, this would require asignificant level of data sorting with data from ACTRAFF in order to aggregate fromaround 1000 commodity codes to an appropriate number of generic commodities.
5.7 Outputs can be calculated on an annual basis or per period.
5.8 A moving annual average aggregated at a Network level is proposed.
Network Availability Reporting Suite (NARS) - Outline Technical Specification
17
System inputs and data dimensions
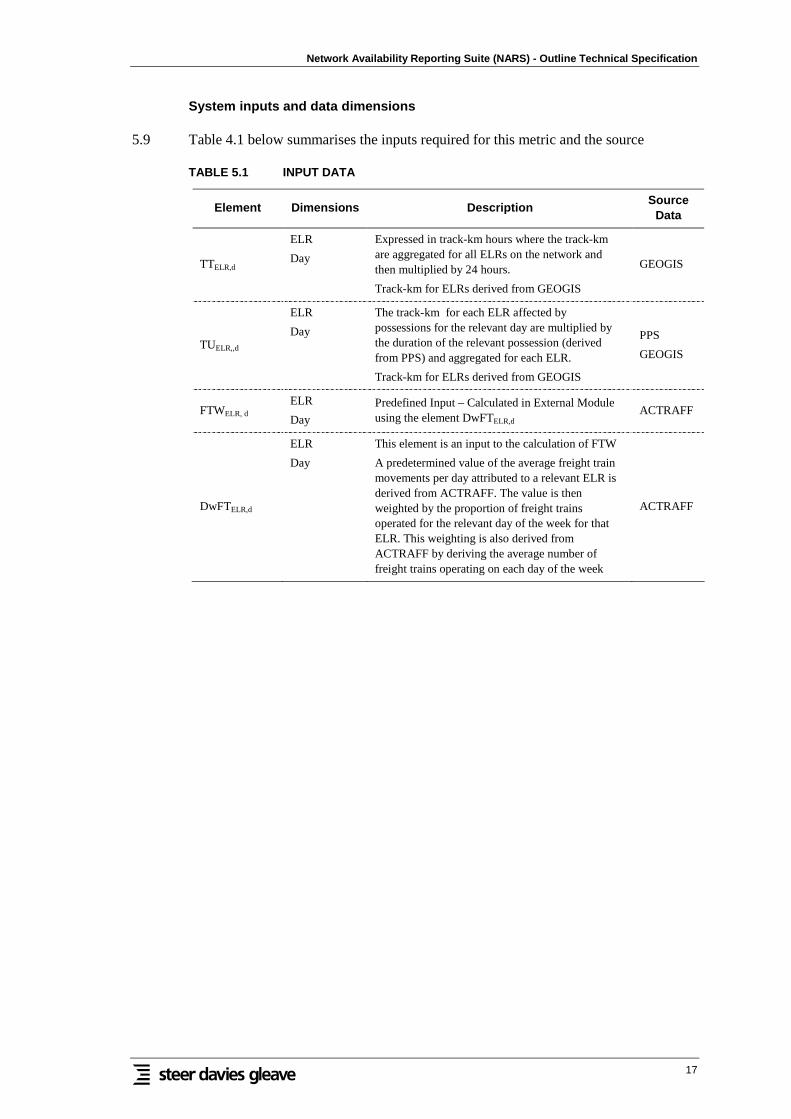
5.9 Table 4.1 below summarises the inputs required for this metric and the source
TABLE 5.1 INPUT DATA
Element Dimensions DescriptionSource
Data
TTELR,d
ELR
Day
Expressed in track-km hours where the track-kmare aggregated for all ELRs on the network andthen multiplied by 24 hours.
Track-km for ELRs derived from GEOGIS
GEOGIS
TUELR,,d
ELR
Day
The track-km for each ELR affected bypossessions for the relevant day are multiplied bythe duration of the relevant possession (derivedfrom PPS) and aggregated for each ELR.
Track-km for ELRs derived from GEOGIS
PPS
GEOGIS
FTWELR, d
ELR
Day
Predefined Input – Calculated in External Moduleusing the element DwFTELR,d
ACTRAFF
DwFTELR,d
ELR
Day
This element is an input to the calculation of FTW
A predetermined value of the average freight trainmovements per day attributed to a relevant ELR isderived from ACTRAFF. The value is thenweighted by the proportion of freight trainsoperated for the relevant day of the week for thatELR. This weighting is also derived fromACTRAFF by deriving the average number offreight trains operating on each day of the week
ACTRAFF

18
6. UNIFIED METRIC (RR)
Metric calculation
6.1 The measure is calculated as follows:
{ }∑ ∑
•=ELR d
dELRdELR RWTURR ,,
Where:TUELR d is the possession track-km-hours calculated daily for the relevantELR;
RWELR,d is the weighted revenue at risk for the relevant ELR and the relevantday, calculated as:
dELR
dELRdELRdELR TT
RPRFRW
,
,,,
+=
RFELR,d is the average daily freight revenue at risk for the relevant ELR;
RPELR,d is the average daily passenger revenue at risk for the relevant ELR;and.
TTELR is the total track-km for the relevant ELR multiplied by the hours perday.
RFELR,d is calculated as follows:
RFELR = RFT ���� FTELR,d
Where:RFT is the average revenue per freight train-km; and
FTELR,d is the average freight train-km weighted by day of week for therelevant ELR and relevant day. The day of week weighting is calculated as the% of average weekly freight trains operated on the relevant ELR for therelevant day of week.
RPELR is calculated as follows:
[ ]∑ •=SG
dELRSGSGdELR PTRPTRP ,,,
Where:RPTSG is the average daily revenue per passenger train-km for the relevantService Group; and
PTSG,,ELR,d is the average daily passenger train-km for the relevant ELRweighted by day of week for the relevant Service Group. The day of weekweighting is calculated as the % of average weekly passenger trains operatedon the relevant ELR for the relevant day of week.
6.2 The values of RFT, FTELR,d, RPTSG, PTSG,ELR,d and THSRS would be pre-determined asfixed inputs, although again these could be updated from time to time to reflectchanges in freight and passenger traffic flows.

Network Availability Reporting Suite (NARS) - Outline Technical Specification
19
6.3 Again, time of day profiles discussed in the context of the previous two measurescould be used to further refine the metric. These will be investigated further as part ofthe more detailed technical specification of the unified metric.
System overview
6.4 Figure 6.1 Provides an overview of the calculation of the unified metric within theNetwork Availability Reporting System.
FIGURE 6.1 OVERVIEW OF UNIFIED METRIC CALCULATION IN THE NARS
OUTPUTSINTERMEDIATE CALCS
NARS – Unified Metric Overview – Revenue at Risk RR
Calculation:Calculation by way of database codeWill involve the creation of intermediatetables differing by aggregation TUcalculated internally
Potential to refine freight revenueweightings to take account of the value ofcommodity carried.
Calculation of Unified KPI
INPUTS
External Processes – (NARS input workbook)
Direct Inputs
POSS_REFDATE (day)SGLOCSTARTEND
TBL:tbl PPS
Fields:
RW
Fields:
TBL: tblELR
Import reference data directlyfrom PPS for all possessionsto capture freight impacts
Source: PPS
Network Infrastructure
Information – ELR track and
route length
Source: ACTRAFF
Weighted revenue at risk fromloss of service by ELR. Derivedfrom passenger and freightrevenue and activity informationINPUTS:ACTRAFF – number of trains byELR by time of dayTrain Kms by ELR (passengerand FreightLENNON – average revenue byService Group.Annual freight revenue data
Weighted Revenue at Risk
TT
Fields:
TBL: tblELR
Output Reports
ELR AnnualQuarterPeriod
Aggregation Frequency
RR
Unified KPI Output
{ }∑ ∑
•=ELR d
dELRdELR RWTURR ,,
6.5 Inputs to the calculation can be provided directly from existing industry systems,updated each period, or can be pre-determined and calculated externally (withinNARS input workbooks) and input into the database as required. Table 6.1 lists theinputs required for the calculation, method of input and source of data. Figure 4.1references indicative data tables shown in Appendix A.
System outputs
Measurement unit: Weighted revenue (£) at risk per period
6.6 It is proposed that this metric is calculated as a single national network measure.However, it can be calculated by geographic regions by summing the calculation forthe relevant ELRs as required.
6.7 It is not considered practical or meaningful to calculate this metric for specificoperators.
6.8 Outputs can be calculated on an annual basis or per period.

20
6.9 A moving annual average aggregated at a Network level is proposed.
System inputs and data dimensions
6.10 Table 6.1 below summarises the inputs required for this metric and the source.
TABLE 6.1 INPUT DATA
Element Dimensions Description Source Data
TTELR,d
ELR
Day
Expressed in track-km hours where the track-kmare aggregated for all ELRs on the network andthen multiplied by 24 hours.
Track-km for ELRs derived from GEOGIS
GEOGIS
TUELR,,d
ELR
Day
The track-km for each ELR affected bypossessions for the relevant day are multipliedby the duration of the relevant possession(derived from PPS) and aggregated for eachELR.
Track-km for ELRs derived from GEOGIS
PPS
GEOGIS
RWELR,,d
ELR
Day
Weighted revenue at risk for each ELR derivedfrom the inputs below As below
INPUTS to RWELR,,d (Calculated externally)
RFELR,,dELR, Day Average daily freight revenue at risk calculated
from RFT and FTELR,dAs below
RFT
RFT is the calculated from an estimatedaggregate national rail freight revenue (whichcould be sourced from the FOC publishedaccounts) divided by annual national freighttonne-km derived from NETRAFF.
FOC publishedannual accounts
NETRAFF
FTELR,d
ELR, day A predetermined value of the average freighttrain-km per day attributed to a relevant ELRcalculated by multiplying the number of freighttrains operated per ELR (derived fromACTRAFF) by the route length of the relevantELR (derived from GEOGIS). The product isthen weighted by the % of freight trainsoperated for the relevant ELR by day of week.This ratio is also derived from ACTRAFF.
ACTRAFF
GEOGIS
RPELR,dELR, Day Average daily passenger revenue at risk
calculated from RPTSG and PTSG,ELR,dAs below
RPTSG
SG Average daily revenue per passenger train km.
Average daily revenue by Service Groupderived from LENNON
Average daily scheduled passenger train-km byService Group can derived for the currenttimetable by SG from S4CS
LENNON
S4CS
Network Availability Reporting Suite (NARS) - Outline Technical Specification
21
Element Dimensions Description Source Data
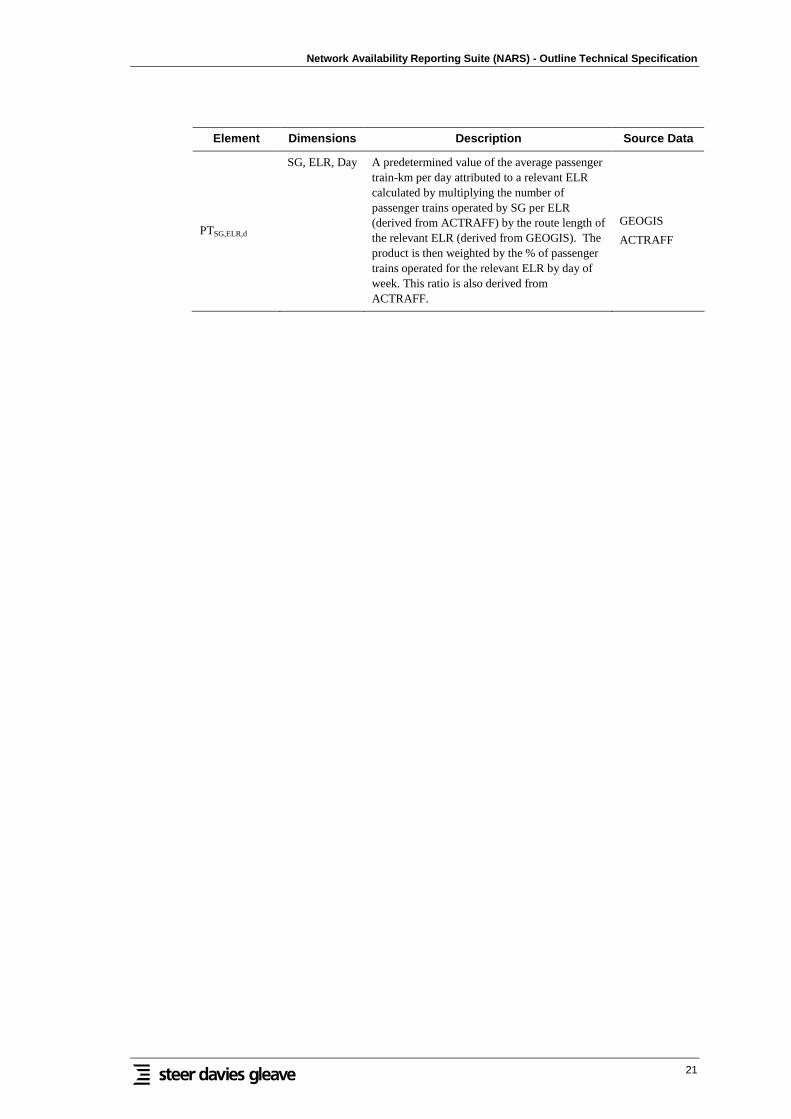
PTSG,ELR,d
SG, ELR, Day A predetermined value of the average passengertrain-km per day attributed to a relevant ELRcalculated by multiplying the number ofpassenger trains operated by SG per ELR(derived from ACTRAFF) by the route length ofthe relevant ELR (derived from GEOGIS). Theproduct is then weighted by the % of passengertrains operated for the relevant ELR by day ofweek. This ratio is also derived fromACTRAFF.
GEOGIS
ACTRAFF

22

Network Availability Reporting Suite (NARS) - Outline Technical Specification
23
7. SECONDARY METRICS
Rail Replacement Bus Hours (BusHRs)
Measurement unit: Bus-hours per period
7.1 Bus service hours are derived each period for each TOC by the relevant ‘BR’ code forrail replacement bus service as contained in train plan within the TSDB. The bus-hours for each service listed is calculated by subtracting the scheduled departure timefrom the scheduled arrival time and aggregating by TOC. It should be noted that notall rail replacement bus services are identifiable by a ‘BR’ code, however we believethese to be relatively few and therefore should not materially affect the overallmeasure.
Possession Notification by T-12 Timetable (N t-12)
Measurement unit: Percentage of possessions per period
7.2 The metric is calculated as the number of possessions per period with a NotificationFactor discount (NFMRE) assigned in accordance with column C of Annex A to Part3 of Schedule 4 expressed as a percentage of the number of notified possessions in agiven period.
7.3 The number of qualifying possessions and total number of notified possessions can besourced from S4CS.
7.4 This metric can be expressed at a national network level or disaggregated by TOC bysifting by the data by the relevant Service Groups. The data can also be arranged togive a comparison between days of the week (e.g. weekday/Saturday/Sunday).
7.5 It would also be possible to disaggregate by network geography down to ELR but thiswould require ELR references to be additionally imported to S4CS or separatelyextracted from PPS by way of relevant possession reference codes.
7.6 It is not proposed to include freight services within this metric, since robustnotification data is only obtainable from S4CS which does not include freight services.
Possession Notification Discount Factor (NDF)
Measurement unit: Percentage of possessions per period for each of three values
7.7 This metric would record for each period the percentage of possessions falling intoeach of the three notification factor discount thresholds (NFMRE) as defined incolumns C to E of Annex A to Part 3 of Schedule 4 corresponding with the followingthresholds:
• In first working timetable
• In T-12 working timetable
• Later than T-12 working timetable
24
The number of possessions falling into each NFMRE category can be derived fromS4CS.
7.8 This metric could be reported by Operator or Sector by sifting the S4CS possessiondata by the relevant Service Groups.
7.9 It would also be possible to disaggregate by network geography down to ELR but thiswould require ELR references to be additionally imported to S4CS or separatelyextracted from PPS by way of relevant possession reference codes.
7.10 It is not proposed to include freight services within this metric, since robustnotification data is only obtainable from S4CS which does not include freight services.
Late Possession Cancellations (LPC)
Measurement unit: Percentage of possessions per period
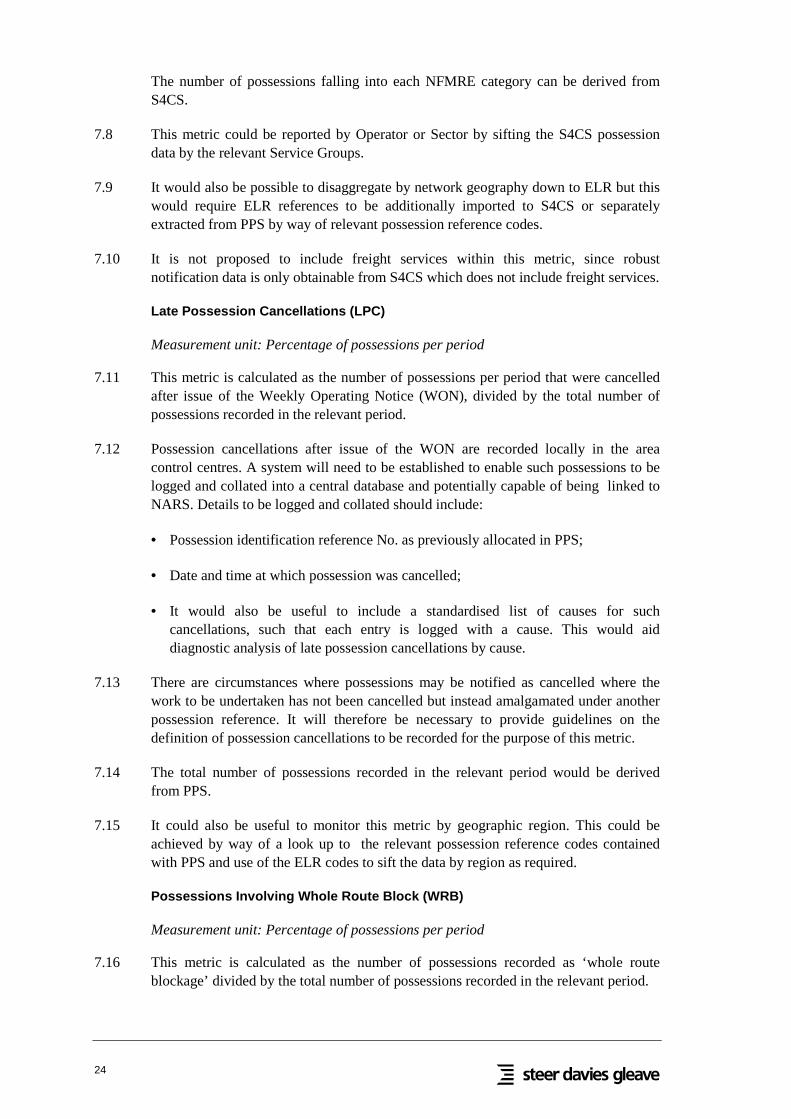
7.11 This metric is calculated as the number of possessions per period that were cancelledafter issue of the Weekly Operating Notice (WON), divided by the total number ofpossessions recorded in the relevant period.
7.12 Possession cancellations after issue of the WON are recorded locally in the areacontrol centres. A system will need to be established to enable such possessions to belogged and collated into a central database and potentially capable of being linked toNARS. Details to be logged and collated should include:
• Possession identification reference No. as previously allocated in PPS;
• Date and time at which possession was cancelled;
• It would also be useful to include a standardised list of causes for suchcancellations, such that each entry is logged with a cause. This would aiddiagnostic analysis of late possession cancellations by cause.
7.13 There are circumstances where possessions may be notified as cancelled where thework to be undertaken has not been cancelled but instead amalgamated under anotherpossession reference. It will therefore be necessary to provide guidelines on thedefinition of possession cancellations to be recorded for the purpose of this metric.
7.14 The total number of possessions recorded in the relevant period would be derivedfrom PPS.
7.15 It could also be useful to monitor this metric by geographic region. This could beachieved by way of a look up to the relevant possession reference codes containedwith PPS and use of the ELR codes to sift the data by region as required.
Possessions Involving Whole Route Block (WRB)
Measurement unit: Percentage of possessions per period
7.16 This metric is calculated as the number of possessions recorded as ‘whole routeblockage’ divided by the total number of possessions recorded in the relevant period.

Network Availability Reporting Suite (NARS) - Outline Technical Specification
25
7.17 Both values will be derived from PPS.
7.18 This metric will require inclusion of an additional field introduced into PPS such thateach possession is recorded as a ‘partial route blockage’ or a ‘whole route blockage’.
7.19 Guidelines will need to be provided to ensure clarity of the definition of ‘whole routeblockage’. The intent is to reflect possessions where no trains are able to operate overthe section of route within the immediate vicinity of the possession.
7.20 It will be possible to disaggregate by network geography by sifting the PPS possessiondata by the relevant ELR codes.
7.21 It could also be possible to disaggregate by operator by way of an ELR – operatorreference table. This would enable a sift of the PPS possession data by the relevantELR codes.
Delay Minutes Due To Possession Overrun (ODM)
Measurement unit: Delay minutes per train-km per period
7.22 This metric is measured as total delay minutes attributed to possession over-runs,divided by scheduled train-km, and expressed per period.
7.23 The delay minutes are derived from delay data recorded within PSS and can beextracted as delay minutes attributed to the Delay Causation Code (I5) for possessionoverruns.
7.24 The weighting by train-km is applied to normalise against changes in the level ofservices scheduled. Train-km per period per period can be derived for the relevantTOC/FOCs from NETRAFF.
7.25 The metric can be reported at a national level or by operator or geography down toStrategic Route Section by sifting the appropriate reference codes held within PSS.
Cancellation Minutes Due To Possession Overrun (OCM)
Measurement unit: Cancellation minutes per train-km per period
7.26 This metric is measured as total cancellation minutes attributed to possession over-runs, divided by scheduled train-km, and expressed per period.
7.27 The cancellation minutes, as defined in the relevant Track Access Agreements, arederived from delay data recorded within PSS and can be extracted as cancellationminutes attributed to the Delay Causation Code (I5) for possession overruns.
7.28 The weighting by train-km is applied to normalise against changes in the level ofservices scheduled. Train-km per period per period can be derived for the relevantTOC/FOCs from NETRAFF.
7.29 The metric can be reported at a national level or by operator or geography by siftingthe appropriate reference codes held within PSS.

26
System overview
7.30 Figure 7.1 Provides an overview of the calculation of the Secondary metrics within theNetwork Availability Reporting System.
FIGURE 7.1 OVERVIEW OF SECONDARY METRIC CALCULATION IN THE NARS
OUTPUTSINTERMEDIATE CALCS
NARS – Secondary Metrics Overview
Limited calculation necessary from rawdata.
Data reported out at the level ofaggregation required in a format/reportconsistent with other metrics. (ie, byPeriod, Service Group, TOC, Region etc)
Some normalisations applied to data toallow comparison across years.(Data drawn from existing tables withindata base)
Calculation of Secondary Metrics
INPUTS
External Processes – (NARS input workbook)
Direct Inputs
NFmre
TBL:tblPbySGbyD
Fields:
LPC
Fields:
TBL: tbl Network
Rail Replacement Bus Hours
per period by RB code by
service code
Source: TSDB
New NR procedure to capturelate cancellations from weeklycontrol centre logs
Late Cancellations
BusHrsarv
BusHrsdpt
Fields:
TBL: tblSG
Output Reports
PdSG/TOCRegion(ELR)
AnnualQuarterPeriod
Aggregation Frequency
BusHRsN t-12NDFWRBODMOCMLPC
Secondary Metrics Output
Notification factors forpossessions impactingpassenger services
Source: S4CS
Delay and cancellation mins by
period by causation code (I5)
Source: PSS
DMCM
Fields:
TBL: tblSG
Possession details including
Single Line Working/Whole
Route Block Flag
Source: PPS
WLB
Fields:
TBL: tblPoss
System inputs and data dimensions
7.31 Table 7.1 below summarises the inputs required for the Secondary metrics and thesource data.
TABLE 7.1 INPUT DATA
Metric Element Dimensions Description Source Data
BusHRs
Bus-hoursper period
Period
ServiceGroup
Bus service hours derived eachperiod for each TOC by the relevant‘BR’ code for rail replacement busservice.
TSDB
N t-12
NFMRE Period
ServiceGroup
The number of possessions fallinginto the relevant NFMRE categorycan be derived from S4CS.
The total number of possession inthe relevant period can also bederived from S4CS.
S4CS
NDF
NFMRE Period
ServiceGroup
The number of possessions fallinginto each NFMRE category can bederived from S4CS.
S4CS

Network Availability Reporting Suite (NARS) - Outline Technical Specification
27
LPC
Cancelledpossessions
Period
ELR
The number of possessionscancelled after issue of the WONsourced from data logged locally atarea control centres.
The total number of possession inthe relevant period can also bederived from PPS.
New systemrequired
PPS
WRB
‘WholeRouteBlockage’
Period
ELR
The number of possessions recordedas ‘Whole Route Blockage’ dividedby total number of possessionsrecorded in relevant period. Bothvalues to be derived from PPS.
PPS
ODM
delayminutes
Period
ServiceGroup
Operator
The delay minutes derived fromdelay data recorded within PSS andcan be extracted as delay minutesattributed to the causation code (I5)for possession overruns.
PSS
ODMTrain-km Operator Train-km per period per period can
be derived for the relevantTOC/FOCs from NETRAFF
NETRAFF
OCM
cancellationminutes
Period
ServiceGroup
Operator
The delay minutes derived fromdelay data recorded within PSS andcan be extracted as delay minutesattributed to the causation code (I5)for possession overruns.
PSS
OCMTrain-km Operator Train-km per period per period can
be derived for the relevantTOC/FOCs from NETRAFF
NETRAFF


Network Availability Reporting Suite (NARS) - Outline Technical Specification
Appendix
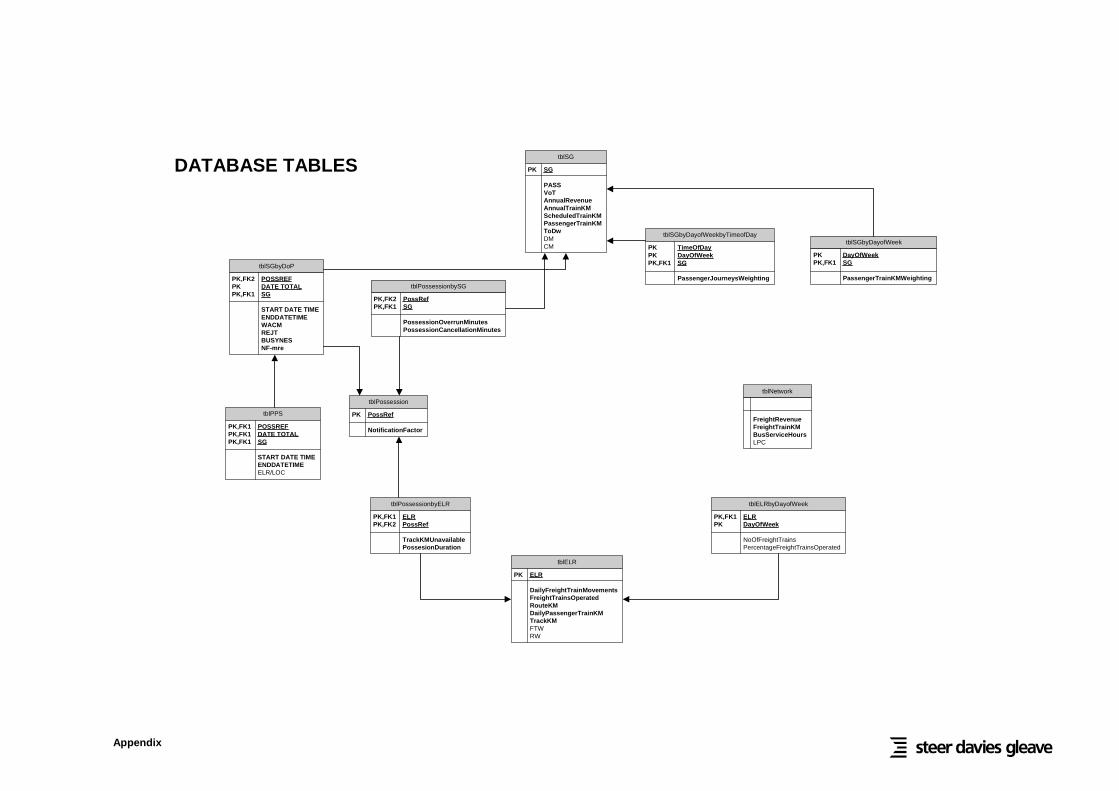
APPENDIX A
INDICATIVE DATABASE STRUCTURE


Appendix
SECONDARY KPI’S
PRIMARY KPI’S
DIRECT INPUTS(UPDATED EACH PERIOD)
PREDEFINED INPUTS(UPDATED AS REQUIRED)
KPI DATABASE
NETWORK AVAILABILITY REPORTING SYSTEM (NARS) OVERVIEW
S4CSNREJT; WACM; BUSYNES;POSS-REF; DATE TOTAL;
START DATE TIME;ENDDATETIME; NF-mre;
PPS(Possession Planning System
Possession information perperiod
EPJwVT(Passenger)
FwT(Freight)
RR(Unified)
BusHRs(Rail Replacement
Bus Hours)
N t-12(PossessionNotification)
NDF(NotificationDiscount)
WRB(Whole Route
Blocks)
ODMOverrun Delay
Minutes
OCM(Overrun
Cancellation Mins)
National TrainService Database
(TSDB)Bus service hours by Service
Code
Import Application
(may require manual upload of data)
MOIRAPassenger demand bytime of day by service
group
Input Data Table
Input Data Table
Lookup/ReferenceTables
Results ofIntermediateCalculations
NREJT
VoTWsg
ToDWsg
EXTERNAL PROCESSESCalculation of Weightings
Output TablesHistoric Data
LENNONAnnual passenger
journeys by ticket typeand Service Code
WebTAGApproved Value of Timeby rail journey purpose
NPSAnnual journeys by
purpose by TOC
ACTRAFFAnnual traffic info by ELR
by Service Group
Reference DataRoute and track length by
ELR, TOC code references,period dates etc from variossources, NF Lookup tables
GEOGIS/ACTRAFF
Value of Time Weights(Passenger Metric)
Time of Day Weights(Passenger Metric)
Revenue and ActivityWeights
(Freight/ Unified Metric
Prepare Reference DataTables
DwFT
FOC accountsAggregate national rail
freight revenue
PSSPossession Overruns and
Cancellation Mins by ServiceGroup
NETRAFFAnnual traffic info by ELR
by Service Group
FTWelr
RWelr
WACM
BF
NF-mre
Date Total
STARTTIME:DATE
ENDTIME:DATE
POSS REF
LPC(Late
Cancellations)
SG
PTSG
RF
RP
TT
RFT
RPT
PT
Secondary MetricData
RoTR
BusHRs
WRB flag
Overun DM
Canc DM
WONCancellations
Appendix
tblSGbyDoP
PK,FK2 POSSREFPK DATE TOTALPK,FK1 SG
START DATE TIMEENDDATETIMEWACMREJTBUSYNESNF-mre
tblSG
PK SG
PASSVoTAnnualRevenueAnnualTrainKMScheduledTrainKMPassengerTrainKMToDwDMCM
tblSGbyDayofWeekbyTimeofDay
PK TimeOfDayPK DayOfWeekPK,FK1 SG
PassengerJourneysWeighting
tblNetwork
FreightRevenueFreightTrainKMBusServiceHoursLPC
tblPossessionbyELR
PK,FK1 ELRPK,FK2 PossRef
TrackKMUnavailablePossesionDuration
tblELR
PK ELR
DailyFreightTrainMovementsFreightTrainsOperatedRouteKMDailyPassengerTrainKMTrackKMFTWRW
tblELRbyDayofWeek
PK,FK1 ELRPK DayOfWeek
NoOfFreightTrainsPercentageFreightTrainsOperated
tblSGbyDayofWeek
PK DayOfWeekPK,FK1 SG
PassengerTrainKMWeighting
tblPossession
PK PossRef
NotificationFactor
tblPossessionbySG
PK,FK2 PossRefPK,FK1 SG
PossessionOverrunMinutesPossessionCancellationMinutes
DATABASE DIAGRAM
tblPPS
PK,FK1 POSSREFPK,FK1 DATE TOTALPK,FK1 SG
START DATE TIMEENDDATETIMEELR/LOC
DATABASE TABLES

Appendix
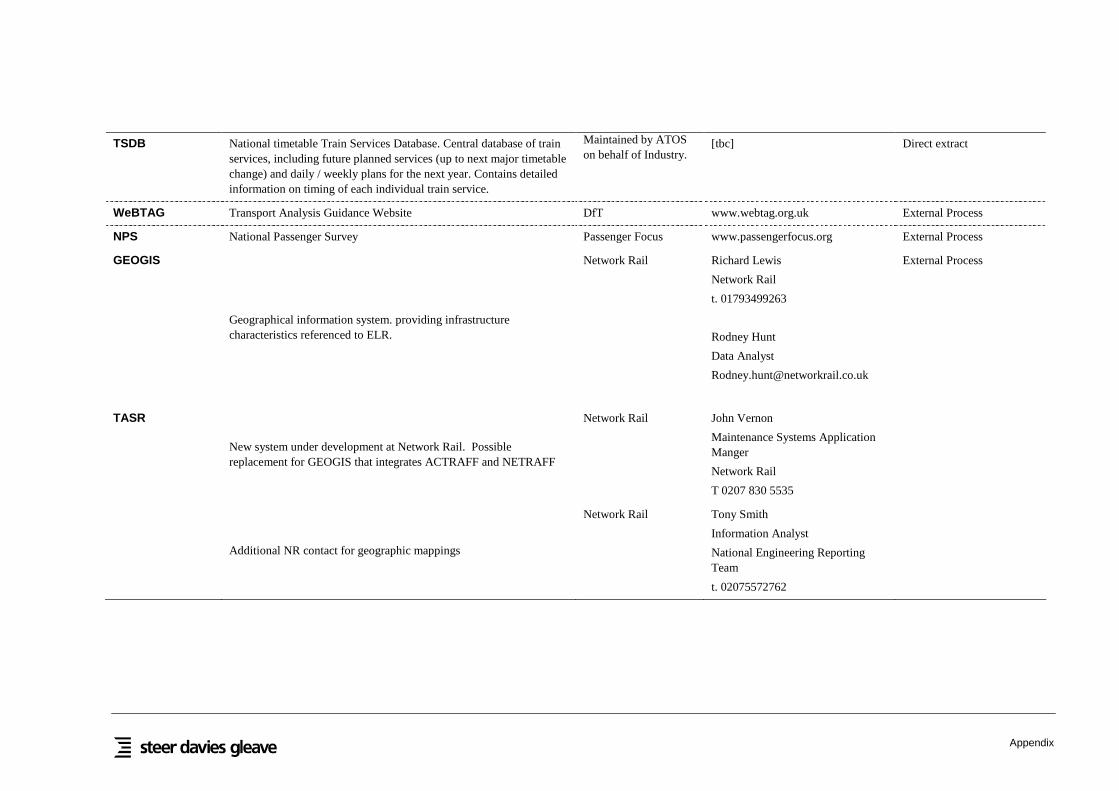
APPENDIX B
DATA SYSTEMS AND CONTACT DETAILS


Appendix
B1. DATA SYSTEMS AND CONTACT DETAILS
System Name System Description Owner Contact Interface Type
PPS
Possession Planning System
Possession Planning System (PPS). Real time database of possessions.Available to all rail industry stakeholders. The database also holdsinformation regarding Temporary Speed Restrictions (TSRs) Thesystem will produce various reports of possessions by route, territory,or affect on Train Operator. System also produces the ConfirmedPeriod Possession Plan, Weekly Operating Notice, and Supplement tothe Weekly Operating Notice.
ORACLE Database.
Data stored by route, location, date and time period.
Network Rail
Chris MyersNetwork Access UnitNetwork Rail6th Floor, City Exchange11 Albion StreetLeedst. 0113 341 2233
Direct extract
S4CS
Schedule 4 Costing System
Schedule 4 (Planned disruptive track access) compensation calculationand reporting tool. Oracle database
Data from Possession Planning System (PPS). Other reference tablesmanually uploaded
Network Rail
Neil RawNetwork RailS4CS SupportGeorge Stephenson HouseToft GreenYork
Direct extract
LENNON
Live Earnings Networked Nationally Overnight
The rail industry’s central ticketing system, formerly CAPRI, is thebasis for passenger kilometres and journeys data. System captures andstores sales of tickets on each flow nationally.
RSP/ATOC
Contact ORR:Paul HadleyHead of OperationsOne Kemble StreetLondonWC2B 4ANt. 020 7282 2039[tbc]
External Process
MOIRATimetable-based model of rail market and passenger train choice.Projects future demand and revenue based on timetable alterations,including elasticity of rail market and consequent revenue change.
Model owned by DeltaRail. Authorisation touse national versionshould be obtained
Jake CartmellRail Service AnalysisDepartment for TransportArea 4/33 Great Minster House76 Marsham Street
External Process

Appendix
from DfT LondonSW1P 4DR
t. 020 7944 5964
ACTRAFF
ACTRAFF is data on the actual traffic and tonnages using the networkevery 4 week period
Detailed files containing the numbers of vehicles using each tracksection every period and higher level summary files giving periodusage for each track section
Flat ascii files subsequently loaded into an Oracle database accessiblevia the Network Rail portal.
Delta Rail providingservice to NetworkRail
DeltaRail:Gwyn RowlandsCentral HouseUpper Woburn PlaceLondonWC1H 0JNt. 0 870 1901436
Network Rail:Stephen RiversTerritory Engineering KnowledgeManagerNetwork Railt. 0121-345-3294e.
External Process
NETTRAFF NETRAFF is used to determine track category, annual tonnage,maximum axle-load and equivalent million gross tonnes per annum(EMGTPA) for each section of track.
Tonnage information produced by NETRAFF is uploaded intoGEOGIS following review and acceptance by the Territory TrackEngineer.
MS Access database
Network Rail Network Rail:Stephen RiversTerritory Engineering KnowledgeManagerNetwork Railt. 0121-345-3294
External Process
PSS PSS is a new Oracle Datawarehouse that is replacing PALADIN as thesystem that archives train movement information from TRUST,including train formations, actual running times, delay minutes anddelay causation / attribution. It is the main industry archive of thisdata.
Network Rail Network RailNigel SalmonSenior Performance AnalystMelton StreetLondont. 020 7557 8487
Direct extract
Appendix
TSDB National timetable Train Services Database. Central database of trainservices, including future planned services (up to next major timetablechange) and daily / weekly plans for the next year. Contains detailedinformation on timing of each individual train service.
Maintained by ATOSon behalf of Industry.
[tbc] Direct extract
WeBTAG Transport Analysis Guidance Website DfT www.webtag.org.uk External Process
NPS National Passenger Survey Passenger Focus www.passengerfocus.org External Process
GEOGIS
Geographical information system. providing infrastructurecharacteristics referenced to ELR.
Network Rail Richard Lewis
Network Rail
t. 01793499263
Rodney Hunt
Data Analyst
External Process
TASR
New system under development at Network Rail. Possiblereplacement for GEOGIS that integrates ACTRAFF and NETRAFF
Network Rail John Vernon
Maintenance Systems ApplicationManger
Network Rail
T 0207 830 5535
Additional NR contact for geographic mappings
Network Rail Tony Smith
Information Analyst
National Engineering ReportingTeam
t. 02075572762

Appendix

Appendix
APPENDIX C
GLOSSARY OF TERMS

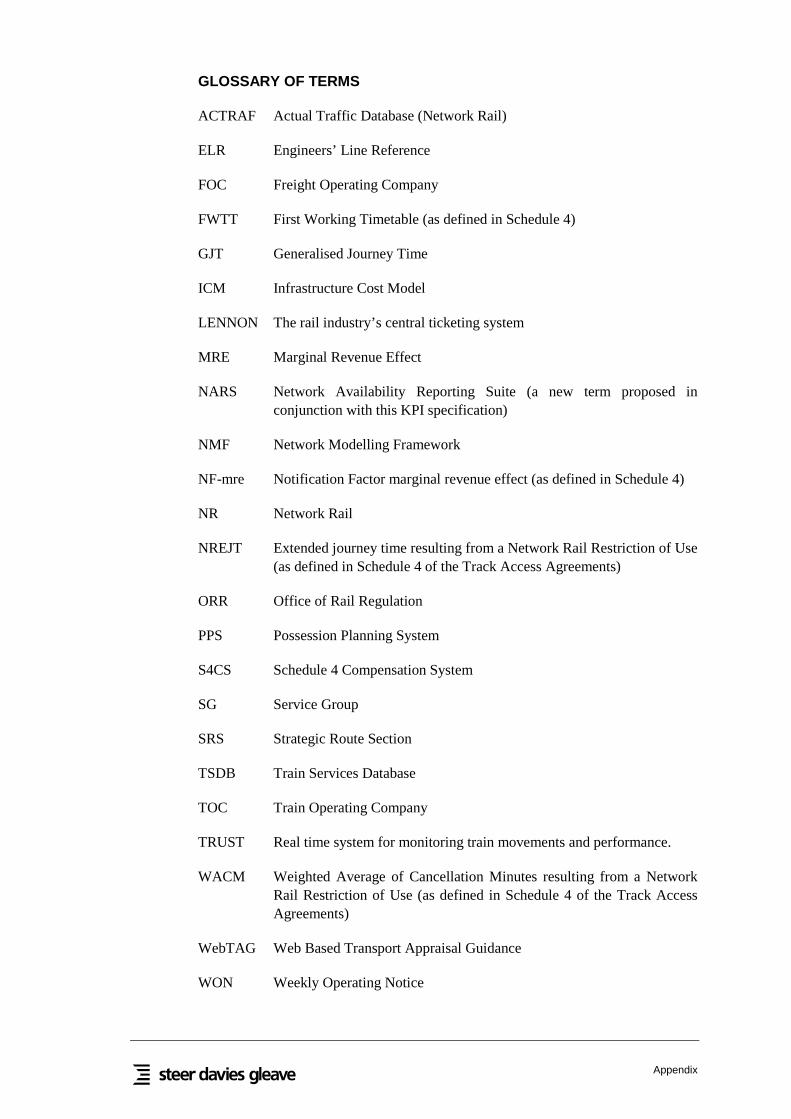
Appendix
GLOSSARY OF TERMS
ACTRAF Actual Traffic Database (Network Rail)
ELR Engineers’ Line Reference
FOC Freight Operating Company
FWTT First Working Timetable (as defined in Schedule 4)
GJT Generalised Journey Time
ICM Infrastructure Cost Model
LENNON The rail industry’s central ticketing system
MRE Marginal Revenue Effect
NARS Network Availability Reporting Suite (a new term proposed inconjunction with this KPI specification)
NMF Network Modelling Framework
NF-mre Notification Factor marginal revenue effect (as defined in Schedule 4)
NR Network Rail
NREJT Extended journey time resulting from a Network Rail Restriction of Use(as defined in Schedule 4 of the Track Access Agreements)
ORR Office of Rail Regulation
PPS Possession Planning System
S4CS Schedule 4 Compensation System
SG Service Group
SRS Strategic Route Section
TSDB Train Services Database
TOC Train Operating Company
TRUST Real time system for monitoring train movements and performance.
WACM Weighted Average of Cancellation Minutes resulting from a NetworkRail Restriction of Use (as defined in Schedule 4 of the Track AccessAgreements)
WebTAG Web Based Transport Appraisal Guidance
WON Weekly Operating Notice

\\Douglas\Work\Projects\7500s\7512\Work\Specification\207512-A Specification Report_Final v3.doc
Appendix

\\Douglas\Work\Projects\7500s\7512\Work\Specification\207512-A Specification Report_Final v3.doc
Control Sheet
CONTROL SHEET
Project/Proposal Name: NETWORK AVAILABILITY KPI
Document Title: Network Availability Reporting Suite (NARS) -Outline Technical Specification
Client Contract/Project Number: ORR/CT/351/NAKPI
SDG Project/Proposal Number: 207512-A
ISSUE HISTORY
REVIEW
Originator: Damian Flynn
Other Contributors: Jon Mellor, Gordon Bird
Review By: Print: Simon Ellis
Sign:
DISTRIBUTION
Clients: Paul Hadley, Tim Griffiths, Lucy Pitcher,Tyson Singleton
Steer Davies Gleave: All project members
Issue No. Date Details
0.3 1/11/07 Draft Issue to Client
1.0 9/11/07 Final Draft to Client
2.0 4/12/07 Final Update to Client