netl modeling of ccs - iea-etsap energy technology systems ... · netl modeling of ccs etsap...
TRANSCRIPT
NETL Modeling of CCSETSAP Workshop session: ‘CCS IN ENERGY SCENARIOS’
July 11, 2017Presented by Chris Nichols, Energy Markets Analysis Team, Systems Engineering and Analysis

2
• Introduction of the Systems Engineering and Analysis (SEA) Directorate at NETL and how we integrate engineering analysis to market modeling
• Discussion of data available and translation into model inputs
• Review some relevant model run results
• Conclusions and on-going work
Overview
3
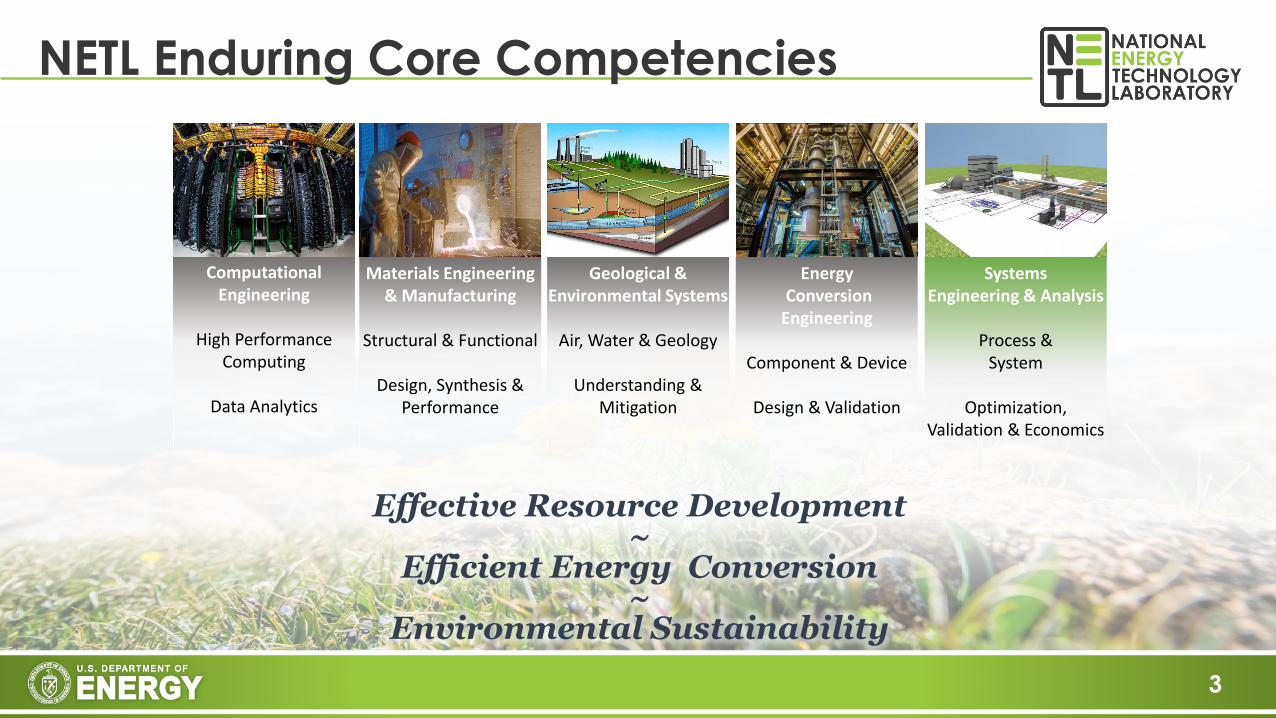
NETL Enduring Core Competencies
Computational Engineering
High Performance Computing
Data Analytics
Materials Engineering & Manufacturing
Structural & Functional
Design, Synthesis & Performance
Geological & Environmental Systems
Air, Water & Geology
Understanding & Mitigation
EnergyConversion
Engineering
Component & Device
Design & Validation
Systems Engineering & Analysis
Process & System
Optimization, Validation & Economics
Effective Resource Development~
Efficient Energy Conversion~
Environmental Sustainability

4
Energy Systems Analysis
Systems Engineering & Analysis (SEA)Teams and Scope
Process Systems Engineering Research
Energy Process Analysis
Energy Markets Analysis
Energy Economy Modeling and Impact Assessment• Enhanced fossil energy representation• Multi-model scenario/policy analysis• Infrastructure, energy-water
Resource Availability and Cost Modeling• CO2 storage (saline and EOR)• Fossil fuel extraction• Rare earth elements• General subsurface technology
evaluation and supportGrid modeling and analysis
Environmental Life Cycle Analysis
Energy Process Design, Analysis, and Cost Estimation• Plant-level modeling, performance assessment• Cost estimation for
plant-level systems• General plant-level
technology evaluation and support
• Economic impact assessment• General regulatory, market and
financial expertise
• Process synthesis, design, optimization, intensification
• Steady state and dynamic process model development
• Uncertainty quantification• Advanced process control
Design, optimization, and modeling framework to be expanded to all SEA “systems”

5
Assessing Program Portfolio Impacts: Coal Program Example
Baseline Data & Model
Development
Set R&D Goals and Evaluate Progress
Project deployment of Technologies
Estimate Potential Benefits of RD&D
NETL Cost and Performance Baseline for Fossil Energy Plants
NETL CO2 Capture, Transport, Storage and Utilization - National Energy Modeling System (CTUS-NEMS)
• Detailed, transparent account of plant information
• Key resource for government, academia and industry
• Adopted by EIA; used in AEO’s 2014/15/16
• Facilitates and encourages EPSA interactions
NETL CO2 Saline Storage Cost Model (onshore and offshore)
0
2
4
6
8
10
12
14
16
0 10 20 30 40
Mcf
/STB
Years
CO2 Utilization Factor
ver 1 ver 2
0
0.1
0.2
0.3
0.4
0.5
0.6
0.7
0.8
0.9
1
0 10 20 30 40
Frac
tio
n
Years
CO2 Retention Factor
ver 1 ver 2
0.0
10.0
20.0
30.0
40.0
50.0
60.0
70.0
80.0
0 10 20 30 40M
STB
Years
Annual Oil Production
ver 1 ver 2
Borehole bottom locations mapped by play name
NETL CO2 Prophet Model
NetPay
GrossPay
Oil Bearing Formation
Gas Cap
Aquifer/ ROZ
Oil Zone
0
10
20
30
40
50
60
70
No RD&D RD&D No RD&D RD&D
Gig
awat
ts
NG Retrofits
New Gas CCS
Coal Retrofits
New Coal CCS
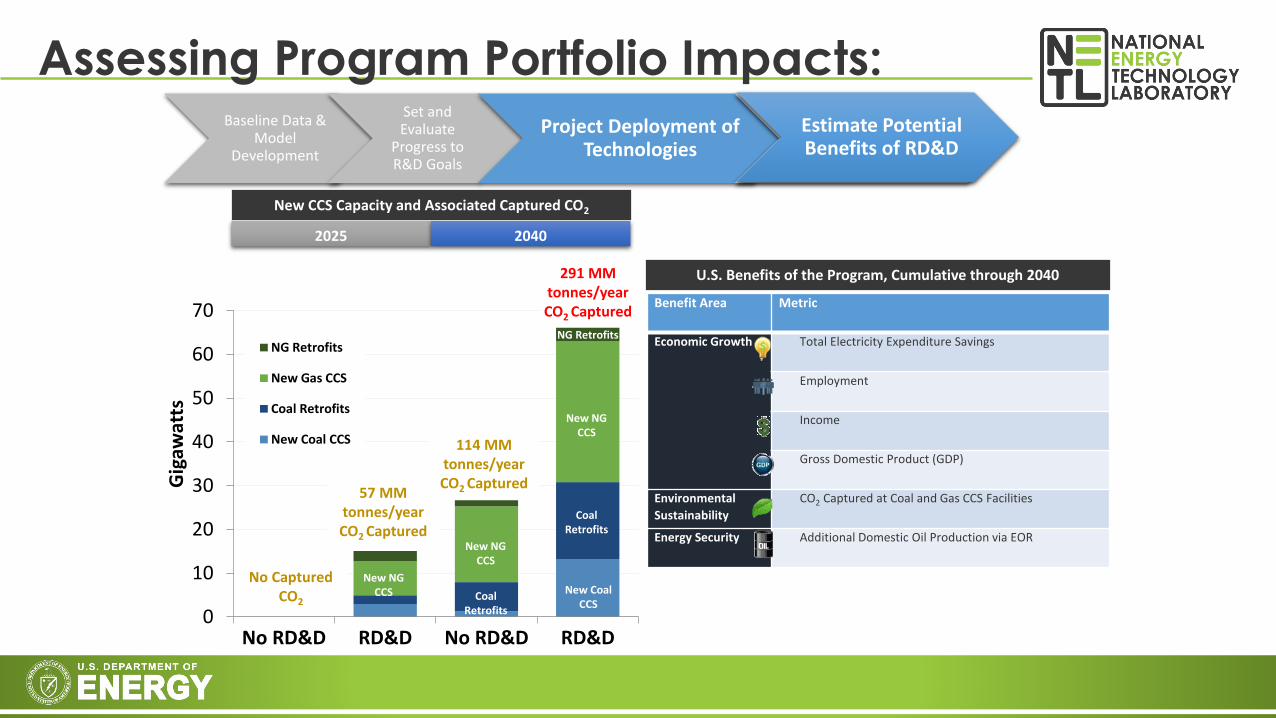
Assessing Program Portfolio Impacts:Baseline Data &
Model Development
Set and Evaluate
Progress to R&D Goals
Project Deployment of Technologies
Estimate Potential Benefits of CCRP RD&D
Estimate Potential Benefits of RD&D
New CCS Capacity and Associated Captured CO2
2025 2040
No Captured CO2
New NG CCS
New NG CCS
Coal Retrofits
New Coal CCS
57 MM tonnes/yearCO2 Captured
114 MM tonnes/yearCO2 Captured
291 MM tonnes/yearCO2 Captured
NG Retrofits
New NG CCS
Coal Retrofits
U.S. Benefits of the Program, Cumulative through 2040
Benefit Area Metric
Economic Growth Total Electricity Expenditure Savings
Employment
Income
Gross Domestic Product (GDP)
Environmental
Sustainability
CO2 Captured at Coal and Gas CCS Facilities
Energy Security Additional Domestic Oil Production via EOR
$
7
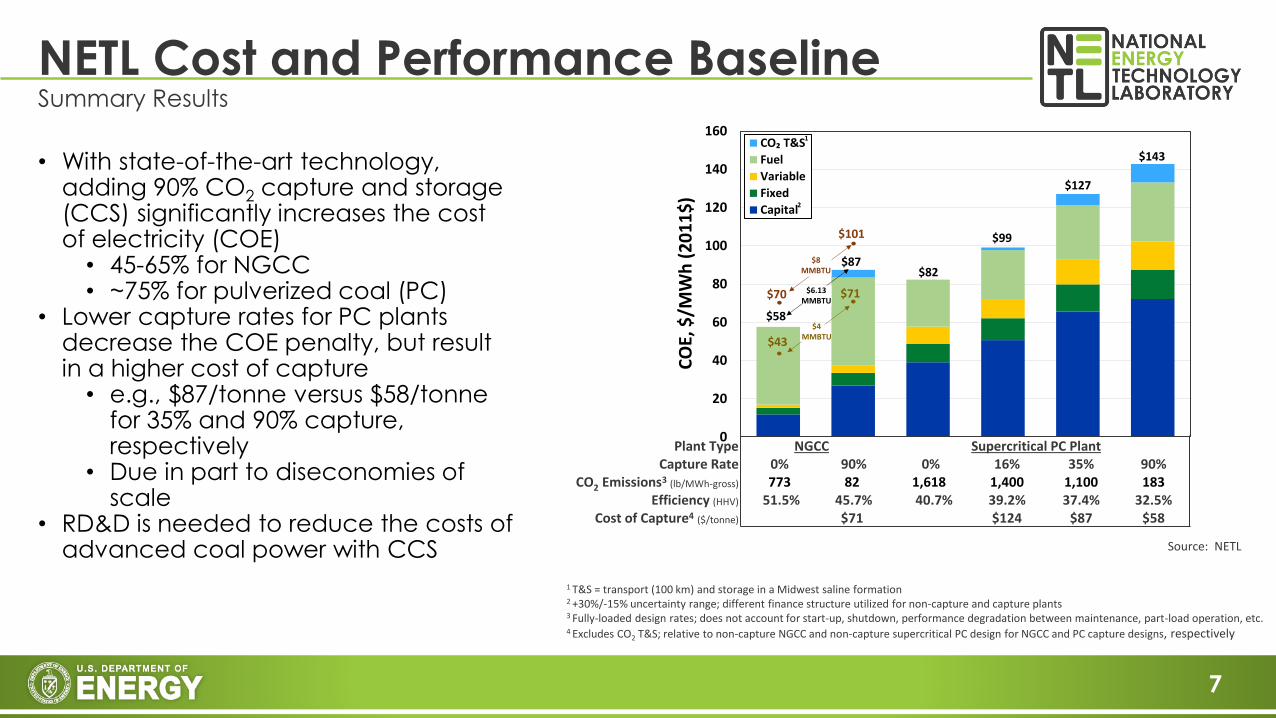
• With state-of-the-art technology, adding 90% CO2 capture and storage (CCS) significantly increases the cost of electricity (COE)• 45-65% for NGCC• ~75% for pulverized coal (PC)
• Lower capture rates for PC plants decrease the COE penalty, but result in a higher cost of capture • e.g., $87/tonne versus $58/tonne
for 35% and 90% capture, respectively
• Due in part to diseconomies of scale
• RD&D is needed to reduce the costs of advanced coal power with CCS
NETL Cost and Performance BaselineSummary Results
1 T&S = transport (100 km) and storage in a Midwest saline formation 2 +30%/-15% uncertainty range; different finance structure utilized for non-capture and capture plants3 Fully-loaded design rates; does not account for start-up, shutdown, performance degradation between maintenance, part-load operation, etc.4 Excludes CO2 T&S; relative to non-capture NGCC and non-capture supercritical PC design for NGCC and PC capture designs, respectively
0
20
40
60
80
100
120
140
160
CO
E, $
/MW
h (
20
11
$)
CO₂ T&S
Fuel
Variable
Fixed
Capital
$143
$127
$99
$82$87
$58
$101
$70
$43
$71$6.13 MMBTU
$4 MMBTU
$8MMBTU
1
2
Plant Type NGCC Supercritical PC PlantCapture Rate 0% 90% 0% 16% 35% 90%
CO2 Emissions3 (lb/MWh-gross) 773 82 1,618 1,400 1,100 183Efficiency (HHV) 51.5% 45.7% 40.7% 39.2% 37.4% 32.5%
Cost of Capture4 ($/tonne) $71 $124 $87 $58
Source: NETL
8
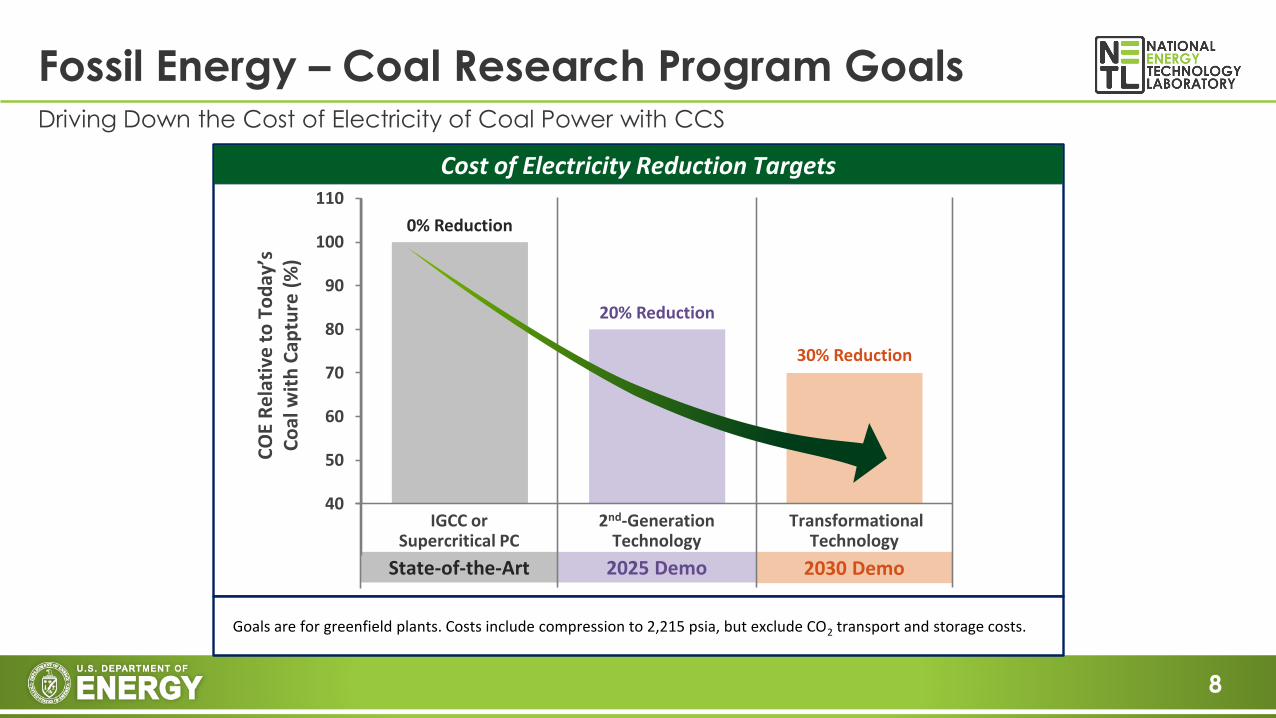
Fossil Energy – Coal Research Program GoalsDriving Down the Cost of Electricity of Coal Power with CCS
0% Reduction
20% Reduction
30% Reduction
40
50
60
70
80
90
100
110
State-of-the-Art 2025 Demo 2030 Demo
Goals are for greenfield plants. Costs include compression to 2,215 psia, but exclude CO2 transport and storage costs.
Cost of Electricity Reduction Targets
Transformational Technology
IGCC orSupercritical PC
2nd-Generation Technology
CO
E R
ela
tive
to
To
day
’s
Co
al w
ith
Cap
ture
(%
)
9
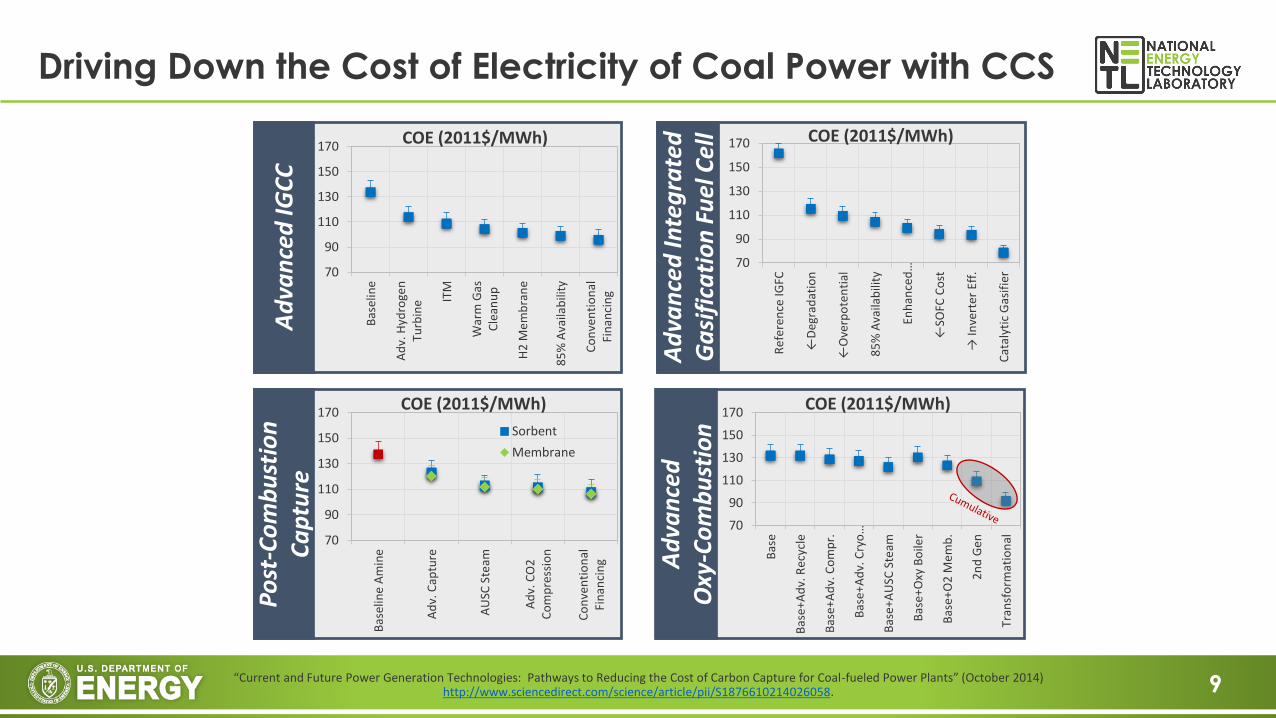
Driving Down the Cost of Electricity of Coal Power with CCS
Ad
van
ced
Inte
gra
ted
G
asi
fica
tio
n F
uel
Cel
l
Ad
van
ced
O
xy-C
om
bu
stio
n
Ad
van
ced
IGC
CP
ost
-Co
mb
ust
ion
C
ap
ture
70
90
110
130
150
170
Bas
elin
e A
min
e
Ad
v. C
aptu
re
AU
SC S
team
Ad
v. C
O2
Co
mp
ress
ion
Co
nve
nti
on
alFi
nan
cin
g
COE (2011$/MWh)
Sorbent
Membrane
70
90
110
130
150
170
Bas
elin
e
Ad
v. H
ydro
gen
Turb
ine IT
M
War
m G
asC
lean
up
H2
Me
mb
ran
e
85
% A
vaila
bili
ty
Co
nve
nti
on
alFi
nan
cin
g
COE (2011$/MWh)
70
90
110
130
150
170
Re
fere
nce
IGFC
←D
egra
dat
ion
←O
verp
ote
nti
al
85
% A
vaila
bili
ty
Enh
ance
d…
←SO
FC C
ost
→ In
vert
er E
ff.
Cat
alyt
ic G
asif
ier
COE (2011$/MWh)
70
90
110
130
150
170
Bas
e
Bas
e+A
dv.
Rec
ycle
Bas
e+A
dv.
Co
mp
r.
Bas
e+A
dv.
Cry
o…
Bas
e+A
USC
Ste
am
Bas
e+O
xy B
oile
r
Bas
e+O
2 M
em
b.
2n
d G
en
Tran
sfo
rmat
ion
al
COE (2011$/MWh)
“Current and Future Power Generation Technologies: Pathways to Reducing the Cost of Carbon Capture for Coal-fueled Power Plants” (October 2014) http://www.sciencedirect.com/science/article/pii/S1876610214026058.

10
• The AEO2016 Reference case includes a 30% capture coal CCS technology.
• The Starting Point case uses AEO2017 assumptions for a 90% capture technology but modified to reflect the absence of Federal R&D.• The first on-line year is assumed to
be 2025 and the learning rate is half the rate in the AEO2017
• The Program Goal case assumes success of the CCS R&D program goals that lead to lower capital costs, an early start year, as well as greater efficiency.
Coal with CCS Capital Costs
11
Co
al C
CS
Pow
er P
lan
t C
apit
al C
ost
y = 45159x-0.282
R² = 0.9749LR=18%
y = 163428x-0.426
R² = 0.9942LR=26%
y = 33660x-0.271
R² = 0.9934LR=17%
1500
2000
2500
3000
3500
4000
4500
- 10,000 20,000 30,000 40,000 50,000 60,000
20
05 U
S M
illio
n d
olla
rs/G
igaw
atts
PJ
R3.1.3.0+ EOR, PG, 45Q,H2O
R3.1.6.0+ PG
R3.1.6.0+ EOR, PG, 45Q,H2O
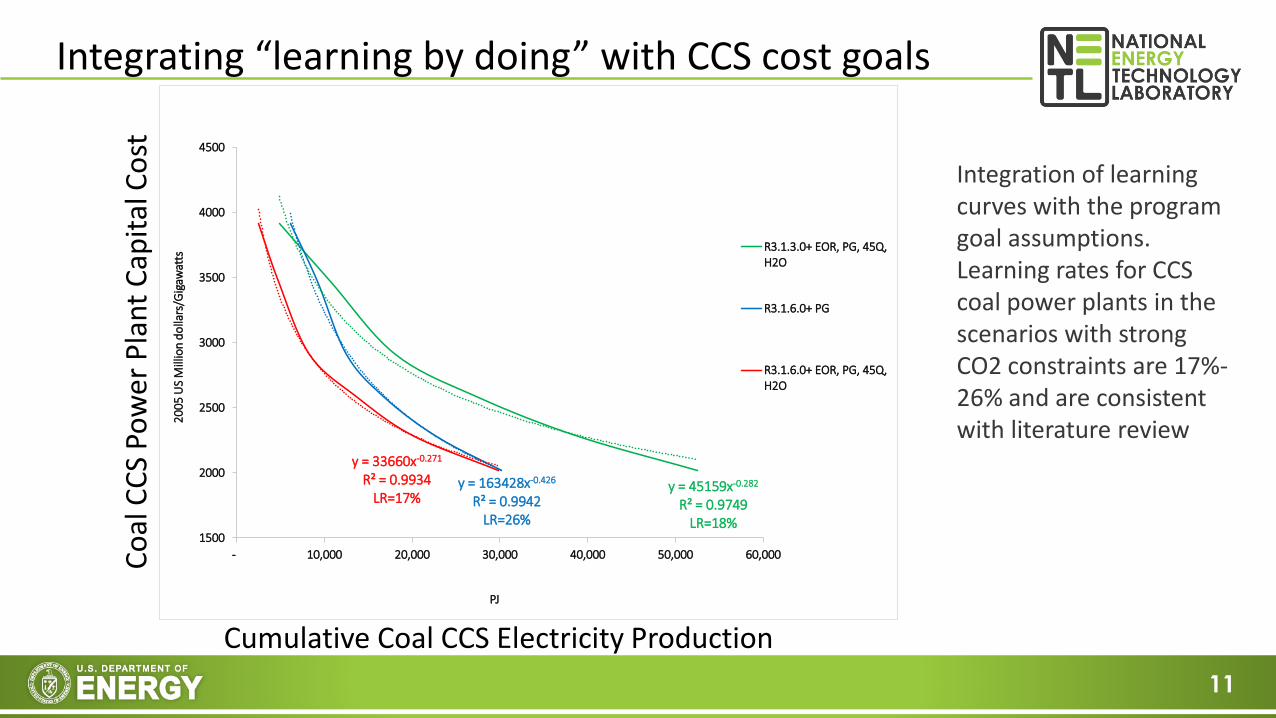
Integration of learning curves with the program goal assumptions. Learning rates for CCS coal power plants in the scenarios with strong CO2 constraints are 17%-26% and are consistent with literature review
Cumulative Coal CCS Electricity Production
Integrating “learning by doing” with CCS cost goals
12
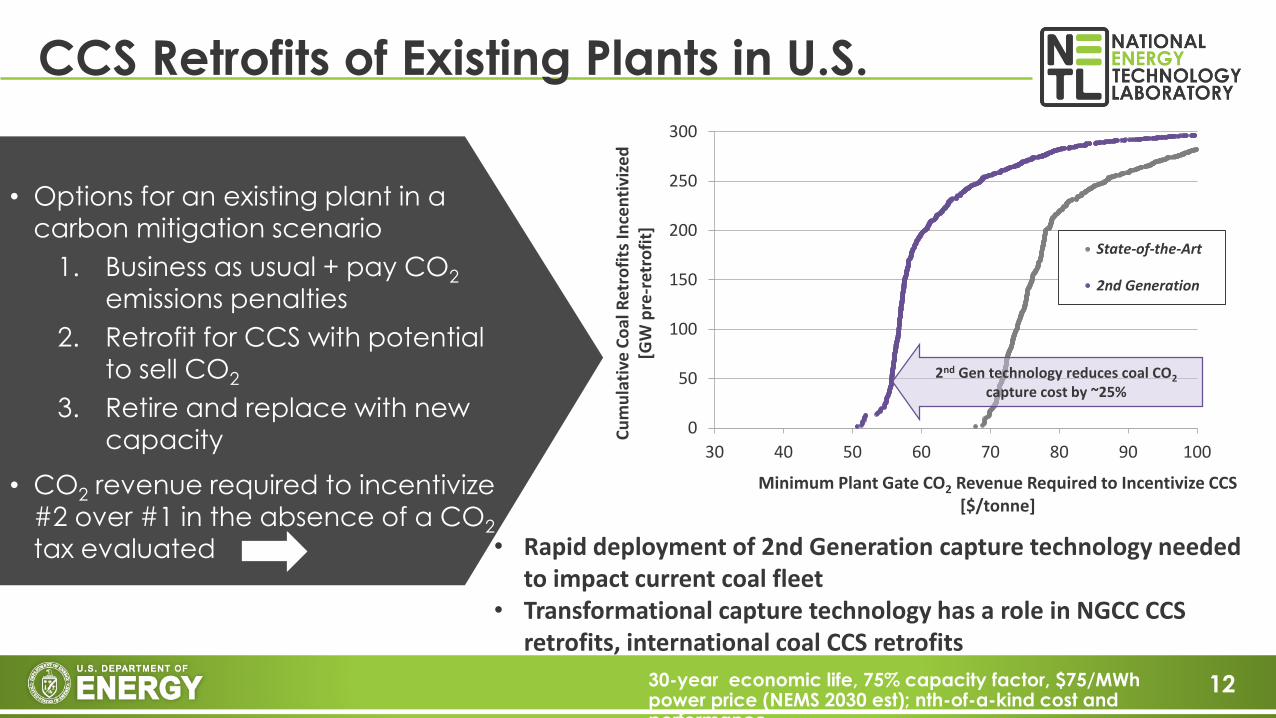
CCS Retrofits of Existing Plants in U.S.
• Options for an existing plant in a
carbon mitigation scenario
1. Business as usual + pay CO2
emissions penalties
2. Retrofit for CCS with potential
to sell CO2
3. Retire and replace with new
capacity
• CO2 revenue required to incentivize
#2 over #1 in the absence of a CO2
tax evaluated • Rapid deployment of 2nd Generation capture technology needed to impact current coal fleet
• Transformational capture technology has a role in NGCC CCS retrofits, international coal CCS retrofits
30-year economic life, 75% capacity factor, $75/MWh power price (NEMS 2030 est); nth-of-a-kind cost and performance
0
50
100
150
200
250
300
30 40 50 60 70 80 90 100
Cu
mu
lati
ve C
oal
Ret
rofi
ts In
cen
tivi
zed
[GW
pre
-ret
rofi
t]
Minimum Plant Gate CO2 Revenue Required to Incentivize CCS [$/tonne]
State-of-the-Art
2nd Generation
2nd Gen technology reduces coal CO2
capture cost by ~25%
13
• Using EPA 9R database with MARKAL, we modeled a variety of CO2 control regimes based on EMF 32 scenarios with and without DOE R&D goals susccess:• Rated based CPP
• Mass based CPP with high NG price
• $25/mt CO2 tax with 5% escalation rate
• 80% economy-wide CO2 reduction by 2050
• Meaningful deployments of CCS do not appear in most non-R&D cases, while R&D success does drive large scale deployments
Overview of relevant model results
14
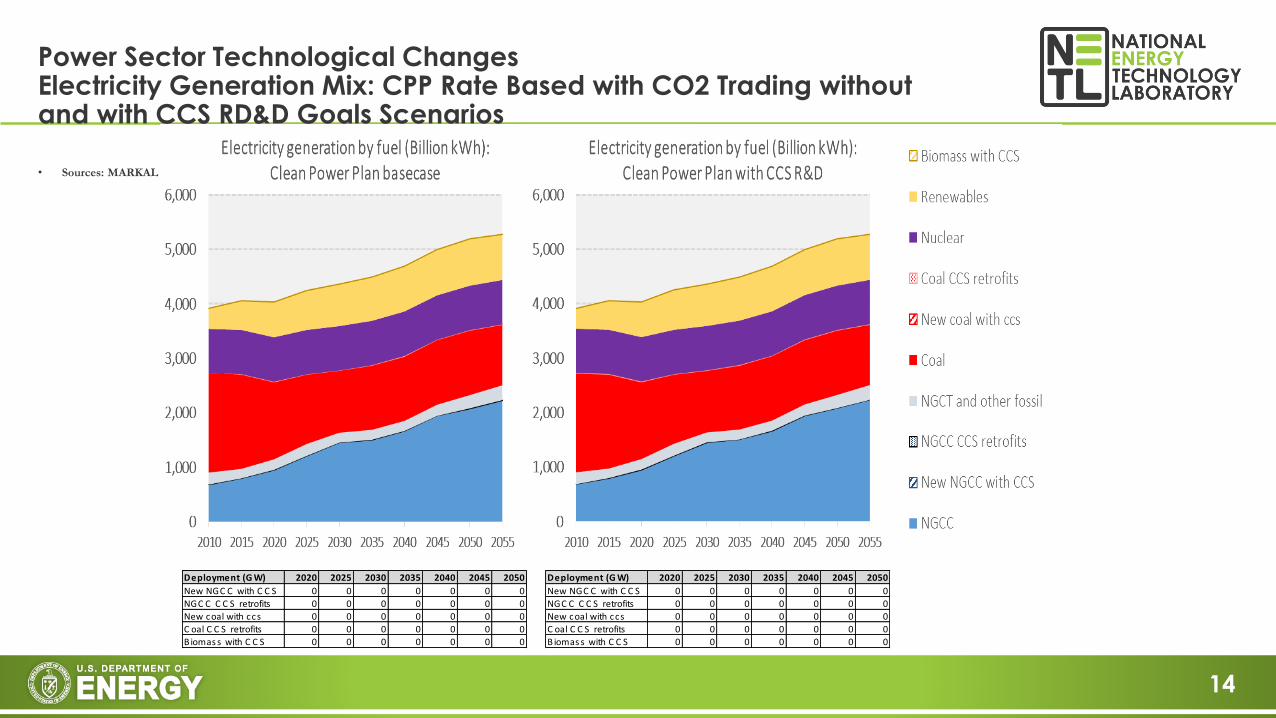
Deployment (G W) 2020 2025 2030 2035 2040 2045 2050
New NGC C with C C S 0 0 0 0 0 0 0
NGC C C C S retrofits 0 0 0 0 0 0 0
New coal with ccs 0 0 0 0 0 0 0
C oal C C S retrofits 0 0 0 0 0 0 0
B iomas s with C C S 0 0 0 0 0 0 0
• Sources: MARKAL NETL
Power Sector Technological ChangesElectricity Generation Mix: CPP Rate Based with CO2 Trading without and with CCS RD&D Goals Scenarios
Deployment (G W) 2020 2025 2030 2035 2040 2045 2050
New NGC C with C C S 0 0 0 0 0 0 0
NGC C C C S retrofits 0 0 0 0 0 0 0
New coal with ccs 0 0 0 0 0 0 0
C oal C C S retrofits 0 0 0 0 0 0 0
B iomas s with C C S 0 0 0 0 0 0 0

15
Electricity Generation Mix: CPP Mass Based with high natural gas prices, without and with CCS RD&D Goals Scenarios
Deployment (GW) 2020 2025 2030 2035 2040 2045 2050
New NGCC with CCS 0 0 0 0 0 0 0
NGCC CCS retrofits 0 0 0 0 0 0 0
New coal with ccs 0 0 0 0 0 0.02 0.1
Coal CCS retrofits 0 0 0 0 0 0 0
Biomass with CCS 0 0 0 0 0 0 0
Deployment (GW) 2020 2025 2030 2035 2040 2045 2050
New NGCC with CCS 0 0 0 0 0 0 0
NGCC CCS retrofits 0 0 0 0 0 0 0
New coal with ccs 0 0 0 0 11 47 106
Coal CCS retrofits 0 0 3 3 3 0 0
Biomass with CCS 0 0 0 0 0 0 0
16
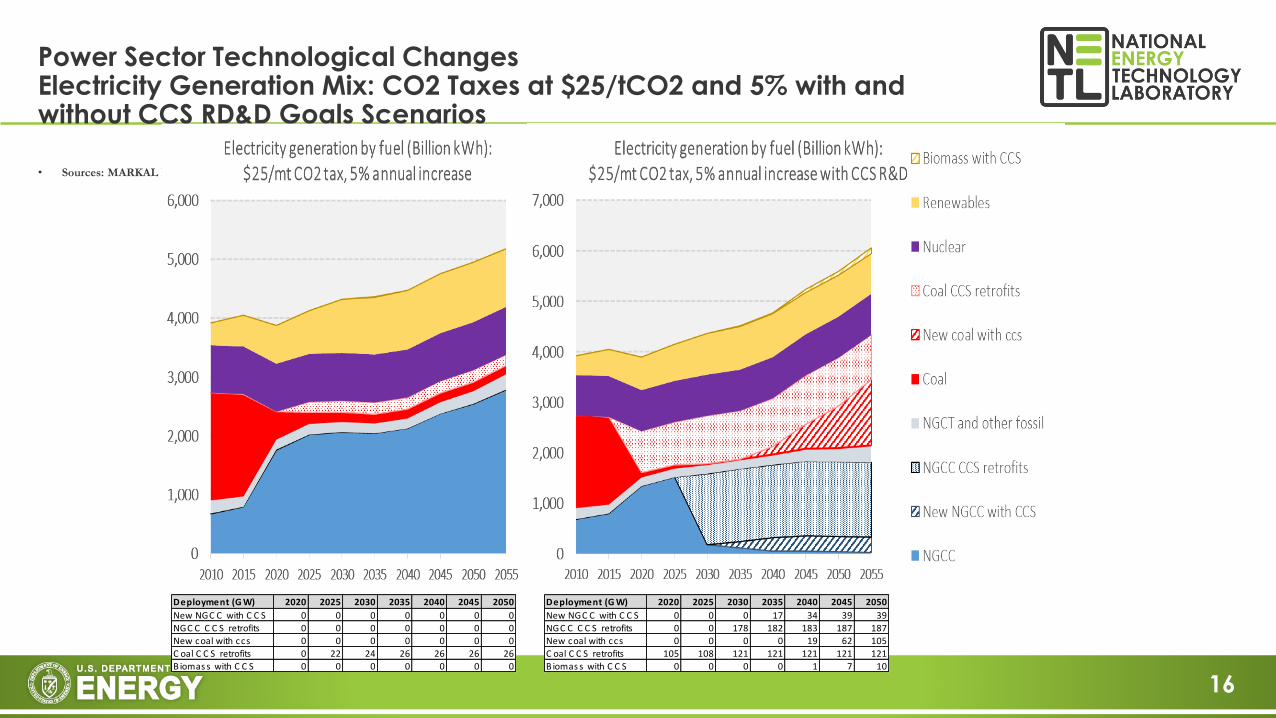
• Sources: MARKAL NETL
Power Sector Technological ChangesElectricity Generation Mix: CO2 Taxes at $25/tCO2 and 5% with and without CCS RD&D Goals Scenarios
Deployment (G W) 2020 2025 2030 2035 2040 2045 2050
New NGC C with C C S 0 0 0 0 0 0 0
NGC C C C S retrofits 0 0 0 0 0 0 0
New coal with ccs 0 0 0 0 0 0 0
C oal C C S retrofits 0 22 24 26 26 26 26
B iomas s with C C S 0 0 0 0 0 0 0
Deployment (G W) 2020 2025 2030 2035 2040 2045 2050
New NGC C with C C S 0 0 0 17 34 39 39
NGC C C C S retrofits 0 0 178 182 183 187 187
New coal with ccs 0 0 0 0 19 62 105
C oal C C S retrofits 105 108 121 121 121 121 121
B iomas s with C C S 0 0 0 0 1 7 10
17
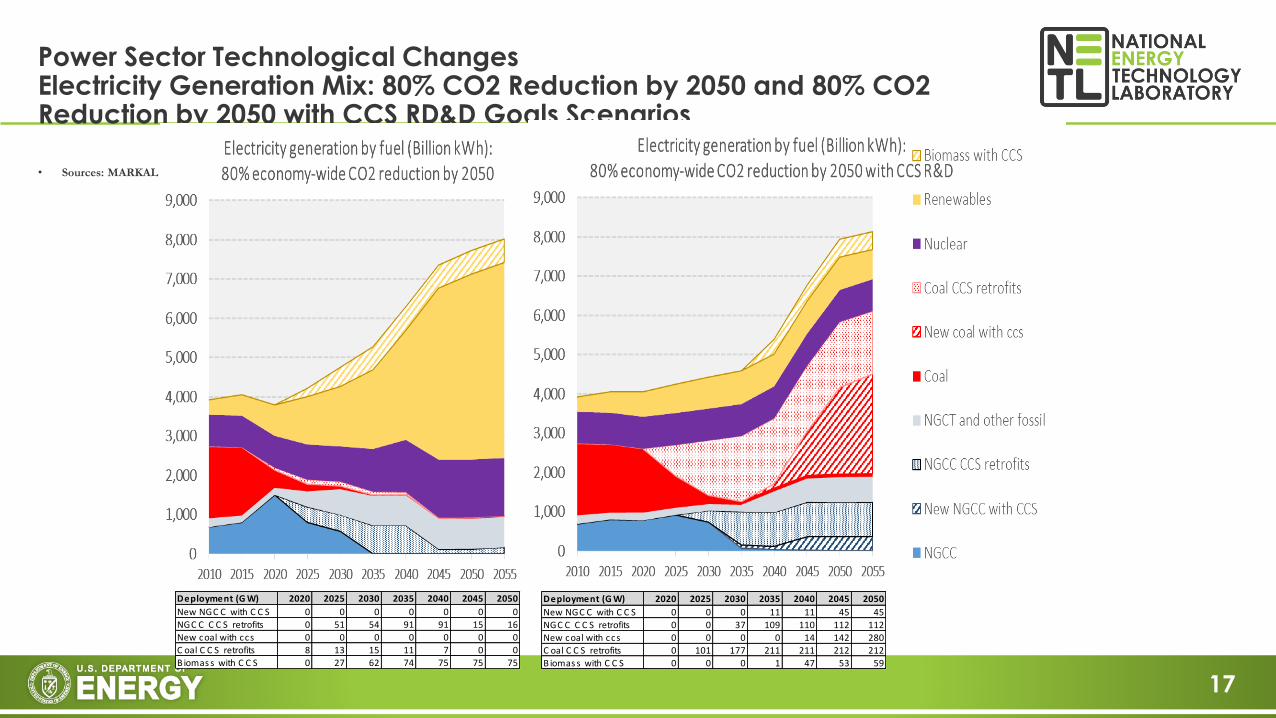
• Sources: MARKAL NETL
Power Sector Technological ChangesElectricity Generation Mix: 80% CO2 Reduction by 2050 and 80% CO2 Reduction by 2050 with CCS RD&D Goals Scenarios
Deployment (G W) 2020 2025 2030 2035 2040 2045 2050
New NGC C with C C S 0 0 0 0 0 0 0
NGC C C C S retrofits 0 51 54 91 91 15 16
New coal with ccs 0 0 0 0 0 0 0
C oal C C S retrofits 8 13 15 11 7 0 0
B iomas s with C C S 0 27 62 74 75 75 75
Deployment (G W) 2020 2025 2030 2035 2040 2045 2050
New NGC C with C C S 0 0 0 11 11 45 45
NGC C C C S retrofits 0 0 37 109 110 112 112
New coal with ccs 0 0 0 0 14 142 280
C oal C C S retrofits 0 101 177 211 211 212 212
B iomas s with C C S 0 0 0 1 47 53 59
18
• Currently investigating cases of CCS deployment without a CO2 price• EOR integration and tax credits
• Examining issues related to existing and new coal units:• Heat rate improvements for existing units
• Impact of cycling operations
• Economic growth assumptions
• Integration of water usage and consumption
Continuing work
19
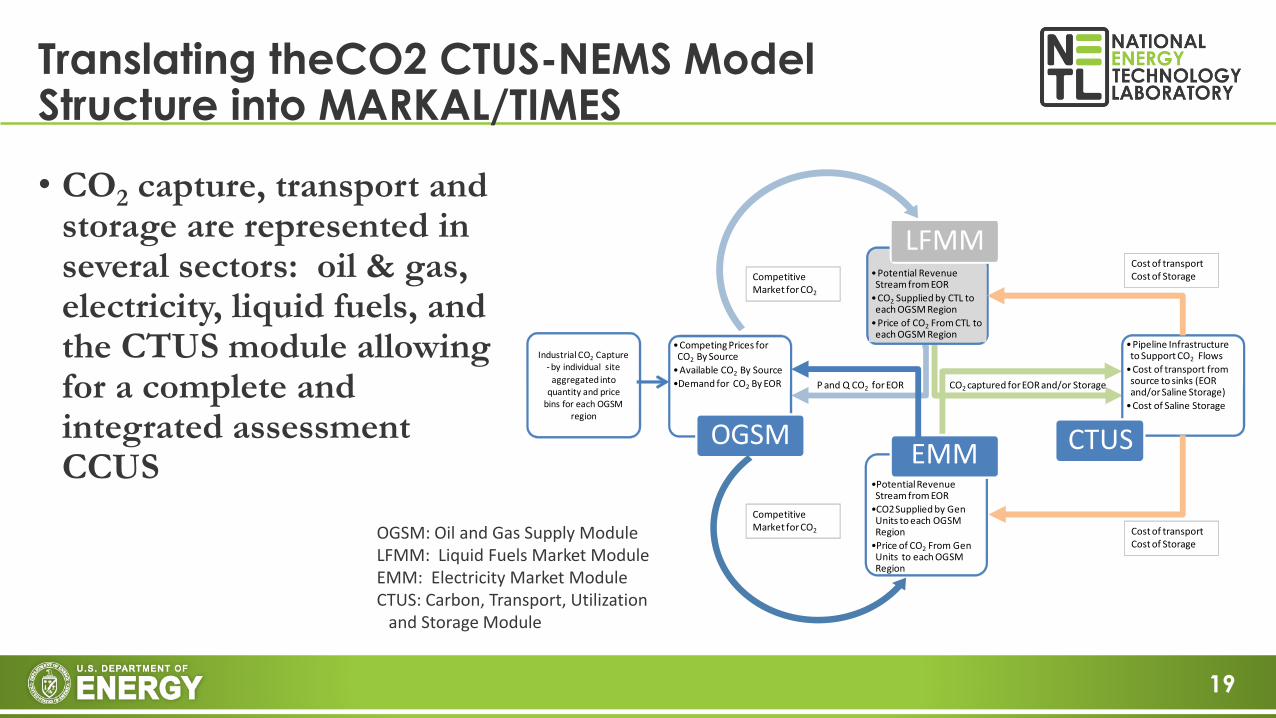
• CO2 capture, transport and storage are represented in several sectors: oil & gas, electricity, liquid fuels, and the CTUS module allowing for a complete and integrated assessment CCUS
Translating theCO2 CTUS-NEMS Model Structure into MARKAL/TIMES
OGSM: Oil and Gas Supply ModuleLFMM: Liquid Fuels Market ModuleEMM: Electricity Market ModuleCTUS: Carbon, Transport, Utilization
and Storage Module
•Competing Prices for CO2 By Source
•Available CO2 By Source
•Demand for CO2 By EOR
OGSM
•Potential Revenue Stream from EOR
•CO2 Supplied by GenUnits to each OGSM Region
•Price of CO2 From Gen Units to each OGSM Region
•Pipeline Infrastructure to Support CO2 Flows
•Cost of transport from source to sinks (EOR and/or Saline Storage)
•Cost of Saline Storage
CTUSEMM
•Potential Revenue Stream from EOR
•CO2 Supplied by CTL to each OGSM Region
•Price of CO2 From CTL to each OGSM Region
LFMMCost of transport Cost of Storage
Cost of transport Cost of Storage
Competitive Market for CO2
Competitive Market for CO2
CO2 captured for EOR and/or StorageP and Q CO2 for EOR
Industrial CO2 Capture- by individual site
aggregated into quantity and price
bins for each OGSM region
20
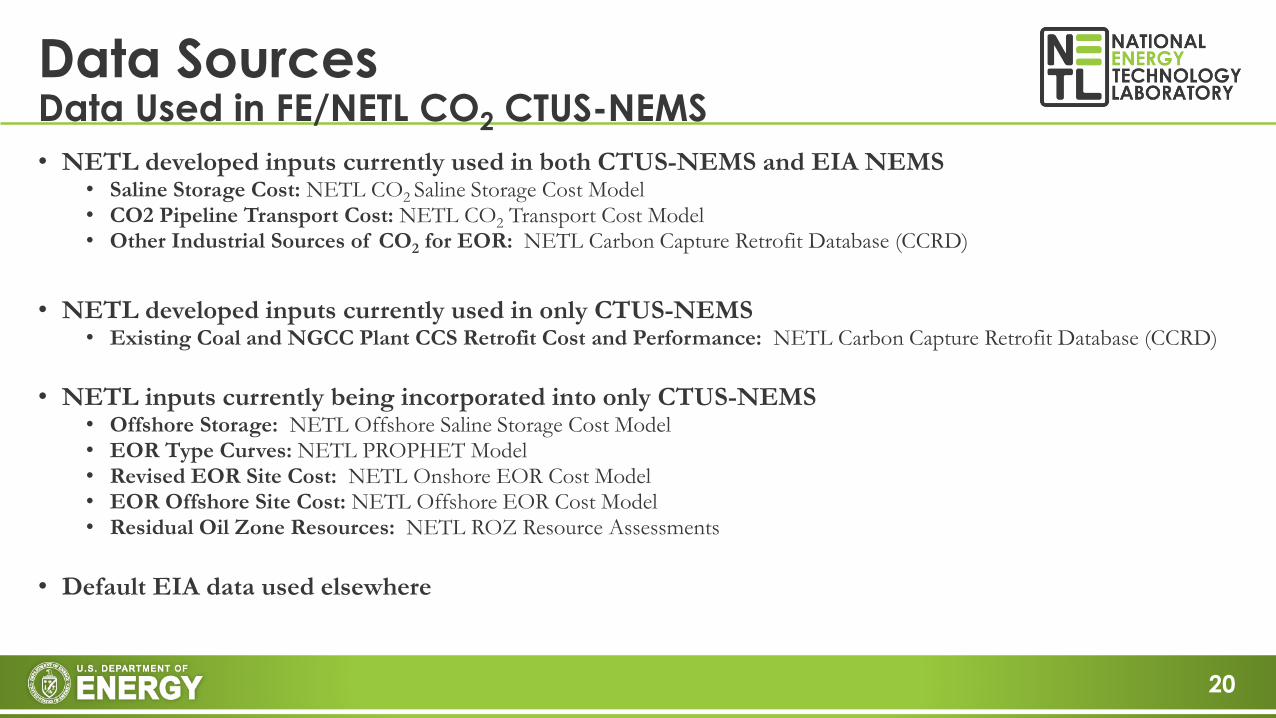
• NETL developed inputs currently used in both CTUS-NEMS and EIA NEMS• Saline Storage Cost: NETL CO2 Saline Storage Cost Model• CO2 Pipeline Transport Cost: NETL CO2 Transport Cost Model • Other Industrial Sources of CO2 for EOR: NETL Carbon Capture Retrofit Database (CCRD)
• NETL developed inputs currently used in only CTUS-NEMS • Existing Coal and NGCC Plant CCS Retrofit Cost and Performance: NETL Carbon Capture Retrofit Database (CCRD)
• NETL inputs currently being incorporated into only CTUS-NEMS• Offshore Storage: NETL Offshore Saline Storage Cost Model• EOR Type Curves: NETL PROPHET Model• Revised EOR Site Cost: NETL Onshore EOR Cost Model• EOR Offshore Site Cost: NETL Offshore EOR Cost Model• Residual Oil Zone Resources: NETL ROZ Resource Assessments
• Default EIA data used elsewhere
Data SourcesData Used in FE/NETL CO2 CTUS-NEMS

Solutions for Today | Options for Tomorrow
I have seen the future and it is very much like the present, only longer. --Kehlog Albran
For more information…
Chris Nichols
304 285-4172
22
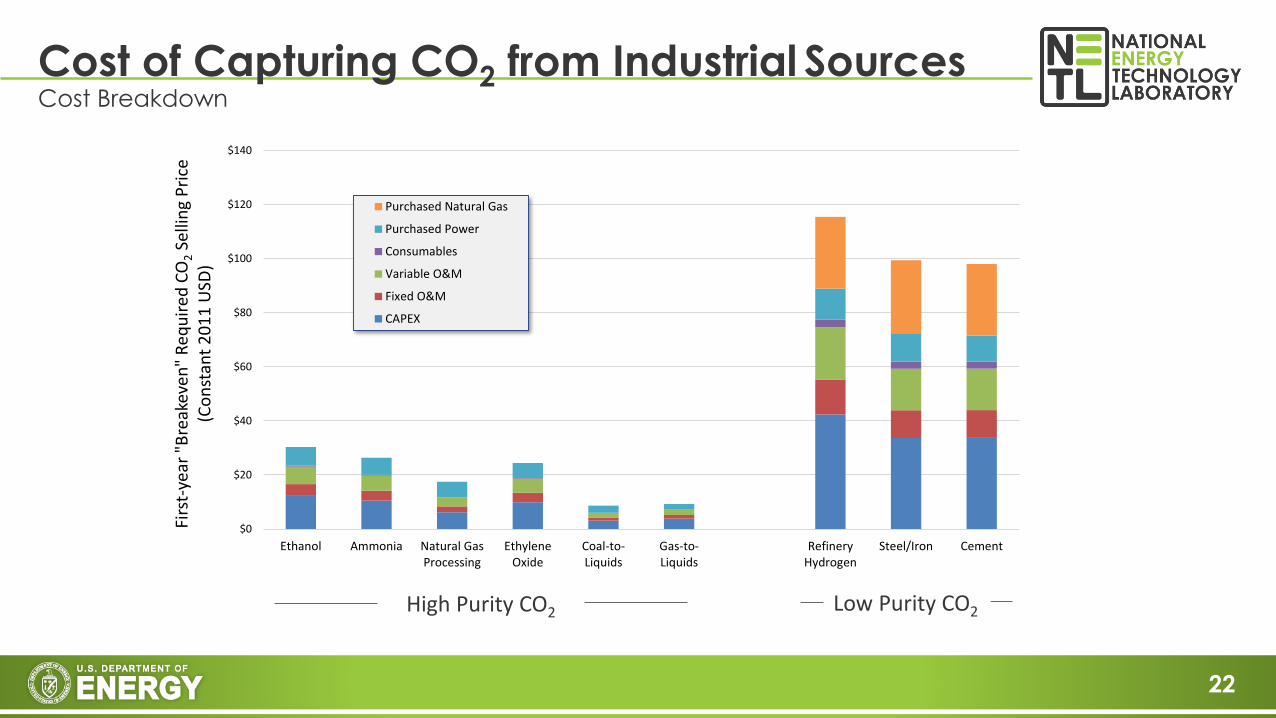
Cost of Capturing CO2 from Industrial SourcesCost Breakdown
$0
$20
$40
$60
$80
$100
$120
$140
Ethanol Ammonia Natural GasProcessing
EthyleneOxide
Coal-to-Liquids
Gas-to-Liquids
RefineryHydrogen
Steel/Iron Cement
Firs
t-ye
ar "
Bre
akev
en"
Req
uir
ed C
O2
Selli
ng
Pri
ce
(Co
nst
ant
20
11
USD
)Purchased Natural Gas
Purchased Power
Consumables
Variable O&M
Fixed O&M
CAPEX
High Purity CO2 Low Purity CO2