netapp storage agent user's guide - e ibm tivoli composite
TRANSCRIPT
IBM Tivoli Monitoring for Virtual Environments Agent forNetApp StorageVersion 7.1
User's Guide
SC14-7489-00
���

IBM Tivoli Monitoring for Virtual Environments Agent forNetApp StorageVersion 7.1
User's Guide
SC14-7489-00
���

NoteBefore using this information and the product it supports, read the information in “Notices” on page 107.
This edition applies to version 7.1 of IBM Tivoli Monitoring for Virtual Environments Agent for NetApp Storage(product number 5724-L92) and to all subsequent releases and modifications until otherwise indicated in neweditions.
© Copyright IBM Corporation 2010, 2011.US Government Users Restricted Rights – Use, duplication or disclosure restricted by GSA ADP Schedule Contractwith IBM Corp.
Contents
Tables . . . . . . . . . . . . . . . v
Chapter 1. Overview of the agent . . . . 1New in this release . . . . . . . . . . . . 2Components of the IBM Tivoli Monitoringenvironment . . . . . . . . . . . . . . 2Agent Management Services . . . . . . . . . 3User interface options . . . . . . . . . . . 3
Chapter 2. Agent installation andconfiguration . . . . . . . . . . . . 5Language pack installation . . . . . . . . . 5
Installing language packs on Windows systems. . 5Installing language packs on UNIX or Linuxsystems . . . . . . . . . . . . . . . 6Silent installation of language packs for agents . . 6
Agent-specific installation and configuration. . . . 8User ID . . . . . . . . . . . . . . . 8Number of instances. . . . . . . . . . . 8NetApp Storage agent application support . . . 8Downloading and installing the NetAppManageability SDK JAR file . . . . . . . . 9Configuration values . . . . . . . . . . 9Remote installation and configuration . . . . 10
Chapter 3. Workspaces reference . . . 13Predefined workspaces . . . . . . . . . . 13Workspace descriptions . . . . . . . . . . 14
NetApp Storage Navigator item . . . . . . 14Aggregates Navigator item . . . . . . . . 14Hosts Navigator item . . . . . . . . . . 15LUNs Navigator item . . . . . . . . . . 16Volumes Navigator item . . . . . . . . . 17
Chapter 4. Attributes reference . . . . 19Attribute groups for the monitoring agent . . . . 19Attributes in each attribute group . . . . . . . 20
Aggregates attribute group . . . . . . . . 20Host Network Interfaces attribute group. . . . 27Hosts attribute group . . . . . . . . . . 32LUNs attribute group . . . . . . . . . . 38Performance Object Status attribute group . . . 43Volumes attribute group . . . . . . . . . 47
Disk capacity planning for historical data . . . . 59
Chapter 5. Situations reference . . . . 61Predefined situations . . . . . . . . . . . 61
Situation descriptions . . . . . . . . . . . 62NetApp Storage Navigator item . . . . . . 62Aggregates Navigator item . . . . . . . . 62Hosts Navigator item . . . . . . . . . . 63LUNs Navigator item . . . . . . . . . . 64Volumes Navigator item . . . . . . . . . 65
Chapter 6. Take Action commandsreference. . . . . . . . . . . . . . 67Predefined Take Action commands . . . . . . 67
Chapter 7. Policies reference . . . . . 69
Chapter 8. Troubleshooting . . . . . . 71Trace logging . . . . . . . . . . . . . . 72
Overview of log file management . . . . . . 72Principal trace log files . . . . . . . . . 73Examples: Using trace logs . . . . . . . . 76RAS trace parameters . . . . . . . . . . 77Dynamic modification of trace settings . . . . 80Setting trace parameters for the Tivoli EnterpriseConsole server . . . . . . . . . . . . 83
Problems and workarounds . . . . . . . . . 83Installation and configuration troubleshooting . . 83Remote deployment troubleshooting . . . . . 86Agent troubleshooting . . . . . . . . . . 87Workspace troubleshooting . . . . . . . . 89Situation troubleshooting . . . . . . . . . 91Take Action commands troubleshooting . . . . 94
Support information . . . . . . . . . . . 94
Appendix A. IBM Tivoli EnterpriseConsole event mapping . . . . . . . 95
Appendix B. Documentation library 103Prerequisite publications. . . . . . . . . . 103Related publications . . . . . . . . . . . 104Other sources of documentation . . . . . . . 104
Accessibility . . . . . . . . . . . . 105
Notices . . . . . . . . . . . . . . 107Trademarks . . . . . . . . . . . . . . 109
Index . . . . . . . . . . . . . . . 111
© Copyright IBM Corp. 2010, 2011 iii

iv IBM Tivoli Monitoring for Virtual Environments Agent for NetApp Storage User's Guide
Tables
1. Capacity planning for historical data logged bythe NetApp Storage agent. . . . . . . . 59
2. Information to gather before contacting IBMSoftware Support . . . . . . . . . . 71
3. Trace log files for troubleshooting agents 734. Problems and solutions for installation and
configuration . . . . . . . . . . . . 845. General problems and solutions for
uninstallation . . . . . . . . . . . . 85
6. Remote deployment problems and solutions 877. Agent problems and solutions . . . . . . 878. Workspace problems and solutions. . . . . 899. Situation problems and solutions . . . . . 91
10. Take Action commands problems andsolutions . . . . . . . . . . . . . 94
© Copyright IBM Corp. 2010, 2011 v

vi IBM Tivoli Monitoring for Virtual Environments Agent for NetApp Storage User's Guide
Chapter 1. Overview of the agent
The IBM® Tivoli® Monitoring for Virtual Environments Agent for NetApp Storage provides you with thecapability to monitor NetApp and IBM N Series storage systems through NetApp DataFabric Manager(DFM). IBM Tivoli Monitoring is the base software for the NetApp Storage agent.
IBM Tivoli Monitoring overview
IBM Tivoli Monitoring provides a way to monitor the availability and performance of all the systems inyour enterprise from one or several designated workstations. It also provides useful historical data thatyou can use to track trends and to troubleshoot system problems.
You can use IBM Tivoli Monitoring to achieve the following tasks:v Monitor for alerts on the systems that you are managing by using predefined situations or custom
situations.v Establish your own performance thresholds.v Trace the causes leading to an alert.v Gather comprehensive data about system conditions.v Use policies to take actions, schedule work, and automate manual tasks.
The Tivoli Enterprise Portal is the interface for IBM Tivoli Monitoring products. You can use theconsolidated view of your environment as seen in the Tivoli Enterprise Portal to monitor and resolveperformance issues throughout the enterprise.
See the IBM Tivoli Monitoring publications listed in “Prerequisite publications” on page 103 for completeinformation about IBM Tivoli Monitoring and the Tivoli Enterprise Portal.
Functions of the monitoring agent
Displays health and performance of NetApp and IBM N series storage systemsYou can use the NetApp Storage agent to visualize capacity, latency, and throughput performancemetrics of NetApp and IBM N series storage systems.
Helps identify poorly performing storage system objectsThe NetApp Storage agent collects several important performance metrics for four importantNetApp storage objects: hosts (filers), aggregates, volumes, and logical unit numbers (LUNs);sorts object lists by performance metrics to show the least healthy or busiest objects at the top;and displays trend graphs of the same performance metrics when showing an object in detail.
Interoperates with the VMware VI agentThe NetApp Storage agent interoperates with the IBM Tivoli Monitoring for Virtual EnvironmentsAgent for VMware VI and provides data sharing and workspace linking between the NetAppStorage agent and the VMware VI agent. The detailed workspaces for NFS data stores in theVMware VI agent can show detailed data about related NetApp volume. Clicking a link fromthat VMware VI data store workspace takes you to the detailed workspace of the related volumein the NetApp Storage agent.
Helps isolate VM guest performance problemsYou can use the NetApp agent to isolate performance problems in their NetApp storage systems,and in cooperation with the VMware VI agent, see how storage system problems might beaffecting VM guest performance. Links within the NetApp Storage agent workspaces make iteasy to drill up and down in the hierarchy of the NetApp storage system objects to see the statusand performance metrics of related objects.
© Copyright IBM Corp. 2010, 2011 1

Performs discovery and monitoring with the DFM server focal pointEach agent instance connects to a single NetApp DFM server. The DFM server discovers theobjects in the NetApp storage system. Only one set of user credentials is required to monitor allthe objects in the storage system. Additional agent instances can monitor additional DFM serversallowing operational monitoring of very large NetApp storage installations from a single TivoliEnterprise Portal.
New in this releaseFor version 7.1 of the NetApp Storage agent, the following enhancements have been made since version6.2.3:v Added a new attribute group.
The Host Network Interfaces attribute group contains information about network interfaces for a filer,including the interface name, IP address, physical address, operational status, and packet transmissionand reception counts.
v Provides data to IBM Tivoli Monitoring for Virtual Environments Dashboard.
Components of the IBM Tivoli Monitoring environmentAfter you install and set up the NetApp Storage agent, you have an environment that contains the client,server, and monitoring agent implementation for IBM Tivoli Monitoring.
This IBM Tivoli Monitoring environment contains the following components:
Tivoli Enterprise Portal clientThe portal has a user interface based on Java™ for viewing and monitoring your enterprise.
Tivoli Enterprise Portal ServerThe portal server is placed between the client and the Tivoli Enterprise Monitoring Server andenables retrieval, manipulation, and analysis of data from the monitoring agents. The TivoliEnterprise Portal Server is the central repository for all user data.
Tivoli Enterprise Monitoring ServerThe monitoring server acts as a collection and control point for alerts received from themonitoring agents, and collects their performance and availability data. The Tivoli EnterpriseMonitoring Server is also a repository for historical data.
Tivoli Enterprise Monitoring Agent, NetApp Storage agent (one or more instances of the monitoringagent) The instances communicate with the systems or subsystems that you want to monitor. This
monitoring agent collects and distributes data to a Tivoli Enterprise Portal Server.
IBM Tivoli Enterprise Console®
The Tivoli Enterprise Console is an optional component that acts as a central collection point forevents from a variety of sources, including events from other Tivoli software applications, Tivolipartner applications, custom applications, network management platforms, and relationaldatabase systems. You can view these events through the Tivoli Enterprise Portal (by using theevent viewer), and you can forward events from IBM Tivoli Monitoring situations to the TivoliEnterprise Console component.
IBM Tivoli Netcool/OMNIbusTivoli Netcool/OMNIbus is an optional component and an alternative to the Tivoli EnterpriseConsole. The Netcool/OMNIbus software is a service level management (SLM) system thatdelivers real-time, centralized monitoring of complex networks and IT domains. The TivoliNetcool/OMNIbus components work together to collect and manage network event information.
Tivoli Common ReportingTivoli Common Reporting is a separately installable feature available to users of Tivoli softwarethat provides a consistent approach to generating and customizing reports. Some individualproducts provide reports that are designed for use with Tivoli Common Reporting and have a
2 IBM Tivoli Monitoring for Virtual Environments Agent for NetApp Storage User's Guide
consistent look and feel. For IBM Tivoli Monitoring for Virtual Environments, you can use TivoliCommon Reporting as a separate installation or as part of the IBM Tivoli Monitoring for VirtualEnvironments Performance and Capacity Management Reports capability.
IBM Tivoli Monitoring for Virtual Environments Dashboard, reporting, and Capacity Plannercapabilities
The dashboard capability provides a summary view of the health of the entire environment soyou can quickly assess if a problem exists and take action to address the problem. Predefinedperformance and capacity management reports provide a complete assessment of the capacity(including forecast) of the virtual environment based on actual historical usage. Capacity planneranalytics and reports provide the ability to create what-if planning scenarios that can be used tooptimize and consolidate the virtual environment.
Agent Management ServicesYou can use IBM Tivoli Monitoring Agent Management Services to manage the NetApp Storage agent.
Agent Management Services is available for the following IBM Tivoli Monitoring OS agents: Windows,Linux, and UNIX. The services are designed to keep the NetApp Storage agent available, and to provideinformation about the status of the product to the Tivoli Enterprise Portal. IBM Tivoli Monitoring V6.2.2,Fix Pack 1 or later provides support for Agent Management Services. For more information about AgentManagement Services, see the IBM Tivoli Monitoring Administrator's Guide, "Agent Management Services"chapter.
User interface optionsInstallation of the base Tivoli monitoring software and other integrated applications provides a variety ofinterfaces that you can use to work with your resources and data.
The following interfaces are available:
Tivoli Enterprise Portal user interfaceYou can run the Tivoli Enterprise Portal as a desktop application or a browser application. Theclient interface is a graphical user interface (GUI) based on Java on a Windows or Linuxworkstation. The browser application is automatically installed with the Tivoli Enterprise PortalServer. The desktop application is installed by using the Tivoli Monitoring installation media orwith a Java Web Start application. To start the Tivoli Enterprise Portal browser client in yourInternet browser, enter the URL for a specific Tivoli Enterprise Portal browser client installed onyour Web server.
Command-line interfaceYou can use IBM Tivoli Monitoring commands to manage the Tivoli Monitoring components andtheir configuration. You can also run commands at the Tivoli Enterprise Console event server orthe Tivoli Netcool/OMNIbus ObjectServer to configure event synchronization for enterprisesituations.
Manage Tivoli Enterprise Monitoring Services windowYou can use the window for the Manage Tivoli Enterprise Monitoring Services utility to configurethe agent and start Tivoli services not designated to start automatically.
IBM Tivoli Enterprise ConsoleYou can use the Tivoli Enterprise Console to help ensure the optimal availability of an IT servicefor an organization. The Tivoli Enterprise Console is an event management application thatintegrates system, network, database, and application management.
IBM Tivoli Netcool/OMNIbus event listYou can use the event list to monitor and manage alerts. An alert is created when theObjectServer receives an event, alarm, message, or data item. Each alert is made up of columns(or fields) of information that are held in a row in the ObjectServer alerts.status table. The Tivoli
Chapter 1. Overview of the agent 3
Netcool/OMNIbus web GUI is also a web-based application that processes network events fromone or more data sources and presents the event data in various graphical formats.
Tivoli Common ReportingUse the Tivoli Common Reporting web user interface when you have installed Tivoli CommonReporting separately. In this interface, you specify report parameters and other report properties,generate formatted reports, schedule reports, and view reports. This user interface is based on theTivoli Integrated Portal.
IBM Tivoli Monitoring for Virtual Environments Dashboard, reporting, and Capacity Plannercapabilities
This user interface is based on the Tivoli Integrated Portal. The Dashboard provides predefinedcontextual summary views of the health (availability, performance, and capacity) of the completevirtual environment. Performance and Capacity Management Reports provides predefinedCognos-based reports that contain historical data, and a data model with tools for creating ad hocreports. Capacity Planner provides you with a tool to import data for analysis and observe trendsand patterns that you use to generate recommendations and create reports in the dashboard.
4 IBM Tivoli Monitoring for Virtual Environments Agent for NetApp Storage User's Guide
Chapter 2. Agent installation and configuration
Agent installation and configuration requires the use of the IBM Tivoli Monitoring Installation and SetupGuide and agent-specific installation and configuration information.
Before installing and configuring the agent, make sure your environment meets the requirements for theIBM Tivoli Monitoring for Virtual Environments Agent for NetApp Storage. See the Prerequisites topic forthe agent in the the IBM Tivoli Monitoring for Virtual Environments information center.
To install and configure the NetApp Storage agent, use the procedures for installing monitoring agents inthe IBM Tivoli Monitoring Installation and Setup Guide along with the agent-specific installation andconfiguration information.
If you are doing a silent installation by using a response file, see that information in the IBM TivoliMonitoring Installation and Setup Guide.
Language pack installationThe steps for installing language packs depend on which operating system and mode of installation youare using.
To install a language pack for the agent support files on the Tivoli Enterprise Monitoring Server, theTivoli Enterprise Monitoring Agent, and the Tivoli Enterprise Portal Server, make sure that you installedthe product in the English language. Then use the steps for the operating system or mode of installationyou are using:v “Installing language packs on Windows systems”v “Installing language packs on UNIX or Linux systems” on page 6v “Silent installation of language packs for agents” on page 6
Installing language packs on Windows systemsYou can install the language packs on a Windows system.
Before you begin
First, make sure that you installed the product in the English language.
Procedure1. On the language pack CD, double-click the lpinstaller.bat file to start the installation program.2. Select the language of the installer and click OK.3. In the Introduction panel, click Next
4. Click Add/Update and click Next.5. Select the folder where the National Language Support package (NLSPackage) files are located.
Typically, the NLSPackage files are located in the nlspackage folder where the installer executablefile is located.
6. Select the language support for the agent of your choice and click Next. To make multiple selections,press Ctrl and select the language that you want.
7. Select the languages that you want to install and click Next.8. Examine the installation summary page and click Next to begin installation.9. After installation completes, click Finish to exit the installer.
© Copyright IBM Corp. 2010, 2011 5
10. Restart the Tivoli Enterprise Portal, Tivoli Enterprise Portal Server, and Eclipse Help Server if any ofthese components are installed.
Installing language packs on UNIX or Linux systemsYou can install the language packs on a UNIX or Linux system.
Before you begin
First, make sure that you installed the product in the English language.
Procedure1. Enter the following command to create a temporary directory on the computer. Make sure that the
full path of the directory does not contain any spaces: mkdir dir_name
2. Mount the language pack CD to the temporary directory that you created.3. Enter the following command to start the installation program: cd dir_name lpinstaller.sh -c
install_dir where install_dir is where you installed IBM Tivoli Monitoring. Typically, the directoryname is /opt/IBM/ITM for AIX® and Linux systems.
4. Select the language of the installer and click OK.5. In the Introduction panel, click Next.6. Click Add/Update and click Next.7. Select the folder where the National Language Support package (NLSPackage) files are located.
Typically, the NLSPackage files are located in the nlspackage folder where the installer executable fileis located.
8. Select the language support for the agent of your choice and click Next. To make multiple selections,press Ctrl and select the language that you want.
9. Select the languages that you want to install and click Next.10. Examine the installation summary page and click Next to begin installation.11. After installation completes, click Finish to exit the installer.12. Restart the Tivoli Enterprise Portal, Tivoli Enterprise Portal Server, and Eclipse Help Server if any of
these components are installed.
Silent installation of language packs for agentsYou can use the silent-mode installation method to install the language packs. In silent mode, theinstallation process obtains the installation settings from a predefined response file. It does not promptyou for any information.
Before you begin
First, make sure that you installed the product in the English language.
Procedure1. Copy and paste the ITM_Agent_LP_silent.rsp response file template as shown in“Response file
example” on page 7.2. Change the following parameter settings:
NLS_PACKAGE_FOLDERFolder where the National Language Support package (NLSPackage) files are located.Typically, the NLSPackage files are located in the nlspackage folder, for example:NLS_PACKAGE_FOLDER = //tmp//LP//nlspackage.
6 IBM Tivoli Monitoring for Virtual Environments Agent for NetApp Storage User's Guide
PROD_SELECTION_PKGName of the language pack to install. Several product components can be included in onelanguage package. You might want to install only some of the available components in alanguage pack.
BASE_AGENT_FOUND_PKG_LISTAgent for which you are installing language support. This value is usually the same asPROD_SELECTION_PKG.
LANG_SELECTION_LISTLanguage you want to install.
3. Enter the command to install the language pack with a response file (silent installation):v For Windows systems:
lpinstaller.bat -f path_to_response_file
v For UNIX or Linux systems:lpinstaller.sh -c candle_home -f path_to_response_file
where candle_home is the IBM Tivoli Monitoring base directory.
Response file example# IBM Tivoli Monitoring Agent Language Pack Silent Installation Operation##This is a sample response file for silent installation mode for the IBM Tivoli#Monitoring Common Language Pack Installer.#.#This file uses the IBM Tivoli Monitoring Common Agent Language Pack with the#install package as an example.#Note:#This response file is for the INSTALLATION of language packs only.#This file does not support UNINSTALLATION of language packs in silent mode.#-------------------------------------------------------------------------------#-------------------------------------------------------------------------------#To successfully complete a silent installation of the the example of Common Agent#localization pack, complete the following steps:##1.Copy ITM_Agent_LP_silent.rsp to the directory where lpinstaller.bat or#lpinstaller.sh is located (IBM Tivoli Monitoring Agent Language Pack build#location).##2.Modify the response file so that it is customized correctly and completely for#your site.# Complete all steps listed below in the response file.##3.After customizing the response file, invoke the silent installation using the#following command:#For Windows:# lpinstaller.bat -f <path_to_response_file>#For UNIX and Linux:# lpinstaller.sh -c <candle_home> -f <path_to_response_file>#Note:<candle_home> is the IBM Tivoli Monitoring base directory.#--------------------------------------------------------------------------------#--------------------------------------------------------------------------------#Force silent install mode.#--------------------------------------------------------------------------------INSTALLER_UI=silent#---------------------------------------------------------------------------------#Run add and update actions.#---------------------------------------------------------------------------------CHOSEN_INSTALL_SET=ADDUPD_SET#---------------------------------------------------------------------------------#NLS Package Folder, where the NLS Packages exist.#For Windows:# Use the backslash-backslash(\\) as a file separator (for example,
Chapter 2. Agent installation and configuration 7
#C:\\zosgmv\\LCD7-3583-01\\nlspackage).#For UNIX and Linux:# Use the slash-slash (//) as a file separator (for example,#//installtivoli//lpsilenttest//nlspackage).#---------------------------------------------------------------------------------#NLS_PACKAGE_FOLDER=C:\\zosgmv\\LCD7-3583-01\\nlspackageNLS_PACKAGE_FOLDER=//tmp//LP//nlspackage#---------------------------------------------------------------------------------#List the packages to process; both variables are required.#Each variable requires that full paths are specified.#Separate multiple entries with a semicolon (;).#For Windows:# Use the backslash-backslash(\\) as a file separator.#For Unix and Linux:# Use the slash-slash (//) as a file separator.#---------------------------------------------------------------------------------#PROD_SELECTION_PKG=C:\\zosgmv\\LCD7-3583-01\\nlspackage\\KIP_NLS.nlspkg#BASE_AGENT_FOUND_PKG_LIST=C:\\zosgmv\\LCD7-3583-01\\nlspackage\\KIP_NLS.nlspkgPROD_SELECTION_PKG=//tmp//LP//nlspackage//kex_nls.nlspkg;//tmp//LP//nlspackage//koq_nls.nlspkgBASE_AGENT_FOUND_PKG_LIST=//tmp//LP//nlspackage//kex_nls.nlspkg;//tmp//LP//nlspackage//koq_nls.nlspkg#--------------------------------------------------------------------------------#List the languages to process.#Separate multiple entries with semicolons.#--------------------------------------------------------------------------------LANG_SELECTION_LIST=pt_BR;fr;de;it;ja;ko;zh_CN;es;zh_TW
Agent-specific installation and configurationIn addition to the installation and configuration information in the IBM Tivoli Monitoring Installation andSetup Guide, use the agent-specific installation and configuration information to install NetApp Storageagent.
User IDThe monitoring agent requires a user ID with a minimum privilege of GlobalRead on the NetApp datasource that is being monitored. The user ID is used by the NetApp Storage agent to communicate withthe NetApp DFM Server.
Create a user ID in your NetApp storage system. For more information on how to create the user ID inyour NetApp storage system, see the NetApp documentation.
Number of instancesAdditional instances of this monitoring agent increase the load on the DFM server and provideredundant information.
Keep the number of instances of the NetApp Storage agent that you configure for the same data sourceto a minimum, preferably one.
NetApp Storage agent application supportAll agents require that you install application support files containing agent-specific information on themonitoring server, portal server, and portal desktop client.
See the IBM Tivoli Monitoring Installation and Setup Guide for information about installing applicationsupport.
8 IBM Tivoli Monitoring for Virtual Environments Agent for NetApp Storage User's Guide
Downloading and installing the NetApp Manageability SDK JAR fileThe NetApp Storage agent requires the NetApp Manageability SDK JAR file to communicate with aNetApp DFM server.
About this task
After the NetApp Storage agent is installed, the NetApp Manageability SDK JAR file (manageontap.jar)must be downloaded from the NetApp website and installed in the monitoring agent lib directory.
Procedure1. Download a compressed file containing the JAR file from http://communities.netapp.com/docs/
DOC-1152.2. When this compressed file has been downloaded and extracted, copy the manageontap.jar file to the
following locations:a. For 32-bit and 64-bit systems Windows systems, copy the file to install_dir/tmaitm6.b. For 32-bit Linux systems, copy the file to install_dir/li6263/nu/lib.c. For 64-bit x86-64 Linux systems, copy the file to install_dir/lx8266/nu/lib.d. For 64-bit zLinux systems, copy the file to install_dir/ls3266/nu/lib.
Configuration valuesFor both local and remote configuration, you provide the configuration values for the agent to operate.
When you are configuring an agent, a panel is displayed so you can enter each value. When a defaultvalue exists, this value is pre-entered into the field. If a field represents a password, two entry fields aredisplayed. You must enter the same value in each field. The values you type are not displayed to helpmaintain the security of these values.
The configuration for this agent is organized into the following groups:
Data Provider (DATA_PROVIDER)
Maximum Number Of Data Provider Log Files (KNU_LOG_FILE_MAX_COUNT)The number of log files the data provider produces before overwriting previous log files.The default value is 10.
Maximum Size in KB of Each Data Provider Log (KNU_LOG_FILE_MAX_SIZE)The maximum amount of data (in kilobytes) that the data provider writes to a single logfile before creating a new log file. The default value is 5190.
Level of Detail in Data Provider Log. (KNU_LOG_LEVEL)The amount of detail that the data provider includes in its log files. The default value isInfo. Log levels include the following log messages:v Off: No messages are logged.v Severe: Only errors are logged.v Warning: Everything that is logged at the Severe level and potential errors that might
result in undesirable behavior.v Info: Everything that is logged at the Warning level and high-level informational
messages that describe the state of the data provider as it executes.v Fine: Everything that is logged at the Info level and low-level informational messages
that describe the state of the data provider as it executes.v Finer: Everything that is logged at the Fine level plus highly-detailed informational
messages, such as performance profiling information and debug data. Choosing this
Chapter 2. Agent installation and configuration 9
option can adversely affect the performance of the monitoring agent. This setting isintended only as a tool for problem determination in conjunction with IBM supportstaff.
v Finest: Everything that is logged at the Fine level and the most detailed informationalmessages, including low-level programming messages and data. Choosing this optionmight adversely affect the performance of the monitoring agent. This setting isintended only as a tool for problem determination in conjunction with IBM supportstaff.
v All: All messages are logged.
DataFabric Manager (Data Source)
Server (KNU_DATASOURCE_HOST_ADDRESS)The host name or IP address of the NetApp DFM server that will be monitored.
User (KNU_DATASOURCE_USERNAME)A user name on the NetApp DFM server that has sufficient privileges to collectmonitoring
Password (KNU_DATASOURCE_PASSWORD)The password for the user name in this section.
Protocol (KNU_DATASOURCE_PROTOCOL)The protocol over which to communicate with the NetApp DFM server. HTTPS is thedefault.
Remote installation and configurationYou can install the monitoring agent remotely from the Tivoli Enterprise Portal or from the commandline.
When installing the agent remotely, you must provide the configuration values for the agent to operate.See “Configuration values” on page 9.
To install from the portal, see the IBM Tivoli Monitoring Installation and Setup Guide.
To remotely install or configure an agent through the Tivoli Enterprise Portal, you must have installed theapplication support for that agent (Tivoli Enterprise Monitoring Server, Tivoli Enterprise Portal Server,and Tivoli Enterprise Portal). You must also have installed the agent bundle into the Remote DeployDepot.
See the tacmd describeSystemType section in the IBM Tivoli Monitoring Command Reference for informationabout displaying the configuration options that are available to use with the configureSystem oraddSystem commands.
If you are using the command line, the following command is an example of remote installation andconfiguration for Windows operating systems:tacmd addSystem -t NU -n OSAgentManagedSystemName -p INSTANCE=InstanceName \
KNU_LOG_FILE_MAX_COUNT=LogFileMaxCount \KNU_LOG_FILE_MAX_SIZE=LogFileMaxSize \KNU_LOG_LEVEL=LogLevel \KNU_DATASOURCE_HOST_ADDRESS=HostAddress \KNU_DATASOURCE_PROTOCOL=Protocol \KNU_DATASOURCE_USERNAME=Username \KNU_DATASOURCE_PASSWORD=Password
In this command, the fields are defined as follows. For more information, see “Configuration values” onpage 9.
10 IBM Tivoli Monitoring for Virtual Environments Agent for NetApp Storage User's Guide
OSAgentManagedSystemNameThe managed system name of the OS agent that is running on the system to which the NetAppStorage agent is to be remotely deployed.
InstanceNameThe name of the instance being deployed.
LogFileMaxCountThe maximum number of data provider log files. Valid values are positive integers.
LogFileMaxSizeThe maximum size (in kilobytes) of each data provider log. Valid values are positive integers.
LogLevelThe level of detail in data provider logs. Valid values are OFF, SEVERE, WARNING, INFO, FINE, FINER,FINEST, and ALL.
HostAddressThe host name or IP address of the NetApp DFM server that is to be monitored.
UsernameA user name on the NetApp DFM server.
PasswordThe password for the user name in Username.
ProtocolThe protocol over which to communicate with the NetApp DFM server. Valid values are HTTP andHTTPS.
Chapter 2. Agent installation and configuration 11

12 IBM Tivoli Monitoring for Virtual Environments Agent for NetApp Storage User's Guide
Chapter 3. Workspaces reference
A workspace is the working area of the Tivoli Enterprise Portal application window. The Navigator treethat is displayed at the left of the workspace contains a list of the workspaces provided by the agent.
About workspaces
Use the Navigator tree that is displayed at the left of the workspace to select the workspace you want tosee. As part of the application window, the right side of the status bar shows the Tivoli Enterprise PortalServer name and port number to which the displayed information applies and the ID of the current user.
When you select an item in the Navigator tree, a default workspace is displayed. When you right-click aNavigator item, a menu that includes a Workspace item is displayed. The Workspace item contains a listof workspaces for that Navigator item. Each workspace has at least one view. Some views have links toother workspaces. You can also use the Workspace Gallery tool as described in the Tivoli Enterprise PortalUser's Guide to open workspaces.
The workspaces in the Navigator are displayed in a Physical view that shows your enterprise as aphysical mapping or a dynamically populated logical view that is agent-specific. You can also create aLogical view. The Physical view is the default view.
This monitoring agent provides predefined workspaces. You cannot modify or delete the predefinedworkspaces, but you can create new workspaces by editing them and saving the changes with a differentname.
Workspace views can be any combination of query-based views, event views, and special purpose views.
Additional information about workspaces
For more information about creating, customizing, and working with workspaces, see the Tivoli EnterprisePortal User's Guide
For a list of the predefined workspaces for this monitoring agent and a description of each workspace,see Predefined workspaces and the information about each individual workspace.
Some attribute groups for this monitoring agent might not be represented in the predefined workspacesor views for this agent. For a full list of the attribute groups, see “Attribute groups for the monitoringagent” on page 19.
Predefined workspacesThe NetApp Storage agent provides predefined workspaces, which are organized by Navigator item.v NetApp Storage Navigator item
– NetApp Storage workspacev Aggregates Navigator item
– Aggregate Detail workspace– Aggregates workspace
v Hosts Navigator item– Host Detail workspace– Hosts workspace
© Copyright IBM Corp. 2010, 2011 13
v LUNs Navigator item– LUN Detail workspace– LUNs workspace
v Volumes Navigator item– Volume Detail workspace– Volumes workspace
Workspace descriptionsEach workspace description provides information about the workspace such as the purpose and a list ofviews in the workspace.
Workspaces are listed under Navigator items.
NetApp Storage Navigator itemThe workspace descriptions are organized by the Navigator item to which the workspaces are relevant.
NetApp Storage workspaceThis workspace shows the status of hosts, aggregates, volumes, and LUNs (logical unit numbers).Each type of object is shown in its own view, and the view is sorted with the worst status at thetop of the list. Each row has a link to a detailed workspace for the object.
This workspace contains the following views:
Hosts StatusThis view shows all the hosts in the monitored storage system. The rows are sorted sothat the host with the worst status sorts to the top of the list. Each host row has a link tothe detailed workspace for that host.
Aggregates StatusThis view shows all the aggregates in the monitored storage system. The rows are sortedso that the aggregate with the worst status sorts to the top of the list. Each aggregate rowhas a link to the detailed workspace for that aggregate.
Volumes StatusThis view shows all the volumes in the monitored storage system. The rows are sorted sothat the volume with the worst status sorts to the top of the list. Each volume row has alink to the detailed workspace for that volume.
LUNs StatusThis view shows all the LUNs in the monitored storage system. The rows are sorted sothat the LUN with the worst status sorts to the top of the list. Each LUN row has a linkto the detailed workspace for that LUN.
Aggregates Navigator itemThe workspace descriptions are organized by the Navigator item to which the workspaces are relevant.
Aggregate Detail workspaceThis workspace shows the performance metrics for a particular aggregate, and the volumes anddisks on which the aggregate relies. Each type of performance metric is shown in its own bargraph or trend graph over the last 60 minutes.
This workspace contains the following views:
Operations per Second - HistoryThis view shows a trend graph of the operations per second for the aggregate in thefollowing categories -- total transfers, user reads, user writes, consistency point reads,user block reads, user block writes, and consistency point block reads.
14 IBM Tivoli Monitoring for Virtual Environments Agent for NetApp Storage User's Guide
Percent Used - HistoryThis view shows a trend graph of the percent of available storage used for the aggregateover the last 60 minutes.
Size This view shows a bar graph of the current storage sizes for the aggregate in thefollowing categories: amount used, amount available, total size, and total spacecommitted.
AggregateThis view shows the most recent detailed data collected for the aggregate.
VolumesThis view shows the volumes on which this aggregate relies. Each volume row has a linkto the detailed workspace for that volume. You can use the link to drill down to theperformance metrics for the volume and the LUNs on which this volume relies.
Aggregates workspaceThis workspace shows the performance metrics for the aggregates. Each performance metric isshown in its own view, sorted with the highest transfer operation rate, percent used, file accessrate, or block access rate shown at the top of the list
This workspace contains the following views:
Aggregates by Total TransfersThis view shows all the aggregates in the monitored storage system. The rows are sortedso that the aggregate with the most transfer operations per second sorts to the top of thelist. Each row has a link to the detailed workspace for that aggregate.
Aggregates by Percent UsedThis view shows all the aggregates in the monitored storage system. The rows are sortedso that the aggregate with the highest percent used sorts to the top of the list. Eachaggregate row has a link to the detailed workspace for that aggregate.
Aggregates by File Access RateThis view shows all the aggregates in the monitored storage system. The rows are sortedso that the aggregate with the highest file access rate sorts to the top of the list. Eachaggregate row has a link to the detailed workspace for that aggregate.
Aggregates by Block Access RateThis view shows all the aggregates in the monitored storage system. The rows are sortedso that the aggregate with the highest block access rate sorts to the top of the list. Eachaggregate row has a link to the detailed workspace for that aggregate.
Hosts Navigator itemThe workspace descriptions are organized by the Navigator item to which the workspaces are relevant.
Host Detail workspaceThis workspace shows the performance metrics for a particular host, and the aggregates andvolumes on which the host relies. Each type of performance metric is shown in its own trendgraph over the last 60 minutes.
This workspace contains the following views:
Operations per Second - HistoryThis view shows a trend graph of the operations per second over the last 60 minutes forthe host in the following categories: CIFS, FCP, iSCSI, and NFS.
CPU Busy - HistoryThis view shows a trend graph of the CPU utilization percent for the host over the last 60minutes.
Chapter 3. Workspaces reference 15
Data Transfer Rate - HistoryThis view shows a trend graph of the data transfer rate for the host over the last 60minutes in the following categories: disk data read, disk data written, network datareceived, and network data sent.
Host This view shows the most recent detailed data collected for the host.
AggregatesThis view shows the aggregates on which this host relies. Each aggregate row has a linkto the detailed workspace for that aggregate, allowing you to drill down to theperformance metrics for the aggregate and its volumes and disks.
VolumesThis view shows the volumes on which this host relies. Each volume row has a link tothe detailed workspace for that volume. You can use the link to drill down and see theperformance metrics for the volume and the LUNs on which this volume relies.
Hosts workspaceThis workspace shows the performance metrics of the hosts. Each type of performance metric isshown in its own view, sorted with the highest operations per second, CPU percent, or datatransfer rate shown at the top of the list
This workspace contains the following views:
Hosts by Operations per SecondThis view shows all the hosts in the monitored storage system. The rows are sorted sothat the host with the most total operations per second sorts to the top of the list. Eachhost row has a link to the detailed workspace for that host.
Hosts by CPU PercentThis view shows all the hosts in the monitored storage system. The rows are sorted sothat the host with the highest CPU utilization percent sorts to the top of the list. Eachhost row has a link to the detailed workspace for that host.
Hosts by Data RateThis view shows all the hosts in the monitored storage system. The rows are sorted sothat the host with the highest data transfer rate sorts to the top of the list. Each host rowhas a link to the detailed workspace for that host.
LUNs Navigator itemThe workspace descriptions are organized by the Navigator item to which the workspaces are relevant.
LUN Detail workspaceThis workspace shows the performance metrics for a particular LUN. Each type of performancemetric is shown in its trend graph over the last 60 minutes.
This workspace contains the following views:
Operations per Second - HistoryThis view shows a trend graph of the operations per second over the last 60 minutes forthe LUN in the following categories: read ops, write ops, and other ops.
Average Latency - HistoryThis view shows a trend graph of the average latency for the LUN over the last 60minutes.
LUN This view shows the most recent detailed data collected for the LUN.
LUNs workspaceThis workspace shows the performance metrics of the LUNs. Each performance metric is shownin its own view, sorted with the highest average latency or operations per second shown at thetop of the list.
16 IBM Tivoli Monitoring for Virtual Environments Agent for NetApp Storage User's Guide
This workspace contains the following views:
LUNs by Operations per SecondThis view shows all the LUNs in the monitored storage system. The rows are sorted sothat the LUN with the most operations per second sorts to the top of the list. Each rowhas a link to the detailed workspace for that LUN.
LUNs by Average LatencyThis view shows all the LUNs in the monitored storage system. The rows are sorted sothat the LUN with the highest latency sorts to the top of the list. Each row has a link tothe detailed workspace for that LUN.
Volumes Navigator itemThe workspace descriptions are organized by the Navigator item to which the workspaces are relevant.
Volume Detail workspaceThis workspace shows the performance metrics for a particular volume, and the LUNs on whichthe volume relies. Each type of performance metric is shown in its trend graph over the last 60minutes.
This workspace contains the following views:
Operations Per Second - HistoryThis view shows a trend graph of the operations per second for the volume over the last60 minutes in the following categories: total ops, read ops, write ops, and other ops.
Latency - HistoryThis view shows a trend graph of the latency for the volume over the last 60 minutes inthe following categories: read latency, write latency, and other latency.
Data Transfer Rate - HistoryThis view shows a trend graph of the data transfer rate for the volume over the last 60minutes in the following categories: read data and write data.
Percent Used - HistoryThis view shows a trend graph of the percent of available storage used for the volumeover the last 60 minutes in the following categories: AFS™, overwrite reserve, andsnapshot reserve.
VolumeThis view shows the most recent detailed data collected for the volume.
LUNs This view shows the LUNs on which this volume relies. Each LUN row has a link to thedetailed workspace for that LUN. You can use the link to drill down and see theperformance metrics for the LUN.
Volumes workspaceThis workspace shows the performance metrics of the volumes. Each performance metric isshown in its own view, sorted with the highest operations per second, latency, percent used, ordata transfer rate shown at the top of the list.
This workspace contains the following views:
Volume by Operations per SecondThis view shows all the volumes in the monitored storage system. The rows are sorted sothat the volume with the most operations per second sorts to the top of the list. Each rowhas a link to the detailed workspace for that volume.
Volumes by LatencyThis view shows all the volumes in the monitored storage system. The rows are sorted sothat the volume with the highest latency sorts to the top of the list. Each row has a linkto the detailed workspace for that volume.
Chapter 3. Workspaces reference 17

Volumes by Percent UsedThis view shows all the volumes in the monitored storage system. The rows are sorted sothat the volume with the highest percent used sorts to the top of the list. Each volumerow has a link to the detailed workspace for that volume.
Volumes by Data Transfer RateThis view shows all the volumes in the monitored storage system. The rows are sorted sothat the volume with the highest data transfer rate sorts to the top of the list. Eachvolume row has a link to the detailed workspace for that volume.
18 IBM Tivoli Monitoring for Virtual Environments Agent for NetApp Storage User's Guide
Chapter 4. Attributes reference
Attributes are the application properties that are being measured and reported by the IBM TivoliMonitoring for Virtual Environments Agent for NetApp Storage.
About attributes
Attributes are organized into attribute groups. Attributes in an attribute group relate to a single objectsuch as an application, or to a single kind of data such as status information.
Attributes in a group can be used in queries, query-based views, situations, policy workflows, take actiondefinitions, and launch application definitions. Chart or table views and situations are two examples ofhow attributes in a group can be used:v Chart or table views
Attributes are displayed in chart and table views. The chart and table views use queries to specifywhich attribute values to request from a monitoring agent. You use the Properties editor to apply filtersand set styles to define the content and appearance of a view based on an existing query.
v SituationsYou use attributes to create situations that monitor the state of your operating system, database, orapplication. A situation describes a condition you want to test. When you start a situation, the valuesyou have assigned to the situation attributes are compared with the values collected by the NetAppStorage agent and registers an event if the condition is met. You are alerted to events by indicator iconsthat are displayed in the Navigator.
Additional information about attributes
For more information about using attributes and attribute groups, see the Tivoli Enterprise Portal User'sGuide.
For a list of the attribute groups, a list of the attributes in each attribute group, and descriptions of theattributes for this monitoring agent, see “Attribute groups for the monitoring agent” and “Attributes ineach attribute group” on page 20.
Attribute groups for the monitoring agentThe NetApp Storage agent contains the following attribute groups. The table name depends on themaximum table name limits of the target database being used for the Tivoli Data Warehouse. If themaximum name is 30 characters, any warehouse table name longer than 30 characters is shortened to 30characters.v Attribute group name: Aggregates
– Table name: KNU02AGREG– Warehouse table name: KNU_AGGREGATES or KNU02AGREG
v Attribute group name: Host Network Interfaces– Table name: KNUHOSTNIF– Warehouse table name: KNU_HOST_NETWORK_INTERFACES or KNUHOSTNIF
v Attribute group name: Hosts– Table name: KNU01HOST– Warehouse table name: KNU_HOSTS or KNU01HOST
v Attribute group name: LUNs
© Copyright IBM Corp. 2010, 2011 19
– Table name: KNU04LUN– Warehouse table name: KNU_LUNS or KNU04LUN
v Attribute group name: Performance Object Status– Table name: KNUPOBJST– Warehouse table name: KNU_PERFORMANCE_OBJECT_STATUS or KNUPOBJST
v Attribute group name: Volumes– Table name: KNU03VOL– Warehouse table name: KNU_VOLUMES or KNU03VOL
Attributes in each attribute groupAttributes in each NetApp Storage agent oup collect data that the agent uses for monitoring.
The descriptions of the attribute groups contain the following information:
Historical groupWhether the attribute group is a historical type that you can roll off to a data warehouse.
Attribute descriptionsDescription, type, and Warehouse name (if applicable) for each attribute in the attribute group.
Some attributes are designated as key attributes. A key attribute is an attribute that is used inwarehouse aggregation to identify rows of data that represent the same object.
Aggregates attribute groupThe Aggregate attribute group contains information about aggregates. The information includes name,containing host name, operating status, transfer operation rate, percent used, file access rates, and blockaccess rates.
Historical groupThis attribute group is eligible for use with Tivoli Data Warehouse.
Attribute descriptionsThe following list contains information about each attribute in the Aggregates attribute group:
Node attribute - This attribute is a key attribute.
DescriptionThe managed system name of the agent.
Type String
Warehouse nameNODE
Timestamp attribute
DescriptionThe local time at the agent when the data was collected.
Type String
Warehouse nameTIMESTAMP
Host Name attribute - This attribute is a key attribute.
DescriptionThe name of the host that contains this aggregate.
20 IBM Tivoli Monitoring for Virtual Environments Agent for NetApp Storage User's Guide
Type String with enumerated values. The strings are displayed in the Tivoli EnterprisePortal. The warehouse and queries return the values shown in parentheses. Thefollowing values are defined:v unavailable (unavailable)
Any other values will display the actual value returned by the agent in the TivoliEnterprise Portal.
Warehouse nameHOST_NAME
Aggregate Name attribute - This attribute is a key attribute.
DescriptionThe name of this aggregate.
Type String with enumerated values. The strings are displayed in the Tivoli EnterprisePortal. The warehouse and queries return the values shown in parentheses. Thefollowing values are defined:v unavailable (unavailable)
Any other values will display the actual value returned by the agent in the TivoliEnterprise Portal.
Warehouse nameAGGREGATE_NAME or AGGR_NAME
Aggregate Type attribute
DescriptionThe type of this aggregate, either traditional or aggregate.
Type String with enumerated values. The strings are displayed in the Tivoli EnterprisePortal. The warehouse and queries return the values shown in parentheses. Thefollowing values are defined:v unavailable (unavailable)v traditional (traditional)v aggregate (aggregate)
Any other values will display the actual value returned by the agent in the TivoliEnterprise Portal.
Warehouse nameAGGREGATE_TYPE or AGGR_TYPE
Run Status attribute
DescriptionIndicates how well this aggregate is running.
Type String with enumerated values. The strings are displayed in the Tivoli EnterprisePortal. The warehouse and queries return the values shown in parentheses. Thefollowing values are defined:v unavailable (unavailable)v unknown (unknown)v normal (normal)v information (information)v unmanaged (unmanaged)v warning (warning)v error (error)
Chapter 4. Attributes reference 21
v critical (critical)v emergency (emergency)
Any other values will display the actual value returned by the agent in the TivoliEnterprise Portal.
Warehouse nameRUN_STATUS or RUN_STS
Perf Status attribute
DescriptionIndicates how well this aggregate is performing.
Type String with enumerated values. The strings are displayed in the Tivoli EnterprisePortal. The warehouse and queries return the values shown in parentheses. Thefollowing values are defined:v unavailable (unavailable)v unknown (unknown)v normal (normal)v information (information)v unmanaged (unmanaged)v warning (warning)v error (error)v critical (critical)v emergency (emergency)
Any other values will display the actual value returned by the agent in the TivoliEnterprise Portal.
Warehouse namePERF_STATUS or PERF_STS
Composite Status attribute
DescriptionA composite of the status fields indicating the maximum severity of all the fields.
Type Integer (gauge) with enumerated values. The strings are displayed in the TivoliEnterprise Portal. The warehouse and queries return the values shown inparentheses. The following values are defined:v unavailable (-1)
Any other values will display the actual value returned by the agent in the TivoliEnterprise Portal.
Warehouse nameCOMPOSITE_STATUS or CMP_STS
Size Available attribute
DescriptionThe number of GB available for use in this aggregate.
Type DEFAULT with enumerated values. The strings are displayed in the TivoliEnterprise Portal. The warehouse and queries return the values shown inparentheses. The following values are defined:v unavailable (-1)
Any other values will display the actual value returned by the agent in the TivoliEnterprise Portal.
22 IBM Tivoli Monitoring for Virtual Environments Agent for NetApp Storage User's Guide
Warehouse nameSIZE_AVAILABLE or SIZE_AVAIL
Size Total attribute
DescriptionThe number of GB in this aggregate.
Type DEFAULT with enumerated values. The strings are displayed in the TivoliEnterprise Portal. The warehouse and queries return the values shown inparentheses. The following values are defined:v unavailable (-1)
Any other values will display the actual value returned by the agent in the TivoliEnterprise Portal.
Warehouse nameSIZE_TOTAL or SIZE_TOTL
Size Used attribute
DescriptionThe number of GB in use in this aggregate.
Type DEFAULT with enumerated values. The strings are displayed in the TivoliEnterprise Portal. The warehouse and queries return the values shown inparentheses. The following values are defined:v unavailable (-1)
Any other values will display the actual value returned by the agent in the TivoliEnterprise Portal.
Warehouse nameSIZE_USED
Percent Used attribute
DescriptionThe percentage of total GB used in this aggregate.
Type Real number (gauge) with 1 decimal place of precision with enumerated values.The strings are displayed in the Tivoli Enterprise Portal. The warehouse andqueries return the values shown in parentheses. The following values are defined:v unavailable (-1)
Any other values will display the actual value returned by the agent in the TivoliEnterprise Portal.
Warehouse namePERCENT_USED or PCT_USED
Size Warehouse attribute
DescriptionIndicates whether the size data is to be ignored or included by the warehouse.
Type Integer (gauge) with enumerated values. The strings are displayed in the TivoliEnterprise Portal. The warehouse and queries return the values shown inparentheses. The following values are defined:v Exclude (0)v Include (1)
Any other values will display the actual value returned by the agent in the TivoliEnterprise Portal.
Chapter 4. Attributes reference 23
Warehouse nameSIZE_WAREHOUSE or SIZE_WRHS
Total Space Committed attribute
DescriptionThe total number of GB committed by this aggregate.
Type DEFAULT with enumerated values. The strings are displayed in the TivoliEnterprise Portal. The warehouse and queries return the values shown inparentheses. The following values are defined:v unavailable (-1)
Any other values will display the actual value returned by the agent in the TivoliEnterprise Portal.
Warehouse nameTOTAL_SPACE_COMMITTED or SPACE_CMTD
Committed Warehouse attribute
DescriptionIndicates whether the committed space data is to be ignored or included by thewarehouse.
Type Integer (gauge) with enumerated values. The strings are displayed in the TivoliEnterprise Portal. The warehouse and queries return the values shown inparentheses. The following values are defined:v Exclude (0)v Include (1)
Any other values will display the actual value returned by the agent in the TivoliEnterprise Portal.
Warehouse nameCOMMITTED_WAREHOUSE or CMTD_WRHS
Total Transfers attribute
DescriptionThe total number of transfers per second serviced by this aggregate.
Type DEFAULT with enumerated values. The strings are displayed in the TivoliEnterprise Portal. The warehouse and queries return the values shown inparentheses. The following values are defined:v unavailable (-1)
Any other values will display the actual value returned by the agent in the TivoliEnterprise Portal.
Warehouse nameTOTAL_TRANSFERS or TOTL_XFER
User Reads attribute
DescriptionThe number of user reads per second from this aggregate.
Type DEFAULT with enumerated values. The strings are displayed in the TivoliEnterprise Portal. The warehouse and queries return the values shown inparentheses. The following values are defined:v unavailable (-1)
24 IBM Tivoli Monitoring for Virtual Environments Agent for NetApp Storage User's Guide
Any other values will display the actual value returned by the agent in the TivoliEnterprise Portal.
Warehouse nameUSER_READS or USR_RD
User Writes attribute
DescriptionThe number of user writes per second to this aggregate.
Type DEFAULT with enumerated values. The strings are displayed in the TivoliEnterprise Portal. The warehouse and queries return the values shown inparentheses. The following values are defined:v unavailable (-1)
Any other values will display the actual value returned by the agent in the TivoliEnterprise Portal.
Warehouse nameUSER_WRITES or USR_WR
CP Reads attribute
DescriptionThe number of reads per second done during a CP on this aggregate.
Type DEFAULT with enumerated values. The strings are displayed in the TivoliEnterprise Portal. The warehouse and queries return the values shown inparentheses. The following values are defined:v unavailable (-1)
Any other values will display the actual value returned by the agent in the TivoliEnterprise Portal.
Warehouse nameCP_READS or CP_RD
File Rate attribute
DescriptionThe number of file-based reads and writes per second for this aggregate.
Type DEFAULT with enumerated values. The strings are displayed in the TivoliEnterprise Portal. The warehouse and queries return the values shown inparentheses. The following values are defined:v unavailable (-1)
Any other values will display the actual value returned by the agent in the TivoliEnterprise Portal.
Warehouse nameFILE_RATE
User Read Blocks attribute
DescriptionThe number of blocks read per second from this aggregate.
Type DEFAULT with enumerated values. The strings are displayed in the TivoliEnterprise Portal. The warehouse and queries return the values shown inparentheses. The following values are defined:v unavailable (-1)
Chapter 4. Attributes reference 25
Any other values will display the actual value returned by the agent in the TivoliEnterprise Portal.
Warehouse nameUSER_READ_BLOCKS or USR_RD_BLK
User Write Blocks attribute
DescriptionThe number of blocks written per second to this aggregate.
Type DEFAULT with enumerated values. The strings are displayed in the TivoliEnterprise Portal. The warehouse and queries return the values shown inparentheses. The following values are defined:v unavailable (-1)
Any other values will display the actual value returned by the agent in the TivoliEnterprise Portal.
Warehouse nameUSER_WRITE_BLOCKS or USR_WR_BLK
CP Read Blocks attribute
DescriptionThe number of blocks read per second during a CP on this aggregate.
Type DEFAULT with enumerated values. The strings are displayed in the TivoliEnterprise Portal. The warehouse and queries return the values shown inparentheses. The following values are defined:v unavailable (-1)
Any other values will display the actual value returned by the agent in the TivoliEnterprise Portal.
Warehouse nameCP_READ_BLOCKS or CP_RD_BLK
Block Rate attribute
DescriptionThe number of block-based reads and writes per second for this aggregate.
Type DEFAULT with enumerated values. The strings are displayed in the TivoliEnterprise Portal. The warehouse and queries return the values shown inparentheses. The following values are defined:v unavailable (-1)
Any other values will display the actual value returned by the agent in the TivoliEnterprise Portal.
Warehouse nameBLOCK_RATE
Perf Warehouse attribute
DescriptionIndicates whether the performance data is to be ignored or included by thewarehouse.
Type Integer (gauge) with enumerated values. The strings are displayed in the TivoliEnterprise Portal. The warehouse and queries return the values shown inparentheses. The following values are defined:v Exclude (0)
26 IBM Tivoli Monitoring for Virtual Environments Agent for NetApp Storage User's Guide
v Include (1)
Any other values will display the actual value returned by the agent in the TivoliEnterprise Portal.
Warehouse namePERF_WAREHOUSE or PERF_WRHS
Host Network Interfaces attribute groupThe Host Network Interfaces attribute group contains information about network interfaces for a filer,including the interface name, IP address, physical address, operational status, and packet transmissionand reception counts.
Historical groupThis attribute group is eligible for use with Tivoli Data Warehouse.
Attribute descriptionsThe following list contains information about each attribute in the Host Network Interfacesattribute group:
Node attribute - This attribute is a key attribute.
DescriptionThe managed system name of the agent.
Type String
Warehouse nameNODE
Timestamp attribute
DescriptionThe local time at the agent when the data was collected.
Type String
Warehouse nameTIMESTAMP
Host Name attribute - This attribute is a key attribute.
DescriptionThe name by which this host is known to the rest of the components of thestorage system.
Type String with enumerated values. The strings are displayed in the Tivoli EnterprisePortal. The warehouse and queries return the values shown in parentheses. Thefollowing values are defined:v unavailable (unavailable)
Any other values will display the actual value returned by the agent in the TivoliEnterprise Portal.
Warehouse nameHOST_NAME
Interface Name attribute - This attribute is a key attribute.
DescriptionThe name of the network interface for which data is being displayed.
Type String with enumerated values. The strings are displayed in the Tivoli EnterprisePortal. The warehouse and queries return the values shown in parentheses. Thefollowing values are defined:
Chapter 4. Attributes reference 27
v unavailable (unavailable)
Any other values will display the actual value returned by the agent in the TivoliEnterprise Portal.
Warehouse nameINTERFACE_NAME or INTERFACE
Administrative Status attribute
DescriptionThe desired status of this network interface.
Type String with enumerated values. The strings are displayed in the Tivoli EnterprisePortal. The warehouse and queries return the values shown in parentheses. Thefollowing values are defined:v unavailable (unavailable)v up (up)v down (down)v testing (testing)
Any other values will display the actual value returned by the agent in the TivoliEnterprise Portal.
Warehouse nameADMINISTRATIVE_STATUS or ADM_STATUS
Operational Status attribute
DescriptionThe current operational status of this network interface.
Type String with enumerated values. The strings are displayed in the Tivoli EnterprisePortal. The warehouse and queries return the values shown in parentheses. Thefollowing values are defined:v unavailable (unavailable)v up (up)v down (down)v testing (testing)
Any other values will display the actual value returned by the agent in the TivoliEnterprise Portal.
Warehouse nameOPERATIONAL_STATUS or OP_STATUS
Physical Address attribute
DescriptionThe MAC address of this network interface.
Type String with enumerated values. The strings are displayed in the Tivoli EnterprisePortal. The warehouse and queries return the values shown in parentheses. Thefollowing values are defined:v unavailable (unavailable)
Any other values will display the actual value returned by the agent in the TivoliEnterprise Portal.
Warehouse namePHYSICAL_ADDRESS or PHYS_ADDR
IP Address attribute
28 IBM Tivoli Monitoring for Virtual Environments Agent for NetApp Storage User's Guide
DescriptionThe IP address mapped to this network interface.
Type String with enumerated values. The strings are displayed in the Tivoli EnterprisePortal. The warehouse and queries return the values shown in parentheses. Thefollowing values are defined:v unavailable (unavailable)
Any other values will display the actual value returned by the agent in the TivoliEnterprise Portal.
Warehouse nameIP_ADDRESS or IP_ADDR
Number IP Addresses attribute
DescriptionThe number of IP addresses mapped to this network interface.
Type Integer (gauge) with enumerated values. The strings are displayed in the TivoliEnterprise Portal. The warehouse and queries return the values shown inparentheses. The following values are defined:v unavailable (-1)
Any other values will display the actual value returned by the agent in the TivoliEnterprise Portal.
Warehouse nameNUMBER_IP_ADDRESSES or NUM_IPADDR
Link Speed attribute
DescriptionThe current bandwidth of this network interface in megabits per second (mbps).
Type Integer (gauge) with enumerated values. The strings are displayed in the TivoliEnterprise Portal. The warehouse and queries return the values shown inparentheses. The following values are defined:v unavailable (-1)
Any other values will display the actual value returned by the agent in the TivoliEnterprise Portal.
Warehouse nameLINK_SPEED
Received KB Per Sec attribute
DescriptionThe rate at which this network interface is receiving data in kilobytes per second(KBps).
Type Real number (gauge) with 1 decimal place of precision with enumerated values.The strings are displayed in the Tivoli Enterprise Portal. The warehouse andqueries return the values shown in parentheses. The following values are defined:v unavailable (-1)
Any other values will display the actual value returned by the agent in the TivoliEnterprise Portal.
Warehouse nameRECEIVED_KB_PER_SEC or KB_RECV
Transmitted KB Per Sec attribute
Chapter 4. Attributes reference 29
DescriptionThe rate at which this network interface is transmitting data in kilobytes persecond (KBps).
Type Real number (gauge) with 1 decimal place of precision with enumerated values.The strings are displayed in the Tivoli Enterprise Portal. The warehouse andqueries return the values shown in parentheses. The following values are defined:v unavailable (-1)
Any other values will display the actual value returned by the agent in the TivoliEnterprise Portal.
Warehouse nameTRANSMITTED_KB_PER_SEC or KB_SENT
Packets Received Per Sec attribute
DescriptionThe number of packets this network interface is receiving per second.
Type Real number (gauge) with 1 decimal place of precision with enumerated values.The strings are displayed in the Tivoli Enterprise Portal. The warehouse andqueries return the values shown in parentheses. The following values are defined:v unavailable (-1)
Any other values will display the actual value returned by the agent in the TivoliEnterprise Portal.
Warehouse namePACKETS_RECEIVED_PER_SEC or PACK_RECV
Packets Transmitted Per Sec attribute
DescriptionThe number of packets this network interface is transmitting per second.
Type Real number (gauge) with 1 decimal place of precision with enumerated values.The strings are displayed in the Tivoli Enterprise Portal. The warehouse andqueries return the values shown in parentheses. The following values are defined:v unavailable (-1)
Any other values will display the actual value returned by the agent in the TivoliEnterprise Portal.
Warehouse namePACKETS_TRANSMITTED_PER_SEC or PACK_SENT
Multicast Received Per Sec attribute
DescriptionThe number of multicast packets this network interface is receiving per second.
Type Real number (gauge) with 1 decimal place of precision with enumerated values.The strings are displayed in the Tivoli Enterprise Portal. The warehouse andqueries return the values shown in parentheses. The following values are defined:v unavailable (-1)
Any other values will display the actual value returned by the agent in the TivoliEnterprise Portal.
Warehouse nameMULTICAST_RECEIVED_PER_SEC or MCAST_RECV
Multicast Transmitted Per Sec attribute
30 IBM Tivoli Monitoring for Virtual Environments Agent for NetApp Storage User's Guide
DescriptionThe number of multicast packets this network interface is transmitting persecond.
Type Real number (gauge) with 1 decimal place of precision with enumerated values.The strings are displayed in the Tivoli Enterprise Portal. The warehouse andqueries return the values shown in parentheses. The following values are defined:v unavailable (-1)
Any other values will display the actual value returned by the agent in the TivoliEnterprise Portal.
Warehouse nameMULTICAST_TRANSMITTED_PER_SEC or MCAST_SENT
Errors Received Per Sec attribute
DescriptionThe number of errors per second that occurred on this network interface whilereceiving packets.
Type Real number (gauge) with 1 decimal place of precision with enumerated values.The strings are displayed in the Tivoli Enterprise Portal. The warehouse andqueries return the values shown in parentheses. The following values are defined:v unavailable (-1)
Any other values will display the actual value returned by the agent in the TivoliEnterprise Portal.
Warehouse nameERRORS_RECEIVED_PER_SEC or ERR_RECV
Errors Transmitted Per Sec attribute
DescriptionThe number of errors per second that occurred on this network interface whiletransmitting packets.
Type Real number (gauge) with 1 decimal place of precision with enumerated values.The strings are displayed in the Tivoli Enterprise Portal. The warehouse andqueries return the values shown in parentheses. The following values are defined:v unavailable (-1)
Any other values will display the actual value returned by the agent in the TivoliEnterprise Portal.
Warehouse nameERRORS_TRANSMITTED_PER_SEC or ERR_SENT
Perf Warehouse attribute
DescriptionIndicates whether the performance data is to be ignored or included by thewarehouse.
Type Integer (gauge) with enumerated values. The strings are displayed in the TivoliEnterprise Portal. The warehouse and queries return the values shown inparentheses. The following values are defined:v Exclude (0)v Include (1)
Any other values will display the actual value returned by the agent in the TivoliEnterprise Portal.
Chapter 4. Attributes reference 31
Warehouse namePERF_WAREHOUSE or PERF_WRHS
Hosts attribute groupThe Hosts attribute group typically contains information about filers, although other host types can bereported as well. The information includes name, address, operating status, operations per second, CPUpercent, and data transfer rates.
Historical groupThis attribute group is eligible for use with Tivoli Data Warehouse.
Attribute descriptionsThe following list contains information about each attribute in the Hosts attribute group:
Node attribute - This attribute is a key attribute.
DescriptionThe managed system name of the agent.
Type String
Warehouse nameNODE
Timestamp attribute
DescriptionThe local time at the agent when the data was collected.
Type String
Warehouse nameTIMESTAMP
Host Name attribute - This attribute is a key attribute.
DescriptionThe name by which this host is known to the rest of the components of thestorage system.
Type String with enumerated values. The strings are displayed in the Tivoli EnterprisePortal. The warehouse and queries return the values shown in parentheses. Thefollowing values are defined:v unavailable (unavailable)
Any other values will display the actual value returned by the agent in the TivoliEnterprise Portal.
Warehouse nameHOST_NAME
Host Type attribute
DescriptionSeveral different types of hosts are included. Possible values are: filer, vfiler,cache, agent, ossv, and switch.
Type String with enumerated values. The strings are displayed in the Tivoli EnterprisePortal. The warehouse and queries return the values shown in parentheses. Thefollowing values are defined:v unavailable (unavailable)v filer (filer)v vfiler (vfiler)
32 IBM Tivoli Monitoring for Virtual Environments Agent for NetApp Storage User's Guide
v cache (cache)v agent (agent)v ossv (ossv)v switch (switch)
Any other values will display the actual value returned by the agent in the TivoliEnterprise Portal.
Warehouse nameHOST_TYPE
IP Address attribute
DescriptionThe IP address of this host.
Type String with enumerated values. The strings are displayed in the Tivoli EnterprisePortal. The warehouse and queries return the values shown in parentheses. Thefollowing values are defined:v unavailable (unavailable)
Any other values will display the actual value returned by the agent in the TivoliEnterprise Portal.
Warehouse nameIP_ADDRESS
FQDN attribute
DescriptionThe fully qualified domain name of this host.
Type String with enumerated values. The strings are displayed in the Tivoli EnterprisePortal. The warehouse and queries return the values shown in parentheses. Thefollowing values are defined:v unavailable (unavailable)
Any other values will display the actual value returned by the agent in the TivoliEnterprise Portal.
Warehouse nameFQDN
Description attribute
DescriptionThe user-written description of this host.
Type String with enumerated values. The strings are displayed in the Tivoli EnterprisePortal. The warehouse and queries return the values shown in parentheses. Thefollowing values are defined:v unavailable (unavailable)
Any other values will display the actual value returned by the agent in the TivoliEnterprise Portal.
Warehouse nameDESCRIPTION or DESC
Communication Status attribute
DescriptionIndicates whether communication with this host is up or down.
Chapter 4. Attributes reference 33
Type String with enumerated values. The strings are displayed in the Tivoli EnterprisePortal. The warehouse and queries return the values shown in parentheses. Thefollowing values are defined:v unavailable (unavailable)v unknown (unknown)v up (up)v down (down)
Any other values will display the actual value returned by the agent in the TivoliEnterprise Portal.
Warehouse nameCOMM_STATUS or COMM_STS
Host Status attribute
DescriptionIndicates whether this host is up or down.
Type String with enumerated values. The strings are displayed in the Tivoli EnterprisePortal. The warehouse and queries return the values shown in parentheses. Thefollowing values are defined:v unavailable (unavailable)v unknown (unknown)v up (up)v down (down)
Any other values will display the actual value returned by the agent in the TivoliEnterprise Portal.
Warehouse nameHOST_STATUS or HOST_STS
Run Status attribute
DescriptionIndicates how well this host is running.
Type String with enumerated values. The strings are displayed in the Tivoli EnterprisePortal. The warehouse and queries return the values shown in parentheses. Thefollowing values are defined:v unavailable (unavailable)v unknown (unknown)v normal (normal)v information (information)v unmanaged (unmanaged)v warning (warning)v error (error)v critical (critical)v emergency (emergency)
Any other values will display the actual value returned by the agent in the TivoliEnterprise Portal.
Warehouse nameRUN_STATUS or RUN_STS
Perf Status attribute
34 IBM Tivoli Monitoring for Virtual Environments Agent for NetApp Storage User's Guide
DescriptionIndicates how well this host is performing.
Type String with enumerated values. The strings are displayed in the Tivoli EnterprisePortal. The warehouse and queries return the values shown in parentheses. Thefollowing values are defined:v unavailable (unavailable)v unknown (unknown)v normal (normal)v information (information)v unmanaged (unmanaged)v warning (warning)v error (error)v critical (critical)v emergency (emergency)
Any other values will display the actual value returned by the agent in the TivoliEnterprise Portal.
Warehouse namePERF_STATUS or PERF_STS
Composite Status attribute
DescriptionA composite of the status fields indicating the maximum severity of all the fields.
Type Integer (gauge) with enumerated values. The strings are displayed in the TivoliEnterprise Portal. The warehouse and queries return the values shown inparentheses. The following values are defined:v unavailable (-1)
Any other values will display the actual value returned by the agent in the TivoliEnterprise Portal.
Warehouse nameCOMPOSITE_STATUS or CMP_STS
CPU Busy attribute
DescriptionThe system CPU resource utilization in percent.
Type DEFAULT with enumerated values. The strings are displayed in the TivoliEnterprise Portal. The warehouse and queries return the values shown inparentheses. The following values are defined:v unavailable (-1)
Any other values will display the actual value returned by the agent in the TivoliEnterprise Portal.
Warehouse nameCPU_BUSY
CIFS Ops attribute
DescriptionThe CIFS operations per second.
Type DEFAULT with enumerated values. The strings are displayed in the Tivoli
Chapter 4. Attributes reference 35
Enterprise Portal. The warehouse and queries return the values shown inparentheses. The following values are defined:v unavailable (-1)
Any other values will display the actual value returned by the agent in the TivoliEnterprise Portal.
Warehouse nameCIFS_OPS
FCP Ops attribute
DescriptionThe FCP operations per second.
Type DEFAULT with enumerated values. The strings are displayed in the TivoliEnterprise Portal. The warehouse and queries return the values shown inparentheses. The following values are defined:v unavailable (-1)
Any other values will display the actual value returned by the agent in the TivoliEnterprise Portal.
Warehouse nameFCP_OPS
iSCSI Ops attribute
DescriptionThe iSCSI operations per second.
Type DEFAULT with enumerated values. The strings are displayed in the TivoliEnterprise Portal. The warehouse and queries return the values shown inparentheses. The following values are defined:v unavailable (-1)
Any other values will display the actual value returned by the agent in the TivoliEnterprise Portal.
Warehouse nameISCSI_OPS
NFS Ops attribute
DescriptionThe NFS operations per second.
Type DEFAULT with enumerated values. The strings are displayed in the TivoliEnterprise Portal. The warehouse and queries return the values shown inparentheses. The following values are defined:v unavailable (-1)
Any other values will display the actual value returned by the agent in the TivoliEnterprise Portal.
Warehouse nameNFS_OPS
Total Ops attribute
DescriptionThe total operations per second.
Type DEFAULT with enumerated values. The strings are displayed in the Tivoli
36 IBM Tivoli Monitoring for Virtual Environments Agent for NetApp Storage User's Guide
Enterprise Portal. The warehouse and queries return the values shown inparentheses. The following values are defined:v unavailable (-1)
Any other values will display the actual value returned by the agent in the TivoliEnterprise Portal.
Warehouse nameTOTAL_OPS
Disk Data Read attribute
DescriptionThe disk KB read per second.
Type DEFAULT with enumerated values. The strings are displayed in the TivoliEnterprise Portal. The warehouse and queries return the values shown inparentheses. The following values are defined:v unavailable (-1)
Any other values will display the actual value returned by the agent in the TivoliEnterprise Portal.
Warehouse nameDISK_DATA_READ or DSK_DTA_RD
Disk Data Written attribute
DescriptionThe disk KB written per second.
Type DEFAULT with enumerated values. The strings are displayed in the TivoliEnterprise Portal. The warehouse and queries return the values shown inparentheses. The following values are defined:v unavailable (-1)
Any other values will display the actual value returned by the agent in the TivoliEnterprise Portal.
Warehouse nameDISK_DATA_WRITTEN or DSK_DTA_WR
Net Data Received attribute
DescriptionThe network KB received per second for this host.
Type DEFAULT with enumerated values. The strings are displayed in the TivoliEnterprise Portal. The warehouse and queries return the values shown inparentheses. The following values are defined:v unavailable (-1)
Any other values will display the actual value returned by the agent in the TivoliEnterprise Portal.
Warehouse nameNET_DATA_RECV or NET_DTA_RV
Net Data Sent attribute
DescriptionThe network KB sent per second for this host.
Type DEFAULT with enumerated values. The strings are displayed in the Tivoli
Chapter 4. Attributes reference 37
Enterprise Portal. The warehouse and queries return the values shown inparentheses. The following values are defined:v unavailable (-1)
Any other values will display the actual value returned by the agent in the TivoliEnterprise Portal.
Warehouse nameNET_DATA_SENT or NET_DTA_SN
Total Data Rate attribute
DescriptionThe sum of the other KB-per-second metrics for this host.
Type DEFAULT with enumerated values. The strings are displayed in the TivoliEnterprise Portal. The warehouse and queries return the values shown inparentheses. The following values are defined:v unavailable (-1)
Any other values will display the actual value returned by the agent in the TivoliEnterprise Portal.
Warehouse nameTOTAL_DATA_RATE or TOTAL_RATE
Perf Warehouse attribute
DescriptionIndicates whether the performance data is to be ignored or included by thewarehouse.
Type Integer (gauge) with enumerated values. The strings are displayed in the TivoliEnterprise Portal. The warehouse and queries return the values shown inparentheses. The following values are defined:v Exclude (0)v Include (1)
Any other values will display the actual value returned by the agent in the TivoliEnterprise Portal.
Warehouse namePERF_WAREHOUSE or PERF_WRHS
LUNs attribute groupThe LUNs attribute group contains information about LUNs. The information includes path, containingvolume name, containing host name, operating status, average latency, and operations per second.
Historical groupThis attribute group is eligible for use with Tivoli Data Warehouse.
Attribute descriptionsThe following list contains information about each attribute in the LUNs attribute group:
Node attribute - This attribute is a key attribute.
DescriptionThe managed system name of the agent.
Type String
Warehouse nameNODE
38 IBM Tivoli Monitoring for Virtual Environments Agent for NetApp Storage User's Guide
Timestamp attribute
DescriptionThe local time at the agent when the data was collected.
Type String
Warehouse nameTIMESTAMP
Host Name attribute - This attribute is a key attribute.
DescriptionThe name of the host that contains this disk.
Type String with enumerated values. The strings are displayed in the Tivoli EnterprisePortal. The warehouse and queries return the values shown in parentheses. Thefollowing values are defined:v unavailable (unavailable)
Any other values will display the actual value returned by the agent in the TivoliEnterprise Portal.
Warehouse nameHOST_NAME
Volume Name attribute - This attribute is a key attribute.
DescriptionThe name of the volume that contains this LUN.
Type String with enumerated values. The strings are displayed in the Tivoli EnterprisePortal. The warehouse and queries return the values shown in parentheses. Thefollowing values are defined:v unavailable (unavailable)
Any other values will display the actual value returned by the agent in the TivoliEnterprise Portal.
Warehouse nameVOLUME_NAME or VOL_NAME
LUN Path attribute - This attribute is a key attribute.
DescriptionThe path name of the LUN including the volume or qtree where the LUN exists.
Type String with enumerated values. The strings are displayed in the Tivoli EnterprisePortal. The warehouse and queries return the values shown in parentheses. Thefollowing values are defined:v unavailable (unavailable)
Any other values will display the actual value returned by the agent in the TivoliEnterprise Portal.
Warehouse nameLUN_PATH
Run Status attribute
DescriptionIndicates how well this LUN is running.
Type String with enumerated values. The strings are displayed in the Tivoli EnterprisePortal. The warehouse and queries return the values shown in parentheses. Thefollowing values are defined:
Chapter 4. Attributes reference 39
v unavailable (unavailable)v unknown (unknown)v normal (normal)v information (information)v unmanaged (unmanaged)v warning (warning)v error (error)v critical (critical)v emergency (emergency)
Any other values will display the actual value returned by the agent in the TivoliEnterprise Portal.
Warehouse nameRUN_STATUS or RUN_STS
Perf Status attribute
DescriptionIndicates how well this LUN is performing.
Type String with enumerated values. The strings are displayed in the Tivoli EnterprisePortal. The warehouse and queries return the values shown in parentheses. Thefollowing values are defined:v unavailable (unavailable)v unknown (unknown)v normal (normal)v information (information)v unmanaged (unmanaged)v warning (warning)v error (error)v critical (critical)v emergency (emergency)
Any other values will display the actual value returned by the agent in the TivoliEnterprise Portal.
Warehouse namePERF_STATUS or PERF_STS
Composite Status attribute
DescriptionA composite of the status fields indicating the maximum severity of all the fields.
Type Real number (gauge) with 1 decimal place of precision with enumerated values.The strings are displayed in the Tivoli Enterprise Portal. The warehouse andqueries return the values shown in parentheses. The following values are defined:v unavailable (-1)
Any other values will display the actual value returned by the agent in the TivoliEnterprise Portal.
Warehouse nameCOMPOSITE_STATUS or CMP_STS
LUN Size attribute
40 IBM Tivoli Monitoring for Virtual Environments Agent for NetApp Storage User's Guide
DescriptionThe size of this LUN in GB.
Type DEFAULT with enumerated values. The strings are displayed in the TivoliEnterprise Portal. The warehouse and queries return the values shown inparentheses. The following values are defined:v unavailable (-1)
Any other values will display the actual value returned by the agent in the TivoliEnterprise Portal.
Warehouse nameLUN_SIZE
Size Warehouse attribute
DescriptionIndicates whether the size data is to be ignored or included by the warehouse.
Type Integer (gauge) with enumerated values. The strings are displayed in the TivoliEnterprise Portal. The warehouse and queries return the values shown inparentheses. The following values are defined:v Exclude (0)v Include (1)
Any other values will display the actual value returned by the agent in the TivoliEnterprise Portal.
Warehouse nameSIZE_WAREHOUSE or SIZE_WRHS
Read Ops attribute
DescriptionThe number of reads per second from this LUN.
Type DEFAULT with enumerated values. The strings are displayed in the TivoliEnterprise Portal. The warehouse and queries return the values shown inparentheses. The following values are defined:v unavailable (-1)
Any other values will display the actual value returned by the agent in the TivoliEnterprise Portal.
Warehouse nameREAD_OPS
Write Ops attribute
DescriptionThe number of writes per second to this LUN.
Type DEFAULT with enumerated values. The strings are displayed in the TivoliEnterprise Portal. The warehouse and queries return the values shown inparentheses. The following values are defined:v unavailable (-1)
Any other values will display the actual value returned by the agent in the TivoliEnterprise Portal.
Warehouse nameWRITE_OPS
Other Ops attribute
Chapter 4. Attributes reference 41
DescriptionThe number of other operations per second on this LUN.
Type DEFAULT with enumerated values. The strings are displayed in the TivoliEnterprise Portal. The warehouse and queries return the values shown inparentheses. The following values are defined:v unavailable (-1)
Any other values will display the actual value returned by the agent in the TivoliEnterprise Portal.
Warehouse nameOTHER_OPS
Total Ops attribute
DescriptionThe number of operations per second serviced by this LUN.
Type DEFAULT with enumerated values. The strings are displayed in the TivoliEnterprise Portal. The warehouse and queries return the values shown inparentheses. The following values are defined:v unavailable (-1)
Any other values will display the actual value returned by the agent in the TivoliEnterprise Portal.
Warehouse nameTOTAL_OPS or TOTL_OPS
Read Data attribute
DescriptionThe KB per second read from this LUN.
Type DEFAULT with enumerated values. The strings are displayed in the TivoliEnterprise Portal. The warehouse and queries return the values shown inparentheses. The following values are defined:v unavailable (-1)
Any other values will display the actual value returned by the agent in the TivoliEnterprise Portal.
Warehouse nameREAD_DATA or RD_DATA
Write Data attribute
DescriptionThe KB per second written to this LUN.
Type DEFAULT with enumerated values. The strings are displayed in the TivoliEnterprise Portal. The warehouse and queries return the values shown inparentheses. The following values are defined:v unavailable (-1)
Any other values will display the actual value returned by the agent in the TivoliEnterprise Portal.
Warehouse nameWRITE_DATA or WR_DATA
Average Latency attribute
42 IBM Tivoli Monitoring for Virtual Environments Agent for NetApp Storage User's Guide
DescriptionThe average time in milliseconds for all operations on this LUN.
Type DEFAULT with enumerated values. The strings are displayed in the TivoliEnterprise Portal. The warehouse and queries return the values shown inparentheses. The following values are defined:v unavailable (-1)
Any other values will display the actual value returned by the agent in the TivoliEnterprise Portal.
Warehouse nameAVG_LATENCY or AVG_LATNCY
Performance Warehouse attribute
DescriptionIndicates whether the performance data is to be ignored or included by thewarehouse.
Type Integer (gauge) with enumerated values. The strings are displayed in the TivoliEnterprise Portal. The warehouse and queries return the values shown inparentheses. The following values are defined:v Exclude (0)v Include (1)
Any other values will display the actual value returned by the agent in the TivoliEnterprise Portal.
Warehouse namePERF_WAREHOUSE or PERF_WRHS
Performance Object Status attribute groupThe Performance Object Status attribute group contains information that reflects the status of otherattribute groups so you can see the status of all of the performance objects that make up this applicationall at once. Each of these other performance attribute groups is represented by a row in this table (orother type of view). The status for an attribute group reflects the result of the last attempt to collect datafor that attribute group, which allows you to see whether the agent is performing correctly. Unlike otherattribute groups, the Performance Object Status attribute group does not reflect the state of the monitoredapplication. This attribute group is most often used to determine why data is not available for one of theperformance attribute groups.
Historical groupThis attribute group is eligible for use with Tivoli Data Warehouse.
Attribute descriptionsThe following list contains information about each attribute in the Performance Object Statusattribute group:
Node attribute - This attribute is a key attribute.
DescriptionThe managed system name of the agent.
Type String
Warehouse nameNODE
Timestamp attribute
DescriptionThe local time at the agent when the data was collected.
Chapter 4. Attributes reference 43
Type String
Warehouse nameTIMESTAMP
Query Name attribute - This attribute is a key attribute.
DescriptionThe name of the attribute group.
Type String
Warehouse nameQUERY_NAME or ATTRGRP
Object Name attribute
DescriptionThe name of the performance object.
Type String
Warehouse nameOBJECT_NAME or OBJNAME
Object Type attribute
DescriptionThe type of the performance object.
Type Integer with enumerated values. The strings are displayed in the Tivoli EnterprisePortal. The warehouse and queries return the values shown in parentheses. Thefollowing values are defined:v WMI (0)v PERFMON (1)v WMI ASSOCIATION GROUP (2)v JMX (3)v SNMP (4)v SHELL COMMAND (5)v JOINED GROUPS (6)v CIMOM (7)v CUSTOM (8)v ROLLUP DATA (9)v WMI REMOTE DATA (10)v LOG FILE (11)v JDBC (12)v CONFIG DISCOVERY (13)v NT EVENT LOG (14)v FILTER (15)v SNMP EVENT (16)v PING (17)v DIRECTOR DATA (18)v DIRECTOR EVENT (19)v SSH REMOTE SHELL COMMAND (20)
Any other values will display the actual value returned by the agent in the TivoliEnterprise Portal.
44 IBM Tivoli Monitoring for Virtual Environments Agent for NetApp Storage User's Guide
Warehouse nameOBJECT_TYPE or OBJTYPE
Object Status attribute
DescriptionThe status of the performance object.
Type Integer with enumerated values. The strings are displayed in the Tivoli EnterprisePortal. The warehouse and queries return the values shown in parentheses. Thefollowing values are defined:v ACTIVE (0)v INACTIVE (1)
Any other values will display the actual value returned by the agent in the TivoliEnterprise Portal.
Warehouse nameOBJECT_STATUS or OBJSTTS
Error Code attribute
DescriptionThe error code associated with the query.
Type Integer with enumerated values. The strings are displayed in the Tivoli EnterprisePortal. The warehouse and queries return the values shown in parentheses. Thefollowing values are defined:v NO ERROR (0)v GENERAL ERROR (1)v OBJECT NOT FOUND (2)v COUNTER NOT FOUND (3)v NAMESPACE ERROR (4)v OBJECT CURRENTLY UNAVAILABLE (5)v COM LIBRARY INIT FAILURE (6)v SECURITY INIT FAILURE (7)v PROXY SECURITY FAILURE (9)v NO INSTANCES RETURNED (10)v ASSOCIATOR QUERY FAILED (11)v REFERENCE QUERY FAILED (12)v NO RESPONSE RECEIVED (13)v CANNOT FIND JOINED QUERY (14)v CANNOT FIND JOIN ATTRIBUTE IN QUERY 1 RESULTS (15)v CANNOT FIND JOIN ATTRIBUTE IN QUERY 2 RESULTS (16)v QUERY 1 NOT A SINGLETON (17)v QUERY 2 NOT A SINGLETON (18)v NO INSTANCES RETURNED IN QUERY 1 (19)v NO INSTANCES RETURNED IN QUERY 2 (20)v CANNOT FIND ROLLUP QUERY (21)v CANNOT FIND ROLLUP ATTRIBUTE (22)v FILE OFFLINE (23)v NO HOSTNAME (24)v MISSING LIBRARY (25)
Chapter 4. Attributes reference 45
v ATTRIBUTE COUNT MISMATCH (26)v ATTRIBUTE NAME MISMATCH (27)v COMMON DATA PROVIDER NOT STARTED (28)v CALLBACK REGISTRATION ERROR (29)v MDL LOAD ERROR (30)v AUTHENTICATION FAILED (31)v CANNOT RESOLVE HOST NAME (32)v SUBNODE UNAVAILABLE (33)v SUBNODE NOT FOUND IN CONFIG (34)v ATTRIBUTE ERROR (35)v CLASSPATH ERROR (36)v CONNECTION FAILURE (37)v FILTER SYNTAX ERROR (38)v FILE NAME MISSING (39)v SQL QUERY ERROR (40)v SQL FILTER QUERY ERROR (41)v SQL DB QUERY ERROR (42)v SQL DB FILTER QUERY ERROR (43)v PORT OPEN FAILED (44)v ACCESS DENIED (45)v TIMEOUT (46)v NOT IMPLEMENTED (47)v REQUESTED A BAD VALUE (48)v RESPONSE TOO BIG (49)v GENERAL RESPONSE ERROR (50)v SCRIPT NONZERO RETURN (51)v SCRIPT NOT FOUND (52)v SCRIPT LAUNCH ERROR (53)v CONF FILE DOES NOT EXIST (54)v CONF FILE ACCESS DENIED (55)v INVALID CONF FILE (56)v EIF INITIALIZATION FAILED (57)v CANNOT OPEN FORMAT FILE (58)v FORMAT FILE SYNTAX ERROR (59)v REMOTE HOST UNAVAILABLE (60)v EVENT LOG DOES NOT EXIST (61)v PING FILE DOES NOT EXIST (62)v NO PING DEVICE FILES (63)v PING DEVICE LIST FILE MISSING (64)v SNMP MISSING PASSWORD (65)v DISABLED (66)v URLS FILE NOT FOUND (67)v XML PARSE ERROR (68)
Any other values will display the actual value returned by the agent in the TivoliEnterprise Portal.
46 IBM Tivoli Monitoring for Virtual Environments Agent for NetApp Storage User's Guide
Warehouse nameERROR_CODE or ERRCODE
Volumes attribute groupThe Volumes attribute group contains information about volumes. The information includes name,containing aggregate name, containing host name, operating status, operations per second, latency,percent used, and data transfer rates.
Historical groupThis attribute group is eligible for use with Tivoli Data Warehouse.
Attribute descriptionsThe following list contains information about each attribute in the Volumes attribute group:
Node attribute - This attribute is a key attribute.
DescriptionThe managed system name of the agent.
Type String
Warehouse nameNODE
Timestamp attribute
DescriptionThe local time at the agent when the data was collected.
Type String
Warehouse nameTIMESTAMP
Host Name attribute - This attribute is a key attribute.
DescriptionThe name of the host that contains this volume.
Type String with enumerated values. The strings are displayed in the Tivoli EnterprisePortal. The warehouse and queries return the values shown in parentheses. Thefollowing values are defined:v unavailable (unavailable)
Any other values will display the actual value returned by the agent in the TivoliEnterprise Portal.
Warehouse nameHOST_NAME
Aggregate Name attribute - This attribute is a key attribute.
DescriptionThe name of the aggregate that contains this volume.
Type String with enumerated values. The strings are displayed in the Tivoli EnterprisePortal. The warehouse and queries return the values shown in parentheses. Thefollowing values are defined:v unavailable (unavailable)
Any other values will display the actual value returned by the agent in the TivoliEnterprise Portal.
Warehouse nameAGGREGATE_NAME or AGGR_NAME
Chapter 4. Attributes reference 47
Volume Name attribute - This attribute is a key attribute.
DescriptionThe name of this volume.
Type String with enumerated values. The strings are displayed in the Tivoli EnterprisePortal. The warehouse and queries return the values shown in parentheses. Thefollowing values are defined:v unavailable (unavailable)
Any other values will display the actual value returned by the agent in the TivoliEnterprise Portal.
Warehouse nameVOLUME_NAME or VOL_NAME
Volume Type attribute
DescriptionThe type of this volume, either traditional, flexible, or striped.
Type String with enumerated values. The strings are displayed in the Tivoli EnterprisePortal. The warehouse and queries return the values shown in parentheses. Thefollowing values are defined:v unavailable (unavailable)v traditional (traditional)v flexible (flexible)v striped (striped)
Any other values will display the actual value returned by the agent in the TivoliEnterprise Portal.
Warehouse nameVOLUME_TYPE or VOL_TYPE
Volume State attribute
DescriptionIndicates the state of this volume. Possible values are unavailable, initializing,failed, offline, online, partial, restricted, or unknown.
Type String with enumerated values. The strings are displayed in the Tivoli EnterprisePortal. The warehouse and queries return the values shown in parentheses. Thefollowing values are defined:v unavailable (unavailable)v initializing (initializing)v failed (failed)v offline (offline)v online (online)v partial (partial)v restricted (restricted)v unknown (unknown)
Any other values will display the actual value returned by the agent in the TivoliEnterprise Portal.
Warehouse nameVOLUME_STATE or VOL_STATE
Run Status attribute
48 IBM Tivoli Monitoring for Virtual Environments Agent for NetApp Storage User's Guide
DescriptionIndicates how well this volume is running. Possible values are unavailable,unknown, normal, information, unmanaged, warning, error, critical, oremergency.
Type String with enumerated values. The strings are displayed in the Tivoli EnterprisePortal. The warehouse and queries return the values shown in parentheses. Thefollowing values are defined:v unavailable (unavailable)v unknown (unknown)v normal (normal)v information (information)v unmanaged (unmanaged)v warning (warning)v error (error)v critical (critical)v emergency (emergency)
Any other values will display the actual value returned by the agent in the TivoliEnterprise Portal.
Warehouse nameRUN_STATUS or RUN_STS
Perf Status attribute
DescriptionIndicates how well this volume is performing. Possible values are unavailable,unknown, normal, information, unmanaged, warning, error, critical, oremergency.
Type String with enumerated values. The strings are displayed in the Tivoli EnterprisePortal. The warehouse and queries return the values shown in parentheses. Thefollowing values are defined:v unavailable (unavailable)v unknown (unknown)v normal (normal)v information (information)v unmanaged (unmanaged)v warning (warning)v error (error)v critical (critical)v emergency (emergency)
Any other values will display the actual value returned by the agent in the TivoliEnterprise Portal.
Warehouse namePERF_STATUS or PERF_STS
Composite Status attribute
DescriptionA composite of the status fields indicating the maximum severity of all the fields.
Type Real number (gauge) with 1 decimal place of precision with enumerated values.
Chapter 4. Attributes reference 49
The strings are displayed in the Tivoli Enterprise Portal. The warehouse andqueries return the values shown in parentheses. The following values are defined:v unavailable (-1)
Any other values will display the actual value returned by the agent in the TivoliEnterprise Portal.
Warehouse nameCOMPOSITE_STATUS or CMP_STS
Volume Size attribute
DescriptionThe total number of GB in this volume, including the snapshot reserve.
Type DEFAULT with enumerated values. The strings are displayed in the TivoliEnterprise Portal. The warehouse and queries return the values shown inparentheses. The following values are defined:v unavailable (-1)
Any other values will display the actual value returned by the agent in the TivoliEnterprise Portal.
Warehouse nameVOLUME_SIZE or VOL_SIZE
Size Warehouse attribute
DescriptionIndicates whether the size data is to be ignored or included by the warehouse.
Type Integer (gauge) with enumerated values. The strings are displayed in the TivoliEnterprise Portal. The warehouse and queries return the values shown inparentheses. The following values are defined:v Exclude (0)v Include (1)
Any other values will display the actual value returned by the agent in the TivoliEnterprise Portal.
Warehouse nameSIZE_WAREHOUSE or SIZE_WRHS
Maximum Size attribute
DescriptionThe maximum size in GB to which this volume grows if autosize is enabled.
Type DEFAULT with enumerated values. The strings are displayed in the TivoliEnterprise Portal. The warehouse and queries return the values shown inparentheses. The following values are defined:v unavailable (-1)
Any other values will display the actual value returned by the agent in the TivoliEnterprise Portal.
Warehouse nameMAXIMUM_SIZE or MAX_SIZE
Autosize Enabled attribute
DescriptionIndicates whether autosize is enabled and whether the maximum size data is tobe ignored or included by the warehouse.
50 IBM Tivoli Monitoring for Virtual Environments Agent for NetApp Storage User's Guide
Type Integer (gauge) with enumerated values. The strings are displayed in the TivoliEnterprise Portal. The warehouse and queries return the values shown inparentheses. The following values are defined:v Disabled (0)v Enabled (1)
Any other values will display the actual value returned by the agent in the TivoliEnterprise Portal.
Warehouse nameAUTOSIZE_ENABLED or AUTOSIZE
Is Dedupe Enabled attribute
DescriptionSpecifies if deduplication is enabled on the volume.
Type Integer (gauge) with enumerated values. The strings are displayed in the TivoliEnterprise Portal. The warehouse and queries return the values shown inparentheses. The following values are defined:v Disabled (0)v Enabled (1)
Any other values will display the actual value returned by the agent in the TivoliEnterprise Portal.
Warehouse nameIS_DEDUPE_ENABLED or DEDUPED
AFS Available attribute
DescriptionThe number of GB available in the active file system of this volume. This value is(afs-total - afs-used) or the available space in the aggregate, whichever is lower.
Type DEFAULT with enumerated values. The strings are displayed in the TivoliEnterprise Portal. The warehouse and queries return the values shown inparentheses. The following values are defined:v unavailable (-1)
Any other values will display the actual value returned by the agent in the TivoliEnterprise Portal.
Warehouse nameAFS_AVAIL
AFS Data attribute
DescriptionThe number of GB used to hold user data in the active file system of this volume.This value matches the sum of the file sizes. This value includes data and holereserves, if any.
Type DEFAULT with enumerated values. The strings are displayed in the TivoliEnterprise Portal. The warehouse and queries return the values shown inparentheses. The following values are defined:v unavailable (-1)
Any other values will display the actual value returned by the agent in the TivoliEnterprise Portal.
Warehouse nameAFS_DATA
Chapter 4. Attributes reference 51
AFS Total attribute
DescriptionThe total number of GB in the active file system of this volume (volume sizeminus snapshot reserve).
Type DEFAULT with enumerated values. The strings are displayed in the TivoliEnterprise Portal. The warehouse and queries return the values shown inparentheses. The following values are defined:v unavailable (-1)
Any other values will display the actual value returned by the agent in the TivoliEnterprise Portal.
Warehouse nameAFS_TOTAL
AFS Used attribute
DescriptionThe number of GB used to hold the active file system data for this volume. Thisvalue is what the df command reports as used for the volume. The value includesdata, hole reserves, overwrite reserves, and snapshot overflow.
Type DEFAULT with enumerated values. The strings are displayed in the TivoliEnterprise Portal. The warehouse and queries return the values shown inparentheses. The following values are defined:v unavailable (-1)
Any other values will display the actual value returned by the agent in the TivoliEnterprise Portal.
Warehouse nameAFS_USED
AFS Percent Used attribute
DescriptionThe percentage of the total number of GB used to hold active file system data.
Type Real number (gauge) with 1 decimal place of precision with enumerated values.The strings are displayed in the Tivoli Enterprise Portal. The warehouse andqueries return the values shown in parentheses. The following values are defined:v unavailable (-1)
Any other values will display the actual value returned by the agent in the TivoliEnterprise Portal.
Warehouse nameAFS_PERCENT_USED or AFS_PCT
AFS Warehouse attribute
DescriptionIndicates whether the AFS data is to be ignored or included by the warehouse.
Type Integer (gauge) with enumerated values. The strings are displayed in the TivoliEnterprise Portal. The warehouse and queries return the values shown inparentheses. The following values are defined:v Exclude (0)v Include (1)
Any other values will display the actual value returned by the agent in the TivoliEnterprise Portal.
52 IBM Tivoli Monitoring for Virtual Environments Agent for NetApp Storage User's Guide
Warehouse nameAFS_WAREHOUSE or AFS_WRHS
Overwrite Reserve Available attribute
DescriptionThe number of GB available as reserved space for data overwrites on thisvolume.
Type DEFAULT with enumerated values. The strings are displayed in the TivoliEnterprise Portal. The warehouse and queries return the values shown inparentheses. The following values are defined:v unavailable (-1)
Any other values will display the actual value returned by the agent in the TivoliEnterprise Portal.
Warehouse nameOVERWRITE_RESERVE_AVAIL or OVR_AVAIL
Overwrite Reserve Total attribute
DescriptionTotal number of GB reserved for data overwrites. This is the space reserved foroverwriting LUNs and other space-reserved files when the volume has snapshotsand afs-avail is zero.
Type DEFAULT with enumerated values. The strings are displayed in the TivoliEnterprise Portal. The warehouse and queries return the values shown inparentheses. The following values are defined:v unavailable (-1)
Any other values will display the actual value returned by the agent in the TivoliEnterprise Portal.
Warehouse nameOVERWRITE_RESERVE_TOTAL or OVR_TOTL
Overwrite Reserve Used attribute
DescriptionNumber of GB used in overwrite reserve space.
Type DEFAULT with enumerated values. The strings are displayed in the TivoliEnterprise Portal. The warehouse and queries return the values shown inparentheses. The following values are defined:v unavailable (-1)
Any other values will display the actual value returned by the agent in the TivoliEnterprise Portal.
Warehouse nameOVERWRITE_RESERVE_USED or OVR_USED
Overwrite Reserve Percent Used attribute
DescriptionThe percentage of the total number of GB used to hold overwrite data for thisvolume.
Type Real number (gauge) with 1 decimal place of precision with enumerated values.The strings are displayed in the Tivoli Enterprise Portal. The warehouse andqueries return the values shown in parentheses. The following values are defined:v unavailable (-1)
Chapter 4. Attributes reference 53
Any other values will display the actual value returned by the agent in the TivoliEnterprise Portal.
Warehouse nameOVERWRITE_RESERVE_PERCENT_USED or OVR_PCT
Overwrite Warehouse attribute
DescriptionIndicates whether the overwrite reserve data is to be ignored or included by thewarehouse.
Type Integer (gauge) with enumerated values. The strings are displayed in the TivoliEnterprise Portal. The warehouse and queries return the values shown inparentheses. The following values are defined:v Exclude (0)v Include (1)
Any other values will display the actual value returned by the agent in the TivoliEnterprise Portal.
Warehouse nameOVERWRITE_WAREHOUSE or OVR_WRHS
Snapshot Reserve Available attribute
DescriptionThe number of available GB in the snapshot reserve for this volume. Ifsnapshot-reserve-used is greater than snapshot-reserve-total, this value is zero.
Type DEFAULT with enumerated values. The strings are displayed in the TivoliEnterprise Portal. The warehouse and queries return the values shown inparentheses. The following values are defined:v unavailable (-1)
Any other values will display the actual value returned by the agent in the TivoliEnterprise Portal.
Warehouse nameSNAPSHOT_RESERVE_AVAIL or SNP_AVL
Snapshot Reserve Total attribute
DescriptionThe total number of GB of snapshot reserve on this volume.
Type DEFAULT with enumerated values. The strings are displayed in the TivoliEnterprise Portal. The warehouse and queries return the values shown inparentheses. The following values are defined:v unavailable (-1)
Any other values will display the actual value returned by the agent in the TivoliEnterprise Portal.
Warehouse nameSNAPSHOT_RESERVE_TOTAL or SNP_TOTL
Snapshot Reserve Used attribute
DescriptionThe total number of GB used to hold snapshot data. This number can be greaterthan the snapshot reserve size but does not include any space used out of theSnapshot reserve.
54 IBM Tivoli Monitoring for Virtual Environments Agent for NetApp Storage User's Guide
Type DEFAULT with enumerated values. The strings are displayed in the TivoliEnterprise Portal. The warehouse and queries return the values shown inparentheses. The following values are defined:v unavailable (-1)
Any other values will display the actual value returned by the agent in the TivoliEnterprise Portal.
Warehouse nameSNAPSHOT_RESERVE_USED or SNP_USED
Snapshot Reserve Percent Used attribute
DescriptionThe percentage of the total number of GB used to hold snapshot data for thisvolume.
Type Real number (gauge) with 1 decimal place of precision with enumerated values.The strings are displayed in the Tivoli Enterprise Portal. The warehouse andqueries return the values shown in parentheses. The following values are defined:v unavailable (-1)
Any other values will display the actual value returned by the agent in the TivoliEnterprise Portal.
Warehouse nameSNAPSHOT_RESERVE_PERCENT_USED or SNP_PCT
Max Percent Used attribute
DescriptionThe maximum percentage used from AFS, overwrite, and snapshot data for thisvolume.
Type Real number (gauge) with 1 decimal place of precision with enumerated values.The strings are displayed in the Tivoli Enterprise Portal. The warehouse andqueries return the values shown in parentheses. The following values are defined:v unavailable (-1)
Any other values will display the actual value returned by the agent in the TivoliEnterprise Portal.
Warehouse nameMAX_PERCENT_USED or MAX_PCT
Snapshot Warehouse attribute
DescriptionIndicates whether the Snapshot reserve data is to be ignored or included by thewarehouse.
Type Integer (gauge) with enumerated values. The strings are displayed in the TivoliEnterprise Portal. The warehouse and queries return the values shown inparentheses. The following values are defined:v Exclude (0)v Include (1)
Any other values will display the actual value returned by the agent in the TivoliEnterprise Portal.
Warehouse nameSNAPSHOT_WAREHOUSE or SNP_WRHS
Read Ops attribute
Chapter 4. Attributes reference 55
DescriptionThe number of reads per second from this volume.
Type DEFAULT with enumerated values. The strings are displayed in the TivoliEnterprise Portal. The warehouse and queries return the values shown inparentheses. The following values are defined:v unavailable (-1)
Any other values will display the actual value returned by the agent in the TivoliEnterprise Portal.
Warehouse nameREAD_OPS or RD_OPS
Read Data attribute
DescriptionThe KB per second read from this volume.
Type DEFAULT with enumerated values. The strings are displayed in the TivoliEnterprise Portal. The warehouse and queries return the values shown inparentheses. The following values are defined:v unavailable (-1)
Any other values will display the actual value returned by the agent in the TivoliEnterprise Portal.
Warehouse nameREAD_DATA or RD_DATA
Read Latency attribute
DescriptionThe average time in milliseconds for reads from this volume.
Type DEFAULT with enumerated values. The strings are displayed in the TivoliEnterprise Portal. The warehouse and queries return the values shown inparentheses. The following values are defined:v unavailable (-1)
Any other values will display the actual value returned by the agent in the TivoliEnterprise Portal.
Warehouse nameREAD_LATENCY or RD_LATNCY
Write Ops attribute
DescriptionThe number of writes per second from this volume.
Type DEFAULT with enumerated values. The strings are displayed in the TivoliEnterprise Portal. The warehouse and queries return the values shown inparentheses. The following values are defined:v unavailable (-1)
Any other values will display the actual value returned by the agent in the TivoliEnterprise Portal.
Warehouse nameWRITE_OPS or WR_OPS
Write Data attribute
56 IBM Tivoli Monitoring for Virtual Environments Agent for NetApp Storage User's Guide
DescriptionThe KB per second written to this volume.
Type DEFAULT with enumerated values. The strings are displayed in the TivoliEnterprise Portal. The warehouse and queries return the values shown inparentheses. The following values are defined:v unavailable (-1)
Any other values will display the actual value returned by the agent in the TivoliEnterprise Portal.
Warehouse nameWRITE_DATA or WR_DATA
Write Latency attribute
DescriptionThe average time in milliseconds for writes from this volume.
Type DEFAULT with enumerated values. The strings are displayed in the TivoliEnterprise Portal. The warehouse and queries return the values shown inparentheses. The following values are defined:v unavailable (-1)
Any other values will display the actual value returned by the agent in the TivoliEnterprise Portal.
Warehouse nameWRITE_LATENCY or WR_LATNCY
Other Ops attribute
DescriptionThe number of other operations per second on this volume.
Type DEFAULT with enumerated values. The strings are displayed in the TivoliEnterprise Portal. The warehouse and queries return the values shown inparentheses. The following values are defined:v unavailable (-1)
Any other values will display the actual value returned by the agent in the TivoliEnterprise Portal.
Warehouse nameOTHER_OPS or OTH_OPS
Other Latency attribute
DescriptionThe average time in milliseconds for other operations on this volume.
Type DEFAULT with enumerated values. The strings are displayed in the TivoliEnterprise Portal. The warehouse and queries return the values shown inparentheses. The following values are defined:v unavailable (-1)
Any other values will display the actual value returned by the agent in the TivoliEnterprise Portal.
Warehouse nameOTHER_LATENCY or OTH_LATNCY
Composite Data Rate attribute
Chapter 4. Attributes reference 57
DescriptionThe sum of the read and write KB-per-second metrics for this volume.
Type DEFAULT with enumerated values. The strings are displayed in the TivoliEnterprise Portal. The warehouse and queries return the values shown inparentheses. The following values are defined:v unavailable (-1)
Any other values will display the actual value returned by the agent in the TivoliEnterprise Portal.
Warehouse nameCOMPOSITE_DATA_RATE or CMP_RATE
Composite Latency attribute
DescriptionThe sum of the read, write, and other latency metrics for this volume.
Type DEFAULT with enumerated values. The strings are displayed in the TivoliEnterprise Portal. The warehouse and queries return the values shown inparentheses. The following values are defined:v unavailable (-1)
Any other values will display the actual value returned by the agent in the TivoliEnterprise Portal.
Warehouse nameCOMPOSITE_LATENCY or CMP_LATNCY
Total Ops attribute
DescriptionThe sum of the read, write, and other operations metrics for this volume.
Type DEFAULT with enumerated values. The strings are displayed in the TivoliEnterprise Portal. The warehouse and queries return the values shown inparentheses. The following values are defined:v unavailable (-1)
Any other values will display the actual value returned by the agent in the TivoliEnterprise Portal.
Warehouse nameTOTAL_OPS or TOTL_OPS
Perf Warehouse attribute
DescriptionIndicates whether the performance data is to be ignored or included by thewarehouse.
Type Integer (gauge) with enumerated values. The strings are displayed in the TivoliEnterprise Portal. The warehouse and queries return the values shown inparentheses. The following values are defined:v Exclude (0)v Include (1)
Any other values will display the actual value returned by the agent in the TivoliEnterprise Portal.
Warehouse namePERF_WAREHOUSE or PERF_WRHS
58 IBM Tivoli Monitoring for Virtual Environments Agent for NetApp Storage User's Guide
Disk capacity planning for historical dataDisk capacity planning for a monitoring agent is a prediction of the amount of disk space to beconsumed for each attribute group with historical data that is being collected. Required disk storage is animportant factor when you are defining data collection rules and your strategy for historical datacollection.
The Capacity planning for historical data table provides the following information required to calculatedisk space for this monitoring agent:
Table Table name as it is displayed in the warehouse database, if the attribute group is configured to bewritten to the warehouse. The table name listed here corresponds to the table name in “Attributegroups for the monitoring agent” on page 19.
Attribute groupName of the attribute group used to create the table in the warehouse database if it is shortenough to fit in the table naming constraints of the database being used for the warehouse. Theattribute group name listed here corresponds to the Warehouse table name in “Attribute groupsfor the monitoring agent” on page 19.
Bytes per row (agent)Estimate of the record length for each row or instance written to the agent disk for historical datacollection. This estimate can be used for agent disk space planning purposes.
Database bytes per row (warehouse)Estimate of the record length for detailed records written to the warehouse database, if theattribute group is configured to be written to the warehouse. Detailed records are records thathave been uploaded from the agent for long-term historical data collection. This estimate can beused for warehouse disk-space planning purposes.
Aggregate bytes per row (warehouse)Estimate of the record length for aggregate records written to the warehouse database, if theattribute group is configured to be written to the warehouse. Aggregate records are created by theSummarization agent for attribute groups that have been configured for summarization. Thisestimate can be used for warehouse disk-space planning purposes.
In addition to the information in the tables, you must know the number of rows of data that you plan tocollect. An attribute group can have single or multiple rows of data depending on the applicationenvironment that is being monitored. For example, if your attribute group is monitoring each processorin your computer and you have a dual processor computer, the number of rows is two.
Table 1. Capacity planning for historical data logged by the NetApp Storage agent
Table Attribute group
Bytes perrow(agent)
Databasebytes perrow(warehouse)
Aggregatebytes perrow(warehouse)
KNU02AGREG KNU_AGGREGATES 376 511 1418
KNU01HOST KNU_HOSTS 865 931 1567
KNUHOSTNIF KNU_HOST_NETWORK_INTERFACES 351 460 1022
KNU04LUN KNU_LUNS 376 464 1038
KNUPOBJST KNU_PERFORMANCE_OBJECT_STATUS 288 289 326
KNU03VOL KNU_VOLUMES 560 842 2580
For more information about historical data collection, see the IBM Tivoli Monitoring Administrator's Guide.
Chapter 4. Attributes reference 59

60 IBM Tivoli Monitoring for Virtual Environments Agent for NetApp Storage User's Guide
Chapter 5. Situations reference
A situation is a logical expression involving one or more system conditions. Situations are used tomonitor the condition of systems in your network. You can manage situations from the Tivoli EnterprisePortal by using the Situation Editor or from the command-line interface using the tacmds for situations.You can manage private situations in the private configuration XML file.
About situations
The monitoring agents that you use to monitor your system environment include a set of predefinedsituations that you can use as-is. You can also create new situations to meet your requirements.
Predefined situations contain attributes that check for system conditions common to many enterprises.Using predefined situations can improve the speed with which you can begin using the IBM TivoliMonitoring for Virtual Environments Agent for NetApp Storage. You can change the conditions or valuesbeing monitored by a predefined situation to the conditions or values best suited to your enterprise.
You can display predefined situations and create your own situations using the Situation editor. The leftpanel of the Situation editor initially lists the situations associated with the Navigator item that youselected. When you click a situation name or create a situation, the right panel opens with the followingtabs:
FormulaFormula describing the condition being tested.
DistributionList of managed systems (operating systems, subsystems, or applications) to which the situationcan be distributed. All the NetApp Storage agent managed systems are assigned by default.
Expert adviceComments and instructions to be read in the event workspace.
ActionCommand to be sent to the system.
EIF Customize forwarding of the event to an Event Integration Facility receiver. (Available when theTivoli Enterprise Monitoring Server has been configured to forward events.)
Until Options to close the event after a period of time, or when another situation becomes true.
Additional information about situations
The Tivoli Enterprise Portal User's Guide contains more information about predefined and customsituations and how to use them to respond to alerts.
For a list of the predefined situations and information about each individual situation for this monitoringagent, see “Predefined situations.”
Predefined situationsThe monitoring agent contains predefined situations, which are organized by Navigator item.v NetApp Storage
– Not applicablev Aggregates
– KNU_AggregateRunStatusAbnormal
© Copyright IBM Corp. 2010, 2011 61
v Hosts– KNU_HostRunStatusAbnormal– KNU_HostOffLine
v LUNs– KNU_LUNRunStatusAbnormal
v Volumes– KNU_VolumeRunStatusAbnormal
Situation descriptionsEach situation description provides information about the situation that you can use to monitor thecondition of systems in your network.
The situation descriptions provide the following information:
DescriptionInformation about the conditions that the situation tests.
FormulaSyntax that contains one or more logical expressions describing the conditions for the situation tomonitor.
DistributionWhether the situation is automatically distributed to instances of the agent or is available formanual distribution.
Run at startupWhether the situation starts monitoring when the agent starts.
Sampling intervalNumber of seconds that elapse between one sample of data that the monitoring agent collects forthe server and the next sample.
Situation persistenceWhether the conditions specified in the situation evaluate to "true" for the defined number ofoccurrences in a row before the situation is raised. The default of one means that nopersistence-checking takes place.
SeveritySeverity of the predefined events: Warning, Informational, or Critical.
Clearing conditionsControls when a true situation closes: after a period of time, when another situation is true, orwhichever occurs first if both are selected.
NetApp Storage Navigator itemNo predefined situations are included for this Navigator item.
Aggregates Navigator itemThe situation descriptions are organized by the Navigator item to which the situations are relevant.
KNU_AggregateRunStatusAbnormal situation
DescriptionThe run status of this aggregate is not normal.
The situation is evaluated for each distinct value of the HOST_NAME attribute.
62 IBM Tivoli Monitoring for Virtual Environments Agent for NetApp Storage User's Guide
Formula*IF *VALUE KNU_AGGREGATES.Run_Status *NE ’unavailable’ *AND *VALUEKNU_AGGREGATES.Run_Status *NE ’normal’ *AND *VALUE KNU_AGGREGATES.Run_Status *NE’information’
See “Attributes in each attribute group” on page 20 for descriptions of the attributes inthis formula.
DistributionThis situation is automatically distributed to instances of this agent.
Run at startupYes
Sampling interval30 seconds
Situation persistenceThe number of times the conditions of the situation must occur for the situation to betrue is 1.
Error conditionsWarning
Clearing conditionsThe situation clears when the condition becomes false.
Hosts Navigator itemThe situation descriptions are organized by the Navigator item to which the situations are relevant.
KNU_HostRunStatusAbnormal situation
DescriptionThe run status for this host is not normal.
The situation is evaluated for each distinct value of the HOST_NAME attribute.
Formula*IF *VALUE KNU_HOSTS.Run_Status *NE ’unavailable’ *AND *VALUEKNU_HOSTS.Run_Status *NE ’normal’ *AND *VALUE KNU_HOSTS.Run_Status *NE’information’
See “Attributes in each attribute group” on page 20 for descriptions of the attributes inthis formula.
DistributionThis situation is automatically distributed to instances of this agent.
Run at startupYes
Sampling interval30 seconds
Situation persistenceThe number of times the conditions of the situation must occur for the situation to betrue is 1.
Error conditionsWarning
Clearing conditionsThe situation clears when the condition becomes false.
KNU_HostOffLine situation
Chapter 5. Situations reference 63
DescriptionThe host is off-line.
The situation is evaluated for each distinct value of the HOST_NAME attribute.
Formula*IF *VALUE KNU_HOSTS.Host_Status *NE ’up’
See “Attributes in each attribute group” on page 20 for descriptions of the attributes inthis formula.
DistributionThis situation is automatically distributed to instances of this agent.
Run at startupYes
Sampling interval30 seconds
Situation persistenceThe number of times the conditions of the situation must occur for the situation to betrue is 1.
Error conditionsWarning
Clearing conditionsThe situation clears when the condition becomes false.
LUNs Navigator itemThe situation descriptions are organized by the Navigator item to which the situations are relevant.
KNU_LUNRunStatusAbnormal situation
DescriptionThe run status of this LUN is not normal.
The situation is evaluated for each distinct value of the HOST_NAME attribute.
Formula*IF *VALUE KNU_LUNS.Run_Status *NE ’unavailable’ *AND *VALUE KNU_LUNS.Run_Status*NE ’normal’ *AND *VALUE KNU_LUNS.Run_Status *NE ’information’
See “Attributes in each attribute group” on page 20 for descriptions of the attributes inthis formula.
DistributionThis situation is automatically distributed to instances of this agent.
Run at startupYes
Sampling interval30 seconds
Situation persistenceThe number of times the conditions of the situation must occur for the situation to betrue is 1.
Error conditionsWarning
Clearing conditionsThe situation clears when the condition becomes false.
64 IBM Tivoli Monitoring for Virtual Environments Agent for NetApp Storage User's Guide
Volumes Navigator itemThe situation descriptions are organized by the Navigator item to which the situations are relevant.
KNU_VolumeRunStatusAbnormal situation
DescriptionThe run status of this volume is not normal.
The situation is evaluated for each distinct value of the HOST_NAME attribute.
Formula*IF *VALUE KNU_VOLUMES.Run_Status *NE ’unavailable’ *AND *VALUEKNU_VOLUMES.Run_Status *NE ’normal’ *AND *VALUE KNU_VOLUMES.Run_Status *NE’information’
See “Attributes in each attribute group” on page 20 for descriptions of the attributes inthis formula.
DistributionThis situation is automatically distributed to instances of this agent.
Run at startupYes
Sampling interval30 seconds
Situation persistenceThe number of times the conditions of the situation must occur for the situation to betrue is 1.
Error conditionsWarning
Clearing conditionsThe situation clears when the condition becomes false.
Chapter 5. Situations reference 65

66 IBM Tivoli Monitoring for Virtual Environments Agent for NetApp Storage User's Guide
Chapter 6. Take Action commands reference
Take Action commands can be run from the portal client or included in a situation or a policy.
About Take Action commands
When included in a situation, the command runs when the situation becomes true. A Take Actioncommand in a situation is also referred to as reflex automation. When you enable a Take Action commandin a situation, you automate a response to system conditions. For example, you can use a Take Actioncommand to send a command to restart a process on the managed system or to send a text message to acell phone.
In advanced automation, policies are used to take actions, schedule work, and automate manual tasks. Apolicy comprises a series of automated steps called activities that are connected to create a workflow.After an activity is completed, the Tivoli Enterprise Portal receives return-code feedback, and advancedautomation logic responds with subsequent activities that are prescribed by the feedback.
A basic Take Action command shows the return code of the operation in a message box that is displayedafter the action is completed or in a log file. After you close this window, no further information isavailable for this action.
Additional information about Take Action commands
For more information about working with Take Action commands, see the Tivoli Enterprise Portal User'sGuide.
Predefined Take Action commandsNot all agents have predefined Take Action commands. But you can create Take Action commands forany agent.
The IBM Tivoli Monitoring for Virtual Environments Agent for NetApp Storage does not providepredefined Take Action commands.
© Copyright IBM Corp. 2010, 2011 67

68 IBM Tivoli Monitoring for Virtual Environments Agent for NetApp Storage User's Guide
Chapter 7. Policies reference
Policies are used as an advanced automation technique for implementing more complex workflowstrategies than you can create through simple automation. All agents do not provide predefined policies,but you can create policies for any agent.
About policies
A policy is a set of automated system processes that can take actions, schedule work for users, orautomate manual tasks. You use the Workflow Editor to design policies. You control the order in whichthe policy executes a series of automated steps, which are also called activities. Policies are connected tocreate a workflow. After an activity is completed, the Tivoli Enterprise Portal receives return-codefeedback, and advanced automation logic responds with subsequent activities prescribed by the feedback.
Additional information about policies
This monitoring agent does not provide predefined policies. For more information about working withpolicies, see the Tivoli Enterprise Portal User's Guide.
For information about using the Workflow Editor, see the IBM Tivoli Monitoring Administrator's Guide orthe Tivoli Enterprise Portal online help.
© Copyright IBM Corp. 2010, 2011 69

70 IBM Tivoli Monitoring for Virtual Environments Agent for NetApp Storage User's Guide
Chapter 8. Troubleshooting
Problems can be related to IBM Tivoli Monitoring or the specific agent that you are using.
See the IBM Tivoli Monitoring Troubleshooting Guide for general troubleshooting information. Also see“Support information” on page 94 for other problem-solving options.
You can resolve some problems by ensuring that your system matches the system requirements listed inthe Prerequisites topic for the agent in the information center.
The following activities can help you find a solution to the problem you are having:v “Gathering product information for IBM Software Support”v “Using logging” on page 72v “Consulting the lists of identified problems and workarounds” on page 72
Gathering product information for IBM Software Support
Before contacting IBM Software Support about a problem you are experiencing with this product, gatherthe information shown in Table 2.
Table 2. Information to gather before contacting IBM Software Support
Information type Description
Log files Collect trace log files from failing systems. Most logs arelocated in a logs subdirectory on the host computer. See“Principal trace log files” on page 73 for lists of all tracelog files and their locations. See the Tivoli EnterprisePortal User's Guide for general information about the IBMTivoli Monitoring environment.
Operating system Operating system version number and patch level
Messages Messages and other information displayed on the screen
Version numbers for IBM Tivoli Monitoring Version number of the following members of themonitoring environment:
v IBM Tivoli Monitoring. Also provide the patch level, ifavailable.
v IBM Tivoli Monitoring for Virtual Environments Agentfor NetApp Storage
Screen captures Screen captures of incorrect output, if any
(UNIX systems only) Core dump files If the system stops on UNIX systems, collect the coredump file from the install_dir/bin directory, whereinstall_dir is the directory where you installed themonitoring agent.
You can use the pdcollect tool to collect the most commonly used information from a system. This toolgathers log files, configuration information, version information, and other data. See the "pdcollect tool"section in the "Tools" chapter of the IBM Tivoli Monitoring Troubleshooting Guide for more informationabout using this tool.
See http://www.ibm.com/support/entry/portal/Open_service_request/Software/Software_support_(general) for information about working with IBM Software Support.
© Copyright IBM Corp. 2010, 2011 71
Using logging
Logging is the primary troubleshooting feature in the NetApp Storage agent. Logging refers to the textmessages and trace data that is generated by the NetApp Storage agent. Messages and trace data are sentto a file.
Trace data captures transient information about the current operating environment when a component orapplication fails to operate as designed. IBM Software Support personnel use the captured traceinformation to determine the source of an error or unexpected condition. See “Trace logging” for moreinformation.
Consulting the lists of identified problems and workarounds
Known problems have been organized into types such as those in the following list to make them easierto locate:v Installation and configurationv General usage and operationv Display of monitoring datav Take Action commands
Information about symptoms and detailed workarounds for these types of problems is located in“Problems and workarounds” on page 83.
See the IBM Tivoli Monitoring Troubleshooting Guide for general troubleshooting information.
Trace loggingTrace logs are used to capture information about the operating environment when component softwarefails to operate as designed.
The principal log type is the RAS (Reliability, Availability, and Serviceability) trace log. These logs are inthe English language only. The RAS trace log mechanism is available for all components of IBM TivoliMonitoring. Most logs are located in a logs subdirectory on the host computer. See the followinginformation to learn how to configure and use trace logging:v “Principal trace log files” on page 73v “Examples: Using trace logs” on page 76v “Setting RAS trace parameters by using the GUI” on page 78
Note: The documentation refers to the RAS facility in IBM Tivoli Monitoring as "RAS1."
IBM Software Support personnel use the information captured by trace logging to trace a problem to itssource or to determine why an error occurred. All components in the IBM Tivoli Monitoring environmenthave a default tracing level. The tracing level can be changed on a per-component level to adjust the typeof trace information collected, the degree of trace detail, the number of trace logs to be kept, and theamount of disk space used for tracing.
Overview of log file managementLog files have naming conventions.
Log file naming conventions
Table 3 on page 73 provides the names, locations, and descriptions of RAS1 log files. The log file namesadhere to the following naming convention:
72 IBM Tivoli Monitoring for Virtual Environments Agent for NetApp Storage User's Guide
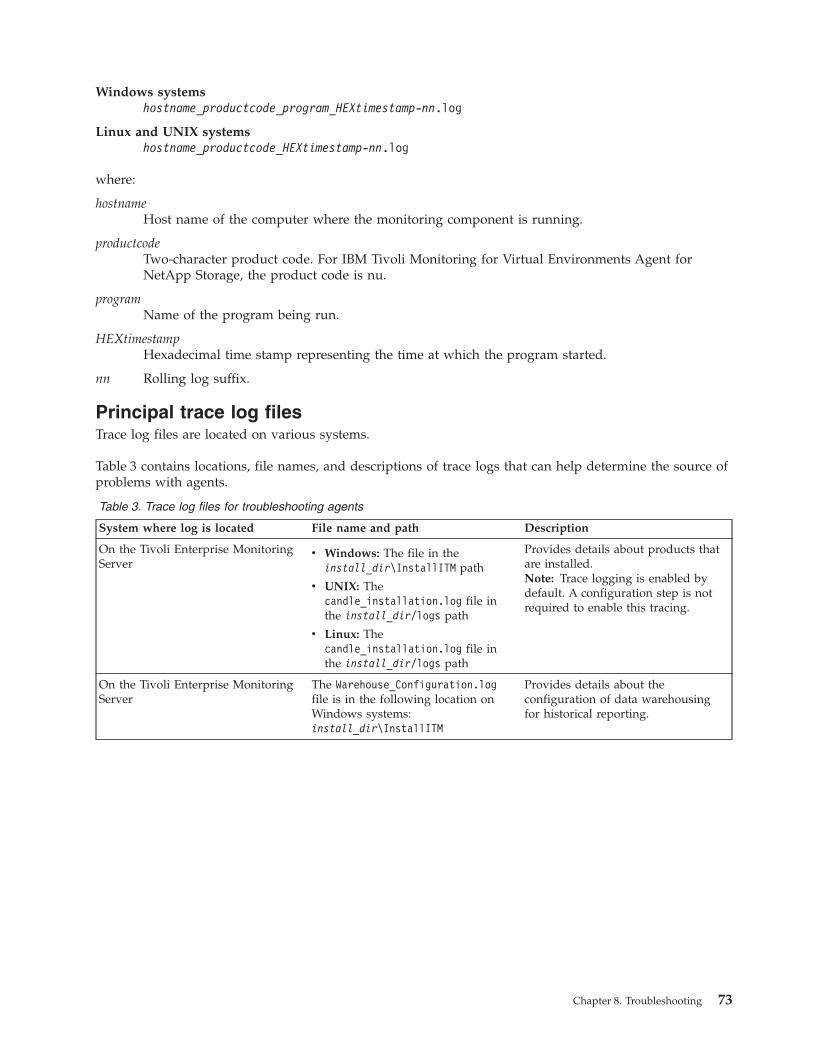
Windows systemshostname_productcode_program_HEXtimestamp-nn.log
Linux and UNIX systemshostname_productcode_HEXtimestamp-nn.log
where:
hostnameHost name of the computer where the monitoring component is running.
productcodeTwo-character product code. For IBM Tivoli Monitoring for Virtual Environments Agent forNetApp Storage, the product code is nu.
programName of the program being run.
HEXtimestampHexadecimal time stamp representing the time at which the program started.
nn Rolling log suffix.
Principal trace log filesTrace log files are located on various systems.
Table 3 contains locations, file names, and descriptions of trace logs that can help determine the source ofproblems with agents.
Table 3. Trace log files for troubleshooting agents
System where log is located File name and path Description
On the Tivoli Enterprise MonitoringServer
v Windows: The file in theinstall_dir\InstallITM path
v UNIX: Thecandle_installation.log file inthe install_dir/logs path
v Linux: Thecandle_installation.log file inthe install_dir/logs path
Provides details about products thatare installed.Note: Trace logging is enabled bydefault. A configuration step is notrequired to enable this tracing.
On the Tivoli Enterprise MonitoringServer
The Warehouse_Configuration.logfile is in the following location onWindows systems:install_dir\InstallITM
Provides details about theconfiguration of data warehousingfor historical reporting.
Chapter 8. Troubleshooting 73
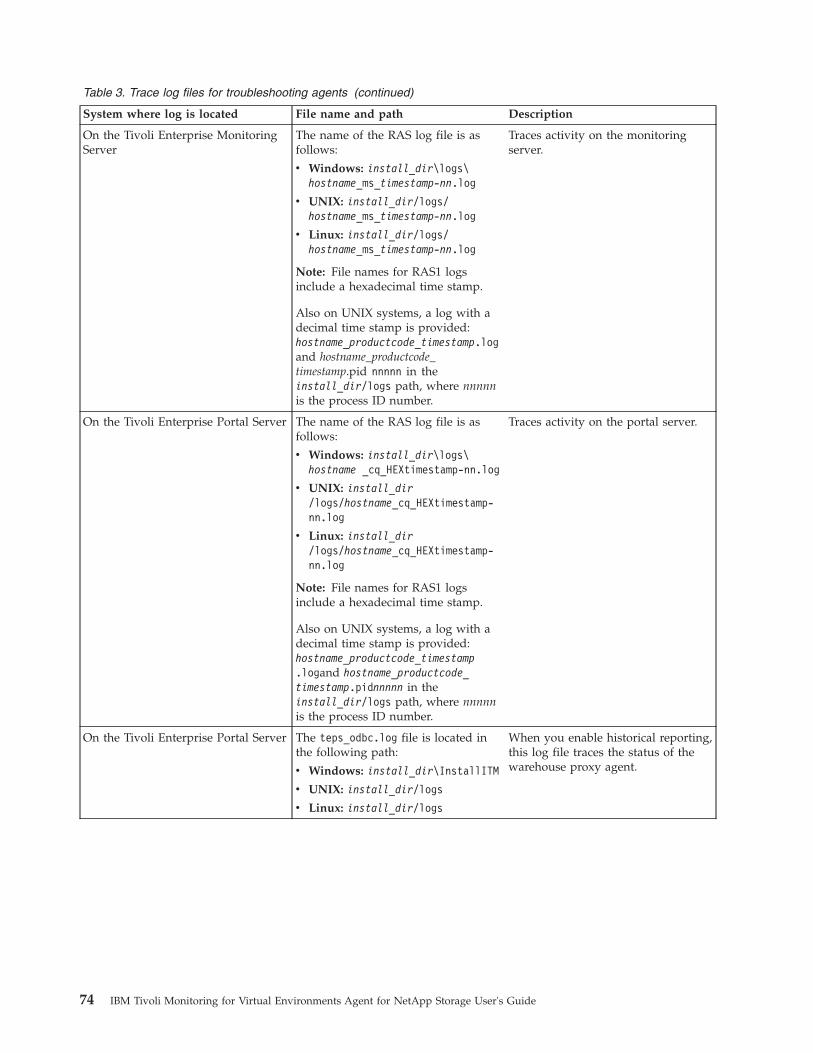
Table 3. Trace log files for troubleshooting agents (continued)
System where log is located File name and path Description
On the Tivoli Enterprise MonitoringServer
The name of the RAS log file is asfollows:
v Windows: install_dir\logs\hostname_ms_timestamp-nn.log
v UNIX: install_dir/logs/hostname_ms_timestamp-nn.log
v Linux: install_dir/logs/hostname_ms_timestamp-nn.log
Note: File names for RAS1 logsinclude a hexadecimal time stamp.
Also on UNIX systems, a log with adecimal time stamp is provided:hostname_productcode_timestamp.logand hostname_productcode_timestamp.pid nnnnn in theinstall_dir/logs path, where nnnnnis the process ID number.
Traces activity on the monitoringserver.
On the Tivoli Enterprise Portal Server The name of the RAS log file is asfollows:
v Windows: install_dir\logs\hostname _cq_HEXtimestamp-nn.log
v UNIX: install_dir/logs/hostname_cq_HEXtimestamp-nn.log
v Linux: install_dir/logs/hostname_cq_HEXtimestamp-nn.log
Note: File names for RAS1 logsinclude a hexadecimal time stamp.
Also on UNIX systems, a log with adecimal time stamp is provided:hostname_productcode_timestamp.logand hostname_productcode_timestamp.pidnnnnn in theinstall_dir/logs path, where nnnnnis the process ID number.
Traces activity on the portal server.
On the Tivoli Enterprise Portal Server The teps_odbc.log file is located inthe following path:
v Windows: install_dir\InstallITM
v UNIX: install_dir/logs
v Linux: install_dir/logs
When you enable historical reporting,this log file traces the status of thewarehouse proxy agent.
74 IBM Tivoli Monitoring for Virtual Environments Agent for NetApp Storage User's Guide
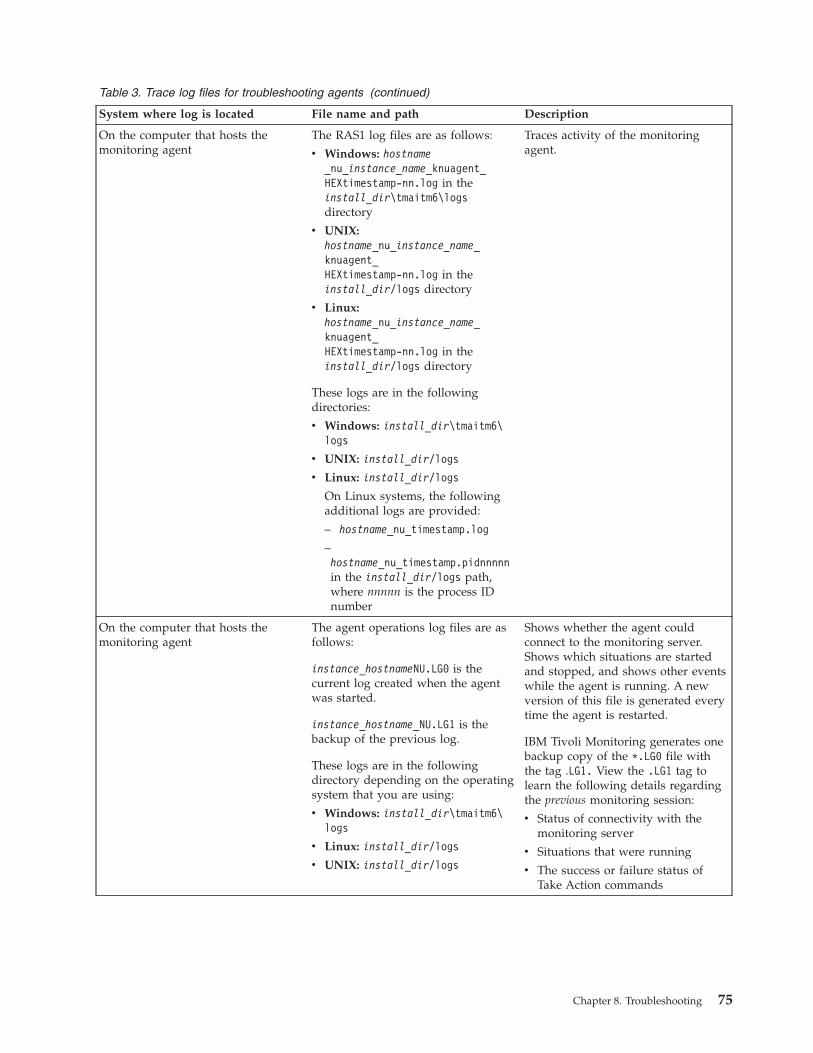
Table 3. Trace log files for troubleshooting agents (continued)
System where log is located File name and path Description
On the computer that hosts themonitoring agent
The RAS1 log files are as follows:
v Windows: hostname_nu_instance_name_knuagent_HEXtimestamp-nn.log in theinstall_dir\tmaitm6\logsdirectory
v UNIX:hostname_nu_instance_name_knuagent_HEXtimestamp-nn.log in theinstall_dir/logs directory
v Linux:hostname_nu_instance_name_knuagent_HEXtimestamp-nn.log in theinstall_dir/logs directory
These logs are in the followingdirectories:
v Windows: install_dir\tmaitm6\logs
v UNIX: install_dir/logs
v Linux: install_dir/logs
On Linux systems, the followingadditional logs are provided:
– hostname_nu_timestamp.log
–hostname_nu_timestamp.pidnnnnnin the install_dir/logs path,where nnnnn is the process IDnumber
Traces activity of the monitoringagent.
On the computer that hosts themonitoring agent
The agent operations log files are asfollows:
instance_hostnameNU.LG0 is thecurrent log created when the agentwas started.
instance_hostname_NU.LG1 is thebackup of the previous log.
These logs are in the followingdirectory depending on the operatingsystem that you are using:
v Windows: install_dir\tmaitm6\logs
v Linux: install_dir/logs
v UNIX: install_dir/logs
Shows whether the agent couldconnect to the monitoring server.Shows which situations are startedand stopped, and shows other eventswhile the agent is running. A newversion of this file is generated everytime the agent is restarted.
IBM Tivoli Monitoring generates onebackup copy of the *.LG0 file withthe tag .LG1. View the .LG1 tag tolearn the following details regardingthe previous monitoring session:
v Status of connectivity with themonitoring server
v Situations that were running
v The success or failure status ofTake Action commands
Chapter 8. Troubleshooting 75
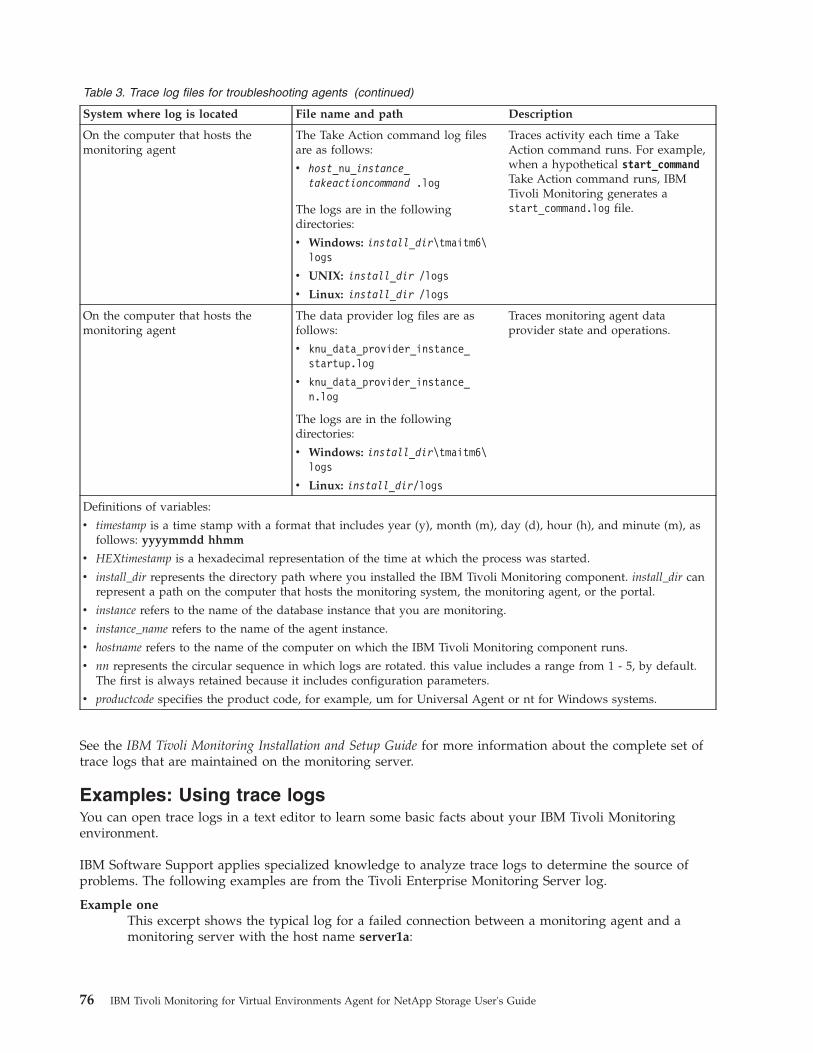
Table 3. Trace log files for troubleshooting agents (continued)
System where log is located File name and path Description
On the computer that hosts themonitoring agent
The Take Action command log filesare as follows:
v host_nu_instance_takeactioncommand .log
The logs are in the followingdirectories:
v Windows: install_dir\tmaitm6\logs
v UNIX: install_dir /logs
v Linux: install_dir /logs
Traces activity each time a TakeAction command runs. For example,when a hypothetical start_commandTake Action command runs, IBMTivoli Monitoring generates astart_command.log file.
On the computer that hosts themonitoring agent
The data provider log files are asfollows:
v knu_data_provider_instance_startup.log
v knu_data_provider_instance_n.log
The logs are in the followingdirectories:
v Windows: install_dir\tmaitm6\logs
v Linux: install_dir/logs
Traces monitoring agent dataprovider state and operations.
Definitions of variables:
v timestamp is a time stamp with a format that includes year (y), month (m), day (d), hour (h), and minute (m), asfollows: yyyymmdd hhmm
v HEXtimestamp is a hexadecimal representation of the time at which the process was started.
v install_dir represents the directory path where you installed the IBM Tivoli Monitoring component. install_dir canrepresent a path on the computer that hosts the monitoring system, the monitoring agent, or the portal.
v instance refers to the name of the database instance that you are monitoring.
v instance_name refers to the name of the agent instance.
v hostname refers to the name of the computer on which the IBM Tivoli Monitoring component runs.
v nn represents the circular sequence in which logs are rotated. this value includes a range from 1 - 5, by default.The first is always retained because it includes configuration parameters.
v productcode specifies the product code, for example, um for Universal Agent or nt for Windows systems.
See the IBM Tivoli Monitoring Installation and Setup Guide for more information about the complete set oftrace logs that are maintained on the monitoring server.
Examples: Using trace logsYou can open trace logs in a text editor to learn some basic facts about your IBM Tivoli Monitoringenvironment.
IBM Software Support applies specialized knowledge to analyze trace logs to determine the source ofproblems. The following examples are from the Tivoli Enterprise Monitoring Server log.
Example oneThis excerpt shows the typical log for a failed connection between a monitoring agent and amonitoring server with the host name server1a:
76 IBM Tivoli Monitoring for Virtual Environments Agent for NetApp Storage User's Guide
(Thursday, August 11, 2005, 08:21:30-{94C}kdcl0cl.c,105,"KDCL0_ClientLookup") status=1c020006,"location server unavailable", ncs/KDC1_STC_SERVER_UNAVAILABLE(Thursday, August 11, 2005, 08:21:35-{94C}kraarreg.cpp,1157,"LookupProxy") Unable to connect tobroker at ip.pipe:: status=0, "success", ncs/KDC1_STC_OK(Thursday, August 11, 2005, 08:21:35-{94C}kraarreg.cpp,1402,"FindProxyUsingLocalLookup") Unableto find running CMS on CT_CMSLIST <IP.PIPE:#server1a>
Example twoThe following excerpts from the trace log for the monitoring server show the status of an agent,identified here as "Remote node." The name of the computer where the agent is running isSERVER5B:(42C039F9.0000-6A4:kpxreqhb.cpp,649,"HeartbeatInserter") Remote node SERVER5B:NU is ON-LINE.. . .(42C3079B.0000-6A4:kpxreqhb.cpp,644,"HeartbeatInserter") Remote node SERVER5B:NU is OFF-LINE.
See the following key points about the preceding excerpts:v The monitoring server appends the NU product code to the server name to form a unique
name (SERVER5B:NU ) for this instance of the IBM Tivoli Monitoring for Virtual EnvironmentsAgent for NetApp Storage. By using this unique name, you can distinguish multiplemonitoring products that might be running on SERVER5B.
v The log shows when the agent started (ON-LINE) and later stopped (OFF-LINE) in theenvironment.
v For the sake of brevity, an ellipsis (...) represents the series of trace log entries that weregenerated while the agent was running.
v Between the ON-LINE and OFF-LINE log entries, the agent was communicating with themonitoring server.
v The ON-LINE and OFF-LINE log entries are always available in the trace log. All trace levelsthat are described in “Setting RAS trace parameters by using the GUI” on page 78 providethese entries.
On Windows systems, you can use the following alternate method to view trace logs:1. In the Windows Start menu, click Program Files > IBM Tivoli Monitoring > Manage Tivoli
Enterprise Monitoring Services. The Manage Tivoli Enterprise Monitoring Services window isdisplayed.
2. Right-click a component and click Advanced > View Trace Log in the menu. For example, if youwant to view the trace log of the IBM Tivoli Monitoring for Virtual Environments Agent for NetAppStorage, right-click the name of that agent in the window. You can also use the viewer to accessremote logs.
Note: The viewer converts time stamps in the logs to a format that is easier to read.
RAS trace parametersPnpoint a problem by setting detailed tracing of individual components of the monitoring agent andmodules
See “Overview of log file management” on page 72 to ensure that you understand log rolling and canreference the correct log files when you manage log file generation.
In the log monitoring component of the PeopleSoft Application Domain agent and PeopleSoft ProcessScheduler agent, a file name-based scheme is used to determine the newest PeopleSoft log file to monitor.For example, the APPSRV_1016 log file from October 16 appears to be newer than the APPSRV_0218 filefrom February 18; thus, the APPSRV_1016 file is monitored. This scheme becomes a problem when the daterolls over from December to January upon a new year. The log monitoring incorrectly identifies
Chapter 8. Troubleshooting 77
APPSRV_1231 as a newer log file than APPSRV_0101. The suggested solution is to archive log files from theprevious year into a different location. Keep only files from the current year in the directories containingthe PeopleSoft domain and scheduler log files.
Setting RAS trace parameters by using the GUIOn Windows systems, you can use the graphical user interface to set trace options.
About this task
The IBM Tivoli Monitoring for Virtual Environments Agent for NetApp Storage uses RAS1 tracing andgenerates the logs described in Table 3 on page 73. The default RAS1 trace level is ERROR. The defaultRAS1 trace level is ERROR.
Procedure1. Open the Manage Tivoli Enterprise Monitoring Services window.2. Select Advanced > Edit Trace Parms. The Tivoli Enterprise Monitoring Server Trace Parameters
window is displayed.3. Select a new trace setting in the pull-down menu in the Enter RAS1 Filters field or type a valid
string.v General error tracing. KBB_RAS1=ERRORv Intensive error tracing. KBB_RAS1=ERROR (UNIT:kqz ALL)v Maximum error tracing. KBB_RAS1=ERROR (UNIT:kqz ALL) (UNIT:kra ALL)
Note: As this example shows, you can set multiple RAS tracing options in a single statement.4. Modify the value for Maximum Log Size Per File (MB) to change the log file size (changes LIMIT
value).5. Modify the value for Maximum Number of Log Files Per Session to change the number of log files
per startup of a program (changes COUNT value).6. Modify the value for Maximum Number of Log Files Total to change the number of log files for all
startups of a program (changes MAXFILES value).7. Optional: Click Y (Yes) in the KDC_DEBUGd Setting menu to log information that can help you
diagnose communications and connectivity problems between the monitoring agent and themonitoring server. The KDC_DEBUG setting and the Maximum error tracing setting can generate a largeamount of trace logging. Use these settings only temporarily, while you are troubleshooting problems.Otherwise, the logs can occupy excessive amounts of hard disk space.
8. Click OK. You see a message reporting a restart of the monitoring agent so that your changes takeeffect.
What to do next
Monitor the size of the logs directory. Default behavior can generate a total of 45 - 60 MB for each agentthat is running on a computer. For example, each database instance that you monitor can generate 45 - 60MB of log data. See the "Procedure" section to learn how to adjust file size and numbers of log files toprevent logging activity from occupying too much disk space.
Regularly prune log files other than the RAS1 log files in the logs directory. Unlike the RAS1 log filesthat are pruned automatically, other log types can grow indefinitely, for example, the logs in Table 3 onpage 73 that include a process ID number (PID).
Use collector trace logs as an additional source of troubleshooting information.
78 IBM Tivoli Monitoring for Virtual Environments Agent for NetApp Storage User's Guide
Note: The KDC_DEBUG setting and the Maximum error tracing setting can generate a large amount of tracelogging. Use these settings only temporarily while you are troubleshooting problems. Otherwise, the logscan occupy excessive amounts of hard disk space.
Manually setting RAS trace parametersYou can manually edit the RAS1 trace logging parameters.
About this task
The IBM Tivoli Monitoring for Virtual Environments Agent for NetApp Storage uses RAS1 tracing andgenerates the logs described in Table 3 on page 73. The default RAS1 trace level is ERROR. The defaultRAS1 trace level is ERROR.
Procedure1. Open the trace options file.
v Windows:
install_dir\tmaitm6\KNUENV
v install_dir /config/nu.ini
2. Edit the line that begins with KBB_RAS1= to set trace logging preferences. For example, if you wantdetailed trace logging, set the Maximum Tracing option: KBB_RAS1=ERROR (UNIT:kqz ALL) (UNIT:kraALL)
3. Edit the line that begins with KBB_RAS1_LOG= to manage the generation of log files:v MAXFILES: The total number of files that are to be kept for all startups of a given program. When
this value is exceeded, the oldest log files are discarded. The default value is 9.v LIMIT: The maximum size, in megabytes (MB) of a RAS1 log file. The default value is 5.v IBM Software Support might guide you to modify the following parameters:
– COUNT: The number of log files to keep in the rolling cycle of one program startup. The default is3.
– PRESERVE: The number of files that are not to be reused in the rolling cycle of one programstartup. The default value is 1.
Note: The KBB_RAS1_LOG parameter also provides for the specification of the log file directory, logfile name, and the inventory control file directory and name. Do not modify these values or loginformation can be lost.
4. Restart the monitoring agent so that your changes take effect.
What to do next
Monitor the size of the logs directory. Default behavior can generate a total of 45 - 60 MB for each agentthat is running on a computer. For example, each database instance that you monitor can generate 45 - 60MB of log data. See the "Procedure" section to learn how to adjust file size and numbers of log files toprevent logging activity from occupying too much disk space.
Regularly prune log files other than the RAS1 log files in the logs directory. Unlike the RAS1 log filesthat are pruned automatically, other log types can grow indefinitely, for example, the logs in Table 3 onpage 73 that include a process ID number (PID).
Use collector trace logs as an additional source of troubleshooting information.
Note: The KDC_DEBUG setting and the Maximum error tracing setting can generate a large amount of tracelogging. Use these settings only temporarily while you are troubleshooting problems. Otherwise, the logscan occupy excessive amounts of hard disk space.
Chapter 8. Troubleshooting 79
Dynamic modification of trace settingsYou can dynamically modify the trace settings for an IBM Tivoli Monitoring component, such as, TivoliEnterprise Monitoring Server, Tivoli Enterprise Portal Server, most monitoring agents, and othercomponents. You can access these components, with the exception of a few monitoring agents, from thetracing utility.
Dynamic modification of the trace settings is the most efficient method, because you can do it withoutrestarting the component. Settings take effect immediately. Modifications by this method are notpersistent.
Note: When the component is restarted, the trace settings are read again from the .env file. Dynamicallymodifying these settings does not change the settings in the .env files. To modify these trace settingspermanently, modify them in the .env files.
ras1
Run this command to modify the trace settings for a Tivoli Monitoring component.
The syntax is as follows:ras1 set|list (UNIT|COMP: class_name ANY|ALL|Detail|ERROR|Flow|INPUT|Metrics|OUTPUT|STATE){(UNIT|COMP: class_name ANY|ALL|Detail|ERROR|Flow|INPUT|Metrics|OUTPUT|STATE)}
You can specify more than one component class to which to apply the trace settings.
Command options
setTurns on or off tracing depending upon the value of its parameters. If the parameter is ANY, it turns itoff. All other parameters turn on tracing based on the specified type or level.
listDisplays the default level and type of tracing that is set by default.
Parameters
The parameters that determine the component classes to which to apply the trace settings are as follows:
COMP: class_nameModifies the trace setting for the name of the component class, as specified by class_name , forexample, COMP:KDH. The output contains trace for the specified class.
UNIT: class_nameModifies the trace setting for any unit that starts with the specified class_name value, for example,UNIT: kra. The output contains trace for any unit that begins with the specified filter pattern.
The parameters that determine the trace level and type are as follows:
ALLDisplays all trace levels, including every trace point defined for the component. This setting mightresult in a large amount of trace, so specify other parameters to exclude unwanted trace. You mightrequire the ALL parameter to isolate a problem. It is the equivalent to setting "Error Detail FlowState Input Output Metrics".
ANYTurns off tracing.
DetailDisplays detailed information about each function.
80 IBM Tivoli Monitoring for Virtual Environments Agent for NetApp Storage User's Guide
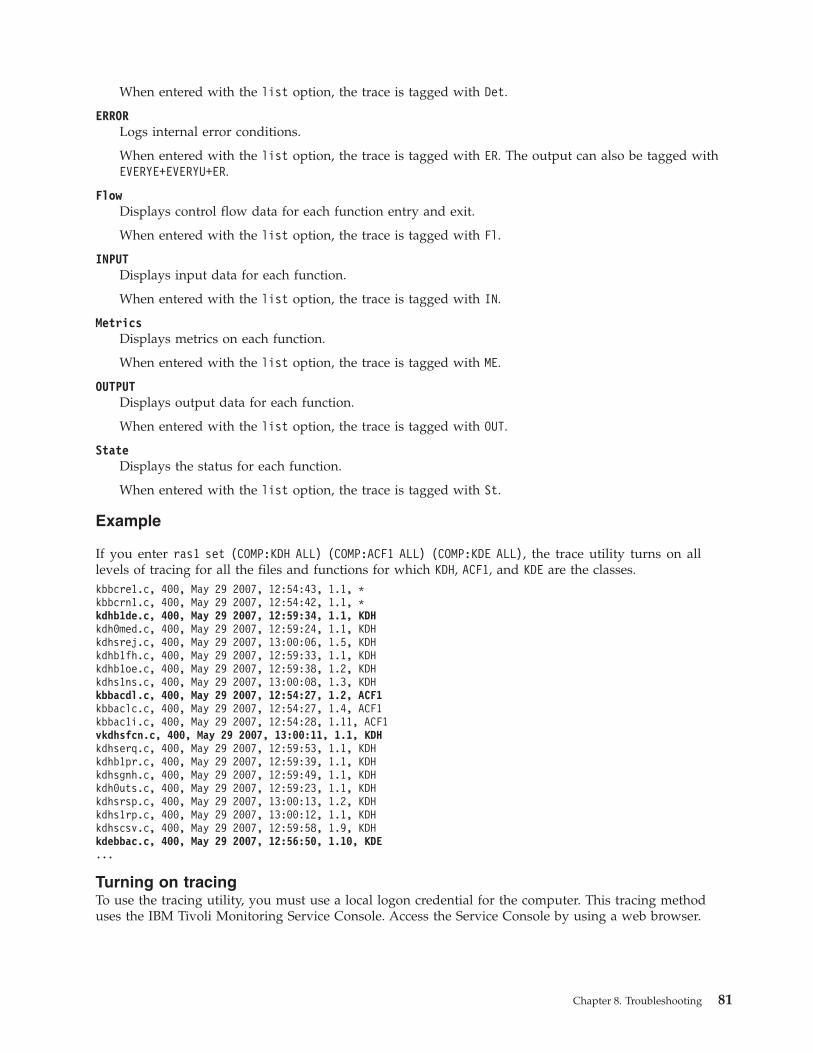
When entered with the list option, the trace is tagged with Det.
ERRORLogs internal error conditions.
When entered with the list option, the trace is tagged with ER. The output can also be tagged withEVERYE+EVERYU+ER.
FlowDisplays control flow data for each function entry and exit.
When entered with the list option, the trace is tagged with Fl.
INPUTDisplays input data for each function.
When entered with the list option, the trace is tagged with IN.
MetricsDisplays metrics on each function.
When entered with the list option, the trace is tagged with ME.
OUTPUTDisplays output data for each function.
When entered with the list option, the trace is tagged with OUT.
StateDisplays the status for each function.
When entered with the list option, the trace is tagged with St.
Example
If you enter ras1 set (COMP:KDH ALL) (COMP:ACF1 ALL) (COMP:KDE ALL), the trace utility turns on alllevels of tracing for all the files and functions for which KDH, ACF1, and KDE are the classes.kbbcre1.c, 400, May 29 2007, 12:54:43, 1.1, *kbbcrn1.c, 400, May 29 2007, 12:54:42, 1.1, *kdhb1de.c, 400, May 29 2007, 12:59:34, 1.1, KDHkdh0med.c, 400, May 29 2007, 12:59:24, 1.1, KDHkdhsrej.c, 400, May 29 2007, 13:00:06, 1.5, KDHkdhb1fh.c, 400, May 29 2007, 12:59:33, 1.1, KDHkdhb1oe.c, 400, May 29 2007, 12:59:38, 1.2, KDHkdhs1ns.c, 400, May 29 2007, 13:00:08, 1.3, KDHkbbacdl.c, 400, May 29 2007, 12:54:27, 1.2, ACF1kbbaclc.c, 400, May 29 2007, 12:54:27, 1.4, ACF1kbbac1i.c, 400, May 29 2007, 12:54:28, 1.11, ACF1vkdhsfcn.c, 400, May 29 2007, 13:00:11, 1.1, KDHkdhserq.c, 400, May 29 2007, 12:59:53, 1.1, KDHkdhb1pr.c, 400, May 29 2007, 12:59:39, 1.1, KDHkdhsgnh.c, 400, May 29 2007, 12:59:49, 1.1, KDHkdh0uts.c, 400, May 29 2007, 12:59:23, 1.1, KDHkdhsrsp.c, 400, May 29 2007, 13:00:13, 1.2, KDHkdhs1rp.c, 400, May 29 2007, 13:00:12, 1.1, KDHkdhscsv.c, 400, May 29 2007, 12:59:58, 1.9, KDHkdebbac.c, 400, May 29 2007, 12:56:50, 1.10, KDE...
Turning on tracingTo use the tracing utility, you must use a local logon credential for the computer. This tracing methoduses the IBM Tivoli Monitoring Service Console. Access the Service Console by using a web browser.
Chapter 8. Troubleshooting 81
About this task
When you start the Service Console, it displays the information about the components that are currentlyrunning on that computer. For example, these components are listed as follows:v Tivoli Enterprise Portal Server: cnpv Monitoring Agent for Windows OS: ntv Tivoli Enterprise Monitoring Server: ms
After you log on, you can type ? to display a list of the supported commands. ras1 is the command tomodify trace settings. If you type it in the field at the bottom of the window, the help for this commandis displayed.
Procedure1. Open a web browser and enter the URL to access the Service Console.
http://hostname:1920
where hostname is the IP address or host name of the computer on which the Tivoli Monitoringcomponent is running.
2. Click the hyperlink associated with the component for which you want to modify its trace settings.
Note: In the previous view, if you want to modify tracing for the Tivoli Enterprise Monitoring Server,select IBM Tivoli Monitoring Service Console under Service Point: system.your host name_ms.
3. Enter a user ID and password to access the system. This ID is any valid user that has access to thesystem.
4. Enter the command to turn on the required level of trace for the specified component classes or units.ras1 set (UNIT|COMP: class_name ALL|Flow|ERROR|Detail|INPUT|Metrics|OUTPUT|STATE){(UNIT|COMP: class_name ALL|Flow|ERROR|Detail|INPUT|Metrics|OUTPUT|STATE)}
For example, to turn on the control flow trace for the KDE, the command is:ras1 (COMP:KDE Flow)
Turning off tracingYou can use the IBM Tivoli Monitoring Service Console to run the ras1 command and dynamically turnoff tracing.
Procedure1. Open a web browser and enter the URL to access the Service Console.
http://hostname:1920
where hostname is the IP address or host name of the computer on which the Tivoli Monitoringcomponent is running.
2. Click the hyperlink associated with the component for which you want to modify its trace settings.3. Enter a user ID and password to access the system. This ID is any valid user that has access to the
system.4. Enter the command to turn off the required level of trace for the specified component classes or units.
ras1 set (UNIT|COMP: class_name ANY){(UNIT|COMP: class_name ANY)}
For example, to turn off tracing for the kbbcrcd class of the Windows OS agent, the command is:ras1 set (UNIT:kbbcrcd ANY)
82 IBM Tivoli Monitoring for Virtual Environments Agent for NetApp Storage User's Guide
Setting trace parameters for the Tivoli Enterprise Console serverIn addition to the trace information captured by IBM Tivoli Monitoring, you can also collect additionaltrace information for the Tivoli Enterprise Console components that gather event server metrics.
About this task
To collect this information, modify the .tec_diag_config file on the Tivoli Enterprise Console eventserver. Use the steps in the following procedure to modify the event server trace parameters.
Procedure1. Open the $BINDIR/TME/TEC/.tec_diag_config file in an ASCII editor.2. Locate the entries that configure trace logging for the agent components on the event server. Two
entries are included, one for tec_reception and one for tec_rule:# to debug Agent Utilstec_reception Agent_Utils error /tmp/tec_receptionSP# to debug Agent Utilstec_rule Agent_Utils error /tmp/tec_rule
3. To gather additional trace information, modify these entries to specify a trace level of trace2:# to debug Agent Utilstec_reception Agent_Utils trace2 /tmp/tec_receptionSP# to debug Agent Utilstec_rule Agent_Utils trace2 /tmp/tec_rule
4. In addition, modify the Highest_level entries for tec_rule and tec_reception:tec_reception Highest_level trace2SPtec_rule Highest_level trace2
Problems and workaroundsThe known problems and workarounds are organized into types of problems that might occur with theNetApp Storage agent, for example installation and configuration problems and workspace problems.
Note: You can resolve some problems by ensuring that your system matches the system requirementslisted in the Prerequisites topic for the agent in the information center.
See the IBM Tivoli Monitoring Troubleshooting Guide for general troubleshooting information.
Installation and configuration troubleshootingProblems can occur during installation, configuration, and uninstallation of the agent.
The problems and solutions in Table 4 on page 84 can occur during installation, configuration, anduninstallation of the agent.
Chapter 8. Troubleshooting 83
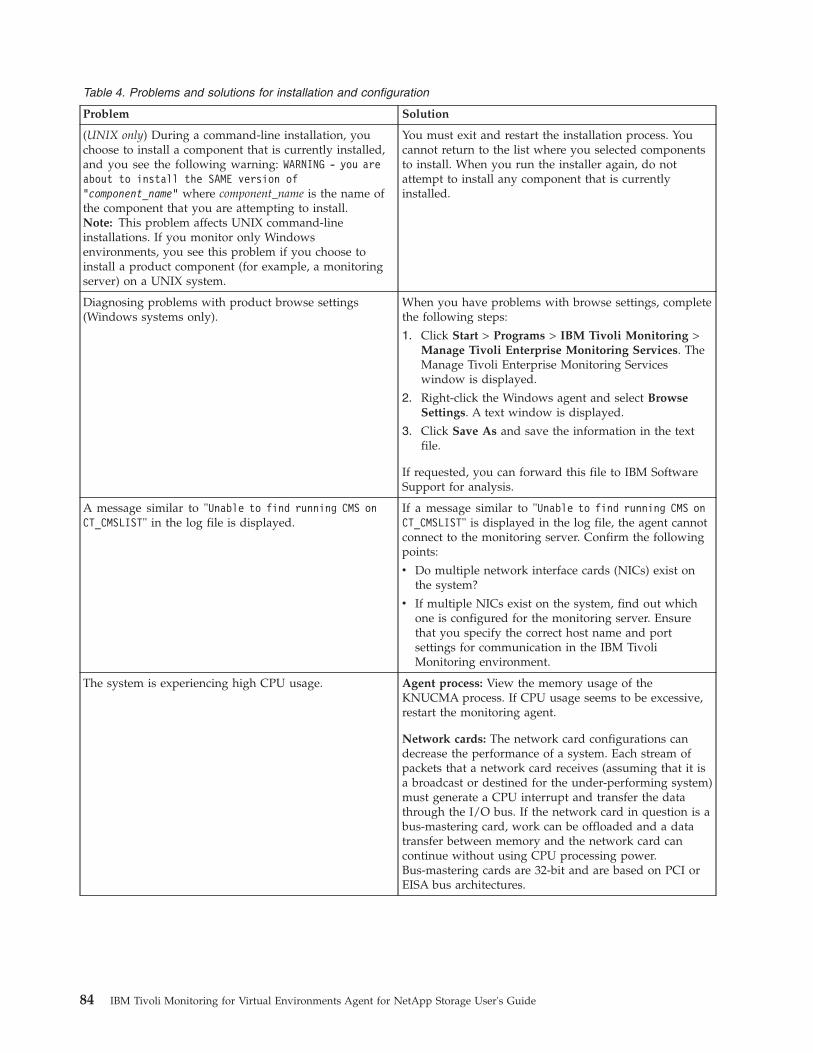
Table 4. Problems and solutions for installation and configuration
Problem Solution
(UNIX only) During a command-line installation, youchoose to install a component that is currently installed,and you see the following warning: WARNING - you areabout to install the SAME version of"component_name" where component_name is the name ofthe component that you are attempting to install.Note: This problem affects UNIX command-lineinstallations. If you monitor only Windowsenvironments, you see this problem if you choose toinstall a product component (for example, a monitoringserver) on a UNIX system.
You must exit and restart the installation process. Youcannot return to the list where you selected componentsto install. When you run the installer again, do notattempt to install any component that is currentlyinstalled.
Diagnosing problems with product browse settings(Windows systems only).
When you have problems with browse settings, completethe following steps:
1. Click Start > Programs > IBM Tivoli Monitoring >Manage Tivoli Enterprise Monitoring Services. TheManage Tivoli Enterprise Monitoring Serviceswindow is displayed.
2. Right-click the Windows agent and select BrowseSettings. A text window is displayed.
3. Click Save As and save the information in the textfile.
If requested, you can forward this file to IBM SoftwareSupport for analysis.
A message similar to "Unable to find running CMS onCT_CMSLIST" in the log file is displayed.
If a message similar to "Unable to find running CMS onCT_CMSLIST" is displayed in the log file, the agent cannotconnect to the monitoring server. Confirm the followingpoints:
v Do multiple network interface cards (NICs) exist onthe system?
v If multiple NICs exist on the system, find out whichone is configured for the monitoring server. Ensurethat you specify the correct host name and portsettings for communication in the IBM TivoliMonitoring environment.
The system is experiencing high CPU usage. Agent process: View the memory usage of theKNUCMA process. If CPU usage seems to be excessive,restart the monitoring agent.
Network cards: The network card configurations candecrease the performance of a system. Each stream ofpackets that a network card receives (assuming that it isa broadcast or destined for the under-performing system)must generate a CPU interrupt and transfer the datathrough the I/O bus. If the network card in question is abus-mastering card, work can be offloaded and a datatransfer between memory and the network card cancontinue without using CPU processing power.Bus-mastering cards are 32-bit and are based on PCI orEISA bus architectures.
84 IBM Tivoli Monitoring for Virtual Environments Agent for NetApp Storage User's Guide
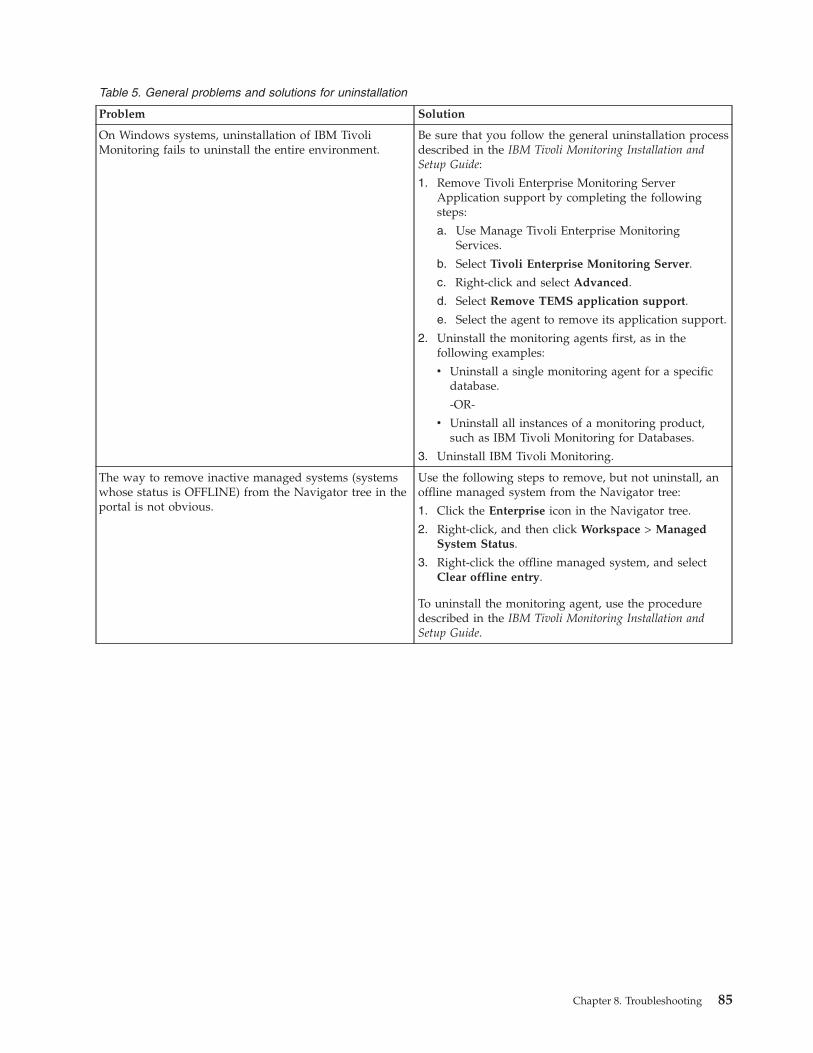
Table 5. General problems and solutions for uninstallation
Problem Solution
On Windows systems, uninstallation of IBM TivoliMonitoring fails to uninstall the entire environment.
Be sure that you follow the general uninstallation processdescribed in the IBM Tivoli Monitoring Installation andSetup Guide:
1. Remove Tivoli Enterprise Monitoring ServerApplication support by completing the followingsteps:
a. Use Manage Tivoli Enterprise MonitoringServices.
b. Select Tivoli Enterprise Monitoring Server.
c. Right-click and select Advanced.
d. Select Remove TEMS application support.
e. Select the agent to remove its application support.
2. Uninstall the monitoring agents first, as in thefollowing examples:
v Uninstall a single monitoring agent for a specificdatabase.
-OR-
v Uninstall all instances of a monitoring product,such as IBM Tivoli Monitoring for Databases.
3. Uninstall IBM Tivoli Monitoring.
The way to remove inactive managed systems (systemswhose status is OFFLINE) from the Navigator tree in theportal is not obvious.
Use the following steps to remove, but not uninstall, anoffline managed system from the Navigator tree:
1. Click the Enterprise icon in the Navigator tree.
2. Right-click, and then click Workspace > ManagedSystem Status.
3. Right-click the offline managed system, and selectClear offline entry.
To uninstall the monitoring agent, use the proceduredescribed in the IBM Tivoli Monitoring Installation andSetup Guide.
Chapter 8. Troubleshooting 85
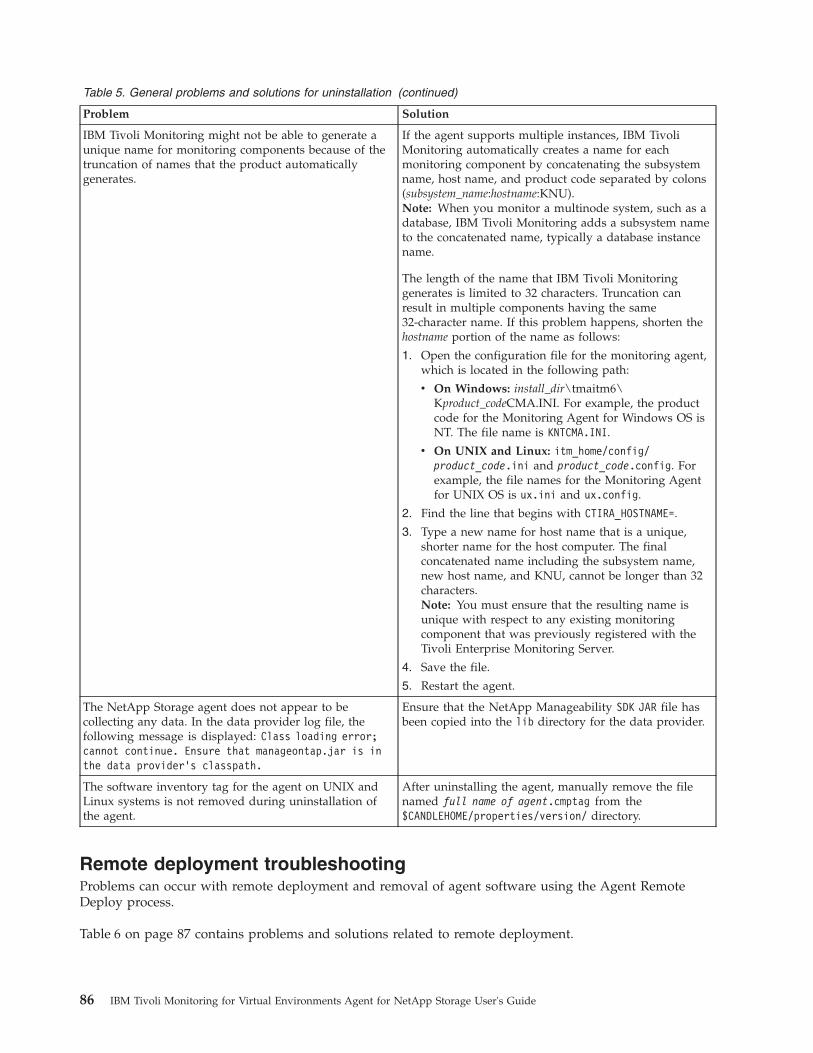
Table 5. General problems and solutions for uninstallation (continued)
Problem Solution
IBM Tivoli Monitoring might not be able to generate aunique name for monitoring components because of thetruncation of names that the product automaticallygenerates.
If the agent supports multiple instances, IBM TivoliMonitoring automatically creates a name for eachmonitoring component by concatenating the subsystemname, host name, and product code separated by colons(subsystem_name:hostname:KNU).Note: When you monitor a multinode system, such as adatabase, IBM Tivoli Monitoring adds a subsystem nameto the concatenated name, typically a database instancename.
The length of the name that IBM Tivoli Monitoringgenerates is limited to 32 characters. Truncation canresult in multiple components having the same32-character name. If this problem happens, shorten thehostname portion of the name as follows:
1. Open the configuration file for the monitoring agent,which is located in the following path:
v On Windows: install_dir\tmaitm6\Kproduct_codeCMA.INI. For example, the productcode for the Monitoring Agent for Windows OS isNT. The file name is KNTCMA.INI.
v On UNIX and Linux: itm_home/config/product_code.ini and product_code.config. Forexample, the file names for the Monitoring Agentfor UNIX OS is ux.ini and ux.config.
2. Find the line that begins with CTIRA_HOSTNAME=.
3. Type a new name for host name that is a unique,shorter name for the host computer. The finalconcatenated name including the subsystem name,new host name, and KNU, cannot be longer than 32characters.Note: You must ensure that the resulting name isunique with respect to any existing monitoringcomponent that was previously registered with theTivoli Enterprise Monitoring Server.
4. Save the file.
5. Restart the agent.
The NetApp Storage agent does not appear to becollecting any data. In the data provider log file, thefollowing message is displayed: Class loading error;cannot continue. Ensure that manageontap.jar is inthe data provider's classpath.
Ensure that the NetApp Manageability SDK JAR file hasbeen copied into the lib directory for the data provider.
The software inventory tag for the agent on UNIX andLinux systems is not removed during uninstallation ofthe agent.
After uninstalling the agent, manually remove the filenamed full name of agent.cmptag from the$CANDLEHOME/properties/version/ directory.
Remote deployment troubleshootingProblems can occur with remote deployment and removal of agent software using the Agent RemoteDeploy process.
Table 6 on page 87 contains problems and solutions related to remote deployment.
86 IBM Tivoli Monitoring for Virtual Environments Agent for NetApp Storage User's Guide
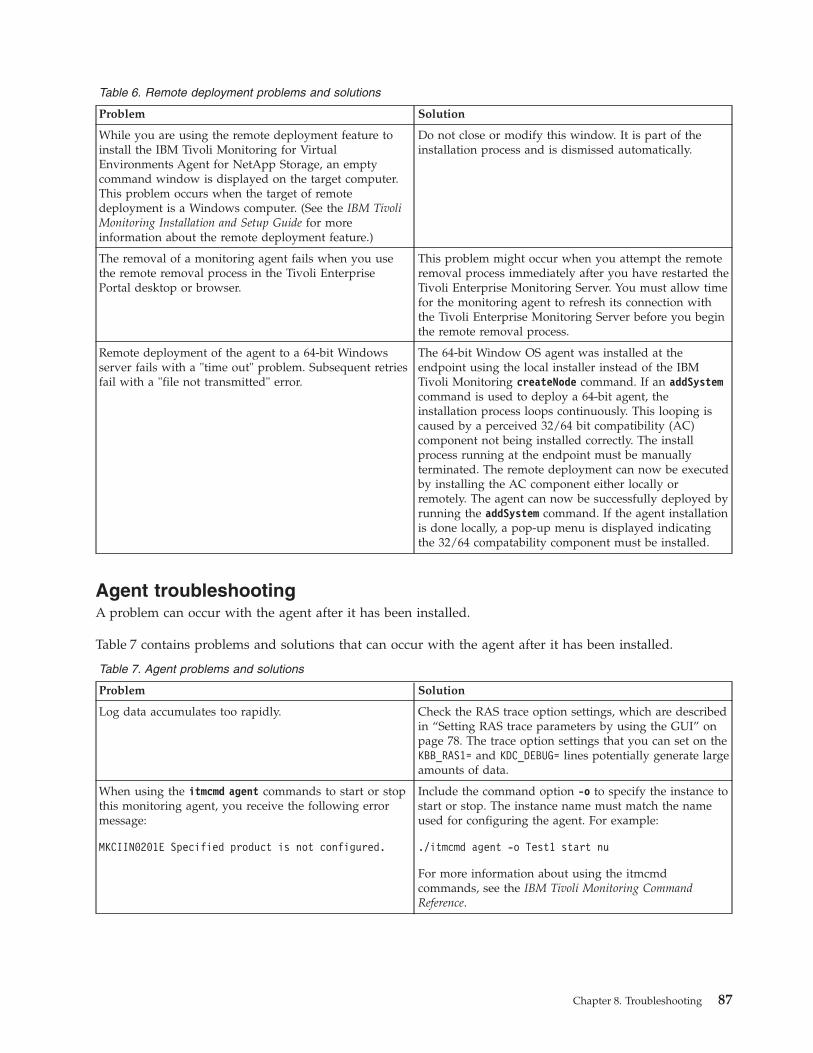
Table 6. Remote deployment problems and solutions
Problem Solution
While you are using the remote deployment feature toinstall the IBM Tivoli Monitoring for VirtualEnvironments Agent for NetApp Storage, an emptycommand window is displayed on the target computer.This problem occurs when the target of remotedeployment is a Windows computer. (See the IBM TivoliMonitoring Installation and Setup Guide for moreinformation about the remote deployment feature.)
Do not close or modify this window. It is part of theinstallation process and is dismissed automatically.
The removal of a monitoring agent fails when you usethe remote removal process in the Tivoli EnterprisePortal desktop or browser.
This problem might occur when you attempt the remoteremoval process immediately after you have restarted theTivoli Enterprise Monitoring Server. You must allow timefor the monitoring agent to refresh its connection withthe Tivoli Enterprise Monitoring Server before you beginthe remote removal process.
Remote deployment of the agent to a 64-bit Windowsserver fails with a "time out" problem. Subsequent retriesfail with a "file not transmitted" error.
The 64-bit Window OS agent was installed at theendpoint using the local installer instead of the IBMTivoli Monitoring createNode command. If an addSystemcommand is used to deploy a 64-bit agent, theinstallation process loops continuously. This looping iscaused by a perceived 32/64 bit compatibility (AC)component not being installed correctly. The installprocess running at the endpoint must be manuallyterminated. The remote deployment can now be executedby installing the AC component either locally orremotely. The agent can now be successfully deployed byrunning the addSystem command. If the agent installationis done locally, a pop-up menu is displayed indicatingthe 32/64 compatability component must be installed.
Agent troubleshootingA problem can occur with the agent after it has been installed.
Table 7 contains problems and solutions that can occur with the agent after it has been installed.
Table 7. Agent problems and solutions
Problem Solution
Log data accumulates too rapidly. Check the RAS trace option settings, which are describedin “Setting RAS trace parameters by using the GUI” onpage 78. The trace option settings that you can set on theKBB_RAS1= and KDC_DEBUG= lines potentially generate largeamounts of data.
When using the itmcmd agent commands to start or stopthis monitoring agent, you receive the following errormessage:
MKCIIN0201E Specified product is not configured.
Include the command option -o to specify the instance tostart or stop. The instance name must match the nameused for configuring the agent. For example:
./itmcmd agent -o Test1 start nu
For more information about using the itmcmdcommands, see the IBM Tivoli Monitoring CommandReference.
Chapter 8. Troubleshooting 87
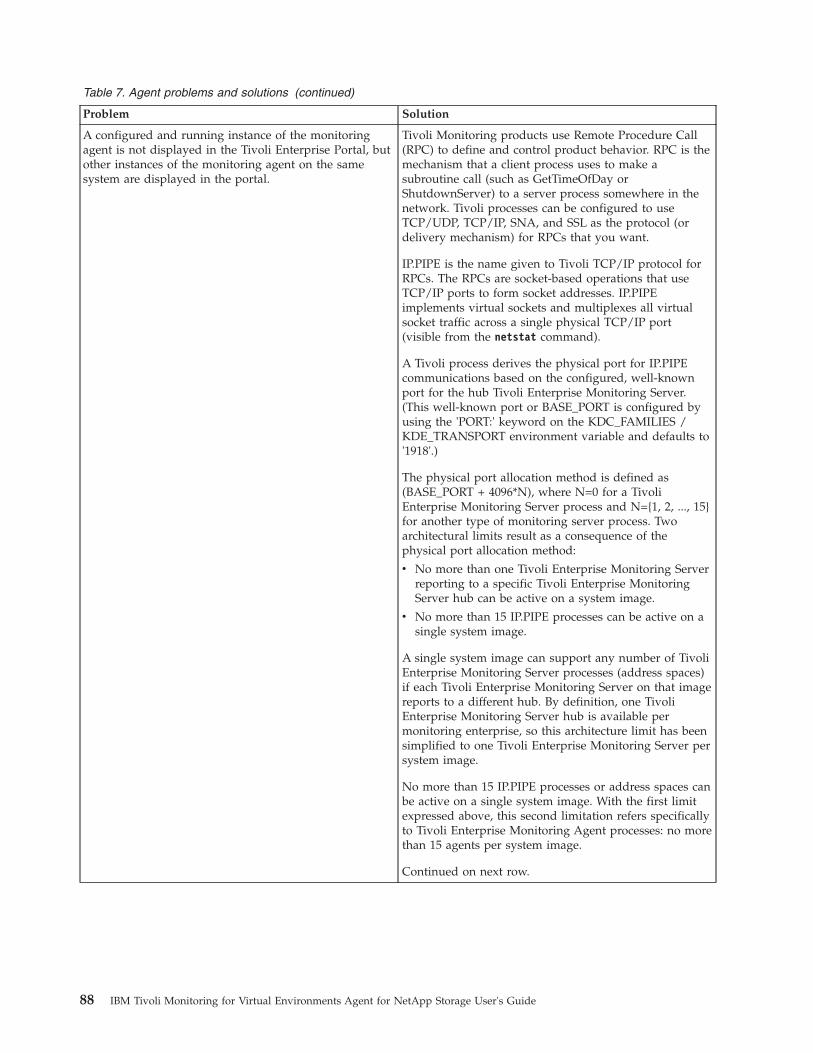
Table 7. Agent problems and solutions (continued)
Problem Solution
A configured and running instance of the monitoringagent is not displayed in the Tivoli Enterprise Portal, butother instances of the monitoring agent on the samesystem are displayed in the portal.
Tivoli Monitoring products use Remote Procedure Call(RPC) to define and control product behavior. RPC is themechanism that a client process uses to make asubroutine call (such as GetTimeOfDay orShutdownServer) to a server process somewhere in thenetwork. Tivoli processes can be configured to useTCP/UDP, TCP/IP, SNA, and SSL as the protocol (ordelivery mechanism) for RPCs that you want.
IP.PIPE is the name given to Tivoli TCP/IP protocol forRPCs. The RPCs are socket-based operations that useTCP/IP ports to form socket addresses. IP.PIPEimplements virtual sockets and multiplexes all virtualsocket traffic across a single physical TCP/IP port(visible from the netstat command).
A Tivoli process derives the physical port for IP.PIPEcommunications based on the configured, well-knownport for the hub Tivoli Enterprise Monitoring Server.(This well-known port or BASE_PORT is configured byusing the 'PORT:' keyword on the KDC_FAMILIES /KDE_TRANSPORT environment variable and defaults to'1918'.)
The physical port allocation method is defined as(BASE_PORT + 4096*N), where N=0 for a TivoliEnterprise Monitoring Server process and N={1, 2, ..., 15}for another type of monitoring server process. Twoarchitectural limits result as a consequence of thephysical port allocation method:
v No more than one Tivoli Enterprise Monitoring Serverreporting to a specific Tivoli Enterprise MonitoringServer hub can be active on a system image.
v No more than 15 IP.PIPE processes can be active on asingle system image.
A single system image can support any number of TivoliEnterprise Monitoring Server processes (address spaces)if each Tivoli Enterprise Monitoring Server on that imagereports to a different hub. By definition, one TivoliEnterprise Monitoring Server hub is available permonitoring enterprise, so this architecture limit has beensimplified to one Tivoli Enterprise Monitoring Server persystem image.
No more than 15 IP.PIPE processes or address spaces canbe active on a single system image. With the first limitexpressed above, this second limitation refers specificallyto Tivoli Enterprise Monitoring Agent processes: no morethan 15 agents per system image.
Continued on next row.
88 IBM Tivoli Monitoring for Virtual Environments Agent for NetApp Storage User's Guide
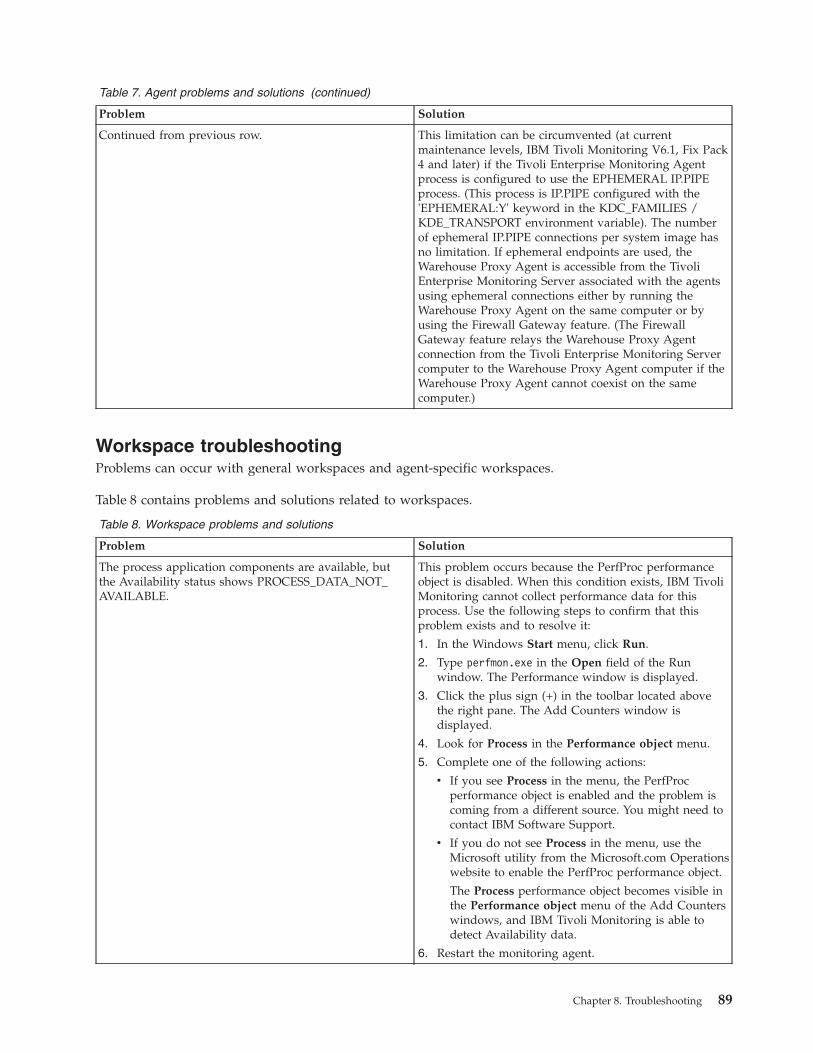
Table 7. Agent problems and solutions (continued)
Problem Solution
Continued from previous row. This limitation can be circumvented (at currentmaintenance levels, IBM Tivoli Monitoring V6.1, Fix Pack4 and later) if the Tivoli Enterprise Monitoring Agentprocess is configured to use the EPHEMERAL IP.PIPEprocess. (This process is IP.PIPE configured with the'EPHEMERAL:Y' keyword in the KDC_FAMILIES /KDE_TRANSPORT environment variable). The numberof ephemeral IP.PIPE connections per system image hasno limitation. If ephemeral endpoints are used, theWarehouse Proxy Agent is accessible from the TivoliEnterprise Monitoring Server associated with the agentsusing ephemeral connections either by running theWarehouse Proxy Agent on the same computer or byusing the Firewall Gateway feature. (The FirewallGateway feature relays the Warehouse Proxy Agentconnection from the Tivoli Enterprise Monitoring Servercomputer to the Warehouse Proxy Agent computer if theWarehouse Proxy Agent cannot coexist on the samecomputer.)
Workspace troubleshootingProblems can occur with general workspaces and agent-specific workspaces.
Table 8 contains problems and solutions related to workspaces.
Table 8. Workspace problems and solutions
Problem Solution
The process application components are available, butthe Availability status shows PROCESS_DATA_NOT_AVAILABLE.
This problem occurs because the PerfProc performanceobject is disabled. When this condition exists, IBM TivoliMonitoring cannot collect performance data for thisprocess. Use the following steps to confirm that thisproblem exists and to resolve it:
1. In the Windows Start menu, click Run.
2. Type perfmon.exe in the Open field of the Runwindow. The Performance window is displayed.
3. Click the plus sign (+) in the toolbar located abovethe right pane. The Add Counters window isdisplayed.
4. Look for Process in the Performance object menu.
5. Complete one of the following actions:
v If you see Process in the menu, the PerfProcperformance object is enabled and the problem iscoming from a different source. You might need tocontact IBM Software Support.
v If you do not see Process in the menu, use theMicrosoft utility from the Microsoft.com Operationswebsite to enable the PerfProc performance object.
The Process performance object becomes visible inthe Performance object menu of the Add Counterswindows, and IBM Tivoli Monitoring is able todetect Availability data.
6. Restart the monitoring agent.
Chapter 8. Troubleshooting 89
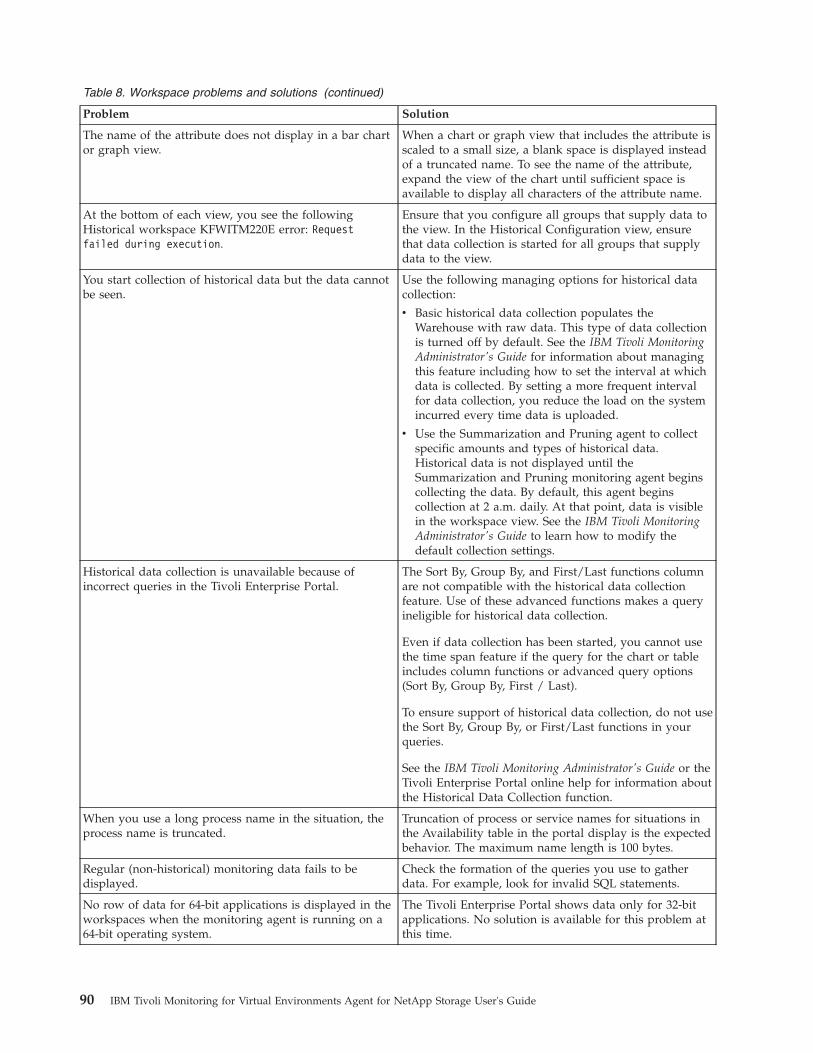
Table 8. Workspace problems and solutions (continued)
Problem Solution
The name of the attribute does not display in a bar chartor graph view.
When a chart or graph view that includes the attribute isscaled to a small size, a blank space is displayed insteadof a truncated name. To see the name of the attribute,expand the view of the chart until sufficient space isavailable to display all characters of the attribute name.
At the bottom of each view, you see the followingHistorical workspace KFWITM220E error: Requestfailed during execution.
Ensure that you configure all groups that supply data tothe view. In the Historical Configuration view, ensurethat data collection is started for all groups that supplydata to the view.
You start collection of historical data but the data cannotbe seen.
Use the following managing options for historical datacollection:
v Basic historical data collection populates theWarehouse with raw data. This type of data collectionis turned off by default. See the IBM Tivoli MonitoringAdministrator's Guide for information about managingthis feature including how to set the interval at whichdata is collected. By setting a more frequent intervalfor data collection, you reduce the load on the systemincurred every time data is uploaded.
v Use the Summarization and Pruning agent to collectspecific amounts and types of historical data.Historical data is not displayed until theSummarization and Pruning monitoring agent beginscollecting the data. By default, this agent beginscollection at 2 a.m. daily. At that point, data is visiblein the workspace view. See the IBM Tivoli MonitoringAdministrator's Guide to learn how to modify thedefault collection settings.
Historical data collection is unavailable because ofincorrect queries in the Tivoli Enterprise Portal.
The Sort By, Group By, and First/Last functions columnare not compatible with the historical data collectionfeature. Use of these advanced functions makes a queryineligible for historical data collection.
Even if data collection has been started, you cannot usethe time span feature if the query for the chart or tableincludes column functions or advanced query options(Sort By, Group By, First / Last).
To ensure support of historical data collection, do not usethe Sort By, Group By, or First/Last functions in yourqueries.
See the IBM Tivoli Monitoring Administrator's Guide or theTivoli Enterprise Portal online help for information aboutthe Historical Data Collection function.
When you use a long process name in the situation, theprocess name is truncated.
Truncation of process or service names for situations inthe Availability table in the portal display is the expectedbehavior. The maximum name length is 100 bytes.
Regular (non-historical) monitoring data fails to bedisplayed.
Check the formation of the queries you use to gatherdata. For example, look for invalid SQL statements.
No row of data for 64-bit applications is displayed in theworkspaces when the monitoring agent is running on a64-bit operating system.
The Tivoli Enterprise Portal shows data only for 32-bitapplications. No solution is available for this problem atthis time.
90 IBM Tivoli Monitoring for Virtual Environments Agent for NetApp Storage User's Guide
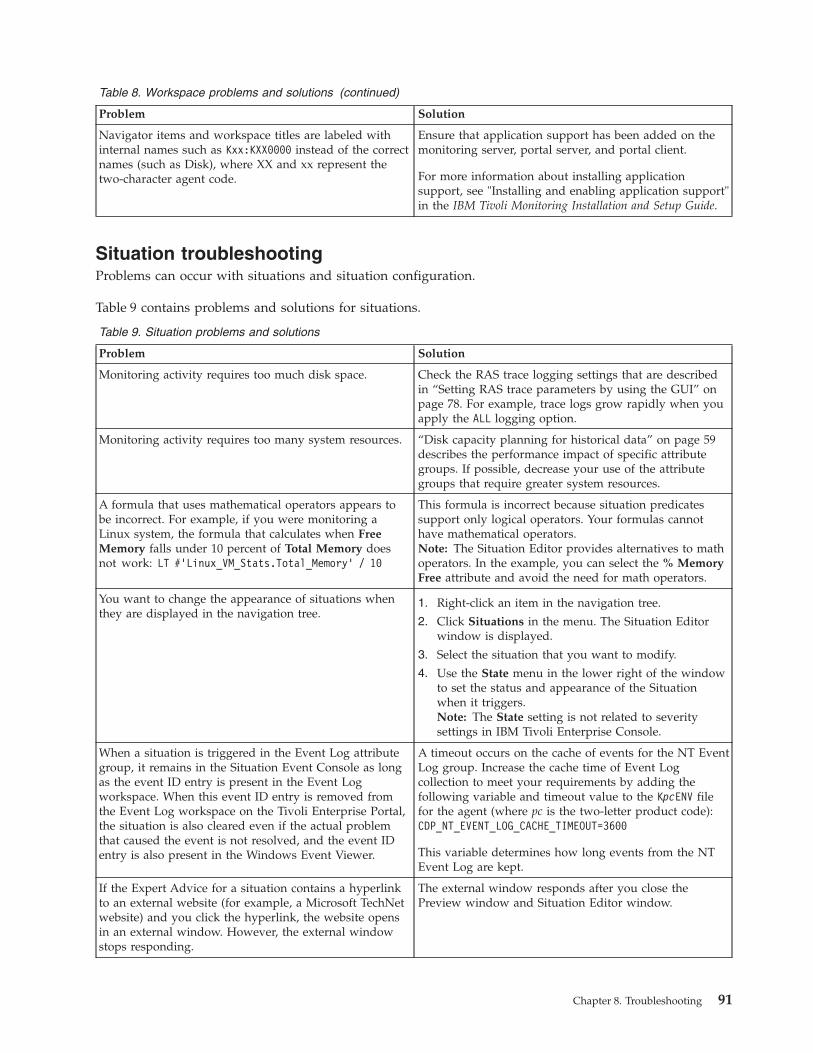
Table 8. Workspace problems and solutions (continued)
Problem Solution
Navigator items and workspace titles are labeled withinternal names such as Kxx:KXX0000 instead of the correctnames (such as Disk), where XX and xx represent thetwo-character agent code.
Ensure that application support has been added on themonitoring server, portal server, and portal client.
For more information about installing applicationsupport, see "Installing and enabling application support"in the IBM Tivoli Monitoring Installation and Setup Guide.
Situation troubleshootingProblems can occur with situations and situation configuration.
Table 9 contains problems and solutions for situations.
Table 9. Situation problems and solutions
Problem Solution
Monitoring activity requires too much disk space. Check the RAS trace logging settings that are describedin “Setting RAS trace parameters by using the GUI” onpage 78. For example, trace logs grow rapidly when youapply the ALL logging option.
Monitoring activity requires too many system resources. “Disk capacity planning for historical data” on page 59describes the performance impact of specific attributegroups. If possible, decrease your use of the attributegroups that require greater system resources.
A formula that uses mathematical operators appears tobe incorrect. For example, if you were monitoring aLinux system, the formula that calculates when FreeMemory falls under 10 percent of Total Memory doesnot work: LT #’Linux_VM_Stats.Total_Memory’ / 10
This formula is incorrect because situation predicatessupport only logical operators. Your formulas cannothave mathematical operators.Note: The Situation Editor provides alternatives to mathoperators. In the example, you can select the % MemoryFree attribute and avoid the need for math operators.
You want to change the appearance of situations whenthey are displayed in the navigation tree.
1. Right-click an item in the navigation tree.
2. Click Situations in the menu. The Situation Editorwindow is displayed.
3. Select the situation that you want to modify.
4. Use the State menu in the lower right of the windowto set the status and appearance of the Situationwhen it triggers.Note: The State setting is not related to severitysettings in IBM Tivoli Enterprise Console.
When a situation is triggered in the Event Log attributegroup, it remains in the Situation Event Console as longas the event ID entry is present in the Event Logworkspace. When this event ID entry is removed fromthe Event Log workspace on the Tivoli Enterprise Portal,the situation is also cleared even if the actual problemthat caused the event is not resolved, and the event IDentry is also present in the Windows Event Viewer.
A timeout occurs on the cache of events for the NT EventLog group. Increase the cache time of Event Logcollection to meet your requirements by adding thefollowing variable and timeout value to the KpcENV filefor the agent (where pc is the two-letter product code):CDP_NT_EVENT_LOG_CACHE_TIMEOUT=3600
This variable determines how long events from the NTEvent Log are kept.
If the Expert Advice for a situation contains a hyperlinkto an external website (for example, a Microsoft TechNetwebsite) and you click the hyperlink, the website opensin an external window. However, the external windowstops responding.
The external window responds after you close thePreview window and Situation Editor window.
Chapter 8. Troubleshooting 91
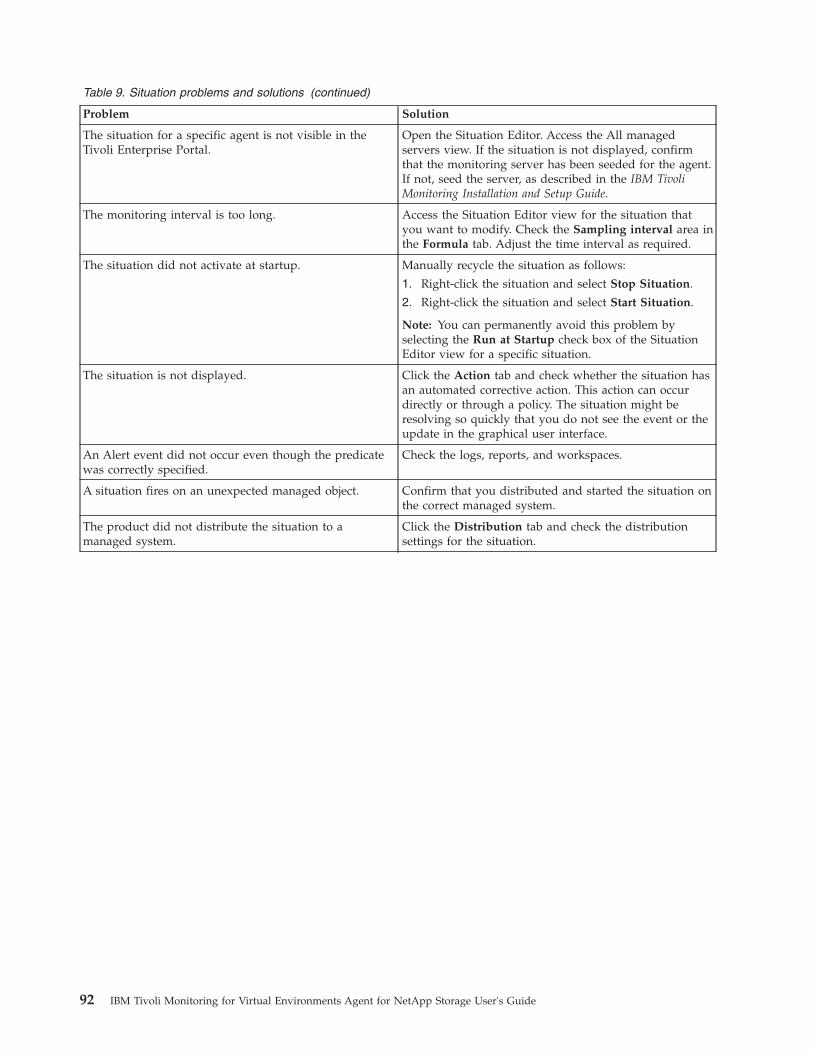
Table 9. Situation problems and solutions (continued)
Problem Solution
The situation for a specific agent is not visible in theTivoli Enterprise Portal.
Open the Situation Editor. Access the All managedservers view. If the situation is not displayed, confirmthat the monitoring server has been seeded for the agent.If not, seed the server, as described in the IBM TivoliMonitoring Installation and Setup Guide.
The monitoring interval is too long. Access the Situation Editor view for the situation thatyou want to modify. Check the Sampling interval area inthe Formula tab. Adjust the time interval as required.
The situation did not activate at startup. Manually recycle the situation as follows:
1. Right-click the situation and select Stop Situation.
2. Right-click the situation and select Start Situation.
Note: You can permanently avoid this problem byselecting the Run at Startup check box of the SituationEditor view for a specific situation.
The situation is not displayed. Click the Action tab and check whether the situation hasan automated corrective action. This action can occurdirectly or through a policy. The situation might beresolving so quickly that you do not see the event or theupdate in the graphical user interface.
An Alert event did not occur even though the predicatewas correctly specified.
Check the logs, reports, and workspaces.
A situation fires on an unexpected managed object. Confirm that you distributed and started the situation onthe correct managed system.
The product did not distribute the situation to amanaged system.
Click the Distribution tab and check the distributionsettings for the situation.
92 IBM Tivoli Monitoring for Virtual Environments Agent for NetApp Storage User's Guide
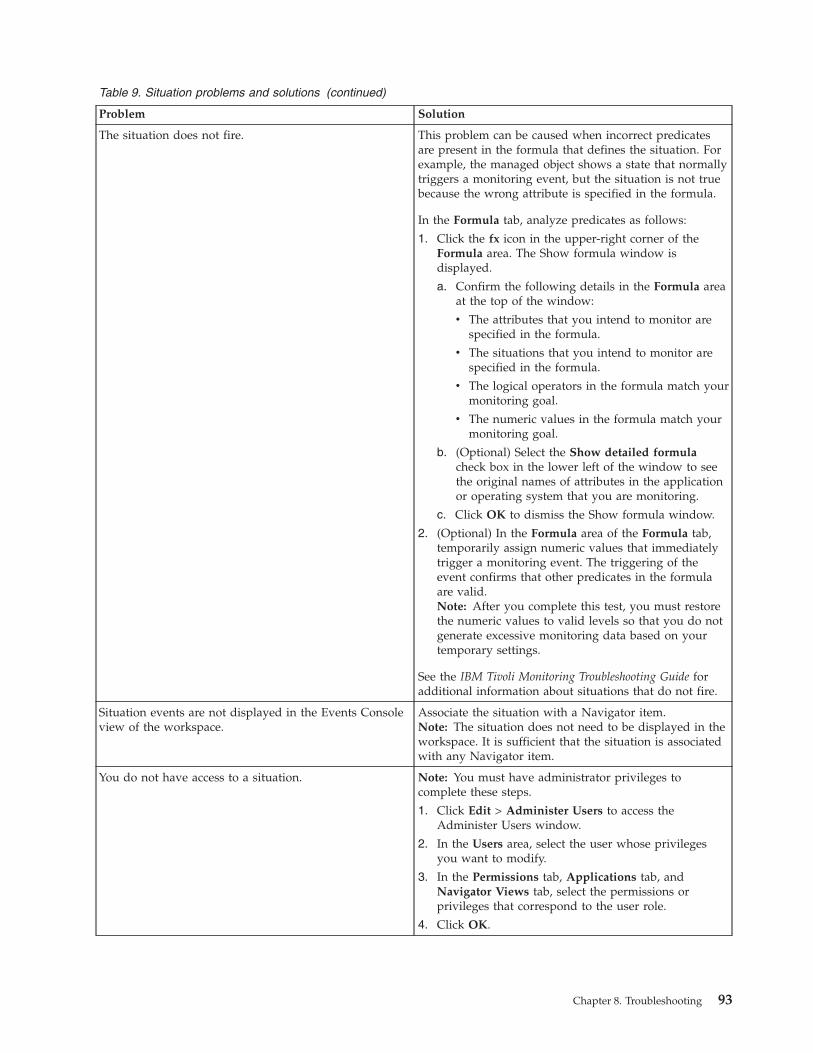
Table 9. Situation problems and solutions (continued)
Problem Solution
The situation does not fire. This problem can be caused when incorrect predicatesare present in the formula that defines the situation. Forexample, the managed object shows a state that normallytriggers a monitoring event, but the situation is not truebecause the wrong attribute is specified in the formula.
In the Formula tab, analyze predicates as follows:
1. Click the fx icon in the upper-right corner of theFormula area. The Show formula window isdisplayed.
a. Confirm the following details in the Formula areaat the top of the window:
v The attributes that you intend to monitor arespecified in the formula.
v The situations that you intend to monitor arespecified in the formula.
v The logical operators in the formula match yourmonitoring goal.
v The numeric values in the formula match yourmonitoring goal.
b. (Optional) Select the Show detailed formulacheck box in the lower left of the window to seethe original names of attributes in the applicationor operating system that you are monitoring.
c. Click OK to dismiss the Show formula window.
2. (Optional) In the Formula area of the Formula tab,temporarily assign numeric values that immediatelytrigger a monitoring event. The triggering of theevent confirms that other predicates in the formulaare valid.Note: After you complete this test, you must restorethe numeric values to valid levels so that you do notgenerate excessive monitoring data based on yourtemporary settings.
See the IBM Tivoli Monitoring Troubleshooting Guide foradditional information about situations that do not fire.
Situation events are not displayed in the Events Consoleview of the workspace.
Associate the situation with a Navigator item.Note: The situation does not need to be displayed in theworkspace. It is sufficient that the situation is associatedwith any Navigator item.
You do not have access to a situation. Note: You must have administrator privileges tocomplete these steps.
1. Click Edit > Administer Users to access theAdminister Users window.
2. In the Users area, select the user whose privilegesyou want to modify.
3. In the Permissions tab, Applications tab, andNavigator Views tab, select the permissions orprivileges that correspond to the user role.
4. Click OK.
Chapter 8. Troubleshooting 93
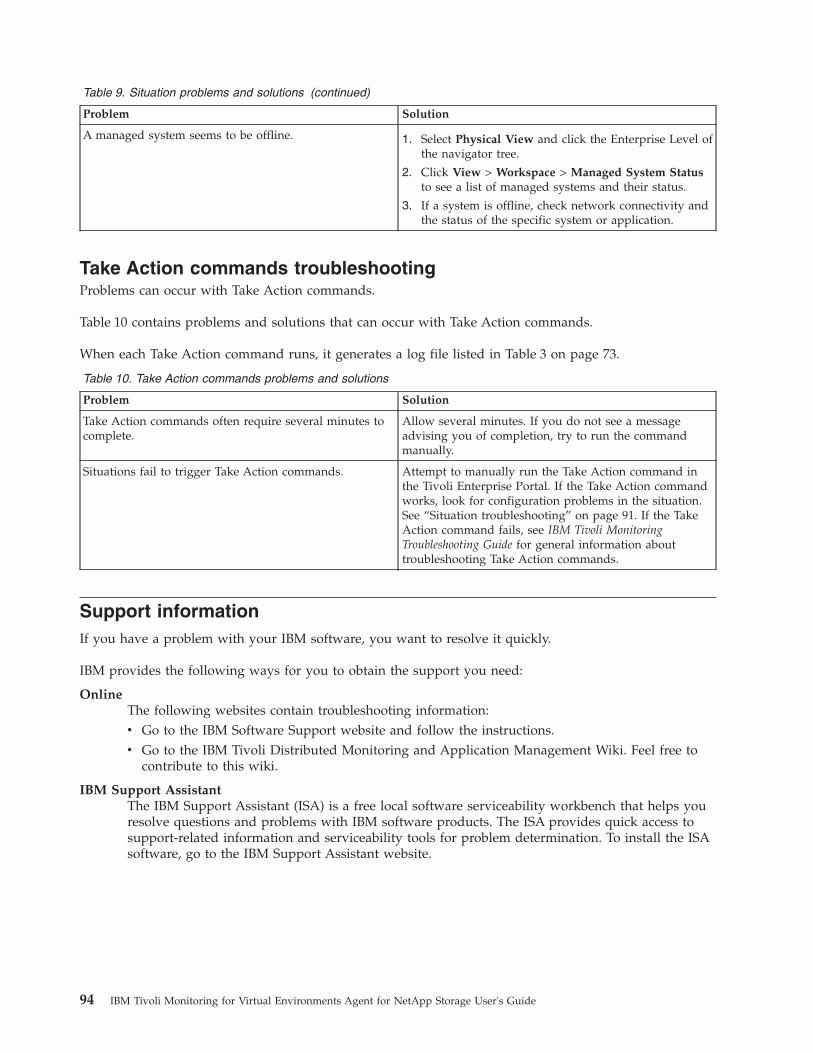
Table 9. Situation problems and solutions (continued)
Problem Solution
A managed system seems to be offline. 1. Select Physical View and click the Enterprise Level ofthe navigator tree.
2. Click View > Workspace > Managed System Statusto see a list of managed systems and their status.
3. If a system is offline, check network connectivity andthe status of the specific system or application.
Take Action commands troubleshootingProblems can occur with Take Action commands.
Table 10 contains problems and solutions that can occur with Take Action commands.
When each Take Action command runs, it generates a log file listed in Table 3 on page 73.
Table 10. Take Action commands problems and solutions
Problem Solution
Take Action commands often require several minutes tocomplete.
Allow several minutes. If you do not see a messageadvising you of completion, try to run the commandmanually.
Situations fail to trigger Take Action commands. Attempt to manually run the Take Action command inthe Tivoli Enterprise Portal. If the Take Action commandworks, look for configuration problems in the situation.See “Situation troubleshooting” on page 91. If the TakeAction command fails, see IBM Tivoli MonitoringTroubleshooting Guide for general information abouttroubleshooting Take Action commands.
Support informationIf you have a problem with your IBM software, you want to resolve it quickly.
IBM provides the following ways for you to obtain the support you need:
OnlineThe following websites contain troubleshooting information:v Go to the IBM Software Support website and follow the instructions.v Go to the IBM Tivoli Distributed Monitoring and Application Management Wiki. Feel free to
contribute to this wiki.
IBM Support AssistantThe IBM Support Assistant (ISA) is a free local software serviceability workbench that helps youresolve questions and problems with IBM software products. The ISA provides quick access tosupport-related information and serviceability tools for problem determination. To install the ISAsoftware, go to the IBM Support Assistant website.
94 IBM Tivoli Monitoring for Virtual Environments Agent for NetApp Storage User's Guide
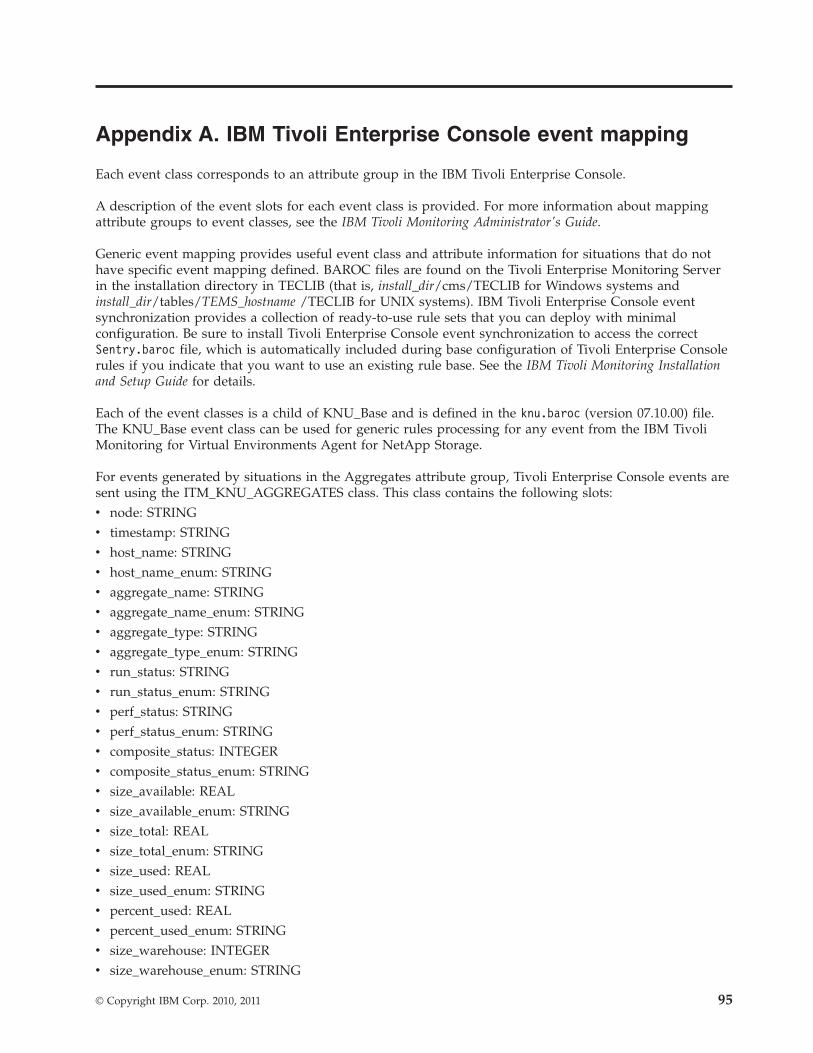
Appendix A. IBM Tivoli Enterprise Console event mapping
Each event class corresponds to an attribute group in the IBM Tivoli Enterprise Console.
A description of the event slots for each event class is provided. For more information about mappingattribute groups to event classes, see the IBM Tivoli Monitoring Administrator's Guide.
Generic event mapping provides useful event class and attribute information for situations that do nothave specific event mapping defined. BAROC files are found on the Tivoli Enterprise Monitoring Serverin the installation directory in TECLIB (that is, install_dir/cms/TECLIB for Windows systems andinstall_dir/tables/TEMS_hostname /TECLIB for UNIX systems). IBM Tivoli Enterprise Console eventsynchronization provides a collection of ready-to-use rule sets that you can deploy with minimalconfiguration. Be sure to install Tivoli Enterprise Console event synchronization to access the correctSentry.baroc file, which is automatically included during base configuration of Tivoli Enterprise Consolerules if you indicate that you want to use an existing rule base. See the IBM Tivoli Monitoring Installationand Setup Guide for details.
Each of the event classes is a child of KNU_Base and is defined in the knu.baroc (version 07.10.00) file.The KNU_Base event class can be used for generic rules processing for any event from the IBM TivoliMonitoring for Virtual Environments Agent for NetApp Storage.
For events generated by situations in the Aggregates attribute group, Tivoli Enterprise Console events aresent using the ITM_KNU_AGGREGATES class. This class contains the following slots:v node: STRINGv timestamp: STRINGv host_name: STRINGv host_name_enum: STRINGv aggregate_name: STRINGv aggregate_name_enum: STRINGv aggregate_type: STRINGv aggregate_type_enum: STRINGv run_status: STRINGv run_status_enum: STRINGv perf_status: STRINGv perf_status_enum: STRINGv composite_status: INTEGERv composite_status_enum: STRINGv size_available: REALv size_available_enum: STRINGv size_total: REALv size_total_enum: STRINGv size_used: REALv size_used_enum: STRINGv percent_used: REALv percent_used_enum: STRINGv size_warehouse: INTEGERv size_warehouse_enum: STRING
© Copyright IBM Corp. 2010, 2011 95
v total_space_committed: REALv total_space_committed_enum: STRINGv committed_warehouse: INTEGERv committed_warehouse_enum: STRINGv total_transfers: REALv total_transfers_enum: STRINGv user_reads: REALv user_reads_enum: STRINGv user_writes: REALv user_writes_enum: STRINGv cp_reads: REALv cp_reads_enum: STRINGv file_rate: REALv file_rate_enum: STRINGv user_read_blocks: REALv user_read_blocks_enum: STRINGv user_write_blocks: REALv user_write_blocks_enum: STRINGv cp_read_blocks: REALv cp_read_blocks_enum: STRINGv block_rate: REALv block_rate_enum: STRINGv perf_warehouse: INTEGERv perf_warehouse_enum: STRING
For events generated by situations in the Host Network Interfaces attribute group, Tivoli EnterpriseConsole events are sent using the ITM_KNU_HOST_NETWORK_INTERFACES class. This class containsthe following slots:v node: STRINGv timestamp: STRINGv host_name: STRINGv host_name_enum: STRINGv interface_name: STRINGv interface_name_enum: STRINGv administrative_status: STRINGv administrative_status_enum: STRINGv operational_status: STRINGv operational_status_enum: STRINGv physical_address: STRINGv physical_address_enum: STRINGv ip_address: STRINGv ip_address_enum: STRINGv number_ip_addresses: INTEGERv number_ip_addresses_enum: STRINGv link_speed: INTEGERv link_speed_enum: STRING
96 IBM Tivoli Monitoring for Virtual Environments Agent for NetApp Storage User's Guide
v received_kb_per_sec: REALv received_kb_per_sec_enum: STRINGv transmitted_kb_per_sec: REALv transmitted_kb_per_sec_enum: STRINGv packets_received_per_sec: REALv packets_received_per_sec_enum: STRINGv packets_transmitted_per_sec: REALv packets_transmitted_per_sec_enum: STRINGv multicast_received_per_sec: REALv multicast_received_per_sec_enum: STRINGv multicast_transmitted_per_sec: REALv multicast_transmitted_per_sec_enum: STRINGv errors_received_per_sec: REALv errors_received_per_sec_enum: STRINGv errors_transmitted_per_sec: REALv errors_transmitted_per_sec_enum: STRINGv perf_warehouse: INTEGERv perf_warehouse_enum: STRING
For events generated by situations in the Hosts attribute group, Tivoli Enterprise Console events are sentusing the ITM_KNU_HOSTS class. This class contains the following slots:v node: STRINGv timestamp: STRINGv host_name: STRINGv host_name_enum: STRINGv host_type: STRINGv host_type_enum: STRINGv ip_address: STRINGv ip_address_enum: STRINGv fqdn: STRINGv fqdn_enum: STRINGv description: STRINGv description_enum: STRINGv comm_status: STRINGv comm_status_enum: STRINGv host_status: STRINGv host_status_enum: STRINGv run_status: STRINGv run_status_enum: STRINGv perf_status: STRINGv perf_status_enum: STRINGv composite_status: INTEGERv composite_status_enum: STRINGv cpu_busy: REALv cpu_busy_enum: STRING
Appendix A. IBM Tivoli Enterprise Console event mapping 97
v cifs_ops: REALv cifs_ops_enum: STRINGv fcp_ops: REALv fcp_ops_enum: STRINGv iscsi_ops: REALv iscsi_ops_enum: STRINGv nfs_ops: REALv nfs_ops_enum: STRINGv total_ops: REALv total_ops_enum: STRINGv disk_data_read: INTEGERv disk_data_read_enum: STRINGv disk_data_written: INTEGERv disk_data_written_enum: STRINGv net_data_recv: INTEGERv net_data_recv_enum: STRINGv net_data_sent: INTEGERv net_data_sent_enum: STRINGv total_data_rate: INTEGERv total_data_rate_enum: STRINGv perf_warehouse: INTEGERv perf_warehouse_enum: STRING
For events generated by situations in the LUNs attribute group, Tivoli Enterprise Console events are sentusing the ITM_KNU_LUNS class. This class contains the following slots:v node: STRINGv timestamp: STRINGv host_name: STRINGv host_name_enum: STRINGv volume_name: STRINGv volume_name_enum: STRINGv lun_path: STRINGv lun_path_enum: STRINGv run_status: STRINGv run_status_enum: STRINGv perf_status: STRINGv perf_status_enum: STRINGv composite_status: REALv composite_status_enum: STRINGv lun_size: REALv lun_size_enum: STRINGv size_warehouse: INTEGERv size_warehouse_enum: STRINGv read_ops: REALv read_ops_enum: STRING
98 IBM Tivoli Monitoring for Virtual Environments Agent for NetApp Storage User's Guide
v write_ops: REALv write_ops_enum: STRINGv other_ops: REALv other_ops_enum: STRINGv total_ops: REALv total_ops_enum: STRINGv read_data: REALv read_data_enum: STRINGv write_data: REALv write_data_enum: STRINGv avg_latency: REALv avg_latency_enum: STRINGv perf_warehouse: INTEGERv perf_warehouse_enum: STRING
For events generated by situations in the Performance Object Status attribute group, Tivoli EnterpriseConsole events are sent using the ITM_KNU_PERFORMANCE_OBJECT_STATUS class. This classcontains the following slots:v node: STRINGv timestamp: STRINGv query_name: STRINGv object_name: STRINGv object_type: INTEGERv object_type_enum: STRINGv object_status: INTEGERv object_status_enum: STRINGv error_code: INTEGERv error_code_enum: STRING
For events generated by situations in the Volumes attribute group, Tivoli Enterprise Console events aresent using the ITM_KNU_VOLUMES class. This class contains the following slots:v node: STRINGv timestamp: STRINGv host_name: STRINGv host_name_enum: STRINGv aggregate_name: STRINGv aggregate_name_enum: STRINGv volume_name: STRINGv volume_name_enum: STRINGv volume_type: STRINGv volume_type_enum: STRINGv volume_state: STRINGv volume_state_enum: STRINGv run_status: STRINGv run_status_enum: STRINGv perf_status: STRING
Appendix A. IBM Tivoli Enterprise Console event mapping 99
v perf_status_enum: STRINGv composite_status: REALv composite_status_enum: STRINGv volume_size: REALv volume_size_enum: STRINGv size_warehouse: INTEGERv size_warehouse_enum: STRINGv maximum_size: REALv maximum_size_enum: STRINGv autosize_enabled: INTEGERv autosize_enabled_enum: STRINGv is_dedupe_enabled: INTEGERv is_dedupe_enabled_enum: STRINGv afs_avail: REALv afs_avail_enum: STRINGv afs_data: REALv afs_data_enum: STRINGv afs_total: REALv afs_total_enum: STRINGv afs_used: REALv afs_used_enum: STRINGv afs_percent_used: REALv afs_percent_used_enum: STRINGv afs_warehouse: INTEGERv afs_warehouse_enum: STRINGv overwrite_reserve_avail: REALv overwrite_reserve_avail_enum: STRINGv overwrite_reserve_total: REALv overwrite_reserve_total_enum: STRINGv overwrite_reserve_used: REALv overwrite_reserve_used_enum: STRINGv overwrite_reserve_percent_used: REALv overwrite_reserve_percent_used_enum: STRINGv overwrite_warehouse: INTEGERv overwrite_warehouse_enum: STRINGv snapshot_reserve_avail: REALv snapshot_reserve_avail_enum: STRINGv snapshot_reserve_total: REALv snapshot_reserve_total_enum: STRINGv snapshot_reserve_used: REALv snapshot_reserve_used_enum: STRINGv snapshot_reserve_percent_used: REALv snapshot_reserve_percent_used_enum: STRINGv max_percent_used: REALv max_percent_used_enum: STRING
100 IBM Tivoli Monitoring for Virtual Environments Agent for NetApp Storage User's Guide
v snapshot_warehouse: INTEGERv snapshot_warehouse_enum: STRINGv read_ops: REALv read_ops_enum: STRINGv read_data: REALv read_data_enum: STRINGv read_latency: REALv read_latency_enum: STRINGv write_ops: REALv write_ops_enum: STRINGv write_data: REALv write_data_enum: STRINGv write_latency: REALv write_latency_enum: STRINGv other_ops: REALv other_ops_enum: STRINGv other_latency: REALv other_latency_enum: STRINGv composite_data_rate: REALv composite_data_rate_enum: STRINGv composite_latency: REALv composite_latency_enum: STRINGv total_ops: REALv total_ops_enum: STRINGv perf_warehouse: INTEGERv perf_warehouse_enum: STRING
Appendix A. IBM Tivoli Enterprise Console event mapping 101

102 IBM Tivoli Monitoring for Virtual Environments Agent for NetApp Storage User's Guide
Appendix B. Documentation library
A variety of publications are relevant to the use of the IBM Tivoli Monitoring for Virtual EnvironmentsAgent for NetApp Storage.
The IBM Tivoli Monitoring, OMEGAMON XE, and Composite Application Manager products: DocumentationGuide, SC23-8816, contains information about accessing and using publications. You can find theDocumentation Guide in the following information centers:v IBM Tivoli Monitoring and OMEGAMON® XEv IBM Tivoli Composite Application Manager
To open the Documentation Guide in the information center, select Using the publications in theContents pane.
To find a list of new and changed publications, click What's new in the information center on theWelcome page of the IBM Tivoli Monitoring and OMEGAMON XE Information Center.
To find publications from the previous version of a product, click Previous versions under the name ofthe product in the Contents pane.
IBM Tivoli Monitoring for Virtual Environments Agent for NetApp Storage library
The documentation for this agent and other product components is located in the IBM Tivoli Monitoringfor Virtual Environments information center.
One document is specific to the NetApp Storage agent: IBM Tivoli Monitoring for Virtual EnvironmentsAgent for NetApp Storage User’s Guide. This publication provides agent-specific information forconfiguring, using, and troubleshooting the NetApp Storage agent.
The Prerequisites topic in the information center contains information about the prerequisites for eachcomponent.
Use the information in this guide with the Tivoli Enterprise Portal User's Guide to monitor NetAppresources.
Prerequisite publicationsTo use the information in this publication effectively, you must have some prerequisite knowledge.
See the following publications to gain the required prerequisite knowledge:v IBM Tivoli Monitoring Readme First
v Exploring IBM Tivoli Monitoring
v IBM Tivoli Monitoring Administrator's Guide
v IBM Tivoli Monitoring Agent Builder User's Guide
v IBM Tivoli Monitoring Command Reference
v Configuring IBM Tivoli Enterprise Monitoring Server on z/OS
v IBM Tivoli Monitoring Installation and Setup Guide
v IBM Tivoli Monitoring: Messages
v IBM Tivoli Monitoring, OMEGAMON XE, and Composite Application Manager products: DocumentationGuide
© Copyright IBM Corp. 2010, 2011 103
v IBM Tivoli Monitoring Troubleshooting Guide
v IBM Tivoli Monitoring Universal Agent User's Guide
v IBM Tivoli Universal Agent API and Command Programming Reference Guide
v IBM Tivoli Monitoring: Upgrading from Tivoli Distributed Monitoring
v IBM Tivoli Monitoring: Upgrading from V5.1.2
v IBM Tivoli Monitoring: i5/OS™ Agent User's Guide
v IBM Tivoli Monitoring: Linux OS Agent User's Guide
v IBM Tivoli Monitoring: UNIX OS Agent User's Guide
v IBM Tivoli Monitoring: UNIX Logs OS Agent User's
v IBM Tivoli Monitoring: Windows OS Agent User's Guide
v Tivoli Enterprise Portal User's Guide
Related publicationsThe publications in related information centers provide useful information.
See the following information centers, which you can find by accessing Tivoli Documentation Central:v IBM Tivoli Monitoringv IBM Tivoli Netcool/OMNIbusv IBM Tivoli Application Dependency Discovery Manager (TADDM)v IBM Tivoli Enterprise Console
Other sources of documentationYou can obtain additional technical documentation about monitoring products from other sources.
See the following sources of technical documentation about monitoring products:v IBM Integrated Service Management Library is an online catalog that contains integration
documentation as well as other downloadable product extensions.v IBM Redbook publications ( Redbooks® publications, Redpapers, and Redbooks technotes) provide
information about products from platform and solution perspectives.v Technotes, which are found through the IBM Software Support website, provide the latest information
about known product limitations and workarounds.v Tivoli wikis
Tivoli Wiki Central is the home for interactive wikis that offer best practices and scenarios for usingTivoli products. The wikis contain white papers contributed by IBM employees, and content created bycustomers and business partners.Two of these wikis are of particular relevance to IBM Tivoli Monitoring:– Tivoli Distributed Monitoring and Application Management Wiki provides information about IBM
Tivoli Monitoring and related distributed products, including IBM Tivoli Composite ApplicationManagement products.
– Tivoli System z® Monitoring and Application Management Wiki provides information about theOMEGAMON XE products, Tivoli NetView® for z/OS®, Tivoli Monitoring Agent for z/TPF, andother System z monitoring and application management products.
104 IBM Tivoli Monitoring for Virtual Environments Agent for NetApp Storage User's Guide
Accessibility
Accessibility features help users with physical disabilities, such as restricted mobility or limited vision, touse software products successfully.
The major accessibility features in this product enable users in the following ways:v Use assistive technologies, such as screen-reader software and digital speech synthesizer, to hear what
is displayed on the screen. Consult the product documentation of the assistive technology for detailson using those technologies with this product.
v Operate specific or equivalent features using only the keyboard.v Magnify what is displayed on the screen.
In addition, the product documentation was modified to include the following features to aidaccessibility:v All documentation is available in both HTML and convertible PDF formats to give the maximum
opportunity for users to apply screen-reader software.v All images in the documentation are provided with alternative text so that users with vision
impairments can understand the contents of the images.
Navigating the interface using the keyboard
Standard shortcut and accelerator keys are used by the product and are documented by the operatingsystem. See the documentation provided by your operating system for more information.
Magnifying what is displayed on the screen
You can enlarge information in the product windows using facilities provided by the operating systemson which the product is run. For example, in a Microsoft Windows environment, you can lower theresolution of the screen to enlarge the font sizes of the text on the screen. See the documentationprovided by your operating system for more information.
© Copyright IBM Corp. 2010, 2011 105

106 IBM Tivoli Monitoring for Virtual Environments Agent for NetApp Storage User's Guide
Notices
This information was developed for products and services offered in the U.S.A. IBM may not offer theproducts, services, or features discussed in this document in other countries. Consult your local IBMrepresentative for information on the products and services currently available in your area. Anyreference to an IBM product, program, or service is not intended to state or imply that only that IBMproduct, program, or service may be used. Any functionally equivalent product, program, or service thatdoes not infringe any IBM intellectual property right may be used instead. However, it is the user'sresponsibility to evaluate and verify the operation of any non-IBM product, program, or service.
IBM may have patents or pending patent applications covering subject matter described in thisdocument. The furnishing of this document does not give you any license to these patents. You can sendlicense inquiries, in writing, to:
IBM Director of LicensingIBM CorporationNorth Castle DriveArmonk, NY 10504-1785 U.S.A.
For license inquiries regarding double-byte (DBCS) information, contact the IBM Intellectual PropertyDepartment in your country or send inquiries, in writing, to:
Intellectual Property LicensingLegal and Intellectual Property LawIBM Japan Ltd.1623-14, Shimotsuruma, Yamato-shiKanagawa 242-8502 Japan
The following paragraph does not apply to the United Kingdom or any other country where suchprovisions are inconsistent with local law:
INTERNATIONAL BUSINESS MACHINES CORPORATION PROVIDES THIS PUBLICATION "AS IS"WITHOUT WARRANTY OF ANY KIND, EITHER EXPRESS OR IMPLIED, INCLUDING, BUT NOTLIMITED TO, THE IMPLIED WARRANTIES OF NON-INFRINGEMENT, MERCHANTABILITY ORFITNESS FOR A PARTICULAR PURPOSE.
Some states do not allow disclaimer of express or implied warranties in certain transactions, therefore,this statement might not apply to you.
This information could include technical inaccuracies or typographical errors. Changes are periodicallymade to the information herein; these changes will be incorporated in new editions of the publication.IBM may make improvements and/or changes in the product(s) and/or the program(s) described in thispublication at any time without notice.
Any references in this information to non-IBM Web sites are provided for convenience only and do not inany manner serve as an endorsement of those Web sites. The materials at those Web sites are not part ofthe materials for this IBM product and use of those Web sites is at your own risk.
IBM may use or distribute any of the information you supply in any way it believes appropriate withoutincurring any obligation to you.
© Copyright IBM Corp. 2010, 2011 107
Licensees of this program who wish to have information about it for the purpose of enabling: (i) theexchange of information between independently created programs and other programs (including thisone) and (ii) the mutual use of the information which has been exchanged, should contact:
IBM Corporation2Z4A/10111400 Burnet RoadAustin, TX 78758 U.S.A.
Such information may be available, subject to appropriate terms and conditions, including in some casespayment of a fee.
The licensed program described in this document and all licensed material available for it are providedby IBM under terms of the IBM Customer Agreement, IBM International Program License Agreement orany equivalent agreement between us.
Any performance data contained herein was determined in a controlled environment. Therefore, theresults obtained in other operating environments may vary significantly. Some measurements may havebeen made on development-level systems and there is no guarantee that these measurements will be thesame on generally available systems. Furthermore, some measurement may have been estimated throughextrapolation. Actual results may vary. Users of this document should verify the applicable data for theirspecific environment.
Information concerning non-IBM products was obtained from the suppliers of those products, theirpublished announcements or other publicly available sources. IBM has not tested those products andcannot confirm the accuracy of performance, compatibility or any other claims related to non-IBMproducts. Questions on the capabilities of non-IBM products should be addressed to the suppliers ofthose products.
All statements regarding IBM's future direction or intent are subject to change or withdrawal withoutnotice, and represent goals and objectives only.
All IBM prices shown are IBM's suggested retail prices, are current and are subject to change withoutnotice. Dealer prices may vary.
This information is for planning purposes only. The information herein is subject to change before theproducts described become available.
This information contains examples of data and reports used in daily business operations. To illustratethem as completely as possible, the examples include the names of individuals, companies, brands, andproducts. All of these names are fictitious and any similarity to the names and addresses used by anactual business enterprise is entirely coincidental.
COPYRIGHT LICENSE:
This information contains sample application programs in source language, which illustrate programmingtechniques on various operating platforms. You may copy, modify, and distribute these sample programsin any form without payment to IBM, for the purposes of developing, using, marketing or distributingapplication programs conforming to the application programming interface for the operating platform forwhich the sample programs are written. These examples have not been thoroughly tested under allconditions. IBM, therefore, cannot guarantee or imply reliability, serviceability, or function of theseprograms. You may copy, modify, and distribute these sample programs in any form without payment toIBM for the purposes of developing, using, marketing, or distributing application programs conformingto IBM‘s application programming interfaces.
108 IBM Tivoli Monitoring for Virtual Environments Agent for NetApp Storage User's Guide
Each copy or any portion of these sample programs or any derivative work, must include a copyrightnotice as follows:
© IBM 2009. Portions of this code are derived from IBM Corp. Sample Programs. © Copyright IBM Corp.2009. All rights reserved.
If you are viewing this information in softcopy form, the photographs and color illustrations might not bedisplayed.
TrademarksIBM, the IBM logo, and ibm.com® are trademarks or registered trademarks of International BusinessMachines Corp., registered in many jurisdictions worldwide. Other product and service names might betrademarks of IBM or other companies. A current list of IBM trademarks is available on the Web at"Copyright and trademark information" at www.ibm.com/legal/copytrade.shtml.
Intel, Intel logo, and Intel Xeon, are trademarks or registered trademarks of Intel Corporation or itssubsidiaries in the United States and other countries.
Java and all Java-based trademarks and logos are trademarks or registered trademarks of Oracle and/orits affiliates.
Linux is a registered trademark of Linus Torvalds in the United States, other countries, or both.
Microsoft and Windows are trademarks of Microsoft Corporation in the United States, other countries, orboth.
UNIX is a registered trademark of The Open Group in the United States and other countries.
Other company, product, or service names may be trademarks or service marks of others.
Notices 109

110 IBM Tivoli Monitoring for Virtual Environments Agent for NetApp Storage User's Guide
Index
Aaccessibility 105additional information
attributes 19situations 61Take Action commands 67Workspaces 13
Administrative Status attribute 28AFS Available attribute 51AFS Data attribute 51AFS Percent Used attribute 52AFS Total attribute 52AFS Used attribute 52AFS Warehouse attribute 52agent
functions 1problems and workarounds 87
Agent Management Services 3Aggregate Detail workspace 14Aggregate Name attribute 21, 47Aggregate Type attribute 21Aggregates
situations 62workspaces
descriptions 14Aggregates attribute group 20Aggregates workspace 15application support 8attribute group 20attribute groups
Aggregates 20Host Network Interfaces 27Hosts 32list of all 19LUNs 38overview 19Performance Object Status 43Volumes 47
attributes 20additional information 19Administrative Status 28AFS Available 51AFS Data 51AFS Percent Used 52AFS Total 52AFS Used 52AFS Warehouse 52Aggregate Name 21, 47Aggregate Type 21Aggregates 20Autosize Enabled 50Average Latency 43Block Rate 26CIFS Ops 35Committed Warehouse 24Communication Status 33Composite Data Rate 58Composite Latency 58Composite Status 22, 35, 40, 49CP Read Blocks 26CP Reads 25
attributes (continued)CPU Busy 35Description 33Disk Data Read 37Disk Data Written 37Error Code 45Errors Received Per Sec 31Errors Transmitted Per Sec 31FCP Ops 36File Rate 25FQDN 33Host Name 20, 27, 32, 39, 47Host Network Interfaces 27Host Status 34Host Type 32Hosts 32Interface Name 27IP Address 29, 33Is Dedupe Enabled 51iSCSI Ops 36Link Speed 29LUN Path 39LUN Size 41LUNs 38Max Percent Used 55Maximum Size 50Multicast Received Per Sec 30Multicast Transmitted Per Sec 31Net Data Received 37Net Data Sent 37NFS Ops 36Node 20, 27, 32, 38, 43, 47Number IP Addresses 29Object Name 44Object Status 45Object Type 44Operational Status 28Other Latency 57Other Ops 42, 57overview 19Overwrite Reserve Available 53Overwrite Reserve Percent Used 53Overwrite Reserve Total 53Overwrite Reserve Used 53Overwrite Warehouse 54Packets Received Per Sec 30Packets Transmitted Per Sec 30Percent Used 23Perf Status 22, 35, 40, 49Perf Warehouse 26, 31, 38, 58Performance Object Status 43Performance Warehouse 43Physical Address 28Query Name 44Read Data 42, 56Read Latency 56Read Ops 41, 56Received KB Per Sec 29Run Status 21, 34, 39, 49Size Available 22Size Total 23
© Copyright IBM Corp. 2010, 2011 111
attributes (continued)Size Used 23Size Warehouse 23, 41, 50Snapshot Reserve Available 54Snapshot Reserve Percent Used 55Snapshot Reserve Total 54Snapshot Reserve Used 54Snapshot Warehouse 55Timestamp 20, 27, 32, 39, 43, 47Total Data Rate 38Total Ops 36, 42, 58Total Space Committed 24Total Transfers 24Transmitted KB Per Sec 30User Read Blocks 25User Reads 24User Write Blocks 26User Writes 25Volume Name 39, 48Volume Size 50Volume State 48Volume Type 48Volumes 47Write Data 42, 57Write Latency 57Write Ops 41, 56
Autosize Enabled attribute 50Average Latency attribute 43
BBlock Rate attribute 26
Ccalculate historical data disk space 59capacity planning for historical data 59CIFS Ops attribute 35commands
tacmd addSystem 10Take Action 67
Committed Warehouse attribute 24Communication Status attribute 33components 2
IBM Tivoli Monitoring 2Composite Data Rate attribute 58Composite Latency attribute 58Composite Status attribute 22, 35, 40, 49configuration 8
agent 5fields 9problems and workarounds 83remote 10values 9
configuring the monitoring agent 5CP Read Blocks attribute 26CP Reads attribute 25CPU Busy attribute 35
DDescription attribute 33descriptions 62developerWorks website 104disk capacity planning for historical data 59Disk Data Read attribute 37
Disk Data Written attribute 37documentation
See publications
Eenhancements 2Error Code attribute 45Errors Received Per Sec attribute 31Errors Transmitted Per Sec attribute 31event
mapping 95
FFCP Ops attribute 36File Rate attribute 25files
manageontap.jar 9NetApp Manageability SDK JAR file 9
FQDN attribute 33
Hhistorical data
calculate disk space 59disk capacity planning 59
Host Detail workspace 15Host Name attribute 20, 27, 32, 39, 47Host Network Interfaces attribute group 27Host Status attribute 34Host Type attribute 32Hosts
situations 63workspaces
descriptions 15Hosts attribute group 32Hosts workspace 16
IIBM Tivoli Enterprise Console
event mapping 95IBM Tivoli Monitoring 2
overview 1installation 8
agent 5problems and workarounds 83remote 10
installing language packs 5installing the monitoring agent 5instances
number 8Integrated Service Management Library documentation 104interface
user 3Interface Name attribute 27IP Address attribute 29, 33Is Dedupe Enabled attribute 51iSCSI Ops attribute 36
KKNU_AggregateRunStatusAbnormal situation 62KNU_HostOffLine situation 64
112 IBM Tivoli Monitoring for Virtual Environments Agent for NetApp Storage User's Guide
KNU_HostRunStatusAbnormal situation 63KNU_LUNRunStatusAbnormal situation 64KNU_VolumeRunStatusAbnormal situation 65
Llanguage packs 5
installing 5silent installation 5
Link Speed attribute 29LUN Detail workspace 16LUN Path attribute 39LUN Size attribute 41LUNs
situations 64workspaces
descriptions 16LUNs attribute group 38LUNs workspace 16
Mmanageontap.jar 9Max Percent Used attribute 55Maximum Size attribute 50Multicast Received Per Sec attribute 30Multicast Transmitted Per Sec attribute 31
NNet Data Received attribute 37Net Data Sent attribute 37NetApp Manageability SDK JAR file 9NetApp Storage
situations 62workspaces
descriptions 14NetApp Storage agent
performance considerations 91NetApp Storage workspace 14new in this release 2NFS Ops attribute 36Node attribute 20, 27, 32, 38, 43, 47Number IP Addresses attribute 29number of instances 8
OObject Name attribute 44Object Status attribute 45Object Type attribute 44Operational Status attribute 28Other Latency attribute 57Other Ops attribute 42, 57overview
IBM Tivoli Monitoring 1Overwrite Reserve Available attribute 53Overwrite Reserve Percent Used attribute 53Overwrite Reserve Total attribute 53Overwrite Reserve Used attribute 53Overwrite Warehouse attribute 54
PPackets Received Per Sec attribute 30Packets Transmitted Per Sec attribute 30Percent Used attribute 23Perf Status attribute 22, 35, 40, 49Perf Warehouse attribute 26, 31, 38, 58performance considerations 91Performance Object Status attribute group 43Performance Warehouse attribute 43Physical Address attribute 28policies 69prerequisite publications 103problems and workarounds 83
agent-specific 87agent-specific workspaces 89configuration 83install 83remote deployment 86situations 91Take Action commands 94workspaces 89
publications 103, 104developerWorks website 104IBM Tivoli Monitoring 103Integrated Service Management Library 104prerequisite 103Redbooks 104related 104Technotes 104wikis 104
Qqueries, using attributes 19Query Name attribute 44
Rras1 80Read Data attribute 42, 56Read Latency attribute 56Read Ops attribute 41, 56Received KB Per Sec attribute 29Redbooks 104remote
installation and configuration 10remote deployment
problems and workarounds 86response file template 5Run Status attribute 21, 34, 39, 49
Ssilent installation 5silent installation of language packs 5situations 62
additional informationpredefined, defined 61
KNU_AggregateRunStatusAbnormal 62KNU_HostOffLine 64KNU_HostRunStatusAbnormal 63KNU_LUNRunStatusAbnormal 64KNU_VolumeRunStatusAbnormal 65overview 61predefined 61
Index 113
situations (continued)problems and workarounds 91Situation Editor 61
situations, using attributes 19Size Available attribute 22Size Total attribute 23Size Used attribute 23Size Warehouse attribute 23, 41, 50Snapshot Reserve Available attribute 54Snapshot Reserve Percent Used attribute 55Snapshot Reserve Total attribute 54Snapshot Reserve Used attribute 54Snapshot Warehouse attribute 55
Ttacmd addSystem command 10Take Action commands
additional information 67overview 67predefined 67problems and workarounds 94
Technotes 104Timestamp attribute 20, 27, 32, 39, 43, 47Total Data Rate attribute 38Total Ops attribute 36, 42, 58Total Space Committed attribute 24Total Transfers attribute 24trace
turn off 82turn on 82
trace settings 80Transmitted KB Per Sec attribute 30troubleshooting 71
agent-specific 87agent-specific workspaces 89installation 83problems and workarounds 83remote deployment 86situations 91Take Action commands 94turn off trace 82turn on trace 82uninstallation 83workspaces 89
Uuser ID 8user interface options 3User Read Blocks attribute 25User Reads attribute 24User Write Blocks attribute 26User Writes attribute 25
Vviews
Aggregate Detail workspace 14Aggregates workspace 15Host Detail workspace 15Hosts workspace 16LUN Detail workspace 16LUNs workspace 16NetApp Storage workspace 14Volume Detail workspace 17
views (continued)Volumes workspace 17
Volume Detail workspace 17Volume Name attribute 39, 48Volume Size attribute 50Volume State attribute 48Volume Type attribute 48Volumes
situations 65workspaces
descriptions 17Volumes attribute group 47Volumes workspace 17
Wwikis 104workarounds 83workspaces
Aggregate Detail 14Aggregates 14, 15descriptions 14Host Detail 15Hosts 15, 16LUN Detail 16LUNs 16NetApp Storage 14predefined 13problems and workarounds 89Volume Detail 17Volumes 17
Workspacesadditional information 13overview 13
Write Data attribute 42, 57Write Latency attribute 57Write Ops attribute 41, 56
114 IBM Tivoli Monitoring for Virtual Environments Agent for NetApp Storage User's Guide


����
Printed in USA
SC14-7489-00