netapp internal use only efficient data center design & virtualization netapp shanmugam ramu...
TRANSCRIPT

NetApp Internal Use Only
Efficient Data Center Design & VirtualizationNetApp
Shanmugam Ramu & John Cherian

2© 2008 NetApp. All rights reserved.
Today’s Data Center Challenges
Reliability Uptime Scalability Efficiency / Cost Corporate Social Responsibility
So what’s the right Power / Cooling Design?

3© 2008 NetApp. All rights reserved.
Data Center Infrastructure Efficiency
U.S. Environmental Protection Agency Report to Congress, August 2, 2007– The report assessed current trends in Data Center energy use and energy costs
and outlined opportunities for improved energy efficiency.
Infrastructure Systems accounts for more than 80% of the Data Center power consumption
Chillers / HVAC / CRAC units Other Equipment Cooling (UPS, Battery, Control / Monitoring rooms) De-Humidifiers Lighting, Access Control & Security Systems UPS / Isolation Transformer losses
The metric cited by the EPA report for Data Center Infrastructure Efficiency is the Power Usage Effectiveness (PUE) ratio
http://www.energystar.gov/ia/partners/prod_development/downloads/EPA_Datacenter_Report_Congress_Final1.pdf

4© 2008 NetApp. All rights reserved.
What’s PUE Ratio?
EPA (U.S.Environmental protection Agency) has set standards for effective usage of power for mission critical Data Centers
5© 2008 NetApp. All rights reserved.
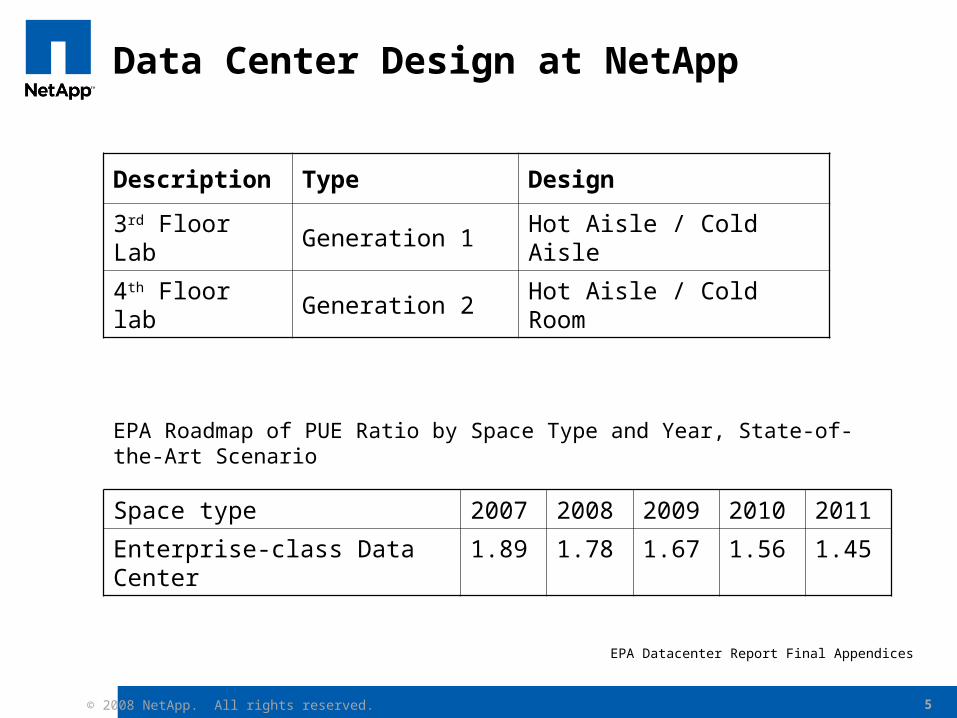
Data Center Design at NetApp
EPA Roadmap of PUE Ratio by Space Type and Year, State-of-the-Art Scenario
EPA Datacenter Report Final Appendices
Space type 2007 2008 2009 2010 2011
Enterprise-class Data Center 1.89 1.78 1.67 1.56 1.45
Description Type Design
3rd Floor Lab Generation 1 Hot Aisle / Cold Aisle
4th Floor lab Generation 2 Hot Aisle / Cold Room

6© 2008 NetApp. All rights reserved.
3rd Floor Data Center
4 kW / rack power capacity for 192 racks PUE ratio = 1.70 Variable Frequency Drive Control used to reduce Power Consumption Cold aisle damper controlled trough Manual valves. Positives
– Common air-handling header = N+1 redundancy– VFD helps to reduce fan horsepower
Negatives– Venturi effect draws hot air into cold row– Manual Valve Control to control the temperature
NetApp Data Center at RTP, North Carolina
Infrared Imagery of datacenter without cold aisle concept
7© 2008 NetApp. All rights reserved.
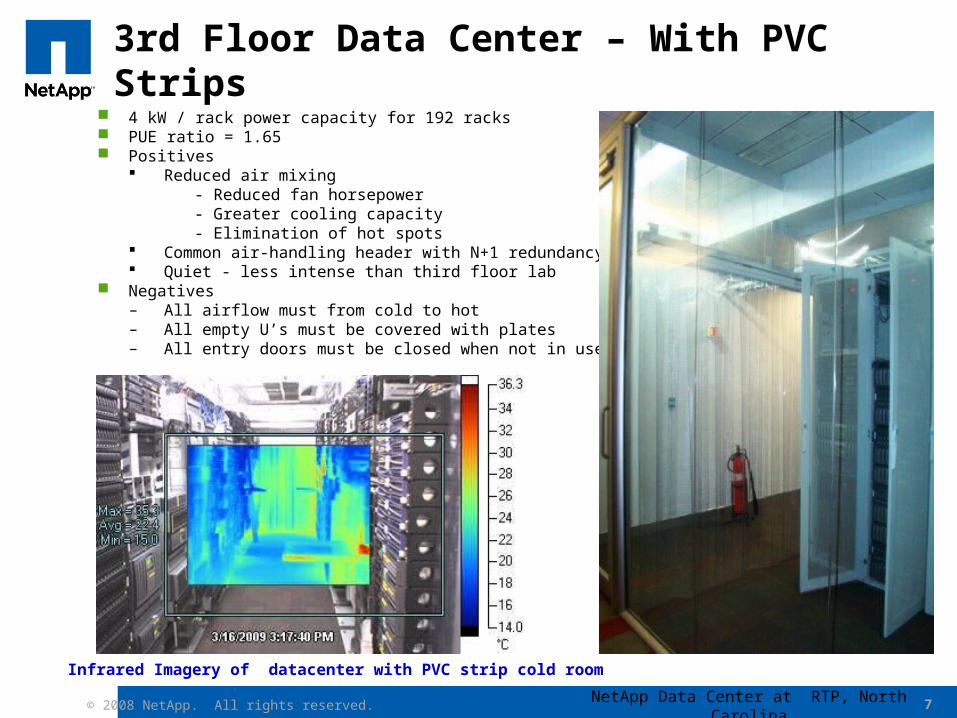
3rd Floor Data Center – With PVC Strips 4 kW / rack power capacity for 192 racks PUE ratio = 1.65 Positives
Reduced air mixing- Reduced fan horsepower- Greater cooling capacity- Elimination of hot spots
Common air-handling header with N+1 redundancy Quiet - less intense than third floor lab
Negatives– All airflow must from cold to hot– All empty U’s must be covered with plates– All entry doors must be closed when not in use
NetApp Data Center at RTP, North Carolina
Infrared Imagery of datacenter with PVC strip cold room
8© 2008 NetApp. All rights reserved.
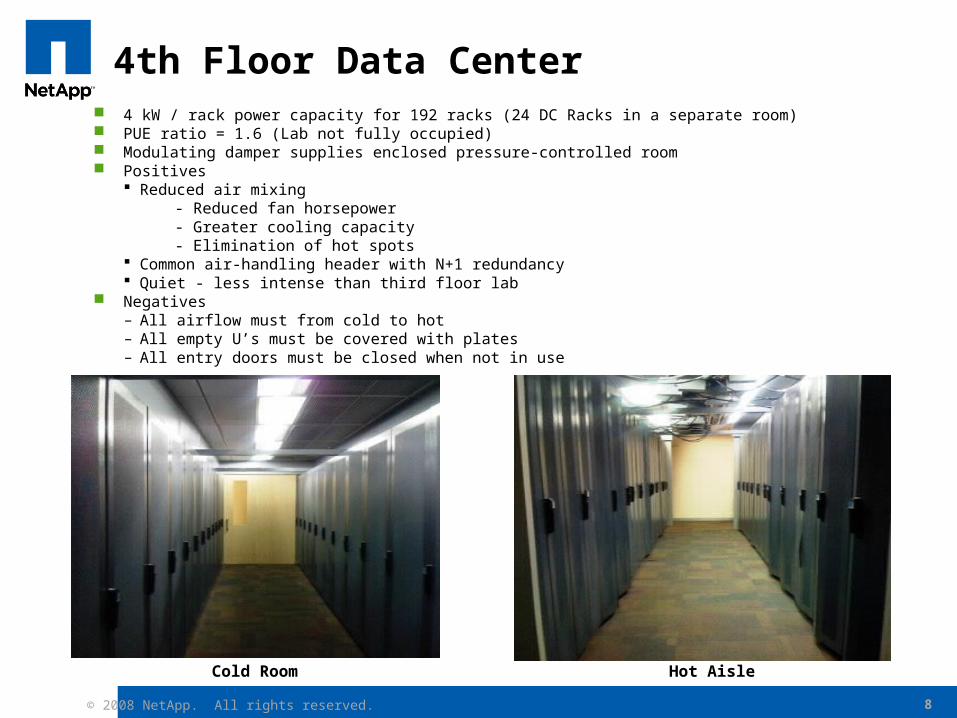
4th Floor Data Center 4 kW / rack power capacity for 192 racks (24 DC Racks in a separate room) PUE ratio = 1.6 (Lab not fully occupied) Modulating damper supplies enclosed pressure-controlled room Positives
Reduced air mixing- Reduced fan horsepower- Greater cooling capacity- Elimination of hot spots
Common air-handling header with N+1 redundancy Quiet - less intense than third floor lab
Negatives– All airflow must from cold to hot– All empty U’s must be covered with plates– All entry doors must be closed when not in use
Cold Room Hot Aisle

9© 2008 NetApp. All rights reserved.
Data Center - Layout
Cold Room
Cold Room
Cold Room
Cold Room
Cold Room
Cold Room
Cold Room
Cold Room
Cold Room

10© 2008 NetApp. All rights reserved.
Current PUE Ratio at Bangalore
Chillers Chiller Pumps AHU’s DC LightingOther
Lighting
UPS / DG / Battery room
AHUUPS
UPS Losses
Security Systems
Total PUE ratio
Apr - 08 364,393 36,545 138,833 9,104 985 13248 737,984 51,659 12.14 1352763.17 1.83
May - 08 395,347 35,074 138,403 9,104 985 13248 838,002 58,660 12.14 1488834.87 1.78
Jun - 08 364,090 35,739 122,880 9,104 985 13248 841,061 58,874 12.14 1445993.23 1.72
Jul - 08 353,855 35,769 101,651 9,104 985 13248 874,988 61,249 12.14 1450861.17 1.66
Aug - 08 349,317 38,970 91,533 9,104 985 13248 890,015 62,301 12.14 1455484.49 1.64
Sep - 08 354,280 39,603 83,270 9,104 985 13248 891,792 62,425 12.14 1454720.01 1.63
Oct - 08 357,322 39,603 82,893 9,104 985 13248 913,080 63,916 12.14 1480163.43 1.62
Nov- 08 348,138 36,438 76,352 9,104 985 13248 871,522 61,007 12.14 1416806.30 1.63
Dec - 08 321,467 38,597 76,013 9,104 985 13248 871,523 61,007 12.14 1391956.27 1.60

11© 2008 NetApp. All rights reserved.
RTP Building One, First-Floor Lab
8 kW / rack power capacity for 360 racks PUE ratio = 1.37 Modulating damper supplies enclosed pressure-controlled room Positives
– Reduced air mixing = reduced fan horsepower– Reduced air mixing = greater cooling capacity– Reduced air mixing = elimination of hot spots– Common air-handling header = N+1 redundancy– Quiet; 10x less intense than second-floor lab
Negatives– Unable to bring in outside air for economizer cooling– All airflow must be cold to hot– All empty U must be covered with plates– All entry doors must be closed when not in use
Hot Aisle Cold Room
Infrared shows very uniform temperatures.Warm areas from not covering empty rack space.

12© 2008 NetApp. All rights reserved.
RTP Building Four Dedicated Lab Building
12 kW / rack power capacity for 2,160 racks PUE ratio = 1.20 36mW total building power capacity $12 million annual electric bill when fully populated (4.5 cents/kWh) Modulating fan supplies enclosed pressure-controlled room Positives
– Raised supply temperature set point Increased chiller efficiency 17% Increased hours of outside air economizer cooling $2 million annual savings in cooling energy cost CO2 reduced by 40,000 tons/year = 7,000 cars not driven for 1 year
– Air-handling units directly over cold room reduce fan horsepower– Reclaimed (treated city waste) water used for cooling tower makeup
$100,000 annual savings in water cost – Outside air economizer adds redundancy for chiller plant failure
Negatives– All airflow must be cold to hot– All empty U must be covered with plates– All entry doors must be closed when not in use

13© 2008 NetApp. All rights reserved.
Highlights of the New Design
Separate Cold Room / Hot Aisle concept No CRAC unit’s inside Data Center (no risk of flooding) Multiple Air Handling units offering N+1 Redundancy NetApp uses new methods with existing cooling technologies
– Modulating Damper supplies enclosed in pressure-controlled room NetApp takes advantage of wide operating temperature and humidity set
points
– Set points are within manufacturers’ operating limits
– Set points are within allowable levels published in Thermal Guidelines for Data Processing Environments by ASHRAE
14© 2008 NetApp. All rights reserved.
Going Forward…..
Separate Cold room / Hot room Enclosures being evaluated Plain metal ceilings in the cold room Evaluate Man trap entrances Evaluate and Install Solar lighting Connect AHU’s and pumps to UPS thereby offering increased set
point temperature New ideas to be explored through Benchmarking……….

15© 2008 NetApp. All rights reserved.
White Papers
http://www.netapp.com/ftp/wp-reducing-datacenter-power-consumption.pdf
Reducing datacenter power consumption
Data ONTAP – Consolidate storage
www.netapp.com/tech_library/ftp/3356.pdf
16© 2008 NetApp. All rights reserved.
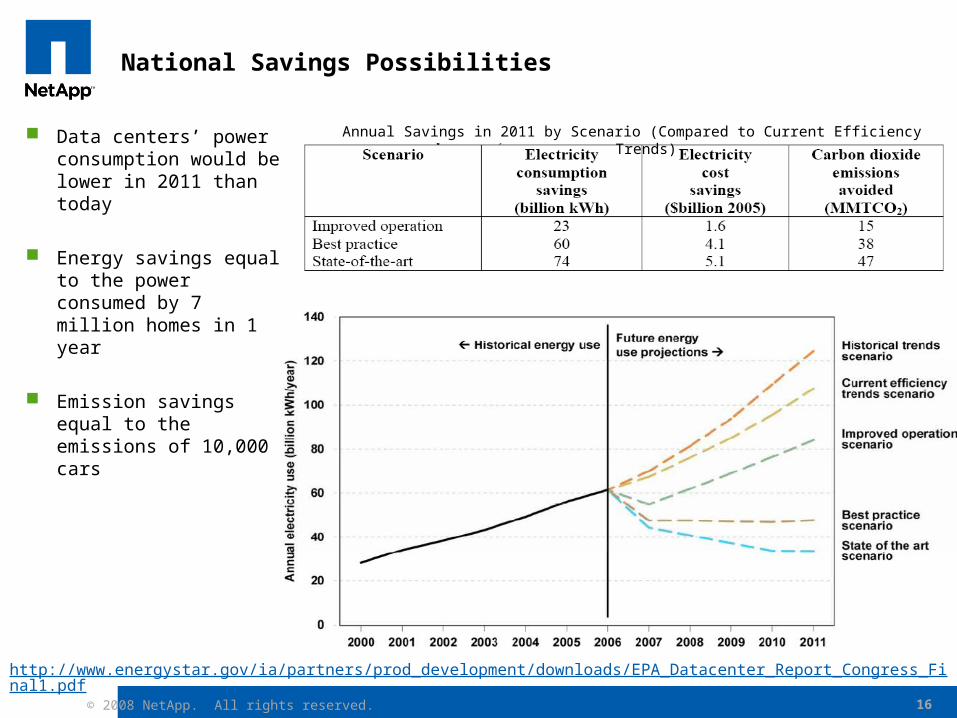
National Savings Possibilities
Data centers’ power consumption would be lower in 2011 than today
Energy savings equal to the power consumed by 7 million homes in 1 year
Emission savings equal to the emissions of 10,000 cars
Annual Savings in 2011 by Scenario (Compared to Current Efficiency Trends)
http://www.energystar.gov/ia/partners/prod_development/downloads/EPA_Datacenter_Report_Congress_Final1.pdf

Virtual Server Farm – NetApp Engineering Data center
18© 2008 NetApp. All rights reserved.
Consolidation
History– Around 1000 physical servers
– Demand of around 40 servers per month
– Limited availability of rack space & power
Virtualization challenges– Business acceptance
– Network Architecture
– ROI
– High Availability

19© 2008 NetApp. All rights reserved.
Virtual vs Physical trend
Resources 8 CPU X7350 @ 2.93GHz /
128 GB
8 CPU X7350 @ 2.93GHz /
128 GB
16 CPU E7340 @ 2.40GHz /
32 GB
8 CPU E5440 @ 2.83GHz / 32 GB
8 CPU E5420 @ 2.50GHz /
48 GB
8 CPU X7350 @ 2.93GHz /
128 GB
8 CPU X7330 @ 2.40GHz /
72 GB
8 CPU X7330 @ 2.40GHz /
64 GB
CPU 42.90% 47.60% 7.53% 5.28% 9.08% 52.28% 28.40% 40.01%
Memory 31.70% 29.32% 54.67% 26.64% 22.70% 35.71% 39.25% 29.80%
Network 2079 KBps 396 KBps 159 KBps 230 KBps 119 KBps 357 KBps 125 KBps 11877 KBps
Uptime 70 days 70 days 70 days 70 days 70 days 70 days 60 days 60 days
20© 2008 NetApp. All rights reserved.
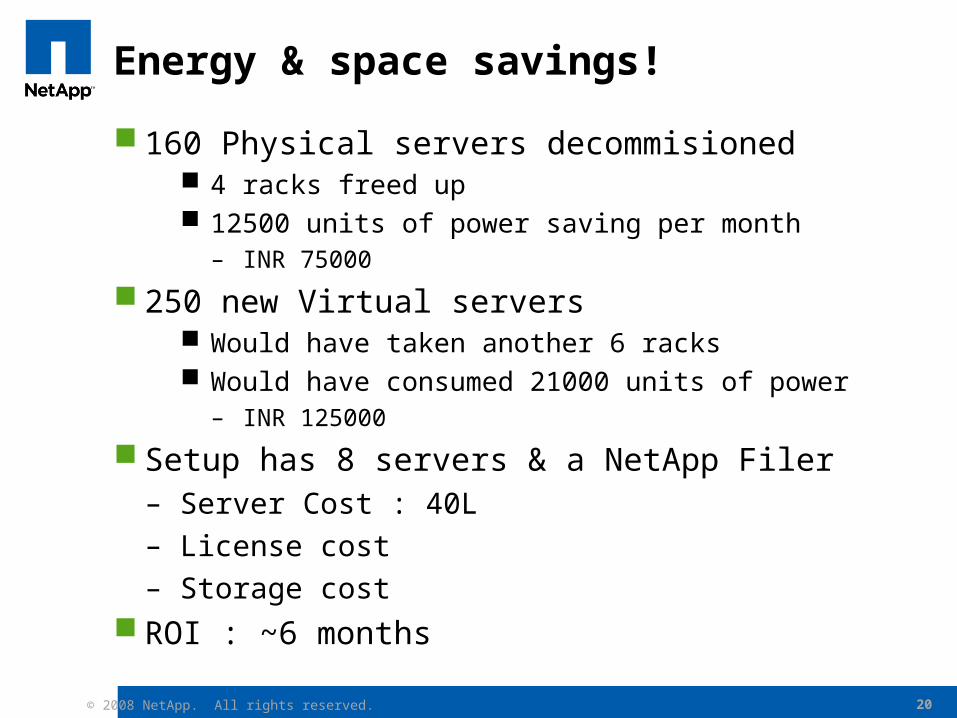
Energy & space savings!
160 Physical servers decommisioned 4 racks freed up 12500 units of power saving per month
– INR 75000
250 new Virtual servers Would have taken another 6 racks Would have consumed 21000 units of power
– INR 125000
Setup has 8 servers & a NetApp Filer– Server Cost : 40L
– License cost
– Storage cost ROI : ~6 months

21© 2008 NetApp. All rights reserved.
Why NetApp Filer
Storage consolidationData protectionHigh availabilityDedupe TechnologyEasy to manageNFS – hence no additional costRapid provisioningUnified Multiprotocol storage

22© 2008 NetApp. All rights reserved.
Accelerate Deployment with Efficient VM cloning
22
1
Storage required
Multiple Cost Volumes
n
n x (Storage per volume)
Slow
Time-consuming due to complete physical copies
Slow to provision, re-provision or repurpose
Quick provisioning with FlexVol® Instant copies with FlexClone® Simple commands or policies Ideal for dynamic Microsoft
Virtualized environment
NetApp VM ProvisioningTraditional VM Provisioning
3 sec
One Flexible Volume
‘n’ zero cost FlexClone Volumes
1
Storage required
One Flexible Volume and multiple zero cost FlexClone volumes
nVery fast
23© 2008 NetApp. All rights reserved. 23
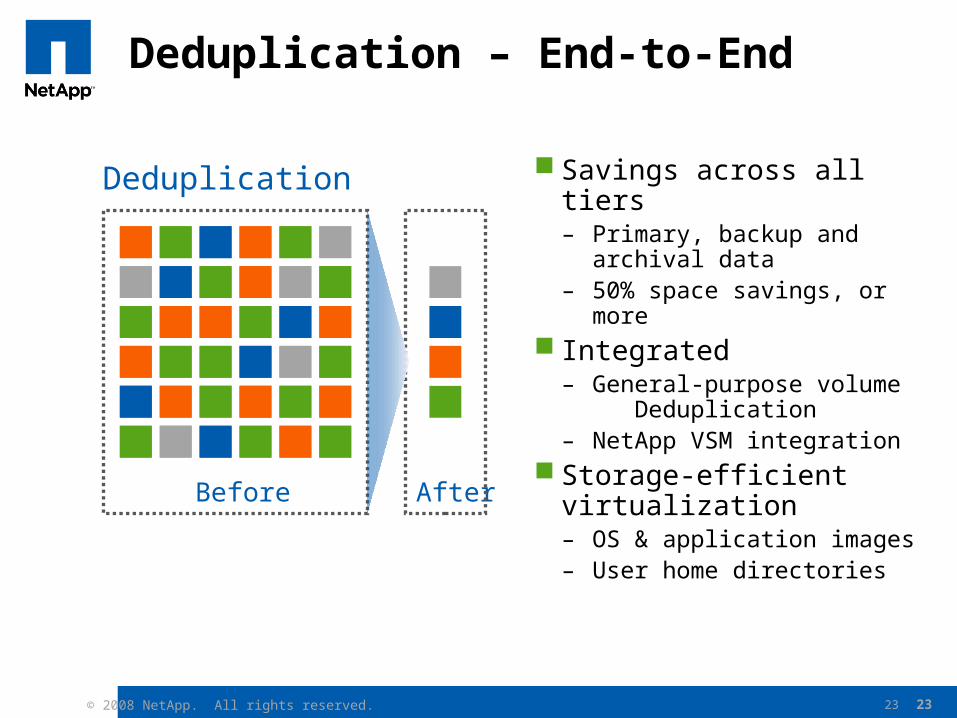
Deduplication – End-to-End
Savings across all tiers– Primary, backup and
archival data– 50% space savings, or
more Integrated
– General-purpose volume Deduplication
– NetApp VSM integration Storage-efficient
virtualization– OS & application images– User home directories
Deduplication
Before After
24© 2008 NetApp. All rights reserved.
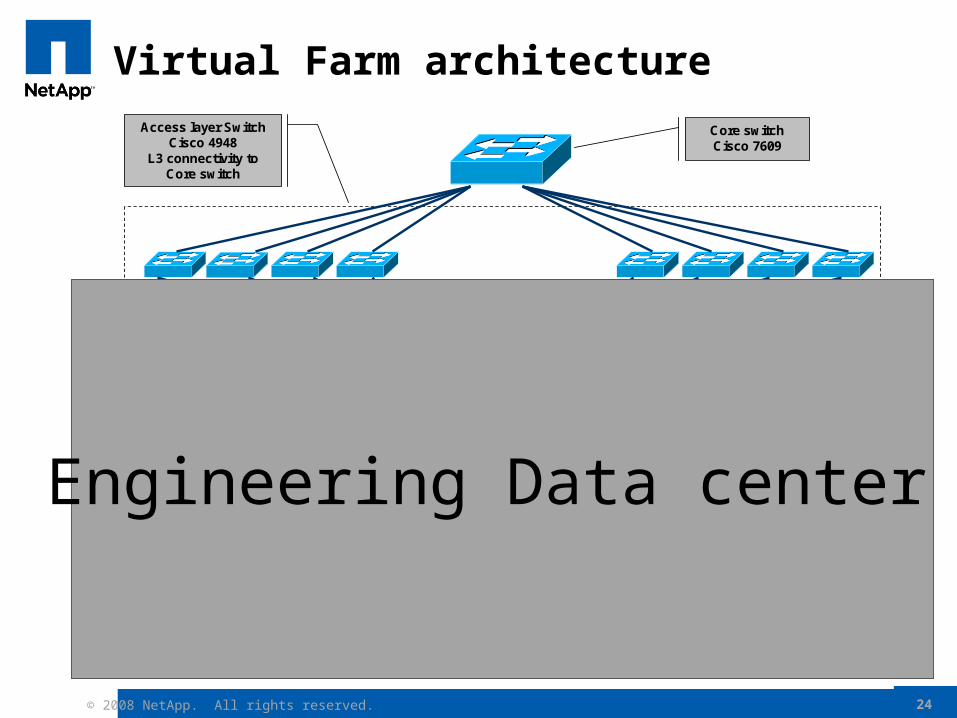
Virtual Farm architecture
FAS3050C
activity status power
FAS3050C
activity status power
72F 72F72F72F72F72F72F72F72F72F72F72F72F72F
Shelf ID
System
Loop B
Loop A
Fault
Power
DS14
FCNetworkAppliance NetworkApplianceNetworkApplianceNetworkApplianceNetworkApplianceNetworkApplianceNetworkApplianceNetworkApplianceNetworkApplianceNetworkApplianceNetworkApplianceNetworkApplianceNetworkApplianceNetworkAppliance
MK2
FAS 3050c
IBM x3850 server
Core switch Cisco 7609
Access layer Switch Cisco 4948
L3 connectivity to Core switch
Switches connecting VMware Farm - Cisco 4948
Vlan extended from access layer switch to VMware
farm switch - L2 connectivity
NB VMware Farm
NFS Data store on clustered FAS3050 filer
Dual 1Gb ports for VMkernel
ESX EST LAN networking
Engineering Data center

25© 2008 NetApp. All rights reserved.
Virtual Farm Strategy
Multi platform VirtualizationVirtual server on demandBusiness continuity & Disaster recovery

26© 2008 NetApp. All rights reserved.
Thank You !