net zero emissions: how do we get there and what are the
TRANSCRIPT

Net zero emissions: how do we get there and what are
the implications?
18th June, 2019Budapest, Hungary
A lively evening discussion with expert speakers followed by an informal drinks reception to celebrate our Budapest office
Erica HopeEuropeanClimate Foundation(Belgium)
Hanna SzemzőMetropolitanResearch Institute(Hungary)
Krzysztof BolestaElectric Vehicles P.F.
(Poland)
Enikő KácsorRegional EnergyPolicy Research
(Hungary)
Christian PlasDenkstatt
(Austria)
Dóra FazekasCambridge Econometrics
(Hungary)
Philip SummertonCambridge Econometrics(United Kingdom)

Cambridge EconometricsHungary, Managing Director
15 years’ experience in economic and econometric analysis to inform policy-makers in the fields of climate, energy and the circular economy.
Dóra Fazekas

European ClimateFoundation
Cross-sectoral ‘2050 Task Force’ and governance programme
Erica Hope

Net Zero Emissions: how do
we get there and what are
the implications?
Cambridge Econometrics seminar
Budapest, Hungary, 18 June 2019
Erica Hope, European Climate Foundation

18/06/2019 European Climate Foundation 5
Net Zero By 2050: From Whether To How?

18/06/2019 European Climate Foundation 6
Reaching NZ2050 is possible via a rangeof pathways
Source: ECF/Climact 2018: Net Zero By 2050: From Whether To How –

European Climate Foundation 7
High ambition is needed in all sectors, whatever the chosen pathway
Source: ECF/Climact 2018: Net Zero By 2050: From Whether To How –
18/06/2019

European Climate Foundation
“Towards Fossil-Free Energy in 2050”
!
▪ Cross-sectoral report on NZ50 vision for power, heat & road transport sectors
▪ Key take-aways:
▪ Fossil-Free energy systems in 2050 are technically feasible in different configurations
▪ Smart electrification and buildings efficiency key pillars, with important complementary role for green hydrogen as seasonal store of energy.
▪ Green gas should be targeted to high value applications (seasonal storage, industry, shipping, aviation)
▪ Zero carbon energy systems come with modestly positive macro-economic impacts
18/06/2019 8

18/06/2019 European Climate Foundation 9
All scenarios involve major structural change in the economy

European Climate Foundation 10
A “just transition” strategy will be neededfor all affected sectors of the economy
Spain;s Just Transition Agreement for MinersSource: ETUC
Czech coal regions. Source: Euracoal (2019), taken fromE3G
Katarína Macháčková, Mayor of PriedzvaSource: just-transition.info
Slovak lignite regions. Source: Euracoal (2019), taken from E3G
18/06/2019
18/06/2019 European Climate Foundation 11
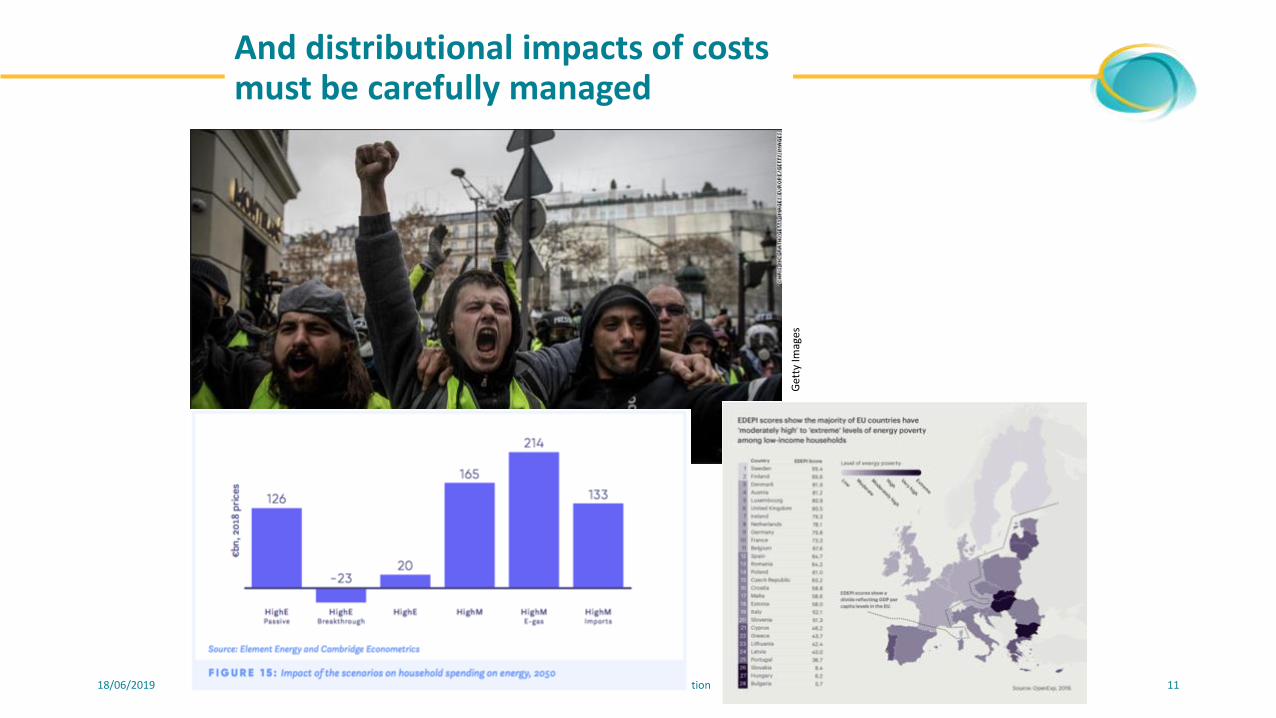
And distributional impacts of costs must be carefully managed
Get
ty Im
ages
1. Net zero is essential, but it won’t happen by chance. We have to plan to get there: to understand the pathways, and then consciously translate these insights into near term policies (“backcasting”).
2. Planning also opens up awareness of social impacts of the transition, so that they can be need to be proactively addressed.
3. National Long Term Strategies (due 1/1/2020, under EU Governance Regulation) can be used by Member States to understand and signal what they need.
18/06/2019 European Climate Foundation 12
Concluding thoughts

Thank [email protected]

Regional Centre forEnergy Policy Research
Experienced in international electricity price comparison, electricity market modelling and support schemes and allocation of support for renewable energy
Enikő Kácsor

Enikő Kácsor
REKK
CITIZEN-ORIENTED ENERGY TRANSITION:
IMPACTS ON MARKETS AND PRICES IN THE CEE
REGION

REKK-Who we are?
▪ Think tank based at the Corvinus University of Budapest
▪ Mission of the Regional Centre for Energy Policy Research (REKK) is to provide
professional analysis and advice on networked energy markets that are both
commercially and environmentally sustainable.
▪ Main research fields: electricity and natural gas markets, district heating,
renewable energy, water economics
▪ Market modelling with policy focus
(EGMM, EEMM)
▪ 3 main activities:
▪ Teaching (University, ERRA)
▪ Research (H2020)
▪ Consultancy
2

ENABLE.EU: Enabling the Energy Union through understanding the
drivers of individual and collective energy choices
Aim
▪ To identify the most important factors of energy
choices in the 3 key energy consumption areas
▪ To better grasp the interactions between individual
and collective energy choices and the regulatory,
technological and investment prerequisites of the
Energy Union
▪ To look at the social acceptability of energy
transition
▪ To increase the knowledge of governance and
social mobilisation practices that encourage
collective energy choices
▪ To provide strategic policy recommendations to
increase the social acceptability of energy
transition
Methodology
▪ Literature review of existing qualitative and
quantitative studies
▪ Case studies drawing on interviews, focus groups
with households and experts, and data from
household surveys conducted in 11 countries
▪ Participatory foresight exercises
▪ Reference and policy scenarios, assessed using
quantitative modelling
▪ Series of policy recommendations formulated and
disseminated
Project partners

4
EEMM model
▪ 39 countries are handled in the model
▪ The model calculates the marginal cost of around 3400 power plant
blocks and sets up the merit order country by country
▪ Power flow is ensured by 104 interconnectors between countries
4

▪ Perfect competition is assumed:
▪ Plants produce energy if P>MC; no capacity withholding
▪ Market based allocation of NTC (Efficient cross-border capacity auctions)
▪ Capacity limits are taken into account for production and cross-border
trade
▪ Large country prices around the region are exogenous to the model, the
rest are determined by the model
▪ Equilibrium prices are formed simultaneously in all modelled countries,
taking into account supply, demand and trade
▪ 90 independent reference hours are modelled for every year
5
Basic economics in the model
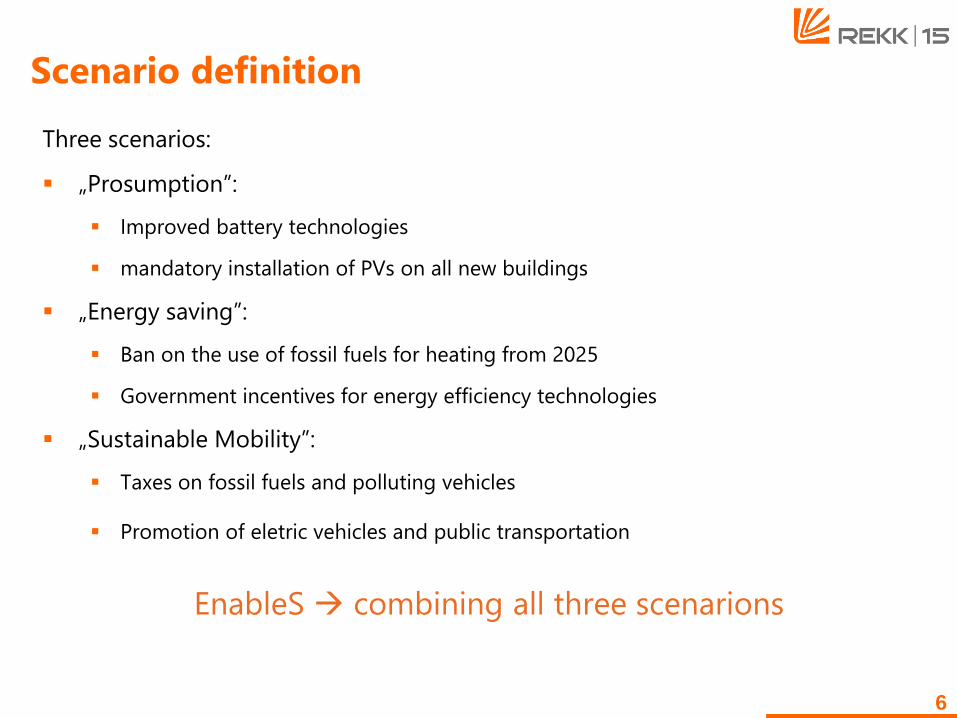
Three scenarios:
▪ „Prosumption”:
▪ Improved battery technologies
▪ mandatory installation of PVs on all new buildings
▪ „Energy saving”:
▪ Ban on the use of fossil fuels for heating from 2025
▪ Government incentives for energy efficiency technologies
▪ „Sustainable Mobility”:
▪ Taxes on fossil fuels and polluting vehicles
▪ Promotion of eletric vehicles and public transportation
EnableS → combining all three scenarions
6
Scenario definition

7
Preliminary results of the modelling
CO2 intensity
CEE defined as: AT, BG, CZ, HR, HU, PL, RO, SI, SK

8
Preliminary results of the modelling
RES share

9
Preliminary results of the modelling
Wholesale prices


Polish E-mobility Foundation, Vice President
Experienced energy and climate advisor, consultant and speaker
Krzysztof Bolesta

Demand for fuel in the low carbon energy transition
CHRIS BOLESTA ELECTRIC VEHICLES PROMOTION FOUNDATION

Future energy expenditure for mobility in Europe
350
300
250
200
150
100
50
0
2018 2023 2028 2033 2038 2043 2048
petrolFuel
Exp
endi
ture
(€bn
)
SOURCE: Cambridge Econometrics
electricity
diesel
hydrogen

Current energy consumption in transport
1990
1994
1998
1992
1996
2000
2008
2004 20
122002
2010
2006 20
142001
2009
2005 20
132003 20
112007 20
152016
1991
1995
1999
1993
1997
20
18
16
14
12
10
8
6
4
2
0
rail electricity
natural gas
biogasoline
diesel oil
road diesel
biodiesel
ship residual fuel oil
aviation kerosene
LPG
ship diesel
road gasoline
Ene
rgy
Con
sum
ptio
n (m
illio
n te
rajo
ules
(TJ
)

Transition will bring benefits
• oil bill down
• disposable income and jobs up
• improved security of supply
• pollution goes away

But oil will be spilled• jobs in refining drop • fuel duty drops
8000
7000
6000
5000
4000
3000
2000
1000
0
350
300
250
200
150
100
50
0
-50 REF TECH
7282bn
1828 1863
2556
151206
2545
2702 2712
7283bn
Income Tax RevenueServices Electricity & hydrogen Fuel Duty Revenue
Social Security RevenueOther Manufacturing
Electrical Equipment
Motor Vehicles
Manufactured fuels
VAT Revenue
2005 20252015 20352010 20302020 2040 2045 2050

Not so obvious disadvantages of the transition • wealth transfers socially unjust
• oil trade impact
• dutch desease gets worse

Conclusions• clear electrification targets should give
investment and divestment impuls
• taxes on motor fuels will have to bereplaced – remodelling of energy taxes
• unjust social transfers in transitionunavoidable
• market will have to accomodateoil trade storm


Metropolitan Research Institute, Managing Director
20 years’ experience in research and consultancy in the fields of urban policy, energy efficiency and social inclusion
Hanna Szemző
Benefits of the low carbon transition in the built environmentHanna SzemzőMetropolitan Research Institute18 June 2019

Benefits of EE investments/low carbon transition
2
• The benefits of energy efficiency investments into this stock, the low carbon transition are obvious regarding the environment, economy, labor market, even education
• The benefits become more complex when we look at the social consequences, especially in the CEE region – something we talk about much less
• EE investments are costly – they pay-back periods are long, and clean energy is beyond reach for many, especially in the CEE region

Preaching for the converted – but still
3
The dire (well-known) facts:
• Buildings are responsible for app. 40% of the final energy consumption in the EU
• They are responsible for 36% of the CO2 emissions in the EU
But to achieve results, we need to note that:
• The stock itself is very diverse – the technical parameters are rather different
• There is an East-West divide – but not because of technical conditions
• And there is no regional pattern in Europe regarding technical quality

There is no East-West divide (despite popular notions)
4
CEE EU member states
Average energy consumption for space heating in the residential sector(kWh/m2/yr)
Weighted average of U values for building shells *
Non-CEE EU member states
Average energy consumption for space heating in the residential sector (kWh/m2/yr)
Weighted average of U values for building shells *
Bulgaria 91 1.35 Italy 138 2.25
Romania 170 1.58 Greece 129 2.15
Slovenia 142 1.15 Spain 80 2.28
Czech Republic 168 1.25 Germany 165 1.14
Hungary 149 1.28 Belgium 194 1.95
Poland 175 1.45 UK 153 1.8
Slovakia 124 1.7 France 193 1.65
Estonia 192 0.58 Denmark 148 0.9
Lithuania 126 0.93 Finland 205 0.75
Latvia 215 0.78 Sweden 143 0.8

Framework conditions in the CEE countries
5
• Relatively young building stock
• High ownership of residential buildings – many poor are owners
• Low rate of social rental housing
• Mixed-income multi unit buildings

Challenges in the CEE
6
• Low income – high investment costs
• Individual versus common solutions (Easily feasible vs technically better)
• Hard to target the needy for an efficient program
• Mixed interest among the owners – EE investments are not feasible for many, including the middle-income population
• Shortage of skilled workforce – new phenomenon

Who pays in the CEE region? State and intermediaries for the low carbon transition
7
- EU regulations provide the framework
- The state provides almost in every CEE subsidy schemes
- Despite the successes there is an obvious limit to whom they can reach
- Municipalities as intermediaries are crucial for a successful transformation


denkstatt, Founder
25 years’ experience in strategy development focusing on a decarbonised world and new business models
Christian Plas

Low Carbon Energy Transition in CEEViability, opportunities and challenges
June 18th, 2019
Budapest
Christian Plas

Science says:„We need this!“

2011 20122013 20142015
Renewables Electricity Share

There is lots of Carbon in Our Energy Mix
Source: Eurostat, Energy Community 48
0 50 100
Austria
France
Germany
Italy
Bulgaria
Czech Republic
Estonia
Hungary
Latvia
Lithuania
Poland
Slovakia
Ukraine
Croatia
Structure of Gas Supply to CEE and other EU Markets (2015)
Domestic Production
Imports from Russia
Imports Other Directions
Source: ENI World O&G Outlook 2016
0% 20% 40% 60% 80% 100%
Ukraine
Hungary
Slovakia
Poland
Czech Republic
Gross Energy Consumption of Primary Sources in CEE (2013)
Solid Fossil Fuels Petroleum & Products Gases Nuclear Renewables

49
Low TargetsDon‘t Help

The Challenge: The Current Policies and Sustainable Development Scenarios
Source: WEO 2018 50
-
50
100
150
200
250
300
350
-
5 000
10 000
15 000
20 000
25 000
2025 2030 2035 2040
Electricity Generation (TWh/a) and Carbon Intensity (gCO2/kWh)
North America Central & South America Europe Africa
Middle East Eurasia Asia Pacific Intensity (g CO2/kWh)

51
How to finance?
How to change awell-trained mindset? Challenges we face …

Let‘s Face the Potential in our Needs
Source: AG Energiebilanzen e.V. (2014) 52
space heating30%
domestic hot water5%
process heat21%
cooling energy2%
mechanical energy37%
ICT2%
lighting3%
Effective Energy Demand (Germany, 2012) (%)
Factor 1:10 topic: heat demand of200 kWh/m².a → 20 kWh/m².a
Factor 1:10 topic: replace light bulbs by LED
Mobility included: about 50% well2wheel reduction with BEV compared with ICEV
BEV … Battery Electric Vehicle; ICEV … Internal Combustion Engine Vehicle

Is this Model viable?
53
Yes,
but …We have to change the
very stable mindset!
We have to change ourprofitability expectations

denkstatt group
denkstatt GmbH
Hietzinger Hauptstraße 28
1130 Vienna, Austria
+43 1 786 89 00
www.denkstatt.eu
Christian Plas
[email protected] Contact

Cambridge EconometricsManaging Director
Experienced in leading energy and climate policy research projects for national governments, the European Commission, and various international organisations.
Phil Summerton
