net marketing co. ltd. - ir pocket
TRANSCRIPT
1 ©2020 Net Marketing Co. Ltd. All right reserved.
Stock Code 6175
FOR THE THIRD QUARTER OF THE FISCAL YEAR ENDING JUNE 30, 2020
Net Marketing Co. Ltd.
FINANCIAL RESULTS

2
Contents
©2020 Net Marketing Co. Ltd. All right reserved.
Financial Highlightsfor the Third Quarter of the
Fiscal Year Ending June 30, 2020

3
Financial Highlightsfor the Third Quarter of the Fiscal Year Ending June 30, 2020

4 ©2020 Net Marketing Co. Ltd. All right reserved.
Third Quarter of the Fiscal Year Ending June 30, 2020– Summary –
Sep. 26, 2019 New Corporate Identity
Aug. 9, 2019 Medium-Term Management Plan updated – No change to basic or core policies
Company-wide sales and income increased year on year.The full-year earnings forecast is currently being calculated due to the spread of COVID-19 coronavirus infections………………………………………………………………………………………………….... P. 7
Media Business
Advertising Business
Both sales and profit showed continued growth
We continued sales activities by attaching weight to up-selling and profit increases of existing projects.
We enhanced initiatives for social media advertising.
We carried out a rebranding of Omiai and started to roll out new creative
The cumulative total number of members reached five million. (as of December 2019) Moved initiatives forward with a focus on key issues (marketing/PR/products)…..……... P. 13 PR activities (rebranding, talent casting, outdoor advertising, etc.)………………... P. 14, 15
Corporate
Business
Company-wide

5
Both net sales and income rose year on year
©2020 Net Marketing Co. Ltd. All right reserved.
Million yen2019.6 3Q 2020.6 3Q YoY
Increase/Decrease
Net Sales 9,812 11,313 +1,500
Gross Profit 2,989 3,589 +600Gross Profit Margin (Gross Profit/Net Sales) 30.5% 31.7%
Operating Income 143 602 +458Operating Income Margin (Operating Income/Net Sales) 1.5% 5.3%
Ordinary Income 139 613 +473
Net Income 91 419 +328
(+15.3%)
* As strategic investments in the Media Business were implemented in the third quarter of the fiscal year ended June 30, 2019, operating income fell on a temporary basis.
Third Quarter of the Fiscal Year Ending June 30, 2020– Financial Results Summary (Reference: YoY Comparison) –

6
The full-year earnings forecast is currently being recalculated. There are no changes to expected dividends.
©2020 Net Marketing Co. Ltd. All right reserved.
Million yen3Q Actual Full-year Earnings Forecast
Net Sales 11,313 ー
Operating Income 602 ー
Ordinary Income 613 ー
Net Income 419 ー
Year-end Dividend (Payout Ratio) ー 6 yen(ー)
The forecast will be announced once the impact on earnings can be predicted.
Third Quarter of the Fiscal Year Ending June 30, 2020– Financial Results Summary (Opening Earnings Comparison) –

7
<Impact on Earnings>
The spread of COVID-19 coronavirus infections is still ongoing, and a state of uncertainty over the future persists. Under these circumstances, an impact on company earnings has begun to emerge, but we have determined that at this stage it is difficult to calculate a specific earnings forecast. Accordingly, on a temporary basis we will not produce an earnings forecast, but will promptly announce a forecast once it becomes possible to make the appropriate calculations. Information on the expected impact on our individual business is given below.
If the falling consumer sentiment continues due to the government’s voluntary stay-at-home request, there may be a greater impact on business KPIs.
Company-wide
Media Business
Advertising BusinessIf the closure or reduced operating hours of businesses at the request of the national government and local governments continues, sales could fall, particularly from advertisers in the category of businesses with physical stores.
Impact of the COVID-19 Coronavirus
©2020 Net Marketing Co. Ltd. All right reserved.

8 ©2020 Net Marketing Co. Ltd. All right reserved.
2,478 2,169
2,343
2,876
0
1,000
2,000
3,000
4,000
5,000
1Q 2Q 3Q 4Q
2,709
2,312
2,692
3,495
1Q 2Q 3Q 4Q
3,455
3,078
3,279
4,237
1Q 2Q 3Q 4Q
2017.6 2018.6 2019.6 2020.6
(Million yen)
4,254
3,496 3,561
1Q 2Q 3Q
Changes in Quarterly Net Sales
* Although we announced the consolidated financial results in the fiscal year ended June 2017 and 2018, this report contains non-consolidated results because we have changed to non-consolidated financial settlement from the fiscal year ended June 2019.

9
131
75 82
153
0
100
200
300
400
500
1Q 2Q 3Q 4Q
189
115
170
78
1Q 2Q 3Q 4Q
26 -0.9
117
280
1Q 2Q 3Q 4Q
Enhancement strategic investment in Media
Business
2017.6 2018.6 2019.6 2020.6
(Million yen)
406
101 94
1Q 2Q 3Q
期⽐
Changes in Quarterly Operating Income
* Although we announced the consolidated financial results in the fiscal year ended June 2017 and 2018, this report contains non-consolidated results because we have changed to non-consolidated financial settlement from the fiscal year ended June 2019.
©2020 Net Marketing Co. Ltd. All right reserved.

10
0
2,000
4,000
6,000
8,000
10,000
12,000
14,000
©2020 Net Marketing Co. Ltd. All right reserved.
Million yen 2019.6 3Q 2020.6 3Q
Media Business
Net Sales 3,108 3,482
Operating Income 53 273
Profit Margin (Operating Income/Net Sales) 1.7% 7.9%
Advertising Business
Net Sales 6,704 8,028
Operating Income 494 778
Profit Margin (Operating Income/Net Sales) 7.4% 9.7%
Adjustments
Net Sales - -197
Corporate Expenses -404 -449
Media BusinessAdvertising Business
(Million yen)
3Q2019.6
3Q2020.6
Results by Segment – Comparison with 3Q Last Year –
Both the Media Business and the Advertising Business achieved double-digit increases in net sales year on year.
Media Business Net Sales
12.0%YoY
Advertising BusinessNet Sales
19.7%

11
740 766 792 835
1,005 1,047 1,055 1,130
1,238 1,141 1,102
144 118 152 34 -10 -8 72 74
182 55 35
(250)
0
250
500
750
1,000
1,250
1,500
1Q 2Q 3Q 4Q 1Q 2Q 3Q 4Q 1Q 2Q 3Q 4Q
Net Sales/Operating Income (Million yen)
2019.6 2020.62018.6
Media Business – Change in Earnings Over Time –
Despite an increase in the number of paying members, net sales declined due to the promotion of long-term plans that generate lower sales per customer.This approach aims to achieve future sales increases by extending the lifetime of paid memberships.
Net Sales (Left axis) Operating Income (Right axis)
* The figures in the graph include segment adjustments.* Although we announced the consolidated financial results in the fiscal year ended June 2018, this report contains non-consolidated results because
we have changed to non-consolidated financial settlement from the fiscal year ended June 2019.
©2020 Net Marketing Co. Ltd. All right reserved.

12
100,000
2017.6 2018.6 2019.61Q
2021.62020.6
(Members)
2Q 3Q
40,118
53,407
76,80180,508 78,246
0
20,000
40,000
60,000
80,000
100,000
The number of paying members rebounded compared with 2Q due to measures to boost new memberships in the year-end and New Year period.
76,225
Target in the final yearof the Medium-Term
Management plan
24,839Progress
46,5933rd year of
Medium-Term Management Plan
Number of paying membersNumber of members who use the monthly subscription service as of the end of March 2020.
Media Business – Trend in Number of Paying Omiai Members –
©2020 Net Marketing Co. Ltd. All right reserved.

13
Initiatives
Media Business – Efforts to Expand Market Share –
Aim to further expand business by moving key initiatives forward.
MarketingEfforts to optimize each KPI and expand advertising methods/channels
PRPR activities to raise awareness and public favor
Products Improving UI/UX, etc.
:Key Issue Focus areas in preparation for high demand season
Continue efforts to optimize each KPI and expand advertising methods/channels.
Engage the services of brand ambassadors and implement PR measures such as outdoor advertising to raise awareness and public favor in the medium-to-long-term.
Updated user interface due to the rebranding
©2020 Net Marketing Co. Ltd. All right reserved.

14 ©2020 Net Marketing Co. Ltd. All right reserved.
Omiai Rebranding
Rebranding press conference held on February 20
Omiai Rebranding Outline
Redesigned brand logo
The new logo was designed based on the idea of wanting to “cheer on serious new relationships that involve love (ai)”
From left: COO Hideki Matsumoto, NON, CEO Kunihisa MiyamotoAt CROAK Prime Studio. Scenes from the event were reported on by many media outlets.
- Promoting improved recognition and public favor through rebranding -
Roll-out of new creative
Brand message of support for those embarking on new relationships
We are now in an age where meeting a partner through the Internet has become commonplace. As a driver of the domestic matching service market, we aim to offer a “service that those looking for safer and more serious matches can use with peace of mind.”
The services of brand ambassador “NON” were employed
We employed the services of NON, a talent who appeals to a wide range of age groups and enjoys a clean image
Media Business – Full-scale operation of PR measures utilizing well-known talent (1) -

15
Engaging the services of Omiai brand ambassador “NON”
Results of Recent PR Measures
Outdoor advertising
Advertising media:Fixed outdoor signboardsOutdoor electronic signagePosters inside train carriagesDigital signage inside train stations
Web-based commercials
The commercials are also streamed on the special website
Launch of special website Changes to app and website pages Changes to app and website pages Launch of special website
Outdoor advertising Web-based commercials
Advertising areas: Kanto, Kansai
Media Business – Full-scale operation of PR measures utilizing well-known talent (2) -
©2020 Net Marketing Co. Ltd. All right reserved.

16
5,414
6,704
8,028
1,968
1,545
1,899
2,660 2,449
2,031 2,224
3,107 3,017
2,4422,567
157
109
170 182 176137
180
367 375
192210
0
50
100
150
200
250
300
350
400
450
500
0
500
1,000
1,500
2,000
2,500
3,000
3,500
1Q 2Q 3Q 4Q 1Q 2Q 3Q 4Q 1Q 2Q 3Q
2019.6 2020.62018.6
Net Sales/Operating Income (Million yen)
Net Sales (Left axis) Operating Income (Right axis)
3Q2019.6
3Q2020.6
3Q2018.6
Advertising Business – Changes in Business Performance Over Time –
Both sales and profit showed continued growth
Comparison of 3Q net sales (cumulative)
(Million yen)
* The figures in the graph include segment adjustments.* Although we announced the consolidated financial results in the fiscal year ended June 2018, this report contains non-consolidated results because
we have changed to non-consolidated financial settlement from the fiscal year ended June 2019.
Up23.8%
Up19.7%
©2020 Net Marketing Co. Ltd. All right reserved.

17
This market forecast does not reflect the impact from the spread of COVID-19 coronavirus infections.
AppendixMarket Environment
18
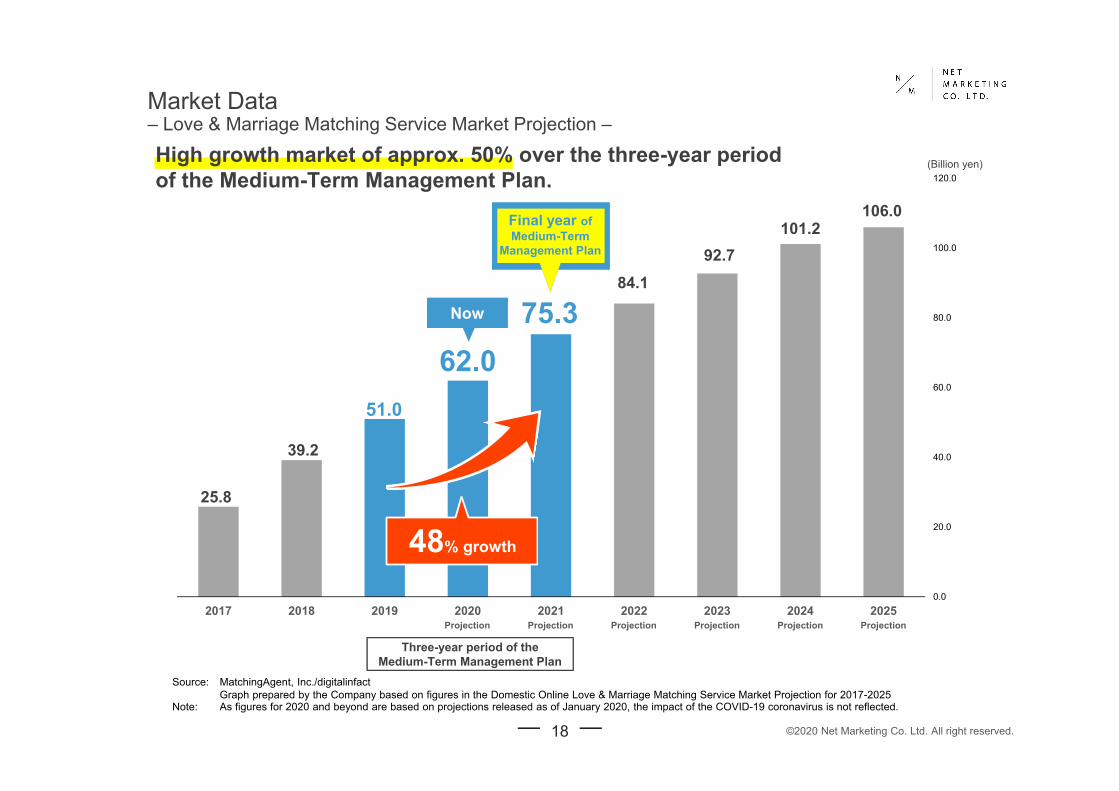
High growth market of approx. 50% over the three-year period of the Medium-Term Management Plan.
25.8
39.2
51.0
62.0 75.3
84.1 92.7
101.2 106.0
0.0
20.0
40.0
60.0
80.0
100.0
120.0
2017 2018 2019 2020 2021 2022 2023 2024 2025
Now
48% growth
Three-year period of the Medium-Term Management Plan
Projection Projection Projection Projection ProjectionProjection
Final year of Medium-Term
Management Plan
Source: MatchingAgent, Inc./digitalinfact Graph prepared by the Company based on figures in the Domestic Online Love & Marriage Matching Service Market Projection for 2017-2025
(Billion yen)
Note: As figures for 2020 and beyond are based on projections released as of January 2020, the impact of the COVID-19 coronavirus is not reflected.
Market Data– Love & Marriage Matching Service Market Projection –
©2020 Net Marketing Co. Ltd. All right reserved.

19
The percentage of couples who married through an online marriage matching service reached a record 7.4%, roughly 1.5 times the figure from the previous year
0
1
2
3
4
5
6
7
8
9
10
2000 2001 2002 2003 2004 2005 2006 2007 2008 2009 2010 2011 2012 2013 2014 2015 2016 2017 2018
Change in the percentage of couples who married after using a marriage matching service
Marriage agency Online marriage matching service Marriage matching parties and events
(%)
7.4%
2.9%
2.4%
Approx. 1.5x
Market Data– Percentage of Online Marriage Matching Service Penetration –
Source: Graph created by the Company based on figures from 2019 Marriage Matching Fact-finding Survey 2019 (Recruit Bridal Souken)
©2020 Net Marketing Co. Ltd. All right reserved.

20
231.6 261.5
288.1 313.3
343.4378.0
465.4
0.0
50.0
100.0
150.0
200.0
250.0
300.0
350.0
400.0
450.0
500.0
2016 2017 2018 2019 2020 2021 2022 2023
(Billion yen)
418.1
Market Data– Affiliate Marketing Market Projection –
A market where stable growth is expected over the three-year period of the Medium-Term Management Plan.
Now
Final year of Medium-Term
Management Plan
ProjectionProjectionProjectionProjectionForecast
Note: Estimate for FY2019 and predictions for FY2020 and beyond as of December 2019. The market size was calculated by adding the rewards for results from affiliate advertising, fees and various expenses. For 2020 and beyond, as the projections are based on information available as of December 2019, the impact of the COVID-19 coronavirus is not reflected.
Source: “Trends in and Outlook for the Affiliate Marketing Market 2019”. Graph created by the Company based on figures announced on February 7, 2020
Three-year period of the Medium-Term Management Plan
©2020 Net Marketing Co. Ltd. All right reserved.

21
114.3 154.0
214.3
260.0307.4
361.5
0.0
50.0
100.0
150.0
200.0
250.0
300.0
350.0
400.0
450.0
500.0
2017 2018 2019 2020 2021 2022 2023
(Billion yen)
448.6
Growth market of approx. 43% over the three-year period of the Medium-Term Management Plan.
Market Data– Social Advertising Market Projection –
Now
Final year of Medium-Term
Management Plan
ProjectionProjectionProjectionProjectionForecast
Source: Graph created by the Company based on figures from Status and Outlook of Net Advertising and Web Solutions Market 2019 (MIC Research Institute)
Three-year period of the Medium-Term Management Plan
Note: Future projections are based on the issue published June 28, 2019 and do not reflect the impact of the COVID-19 coronavirus.
©2020 Net Marketing Co. Ltd. All right reserved.

22
1,932.3 1,965.7 1,947.8 1,912.3
1,861.2
1,159.4 1,310.0
1,509.4 1,758.9
2,104.8
0.0
500.0
1,000.0
1,500.0
2,000.0
2,500.0
2015 2016 2017 2018 2019
(Billion yen)
Internet Advertising
TV Advertising
2019Internet
Advertising Expenditures
Over
2 trillionyen
In 2019, expenditures on internet advertising overtook TV advertising for the first time
Market Data– Comparative Shift in TV Advertising and Internet Advertising Expenditures –
Source: Graph created by the Company based on figures from 2019 Advertising Expenditures in Japan (Dentsu Inc.)
©2020 Net Marketing Co. Ltd. All right reserved.

23
This material was prepared by Net Marketing Co. Ltd. (hereinafter referred to as “the Company”) to increase understanding of the current status of the Company. The information contained in this material is derived from various sources including knowledge within the Company and public information available to the Company and the Company makes no guarantee of the accuracy of such information. The actual performance of the Company may differ due to a variety of factors.
©2020 Net Marketing Co. Ltd. All right reserved.