net debugging 2017
TRANSCRIPT

.NET
DEBUGGING
@TessFerrandez
Microsoft

Crashes
Performance Issues
Memory LeaksIssues that we can’t step by step debug
@TessFerrandez

MEMORY
DUMPS
User-mode dump
Snapshot of a process and the memory
it addresses
@TessFerrandez

Threads call stacks, stack objects
Modules dlls, exes
.NET Heap .net objects, sizes, info
@TessFerrandez

GATHERING
MEMORY DUMPS

TASK MANAGER
@TessFerrandez

PROCDUMP
Light-weight, no-install utility for generating dumps
Procdump –ma app.exe app.dmpProcdump –ma –h app.exe hang.dmpProcdump –ma –e app.exe crash.dmp Procdump –ma –c 90 app.exe cpu.dmp
@TessFerrandez

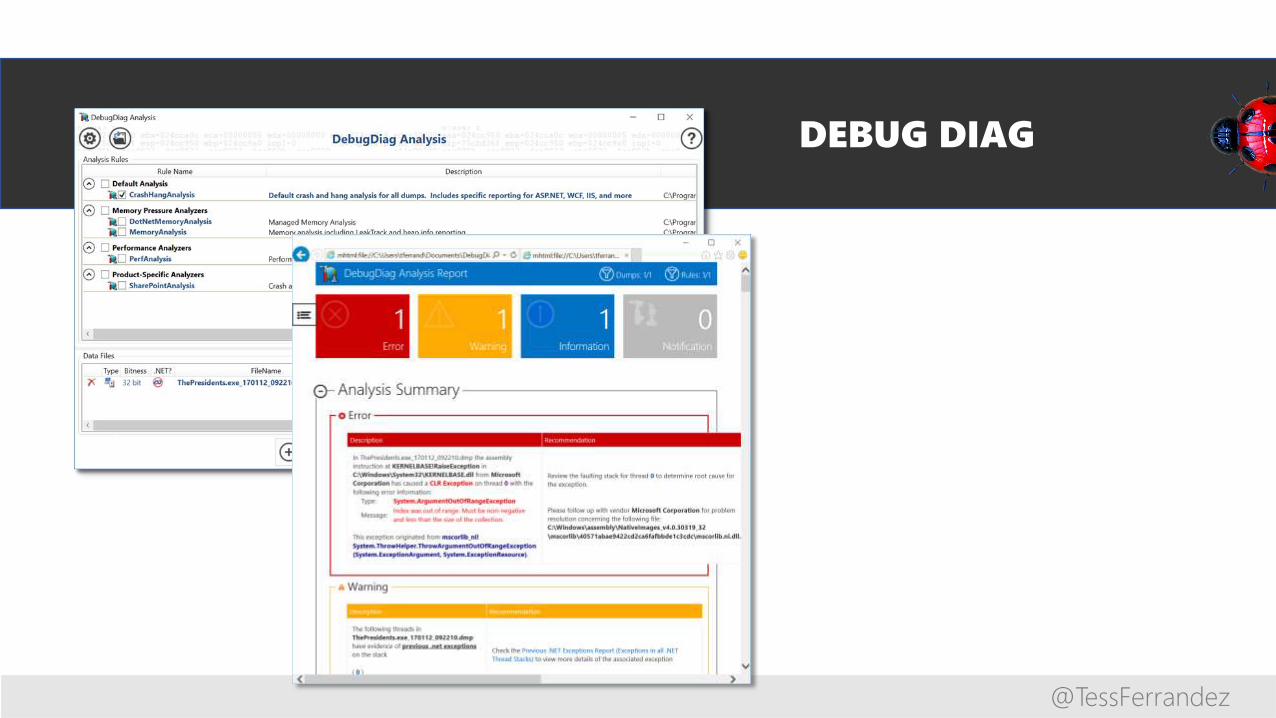
DEBUG DIAG
GUI tool to generate dumps based on rules and analyze dumps for common .net issues
@TessFerrandez

ANALYZING
MEMORY DUMPS

WINDBG
Native debugger
Installed with WDK and Debugging tools for Windows
@TessFerrandez
@TessFerrandez
DEBUG DIAG
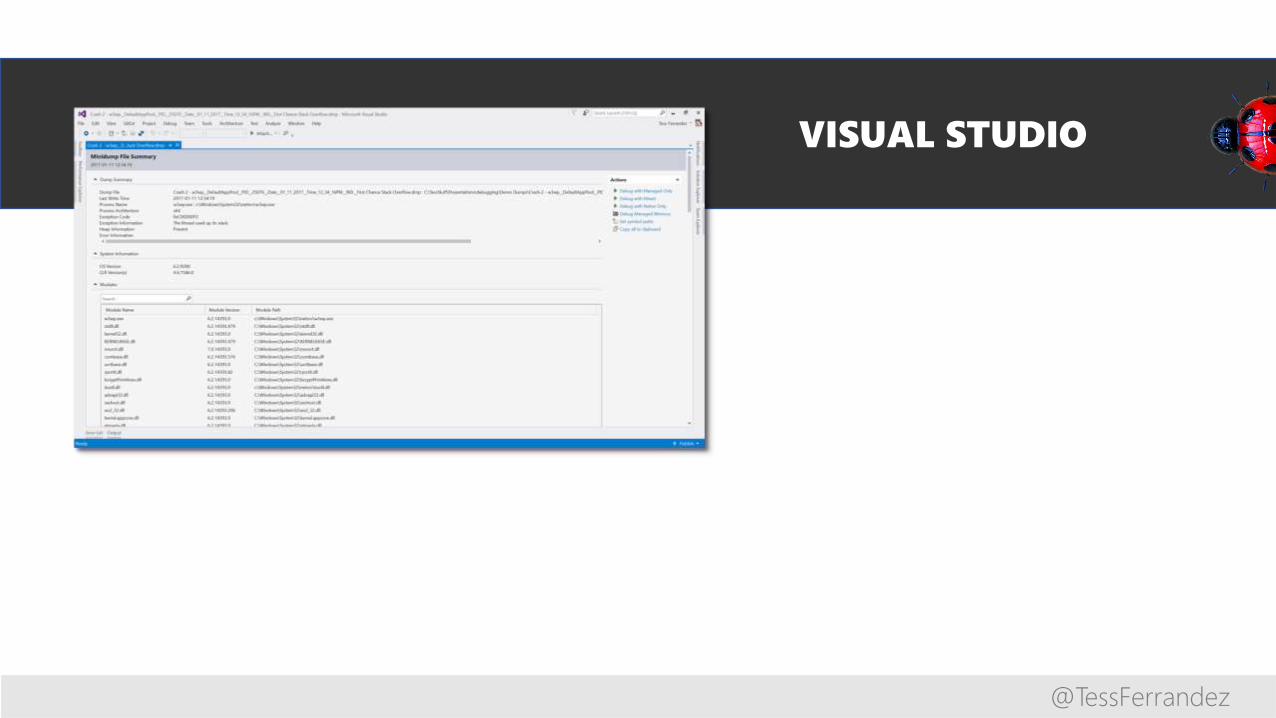
VISUAL STUDIO
@TessFerrandez

CRASHES

When I open an email with a pdf attachement that is
larger than 2 MB, a message box saying Unknown Error
shows up and then the process exits
Tess!!! the internet e-thingy is not working anymore

WHO
DUNNIT?
Unhandled Exception – 2nd chance
StackOverflowException
OutOfMemoryException
ExecutionEngineException
Kill or recycle

1 Check the event viewer
2 Capture dump on crash
3 Look at the faulting stack
@TessFerrandez

PERFORMANCE
ISSUES
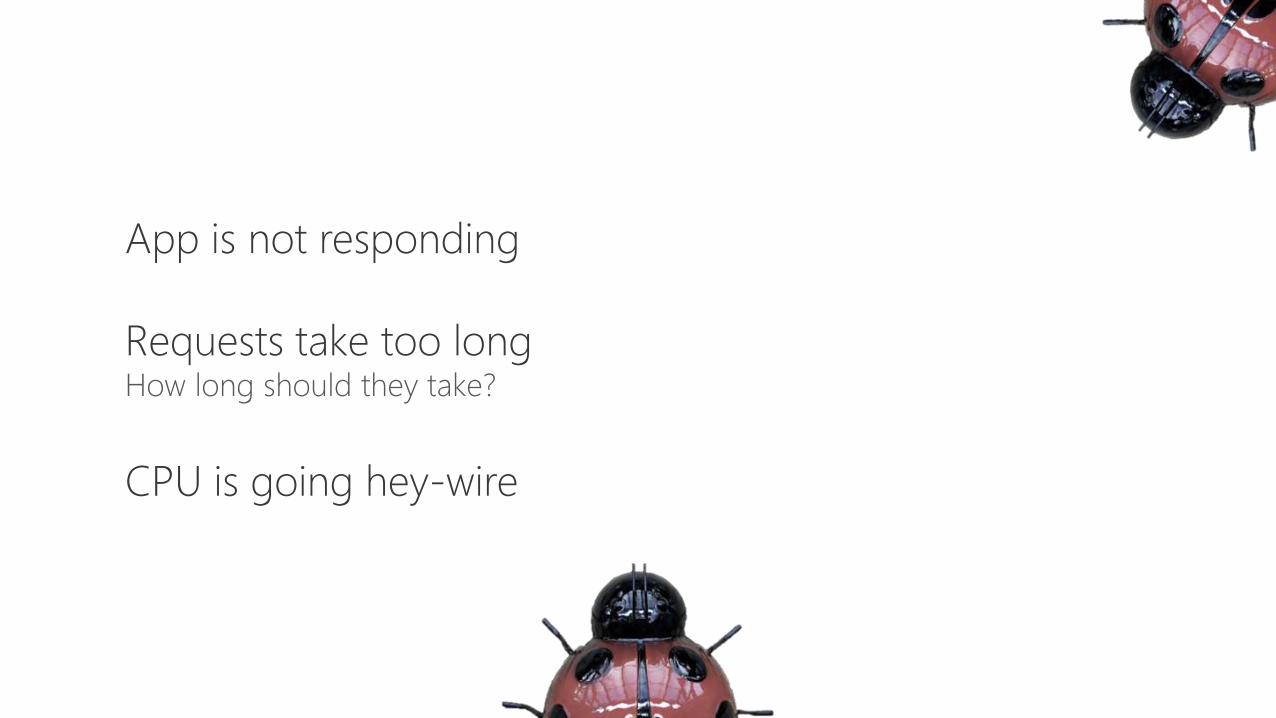
App is not responding
Requests take too longHow long should they take?
CPU is going hey-wire

WHO
DUNNIT?
LOW CPU
Waiting for an external resource
Deadlock
HIGH CPU
Busy, Tight loop
High CPU in GC
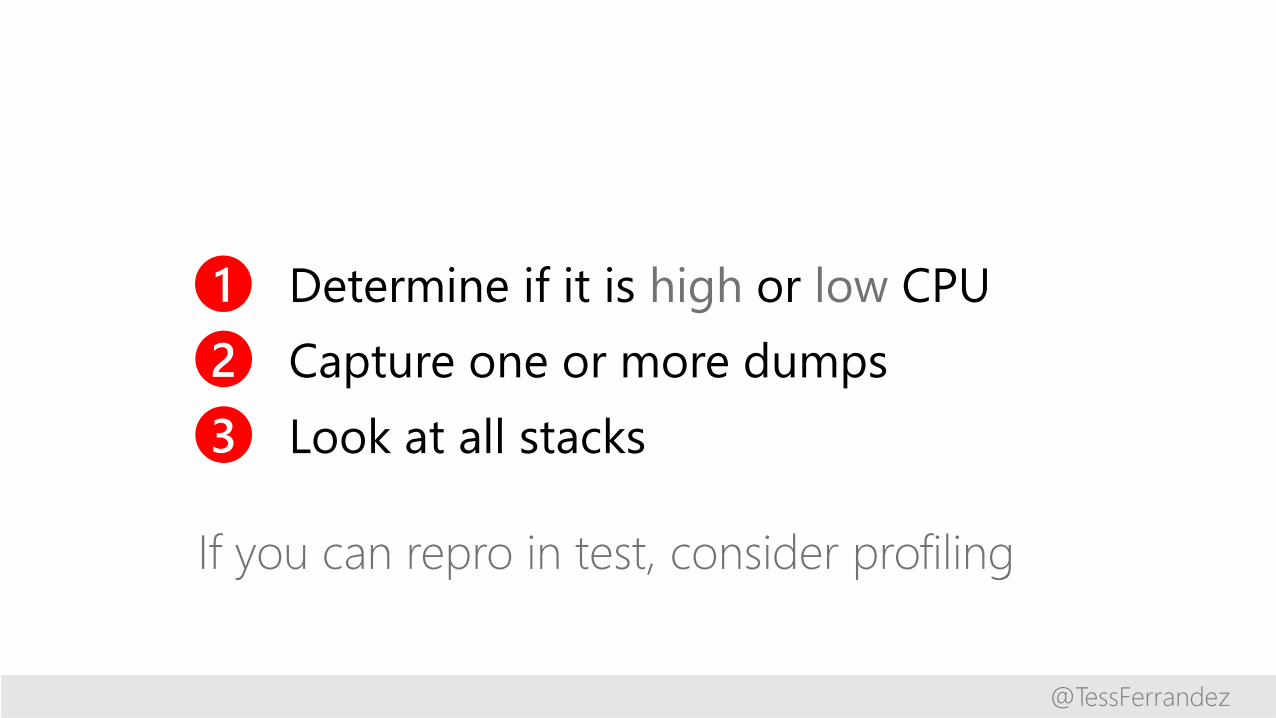
1 Determine if it is high or low CPU
2 Capture one or more dumps
3 Look at all stacks
If you can repro in test, consider profiling
@TessFerrandez

MEMORY
LEAKS
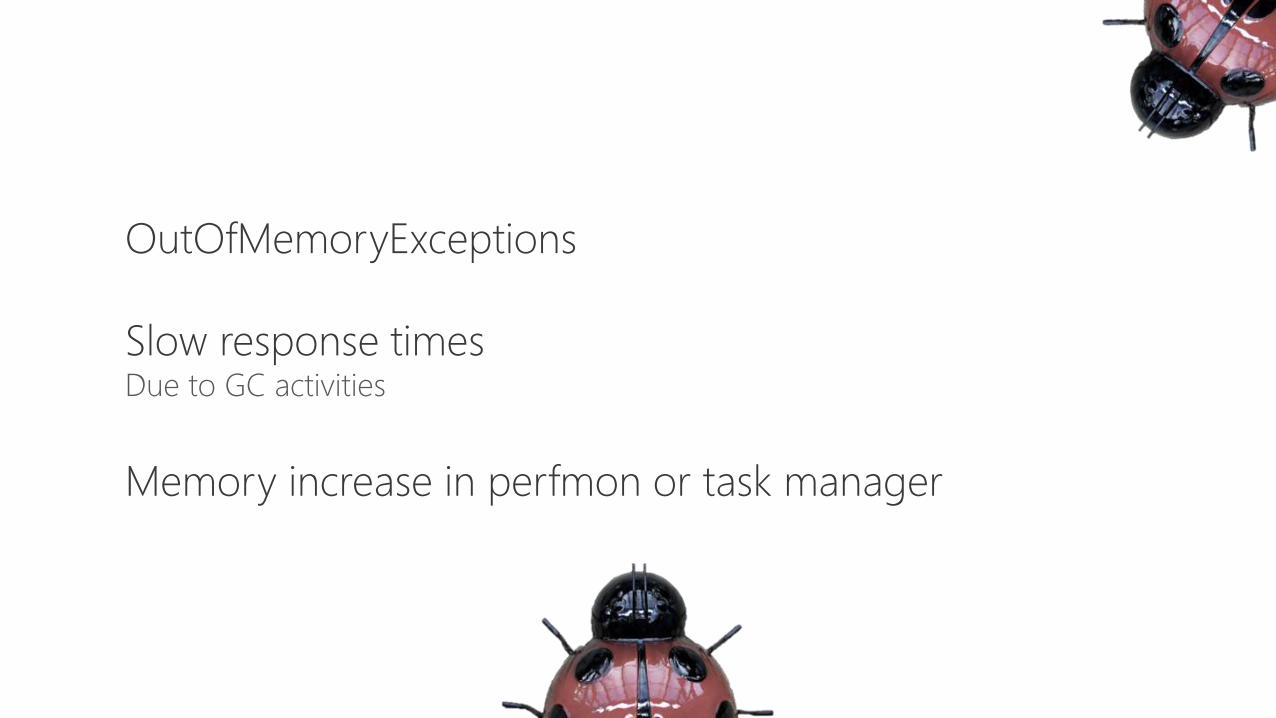
OutOfMemoryExceptions
Slow response timesDue to GC activities
Memory increase in perfmon or task manager

WHO
DUNNIT?
Cache or Session State
Static / Pinned
Blocked Finalizer
Assembly Leak
Native Leak
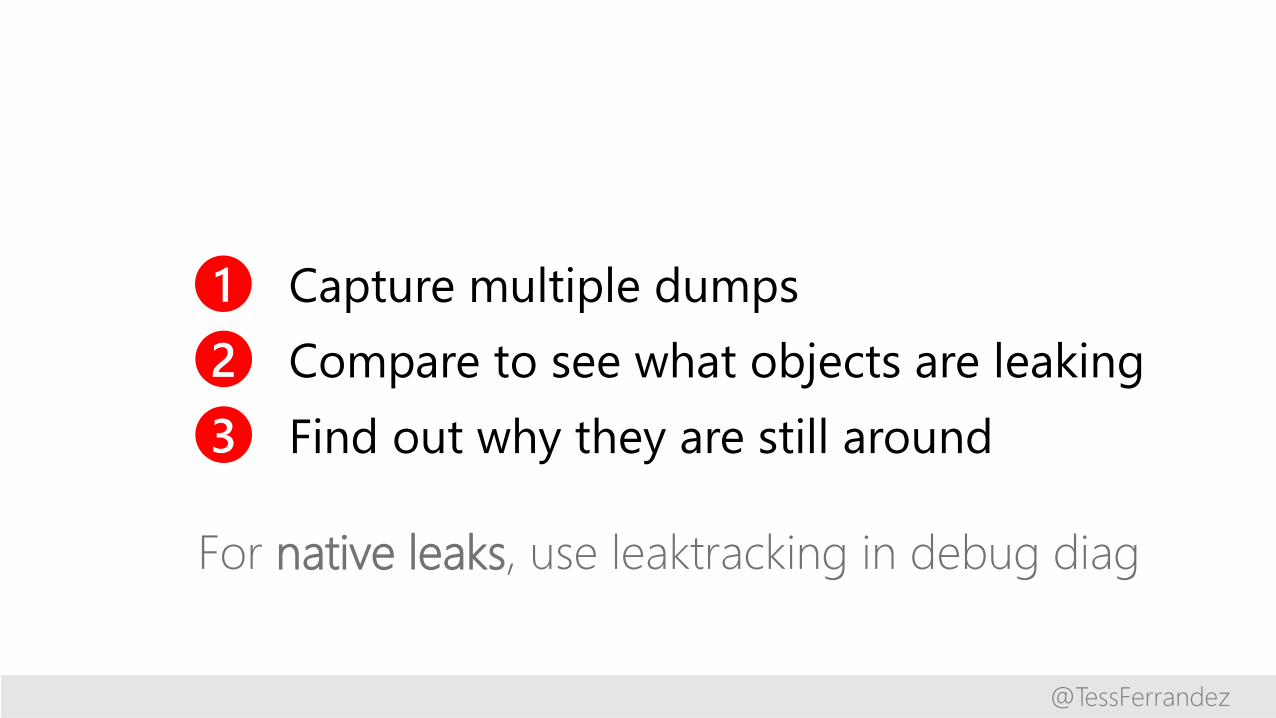
1 Capture multiple dumps
2 Compare to see what objects are leaking
3 Find out why they are still around
For native leaks, use leaktracking in debug diag
@TessFerrandez

AUTOMATION

CLRMD
@TessFerrandez
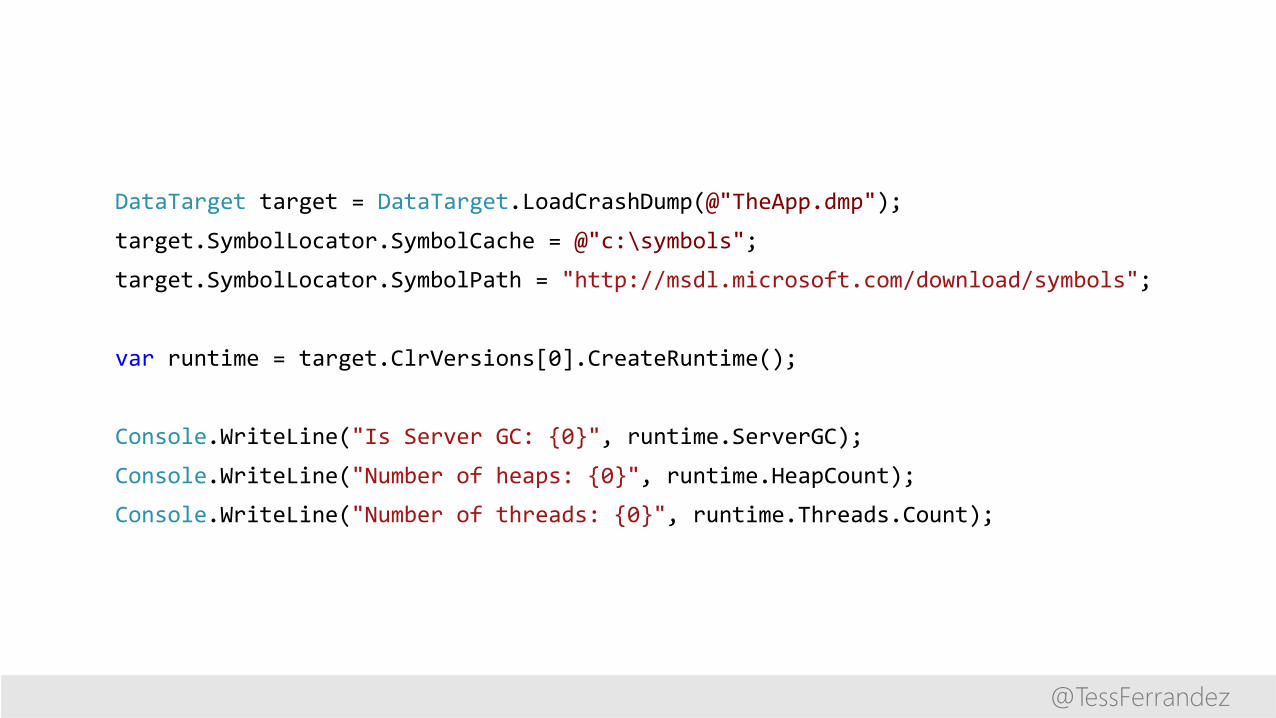
DataTarget target = DataTarget.LoadCrashDump(@"TheApp.dmp");
target.SymbolLocator.SymbolCache = @"c:\symbols";
target.SymbolLocator.SymbolPath = "http://msdl.microsoft.com/download/symbols";
var runtime = target.ClrVersions[0].CreateRuntime();
Console.WriteLine("Is Server GC: {0}", runtime.ServerGC);
Console.WriteLine("Number of heaps: {0}", runtime.HeapCount);
Console.WriteLine("Number of threads: {0}", runtime.Threads.Count);
@TessFerrandez

foreach (var thread in runtime.Threads) {
var e = thread.CurrentException;
if (e != null) {
Console.WriteLine("Thread {0}", thread.ManagedThreadId);
Console.WriteLine("\t{0} - {1}", e.Type.Name, e.Message);
foreach (var frame in e.StackTrace) {
Console.WriteLine("\t" + frame.DisplayString);
}
}
}
@TessFerrandez

.NET
DEBUGGING
@TessFerrandez
Microsoft