neries jra4 meeting rome 4 and 5 december 2006 task a: site selection monography of the station...
TRANSCRIPT

NERIESJRA4 Meeting
Rome 4 and 5 December 2006
TASK A: SITE SELECTION
Monography of the stationCATANIA
Station codeCAT__
Servizio Sismico Nazionale

Location of the site
General Site Information
Code CAT__
Site Name-Location CATANIA
Surface Geology So

Geographical Data
Latitude 37.446944
Longitude 15.046667
Altitude (m) 10
Location of the station
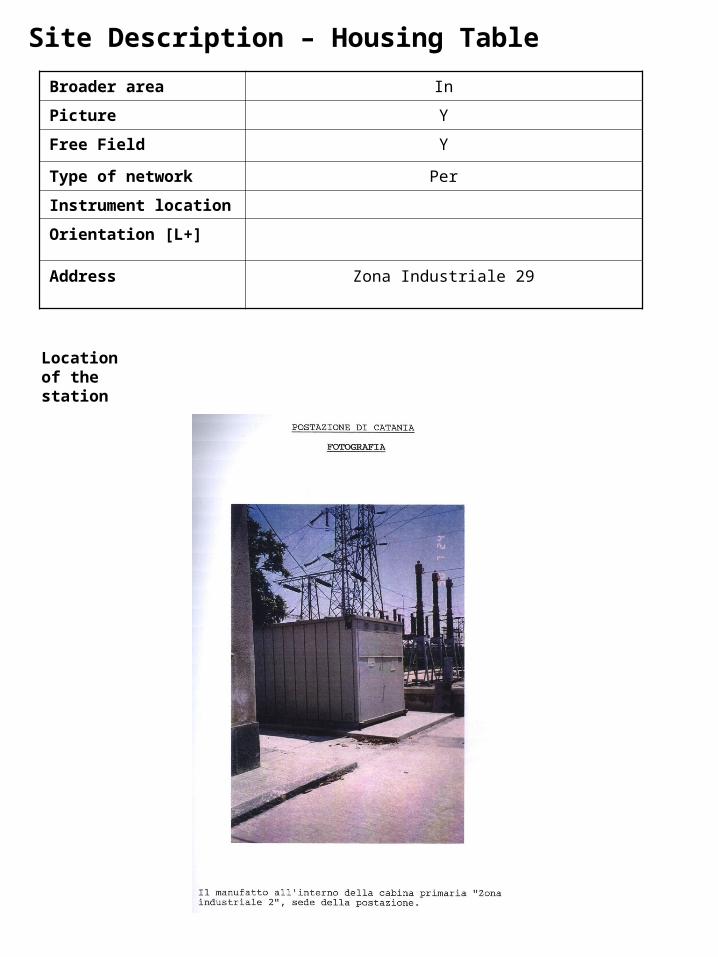
Broader area In
Picture Y
Free Field Y
Type of network Per
Instrument location
Orientation [L+]
Address Zona Industriale 29
Site Description – Housing Table
Location of the station
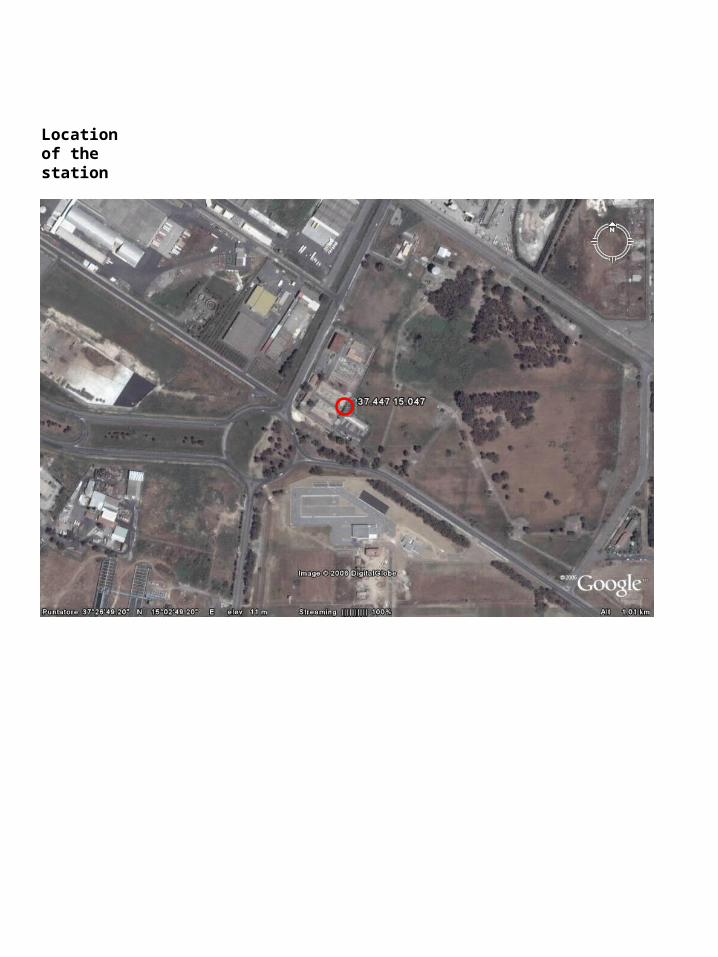
Location of the station

Earthquake Recordings
Type of Instrument A
Present Condition Act
Date of activation 1990/07/24
Date of deactivation
Strong Motion Records Y
number of records with PGA<0.1
number of records with PGA>=0.1 1
maximum recorded PGA (g) 0.247
Date of Max PGA recorded 1990/12/13
Source ENEA

Morfology Pl
Basin Geometry
Width
Depth
Length
Closest Distance from Edge (Km)
Morphological Data
View of the area

Geological Data
Geological map Y
Stratigraphy & Lithology
Y
Bedrock Depth (m) > 100 m
Ground water table Y
Water table depth 2 m

Geological map

Geological sketch
The creation of a database of about 860 boreholes provided the basis for a geotechnical zonation of the Catania municipal area; based on existing in situ tests (SPT, CPT, cross-hole and down-hole measurements) the mapping of the shear wave velocity for earthquake engineering purposes was carried out. All the borehole and in situ test data were stored in the database and the investigation sites located via GIS system (see 2.2).
To integrate the previous data, investigations were carried out for measuring the shear wave velocity by surface wave methods (see 2.3), in particular SASW investigations have been performed at beach sites south of the city (La Plaja), where saturated sand deposits exhibit a marked susceptibility to liquefaction. Laboratory cyclic tests were performed to characterise the non linear soil behaviour, which may occur during strong earthquakes, such as the 1693 scenario earthquake (see 1). Two boreholes were made, in which down-hole velocity measurements have been executed, and undisturbed samples were retrieved. Resonant column tests and cyclic loading torsional shear tests were performed to investigate the initial shear modulus Go and shear modulus degradation with shear strain, as well as damping ratio degradation (2.4).
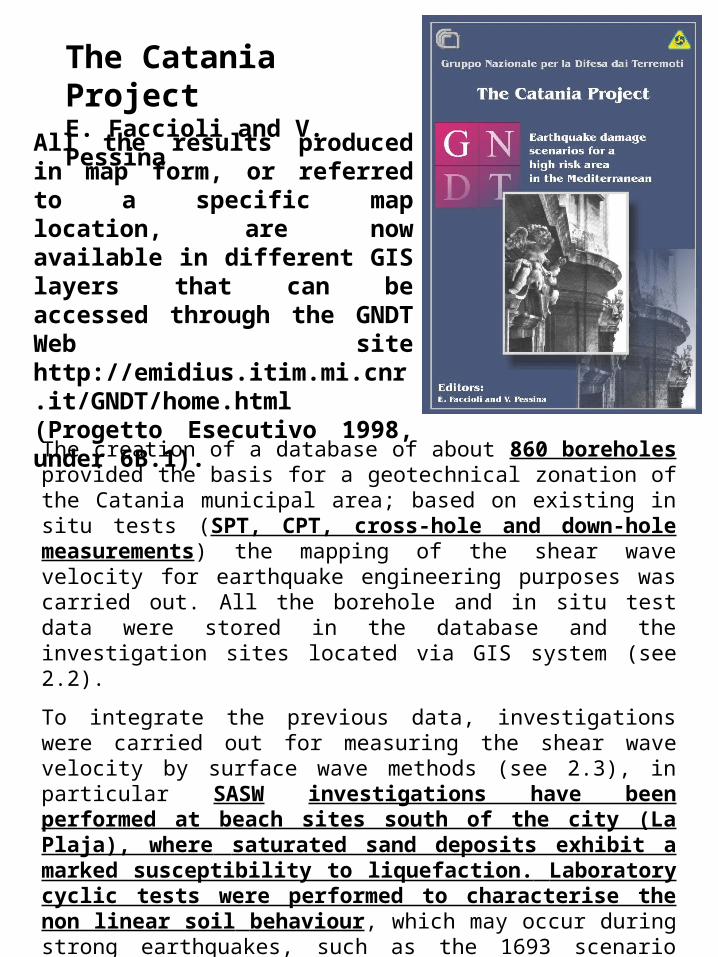
The Catania ProjectE. Faccioli and V. Pessina
All the results produced in map form, or referred to a specific map location, are now available in different GIS layers that can be accessed through the GNDT Web site http://emidius.itim.mi.cnr.it/GNDT/home.html (Progetto Esecutivo 1998, under 6B.1).

Geognostic Investigation
In-Situ Test Y
Survey’s Year 1999
Borehole stratigraphy Y
SPT Y
SPT-max. depth 40 m
CPT Y
CPT-max. depth 40 m
Survey’s closest distance from station (m)
100 m
Raw data availability Y
Type of raw data D
References E. Faccioli and V. Pessina “The Catania Project”

E. Faccioli and V. Pessina “The Catania Project”

E. Faccioli and V. Pessina “The Catania Project”
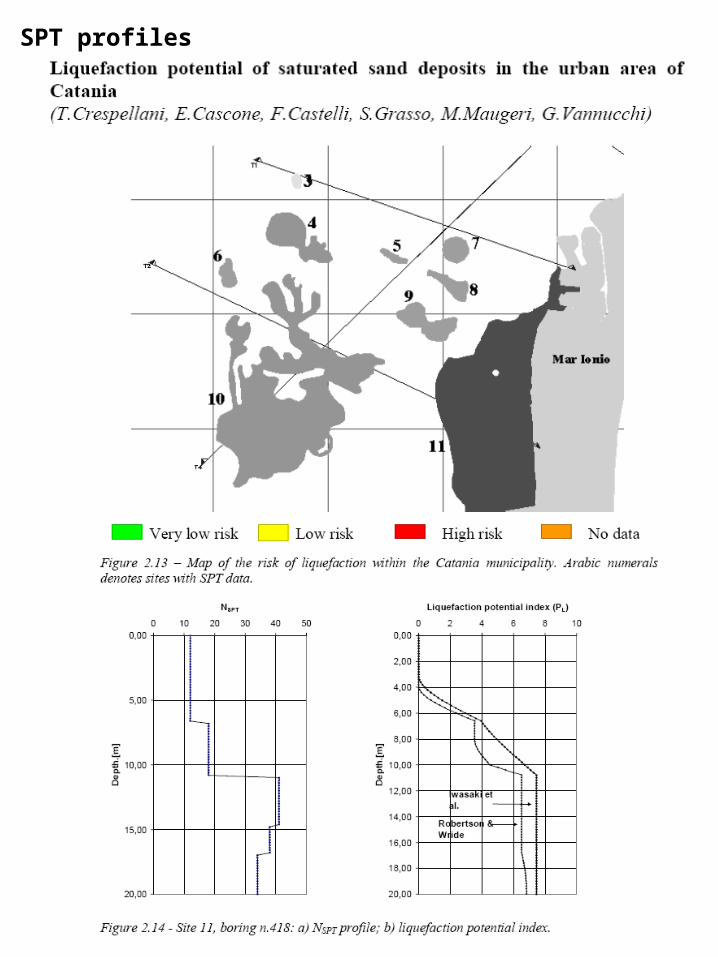
SPT profiles

Geotechnical Laboratory Analysis
Lab. Test Y
Survey’s Year 1999
Y
Resonant Column Test (G-g-D curves)
Y
Torsional Shear Test Y
Triaxial Cyclic Loading Test N
Survey’s closest distance from station (m)
100 m
Raw data availability Y
Type of raw data D
References E. Faccioli and V. Pessina “The Catania Project”

Resonant Column Test and Torsional Shear Test

E. Faccioli and V. Pessina “The Catania Project”
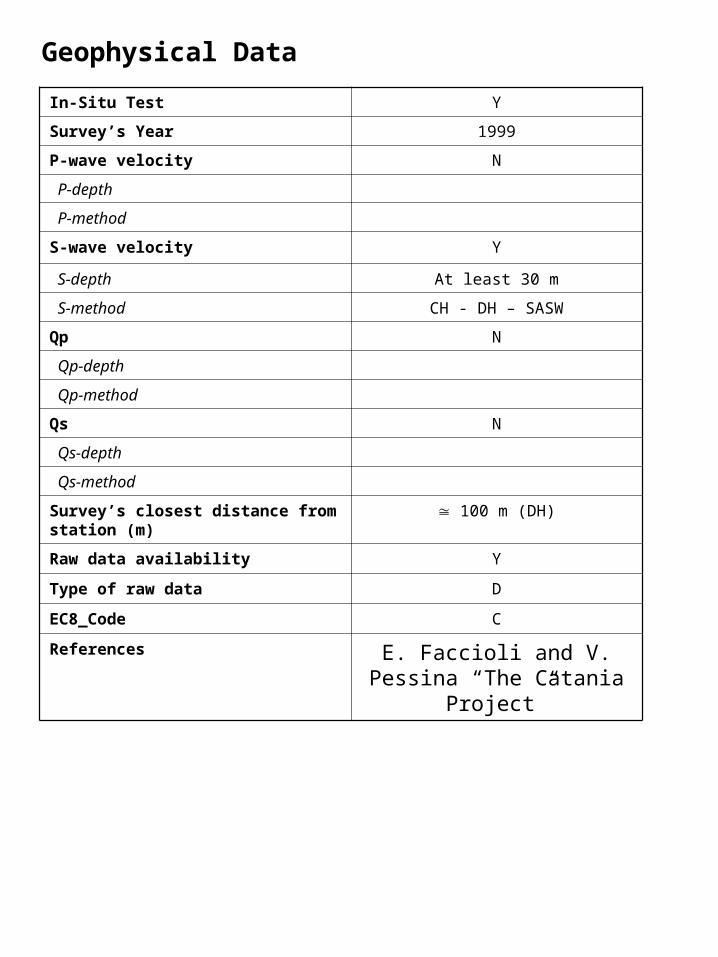
Geophysical Data
In-Situ Test Y
Survey’s Year 1999
P-wave velocity N
P-depth
P-method
S-wave velocity Y
S-depth At least 30 m
S-method CH - DH – SASW
Qp N
Qp-depth
Qp-method
Qs N
Qs-depth
Qs-method
Survey’s closest distance from station (m)
100 m (DH)
Raw data availability Y
Type of raw data D
EC8_Code C
References E. Faccioli and V. Pessina “The Catania Project”

Vs30 Map
E. Faccioli and V. Pessina “The Catania Project”
DH – CH - SASW
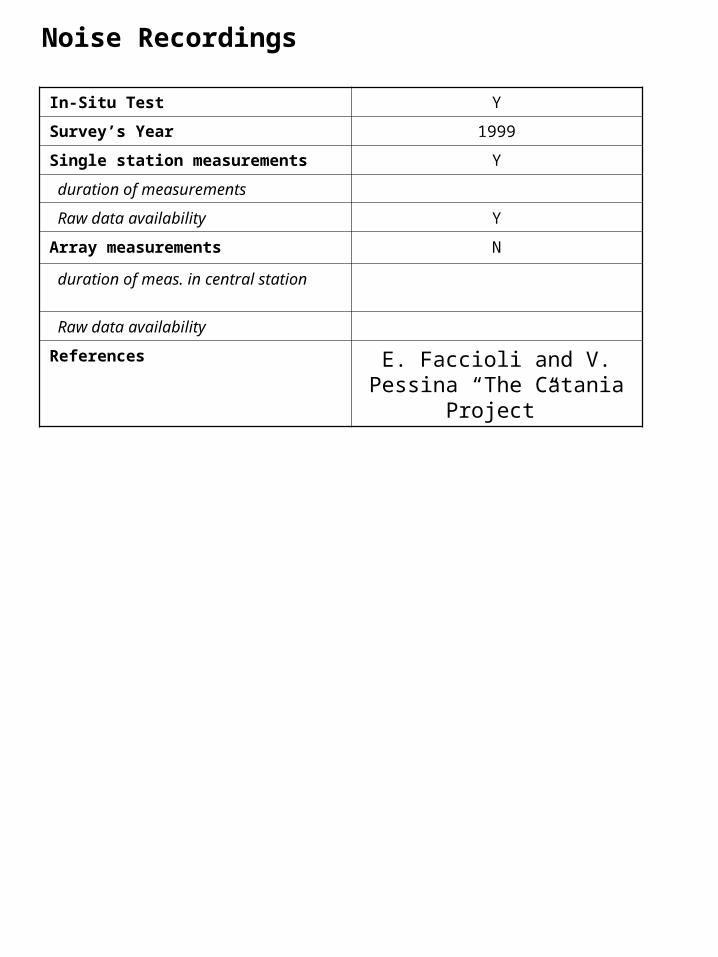
Noise Recordings
In-Situ Test Y
Survey’s Year 1999
Single station measurements Y
duration of measurements
Raw data availability Y
Array measurements N
duration of meas. in central station
Raw data availability
References E. Faccioli and V. Pessina “The Catania Project”

E. Faccioli and V. Pessina “The Catania Project”

E. Faccioli and V. Pessina “The Catania Project”

Vs Profile - FTAN

Site Response
Site Response Analysis Y
Survey’s Year 1999
Experimental Studies Earthquake Records
Y
Experimental Studies Ambient Noise Records
Theoretical Studies 1D Y
Theoretical Studies 2D
Theoretical Studies 3D
References E. Faccioli and V. Pessina “The Catania Project”