neri seminar assessing funding models for water services provision
TRANSCRIPT

Assessing Funding Models for Water Services
Provision
Dr. Tom McDonnellNERI (Nevin Economic Research Institute)[email protected]
NERI Seminar Series12th November 2014

The Current Context• Proposals are made in the context of the decision to introduce
water charges.• The United Nations General Assembly has recognized the right of
every human being to have access to sufficient water for personal and domestic uses (between 50 and 100 liters of water per person per day), which must be safe, acceptable and affordable
• The change in funding model to one based on user charges is regressive and raises serious affordability issues for low income households.
• Based on the premise that water charges remain in place I consider various charging models and assess them against a set of ‘sustainability dimensions’

Trade-off between policy objectives
• Policy pursues multiple objectives beyond the provision of clean, consistent and secure water– These objectives can be structured around four ‘sustainability
dimensions’
1. Economic efficiency2. Environmental sustainability3. Financial sustainability4. Social concerns
• Also public finance considerations

Full supply costs
• Full supply or financial costs:– Operation and maintenance costs, associated with daily running of the
water supply system, such as electricity for pumping, labour and repair costs;
– Capital costs, covering both capital for renewal investment of existing infrastructure and new capital investment costs;
– In addition, there is the cost of servicing debt
• Pre-Irish Water• Cost of water and wastewater services in 2010:
– OPEX = €715 million– CAPEX = €500 million+ (Central Government gave Local Authorities between €529
million and €544 million annually for CAPEX between 2007 and 2009)• Cost of water and wastewater services in 2014:
– €1.4 billion (€817 million in opex and €608 million in capex)

The ‘on book’ and ‘off book’ dance related to domestic water charges and reliefs
(there is also a €533 million contribution from the Local Government Fund)
Funding Source (€ millions) Yield from non-domestic charges 240 Revenue from non-domestic charges lost to the exchequer (240) Yield from domestic charges 300 Equity investment in Irish Water 222
Total 522
less compensatory fiscal measures Income tax relief for water charges (40) Change to Household Benefits Package (42) Change to Fuel Allowance (24)
Net fiscal impact 416

Full cost of water
• Full cost of water =
Full supply costs + economic costs + environmental externalities + administrative and governance costs
• Economic externalities:– Costs to producers and consumers (upstream and downstream)
• Environmental externalities:– Costs to public health and ecosystems
• Administrative and governance costs:– Regulating the service, institutional capacity building, cost of
implementing and devising policy etc
Objective 1:Economic efficiency
• Goal:– Water is allocated to the most beneficial uses
• Allocation of resources to uses of highest value to economy– Compare costs with value
• Measurement issues
– Is water a merit good? – if so, this means we want a non-zero allocation for each household
• What is the appropriate role of the regulator? – Pricing as the allocation mechanism
• Achieving economic efficiency:– Long run marginal cost pricing (economies of scale)– Requires metering
Objective 2:Environmental sustainability
• Goals:– Ecological preservation– Minimise waste
Supply side and demand side elements
• Emphasise demand side solutions to water scarcity– Encourage water saving– Discourage wasteful use– Volumetric pricing – polluter pays principle
• Supply side is still important (requires capex)– Fixing leaks– Efficient distribution– Suggests different prices for different regions (different supply costs)

Objective 3:Financial sustainability
• Goals:– To appropriately compensate resource inputs
• i.e. capital and labour
– To minimise lifecycle costs (cost efficiency)• Cost of creating physical capital• Operation costs• Maintenance costs
• Financial sustainability requires Full Cost Recovery (FCR)– In addition,
• Technological improvements and productivity gains are a function of continuous investment in physical and human capital
• CER is going to use an RPI – X model to determine the utility’s allowable revenue based on efficient spending opex, capex and an opening RAB of just over €1 billion– RPI – X is a revenue cap model and is often called the glide path formula
• Best practice for natural monopoly with economies of scale?– Marginal cost pricing is inconsistent with financial sustainability– Financing the renewal of infrastructures – fixed payments– Suggests a dual charging structure (fixed and volumetric components)
• but– How do we cope with affordability issues ?
Objective 4:Social concerns
• Goal:– Equal access to water at affordable prices
• Linking water access to water need• Equitable sharing of the cost of water resources• Structuring of tariffs so that lower-income users can have affordable access
• Moving from general taxation to a system of volumetric water charges is regressive and without additional policy measures will increase poverty
• Universal free allowances address ‘macro-affordability’ issues (indicators related to national averages) but this completely misses the point– The real policy concern is the ‘micro-affordability’ issue (indicators related to particular groups
e.g. those on low income)– A key indicator is the percentage of disposable income that the poorest income deciles end up
paying for water
Policy Trade-offs (1-3)
• Trade-off 1:– Ecological sustainability vs. Social concerns
• Environmental ‘user/polluter pays’ volumetric pricing may not provide affordable water for those on low incomes
• Trade-off 2:– Ecological sustainability vs. Financial sustainability
• Higher environmental standards will increase the cost of water provision
• Trade-off 3:– Ecological sustainability vs. Economic sustainability
• The most efficient ‘high value’ allocation (in terms of financial rate of return) may not be consistent with water saving/preservation
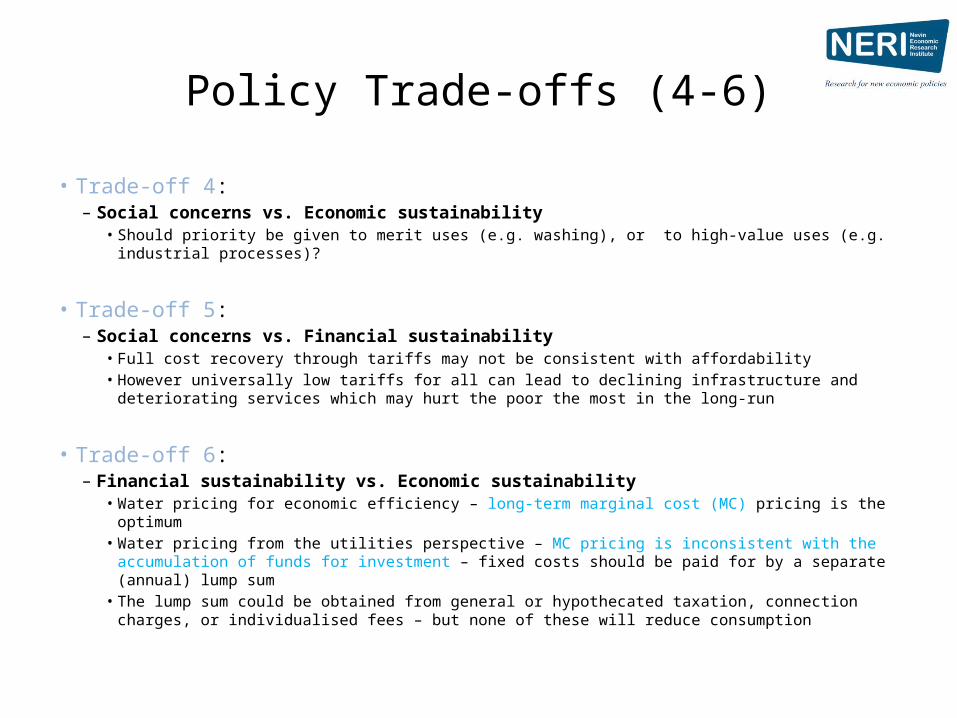
Policy Trade-offs (4-6)
• Trade-off 4:– Social concerns vs. Economic sustainability
• Should priority be given to merit uses (e.g. washing), or to high-value uses (e.g. industrial processes)?
• Trade-off 5:– Social concerns vs. Financial sustainability
• Full cost recovery through tariffs may not be consistent with affordability• However universally low tariffs for all can lead to declining infrastructure and deteriorating services
which may hurt the poor the most in the long-run
• Trade-off 6:– Financial sustainability vs. Economic sustainability
• Water pricing for economic efficiency – long-term marginal cost (MC) pricing is the optimum• Water pricing from the utilities perspective – MC pricing is inconsistent with the accumulation of
funds for investment – fixed costs should be paid for by a separate (annual) lump sum• The lump sum could be obtained from general or hypothecated taxation, connection charges, or
individualised fees – but none of these will reduce consumption

The affordability question
• Consumptions charges are regressive and impact disproportionately on the poorest households
• Switching the funding model from one based on government subsidies (general taxation), to one based on user charges reduces the progressivity of the overall system of taxes and benefits.
• A ‘free’ universal allocation of water for everyone might sound like equality, but in reality this is inefficient and wasteful– It means general taxation is subsidising wealthier households who can afford to pay for
the water they use
• A small free universal allowance will not address the affordability issue while a large free allowance undermines the other three objectives
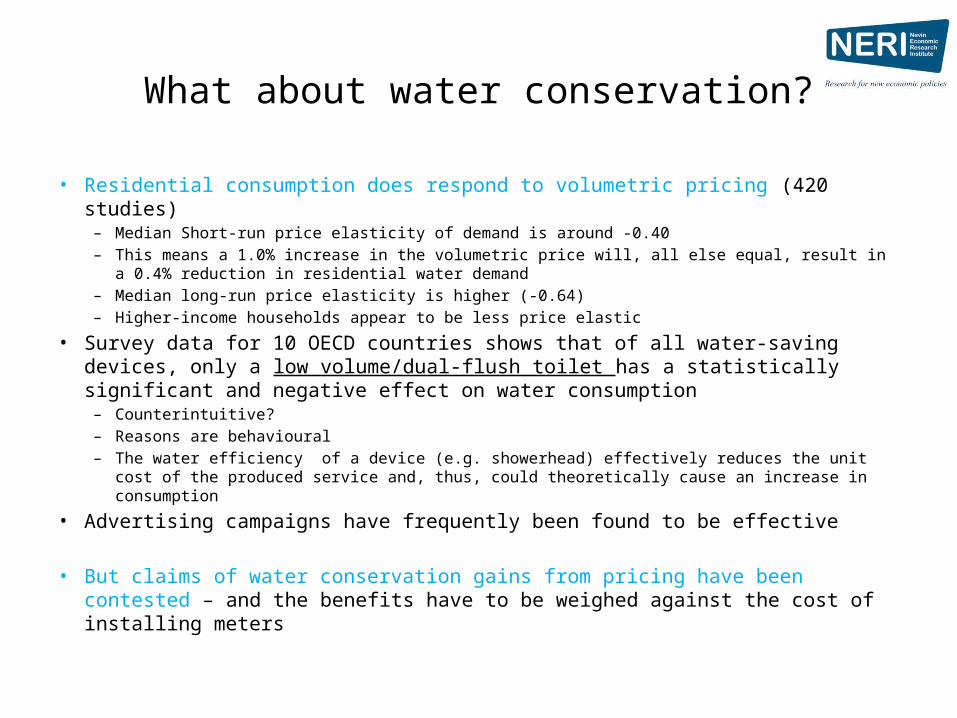
What about water conservation?
• Residential consumption does respond to volumetric pricing (420 studies)– Median Short-run price elasticity of demand is around -0.40– This means a 1.0% increase in the volumetric price will, all else equal, result in a 0.4% reduction in
residential water demand– Median long-run price elasticity is higher (-0.64)– Higher-income households appear to be less price elastic
• Survey data for 10 OECD countries shows that of all water-saving devices, only a low volume/dual-flush toilet has a statistically significant and negative effect on water consumption– Counterintuitive?– Reasons are behavioural– The water efficiency of a device (e.g. showerhead) effectively reduces the unit cost of the
produced service and, thus, could theoretically cause an increase in consumption
• Advertising campaigns have frequently been found to be effective
• But claims of water conservation gains from pricing have been contested – and the benefits have to be weighed against the cost of installing meters

Potential revenue sources from domestic users
1. Connection fees– Paying for installation
2. Recurrent fixed charge (flat fees)– Uniform across customers, or– Differentiated: • i.e. linked to customer characteristics (hedonic system)
3. Volumetric charge– (Volumetric rate) X (volume of water consumed) • Requires a metering system in place• Can also be uniform or differentiated

Potential revenue structures
• Flat rates in a non-metered environment– Uniform rates or differentiated rates
• Volumetric rates in a metered environment– Can be uniform or differentiated– Possibly supplemented by a recurrent fixed charge– A supplementary fixed charge can itself be uniform or
differentiated and may even be negative• A negative fixed charge effectively generates a free allowance under the
volumetric system
• Block tariffs in a metered environment– Volumetric charges or flat rates – (uniform or differentiated) – Charge/rate increases or decreases for each block
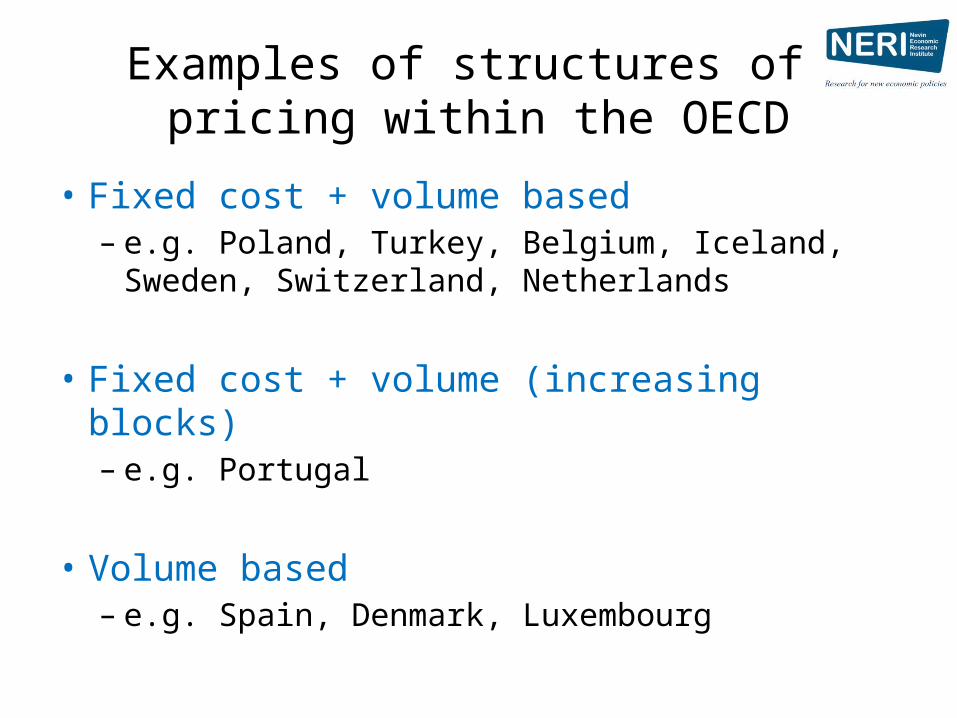
Examples of structures of pricing within the OECD
• Fixed cost + volume based – e.g. Poland, Turkey, Belgium, Iceland, Sweden,
Switzerland, Netherlands
• Fixed cost + volume (increasing blocks) – e.g. Portugal
• Volume based – e.g. Spain, Denmark, Luxembourg

Comparative assessment of charging bases against fairness principles (Walker, 2009)
Principle Flat rate Volumetric Rateable Value Household Occupancy
Bedrooms Property Type
Water efficiency incentive
No Yes No No No No
Cost-related No It can be No No No No
Polluter pays No Yes No Partly No No
Affordable No No No No No No
Fair to companies Yes Yes Yes Yes Yes Yes
Simple and transparent
Yes Yes No Yes No No
Administratively feasible
Yes Yes Yes No Yes Yes

Unit price of water supply and sanitation services to households, including taxes, in OECD countries
(2008)
Country Price Country Price
Denmark €5.43 Poland €1.72
Scotland €4.63 Hungary €1.64
Finland €3.57 New Zealand €1.60
Flanders (Belgium) €3.35 Spain €1.56
Wallonia (Belgium) €3.18 Japan €1.50
England & Wales €3.09 Canada €1.28
France €3.03 Italy €1.17
Sweden €2.91 Greece €1.13
Switzerland €2.54 Portugal €1.00
Austria €1.98 Korea €0.62
Czech Republic €1.97 Mexico €0.40

Annual water and sewerage household bills in Great Britain
Water and sewerage company
Average bill for 2011/12
Forecast average bill for 2013/14
South West €608 €587/€646*
Wessex €504 €562 Dŵr Cymru €484 €511
Anglian €468 €511 Southern €467 €528
United Utilities €442 €478
Yorkshire €399 €433 Northumbrian (North East) €395 €422
Scottish Water €381 €393
Thames €375 €416
Severn Trent €366 €394
Industry Average €444 €476*

Average water and wastewater bills for the lowest income decile in 2005
Country % of disposable
income
Country % of disposable
income
Country % of disposable
income Turkey 10.3 Belgium 2.4 Greece 1.4 Poland 9.0 France 2.2 Switzerland 1.4 Slovakia 5.3 USA 2.2 Canada 1.3 Hungary 4.8 UK 2.1 Norway 1.2 Czech Rep. 3.9 Australia 2.1 Korea 1.1 Germany 3.5 Spain 2.0 Italy 1.1 New Zealand 3.3 Austria 1.7 Netherlands 1.1 Mexico 3.1 Luxembourg 1.6 Sweden 1.1 Denmark 3.0 Finland 1.6 Iceland 0.8 Portugal 2.7 Japan 1.5

Commission for Energy Regulation Proposals
• Government decision to set average household cost for all types of household at €238– Implies revenue from domestic users of somewhere just north of €300
million (post universal allowances and including non primary residences)
– Decisions re household benefits package, fuel allowance and income tax relief cost €106 million
• All types of household includes households with septic tanks and those on group water schemes– Implies ‘other’ households will have an average cost in excess of €238– 1.35 million domestic properties connected to public water supplies

Allowances & Consumption
Allowances• ‘Free’ Household Allowance of 30,000 litres• Child Allowance reduced from 38 to 21,000l
Assumed Consumption• The assumed adult consumption is 66,000l
– previous working assumption was 55,000l
• Every additional adult consumption 21,000l
• No recurrent fixed charge• Value of the household subsidy (water and wastewater) is €146 per
household
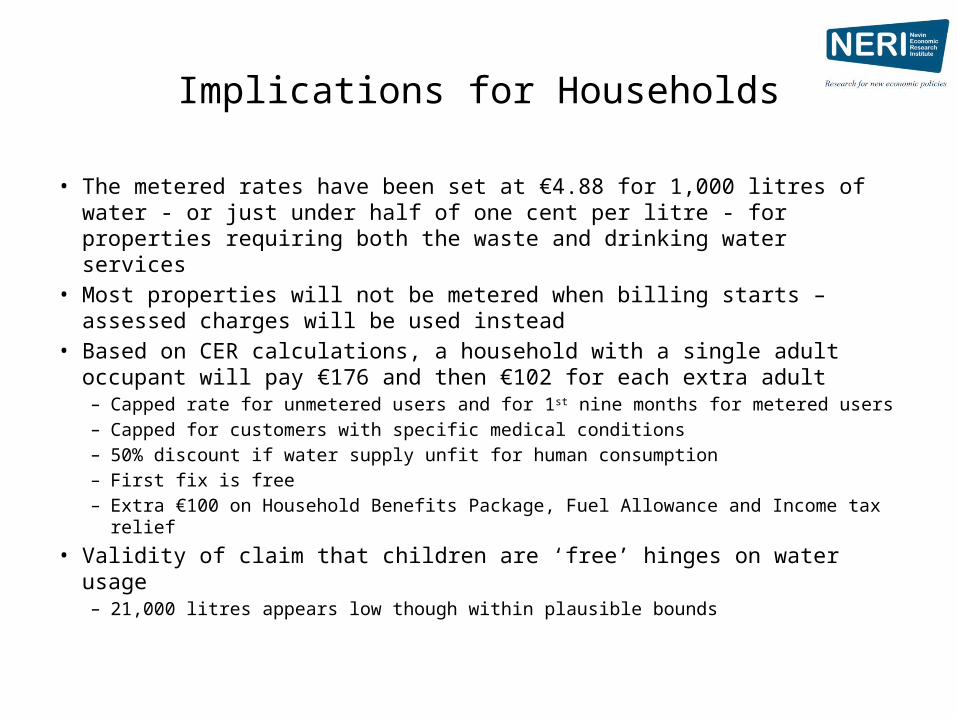
Implications for Households
• The metered rates have been set at €4.88 for 1,000 litres of water - or just under half of one cent per litre - for properties requiring both the waste and drinking water services
• Most properties will not be metered when billing starts – assessed charges will be used instead
• Based on CER calculations, a household with a single adult occupant will pay €176 and then €102 for each extra adult– Capped rate for unmetered users and for 1st nine months for metered users– Capped for customers with specific medical conditions– 50% discount if water supply unfit for human consumption– First fix is free– Extra €100 on Household Benefits Package, Fuel Allowance and Income tax relief
• Validity of claim that children are ‘free’ hinges on water usage– 21,000 litres appears low though within plausible bounds

What is affordable?
• How can affordability be assessed?– By comparing the water bill to the users capacity-to-pay
• How do we measure capacity-to-pay?– By looking at disposable income (perhaps post expenditure on essential
services e.g. healthcare/energy)
• What are the absolute levels of water affordability?– A reasonable affordability goal might be to ensure the cost of water does not
exceed 1.5% to 2% of disposable income for the lowest income decile group
• ESRI study – Water poverty concentrated in the bottom two income deciles– household benefits package is badly targeted as a measure to address water
poverty

Water affordability under the Government’s July 2014 plan – a regressive structure, (€)
Decile Gross Household
Income
Disposable Household
Income
1 Adult Household
Bill
1 Adult Share
of Income
2 Adult Household
Bill
2 Adult Share
of Income
3 Adult Household
Bill
3 Adult Share
of Income
4 Adult Household
Bill
4 Adult Share
of Income
Bottom 8,675.89 8,657.62 176 2.0% 278 3.2% 380 4.4% 482 5.6%
2nd 15,317.67 15,289.46 176 1.2% 278 1.8% 380 2.5% 482 3.2%
3rd 21,949.04 21,804.00 176 0.8% 278 1.3% 380 1.7% 482 2.2%
4th 27,852.17 27,368.66 176 0.6% 278 1.0% 380 1.4% 482 1.8%
5th 34,795.24 33,814.83 176 0.5% 278 0.8% 380 1.1% 482 1.4%
6th 43,264.32 40,708.83 176 0.4% 278 0.7% 380 0.9% 482 1.2%
7th 55,139.07 49,716.98 176 0.4% 278 0.6% 380 0.8% 482 1.0%
8th 70,347.16 61,010.92 176 0.3% 278 0.5% 380 0.6% 482 0.8%
9th 93,277.24 76,537.41 176 0.2% 278 0.4% 380 0.5% 482 0.6%
Top 159,018.00 118,250.49 176 0.1% 278 0.2% 380 0.3% 482 0.4%
Tariff design and affordability
• How do we protect vulnerable groups?– The key consideration is not average tariff levels
• Reducing average tariff levels through a universal free allowance actually reduces the scope for affordability measures for lower income groups
• Key questions:– What are the redistributive/affordability criteria?– What are the best non-tariff instruments?
– Income support– or– Subsidised payments
– What are the subsidisation criteria?– Universal? – human rights argument– Household income?– Household size?– Geographic location?– Category based? e.g. the unemployed, disabled, or over 65s
– Is cross-subsidisation a possibility– Higher tariffs for better off user groups– Politically and administratively difficult

Common affordability measures for domestic users (out of 30 OECD countries in 2005)
Measure Number of Countries
Measure Number of Countries
Income support for low-income households
30 Unmetered (cheap flat rate tariff)
9
No disconnection of water supply for low-income households in arrears
14 Targeted assistance (grants or forgiveness of arrears for low-income households)
8
Subsidies for water supply and/or sanitation over 30% of total service cost
13 No fixed fee (only proportional fee)
6
Progressive water tariff in general use 13 Reduced waste water tax or other water charges for low-income groups
3
Social water tariff (reduced price for certain groups of users)
12 Provision of a first block at zero price for low-income households or all households
3
VAT on water below normal rate 11

Comparison of affordability measures
Model Admin. complexity
Subsidises Size of subsidy Cost borne by Socio-environment benefits
Cost to exchequer
Universal Free Allowance
Low All Fixed General taxation Low Highest
Direct cash transfer
Low/medium Lower income households
Variable (can be fixed)
General taxation High (but risks)
Income related water credits
Medium/high Lower income households (tapered)
Variable General taxation Medium
Cross-subsidisation
High Lower income households
Variable (sometimes negative)
High income users
Medium/high Lowest
Social tariffs Low/medium Defined groups Fixed General taxation Medium

Illustrative water credits based charging structure (€)
(Based on 1.3 million domestic customers)gross yield of €500 million – net contribution of €300 million
Decile Gross Household
Income
Disposable Household
Income
Gross Average
Household Bill
Scale of Subsidy
Value of Subsidy
Net Average
Household Bill
Net Average Household
Bill as Share of Income
Gross Capped
Bill
Net Capped
Bill
Net Capped Bill as
Share of Income
Bottom 8,675.89 8,657.62 385 100% 385 0 0% 450 0 0%
2nd 15,317.67 15,289.46 385 100% 385 0 0% 450 0 0%
3rd 21,949.04 21,804.00 385 80% 308 77 0.4% 450 90 0.4%
4th 27,852.17 27,368.66 385 60% 231 154 0.6% 450 180 0.7%
5th 34,795.24 33,814.83 385 40% 154 231 0.7% 450 270 0.8%
6th 43,264.32 40,708.83 385 20% 77 308 0.8% 450 360 0.9%
7th 55,139.07 49,716.98 385 0% 0 385 0.8% 450 450 0.9%
8th 70,347.16 61,010.92 385 0% 0 385 0.6% 450 450 0.7%
9th 93,277.24 76,537.41 385 0% 0 385 0.5% 450 450 0.6%
Top 159,018.00 118,250.49 385 0% 0 385 0.3% 450 450 0.4%
Average 385 40% 154 231

Conclusion• Options are discussed purely in the context of a regime based on domestic water charges.• Within that context:
– Market is a natural monopoly – single provider makes sense – Must be regulated– Volumetric component crucial for environmental and economic considerations – Regulatory
decision– Allowable revenue base for the utility (RPI – X) – Regulatory decision
– Household allowances should be based on capacity-to-pay considerations – Political decision (general taxation)
– Universal allowances and reliefs actually make it more difficult to avert water poverty• Income – not ‘social category’ is the appropriate frame of reference• Allowances should taper down as household income increases• Allowances should not involve the utility – they should be a payment from DSP to the
household independent of interactions with the utility• System of allowances should be completely detached from the regulator
– Allow the regulator to independently set the price per litre of water and use income related social payments to address affordability issues
• Administrative issues but these can be overcome