neri facts winter 2015
DESCRIPTION
NERI factsTRANSCRIPT

ISSN 2009-4671
December 2015

About NERI and this publication The Nevin Economic Research Institute (NERI) has been established to provide information, analysis and economic policy alternatives. Further information about NERI may be obtained at our website www.NERInstitute.net
The purpose of this Quarterly Economic Facts (QEF) document is to provide regular, accessible and timely statistical information so as to equip trade unions and others in understanding economic trends and comparisons. All data are sourced from official sources with a clear link or reference to the website or publication from where they are drawn. Every care has been taken to ensure that the data were valid at the time of this release.
This (Winter 2015) edition incorporates a restructure of the QEF set of indicators. These have been revised to provide a more comprehensive overview of the labour market, income, earnings, social exclusion and public finances on the island of Ireland.
Each release of the QEF is complemented by another release – Quarterly Economic Observer which is available on the NERI website.

The Nevin Economic Research Institute
Quarterly Economic Facts
Winter 2015
This document is also available in electronic format on our website: www.NERInstitute.net

Table of Contents Table of Contents 1 Overview 3 1. People in Paid Work 5 Indicator 1.1a Employment and Unemployment Trends (Republic of
Ireland) 7
Indicator 1.1b Employment and Unemployment Trends (Northern Ireland)
9
Indicator 1.2a Employment Change by Sector in the Republic of Ireland 11 Indicator 1.2b Employment Change by Sector in Northern Ireland 13 Indicator 1.3 Numbers Employed in the Wide Public Sector (OECD) 15 Indicator 1.4 Unemployment plus Under-employment across European
Union Member States 17
Indicator 1.5a Under-employment in the Republic of Ireland 19 Indicator 1.5b Under-employment in Northern Ireland 21 Indicator 1.6 Average Number of Hours Worked across OECD countries 23 2. People Out of Work 25 Indicator 2.1 The Rate of Unemployment across European Union Member
States 27
Indicator 2.2a Long-term Unemployment Trends (Republic of Ireland) 29 Indicator 2.2b Long-term Unemployment Trends (Northern Ireland) 31 Indicator 2.3a Unemployed Persons per Job Vacancy (Republic of Ireland) 33 Indicator 2.3b Unemployed Persons per Job Vacancy (Northern Ireland) 35 Indicator 2.4 Youth Unemployment across European Union Member
States 37
Indicator 2.5 Young People Not in Education, Employment or Training (NEETs), ROI and NI
39
Indicator 2.6 A Profile of Economic Inactivity among those who want to work in Northern Ireland
41
3. Labour Costs and Earnings 43 Indicator 3.1a Cost of Employing Labour Across Advanced EU Economies
(EU15) 45
Indicator 3.1b Cost of Employing Labour in the Accommodation and Food Sectors Across Advanced EU Economies (EU15)
47
Indicator 3.1c Cost of Employing Labour in the Wholesale and Retail Trade Sectors Across Advanced EU Economies (EU15)
49
Indicator 3.1d Cost of Employing Labour in the Manufacturing Sectors Across Advanced EU Economies (EU15)
51
Indicator 3.2 Comparisons of National Minimum Wage across the EU 53 Indicator 3.3a Trends in Earnings and Prices (Republic of Ireland) 55 Indicator 3.3b Trends in Earnings and Prices (Northern Ireland) 57 Indicator 3.4 Gender Pay Gap across the EU 59 4. Distribution of Income, Earnings and Wealth 61 Indicator 4.1 Income per capita in the EU 63 Indicator 4.2a Income Distribution over Time (Republic of Ireland) 65
NERI • Quarterly Economic Facts • Winter 2015
1

Indicator 4.2b Income Distribution over Time (Northern Ireland) 67 Indicator 4.3a Average and Median income over Time and by Gender
(Republic of Ireland) 69
Indicator 4.3b Average and Median income over Time and by Household Type (Northern Ireland)
71
Indicator 4.4 Wage Share as a Percentage of GDP (Selected Countries) 73 Indicator 4.5a Distribution of Earnings (Republic of Ireland) 75 Indicator 4.5b Distribution of Earnings (Northern Ireland) 77 Indicator 4.6 Net Wealth per Household across Eurozone countries 79 Indicator 4.7 Net Financial Assets per Capita across Selected EU countries 81 5. Poverty, Social Exclusion and Social Protection 83 Indicator 5.1 Poverty and Deprivation (Republic of Ireland) 85 Indicator 5.2 Poverty in Northern Ireland 87 Indicator 5.3 In Work-Poverty (Republic of Ireland) 89 Indicator 5.4 Poverty and Deprivation by Gender (Republic of Ireland) 91 Indicator 5.5 Unemployment Benefits Compared to Earnings (OECD
countries) 93
Indicator 5.6 Unemployment Traps across OECD countries 95 6. Public Finances 97 Indicator 6.1 Trends in General Government Expenditure and Revenue
(EU28 and Republic of Ireland) 99
Indicator 6.2 Government Revenue as % of GDP (EU28 and Republic of Ireland)
101
Indicator 6.3a General Government Deficit as % of GDP (EU member states)
103
Indicator 6.3b Estimated General Government Structural Deficit as % of GDP (EU member states)
105
Indicator 6.4 General Government Debt as % of GDP (EU member states) 107
NERI • Quarterly Economic Facts • Winter 2015
2

Overview Recent years have seen a huge growth in the supply, range and timeliness of data from a variety of official agencies including the Central Statistics Office (CSO), the Northern Ireland Statistics and Research Agency (NISRA), Eurostat, the Organisation for Economic Cooperation and Development (OECD), the International Monetary Fund (IMF) as well as other agencies. Much of the data are publicly and readily available online together with detailed notes about the data. The QEF is not intended to provide an alternative to these sources. It provides a signpost to available sources of data. It selects a few indicators from key areas of concern: employment, unemployment, earnings and labour costs, inequality in income, poverty and public finances.
It is intended to expand and change a selection of indicators over time to cover a somewhat broader range of topics under each heading - this (Winter 2015) edition incorporates a restructure of the QEF set of indicators. Comments, queries and suggestions are welcome both in relation to the content as well as the overall scope of this publication.
Each indicator is laid out as follows:
− Definition − Chart and Data Table − Interpretation − Technical Notes and Sources.
For the purposes of comparisons across European States typically two averages are used where possible: EU 28 for all Member States and EU 15 for those Member States that were in the Union prior to 2004. The latter constitute a more homogeneous group in terms of GDP per capita. Unless otherwise stated, averages at the level of EU 28 or EU 15 are unweighted means.
Please note that, unless otherwise specified, all references to ‘Ireland’ in this edition of QEF refers to the Republic of Ireland only.
NERI • Quarterly Economic Facts • Winter 2015
3

NERI • Quarterly Economic Facts • Winter 2015
4

1 People in Paid Work
Indicator 1.1a Employment and Unemployment Trends (Republic of Ireland)
Indicator 1.1b Employment and Unemployment Trends (Northern Ireland)
Indicator 1.2a Employment Change by Sector in the Republic of Ireland
Indicator 1.2b Employment Change by Sector in Northern Ireland
Indicator 1.3 Numbers Employed in the Wide Public Sector (OECD)
Indicator 1.4 Unemployment plus Under-employment across European Union Member States
Indicator 1.5a Under-employment in the Republic of Ireland
Indicator 1.5b Under-employment in Northern Ireland
Indicator 1.6 Average Number of Hours Worked across OECD countries
NERI • Quarterly Economic Facts • Winter 2015
5

NERI • Quarterly Economic Facts • Winter 2015
6

Indicator 1.1a Employment and Unemployment Trends (Republic of Ireland)
Indicator defined Share of employed, unemployed and economically inactive in population of working age in the Republic of Ireland
Data is the latest available as of 1December 2015
QEF Chart 1.1a Employment and Unemployment Trends (Republic of Ireland)
Source: Eurostat Labour Force Survey
0% 10% 20% 30% 40% 50% 60% 70% 80% 90% 100%
1996
1997
1998
1999
2000
2001
2002
2003
2004
2005
2006
2007
2008
2009
2010
2011
2012
2013
2014
Unemployed Inactive Employed
NERI • Quarterly Economic Facts • Winter 2015
7

QEF Table 1.1a Employment and Unemployment Trends (Republic of Ireland)
Total aged 15-64
'000s Unemployed Inactive Employed
1996 2,334.8 7.4% 37.5% 55.4% 1997 2,387.8 6.5% 36.9% 57.6% 1998 2,457.2 5.1% 35.1% 60.6% 1999 2,502.7 3.9% 33.4% 63.3% 2000 2,546.2 3.0% 32.4% 65.2% 2001 2,600.6 2.5% 32.2% 65.8% 2002 2,660.8 2.9% 31.9% 65.5% 2003 2,711.2 3.1% 31.7% 65.5% 2004 2,761.3 3.1% 31.2% 66.3% 2005 2,831.0 3.1% 29.2% 67.6% 2006 2,919.3 3.2% 28.1% 68.7% 2007 3,034.7 3.5% 27.4% 69.2% 2008 3,089.4 4.7% 27.9% 67.4% 2009 3,095.6 8.6% 29.4% 61.9% 2010 3,080.9 9.8% 30.6% 59.6% 2011 3,063.6 10.3% 30.8% 58.9% 2012 3,042.0 10.4% 30.8% 58.8% 2013 3,021.7 9.3% 30.2% 60.5% 2014 3,007.4 8.1% 30.2% 61.7% Source: Eurostat Labour Force Survey Notes: Percentages are for the total population. The unemployment rate is
calculated as a percentage of the labour force. Interpretation Since 1995 there has been a gradual decline in the proportion of ‘economically inactive’ people. This trend has been partially reversed by the recession. The term ‘economically inactive’ is used by economists and statisticians to refer to persons who are not in paid employment (for typically more than one hour in the previous week at the time of survey). It is not intended, here, to imply that persons actively engaged in activities that are not remunerated in the labour market are not contributing very significantly to economic and social well-being. Technical Notes There is a statistical discrepancy between total population aged 15-64 (as recorded in the Quarterly National Household Survey) and the sum of employed, unemployed and the economically inactive. The actual percentages (of population) are presented in the table, while in the graph economically inactive is treated as a residual. The discrepancy is at its largest in 1997, at 1% of the population. Source(s) Eurostat online database [lfsi_emp_a, lfsi_act_a, lfsa_ugan, lfsa_igan]
NERI • Quarterly Economic Facts • Winter 2015
8
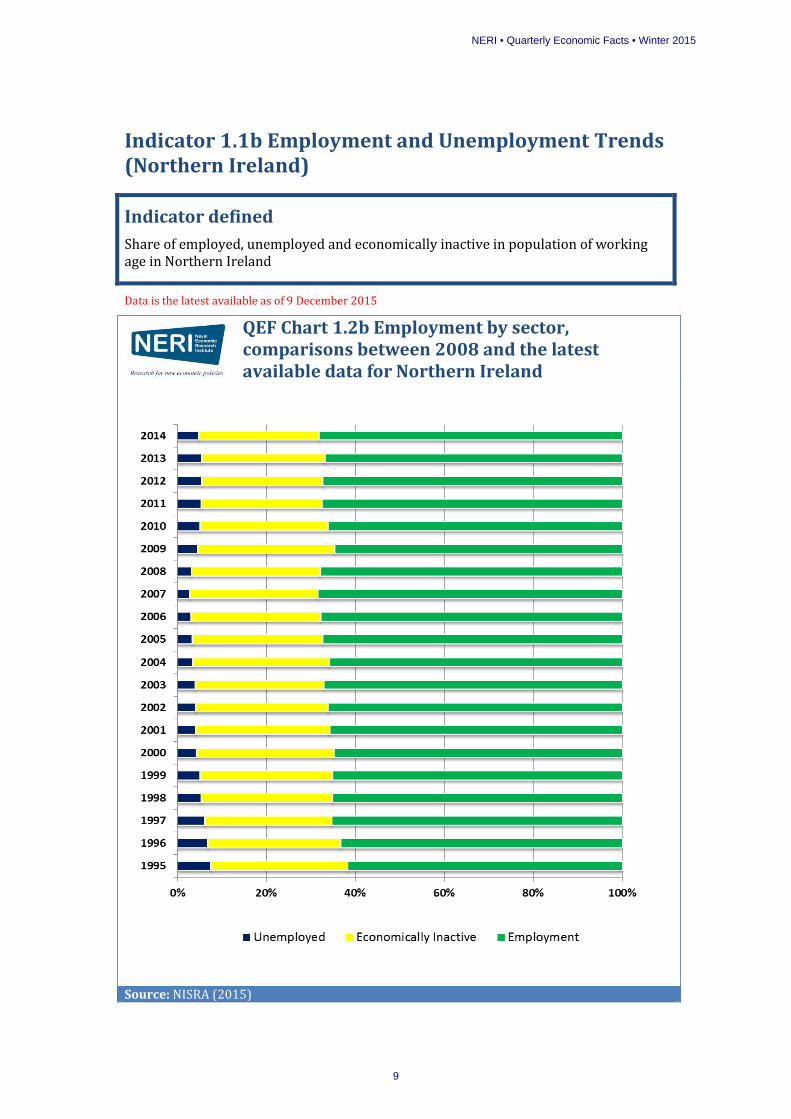
Indicator 1.1b Employment and Unemployment Trends (Northern Ireland)
Indicator defined Share of employed, unemployed and economically inactive in population of working age in Northern Ireland
Data is the latest available as of 9 December 2015
QEF Chart 1.2b Employment by sector, comparisons between 2008 and the latest available data for Northern Ireland
Source: NISRA (2015)
NERI • Quarterly Economic Facts • Winter 2015
9

QEF Table 1.1b Total population and share of employed, unemployed and economically inactive
Year Total 16-64 ‘000s Employment Economically
Inactive Unemployed
1995 1006 61.8% 30.7% 7.5% 1996 1017 63.2% 29.8% 6.9% 1997 1027 65.3% 28.5% 6.2% 1998 1035 65.2% 29.5% 5.4% 1999 1041 65.2% 29.7% 5.1% 2000 1048 64.8% 30.9% 4.3% 2001 1059 65.8% 30.0% 4.3% 2002 1067 66.1% 29.7% 4.2% 2003 1075 67.0% 29. 0% 4.0% 2004 1085 65.9% 30.6% 3.6% 2005 1098 67.3% 29.4% 3.4% 2006 1112 67.7% 29.1% 3.2% 2007 1125 68.4% 28.8% 2.9% 2008 1135 67.8% 28.9% 3.3% 2009 1142 64.7% 30.8% 4.6% 2010 1147 66.1% 28.8% 5.2% 2011 1154 67.4% 27.2% 5.3% 2012 1159 67.3% 27.2% 5.5% 2013 1163 66.8% 27.5% 5.6% 2014 1165 66.93% 27.1% 4.8%
Source: NISRA (2015) Note: Data is yearly average based on 4 calendar quarters. Percentages are
for the total population. The unemployment rate is calculated as a percentage of the labour force.
Interpretation As shown above Northern Ireland has seen increases in both unemployment and economic inactivity over the recession period. While the rate of unemployment is returning to pre-crisis levels, the decline in the level of economic inactivity has been less marked. Northern Ireland still has a level of economic inactivity that is considerably higher than that of the UK and thus direct comparisons can be misguided.
Technical Notes Economic Activity, Employment and Unemployment rate are all calculated as a percentage of the working age population (16-64). Unemployment and economically inactive are calculated as residuals from employment and economically active.
Source(s) NISRA (2015) Labour Force Survey
NERI • Quarterly Economic Facts • Winter 2015
10

Indicator 1.2a Employment Change by Sector in the Republic of Ireland
Indicator defined Employment at NACE 2 sectoral level comparing the level in Q3 2007 with current employment levels (seasonally adjusted).
Data is the latest available as of 1 December 2015
QEF Chart 1.2a Employment Change by Sector in the Republic of Ireland
Source: CSO Statbank
0 100 200 300 400
Agriculture, forestry & fishing
Industry
Construction
Wholesale & retail, repair of motor vehicles &motorcycles
Transportation & storage
Accommodation & food service activities
Information & communication
Financial, insurance & real estate activities
Professional, scientific & technical activities
Administrative & support service activities
Public administration & defence, compulsory socialsecurity
Education
Human health & social work activities
Other NACE activities
Q3 2015 (‘000s)
Q3 2007 (‘000s)
NERI • Quarterly Economic Facts • Winter 2015
11

QEF Table 1.2a Employment Change by Sector in the Republic of Ireland
Economic Sector Q3 2007 Q3 2015 ‘000s ‘000s Agriculture, forestry and fishing (A) 109.5 111.8 Industry (B to E) 303.5 252.4 Construction (F) 268.2 126.2 Wholesale and retail trade, repair of motor vehicles and motorcycles (G) 308.7 272.3
Transportation and storage (H) 92.1 90.6 Accommodation and food service activities (I) 134 136 Information and communication (J) 68.3 84.1 Financial, insurance and real estate activities (K,L) 105.8 98.8 Professional, scientific and technical activities (M) 115.3 121.1 Administrative and support service activities (N) 81.6 65.8 Public administration and defence, compulsory social security (O) 106.9 100.1
Education (P) 140.2 152.3 Human health and social work activities (Q) 217.3 252.1 Other NACE activities (R to U) 95.4 103.7 Source: CSO Statbank
Interpretation The wholesale and retail sector has remained the largest employment sector throughout the boom and the recession. The information and communication sector has experienced the greatest percentage increase in employment over the past eight years with employment in activities related to human health and social work increasing significantly, also. Roughly one in every two jobs in the construction sector was lost from the third quarter in 2007 to the same period in 2015.
Technical Notes The CSO’s Quarterly National Household Survey is a conducted each week over a total sample of 39,000 households and is published on a quarterly basis. The households are surveyed over five consecutive quarters. The ILO definition of the labour force includes all those employed and unemployed over the age of 15, but excludes the inactive population. The NACE codes are employment sector classifications. Seasonally adjusted data is data that has been treated for calendar effects, seasonal variations etc. and is arrived using the X-12-ARIMA model. The seasonally adjusted factor is revised each quarter for all previous quarters. In November 2012 the CSO revised estimates for previous periods. The data should be treated with caution given the resampling of the Quarterly National Household Survey.
Source(s) CSO Statbank. [QNQ03]
NERI • Quarterly Economic Facts • Winter 2015
12
Indicator: 1.2b Employment Change by Sector in Northern Ireland
Indicator defined Workforce jobs by industry (SIC 2007) - seasonally adjusted: all persons comparing the level in March 2008 with the most recently reported period.
Data is the latest available as of 9 December 2015
QEF Chart 1.2b Workforce Jobs by sector, comparisons between 2008 and the latest available data for Northern Ireland
Source: ONS (2015)
0 20 40 60 80 100 120 140 160 180
Agriculture, forestry and fishing
Mining and quarrying
Manufacturing
Electricity & gas
Water supply; sewerage, waste mgmt
Construction
Wholesale and retail trade
Transportation and storage
Accommodation and food service activities
Information and communication
Financial and insurance activities
Real estate activities
Professional, scientific and technical
Administrative and support service
Public administration
Education
Human health and social work activities
Arts, entertainment and recreation
Other service activities
Q2 2015 ‘000s
Q1 2008 ‘000s
NERI • Quarterly Economic Facts • Winter 2015
13
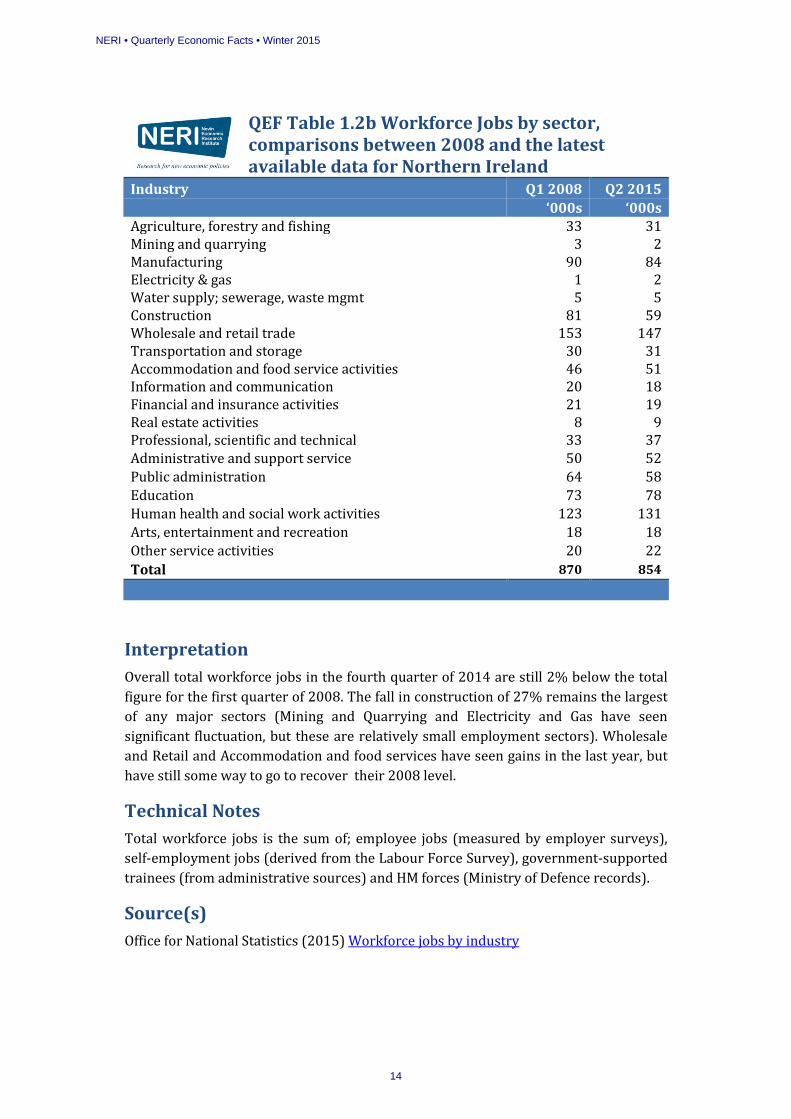
QEF Table 1.2b Workforce Jobs by sector, comparisons between 2008 and the latest available data for Northern Ireland
Industry Q1 2008 Q2 2015 ‘000s ‘000s Agriculture, forestry and fishing 33 31 Mining and quarrying 3 2 Manufacturing 90 84 Electricity & gas 1 2 Water supply; sewerage, waste mgmt 5 5 Construction 81 59 Wholesale and retail trade 153 147 Transportation and storage 30 31 Accommodation and food service activities 46 51 Information and communication 20 18 Financial and insurance activities 21 19 Real estate activities 8 9 Professional, scientific and technical 33 37 Administrative and support service 50 52 Public administration 64 58 Education 73 78 Human health and social work activities 123 131 Arts, entertainment and recreation 18 18 Other service activities 20 22 Total 870 854
Interpretation Overall total workforce jobs in the fourth quarter of 2014 are still 2% below the total figure for the first quarter of 2008. The fall in construction of 27% remains the largest of any major sectors (Mining and Quarrying and Electricity and Gas have seen significant fluctuation, but these are relatively small employment sectors). Wholesale and Retail and Accommodation and food services have seen gains in the last year, but have still some way to go to recover their 2008 level.
Technical Notes Total workforce jobs is the sum of; employee jobs (measured by employer surveys), self-employment jobs (derived from the Labour Force Survey), government-supported trainees (from administrative sources) and HM forces (Ministry of Defence records).
Source(s) Office for National Statistics (2015) Workforce jobs by industry
NERI • Quarterly Economic Facts • Winter 2015
14

Indicator: 1.3 Numbers Employed in the Wide Public Sector (OECD), 2013
Indicator defined Total numbers employed in General Government as a proportion of total Labour Force.
Data the latest available as of 14 September 2015.
QEF Chart 1.3 Numbers Employed in the Wide Public Sector (OECD), 2013
Source: OECD Government at a Glance. 2013 data for Czech Republic & Germany unavailable
0 5 10 15 20 25 30 35 40
ColumbiaSouth Korea
JapanChile
MexicoBrazil
New ZealandTurkey
SpainSouth Africa
PortugalAustralia
ItalySwitzerland
IrelandGreeceFrance
CanadaOECD
BelgiumUkraine
SloveniaUnited Kingdom
PolandSlovakiaEstonia
HungaryLuxembourg
SwedenLatvia
DenmarkNorway
2013
2009
NERI • Quarterly Economic Facts • Winter 2015
15

QEF Table 1.3 Total Numbers Employed in the Public Sector (OECD), 2013
Country 2009 2013 Country 2009 2013
Columbia 4.0 3.7 Canada 18.6 19.0 South Korea - 7.4 OECD 19.4 19.3 Japan 7.5 7.6 Belgium 21.1 19.6 Chile 9.2 10.3 Ukraine 20.4 20.1 Mexico 11.2 11.2 Slovenia 19.7 20.9 Brazil - 11.4 United Kingdom 22.9 21.5 New Zealand 12.1 11.6 Poland 24.6 22.6 Turkey 12.2 11.7 Slovakia 23.3 23.3 Spain 13.2 12.7 Estonia 23.1 23.8 South Africa 11.7 13.1 Hungary 23.7 23.9 Portugal - 13.9 Luxembourg 24.4 24.8 Australia - 14.3 Sweden 26.6 25.8 Italy 17.2 16.0 Latvia - 27.5 Switzerland 14.5 17.3 Denmark 31.6 32.2 Ireland - 17.4 Norway 31.1 33.4 Greece 19.9 17.5 Czech Republic 31.8 - France 18.3 17.9 Germany 14.2 - Source: OECD Government at a Glance
Interpretation Ireland’s ‘wide public sector’ share of total employment, as published by the OECD in 2013 was 17.4% for the year 2013. This was below the OECD country average of 19.3% in 2013 for those countries reporting data.
Technical Notes OECD Government at a Glance was last published by the OECD in summer 2015 and shows total employment in general government and public corporations in 2011 and earlier years. The OECD use the International Labour Organization LABORSTA database as the source for information on public sector employment (see laborsta.ilo.org). The laborsta database contains information for some OECD countries in 2009 and 2010 that are not displayed above.
General Government is defined as all levels of government (e.g. central, state, regional and local) and includes core Ministries, agencies, departments and non-profit institutions that are controlled and mainly financed by public authorities. Public corporations are defined as legal units mainly owned or controlled by the government which produce goods and services for sale in the market. Public corporations include post offices and railways. Public corporations also include quasi-corporations.
Source(s) OECD Government at a Glance (2015)
NERI • Quarterly Economic Facts • Winter 2015
16
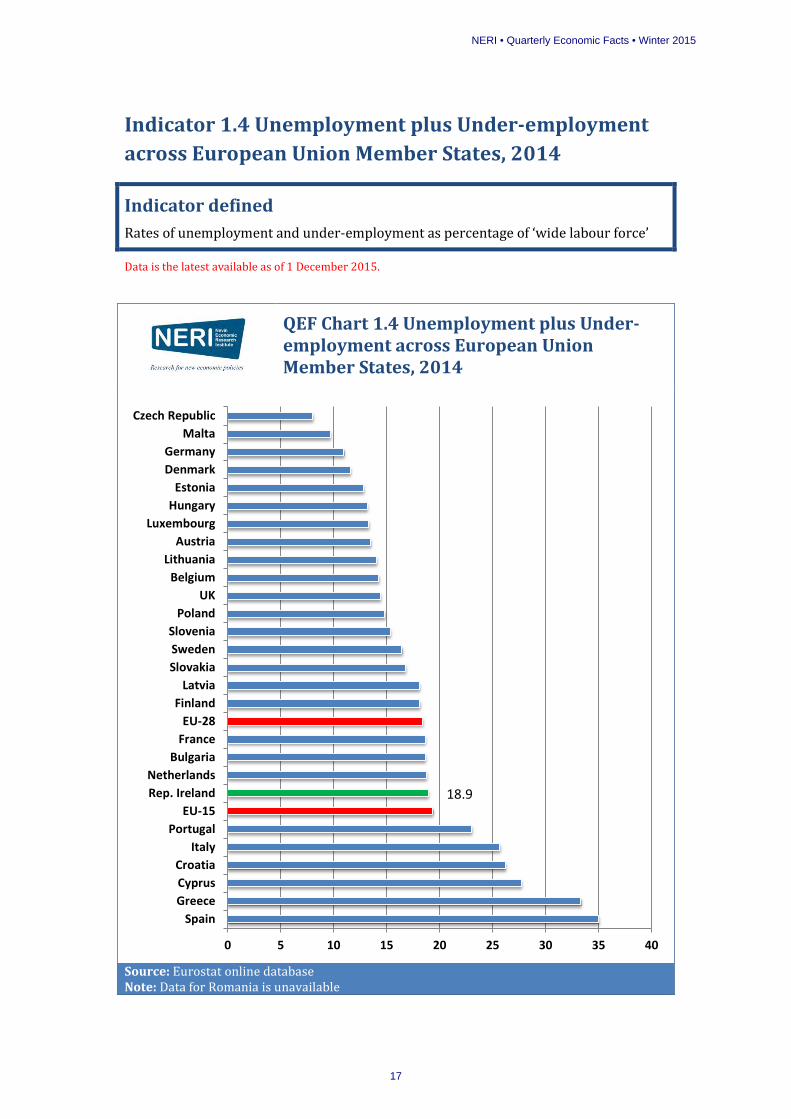
Indicator 1.4 Unemployment plus Under-employment across European Union Member States, 2014
Indicator defined Rates of unemployment and under-employment as percentage of ‘wide labour force’
Data is the latest available as of 1 December 2015.
QEF Chart 1.4 Unemployment plus Under-employment across European Union Member States, 2014
Source: Eurostat online database Note: Data for Romania is unavailable
0 5 10 15 20 25 30 35 40
SpainGreeceCyprusCroatia
ItalyPortugal
EU-15Rep. IrelandNetherlands
BulgariaFranceEU-28
FinlandLatvia
SlovakiaSwedenSlovenia
PolandUK
BelgiumLithuania
AustriaLuxembourg
HungaryEstonia
DenmarkGermany
MaltaCzech Republic
18.9
NERI • Quarterly Economic Facts • Winter 2015
17
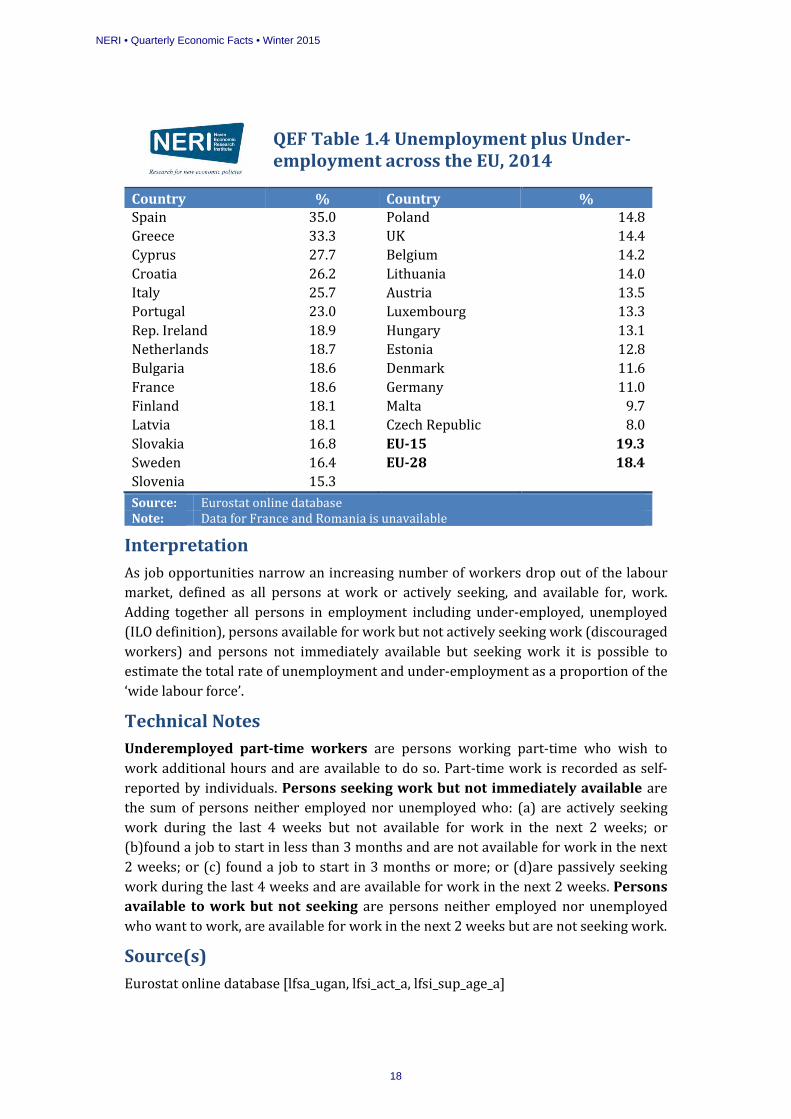
QEF Table 1.4 Unemployment plus Under-employment across the EU, 2014
Country % Country % Spain 35.0 Poland 14.8 Greece 33.3 UK 14.4 Cyprus 27.7 Belgium 14.2 Croatia 26.2 Lithuania 14.0 Italy 25.7 Austria 13.5 Portugal 23.0 Luxembourg 13.3 Rep. Ireland 18.9 Hungary 13.1 Netherlands 18.7 Estonia 12.8 Bulgaria 18.6 Denmark 11.6 France 18.6 Germany 11.0 Finland 18.1 Malta 9.7 Latvia 18.1 Czech Republic 8.0 Slovakia 16.8 EU-15 19.3 Sweden 16.4 EU-28 18.4 Slovenia 15.3 Source: Eurostat online database Note: Data for France and Romania is unavailable
Interpretation As job opportunities narrow an increasing number of workers drop out of the labour market, defined as all persons at work or actively seeking, and available for, work. Adding together all persons in employment including under-employed, unemployed (ILO definition), persons available for work but not actively seeking work (discouraged workers) and persons not immediately available but seeking work it is possible to estimate the total rate of unemployment and under-employment as a proportion of the ‘wide labour force’.
Technical Notes Underemployed part-time workers are persons working part-time who wish to work additional hours and are available to do so. Part-time work is recorded as self-reported by individuals. Persons seeking work but not immediately available are the sum of persons neither employed nor unemployed who: (a) are actively seeking work during the last 4 weeks but not available for work in the next 2 weeks; or (b)found a job to start in less than 3 months and are not available for work in the next 2 weeks; or (c) found a job to start in 3 months or more; or (d)are passively seeking work during the last 4 weeks and are available for work in the next 2 weeks. Persons available to work but not seeking are persons neither employed nor unemployed who want to work, are available for work in the next 2 weeks but are not seeking work.
Source(s) Eurostat online database [lfsa_ugan, lfsi_act_a, lfsi_sup_age_a]
NERI • Quarterly Economic Facts • Winter 2015
18

Indicator 1.5a Under-employment in the Republic of Ireland
Indicator defined Numbers of unemployed and part-time underemployed
Data is the latest available as of 1 December 2015.
QEF Chart 1.5a Under-employment in the Republic of Ireland, ‘000s
Source: CSO Quarterly National Household Survey, QNQ37
0
50
100
150
200
250
300
350
Part-time Under-employed Unemployed
NERI • Quarterly Economic Facts • Winter 2015
19

QEF Table 1.5a Under-employment in the Republic of Ireland, ‘000s
Period Part-time under-employed Unemployed
2010 Q3 112.5 310.6 2010 Q4 116.8 310.9 2011 Q1 126.5 307.6 2011 Q2 137.1 317.4 2011 Q3 140.8 328.1 2011 Q4 145.6 313.9 2012 Q1 138.9 321.9 2012 Q2 156.6 323 2012 Q3 147.6 324.5 2012 Q4 145.8 294.6 2013 Q1 155.9 292 2013 Q2 149.4 300.7 2013 Q3 139.3 282.9 2013 Q4 143.3 253.2 2014 Q1 141.7 258.1 2014 Q2 129.7 254.5 2014 Q3 124.3 245.5 2014 Q4
115.5
213.6 2015 Q1 114.8 212.8 2015 Q2 119.6 211.2 2015 Q3 106.5 203.0 Source: CSO Quarterly National Household Survey, QNQ37
Interpretation Part-time underemployed are those who wish to work full-time, but cannot find a full-time job. The numbers involuntarily part-time has increased during the recession. As the total number of part-timers has remained stable this suggests that those who wish to work part-time were displaced by those who would prefer to work full-time. Trends in involuntary part-time employment can have an ambiguous interpretation as they can be due to the creation of new part-time jobs, or the destruction of full-time jobs.
Technical Notes
These figures are not directly comparable to indicator 1.5b for Northern Ireland.
Source(s) CSO Quarterly National Household Survey [Table 1a]
NERI • Quarterly Economic Facts • Winter 2015
20
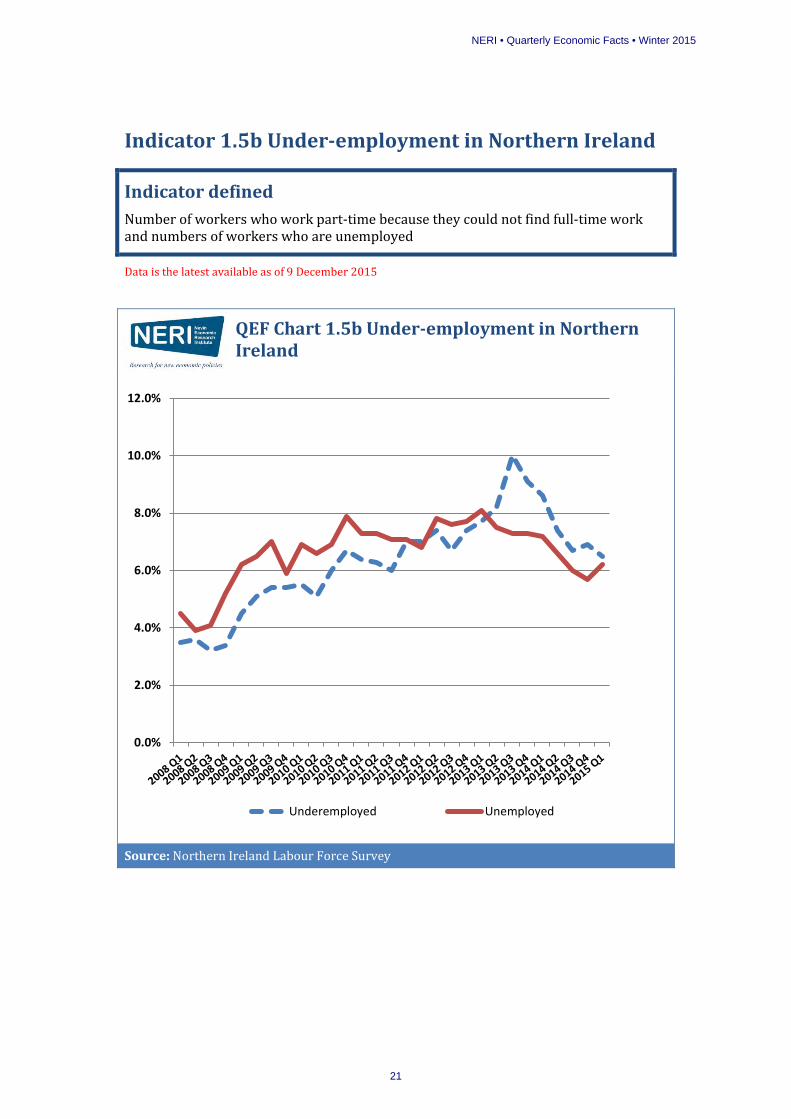
Indicator 1.5b Under-employment in Northern Ireland
Indicator defined Number of workers who work part-time because they could not find full-time work and numbers of workers who are unemployed
Data is the latest available as of 9 December 2015
QEF Chart 1.5b Under-employment in Northern Ireland
Source: Northern Ireland Labour Force Survey
0.0%
2.0%
4.0%
6.0%
8.0%
10.0%
12.0%
Underemployed Unemployed
NERI • Quarterly Economic Facts • Winter 2015
21
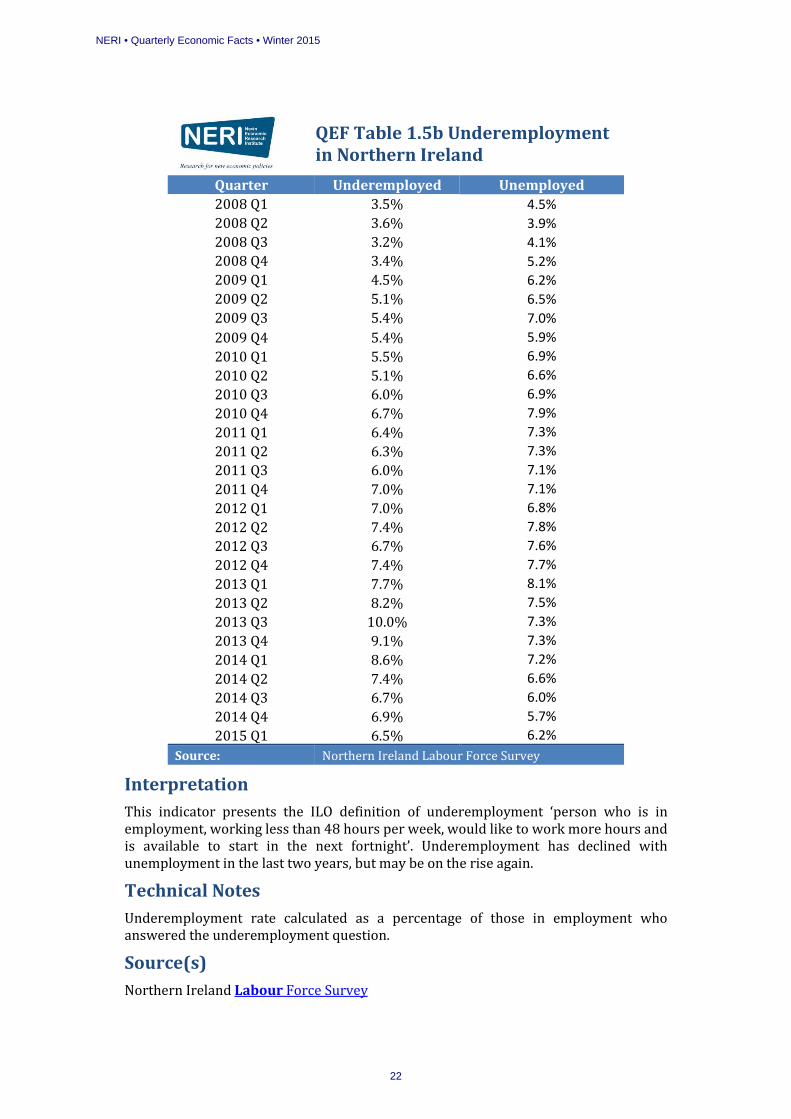
QEF Table 1.5b Underemployment in Northern Ireland
Quarter Underemployed Unemployed 2008 Q1 3.5% 4.5% 2008 Q2 3.6% 3.9% 2008 Q3 3.2% 4.1% 2008 Q4 3.4% 5.2% 2009 Q1 4.5% 6.2% 2009 Q2 5.1% 6.5% 2009 Q3 5.4% 7.0% 2009 Q4 5.4% 5.9% 2010 Q1 5.5% 6.9% 2010 Q2 5.1% 6.6% 2010 Q3 6.0% 6.9% 2010 Q4 6.7% 7.9% 2011 Q1 6.4% 7.3% 2011 Q2 6.3% 7.3% 2011 Q3 6.0% 7.1% 2011 Q4 7.0% 7.1% 2012 Q1 7.0% 6.8% 2012 Q2 7.4% 7.8% 2012 Q3 6.7% 7.6% 2012 Q4 7.4% 7.7% 2013 Q1 7.7% 8.1% 2013 Q2 8.2% 7.5% 2013 Q3 10.0% 7.3% 2013 Q4 9.1% 7.3% 2014 Q1 8.6% 7.2% 2014 Q2 7.4% 6.6% 2014 Q3 6.7% 6.0% 2014 Q4 6.9% 5.7% 2015 Q1 6.5% 6.2%
Source: Northern Ireland Labour Force Survey
Interpretation This indicator presents the ILO definition of underemployment ‘person who is in employment, working less than 48 hours per week, would like to work more hours and is available to start in the next fortnight’. Underemployment has declined with unemployment in the last two years, but may be on the rise again.
Technical Notes
Underemployment rate calculated as a percentage of those in employment who answered the underemployment question.
Source(s) Northern Ireland Labour Force Survey
NERI • Quarterly Economic Facts • Winter 2015
22

Indicator 1.6 Average Hours Worked Across OECD Countries
Indicator defined Average annual hours actually worked per worker in 2014
Data is the latest available as of 1 December 2015.
QEF Chart 1.6 Average Number of Hours Worked Across OECD Countries
Source: OECD Labour Force Statistics Note: Data for Korea is unavailable.
0 500 1,000 1,500 2,000 2,500
MexicoCosta Rica
KoreaGreece
ChileRussian…
LatviaPolandIcelandEstonia
HungaryPortugal
IsraelLithuania
IrelandUnited States
Czech RepublicOECD countriesSlovak Republic
New ZealandItaly
JapanCanada
SpainUnited Kingdom
AustraliaFinland
LuxembourgAustria
SwedenSwitzerland
SloveniaFrance
DenmarkNorway
NetherlandsGermany
1,821
NERI • Quarterly Economic Facts • Winter 2015
23
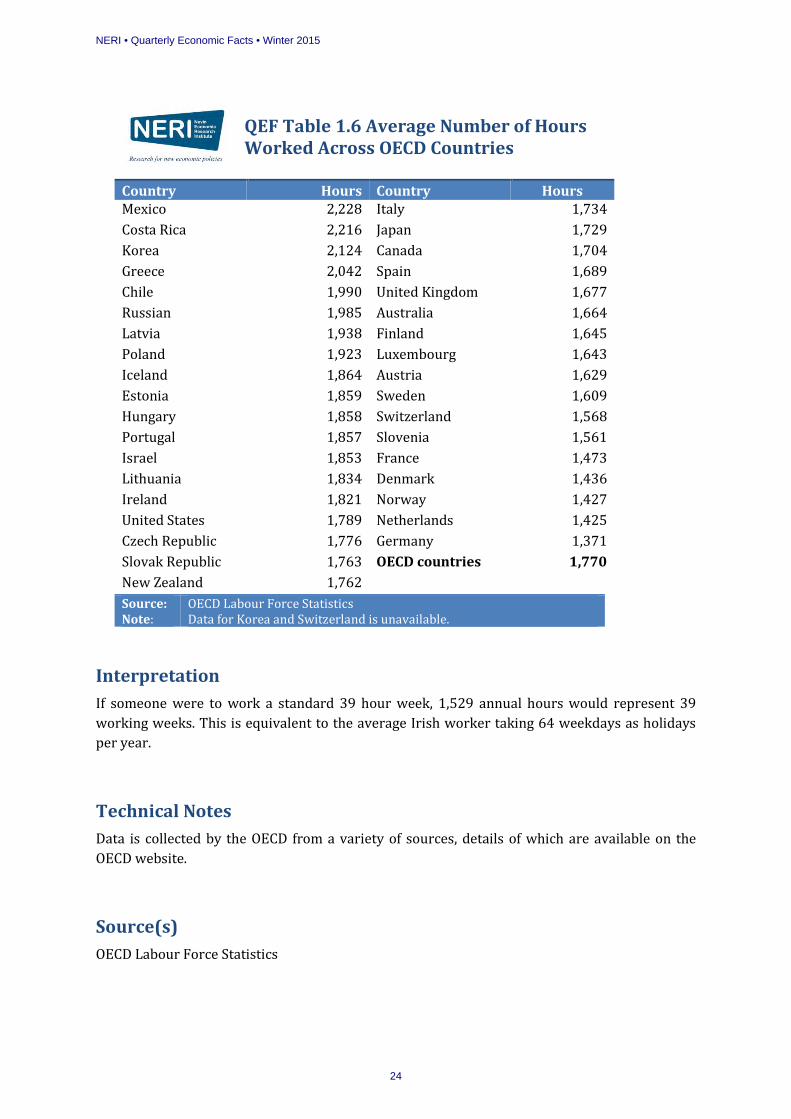
QEF Table 1.6 Average Number of Hours Worked Across OECD Countries
Country Hours Country Hours Mexico 2,228 Italy 1,734 Costa Rica 2,216 Japan 1,729 Korea 2,124 Canada 1,704 Greece 2,042 Spain 1,689 Chile 1,990 United Kingdom 1,677 Russian
1,985 Australia 1,664
Latvia 1,938 Finland 1,645 Poland 1,923 Luxembourg 1,643 Iceland 1,864 Austria 1,629 Estonia 1,859 Sweden 1,609 Hungary 1,858 Switzerland 1,568 Portugal 1,857 Slovenia 1,561 Israel 1,853 France 1,473 Lithuania 1,834 Denmark 1,436 Ireland 1,821 Norway 1,427 United States 1,789 Netherlands 1,425 Czech Republic 1,776 Germany 1,371 Slovak Republic 1,763 OECD countries 1,770 New Zealand 1,762 Source: OECD Labour Force Statistics Note: Data for Korea and Switzerland is unavailable.
Interpretation If someone were to work a standard 39 hour week, 1,529 annual hours would represent 39 working weeks. This is equivalent to the average Irish worker taking 64 weekdays as holidays per year.
Technical Notes Data is collected by the OECD from a variety of sources, details of which are available on the OECD website.
Source(s) OECD Labour Force Statistics
NERI • Quarterly Economic Facts • Winter 2015
24

2 People out of Work
Indicator 2.1 The Rate of Unemployment across European Union Member States
Indicator 2.2a Long-term Unemployment Trends (Republic of Ireland)
Indicator 2.2b Long-term Unemployment Trends (Northern Ireland)
Indicator 2.3a Unemployed Persons per Job Vacancy (Republic of Ireland)
Indicator 2.3b Unemployed Persons per Job Vacancy (Northern Ireland)
Indicator 2.4 Youth Unemployment across European Union Member States
Indicator 2.5 Young People Not in Education, Employment or Training (NEETs), ROI and NI
Indicator 2.6 A Profile of Economic Inactivity among those who want to work in Northern Ireland
NERI • Quarterly Economic Facts • Winter 2015
25

NERI • Quarterly Economic Facts • Winter 2015
26

Indicator 2.1a The Rate of Unemployment across European Union Member States, August 2015 Indicator defined Seasonally adjusted total unemployed as a percentage of the Labour Force (ILO definition)
Data is the latest available as of 1 December 2015
QEF Chart 2.1 The Rate of Unemployment across European Union Member States
Source: Eurostat online database Note: *Data from September 2015; **Data from August 2015
0 5 10 15 20 25 30
Greece**Spain
CroatiaCyprus
PortugalItaly
FranceSlovakia
LatviaEU 15
BulgariaFinland
EU 28Slovenia
IrelandLithuania
BelgiumSwedenPoland
NetherlandsRomania
Hungary*DenmarkEstonia*
LuxembourgAustria
United Kingdom**Malta
Czech RepublicGermany
8.9
NERI • Quarterly Economic Facts • Winter 2015
27
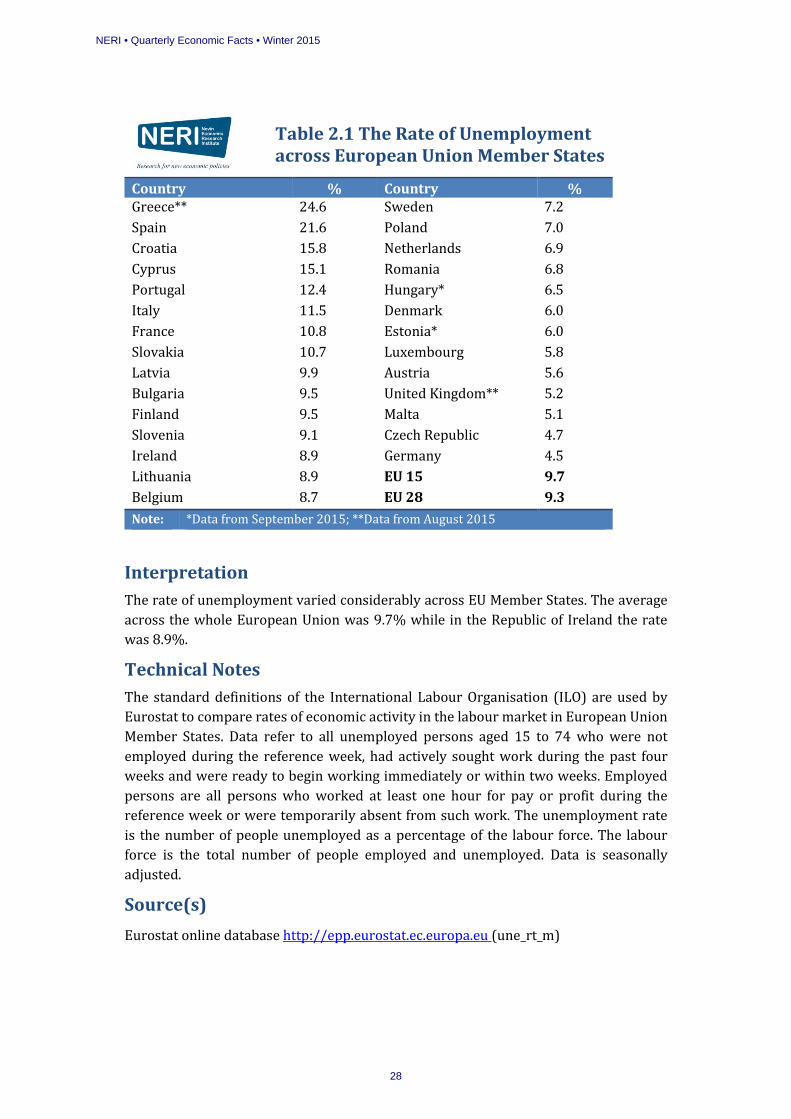
Table 2.1 The Rate of Unemployment across European Union Member States
Country % Country % Greece** 24.6 Sweden 7.2 Spain 21.6 Poland 7.0 Croatia 15.8 Netherlands 6.9 Cyprus 15.1 Romania 6.8 Portugal 12.4 Hungary* 6.5 Italy 11.5 Denmark 6.0 France 10.8 Estonia* 6.0 Slovakia 10.7 Luxembourg 5.8 Latvia 9.9 Austria 5.6 Bulgaria 9.5 United Kingdom** 5.2 Finland 9.5 Malta 5.1 Slovenia 9.1 Czech Republic 4.7 Ireland 8.9 Germany 4.5 Lithuania 8.9 EU 15 9.7 Belgium 8.7 EU 28 9.3 Note: *Data from September 2015; **Data from August 2015
Interpretation The rate of unemployment varied considerably across EU Member States. The average across the whole European Union was 9.7% while in the Republic of Ireland the rate was 8.9%.
Technical Notes The standard definitions of the International Labour Organisation (ILO) are used by Eurostat to compare rates of economic activity in the labour market in European Union Member States. Data refer to all unemployed persons aged 15 to 74 who were not employed during the reference week, had actively sought work during the past four weeks and were ready to begin working immediately or within two weeks. Employed persons are all persons who worked at least one hour for pay or profit during the reference week or were temporarily absent from such work. The unemployment rate is the number of people unemployed as a percentage of the labour force. The labour force is the total number of people employed and unemployed. Data is seasonally adjusted.
Source(s) Eurostat online database http://epp.eurostat.ec.europa.eu (une_rt_m)
NERI • Quarterly Economic Facts • Winter 2015
28
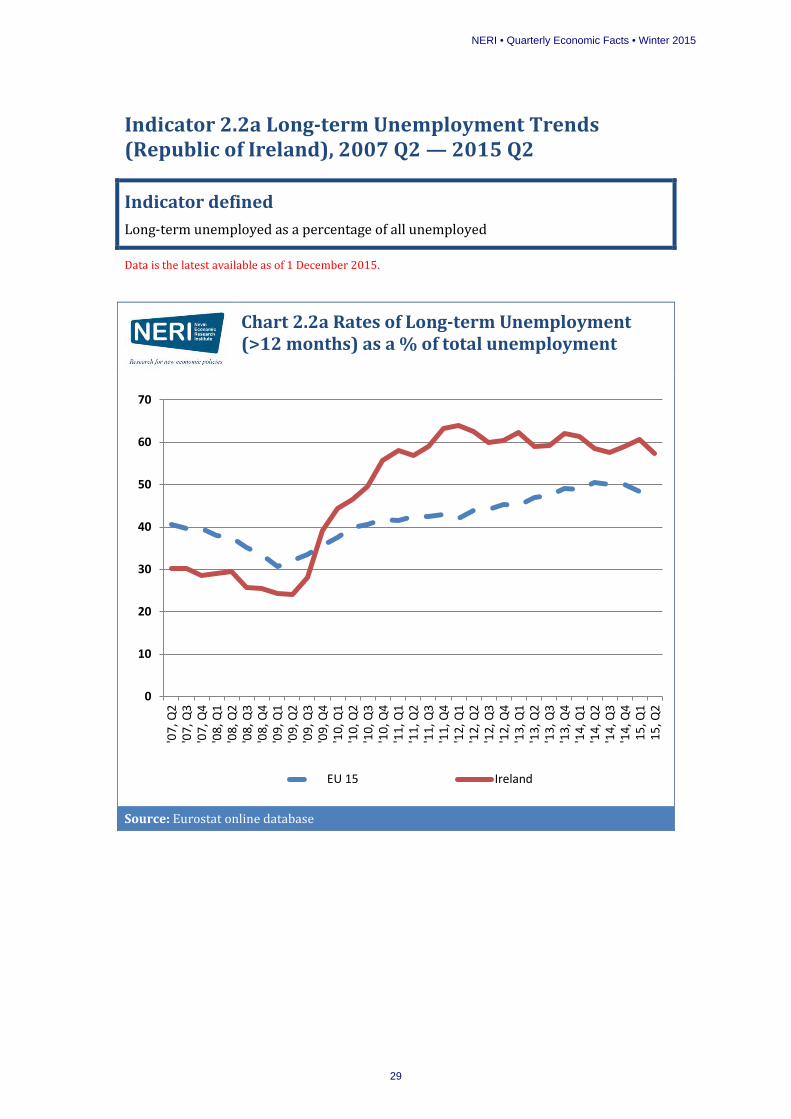
Indicator 2.2a Long-term Unemployment Trends (Republic of Ireland), 2007 Q2 — 2015 Q2
Indicator defined Long-term unemployed as a percentage of all unemployed
Data is the latest available as of 1 December 2015.
Chart 2.2a Rates of Long-term Unemployment (>12 months) as a % of total unemployment
Source: Eurostat online database
0
10
20
30
40
50
60
70
'07,
Q2
'07,
Q3
'07,
Q4
'08,
Q1
'08,
Q2
'08,
Q3
'08,
Q4
'09,
Q1
'09,
Q2
'09,
Q3
'09,
Q4
'10,
Q1
'10,
Q2
'10,
Q3
'10,
Q4
'11,
Q1
'11,
Q2
'11,
Q3
'11,
Q4
'12,
Q1
'12,
Q2
'12,
Q3
'12,
Q4
'13,
Q1
'13,
Q2
'13,
Q3
'13,
Q4
'14,
Q1
'14,
Q2
'14,
Q3
'14,
Q4
15, Q
115
, Q2
EU 15 Ireland
NERI • Quarterly Economic Facts • Winter 2015
29

QEF Table 2.2a Rates of Long-term Unemployment as a % of total unemployment
Period EU 15
Rep of Ireland 2009, Q2 32.1 24.0 2009, Q3 33.6 28.2 2009, Q4 35.7 39.2 2010, Q1 37.4 44.4 2010, Q2 39.9 46.4 2010, Q3 40.7 49.5 2010, Q4 41.7 55.7 2011, Q1 41.5 58.1 2011, Q2 42.4 56.9 2011, Q3 42.4 59.0 2011, Q4 42.9 63.3 2012, Q1 42.0 64.0 2012, Q2 43.9 62.5 2012, Q3 44.2 60.0 2012, Q4 45.4 60.3 2013, Q1 45.1 62.4 2013, Q2 46.9 59.0 2013, Q3 47.5 59.2 2013, Q4 49.0 62.0 2014, Q1 48.8 61.4 2014, Q2 50.4 58.6 2014, Q3 50.1 57.6 2014, Q4 50.0 59.1 2015, Q1 48.5 60.7 2015, Q2 49.4 57.4
Interpretation As total unemployment rates have increased across Europe the proportion of total unemployed who are long-term unemployed has increased especially since the first Quarter of 2009. The rate in the Republic of Ireland has risen sharply and overtook the EU 15 average in the last quarter of 2009. Currently, long-term unemployed account for 59% of all unemployed in the Republic compared to just fewer than 30% in 2008.
Technical Notes See notes for Indicator 2.1, above.
Source Eurostat online database (une_ltu_q)
NERI • Quarterly Economic Facts • Winter 2015
30

Indicator 2.2b Long-term Unemployment Trends (Northern Ireland), Q3 2008 —Q3 2015
Indicator defined Long-term unemployed as a percentage of all unemployed
Data is the latest available as of 1 December 2015
QEF Chart 2.2b Rates of Long-term Unemployment (>12 months) as a % of total unemployment, Q1 2009 —Q1 2015
Source: Eurostat online database
0
10
20
30
40
50
60
70
'08,
Q3
'08,
Q4
'09,
Q1
'09,
Q2
'09,
Q3
'09,
Q4
'10,
Q1
'10,
Q2
'10,
Q3
'10,
Q4
'11,
Q1
'11,
Q2
'11,
Q3
'11,
Q4
'12,
Q1
'12,
Q2
'12,
Q3
'12,
Q4
'13,
Q1
'13,
Q2
'13,
Q3
'13,
Q4
'14,
Q1
'14,
Q2
'14,
Q3
'14,
Q4
'15,
Q1
'15,
Q2
'15,
Q3
NI EU15
NERI • Quarterly Economic Facts • Winter 2015
31

QEF Table 2.2b Rates of Long-term Unemployment (>12 months) as a % of total unemployment
Year
Northern Ireland % EU 15 % 2010, Q2 39.9 42.9 2010, Q3 40.7 44.9 2010, Q4 41.7 46.4 2011, Q1 41.5 47.6 2011, Q2 42.4 48.0 2011, Q3 42.4 40.6 2011, Q4 42.9 40.4 2012, Q1 42 46.5 2012, Q2 43.9 44.3 2012, Q3 44.3 53.2 2012, Q4 45.4 58.9 2013, Q1 45.1 60.2 2013, Q2 46.9 54.0 2013, Q3 47.5 50.7 2013, Q4 49.1 47.4 2014, Q1 48.9 47.6 2014, Q2 50.4 51.9 2014, Q3 50.1 58.8 2014, Q4 55.6 50.0 2015, Q1 62.1 48.5 2015, Q2 58.6 49.4
Interpretation As total unemployment rates have increased across Europe the proportion of total unemployed who are long-term unemployed has increased especially since the first Quarter of 2009. The long-term unemployment rate in Northern Ireland rose through 2011and 2012 and was 14.1 percentage points above the EU 15 average in the last quarter of 2013. The most recent data shows the difference between Northern Ireland and the EU 15 average reduced to just over 9 percentage points in the second quarter of 2015.
Technical Notes
See notes for Indicator 2.1, above.
Source(s) Northern Ireland Statistics and Research Agency http://www.detini.gov.uk/deti-stats-index/labour_market_statistics.htm and Eurostat online database http://epp.eurostat.ec.europa.eu [une_ltu_q]
NERI • Quarterly Economic Facts • Winter 2015
32

Indicator 2.3a Unemployed Persons per Job Vacancy (Republic of Ireland), 2015 Q2
Indicator defined Ratio of the number of unemployed to the number of job vacancies
Data is the latest available as of 3 December 2015.
QEF Chart 2.3a Ratio of unemployed to job vacancies—2015,Q2
Source: Eurostat online database Notes: *Data for U.K. refers to 2015 Q1
0 10 20 30 40 50 60 70 80
Greece
Spain
Portugal
Latvia
Cyprus
Slovakia
Poland
Bulgaria
Croatia
Ireland
Romania
Finland
Lithuania
Slovenia
Estonia
Sweden
Netherlands
Belgium
Austria
Luxembourg
Czech Republic
United Kingdom
Germany
14.8
NERI • Quarterly Economic Facts • Winter 2015
33
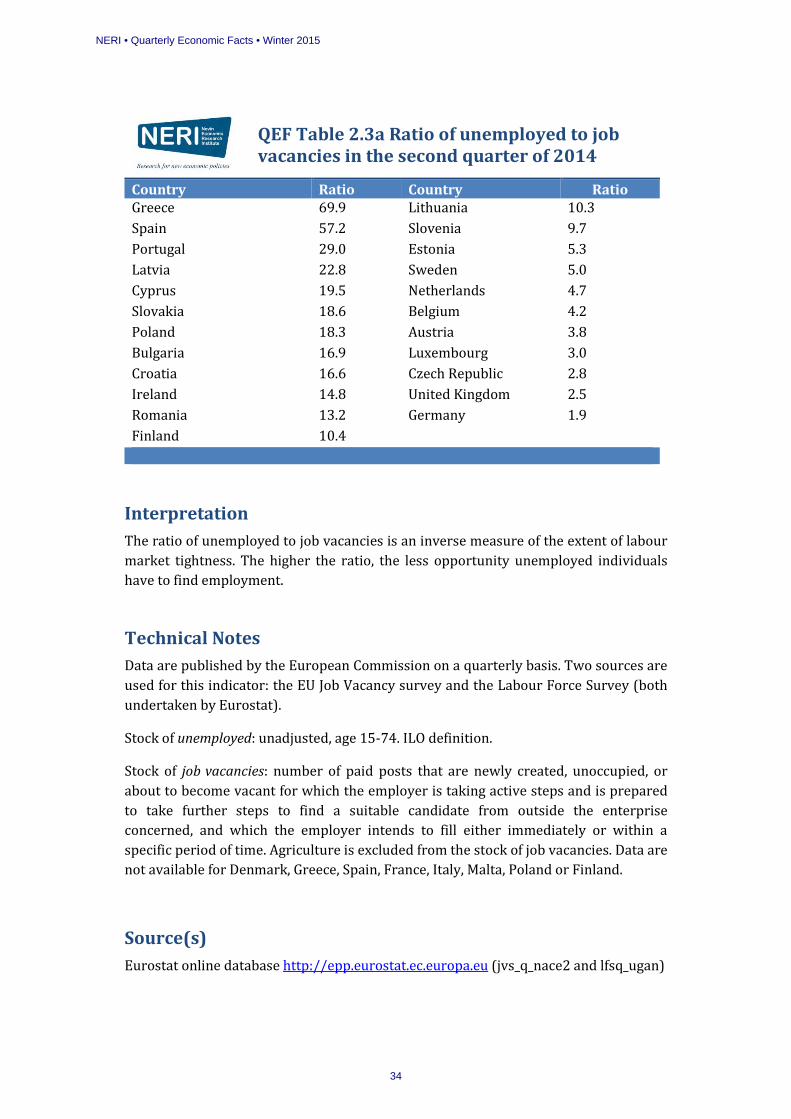
QEF Table 2.3a Ratio of unemployed to job vacancies in the second quarter of 2014
Country Ratio Country Ratio Greece 69.9 Lithuania 10.3 Spain 57.2 Slovenia 9.7 Portugal 29.0 Estonia 5.3 Latvia 22.8 Sweden 5.0 Cyprus 19.5 Netherlands 4.7 Slovakia 18.6 Belgium 4.2 Poland 18.3 Austria 3.8 Bulgaria 16.9 Luxembourg 3.0 Croatia 16.6 Czech Republic 2.8 Ireland 14.8 United Kingdom 2.5 Romania 13.2 Germany 1.9 Finland 10.4
Interpretation The ratio of unemployed to job vacancies is an inverse measure of the extent of labour market tightness. The higher the ratio, the less opportunity unemployed individuals have to find employment.
Technical Notes
Data are published by the European Commission on a quarterly basis. Two sources are used for this indicator: the EU Job Vacancy survey and the Labour Force Survey (both undertaken by Eurostat).
Stock of unemployed: unadjusted, age 15-74. ILO definition.
Stock of job vacancies: number of paid posts that are newly created, unoccupied, or about to become vacant for which the employer is taking active steps and is prepared to take further steps to find a suitable candidate from outside the enterprise concerned, and which the employer intends to fill either immediately or within a specific period of time. Agriculture is excluded from the stock of job vacancies. Data are not available for Denmark, Greece, Spain, France, Italy, Malta, Poland or Finland.
Source(s) Eurostat online database http://epp.eurostat.ec.europa.eu (jvs_q_nace2 and lfsq_ugan)
NERI • Quarterly Economic Facts • Winter 2015
34
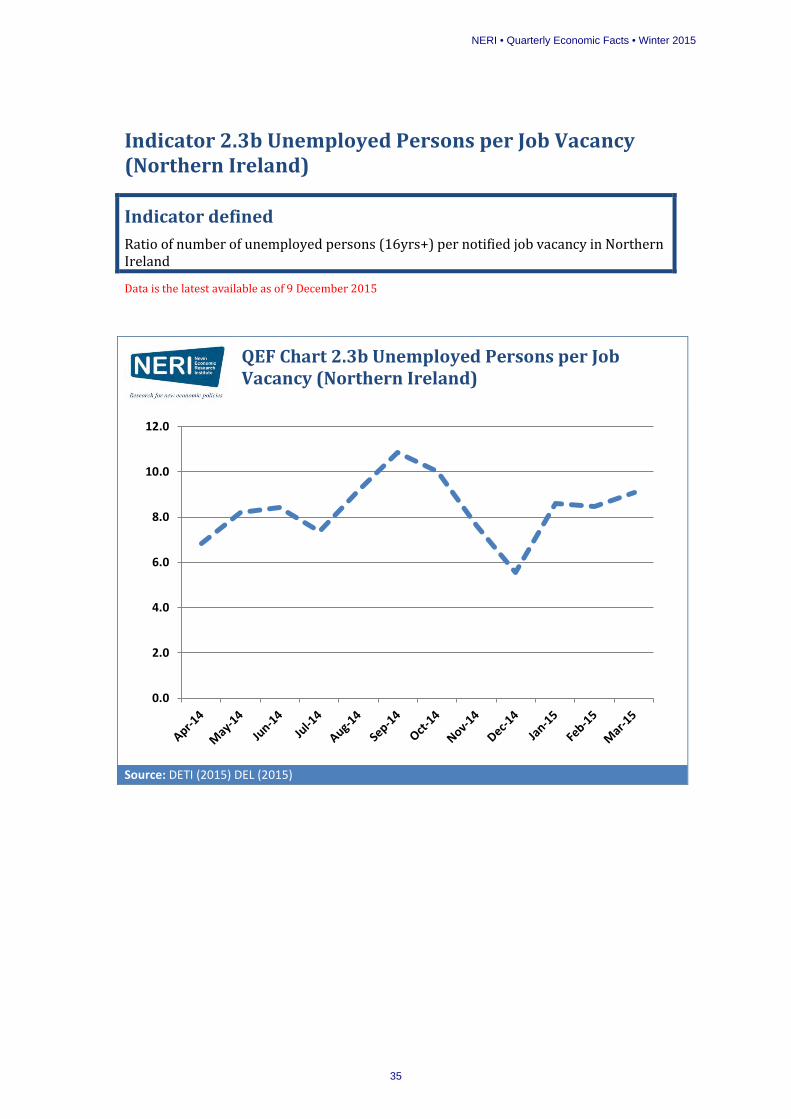
Indicator 2.3b Unemployed Persons per Job Vacancy (Northern Ireland)
Indicator defined Ratio of number of unemployed persons (16yrs+) per notified job vacancy in Northern Ireland Data is the latest available as of 9 December 2015
QEF Chart 2.3b Unemployed Persons per Job Vacancy (Northern Ireland)
Source: DETI (2015) DEL (2015)
0.0
2.0
4.0
6.0
8.0
10.0
12.0
NERI • Quarterly Economic Facts • Winter 2015
35

QEF Table 2.3 Unemployed Persons per Job Vacancy (Northern Ireland)
Quarter No.'s Unemployed
No. of Vacancies
Unemployed per Vacancy
Apr-14
61,000 4,178 6.8 May-14
59,000 4,836 8.2
Jun-14
58,000 4,883 8.4 Jul-14
57,000 4,210 7.4
Aug-14
53,000 4,870 9.2 Sep-14
52,000 5,651 10.9
Oct-14
55,000 5,512 10.0 Nov-14
50,000 3,803 7.6
Dec-14
50,000 2,780 5.6 Jan-15
52,000 4,466 8.6
Feb-15
53,000 4,492 8.5 Mar-15
55,000 4,995 9.1
Note: Note if required here under the table Source: DEL (2015) & DETI (2015)
Interpretation Vacancy statistics are an important measure of the surplus demand for labour in the economy while unemployment numbers represent and important measure of the surplus supply of labour in the economy. Taken together these statistics can indicate the degree to which the economy suffers from a lack of supply or a lack of demand. In Northern Ireland for the last four years has suffered from a lack of demand in the economy. While there has been a fall in the total numbers unemployed over the last year, job vacancies have also decreased leading to a 2.3 increase in the ratio.
Technical Notes
The number of unemployed persons is those aged 16 and over who meet ILO definition of unemployment. Vacancies are defined as those notified to Job Centres/Jobs & Benefits Offices of the Department for Employment and Learning that have been placed or cancelled. This includes vacancies filled by Job Centres/Jobs & Benefits Offices or other recruitment channels and vacancies that have been withdrawn.
Source(s) Unemployment: Northern Ireland Labour Force Survey DETI Labour Market Statistics (LFS Key Data Historical Series 1995 - Present).
Vacancies: Department of Employment and Learning Statistics and Research
NERI • Quarterly Economic Facts • Winter 2015
36
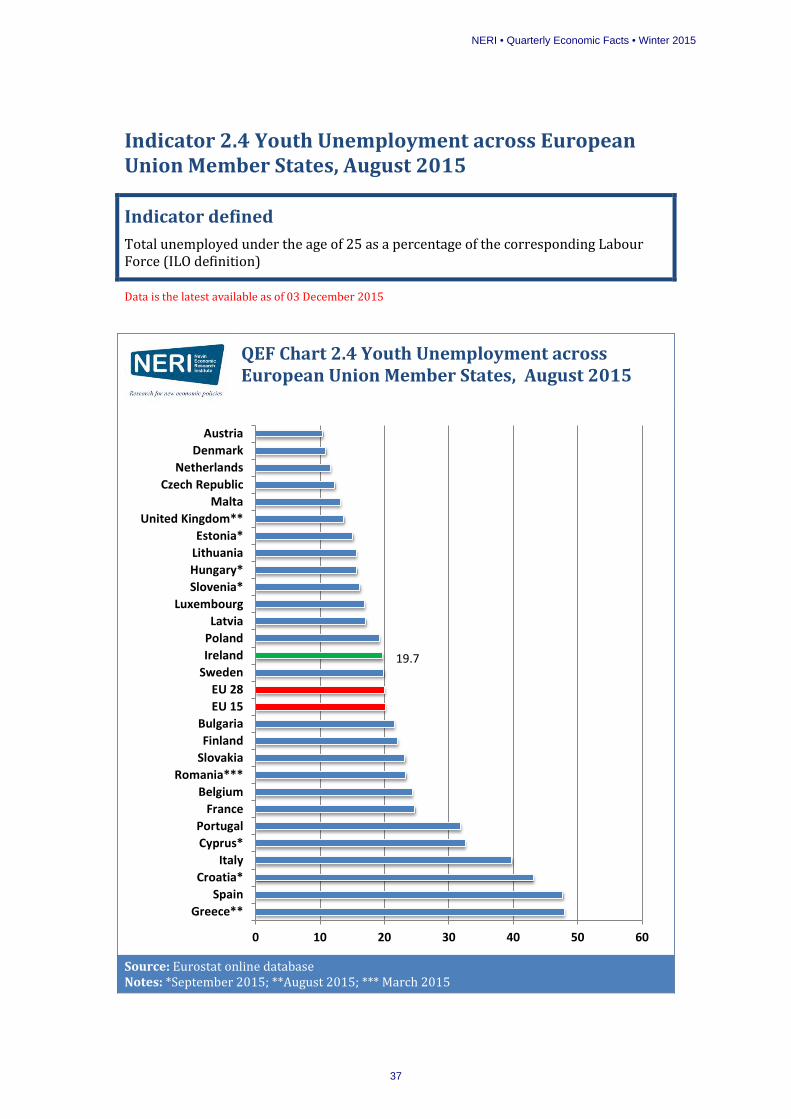
Indicator 2.4 Youth Unemployment across European Union Member States, August 2015
Indicator defined Total unemployed under the age of 25 as a percentage of the corresponding Labour Force (ILO definition)
Data is the latest available as of 03 December 2015
QEF Chart 2.4 Youth Unemployment across European Union Member States, August 2015
Source: Eurostat online database Notes: *September 2015; **August 2015; *** March 2015
0 10 20 30 40 50 60
Greece**Spain
Croatia*Italy
Cyprus*Portugal
FranceBelgium
Romania***SlovakiaFinland
BulgariaEU 15EU 28
SwedenIrelandPolandLatvia
LuxembourgSlovenia*Hungary*LithuaniaEstonia*
United Kingdom**Malta
Czech RepublicNetherlands
DenmarkAustria
19.7
NERI • Quarterly Economic Facts • Winter 2015
37
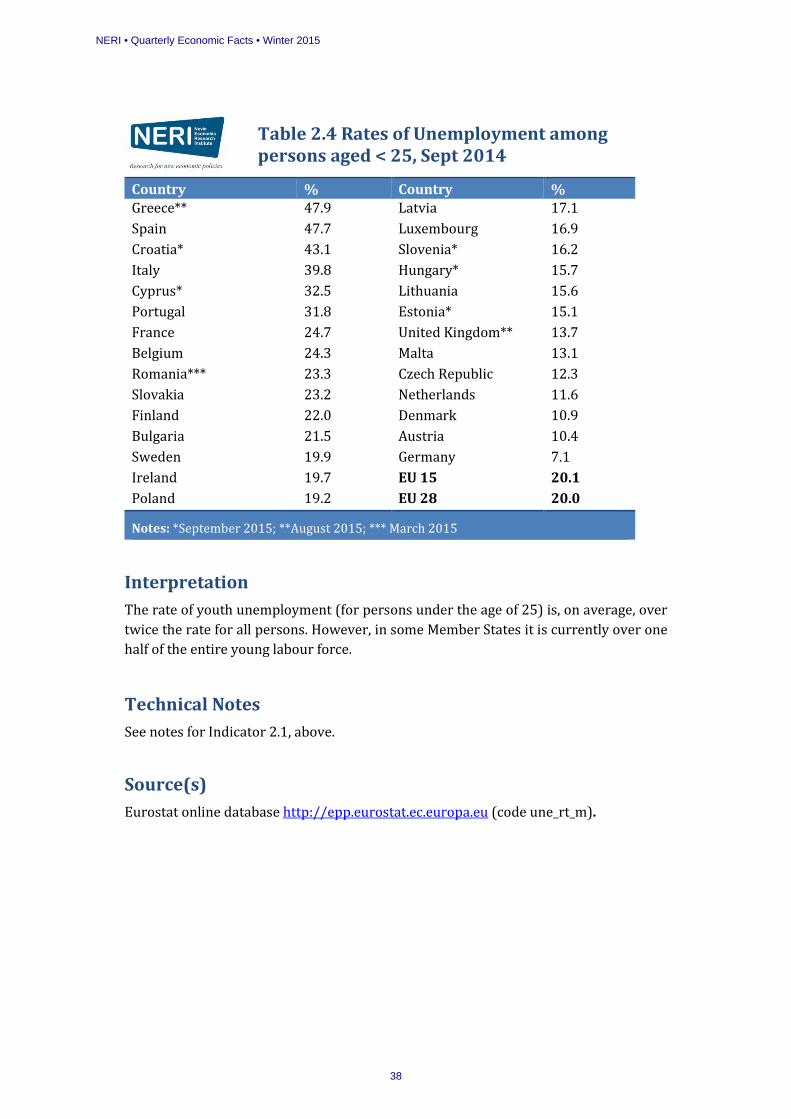
Table 2.4 Rates of Unemployment among persons aged < 25, Sept 2014
Country % Country % Greece** 47.9 Latvia 17.1 Spain 47.7 Luxembourg 16.9 Croatia* 43.1 Slovenia* 16.2 Italy 39.8 Hungary* 15.7 Cyprus* 32.5 Lithuania 15.6 Portugal 31.8 Estonia* 15.1 France 24.7 United Kingdom** 13.7 Belgium 24.3 Malta 13.1 Romania*** 23.3 Czech Republic 12.3 Slovakia 23.2 Netherlands 11.6 Finland 22.0 Denmark 10.9 Bulgaria 21.5 Austria 10.4 Sweden 19.9 Germany 7.1 Ireland 19.7 EU 15 20.1 Poland 19.2 EU 28 20.0
Notes: *September 2015; **August 2015; *** March 2015
Interpretation The rate of youth unemployment (for persons under the age of 25) is, on average, over twice the rate for all persons. However, in some Member States it is currently over one half of the entire young labour force.
Technical Notes See notes for Indicator 2.1, above.
Source(s) Eurostat online database http://epp.eurostat.ec.europa.eu (code une_rt_m).
NERI • Quarterly Economic Facts • Winter 2015
38

Indicator 2.5 Young People Not in Education, Employment or Training (NEETs), ROI and NI
Indicator defined Percentage of young people aged 18-24 not in employment and not in any education and training
Data is the latest available as of 9 December 2015
QEF Chart 2.5 NEETs Northern Ireland and the Republic of Ireland
Source: Eurostat (2015)
0
5
10
15
20
25
30
2000 2001 2002 2003 2004 2005 2006 2007 2008 2009 2010 2011 2012 2013 2014
Northern Ireland Republic of Ireland
NERI • Quarterly Economic Facts • Winter 2015
39

QEF Table 2.5 NEETs Northern Ireland and the Republic of Ireland
Year NI Rep. of Ireland 2000 12.9 - 2001 14.9 - 2002 15.1 15 2003 11.1 12.9 2004 12.2 13.0 2005 9.3 12.6 2006 8.6 11.8 2007 14.7 12.5 2008 16.9 17.4 2009 18.2 23.1 2010 18.6 24.1 2011 19.3 24.0 2012 21.7 23.8 2013 19.1 20.5 2014 19.2 19.5
Source: Eurostat (2015)
Interpretation NEET describes a situation where a young person is unemployed and not engaged in any education or training. This situation could lead to a state of permanent detachment from the labour market as the individual lacks experience or the training and skills necessary to gain employment. The NEET rate as described in the graph and table above shows the picture across the island of Ireland. The rate increased significantly in both jurisdictions since 2007, peaking in 2010 in the Republic and 2012 in Northern Ireland. There has been a substantial decrease in the Republic of Ireland in the last two years, but the NEET rate increased in Northern Ireland in 2014.
Technical Notes
The indicator corresponds to the percentage of the population of a given age who are not employed and not involved in further education or training. The numerator of the indicator refers to persons who meet the following two conditions: (a) they are not employed (i.e. unemployed or inactive according to the International Labour Organisation definition) and (b) they have not received any education or training in the four weeks preceding the survey. The denominator is the total population.
Source(s) Eurostat online database http://epp.eurostat.ec.europa.eu (edat_lfse_22)
NERI • Quarterly Economic Facts • Winter 2015
40

Indicator 2.6 A Profile of Economic Inactivity among those who want to work in Northern Ireland
Indicator defined Reasons for economic inactivity in Northern Ireland among those who want to work
Data is the latest available as of 9 December 2015
QEF Chart 2.6 Reasons for Economic Inactivity in Northern Ireland, 1995-2015
Source: NISRA (2015)
0
5
10
15
20
25
30
Long-term sick Family & home care Other
NERI • Quarterly Economic Facts • Winter 2015
41

QEF Table 2.6 Reasons for Economic Inactivity, 1995-2015 (000’s of workers)
Quarter Long-term sick Family & home care Other 1995 Q1 9 25 27 1996 Q1 9 24 20 1997 Q1 16 23 17 1998 Q1 16 24 13 1999 Q1 18 23 16 2000 Q1 20 25 16 2001 Q1 21 18 14 2002 Q1 19 22 15 2003 Q1 14 21 9 2004 Q1 16 15 13 2005 Q1 11 13 11 2006 Q1 10 14 12 2007 Q1 17 13 11 2008 Q1 18 16 16 2009 Q1 16 9 17 2010 Q1 16 12 13 2011 Q1 15 15 15 2012 Q1 14 14 16 2013 Q1 15 13 19 2014 Q1 13 13 19 2015 Q1 17 16 15 Source: NISRA (2015)
Interpretation The indicator gives reasons for economic inactivity among those who want a job. Northern Ireland has higher levels of economic inactivity compared to the UK. While there has been a modest reduction in overall rates of economic inactivity, the same reduction has also taken place at UK level. The chart and table above show that there is no one clear reason why people who want to work remain economically inactive, and further research into this trend is required.
Technical Notes The grouping above is taken from economically inactive workers aged 16+. Of these the graph and chart are based on those who want a job but had not sought employment in the previous four weeks.
Source(s) NISRA (2014) LFS Key Historical Data Series (1995-Present)
NERI • Quarterly Economic Facts • Winter 2015
42

3 Labour Costs and Earnings
Indicator 3.1a Cost of Employing Labour Across Advanced EU Economies (EU15)
Indicator 3.1b Cost of Employing Labour in the Accommodation and Food Sectors Across Advanced EU Economies (EU15)
Indicator 3.1c Cost of Employing Labour in the Wholesale and Retail Trade Sectors Across Advanced EU Economies (EU15)
Indicator 3.1d Cost of Employing Labour in the Manufacturing Sectors Across Advanced EU Economies (EU15)
Indicator 3.2 Comparisons of National Minimum Wage across the EU
Indicator 3.3a Trends in Earnings and Prices (Republic of Ireland)
Indicator 3.3b Trends in Earnings and Prices (Northern Ireland)
Indicator 3.4 Gender Pay Gap across the EU
NERI • Quarterly Economic Facts • Winter 2015
43

NERI • Quarterly Economic Facts • Winter 2015
44
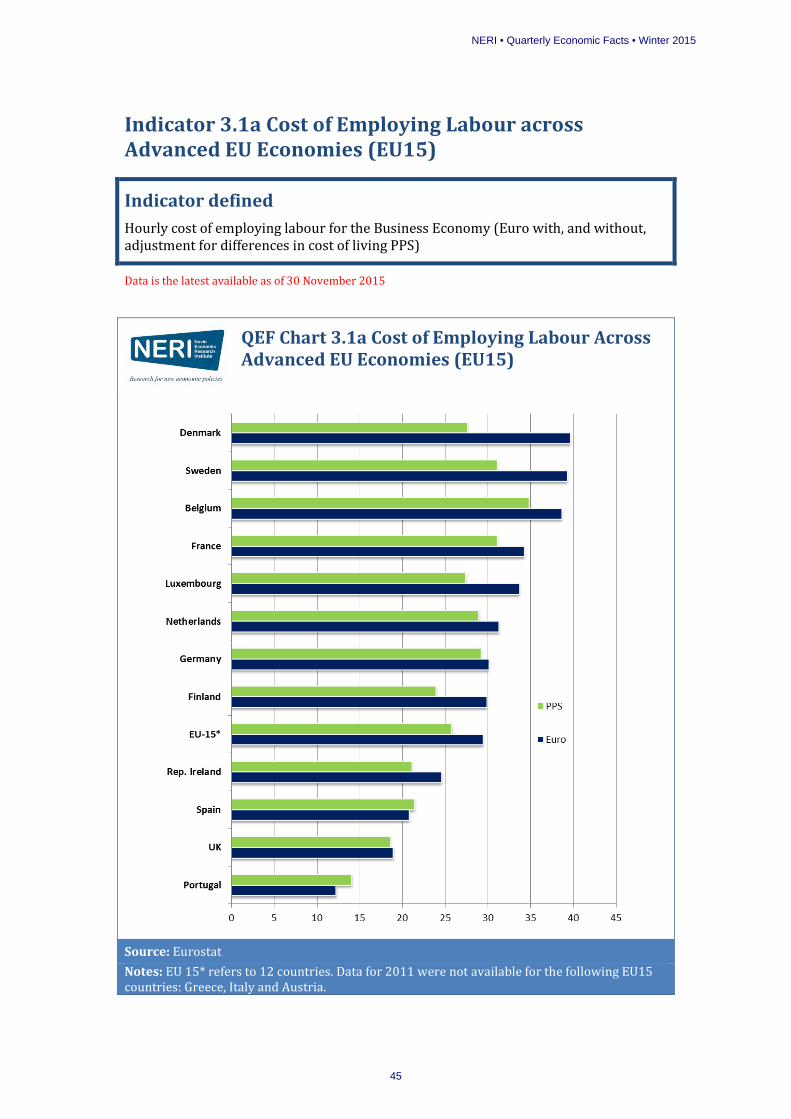
Indicator 3.1a Cost of Employing Labour across Advanced EU Economies (EU15)
Indicator defined Hourly cost of employing labour for the Business Economy (Euro with, and without, adjustment for differences in cost of living PPS)
Data is the latest available as of 30 November 2015
QEF Chart 3.1a Cost of Employing Labour Across Advanced EU Economies (EU15)
Source: Eurostat Notes: EU 15* refers to 12 countries. Data for 2011 were not available for the following EU15 countries: Greece, Italy and Austria.
NERI • Quarterly Economic Facts • Winter 2015
45
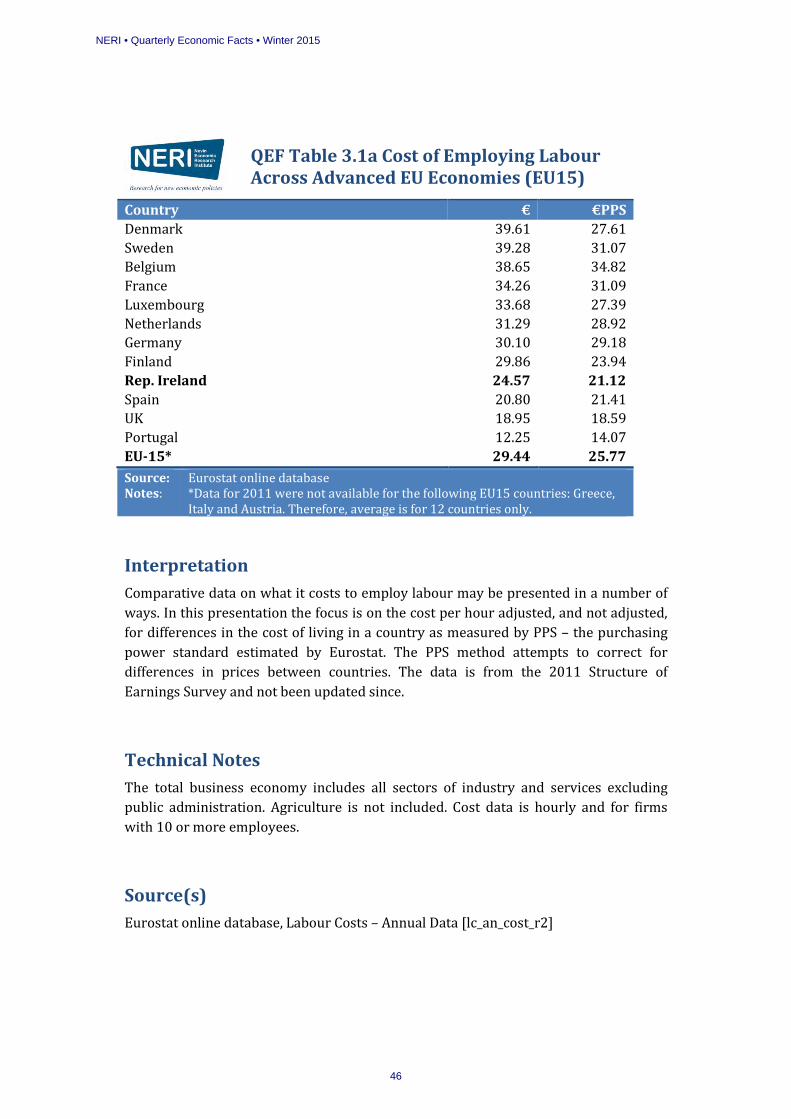
QEF Table 3.1a Cost of Employing Labour Across Advanced EU Economies (EU15)
Country € €PPS Denmark 39.61 27.61 Sweden 39.28 31.07 Belgium 38.65 34.82 France 34.26 31.09 Luxembourg 33.68 27.39 Netherlands 31.29 28.92 Germany 30.10 29.18 Finland 29.86 23.94 Rep. Ireland 24.57 21.12 Spain 20.80 21.41 UK 18.95 18.59 Portugal 12.25 14.07 EU-15* 29.44 25.77 Source: Eurostat online database Notes: *Data for 2011 were not available for the following EU15 countries: Greece,
Italy and Austria. Therefore, average is for 12 countries only.
Interpretation Comparative data on what it costs to employ labour may be presented in a number of ways. In this presentation the focus is on the cost per hour adjusted, and not adjusted, for differences in the cost of living in a country as measured by PPS – the purchasing power standard estimated by Eurostat. The PPS method attempts to correct for differences in prices between countries. The data is from the 2011 Structure of Earnings Survey and not been updated since.
Technical Notes The total business economy includes all sectors of industry and services excluding public administration. Agriculture is not included. Cost data is hourly and for firms with 10 or more employees.
Source(s) Eurostat online database, Labour Costs – Annual Data [lc_an_cost_r2]
NERI • Quarterly Economic Facts • Winter 2015
46

Indicator 3.1b Cost of Employing Labour in the Accommodation and Food Sectors across Advanced EU Economies (EU15)
Indicator defined Hourly cost of employing labour for the Accommodation and Food Sector (Euro with, and without, adjustment for differences in cost of living PPS)
Data is the latest available as of 30 November 2015
QEF Chart 3.1b Cost of Employing Labour in the Accommodation and Food Sectors across Advanced EU Economies (EU15)
Source: Eurostat Notes: *EU-15 refers to 11 countries. Data for 2011 were not available for the following EU15 countries: Belgium, Greece, Italy and Austria
NERI • Quarterly Economic Facts • Winter 2015
47

QEF Table 3.1b Cost of Employing Labour in the Accommodation and Food Sectors across Advanced EU Economies (EU15)
Country € €PPS Denmark 27.78 19.36 Sweden 23.95 18.94 France 23.05 20.91 Finland 22.98 18.43 Netherlands 18.62 17.21 Luxembourg 17.56 14.28 Germany 14.70 14.25 Rep. Ireland 13.83 11.89 Spain 13.83 14.23 United Kingdom 10.32 10.12 Portugal 8.93 10.26 EU-15* 17.78 15.44 Source: Eurostat online database Notes: *EU-15 refers to 11 countries. Data for 2011 were not available for the
following EU15 countries: Belgium, Greece, Italy and Austria
Interpretation See interpretation for indicator 3.1a.
Technical Notes See notes for indicator 3.1a.
Source(s) Eurostat online database, Labour Costs – Annual Data [lc_an_cost_r2]
NERI • Quarterly Economic Facts • Winter 2015
48

Indicator 3.1c Cost of Employing Labour in the Wholesale and Retail Trade Sectors across Advanced EU Economies (EU15)
Indicator defined Hourly cost of employing labour in the wholesale and retail trade including the repair of motor vehicles and motorcycles sector (Euro with, and without, adjustment for differences in cost of living PPS)
Data is the latest available as of 30 November 2015
QEF Chart 3.1c Cost of Employing Labour in the Wholesale and Retail Trade Sectors across Advanced EU Economies (EU15)
Source: Eurostat Notes: *EU-15 refers to 12 countries. Data for 2011 were not available for the following EU15 countries: Greece, Italy and Austria
NERI • Quarterly Economic Facts • Winter 2015
49

QEF Table 3.1c Cost of Employing Labour in the Wholesale and Retail Trade Sectors across Advanced EU Economies (EU15)
Country € €PPS Denmark 35.27 24.58 Sweden 34.61 27.37 Belgium 33.98 30.61 France 28.68 26.02 Netherlands 27.10 25.05 Finland 26.12 20.94 Germany 24.90 24.14 Luxembourg 23.05 18.75 Rep. Ireland 19.30 16.59 Spain 18.14 18.67 United Kingdom 15.82 15.51 Portugal 11.47 13.17 EU-15* 24.87 21.78 Source: Eurostat online database Notes: *EU-15 refers to 12 countries. Data for 2011 were not available for the
following EU15 countries: Greece, Italy and Austria
Interpretation See interpretation for indicator 3.1a.
Technical Notes See notes for indicator 3.1a.
Source(s) Eurostat online database, Labour Costs – Annual Data [lc_an_cost_r2]
NERI • Quarterly Economic Facts • Winter 2015
50

Indicator 3.1d Cost of Employing Labour in the Manufacturing Sectors across Advanced EU Economies (EU15)
Indicator defined Hourly cost of employing labour in the wholesale and retail trade including the repair of motor vehicles and motorcycles sector (Euro with, and without, adjustment for differences in cost of living PPS)
Data is the latest available as of 30 November 2015
QEF Chart 3.1d Cost of Employing Labour in the Manufacturing Sectors across Advanced EU Economies (EU15)
Source: Eurostat Notes: *EU-15 refers to 12 countries. Data for 2011 were not available for the following EU15 countries: Greece, Italy and Austria
NERI • Quarterly Economic Facts • Winter 2015
51
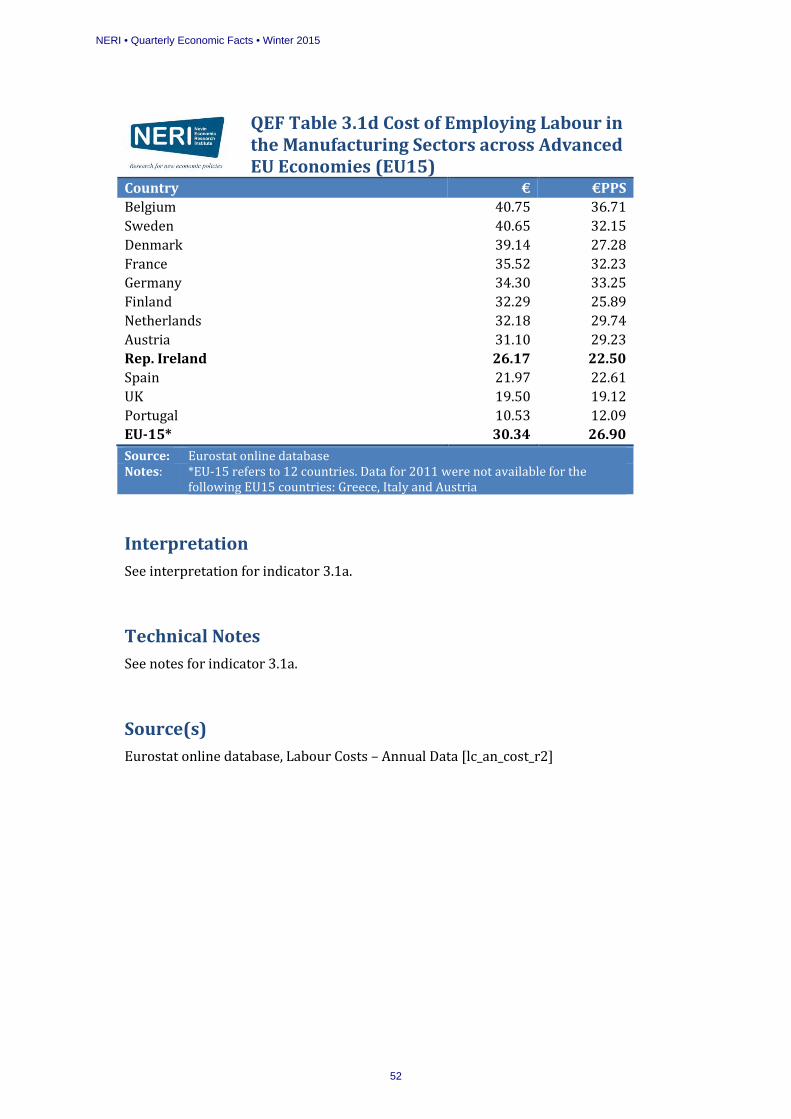
QEF Table 3.1d Cost of Employing Labour in the Manufacturing Sectors across Advanced EU Economies (EU15)
Country € €PPS Belgium 40.75 36.71 Sweden 40.65 32.15 Denmark 39.14 27.28 France 35.52 32.23 Germany 34.30 33.25 Finland 32.29 25.89 Netherlands 32.18 29.74 Austria 31.10 29.23 Rep. Ireland 26.17 22.50 Spain 21.97 22.61 UK 19.50 19.12 Portugal 10.53 12.09 EU-15* 30.34 26.90 Source: Eurostat online database Notes: *EU-15 refers to 12 countries. Data for 2011 were not available for the
following EU15 countries: Greece, Italy and Austria
Interpretation See interpretation for indicator 3.1a.
Technical Notes See notes for indicator 3.1a.
Source(s) Eurostat online database, Labour Costs – Annual Data [lc_an_cost_r2]
NERI • Quarterly Economic Facts • Winter 2015
52
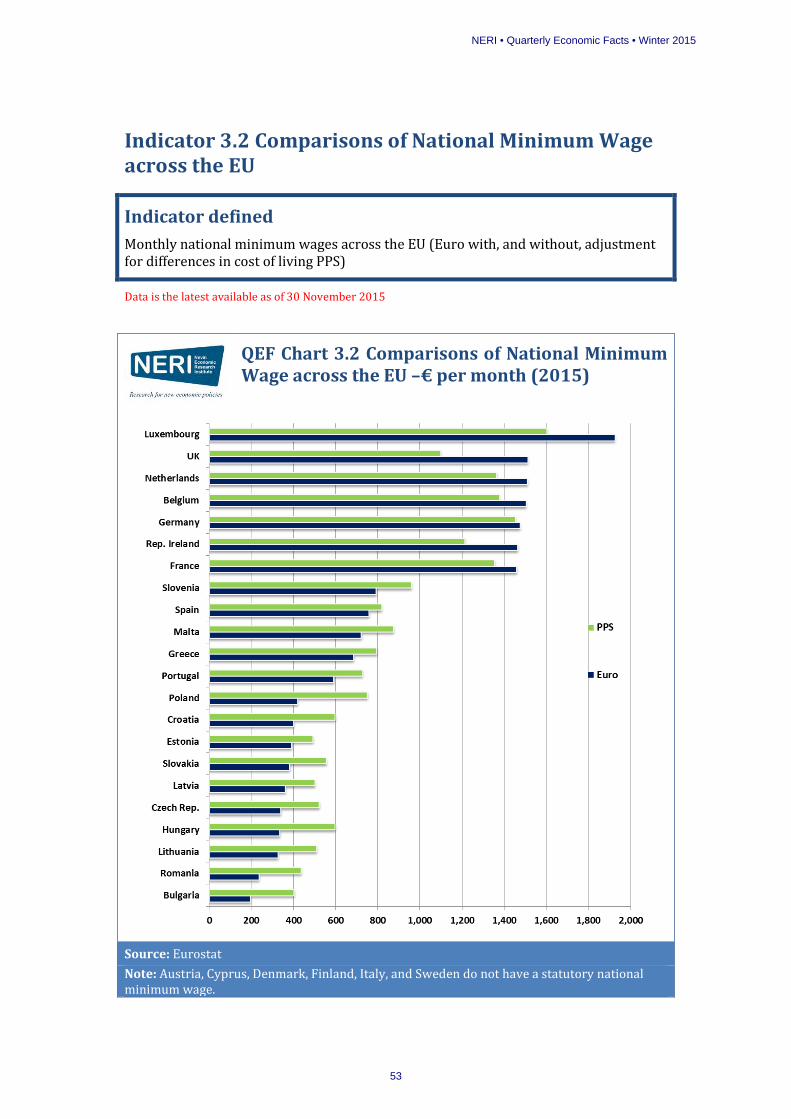
Indicator 3.2 Comparisons of National Minimum Wage across the EU
Indicator defined Monthly national minimum wages across the EU (Euro with, and without, adjustment for differences in cost of living PPS)
Data is the latest available as of 30 November 2015
QEF Chart 3.2 Comparisons of National Minimum Wage across the EU –€ per month (2015)
Source: Eurostat Note: Austria, Cyprus, Denmark, Finland, Italy, and Sweden do not have a statutory national minimum wage.
NERI • Quarterly Economic Facts • Winter 2015
53

QEF Table 3.2 Comparisons of National Minimum Wage across the EU, € per month
Country 2007 2015 Country 2007 2015
Belgium 1,283.00 1,501.82 Luxembourg 1,570.28 1,922.96 Bulgaria 92.03 194.29 Malta 601.90 720.46 Croatia n/a 398.90 Netherlands 1,317.00 1,507.80 Czech Rep. 278.57 337.58 Poland 248.43 417.55 Estonia 230.08 390.00 Portugal 470.17 589.17 France 1,280.07 1,457.52 Rep. Ireland 1,461.85 1,461.85 Germany n/a 1,473.00 Romania 124.44 234.77 Greece 767.55 683.76 Slovakia 225.96 380.00 Hungary 266.10 333.41 Slovenia 521.80 790.73 Latvia 172.34 360.00 Spain 665.70 756.70 Lithuania 202.73 325.00 UK 1,310.09 1,509.70 Source: Eurostat online database Notes: Austria, Cyprus, Denmark, Finland, Italy, and Sweden do not have a statutory
national minimum wage. Data is for the second half of both years.
Interpretation National monthly minimum wages, adjusted for prices, reflect the minimum standard of living that a full-time employed worker can expect. Minimum wages (adjusted or not for prices) are not an ideal measure of labour cost competitiveness. This is as: many high pay countries without statutory minimum wages have de facto minimum wages; minimum wages do not include other labour costs, such as social insurance; and monthly wages depend on hours worked which vary across countries. In general, labour costs data gives a better indication of labour cost competitiveness (see indicators 3.1a, 3.1b, 3.1c, 3.1d).
Technical Notes Belgium and Greece have a national minimum wage which is set by national intersectoral agreements. Eurostat includes both countries in the data collection as the minimum wage is fairly universal in coverage. For Ireland, France, the United Kingdom and Germany the minimum wage is fixed at an hourly rate, and for Malta the minimum wage is fixed at a weekly rate. These have been converted to a monthly rate. Germany introduced its minimum wage from 1st January 2015.
Source(s) Eurostat online database, Minimum wages [code earn_mw_cur]
NERI • Quarterly Economic Facts • Winter 2015
54
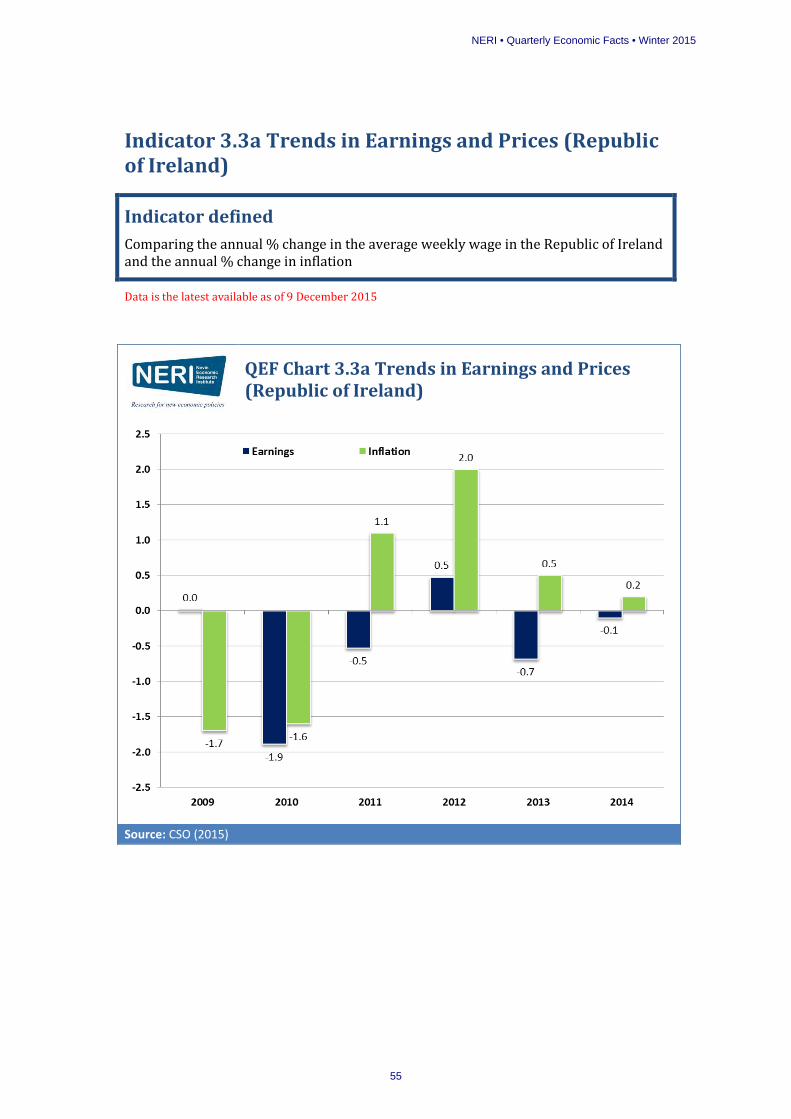
Indicator 3.3a Trends in Earnings and Prices (Republic of Ireland)
Indicator defined Comparing the annual % change in the average weekly wage in the Republic of Ireland and the annual % change in inflation
Data is the latest available as of 9 December 2015
QEF Chart 3.3a Trends in Earnings and Prices (Republic of Ireland)
Source: CSO (2015)
NERI • Quarterly Economic Facts • Winter 2015
55
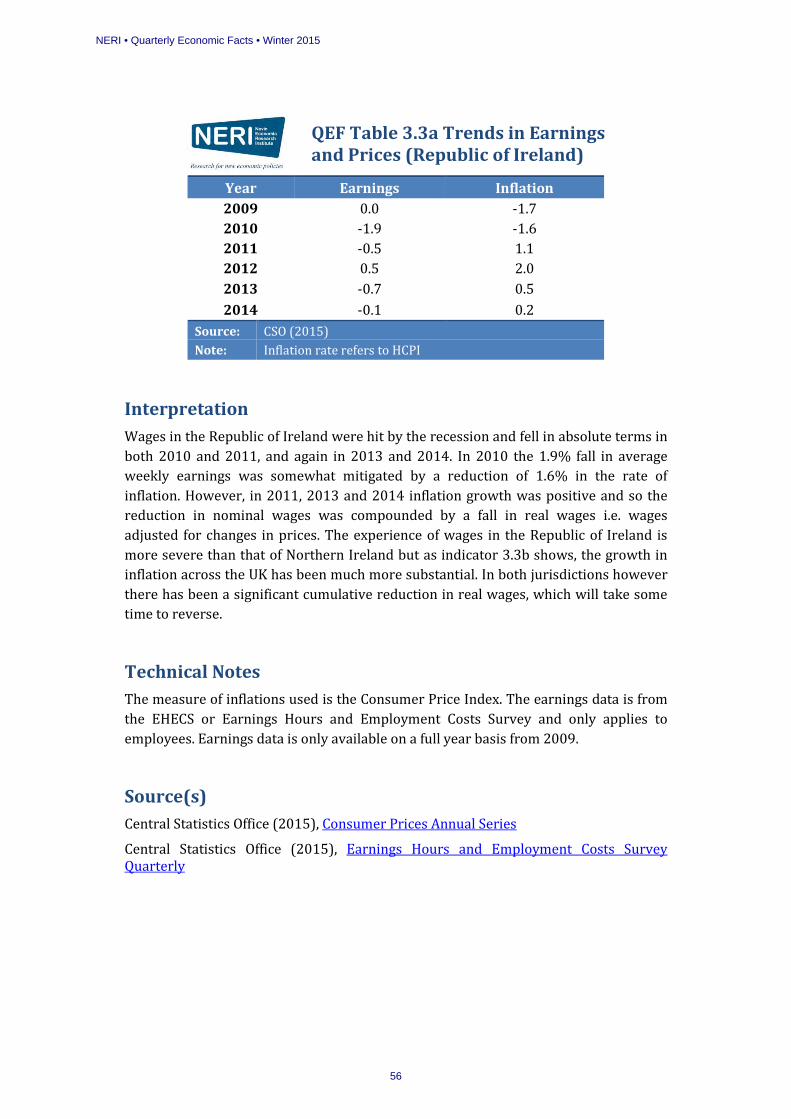
QEF Table 3.3a Trends in Earnings and Prices (Republic of Ireland)
Year Earnings Inflation 2009 0.0 -1.7 2010 -1.9 -1.6 2011 -0.5 1.1 2012 0.5 2.0 2013 -0.7 0.5 2014 -0.1 0.2
Source: CSO (2015) Note: Inflation rate refers to HCPI
Interpretation Wages in the Republic of Ireland were hit by the recession and fell in absolute terms in both 2010 and 2011, and again in 2013 and 2014. In 2010 the 1.9% fall in average weekly earnings was somewhat mitigated by a reduction of 1.6% in the rate of inflation. However, in 2011, 2013 and 2014 inflation growth was positive and so the reduction in nominal wages was compounded by a fall in real wages i.e. wages adjusted for changes in prices. The experience of wages in the Republic of Ireland is more severe than that of Northern Ireland but as indicator 3.3b shows, the growth in inflation across the UK has been much more substantial. In both jurisdictions however there has been a significant cumulative reduction in real wages, which will take some time to reverse.
Technical Notes
The measure of inflations used is the Consumer Price Index. The earnings data is from the EHECS or Earnings Hours and Employment Costs Survey and only applies to employees. Earnings data is only available on a full year basis from 2009.
Source(s) Central Statistics Office (2015), Consumer Prices Annual Series
Central Statistics Office (2015), Earnings Hours and Employment Costs Survey Quarterly
NERI • Quarterly Economic Facts • Winter 2015
56

Indicator 3.3b Trends in Earnings and Prices (Northern Ireland)
Indicator defined Comparing the annual % change in the average weekly wage in Northern Ireland and the annual % change in UK wide inflation
Data is the latest available as of 9 December 2015
QEF Chart 3.3b Trends in Earnings and Prices (Northern Ireland)
Source: ONS (2015) & NISRA (2014)
NERI • Quarterly Economic Facts • Winter 2015
57
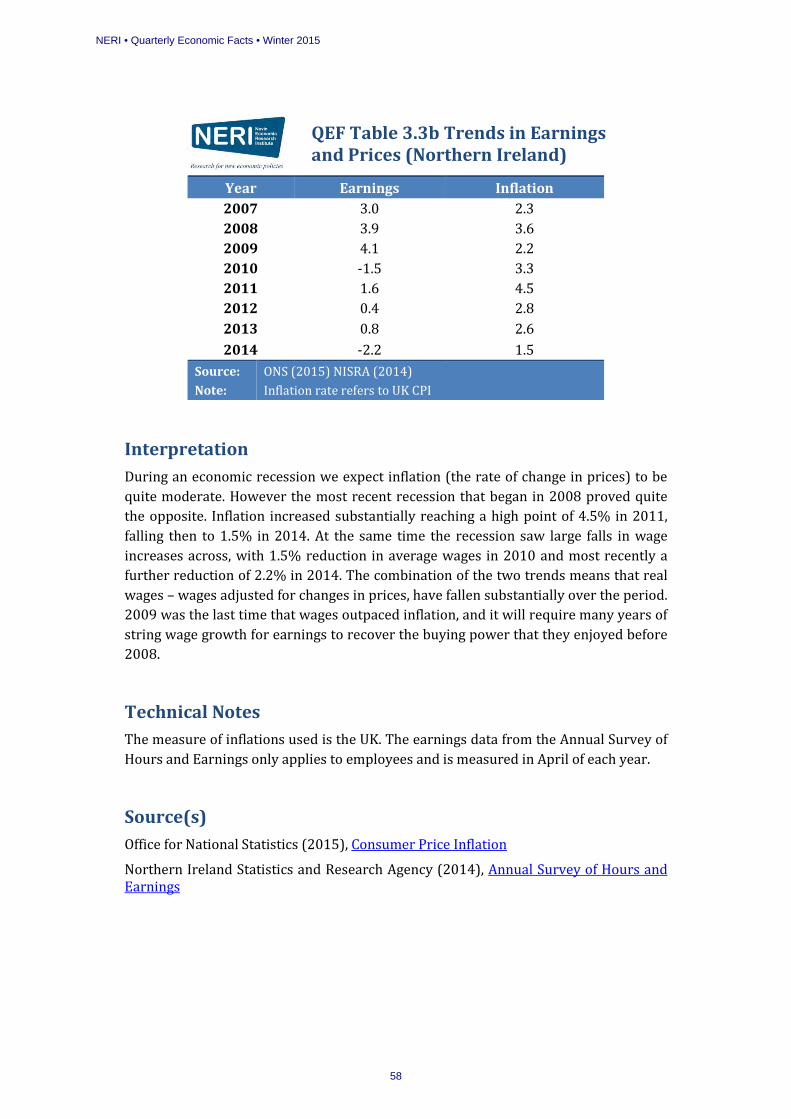
QEF Table 3.3b Trends in Earnings and Prices (Northern Ireland)
Year Earnings Inflation 2007 3.0 2.3 2008 3.9 3.6 2009 4.1 2.2 2010 -1.5 3.3 2011 1.6 4.5 2012 0.4 2.8 2013 0.8 2.6 2014 -2.2 1.5
Source: ONS (2015) NISRA (2014) Note: Inflation rate refers to UK CPI
Interpretation During an economic recession we expect inflation (the rate of change in prices) to be quite moderate. However the most recent recession that began in 2008 proved quite the opposite. Inflation increased substantially reaching a high point of 4.5% in 2011, falling then to 1.5% in 2014. At the same time the recession saw large falls in wage increases across, with 1.5% reduction in average wages in 2010 and most recently a further reduction of 2.2% in 2014. The combination of the two trends means that real wages – wages adjusted for changes in prices, have fallen substantially over the period. 2009 was the last time that wages outpaced inflation, and it will require many years of string wage growth for earnings to recover the buying power that they enjoyed before 2008.
Technical Notes
The measure of inflations used is the UK. The earnings data from the Annual Survey of Hours and Earnings only applies to employees and is measured in April of each year.
Source(s) Office for National Statistics (2015), Consumer Price Inflation
Northern Ireland Statistics and Research Agency (2014), Annual Survey of Hours and Earnings
NERI • Quarterly Economic Facts • Winter 2015
58

Indicator 3.4 Gender Pay Gap across the EU
Indicator defined The percentage difference in the average hourly earnings of males and females across the EU
Data is the latest available as of 9 December 2015
QEF Chart 3.4 Gender Pay Gap across the EU (2013)
Source: Eurostat (2015) *Rep. of Ireland data refer to 2012
NERI • Quarterly Economic Facts • Winter 2015
59
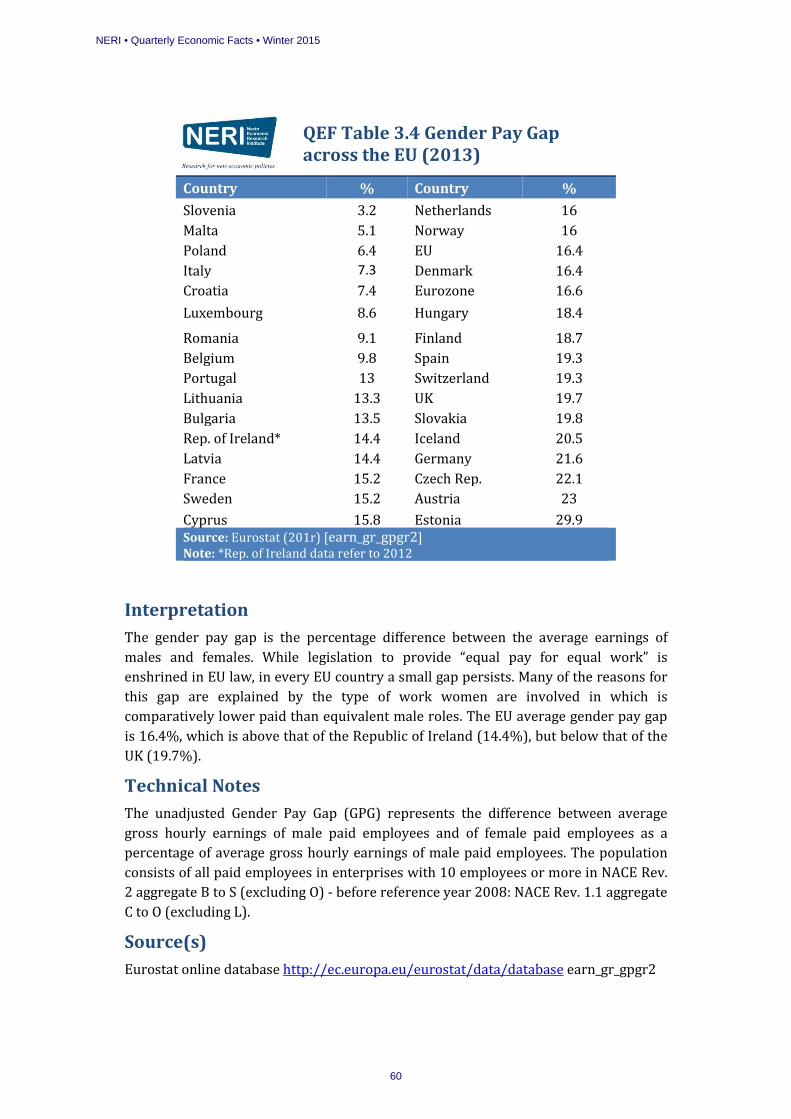
QEF Table 3.4 Gender Pay Gap across the EU (2013)
Country % Country % Slovenia 3.2 Netherlands 16 Malta 5.1 Norway 16 Poland 6.4 EU 16.4 Italy 7.3 Denmark 16.4 Croatia 7.4 Eurozone 16.6 Luxembourg 8.6 Hungary 18.4
Romania 9.1 Finland 18.7 Belgium 9.8 Spain 19.3 Portugal 13 Switzerland 19.3 Lithuania 13.3 UK 19.7 Bulgaria 13.5 Slovakia 19.8 Rep. of Ireland* 14.4 Iceland 20.5 Latvia 14.4 Germany 21.6 France 15.2 Czech Rep. 22.1 Sweden 15.2 Austria 23 Cyprus 15.8 Estonia 29.9 Source: Eurostat (201r) [earn_gr_gpgr2] Note: *Rep. of Ireland data refer to 2012
Interpretation The gender pay gap is the percentage difference between the average earnings of males and females. While legislation to provide “equal pay for equal work” is enshrined in EU law, in every EU country a small gap persists. Many of the reasons for this gap are explained by the type of work women are involved in which is comparatively lower paid than equivalent male roles. The EU average gender pay gap is 16.4%, which is above that of the Republic of Ireland (14.4%), but below that of the UK (19.7%).
Technical Notes
The unadjusted Gender Pay Gap (GPG) represents the difference between average gross hourly earnings of male paid employees and of female paid employees as a percentage of average gross hourly earnings of male paid employees. The population consists of all paid employees in enterprises with 10 employees or more in NACE Rev. 2 aggregate B to S (excluding O) - before reference year 2008: NACE Rev. 1.1 aggregate C to O (excluding L).
Source(s) Eurostat online database http://ec.europa.eu/eurostat/data/database earn_gr_gpgr2
NERI • Quarterly Economic Facts • Winter 2015
60
4 Distribution of Income, Earnings and Wealth
Indicator 4.1 Income per capita in the EU
Indicator 4.2a Income Distribution over Time (Republic of Ireland)
Indicator 4.2b Income Distribution over Time (Northern Ireland)
Indicator 4.3a Average and Median income over Time and by Gender (Republic of Ireland)
Indicator 4.3b Average and Median income over Time and by Household Type (Northern Ireland)
Indicator 4.4 Wage Share as a Percentage of GDP (Selected Countries)
Indicator 4.5a Distribution of Earnings (Republic of Ireland)
Indicator 4.5b Distribution of Earnings (Northern Ireland)
Indicator 4.6 Net Wealth per Household across Eurozone countries
Indicator 4.7 Net Financial Assets per Capita across Selected EU countries
NERI • Quarterly Economic Facts • Winter 2015
61

NERI • Quarterly Economic Facts • Winter 2015
62

Indicator 4.1 Income per capita in the EU
Indicator defined National income (GDP) in per capita (per head of population) terms expressed in Euro and adjusted for differences in cost of living (PPS)
Data is the latest available as of 30 November 2015
QEF Chart 4.1 GDP per capita in the EU, 2013 in € and €PPS terms
Source: Eurostat online database
NERI • Quarterly Economic Facts • Winter 2015
63

QEF Table 4.1 GDP per capita in the EU, 2013
Country € €PPS Country € €PPS
Luxembourg 83,400 67,900 Malta 17,200 22,700 Denmark 44,400 32,100 Slovenia 17,100 21,300 Sweden 43,800 32,700 Portugal 15,800 19,400 Austria 37,000 33,200 Czech Rep. 14,200 20,600 Netherlands 35,900 32,600 Estonia 13,900 18,800 Rep. Ireland 35,600 32,500 Slovakia 13,300 19,600 Finland 35,600 28,700 Lithuania 11,700 19,100 Belgium 34,500 30,500 Latvia 11,600 17,300 Germany 33,300 32,000 Croatia 10,100 15,600 France 31,300 27,800 Poland 10,100 17,500 UK 29,600 27,200 Hungary 9,900 17,200 Italy 25,600 25,200 Romania 7,100 13,900 Spain 22,300 24,500 Bulgaria 5,500 12,000 Cyprus 19,000 22,100 EU-15 29,800 28,000 Greece* 17,400 19,500 EU-28 25,700 25,700 Source: Eurostat online database Note: *Data for Greece is for 2012
Interpretation GDP measures the value of all activities in the economy and the table and chart above provide values for this measure in 2013 on a per capita basis (divided by the population of the country). The GDP per capita figure for the Republic of Ireland was €35,600 in 2013, the sixth highest in the EU. Using Gross National Product, a measure which somewhat takes account of the income earned in Ireland and subsequently repatriated by multinational companies, the CSO reported Ireland’s GNP per capita for 2013 as €32,115 (ESA 2010 definition). In the UK GDP per capita in 2013 was equivalent to €29,600. There are no GDP figures available for Northern Ireland.
While the above data details the average levels of income, the remainder of this section examines the distribution of that income and wealth.
Technical Notes As the real value of a Euro differs between countries, given variations in price levels, the data is also presented in PPS terms – the purchasing power standard estimated by Eurostat. The PPS method attempts to correct for differences in prices between countries and therefore gives a more comparable picture of the buying power of income.
Source(s) Eurostat online database, GDP per capita - Annual Data [nama_aux_gph]
NERI • Quarterly Economic Facts • Winter 2015
64
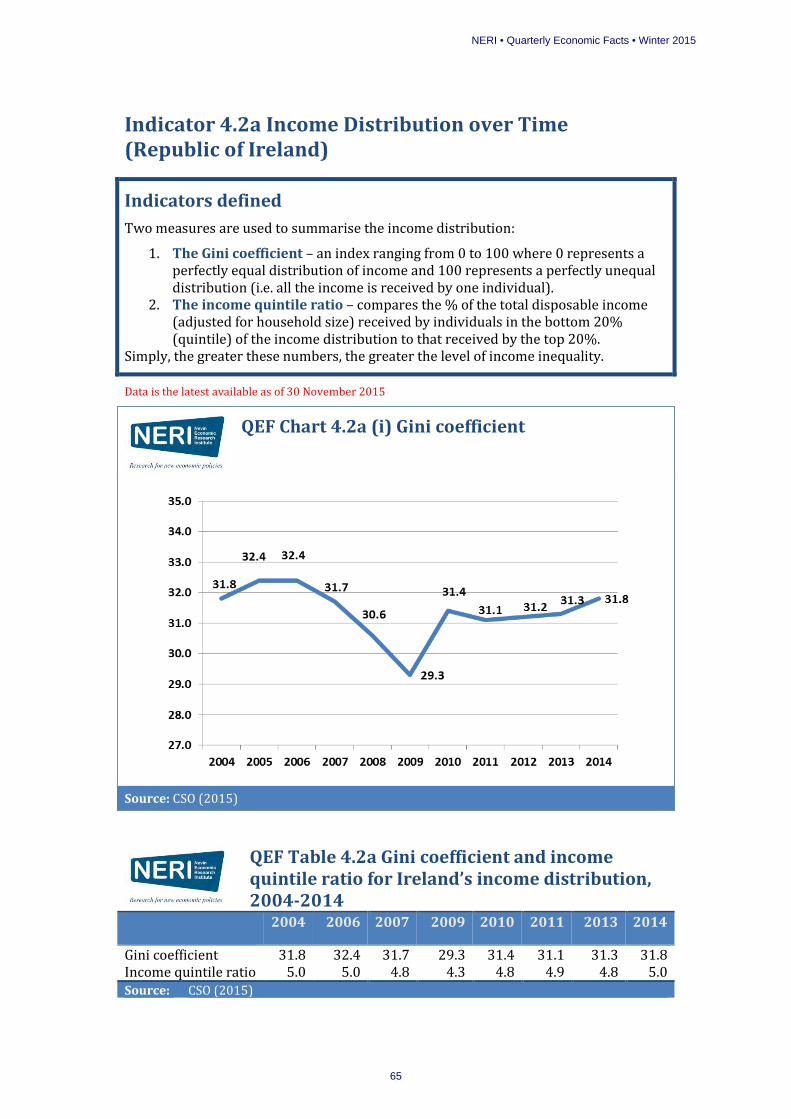
Indicator 4.2a Income Distribution over Time (Republic of Ireland)
Indicators defined Two measures are used to summarise the income distribution:
1. The Gini coefficient – an index ranging from 0 to 100 where 0 represents a perfectly equal distribution of income and 100 represents a perfectly unequal distribution (i.e. all the income is received by one individual).
2. The income quintile ratio – compares the % of the total disposable income (adjusted for household size) received by individuals in the bottom 20% (quintile) of the income distribution to that received by the top 20%.
Simply, the greater these numbers, the greater the level of income inequality.
Data is the latest available as of 30 November 2015
QEF Chart 4.2a (i) Gini coefficient
Source: CSO (2015)
QEF Table 4.2a Gini coefficient and income quintile ratio for Ireland’s income distribution, 2004-2014
2004 2006 2007 2009 2010 2011 2013 2014
Gini coefficient 31.8 32.4 31.7 29.3 31.4 31.1 31.3 31.8 Income quintile ratio 5.0 5.0 4.8 4.3 4.8 4.9 4.8 5.0 Source: CSO (2015)
NERI • Quarterly Economic Facts • Winter 2015
65

QEF Chart 4.2a (ii) Income quintile ratio, 2004-2014
Source: : CSO (2015)
Interpretation Between 2004 and 2007 Ireland’s income distribution was reasonably static with only small movements in both the measures reported above. Subsequently, during 2008 and 2009, the gap between the top and bottom quintile (20%) narrowed meaning income inequality fell to its lowest level since the introduction of the CSO’s annual Survey on Income and Living Conditions (SILC). However, since 2009 both measures have increased once again. In 2014, the income of the top quintile was 5 times that of the bottom quintile while the Gini coefficient was 31.8.
Technical Notes The data used to compile these figures comes from the CSO’s Survey on Income and Living Conditions (SILC). This survey, which has been carried out annually since 2004, collects data on a representative sample of the national population with the latest survey in 2014 providing data on 14,078 individuals in 5,486 households. The income data used is disposable income, representing the income individuals have to spend once they have paid all their income taxes and received any welfare entitlements. Further details on the SILC survey and its income variables are available from the CSO documents and website references below.
Source(s) CSO (2015) Survey on Income and Living Conditions 2014. Dublin, Stationery Office. CSO SILC website: www.cso.ie/en/silc/
NERI • Quarterly Economic Facts • Winter 2015
66

Indicator 4.2b Income Distribution over Time (Northern Ireland)
Indicator defined The distribution of total weekly household income in Northern Ireland classified by ranges of nominal income
Data is the latest available as of 30 November 2015
QEF Chart 4.2b The Distribution of Total Weekly Income in Northern Ireland by Household Income Range, 2013-14
Source: Department for Work and Pensions (2015)
NERI • Quarterly Economic Facts • Winter 2015
67

QEF Table 4.2b The Distribution of Total Weekly Income in Northern Ireland by Household Income Range
Weekly income range 2011-12 2012-13 2013-14 Less than £100 2% 2% 2% £100-£199 11% 10% 10% £200-£299 15% 14% 15% £300-£399 15% 13% 12% £400-£499 10% 11% 10% £500-£599 10% 10% 10% £600-£699 9% 9% 9% £700-£799 6% 7% 7% £800-£899 5% 5% 5% £900-£999 4% 4% 5% £1,000 or more 13% 14% 17% Source: Department for Work and Pensions (2015) Note: Columns may sum to more than 100% due to data rounding
Interpretation The results of the annual UK wide Family Resources Survey provide an insight into the distribution of income across households in Northern Ireland. Using the latest data, for the financial year 2013-14, the results presented above show that almost half of households (49%) have an income of less than £500 per week (£26,000 per annum). The table tracks trends in this distribution over the last three reports.
Technical Notes Total weekly household income captures the income received by all household members from all sources including wages and salaries, state benefits, payable tax credits, private (occupational and personal) pension schemes and investments. The data is collected as part of the annual Family Resources Survey (FRS) by the Office of National Statistics. FRS represents the UK input into the European Union Survey on Income and Living Conditions (SILC). The 2013-14 survey for Northern Ireland comprises 1,965 households. The sample in 2011-12 was 1,943 and 1,891 in 2012-13.
Source(s) Family Resources Survey 2013-14 (published June 2015) and earlier years is available at http://research.dwp.gov.uk/asd/frs/
NERI • Quarterly Economic Facts • Winter 2015
68

Indicator 4.3a Average and Median Income over Time and by Gender (Republic of Ireland)
Indicator defined Average and median household and individual equivalised disposable income (after taxes and transfers) disaggregated by gender
Data is the latest available as of 30 November 2015
QEF Chart 4.3a (i) Household Disposable Income, 2004-2014
Source: CSO
QEF Table 4.3a Household and Individual Income Trends, 2007-2014 (€)
Household Individual Individual
Year Average Average All
Average Males
Average Females
Median All
Median Males
Median Females
2007 47,988 23,610 24,046 23,173 19,794 20,086 19,274 2008 49,043 24,380 24,640 24,121 20,758 21,107 20,202 2009 45,959 23,326 23,627 23,029 20,107 20,568 19,699 2010 43,151 22,138 22,324 21,955 18,591 19,032 18,213 2011 41,819 21,440 21,718 21,167 18,148 18,788 17,594 2012 40,505 20,856 20,922 20,790 17,702 18,039 17,561 2013 41,058 21,106 21,323 20,894 17,551 17,863 17,297 2014 42,291 21,718 21,932 21,509 18,210 18,327 18,012
Source CSO
NERI • Quarterly Economic Facts • Winter 2015
69

QEF Chart 4.3a (ii) Average Disposable Income for Males and Females, 2004-2014
Source: CSO
Interpretation This indicator uses data from the CSO’s Survey on Income and Living Conditions (SILC). Total household disposable income (after taxes and transfers) is adjusted to take account of the composition of households (number of adults and children) using the national equivalence scale. Following this adjustment the CSO report individual income, or income per adult equivalent, which is used for the gender decomposition.
Average household incomes peaked in 2008 reflecting increases in earnings, enhanced welfare payments and decreases in income taxation levels in earlier years. Since then, this trend has been reversed with average disposable household incomes falling back to 2006 levels by 2013/2014. Throughout the period male and female incomes follow a similar trend. However, male incomes consistently exceed female incomes by between 0.6-6% per annum. Since peaking in 2008 individual incomes have declined by 10.9% on average (the figure is 11% for males and 10.8% for females) reflecting decreases in earnings, reduced welfare payments and increases in income taxation levels. On average in 2014 median male income was €18,327 and median female income was €18,012. The gap between median male and female income was €315; 1.7% of the median female wage.
Technical Notes See indicator 4.2a.
Source(s): See indicator 4.2a.
NERI • Quarterly Economic Facts • Winter 2015
70
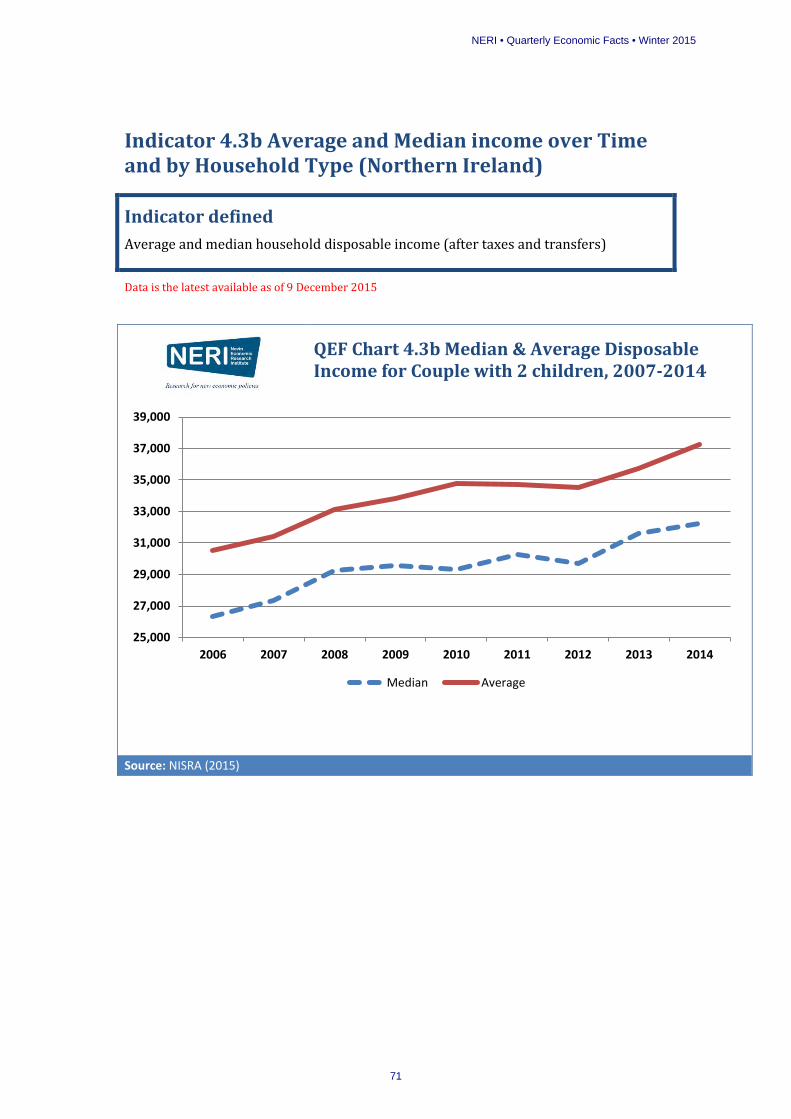
Indicator 4.3b Average and Median income over Time and by Household Type (Northern Ireland)
Indicator defined Average and median household disposable income (after taxes and transfers)
Data is the latest available as of 9 December 2015
QEF Chart 4.3b Median & Average Disposable Income for Couple with 2 children, 2007-2014
Source: NISRA (2015)
25,000
27,000
29,000
31,000
33,000
35,000
37,000
39,000
2006 2007 2008 2009 2010 2011 2012 2013 2014
Median Average
NERI • Quarterly Economic Facts • Winter 2015
71

QEF Table 4.3b Median & Average Household Disposable Income by Household Type, 2006-2014 (£)
Household Type 2006 2007 2008 2009 2010 2011 2012 2013 2014 Median
Couple No Child 17,219 17,878 19,106 19,345 19,202 19,777 19,404 20,611 21,068 Single No Children 11,532 11,978 12,801 12,961 12,836 13,250 13,001 13,828 14,116 Couple 2 Children 26,351 27,353 29,231 29,597 29,325 30,258 29,688 31,569 32,234 Single 2 Children 20,663 21,454 22,927 23,214 23,011 23,732 23,285 24,733 25,282
Average Couple No Child 19,933 20,550 21,670 22,087 22,698 22,686 22,541 23,324 24,344
Single No Children 13,358 13,768 14,519 14,798 15,237 15,200 15,102 15,654 16,310 Couple 2 Children 30,525 31,441 33,155 33,793 34,752 34,710 34,488 35,743 37,246 Single 2 Children 23,951 24,660 26,004 26,505 27,238 27,223 27,049 28,021 29,213 Source: NISRA (2015)
Interpretation This indicator examines household disposable income representing the income a household has to spend after it has received all its incomes from employment, self-employment, investment and social transfers and after it has paid all its income taxation. As the level of average household disposable incomes can be biased by households with very high, or very low, incomes, so data for the median household is also presented. Between 2006 and 2010 average household incomes increased, with nearly all household types experiencing a fall in income in both 2011 and 2012 before increasing again in 2013. Median incomes present a more mixed picture with different family types experiencing falls in income at several stages throughout the time period.
Technical Notes Incomes are reported in current prices (not taking account of inflation).
Source(s): Northern Ireland Statistics and Research Agency (2015) Households Below Average Income Survey in Northern Ireland
NERI • Quarterly Economic Facts • Winter 2015
72

Indicator 4.4 Wage Share as a Percentage of GDP
Indicator defined Compensation per employee (wages plus social insurance), adjusted to account for self-employed workers, as a percentage of GDP at current market prices
Data is the latest available as of 12 November 2015
QEF Chart 4.4 Adjusted Wage Share as a % of GDP, 1996 to 2014
Source: AMECO Online Database (2015)
NERI • Quarterly Economic Facts • Winter 2015
73
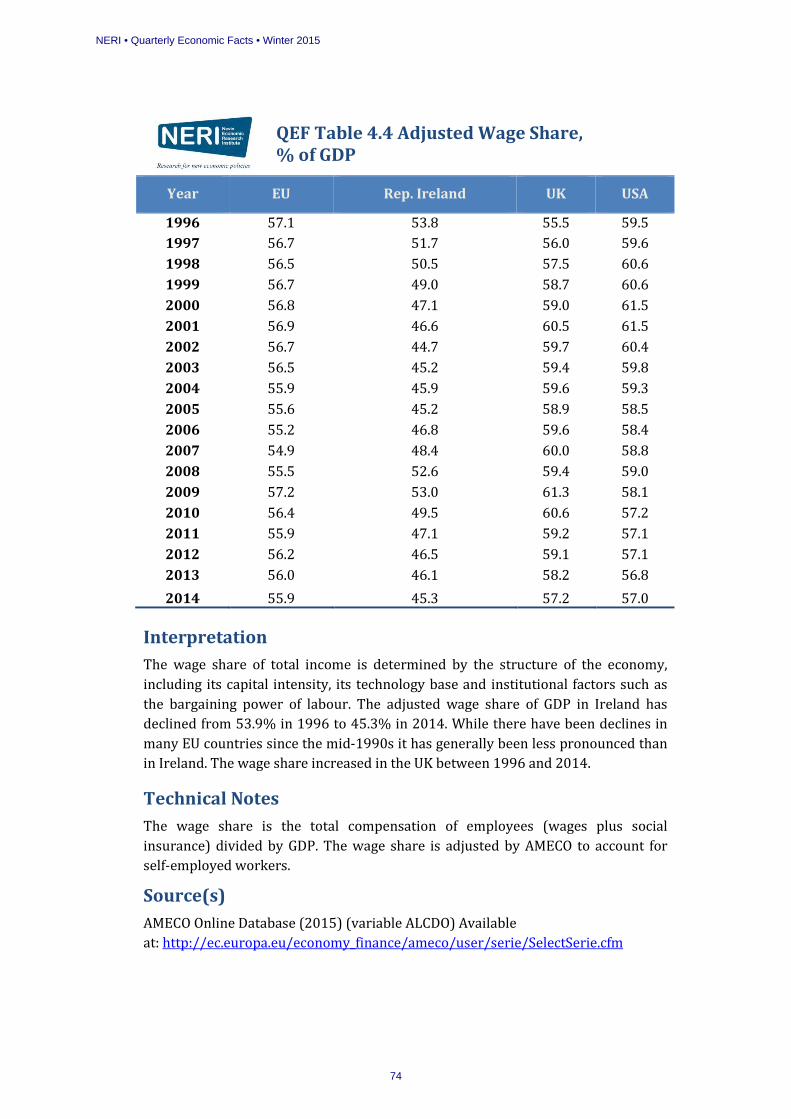
QEF Table 4.4 Adjusted Wage Share, % of GDP
Year EU Rep. Ireland UK USA
1996 57.1 53.8 55.5 59.5 1997 56.7 51.7 56.0 59.6 1998 56.5 50.5 57.5 60.6 1999 56.7 49.0 58.7 60.6 2000 56.8 47.1 59.0 61.5 2001 56.9 46.6 60.5 61.5 2002 56.7 44.7 59.7 60.4 2003 56.5 45.2 59.4 59.8 2004 55.9 45.9 59.6 59.3 2005 55.6 45.2 58.9 58.5 2006 55.2 46.8 59.6 58.4 2007 54.9 48.4 60.0 58.8 2008 55.5 52.6 59.4 59.0 2009 57.2 53.0 61.3 58.1 2010 56.4 49.5 60.6 57.2 2011 55.9 47.1 59.2 57.1 2012 56.2 46.5 59.1 57.1 2013 56.0 46.1 58.2 56.8 2014 55.9 45.3 57.2 57.0
Interpretation The wage share of total income is determined by the structure of the economy, including its capital intensity, its technology base and institutional factors such as the bargaining power of labour. The adjusted wage share of GDP in Ireland has declined from 53.9% in 1996 to 45.3% in 2014. While there have been declines in many EU countries since the mid-1990s it has generally been less pronounced than in Ireland. The wage share increased in the UK between 1996 and 2014.
Technical Notes The wage share is the total compensation of employees (wages plus social insurance) divided by GDP. The wage share is adjusted by AMECO to account for self-employed workers.
Source(s) AMECO Online Database (2015) (variable ALCDO) Available at: http://ec.europa.eu/economy_finance/ameco/user/serie/SelectSerie.cfm
NERI • Quarterly Economic Facts • Winter 2015
74

Indicator 4.5a Distribution of Earnings (Republic of Ireland)
Indicator defined Distribution of tax cases (individuals or couples who are jointly assessed) by total gross income for the latest tax year published by the Revenue Commissioners.
Data is the latest available as of 30 November 2015
QEF Chart 4.5a Distribution of Tax Cases by income range (2013)
Source: CSO and Revenue Commissioners
NERI • Quarterly Economic Facts • Winter 2015
75

QEF Table 4.5a Distribution of Tax Cases by income range (2013)
From € To € No. of cases % total - 10,000 393,347 18.32% 10,000 12,000 70,832 3.30% 12,000 15,000 114,749 5.34% 15,000 17,000 80,631 3.76% 17,000 20,000 125,277 5.84% 20000 25,000 198,574 9.25% 25,000 27,000 76,438 3.56% 27,000 30,000 106,008 4.94% 30,000 35,000 158,495 7.38% 35,000 40,000 134,319 6.26% 40,000 50,000 202,525 9.43% 50,000 60,000 138,635 6.46% 60,000 75,000 130,929 6.10% 75,000 100,000 108,296 5.04% 100,000 150,000 68,858 3.21% 150,000 200,000 18,940 0.88% 200,000 275,000 10,043 0.47% over 275,000 9,952 0.46% Totals 2,146,848 100.00% Source: CSO and Revenue Commissioners
Interpretation The Revenue Commissioners income tax data for 2013 gives an indication of the distribution of earnings (from all sources which are subject to income tax) in the Republic of Ireland. In that year 36.5% of tax cases reported a gross income of less than €20,000. The data show that almost 41% of tax cases are in the range from €20,000 to €50,000 per annum. At the top of the distribution, 5% of tax cases had an income in excess of €100,000 and almost 1% had an income in excess of €200,000.
Technical Notes Data used in this indicator is from the Revenue Commissioners/Central Statistics database (Table RVA01). The data is for tax cases rather than individuals and does not distinguish between the different sources of earnings (employment income, self-employment, property income etc). Due to the structure of the tax year and the system of provisional tax returns for certain earners, there is a delay in the figures.
Source(s) CSO and Revenue Commissioners Online Database: http://www.cso.ie/px/pxeirestat/pssn/rv01/homepagefiles/rv01_statbank.asp
NERI • Quarterly Economic Facts • Winter 2015
76
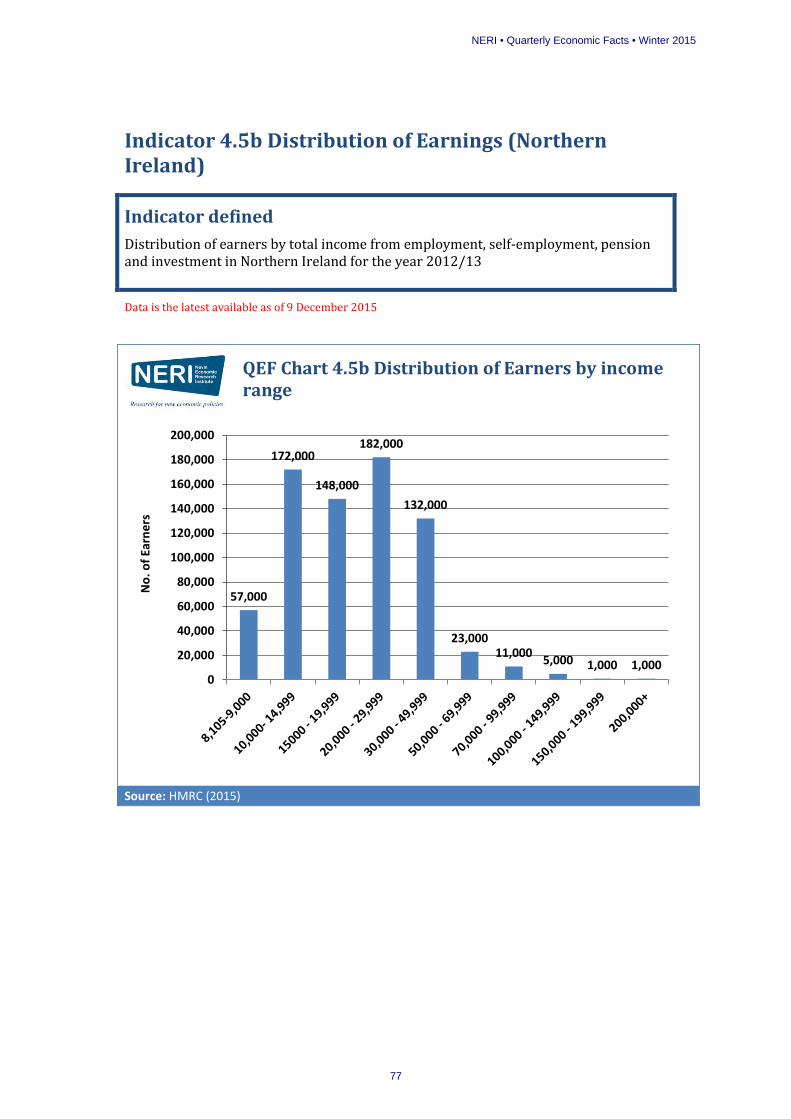
Indicator 4.5b Distribution of Earnings (Northern Ireland)
Indicator defined Distribution of earners by total income from employment, self-employment, pension and investment in Northern Ireland for the year 2012/13
Data is the latest available as of 9 December 2015
QEF Chart 4.5b Distribution of Earners by income range
Source: HMRC (2015)
57,000
172,000
148,000
182,000
132,000
23,000 11,000 5,000 1,000 1,000
0
20,000
40,000
60,000
80,000
100,000
120,000
140,000
160,000
180,000
200,000
No.
of E
arne
rs
NERI • Quarterly Economic Facts • Winter 2015
77

QEF Table 4.5b Distribution of earners by income range in Northern Ireland, financial year 2012/13
Income Range No. of earners
% of earners
Income £m
% of income
8,105 -9,999 57,000 7.79% 510 2.80% 10,000 - 14,999 172,000 23.50% 2,160 11.87% 15000 - 19,999 148,000 20.00% 2,580 14.18% 20,000 - 29,999 182,000 24.86% 4,450 24.45% 30,000 - 49,999 132,000 18.03% 4,960 27.25% 50,000 - 69,999 23,000 3.14% 1,320 7.25% 70,000 - 99,999 11,000 1.50% 860 4.73% 100,000 - 149,999 5,000 0.68% 642 3.53% 150,000 - 199,999 1,000 0.14% 240 1.32% 200,000+ 1,000 0.14% 489 2.69% Total 732,000 100% 18,092 100% Source: HMRC (2015)
Interpretation The data for this indicator is compiled using income tax receipts for Northern Ireland in the financial year 2012/13. The biggest change to have taken place since the 2011/12 figures were produced is the significant increases in the tax free allowance which have led to an increase on the lower bound of earnings from 7,475 to 8,105 for HMRC data. This does not imply the disappearance of some 20,000 low earners, but that majority of these earners do not pay direct income tax and so are not of interest to HMRC. Most other figures are largely unchanged from 2011/12 release.
Technical Notes The data is from the results of the HMRC Survey of Personal Incomes 2012-13 using information held by HMRC on persons liable to UK income tax for the income tax year. It is carried out annually and covers the income assessable for tax in each tax year.
Source(s) HMRC (2015) Personal Incomes Statistics 2012-13(tables 3.01-3.11).
NERI • Quarterly Economic Facts • Winter 2015
78

Indicator 4.6 Net Wealth per Household across Euro Area Countries
Indicator defined Net mean household wealth expressed in thousands of Euro
Data is the latest available as of 12 November 2015
QEF Chart 4.6 Mean Net Wealth per Household, Euro Area Countries, €’000s
Source: Eurosystem HFCS (2013), CSO HFCS (2015)
NERI • Quarterly Economic Facts • Winter 2015
79

QEF Table 4.6 Net Wealth per Household across Euro Area Countries
Country (€,000s) Country (€,000s)
Luxembourg 710.1 Rep. Ireland 224.0 Cyprus 670.9 Germany 195.2 Malta 366.0 Netherlands 170.2 Belgium 338.6 Finland 161.5 Spain 291.4 Portugal 152.9 Italy 275.2 Slovenia 148.7 Austria 265.0 Greece 147.8 France 233.4 Euro area 230.8 Source: Eurosystem Household Finance and Consumption Survey (2013)
Interpretation Fieldwork for the initial Eurosystem Household Finance and Consumption Survey did not occur at the same time in every country. Fieldwork began as early as 2008 in Spain and as late as 2011 in Italy. Ireland and Estonia did not participate in the initial Eurosystem Household Finance and Consumption Survey. 2013 survey data for Ireland was subsequently made available by the CSO in 2015
Technical Notes Net wealth is the difference between total household assets and total household liabilities. Total assets include real assets (value of household main residence for homeowners, other real estate property, vehicles, valuables such as jewellery, works of art, antiques, etc. and value of self-employment businesses) and financial assets (deposits, mutual funds, bonds, shares, money owed to households, value of voluntary pension plans and whole life insurance policies of householders and other financial assets – including non-self-employment businesses, assets in managed accounts and other types of financial assets). Total liabilities include mortgages collateralised on household's main residence, mortgages collateralised on other real estate property owned by the household, non-mortgage loans (consumer credit loans, private loans, other loans not collateralised on household's real estate property), credit lines/bank overdrafts debt and credit card debt.
Source(s) Eurosystem Household Finance and Consumption Survey (2013), Available at: http://www.ecb.europa.eu/home/pdf/research/hfcn/HFCS_Statistical_Tables_Wave1.pdf??8f73764897f49b052a0dae673b27b461
CSO Household Finance and Consumption Survey (2015), Available at: http://www.cso.ie/en/media/csoie/releasespublications/documents/socialconditions/2013/hfcs2013.pdf
NERI • Quarterly Economic Facts • Winter 2015
80
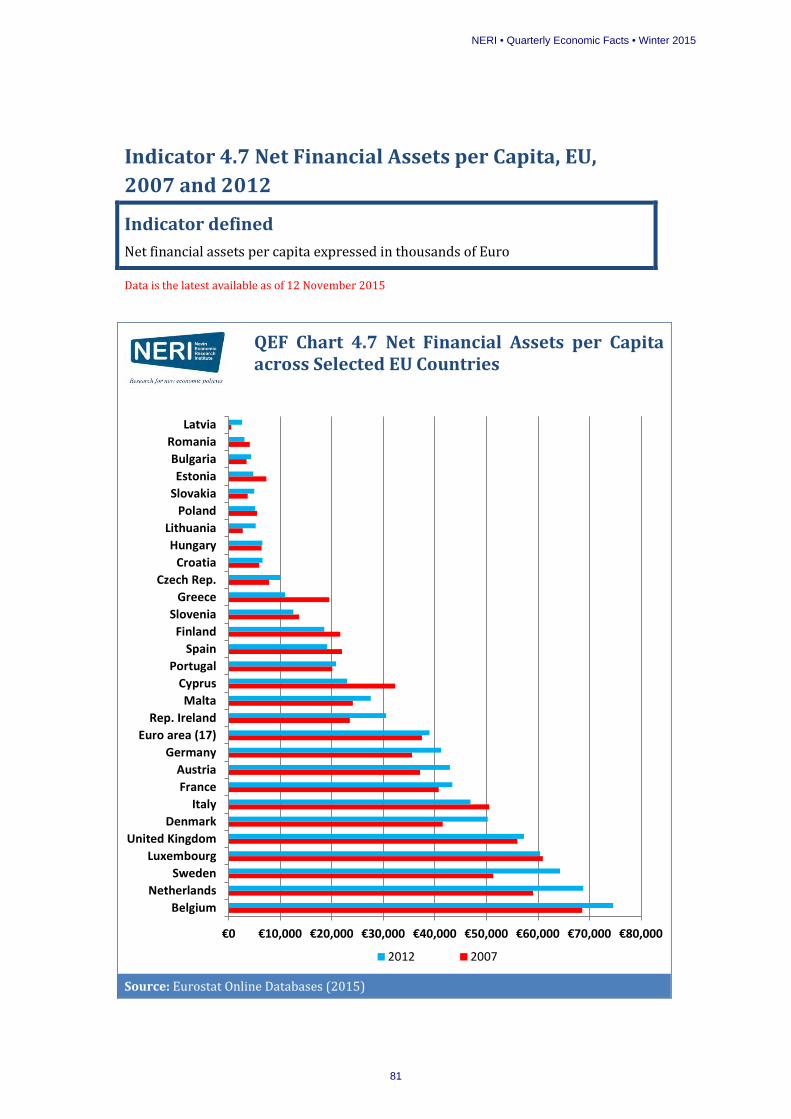
Indicator 4.7 Net Financial Assets per Capita, EU, 2007 and 2012
Indicator defined Net financial assets per capita expressed in thousands of Euro
Data is the latest available as of 12 November 2015
QEF Chart 4.7 Net Financial Assets per Capita across Selected EU Countries
Source: Eurostat Online Databases (2015)
€0 €10,000 €20,000 €30,000 €40,000 €50,000 €60,000 €70,000 €80,000
BelgiumNetherlands
SwedenLuxembourg
United KingdomDenmark
ItalyFranceAustria
GermanyEuro area (17)
Rep. IrelandMalta
CyprusPortugal
SpainFinland
SloveniaGreece
Czech Rep.Croatia
HungaryLithuania
PolandSlovakiaEstonia
BulgariaRomania
Latvia
2012 2007
NERI • Quarterly Economic Facts • Winter 2015
81

QEF Table 4.7 Net Financial Assets per Capita, EU, 2007 and 2012 (€’000s)
Country 2007 2012 Country 2007 2012
Belgium 68,593 74,593 Spain 21,986 19,091 Netherlands 59,045 68,775 Finland 21,624 18,546 Sweden 51,337 64,284 Slovenia 13,659 12,522 Luxembourg 60,950 60,402 Greece 19,493 10,948 UK 56,010 57,272 Czech Rep. 7,814 10,017 Denmark 41,518 50,240 Croatia 5,892 6,568 Italy 50,531 46,919 Hungary 6,378 6,524 France 40,739 43,389 Lithuania 2,725 5,214 Austria 37,136 42,925 Poland 5,502 5,140 Germany 35,587 41,210 Slovakia 3,686 4,956 Rep. Ireland 23,484 30,531 Estonia 7,312 4,770 Malta 24,086 27,555 Bulgaria 3,446 4,327 Cyprus 32,282 22,958 Romania 4,090 3,066 Portugal 20,076 20,831 Latvia 488 2,580 Source: Eurostat Online Databases (2015)
Interpretation Financial assets include deposits, mutual funds, bonds, shares, money owed to the households, value of voluntary pension plans and whole life insurance policies of household members and other financial assets item - which includes private non-self-employment businesses, assets in managed accounts and other types of financial assets. Total liabilities include mortgages collateralised on household's main residence and other real estate property owned by the household, non-mortgage loans, credit lines/bank overdrafts debt and credit card debt.
Technical Notes The value of this indicator is calculated by taking Eurostat figures for a countries total consolidated net financial assets of households and non-profit institutions serving households and dividing this by the population as of 1st January of the relevant year.
Source(s) Eurostat online database [nasa_f_bs and demo_pjan]
NERI • Quarterly Economic Facts • Winter 2015
82
5 Poverty, Social Exclusion and Social Protection
Indicator 5.1 Poverty and Deprivation (Republic of Ireland)
Indicator 5.2 Poverty in Northern Ireland
Indicator 5.3 In Work-Poverty (Republic of Ireland)
Indicator 5.4 Poverty and Deprivation by Gender (Republic of Ireland)
Indicator 5.5 Unemployment Benefits Compared to Earnings (OECD countries)
Indicator 5.6 Unemployment Traps across OECD countries
NERI • Quarterly Economic Facts • Winter 2015
83

NERI • Quarterly Economic Facts • Winter 2015
84

Indicator 5.1 Poverty and Deprivation (Republic of Ireland)
Indicators defined At risk of poverty rate: The proportion of individuals with disposable income of less than 60% of median income
(Enforced) Deprivation rate: The proportion of individuals who cannot afford two or more items from a list of 11
Consistent poverty rate: The proportion of individuals who are at-risk of poverty and also experiencing enforced deprivation
Data is the latest available as of 30 November 2015
QEF Chart 5.1 Trends in poverty and deprivation, 2004-2014 (%)
Source: CSO (2015)
QEF Table 5.1 Poverty and Deprivation rates, 2006-2014
2004 2006 2007 2009 2011 2012 2013 2014 At risk of poverty 19.4 17.0 16.5 14.1 16.0 16.5 15.2 16.3 Deprivation 14.2 14.0 11.8 17.1 24.5 26.9 30.5 29.0 Consistent poverty 6.6 6.6 5.1 5.5 6.9 7.7 8.2 8.0 Child poverty n/a 22.3 19.9 18.6 18.8 18.8 17.9 18.6 Source: CSO (2015)
NERI • Quarterly Economic Facts • Winter 2015
85

Interpretation The at risk of poverty or ‘relative income poverty’ rate fell from 2004 to 2009. However, the rate increased since then from 14.1% in 2009 to 16.3% in 2014. This increase occurred despite the fact that the poverty threshold level (60% of median disposable income) declined by 9.4% between 2009 and 2014 (from €12,064 to €10,926); reflecting an overall decline in income over that period.
Enforced deprivation, measuring the number of individuals deprived of two or more basic items fell to as low as 11.8% in 2007. However, it has increased rapidly since as the impact of the recession hit households. By 2014 almost three in every ten households were experiencing deprivation. The rate of consistent poverty measures the sub-section of the population who are at risk of poverty and experiencing deprivation. This measure is the focus of the government’s official poverty target which aims to reduce those experiencing consistent poverty to 4% by 2016 and to 2% or less by 2020. Between 2004 and 2008 the rate fell, but it has since increased to 8% in 2014.
The proportion of the ROI’s children living in households whose income is below the 60% of median income poverty line has experienced limited change over the past few years. While the years 2006-07 recorded a decrease from 22.3% to 19.9%, by 2014 almost 1 in every 5 children (18.6%) lived in a household experiencing relative income poverty. Over the period 2006-2008 the proportion of children living in households experiencing both relative income poverty and deprivation (consistent poverty) decreased from 10.3% to 6.3% (not shown in table). However, since then it has increased and in 2014 11.2% of the ROI’s children experienced consistent poverty.
Technical Notes The data used to compile these figures comes from the CSO’s Survey on Income and Living Conditions (SILC) and has been described in the technical notes accompanying indicator 4.2a. The at risk of poverty threshold is calculated as 60% of median equivalised disposable income.
Source(s) CSO (2015) Survey on Income and Living Conditions 2014. Dublin, Stationery Office.
CSO SILC website: www.cso.ie/en/silc/
NERI • Quarterly Economic Facts • Winter 2015
86

Indicator 5.2 Poverty in Northern Ireland
Indicator defined A household is counted as being in poverty if its income is less than 60% of the median UK household income adjusted for household size and composition
Data is the latest available as of 30 November 2015
QEF Chart 5.2 Trends in poverty in Northern Ireland and the UK, Before Housing Costs (%)
Sources: Department of Work and Pensions (2015), DSD (2015)
QEF Table 5.2 Trends in Poverty in Northern Ireland, 2002-2014
02-03 06-07 09-10 11-12 12-13 13-14 Population BHC 19 19 22 21 19 21 Children BHC 24 23 26 21 20 23 Working age Adults BHC 16 15 19 20 18 20 Pensioners BHC 24 27 23 24 20 21 Population AHC 20 19 22 22 19 21 Children AHC 27 23 28 27 22 26 Working age Adults AHC 18 16 21 22 19 20 Pensioners AHC 18 20 18 15 14 16 Sources: Department of Work and Pensions (2015), DSD (2015)
NERI • Quarterly Economic Facts • Winter 2015
87

Interpretation Using data from the UK Family Resources Survey Households Below Average Income dataset, the Northern Ireland Department for Social Development (DSD) provide details on the levels and trends in poverty in Northern Ireland. The data for this indicator is for the period from 2002-2014 and are calculated for the UK financial year April-March.
Over time the level of poverty in Northern Ireland (before housing costs) has remained reasonably static at around one fifth of the population. In 2014, there were 376,100 people in Northern Ireland living on an income below the poverty line – an increase of 38,000 from 2013. The Northern Ireland rate is approximately five percentage points higher than that for the UK. Within the population, the level of child poverty is high, with almost one in every four children in Northern Ireland living in poverty – the number for 2013/14 is 100,500 children (23%). Among pensioners, one in every five (62,900 in 2013/14) live on an income below the poverty line. One-fifth of all adults of working age in Northern Ireland (212,700) live on an income that is below the poverty line.
Technical Notes The data used to compile these figures comes from the Department of Work and Pensions’ study entitled ‘Households Below Average Income’. Poverty is calculated before and after housing costs where these costs include rent, service charges and mortgage interest payments. Household income is also equivalised, or adjusted, to take account of the size and composition of the household. Following this process, an income per adult-equivalent is achieved and this is used as the basis for setting the poverty lines. For the period 2013/14 the poverty thresholds in Northern Ireland were:
Before Housing Costs
After Housing Costs
Couple – no children £272 £232 Single – no children £182 £134 Couple with 2 children under 14 years £416 £375 Lone parent with 2 children under 14yrs £326 £278
Source(s) Department of Work and Pensions (2015) Households Below Average Income. London,
HM Stationery Office.
Department for Social Development (2015) Households Below Average Income Northern Ireland 2013-14. Belfast, NISRA and DSD.
NERI • Quarterly Economic Facts • Winter 2015
88

Indicator 5.3 In Work-Poverty (Republic of Ireland)
Indicators defined Workers at risk of poverty: The proportion of individuals whose principle economic status is ‘at work’ and whose equivalised disposable income is less than 60% of median income Workers in consistent poverty: The proportion of individuals whose principle economic status is ‘at work’ and who are at-risk of poverty and also experiencing enforced deprivation
Data is the latest available as of 30 November 2015
QEF Chart 5.3(i) In-work Poverty in the ROI, 2004-2014 (% of those at work)
Source: CSO (2015)
QEF Table 5.3 Composition of those at risk of poverty in the ROI, 2009-2014
2009 2011 2013 2014 At Work 14.3% 14.2% 11.7% 14.0% Unemployed 12.9% 16.6% 20.4% 15.9% Student 14.6% 14.7% 15.2% 15.5% Home duties 18.0% 17.5% 15.0% 15.9% Retired 4.7% 4.3% 5.8% 6.2% Ill/disabled 6.4% 4.8% 4.4% 5.3% Source: CSO (2015)
NERI • Quarterly Economic Facts • Winter 2015
89

QEF Chart 5.3(ii) Composition of those at risk of poverty 2014 (%)
Source: CSO (2015)
Interpretation Of all those who are at risk of poverty in 2014, the latest data, 14% are at work (see table 5.3). This group, often labelled ‘the working poor’, represent 6.1% of all workers in the Republic (Chart 5.3(i)). Poverty is most common among those who are unemployed, students and working in the home.
Despite the fact that the rate of relative income poverty (6.1%) and consistent poverty (2.4%) is low among those whose principle economic status is work, the fact that the working population comprises a large part of the population aged 16 years and above results in a high number of workers being in poverty.
Technical Notes See notes for indicators 4.2a and 5.1. The composition of those at risk of poverty is decomposed by principle economic status for all those aged 16 years and above. The tables and charts above exclude figures for children under 16 years who are living in households that are at risk of poverty.
Source(s) See all the sources listed under indicator 4.2a.
NERI • Quarterly Economic Facts • Winter 2015
90

Indicator 5.4 Poverty and Deprivation by Gender (Republic of Ireland)
Indicators defined At risk of poverty rate: The proportion of individuals with disposable income of less than 60% of median income – data for all the population any by gender.
(Enforced) Deprivation rate: The proportion of individuals who cannot afford two or more items from a list of 11 – data for all the population any by gender.
Consistent poverty rate: The proportion of individuals who are at-risk of poverty and also experiencing enforced deprivation – data for all the population any by gender.
Data is the latest available as of 30 November 2015
QEF Chart 5.4(i) Trends in poverty by gender, 2006-2014 (%)
Source: CSO (2014)
Interpretation As the tables and charts for this indicator show, females have a marginally higher risk of poverty than males (in 2014) while females experience a higher level of deprivation than males.
Technical Notes See indicator 5.1.
NERI • Quarterly Economic Facts • Winter 2015
91

Charts 5.4(ii)/5.4(iii) Deprivation and Consistent Poverty by gender, 2014 (%)
Source: CSO (2015)
QEF Table 5.4 Poverty and Deprivation by Gender, 2006-2014 (%)
2006 2008 2010 2012 2013 2014 At risk of poverty – All* 17.0 14.4 14.7 16.5 15.2 16.3 Males 16.6 14.0 14.3 16.3 15.1 16.0 Females 17.4 14.9 15.1 16.7 15.4 16.5 Deprivation – All* 14.0 13.7 22.6 26.9 30.5 29.0 Males 13.6 13.1 21.7 26.4 29.6 27.9 Females 14.4 14.2 23.5 27.4 31.4 30.1 Consistent Poverty – All* 6.6 4.2 6.3 7.7 8.2 8.0 Males 6.5 4.0 5.8 7.8 8.0 7.8 Females 6.7 4.4 6.8 7.6 8.5 8.3 Source: CSO (2015) Note: *all refers to the rate for the population of the ROI
Source(s) CSO (2015) Survey on Income and Living Conditions 2014. Dublin, Stationery Office.
CSO SILC website: www.cso.ie/en/silc/
NERI • Quarterly Economic Facts • Winter 2015
92

Indicator 5.5 Unemployment Benefits Compared to Earnings (OECD countries)
Indicator defined We compare pre and post Unemployment income using the replacement rate. It refers to the level of welfare provided immediately after the individual becomes unemployed and calculates this as a proportion of previous after tax or net income. The figures in this assessment are based on an individual earning 67% of the average wage in each OECD country before becoming unemployed.
Data is the latest available as of 30 November 2015
QEF Table 5.5 Net Replacement Rates for six family types, 2013
No children 2 children
OECD countries Single person
One-earner couple
Two-earner couple
Lone parent
One-earner couple
Two-earner couple
Australia 31 56 50 59 66 64 Austria 55 57 80 68 69 85 Belgium 90 83 84 95 82 85 Canada 64 65 81 77 77 84 Chile 56 56 78 63 63 78 Czech Rep. 65 65 87 67 67 88 Denmark 84 85 92 89 87 92 Estonia 55 57 77 65 62 79 Finland 59 59 80 74 69 84 France 69 65 84 71 68 84 Germany 59 59 86 81 83 90 Greece 39 40 68 62 53 72 Hungary 68 68 84 76 76 87 Iceland 76 79 88 82 81 90 Rep. Ireland 50 80 75 50 75 81 Israel 89 89 95 88 90 93 Italy 72 76 86 81 78 88 Japan 70 69 86 75 71 87 Korea 55 55 78 63 57 78 Luxembourg 83 81 90 90 89 93 Netherlands 76 77 84 67 81 77 New Zealand 35 59 50 57 63 65 Norway 68 69 84 79 73 86 Poland 51 52 75 83 58 77 Portugal 75 75 91 79 78 92 Slovak Rep. 62 58 85 72 57 86 Slovenia 86 83 93 85 88 96 Spain 78 75 89 76 74 88 Sweden 63 63 81 71 67 83 Switzerland 73 70 85 85 84 91 Turkey 53 52 76 52 51 76 UK 20 31 60 47 56 67 USA 61 60 81 54 51 83 OECD Median 64 65 84 74 71 85 EU Median 65 65 84 73 71 85
NERI • Quarterly Economic Facts • Winter 2015
93

QEF Chart 5.5 Net Replacement Rates for six family types in initial phase of unemployment, 2013
Source: OECD (2015)
Interpretation Replacement rates compare income prior to unemployment with income from welfare after unemployment. Across the OECD these rates range from 20% (UK single person) to 96% (Slovenia two-earner married couple). Given the variation in individual country replacement rates, reflecting the nature and composition of welfare entitlements in these countries, the data shows the futility of making simple cross country comparisons based on one particular type of individual/household. The ROI possesses the fifth lowest replacement rate for single unemployed people with no children within the OECD (50%), only the UK, Australia, New Zealand and Greece possess lower rates. Of the six household types examined by the OECD (see table and chart) four ROI types record replacement rates below the OECD and EU median values and two above these median values.
Technical Notes Data is from the OECD’s Tax-Benefit Calculator. The OECD also examine these rates for individuals at other percentages of average earnings. The data in the table and chart is from 2013, since then changes to welfare rates, taxation structures and average earnings will have altered these rates.
Source OECD Tax-Benefit Calculator: http://www.oecd.org/els/benefits-and-wages-statistics.htm
NERI • Quarterly Economic Facts • Winter 2015
94

Indicator 5.6 Unemployment Traps across OECD countries
Indicator defined We use participation tax rates to measure the extent to which taxes and benefits reduce the financial gain of moving into work. High participation tax rates reduce the attractiveness of labour market participation and may serve to trap individuals or households in unemployment. The figures in this assessment are based on an individual earning 67% of the average wage in each OECD country Data is the latest available as of 30 November 2015
QEF Table 5.6 Participation Tax Rates for six family types, 2013
No children 2 children
OECD countries Single person
One-earner
married couple
Two-earner
married couple
Lone parent
One-earner
married couple
Two-earner
married couple
Australia 43 64 17 55 63 39 Austria 68 69 71 71 72 76 Belgium 93 87 79 93 84 79 Canada 70 68 70 72 72 72 Chile 64 64 64 70 70 64 Czech Rep. 72 69 79 67 64 79 Denmark 90 90 90 90 90 90 Estonia 64 64 64 67 63 64 Finland 69 69 69 74 74 74 France 77 72 76 72 72 75 Germany 73 69 82 84 84 86 Greece 51 48 45 66 55 47 Hungary 79 79 79 77 77 79 Iceland 83 82 83 84 82 84 Rep. Ireland 56 81 56 27 66 65 Israel 91 91 91 88 91 88 Italy 80 81 80 82 78 82 Japan 46 44 48 46 44 48 Korea 31 31 31 36 30 31 Luxembourg 87 84 83 89 88 86 Netherlands 84 84 78 68 85 65 New Zealand 45 65 15 51 58 37 Norway 76 76 76 80 77 77 Poland 64 64 64 86 64 64 Portugal 80 79 85 80 79 87 Slovak Rep. 44 38 50 37 31 50 Slovenia 90 88 90 84 88 93 Spain 82 78 82 78 76 80 Sweden 71 71 71 71 71 71 Switzerland 81 80 78 87 87 86 Turkey 64 63 64 63 62 63 UK 36 45 36 46 55 45 USA 70 67 71 55 49 72 OECD Median 71 69 71 72 72 74 EU Median 73 72 78 74 74 76
NERI • Quarterly Economic Facts • Winter 2015
95

QEF Chart 5.6 Participation Tax Rates for six family types, 2013
Source: OECD (2015)
Interpretation As individuals transition from unemployment to employment they experience losses of welfare payments and entitlements, gains in earned gross income and they begin to pay income taxes and social insurance contributions on their earned income. The participation tax rates attempts to measure the collective impact of these experiences by estimating by how much changes to taxes and benefits reduce the financial gain of moving into work. A participation tax rate of 50% implies that half of the gains in earnings from commencing work are lost through changes to taxes and benefits.
Across the OECD these rates range from 15% (New Zealand two earner married couple) to 93% (Belgium single person, Belgium Lone Parent and Slovenia two-earner married couple). From country to country they differ given differences in the interaction of the welfare and taxation systems. The ROI possesses the eight lowest replacement rate for single unemployed people with no children within the OECD (56%). Of the six household types examined by the OECD (see table and chart) five ROI types record replacement rates below the OECD and EU median values.
Technical Notes See indicator 5.5.
Source(s) OECD Tax-Benefit Calculator: http://www.oecd.org/els/benefits-and-wages-statistics.htm
NERI • Quarterly Economic Facts • Winter 2015
96

6 Public Finances
Indicator 6.1 Trends in General Government Expenditure and Revenue, EU and ROI
Indicator 6.2 Government Revenue as % of GDP, EU and ROI, 2014
Indicator 6.3a General Government Deficit as % of GDP, EU member states, 2014
Indicator 6.3b Estimated General Government Structural Deficit as % of GDP, EU member states, 2014
Indicator 6.4 General Government Gross Debt as % of GDP, EU member states, 2014
NERI • Quarterly Economic Facts • Winter 2015
97

NERI • Quarterly Economic Facts • Winter 2015
98

Indicator 6.1 Trends in General Government Expenditure and Revenue, EU and ROI, 2003 to 2014
Indicator defined Total General Government Expenditure and Revenue as a percentage of GDP
Data is the latest available as of 12 November 2015
QEF Chart 6.1 General Government Expenditure and Revenue, % GDP, EU and Rep. Ireland, 2003 to 2014
Source: Eurostat Government Statistics (2015)
O (2013:22)
NERI • Quarterly Economic Facts • Winter 2015
99

QEF Table 6.1 General Government Expenditure and Revenue, % GDP, EU and Rep. Ireland, 2003 to 2014
Year EU 28 Expenditure
Rep. Ireland Expenditure
EU 28 Revenue
Rep. Ireland Revenue
2003 46.5 32.9 43.3 33.7 2004 46.1 33.1 43.2 34.5 2005 46.1 33.4 43.5 34.7 2006 45.6 33.9 43.9 36.7 2007 44.9 35.9 44.0 36.2 2008 46.5 41.9 44.0 34.9 2009 50.3 47.2 43.6 33.4 2010 50.0 65.7 43.6 33.3 2011 48.6 45.5 44.0 33.0 2012 49.0 41.8 44.8 33.8 2013 48.6 39.7 45.3 34.0 2014 48.2 38.2 45.2 34.4
Source: Eurostat Government Statistics (2015)
Interpretation Public expenditure relating to bank recapitalisation is included in the figures for Government spending in the above table and chart for each of the three years 2009, 2010 and 2011.
The level of government revenue and the level of government spending in the Republic of Ireland are both substantially lower than the average for the EU 28 when measured as a percentage of GDP.
Technical Notes Total General Government Revenue includes taxes and other receipts of public authorities
Source(s) Eurostat online database available at: http://epp.eurostat.ec.europa.eu (t_gov_a)
NERI • Quarterly Economic Facts • Winter 2015
100

Indicator 6.2 Government Revenue as % of GDP, EU member states, 2014
Indicator defined Total General Government Revenue as % of GDP
Data is the latest available as of 12 November 2015
QEF Chart 6.2 General Government Revenue as % GDP, EU and Rep. Ireland, 2014
Source: Eurostat Government Statistics (2015)
30 35 40 45 50 55 60
RomaniaLithuania
Rep. IrelandLatvia
BulgariaUK
SpainEstoniaPoland
SlovakiaCyprus
Czech Rep.Malta
CroatiaNetherlands
PortugalGermanySlovenia
EU 28Greece
Euro areaHungaryHungary
ItalyAustria
SwedenBelgium
FranceFinland
Denmark
NERI • Quarterly Economic Facts • Winter 2015
101
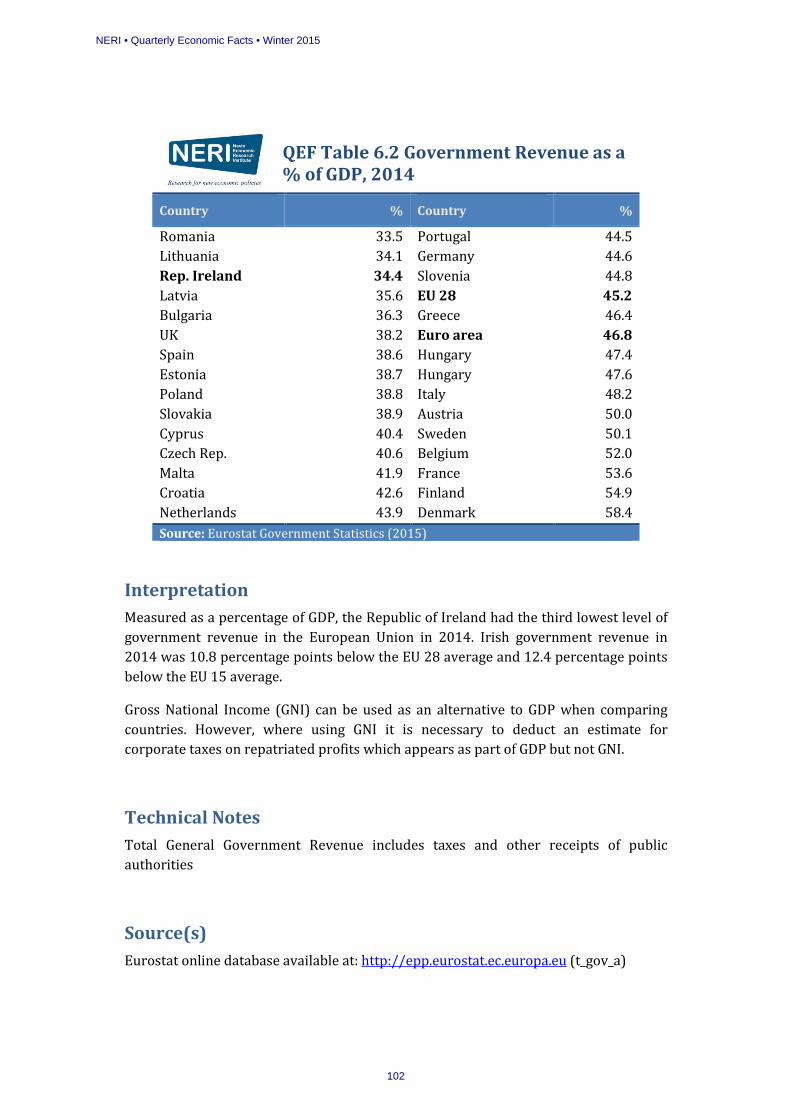
QEF Table 6.2 Government Revenue as a % of GDP, 2014
Country % Country %
Romania 33.5 Portugal 44.5 Lithuania 34.1 Germany 44.6 Rep. Ireland 34.4 Slovenia 44.8 Latvia 35.6 EU 28 45.2 Bulgaria 36.3 Greece 46.4 UK 38.2 Euro area 46.8 Spain 38.6 Hungary 47.4 Estonia 38.7 Hungary 47.6 Poland 38.8 Italy 48.2 Slovakia 38.9 Austria 50.0 Cyprus 40.4 Sweden 50.1 Czech Rep. 40.6 Belgium 52.0 Malta 41.9 France 53.6 Croatia 42.6 Finland 54.9 Netherlands 43.9 Denmark 58.4 Source: Eurostat Government Statistics (2015)
Interpretation Measured as a percentage of GDP, the Republic of Ireland had the third lowest level of government revenue in the European Union in 2014. Irish government revenue in 2014 was 10.8 percentage points below the EU 28 average and 12.4 percentage points below the EU 15 average.
Gross National Income (GNI) can be used as an alternative to GDP when comparing countries. However, where using GNI it is necessary to deduct an estimate for corporate taxes on repatriated profits which appears as part of GDP but not GNI.
Technical Notes Total General Government Revenue includes taxes and other receipts of public authorities
Source(s) Eurostat online database available at: http://epp.eurostat.ec.europa.eu (t_gov_a)
NERI • Quarterly Economic Facts • Winter 2015
102

Indicator 6.3a General Government Deficit as % of GDP, EU member states, 2014
Indicator defined Total General Government Deficit as % of GDP
Data is the latest available as of 12 November 2015
QEF Chart 6.3a General Government Deficit as a % of GDP, 2014
Source: Eurostat Government Statistics (2015)
NERI • Quarterly Economic Facts • Winter 2015
103

QEF Table 6.3a General Government Deficit as % of GDP, 2014
Country % Country %
Cyprus -8.9 Slovakia -2.8 Portugal -7.2 Austria -2.7 Spain -5.9 Hungary -2.5 Bulgaria -5.8 Netherlands -2.4 UK -5.7 Malta -2.1 Croatia -5.6 Czech Rep. -1.9 Slovenia -5.0 Sweden -1.7 Rep. Ireland -3.9 Latvia -1.5 France -3.9 Romania -1.4 Greece -3.6 Lithuania -0.7 Poland -3.3 Germany 0.3 Finland -3.3 Estonia 0.7 Belgium -3.1 Luxembourg 1.4 Italy -3.0 Denmark 1.5 EU 28 -3.0 Source: Eurostat Government Statistics (2015)
Interpretation The Maastricht rules require EU member states to have a government deficit of no more than 3% of GDP. The latest estimates of the General Government Balance (the headline deficit) for 2014 shows that 14 out of 28 member states were in excess of this figure. In the case of the Republic of Ireland, in 2014, the ‘headline’ government deficit is estimated to be 3.9%. This was the joint eighth highest rate in the EU.
Technical Notes The General Government Deficit (or General Government Balance) is the difference between General Government Expenditure and General Government Revenue in any given year. An excess of expenditure over revenue is expressed as a percentage of GDP and is shown as a negative value.
Source(s) Eurostat online database available at: http://epp.eurostat.ec.europa.eu (t_gov_dd)
NERI • Quarterly Economic Facts • Winter 2015
104
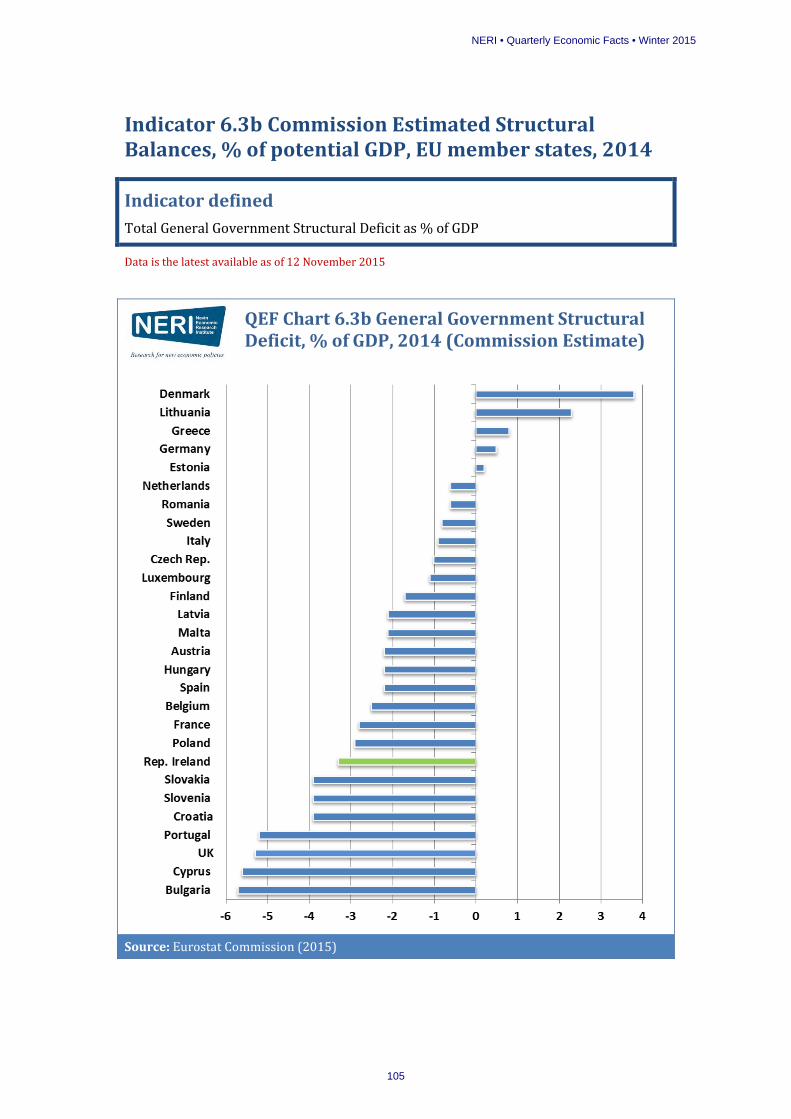
Indicator 6.3b Commission Estimated Structural Balances, % of potential GDP, EU member states, 2014
Indicator defined Total General Government Structural Deficit as % of GDP
Data is the latest available as of 12 November 2015
QEF Chart 6.3b General Government Structural Deficit, % of GDP, 2014 (Commission Estimate)
Source: Eurostat Commission (2015)
NERI • Quarterly Economic Facts • Winter 2015
105
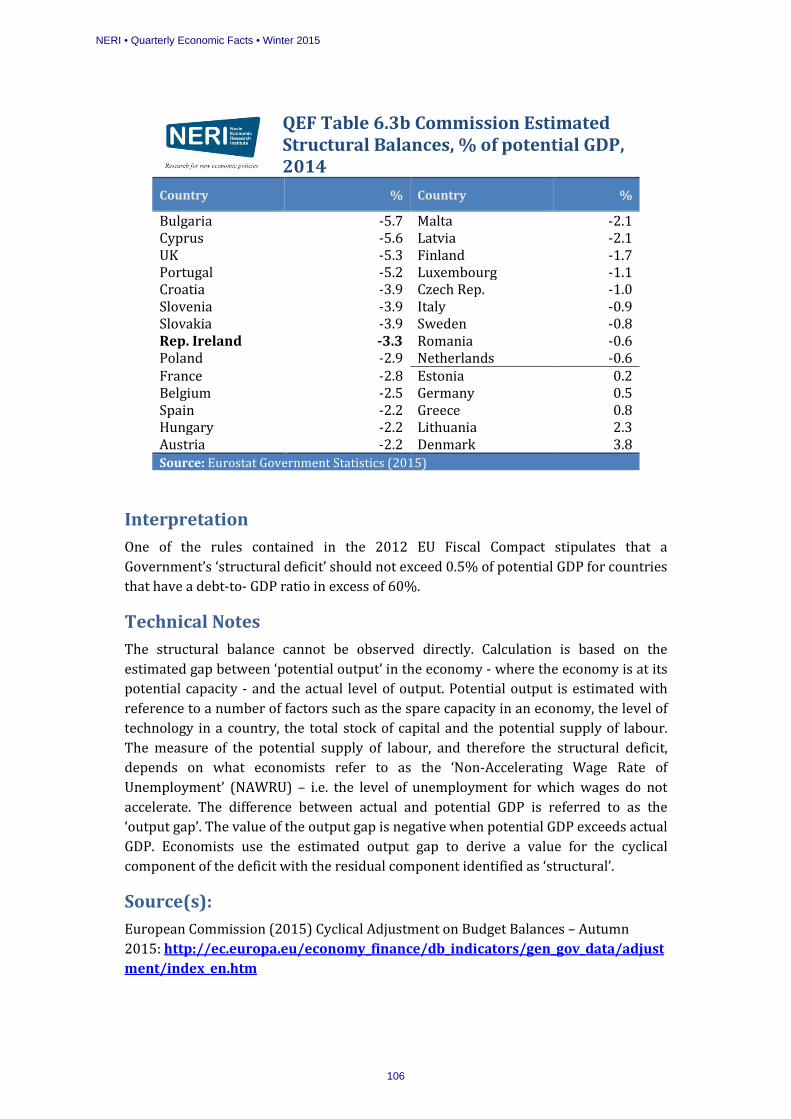
QEF Table 6.3b Commission Estimated Structural Balances, % of potential GDP, 2014
Country % Country %
Bulgaria -5.7 Malta -2.1 Cyprus -5.6 Latvia -2.1 UK -5.3 Finland -1.7 Portugal -5.2 Luxembourg -1.1 Croatia -3.9 Czech Rep. -1.0 Slovenia -3.9 Italy -0.9 Slovakia -3.9 Sweden -0.8 Rep. Ireland -3.3 Romania -0.6 Poland -2.9 Netherlands -0.6 France -2.8 Estonia 0.2 Belgium -2.5 Germany 0.5 Spain -2.2 Greece 0.8 Hungary -2.2 Lithuania 2.3 Austria -2.2 Denmark 3.8 Source: Eurostat Government Statistics (2015)
Interpretation One of the rules contained in the 2012 EU Fiscal Compact stipulates that a Government’s ‘structural deficit’ should not exceed 0.5% of potential GDP for countries that have a debt-to- GDP ratio in excess of 60%.
Technical Notes The structural balance cannot be observed directly. Calculation is based on the estimated gap between ‘potential output’ in the economy - where the economy is at its potential capacity - and the actual level of output. Potential output is estimated with reference to a number of factors such as the spare capacity in an economy, the level of technology in a country, the total stock of capital and the potential supply of labour. The measure of the potential supply of labour, and therefore the structural deficit, depends on what economists refer to as the ‘Non-Accelerating Wage Rate of Unemployment’ (NAWRU) – i.e. the level of unemployment for which wages do not accelerate. The difference between actual and potential GDP is referred to as the ‘output gap’. The value of the output gap is negative when potential GDP exceeds actual GDP. Economists use the estimated output gap to derive a value for the cyclical component of the deficit with the residual component identified as ‘structural’.
Source(s): European Commission (2015) Cyclical Adjustment on Budget Balances – Autumn 2015: http://ec.europa.eu/economy_finance/db_indicators/gen_gov_data/adjustment/index_en.htm
NERI • Quarterly Economic Facts • Winter 2015
106
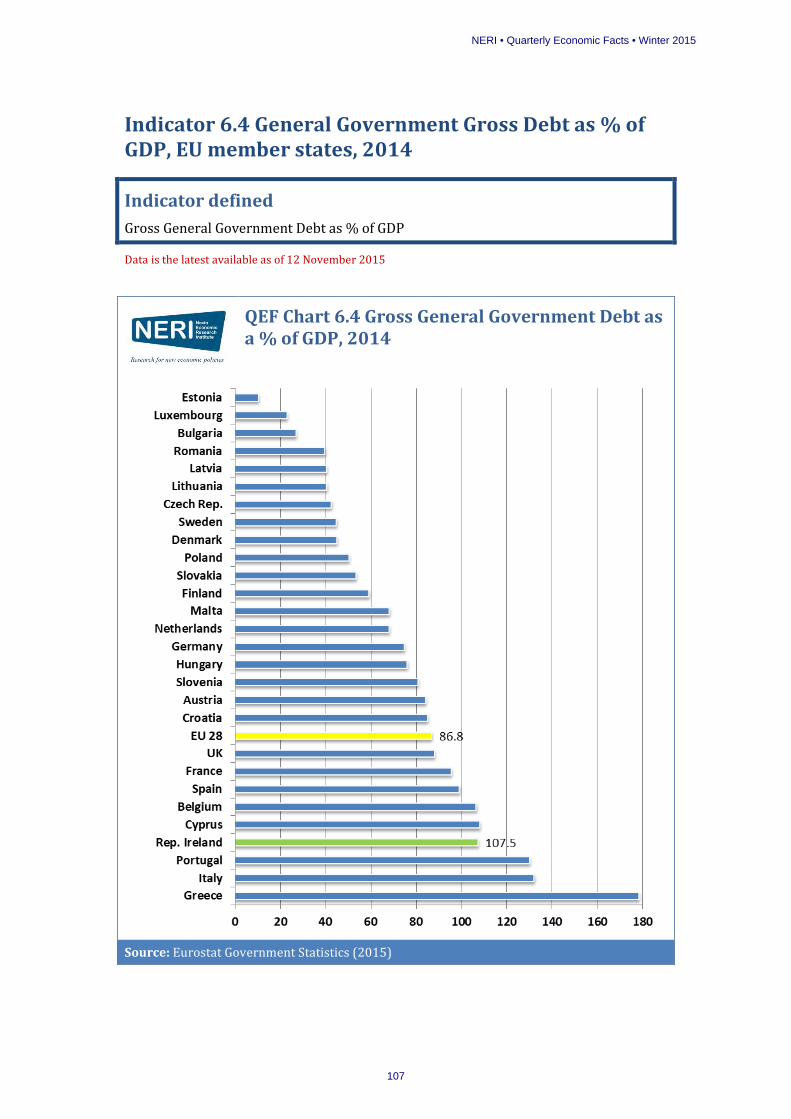
Indicator 6.4 General Government Gross Debt as % of GDP, EU member states, 2014
Indicator defined Gross General Government Debt as % of GDP
Data is the latest available as of 12 November 2015
QEF Chart 6.4 Gross General Government Debt as a % of GDP, 2014
Source: Eurostat Government Statistics (2015)
NERI • Quarterly Economic Facts • Winter 2015
107

QEF Table 6.4 General Government Gross Debt as % of GDP, 2014
Country % Country %
Greece 178.6 Netherlands 68.2 Italy 132.3 Malta 68.3 Portugal 130.2 Finland 59.3 Rep. Ireland 107.5 Slovakia 53.5 Cyprus 108.2 Poland 50.4 Belgium 106.7 Denmark 45.1 Spain 99.3 Sweden 44.9 France 95.6 Czech Rep. 42.7 UK 88.2 Lithuania 40.7 EU 28 86.8 Latvia 40.6 Croatia 85.1 Romania 39.9 Austria 84.2 Bulgaria 27 Slovenia 80.8 Luxembourg 23 Hungary 76.2 Estonia 10.4 Germany 74.9 Source: Eurostat Government Statistics (2015)
Interpretation A rule contained in the 2012 EU Fiscal Compact stipulates that where the gross general government debt-to-GDP ratio exceeds 60% countries must reduce it by 1/20 of the excess per annum. In 2014, the Republic of Ireland at 107.5% of GDP was one of 16 EU member states above the 60% threshold.
Technical Notes Gross General Government Debt is defined as the total consolidated gross debt at nominal value at the end of the year in the following categories of government liabilities (as defined in ESA2010): currency and deposits, debt securities and loans.
Source(s) Eurostat online database available at: http://epp.eurostat.ec.europa.eu (t_gov_dd)
NERI • Quarterly Economic Facts • Winter 2015
108

Notes

Nevin Economic Research Institute (NERI)
31/32 Parnell Square Dublin 1 Phone + 353 1 8897722
Carlin House 4-6 Donegall Street Place Belfast BT1 2FN, Northern Ireland Phone +44 28 902 46214 Email: [email protected]
Web: www.NERInstitute.net