neptune energy 2021 half year results
TRANSCRIPT

NEPTUNE ENERGY 2021 HALF YEAR RESULTS
Neptune Energy Group Midco Limited Unaudited Condensed Consolidated Financial Statements For the six months ended 30 June 2021

Neptune Energy Group Midco Limited Report for the period ended 30 June 2021
2
About Neptune Energy Group Neptune is an independent global E&P company and active across Europe, North Africa and Asia Pacific. The Company’s parent company, Neptune Energy Group Limited, is backed by CIC and funds advised by The Carlyle Group and CVC Capital Partners. Further background information is available on the corporate website www.neptuneenergy.com General Except as the context otherwise indicates, ’Neptune’ or ‘Neptune Energy’, ‘Neptune Energy Group’, ‘Group’, ‘we’, ‘us’, and ‘our’, refers to the group of companies comprising Neptune Energy Group Midco Limited (‘the Company’) and its consolidated subsidiaries and equity accounted investments. ‘EPI’ refers to the business of ENGIE E&P International S.A. (now renamed Neptune Energy International S.A.) and its direct or indirect subsidiaries. In this report, unless otherwise indicated, our production, reserves and resources figures are presented on a basis including our ownership share of volumes of companies that we account for under the equity accounting method, in particular, for the interest held in the Touat project in Algeria through a joint venture company. Production for interests held under production sharing contracts is reported on an appropriate unit of production basis. The discussion in this report includes forward-looking statements which, although based on assumptions that we consider reasonable, are subject to risks and uncertainties which could cause actual events or conditions to materially differ from those expressed or implied by the forward-looking statements. While these forward-looking statements are based on our internal expectations, estimates, projections, assumptions and beliefs as at the date of such statements or information, including, among other things, assumptions with respect to production, future capital expenditures and cash flow, we caution you that the assumptions used in the preparation of such information may prove to be incorrect and no assurance can be given that our expectations, or the assumptions underlying these expectations, will prove to be correct. Any forward-looking statements that we make in this report speak only as of the date of such statement or the date of this report. This report contains non-GAAP and non-IFRS measures and ratios that are not required by, or presented in accordance with, any generally accepted accounting principles (GAAP) or IFRS. These non-IFRS and non-GAAP measures and ratios may not be comparable to other similarly titled measures of other companies and have limitations as analytical tools and should not be considered in isolation or as a substitute for analysis of our operating results as reported under IFRS or GAAP. Non-IFRS and non-GAAP measures and ratios are not measurements of our performance or liquidity under IFRS or GAAP and should not be considered as alternatives to operating profit or profit from continuing operations or any other performance measures derived in accordance with IFRS or GAAP or as alternatives to cash flow from operating, investing or financing activities.

Neptune Energy Group Midco Limited
Unaudited Condensed Consolidated Financial Statements
For the period ended 30 June 2021
Neptune Energy Group Midco Limited Report for the period ended 30 June 2021
3
NEPTUNE ENERGY ANNOUNCES H1 2021 RESULTS London, 12 August 2021 – Neptune Energy today announces its financial results for the first half of 2021. New projects performing above plan, delivering near-term production growth
• Robust health and safety performance, with total recordable injury rate of 1.6 per million hours worked, in line with target.
• Q2 production of 115.4 kboepd (136.3 kboepd including production-equivalent insurance income), in line with guidance.
• New projects in Norway and Indonesia delivered on time, performing above plan. Our Duva project is expected onstream in August. FY guidance tightened to 130-135 kboepd, within initial 130-145 kboepd range, reflecting extended shutdowns at Snøhvit and Touat.
• Further exploration and appraisal success with a gas discovery at the Turkoois prospect and positive results from the Maha-2 appraisal well.
Significant cash flows supported by higher prices
• Higher quarterly average realised prices (including hedging) of $62.1/bbl for oil and $6.8/MMbtu for gas.
• EBITDAX of $670 million and post-tax operating cash flow (after working capital) of $530 million in H1. FY guidance for post-tax operating cash flow (before working capital) increased to more than $1.6 billion from ~$1.4 billion.
• H1 adjusted development capex of $336 million, exploration and pre-development spend of $87 million.
• Operating costs of $10.6/boe in H1, below $11-12/boe guidance range for the full year. Strong balance sheet and available liquidity, with deleveraging on target
• Total available liquidity of $1.1 billion as at 30 June 2021 to support growth plans.
• Leverage lower at 1.95 net debt/EBITDAX for H1, on track to decline to less than 1.5x by year end 2021.
• 60% hedged for 2021, providing downside protection, whilst retaining exposure to improvements in the commodity price cycle.
• Moody’s credit rating outlook changed to ‘positive’. Sector-leading low emissions intensity, continued progress on New Energy projects
• Carbon intensity remained low at 7 kg CO2/boe, significantly lower than the industry average of 17 kg CO2/boe. Methane intensity remained low at a 0.02%, monitoring study to commence at Cygnus in H2.
• EcoVadis upgraded ESG rating, placing Group in top 25% of 75,000 global companies assessed.
• Feasibility study underway for Dutch CCS project – potential to store 5-8 mtpa of CO2, many times Group annual emissions.
• Awarded €3.6 million subsidy for PosHYdon green hydrogen project and finalised consortium agreement in July. FINANCIAL SUMMARY
Neptune Energy Second quarter
2021 Second quarter
2020 First half
2021 First half
2020
Total daily production (kboepd) (note a) 115.4 149.6 126.2 155.8
Total daily production (kboepd) including production-equivalent insurance payments (note b)
136.3 149.6 143.3 155.8
Operating costs ($/boe) 11.2 8.5 10.6 8.7
EBITDAX ($m) (RBL basis) (note c) 346.4 214.7 669.6 537.6
Underlying operating profit (note d) 147.3 86.9 319.2 241.9
Cash flow from operations, after tax ($m) 530.4 417.3
Adjusted development cash capital expenditure ($m) (note e) 336.0 430.2
Free cash flow ($m) (note f) 61.3 (55.6)
Net debt ($m) (book value) (RBL basis) (note g) 2,044.4 1,646.8
Net debt/EBITDAX (RBL basis) (note g) 1.95x 1.31x
a) Production and realised price figures are for wholly owned affiliates and equity accounted affiliates. b) Including business interruption insurance payments, converted to a net entitled production equivalent. c) EBITDAX comprises net income for the period before income tax expense, financial expenses, financial income, impairment losses, other operating gains and losses, exploration expense and
depreciation and amortisation. EBITDAX as defined by the RBL and shareholder agreement includes our share of net income from Touat in 2021 following the repayment of the Touat Vendor Loan. EBITDAX for 2020 excludes our share of net income from Touat.

Neptune Energy Group Midco Limited
Unaudited Condensed Consolidated Financial Statements
For the period ended 30 June 2021
Neptune Energy Group Midco Limited Report for the period ended 30 June 2021
4
d) Underlying operating profit is calculated as operating (loss)/profit before the impact of impairment gains/losses and net restructuring costs. A full calculation is shown below. e) Adjusted development cash capital expenditure excludes capital expenditure on acquisitions and includes $15.9 million for the period (2020: $15.9 million) in respect of the Touat project, held by a
joint venture company which Neptune accounts for under the equity method. f) Free cash flow is calculated as net cashflow from operating activities less net capital investments during the period including repayments under leases. g) Net debt excludes Subordinated Neptune Energy Group Limited Loan and Touat project finance facility as defined by the RBL and Shareholder agreements. The Touat project finance facility was
repaid at the end of September 2020.
Underlying operating profit is calculated before the impact of impairment gains and losses and net restructuring as follows:
US$ millions Second quarter
2021 Second quarter
2020 First half
2021 First half
2020
Operating profit/(loss) before financial items and tax 230.8 (72.1) 402.1 83.2
Add back:
Impairment (gains)/losses (82.4) 125.0 (82.4) 125.0
Net restructuring cost/(release) (1.1) 34.0 (0.5) 33.7
Underlying operating profit before financial items and tax 147.3 86.9 319.2 241.9
Sam Laidlaw, Executive Chairman “As COVID-19 vaccination programmes continue to be rolled out across the world, energy demand in key markets is recovering. However, the recovery remains uneven and, with concerns around new variants, we remain vigilant and focused on managing the risks to our people, our operations and our business. “Neptune continues to navigate this environment well and we delivered a strong operational and financial performance in the first half of the year, laying the foundations for growth towards our production target of 185-200 kboepd in 2023. “We see good opportunities for growth from New Energy, particularly with CCS, hydrogen and electrification, and continue to make progress with our projects, which would build on our existing lower carbon position.” Jim House, Chief Executive Officer “Neptune continued to deliver on plan in the second quarter of the year, with a good safety performance, new projects delivered and further positive results from our drilling activities. “Our strong financial performance was underpinned by higher commodity prices and supported by robust production and continued tight cost control across the Group. “In the second half of the year, we expect to deliver materially higher production, driven by our investment in new projects and the Touat Gas Plant reaching full export capacity, leading to higher cash flow and decreasing leverage.”

Neptune Energy Group Midco Limited
Unaudited Condensed Consolidated Financial Statements
For the period ended 30 June 2021
Neptune Energy Group Midco Limited Report for the period ended 30 June 2021
5
GROUP OVERVIEW Operational review Neptune Energy delivered a robust operational performance in the second quarter of 2021, with production in line with guidance and the start-up of our Merakes development (Indonesia) in April. We also delivered further success from our exploration and appraisal programme from wells drilled in Indonesia and the Netherlands. Our development activities continue to progress well and in August we expect our Duva project (Norway) to start-up, which will be our third major new development onstream in 2021. These developments add more than 27 kboepd of new production, which will result in a significant increase in production from the second half of the year, towards our 2023 target of 185-200 kboepd. Health, safety and environment Our HSE performance remained robust across all our countries in the first half of the year. There were no serious personal injuries and our total recordable injury rate (TRIR) was 1.6 per million hours worked, up slightly from 1.4 in 2020, but in line with our annual target. Our lost time injury frequency rate (LTIF) increased to 1.0 per million hours worked from 0.6 in the first quarter of 2021 and is above our target of 0.6. Of the six injuries recorded in 2021, five were in Algeria, which is a particular focus for improvement. These figures include both direct operated and cooperated joint venture activities. In June, we recorded a milestone at our Norwegian operations, with a full year without recordable incidents. This includes exemplary safety records at our operated Gjøa P1 and Duva projects. Our Process Safety Event Rate (PSER) KPI for the second quarter saw an increase from 2.4 per million hours worked in 2020 to 3.0, which is above our target of 2.4. We had no tier 1 process safety events in the first half of 2021. Our PSER KPI tracks small non-reportable losses, as well as those with the greatest consequence, enabling us to identify leading indicators and prevent more serious events. In the second half of 2021, we expect to complete the full roll-out of our process safety fundamentals campaign. In July, EcoVadis upgraded our ESG rating and awarded us a Silver Medal in recognition of our ESG performance. This places us in the top 25% of 75,000 global companies assessed by EcoVadis and demonstrates the progress we continue to make on our ESG strategy. As part of our three-year ESG roadmap, we commissioned an independent organisation to assess our business and supply chain performance against the UN Guiding Principles on Business and Human Rights. This included a detailed review of our current policies and practices on HSE, labour, supply chain, security and community engagement. The assessment outlined the strengths of our existing systems, together with recommendations that we are integrating into our plans.
As part of our commitment to responsible business practices, we became a signatory to the UN Global Compact, which sets out 10 principles on human rights, the environment and anti-corruption. Production Group production for the second quarter of 2021 averaged 115.4 kboepd, in line with expectations. Including production-equivalent insurance income for the outages at Snøhvit (Norway) and Touat (Algeria), economic production averaged 136.3 kboepd. Production in the second quarter reflected planned shutdowns at Gjøa and Fram in Norway and Cygnus in the UK. This was offset by a strong performance in the Netherlands, due to higher production availability, and the contribution of new volumes from the Gjøa P1 (Norway) and Merakes projects. Merakes, which came onstream in April, is demonstrating strong deliverability with the Jangkrik floating production unit (FPU) operating at its full 750 mmcfpd export capacity. Gjøa P1 is also performing better than expected. Following successful completion of identified remedial works at Touat in the first quarter of 2021, issues with the amine process system, as a result of the earlier outage, limited output during the second quarter. The amine system was repaired in July and production is now ramping up to plant export capacity levels.

Neptune Energy Group Midco Limited
Unaudited Condensed Consolidated Financial Statements
For the period ended 30 June 2021
Neptune Energy Group Midco Limited Report for the period ended 30 June 2021
6
In the UK, export constraints and reduced blend gas availability limited output in the second quarter. These restrictions were mitigated partially by the scheduling of our shutdown plans, along with temporary changes to network entry provisions at the onshore Bacton receiving terminal. Excluding third-party disruptions and planned shutdown activity, underlying production efficiency improved slightly to 92% reflecting an improvement in the Netherlands, where we have implemented enhanced maintenance and integrity management programmes. Production efficiency at our operated assets averaged 68%, reflecting the planned shutdowns in Norway and the UK. The carbon intensity of our operated production in the first half of 2021 remained low at 7 kg CO2/boe. While carbon intensity will increase marginally as a result of the compression project at Cygnus, we still expect it to remain within guided levels of around 9 kg CO2/boe for the full year, significantly lower than the industry average of 17 kg CO2/boe. We initiated energy management reviews in Norway and the Netherlands in the second quarter to identify opportunities to improve efficiency and reduce emissions. We plan to implement recommendations from the findings in the second half of 2021. Our methane intensity also remained low at a 0.02%. In September, our methane monitoring study at the Cygnus platform is due to commence. By utilising drone technology, the study will capture detailed data on emissions and identify where we need to take further action, including how we can apply new measurement techniques across our operated portfolio. In early June, we announced the creation of digital twins for five of our operated platforms in Norway, the Netherlands and the UK. The use of digital twins, along with VR technology, is expected to increase operational efficiencies across maintenance programmes, in order to improve safety, reduce operational costs and lower carbon emissions through reductions in offshore activities. Projects and exploration We continue to advance our project pipeline, with significant progress at Seagull (UK), Njord and Fenja (both Norway) in the first half of the year. These three projects will add a further 47 kboepd at plateau, taking us further towards our target of 185-200 kboepd in 2023. At Seagull, the first of four development wells has been drilled, with the second currently underway. In the third quarter, we are planning a subsea campaign for installation of the umbilical, pipeline and manifold. At Fenja, topside construction activities are progressing as planned. In the second half of the year the subsea infrastructure programme is expected to be completed. At Njord, work has progressed with a decision on timing of sail-away of the Njord A FPU expected by the fourth quarter. Our New Energy initiatives also continue to progress well. In the Netherlands, contracts have been awarded to assess the suitability of the reuse of existing wells, pipelines and infrastructure for our carbon capture and storage project at L10. The project has the potential to safely store 5-8 million tonnes of CO2 annually for third-party industrial customers – many times our own annual emissions. At PosHYdon, our green hydrogen pilot project in the Netherlands, the Netherlands Enterprise Agency has awarded a subsidy worth €3.6 million. The consortium agreement has now been finalised, with activities commencing in the third quarter. In May we submitted plans to the UK Oil and Gas Authority for a Carbon Dioxide Appraisal and Storage licence. The project would offer a combined CCS and blue hydrogen solution for the South Humber industrial area. In the second quarter, we delivered further exploration and appraisal success with positive results from wells drilled in Indonesia and the Netherlands. In Indonesia, the Maha-2 appraisal well, drilled in the West Ganal Block (Neptune 30%), demonstrated excellent reservoir characteristics and strong gas deliverability during testing. The Maha field is located within tie-back distance to our Jangkrik FPU. In the Netherlands, the Turkoois exploration well (Neptune 24%) successfully encountered gas and the results are being evaluated.

Neptune Energy Group Midco Limited
Unaudited Condensed Consolidated Financial Statements
For the period ended 30 June 2021
Neptune Energy Group Midco Limited Report for the period ended 30 June 2021
7
Financial review Despite temporarily lower production, as guided, we delivered robust financial results in the first half of 2021, with EBITDAX of $669.6 million and post-tax operating cash flow of $530.4 million, higher than in the same period of 2020. Results during the first half of 2021 benefited from higher commodity prices, tight cost control, net cash tax refunds and continued business interruption insurance income. Business interruption insurance income of $60.1 million, related to the long-term outage in Norway, was recognised in the first half of 2021, of which $30.6 million was attributable to the second quarter. At the end of the June, an interim claim was agreed with our insurers in Algeria. Further insurance income is expected to be recognised in the second half of the year and in 2022. As commodity prices strengthened in the second quarter of 2021, we took the opportunity to add hedges to protect cash flows for the rest of the year, as well as for 2022 and 2023. As a result, at the end of June, we have satisfied obligations under our RBL and are now 60% hedged for the remainder of 2021 for after tax volumes. Hedged volumes include swaps, puts and collars, providing good downside protection, while also retaining exposure to improvements in the commodity price cycle. Operating costs in the first half of the year were $10.6/boe, reflecting planned shutdowns at some of our lowest cost fields in the UK and Norway. Operating costs increased temporarily above $11/boe in the second quarter of 2021, but are expected to fall back below this level in the fourth quarter as production increases. G&A costs increased to $37.8 million ($1.8/boe) due to relocation costs associated with our new head office in Germany and for extra employees allocated to our Touat joint venture. Exploration expenses of $24.1 million in the first half of 2021 included geological and geophysical studies, seismic costs and the unsuccessful, non-operated Apodida well, drilled in Norway. In the first half of 2021 we recognised a net impairment reversal of $82.4 million related to our operations in the Netherlands. This reflected an impairment reversal at a Netherlands Cash Generating Unit (CGU), offset partially by an impairment charge for our unsuccessful development well on another Netherlands CGU. In the first half of 2020, we recognised a net impairment charge of $125.0 million, largely related to our operations in the Netherlands and Indonesia. In the first half of 2021, we invested $320.1 million in development capex, largely in the completion of our projects in Norway and Indonesia and a further $15.8 million in our equity accounted entities, including Touat. We capitalised a further $68.7 million in exploration and pre-development spend reflecting positive results from our drilling programme. Continued cost control, net cash tax refunds of $125.8 million and disciplined capital allocation helped to deliver free cash flow of $61.3 million in the first half of 2021, compared with a $55.6 million outflow in the corresponding period of 2020. Growth in free cash flow was limited in the first half of 2021 by a working capital outflow of $193.5 million, related to the increase in commodity prices, lifting schedules and the outage at Snøhvit. Leverage at 30 June 2021 was within the expected range, at 1.95 times net debt to EBITDAX. This reflected largely our capex spend in the first half of the year and the $200 million dividend payment to shareholders in the first quarter. In the second half of 2021 we expect production and cash flow to increase, reducing leverage to less than 1.5 times by the end of the year. In June, Moody’s revised its outlook on our ‘Ba3’ long-term rating from ‘stable’ to ‘positive’. This followed outlook upgrades from both S&P and Fitch in the first quarter. Outlook Despite the roll-out of COVID-19 vaccinations programmes, we remain conscious of the pandemic’s ongoing impacts on our people, our operations and the market. The health and safety of our people and the integrity of our operations remains of paramount importance and, therefore, remains our focus. In the third quarter, we have planned shutdowns at Gjøa (Norway), Gudrun (Norway) and L5a-D (Netherlands). However, the impact of these shutdowns is expected to be more than offset by a full quarter’s production from Merakes, start-up of our operated Duva project and higher expected production from Touat, which together are expected to result in materially higher production.

Neptune Energy Group Midco Limited
Unaudited Condensed Consolidated Financial Statements
For the period ended 30 June 2021
Neptune Energy Group Midco Limited Report for the period ended 30 June 2021
8
As a result of higher production and the continued strengthening of commodity prices, we expect EBITDAX and post-tax operating cash flow to increase in the third quarter, leading to lower leverage. Our full year guidance for post-tax operating cash flow (before working capital) has also increased from ~$1.4 billion to more than $1.6 billion. Unit opex is expected to remain above $11/boe in the third quarter before declining in the fourth quarter as production increases. For the full year, opex is likely to average towards the lower end of our $11-12/boe guidance range. Full year capex guidance is unchanged, but we have increased guidance for exploration and pre-development spend to around $180 million, reflecting higher activity levels and additional costs for testing related to our drilling success. For the full year, the extended shutdowns at Snøhvit (Norway) and Touat (Algeria) are likely to reduce production for 2021 to 130-135 kboepd, towards the lower end of our guidance range. The impact of this reduction will be mitigated through business interruption insurance income, resulting in expected economic production for 2021 of 140-155 kboepd. OPERATING REVIEW EUROPE Norway In Norway, production averaged 36.0 kboepd in the second quarter, reflecting planned extended shutdowns at Gjøa and Fram and a shorter planned shutdown at Gudrun. Our production performance in Norway continues to be strong with good production efficiency. We have also achieved 12 months with no recordable injuries, process safety incidents or harmful discharges to the environment. At Gjøa, the planned shutdown starting in April enabled topside modifications to be completed for the Duva and Nova projects. In April, the final drilling campaign on Duva commenced, with three of the four wells completed. Duva is expected to be brought onstream in August and contribute 8 kboepd of net production. The Gjøa P1 project, which came onstream in February, continues to perform better than expected. At our Fenja project, all construction activities are progressing as planned, including the laying of our ground-breaking electrically trace-heated pipe. In the third quarter, pipelay activities will complete the subsea infrastructure programme ahead of final hook-up to Njord. At Njord, work has progressed with a decision on timing of sail-away of the Njord A FPU to be taken by the fourth quarter. In the third quarter, a further three-day shutdown is planned at Gjøa, with an extended shutdown for the Nova development now deferred until March 2022. A shutdown is also planned at Gudrun in September. Repairs at Snøhvit are progressing to plan with the operator, Equinor, continuing to guide restart at the end of the first quarter of 2022. We are working with our partners to potentially bring this forward. In June, drilling commenced at the Ommadawn prospect (Neptune 20%), which is located on PL970 and close to existing discoveries. We plan to spud the Dugong Tail exploration well (Neptune 45%) in the third quarter, potentially adding significant further resources to the adjacent Dugong discovery. The Apodida exploration well, drilled in June and targeting a structure close to our recent Echino South and Blasto discoveries (Neptune 15%), was dry. In early June, we agreed to dispose of our interest in the Solsort field in Denmark to Danoil Exploration A/S for up to $6 million, including contingent payments due on certain milestones. Netherlands Production in the Netherlands continued to be strong in the second quarter, averaging 21.5 kboepd as the portfolio benefitted from higher uptime as a result of our enhanced maintenance and integrity management programmes. Production from L5a-D was higher as cleaning scopes and choke change-out cycles were reduced. In the second quarter, we completed successfully annual shutdowns at E17 and K12, with a planned shutdown of the Q13-a platform deferred until August. Production from the Netherlands is expected to be lower in the
Neptune Energy Group Midco Limited
Unaudited Condensed Consolidated Financial Statements
For the period ended 30 June 2021
Neptune Energy Group Midco Limited Report for the period ended 30 June 2021
9
third quarter reflecting our seasonal maintenance programmes. The K9ab-A4 development well was drilled and abandoned due to being uneconomic to complete. In April, we confirmed a gas discovery at the Turkoois prospect, located offshore on the Netherlands/German border and adjacent to planned infrastructure. Results from the Turkoois well are currently being evaluated. We continue to make good progress with our New Energy initiatives in the Netherlands. At our L10 CCS project, we are progressing a feasibility study into injecting 5-8 million tonnes of CO2 into depleted gas fields around our L10 platform. Contracts have been awarded to assess the suitability of the offshore pipelines, infrastructure and wells for reuse, and discussions with CO2 emitters are ongoing. In July, our green hydrogen PosHYdon pilot was awarded a €3.6 million subsidy by the Netherlands Enterprise Agency and the consortium agreement was finalised. A topside feasibility study will commence in the third quarter. UK In the UK, production averaged 10.9 kboepd in the second quarter, reflecting reduced availability of SEAL blend gas due to significant planned and unplanned outages at key third-party infrastructure, export constraints at the Bacton onshore receiving terminal and a planned shutdown at Cygnus (from late May to mid-June). A temporary blending arrangement, in conjunction with National Grid, was successfully utilised from mid-June (for one month) to provide mitigation during the extended SEAL outage. Gas compression at Cygnus is expected to commence in the third quarter. In the first half of the year, we commenced the development drilling campaign at our Seagull project, with the first of the wells now complete. The subsea campaign to install the umbilical, pipeline and manifold is planned for the third quarter. An extended maintenance programme on the host ETAP platform was completed in July. In early July we completed the acquisition of a 38.75% interest in the Pegasus West discovery from Spirit Energy. Pegasus West is located within tie-back distance to Cygnus and will help maintain higher production in the medium-term with first gas possible from 2025. We are working with Spirit Energy to advance FEED studies ahead of a final investment decision anticipated by the end of 2021. Neptune will operate the development phase. In May, we announced that we had submitted plans to the UK Oil & Gas Authority for a Carbon Dioxide Appraisal and Storage licence. The project would offer a combined CCS and blue hydrogen solution for the South Humber industrial area. Germany In the second quarter, production in Germany averaged 18.6 kboepd reflecting completion of our recent acquisition from Wintershall Dea and a strong performance from the Adorf and Ringe gas fields. These additions were partially offset by an electric submersible pump (ESP) failure at Rӧmerberg and shutdowns at the Husum and Altmark gas fields due to export constraints. Production is expected to average slightly higher rates in the third quarter as these restrictions ease. Drilling of the Adorf-Z16 well is progressing well, with the well expected to come onstream in the fourth quarter. Start-up of the Rӧmerberg-6 well has been deferred until 2022 following a revision to the work programme. NORTH AFRICA Algeria Following restart of production from Touat in April, issues with the amine process system, as a result of the earlier outage, required a further shutdown, which limited output in the second quarter to 2.7 kboepd. After repairs to the amine system, production restarted at the beginning of July, with output expected to gradually ramp-up to plant export capacity and contribute significantly higher volumes to Group production in the second half of the year.

Neptune Energy Group Midco Limited
Unaudited Condensed Consolidated Financial Statements
For the period ended 30 June 2021
Neptune Energy Group Midco Limited Report for the period ended 30 June 2021
10
Egypt Production from Egypt was stable in the second quarter, averaging 3.4 kboepd. During the second quarter, we added additional perforations to the Assil-9 well, worked over the Magd-1 well and installed several new ESPs after achieving positive results from recent upgrades, which has been operating for nine months. We are working closely with the operator to bring forward activity and optimise production. In the third quarter, we plan to continue our workover and ESP/SRP (sucker rod pumps) replacement programmes and have commenced the drilling of two back-to-back exploration wells at Assil C105 and Bahga C101-D. The Karam-11 well is expected to start-up in the fourth quarter. During the first half of the year we made good progress reducing our receivable balance through strong cash collections. Our receivables balance is now at its lowest level for more than a decade. ASIA PACIFIC Indonesia Production in Indonesia was stronger in the second quarter, following start-up of the Merakes field in April. The strong performance from Merakes was offset partially by temporary process issues at the Bontang LNG plant in May. Production in the second quarter averaged 22.3 kboepd, up from 13.9 kboepd the first quarter. During July, output was reduced temporarily for the replacement of an umbilical at Jangkrik. Production is expected to increase further in the second half of 2021 as output from Merakes is optimised. In June, ENI, the operator of the West Ganal licence, announced that the Maha-2 appraisal well had encountered 43m of gas-bearing sands with excellent reservoir characteristics. A drill stem test demonstrated strong gas deliverability flowing at 34 mmcfpd, which was limited by surface facilities. The data collected from this programme will support a future subsea development and tie-back to the Jangkrik FPU, which is located 16 km north-west. Australia In June, we were awarded six new offshore exploration licences in the Bonaparte Basin. Three of the licences, including two operated blocks, are located close to our Petrel field in the Petrel Sub-Basin, where we are continuing to make good progress towards concept selection and the start of FEED. During the second quarter, we continued to engage with our partners to advance commercial studies and mature technical work aimed at reducing subsurface risk and further defining the resource range. At our new licences we will utilise recently acquired 3D seismic to work up a prospect and lead inventory to support the Petrel development. The remaining three exploration licences are located in the Vulcan Sub-Basin providing growth potential in a proven hydrocarbon area. Modern 3D seismic is expected to provide a step change in this region, helping to improve our understanding of existing prospects and leads while identifying new play types.

Neptune Energy Group Midco Limited
Unaudited Condensed Consolidated Financial Statements
For the period ended 30 June 2021
Neptune Energy Group Midco Limited Report for the period ended 30 June 2021
11
Summary of production by area - wholly owned affiliates Second quarter
2021
Second quarter
2020
First half 2021
First half 2020
Gas production (kboepd)
Norway 16.0 20.7 19.6 22.8
UK 10.7 19.0 12.9 18.9
Netherlands 20.1 21.6 20.8 19.3
Germany 12.5 11.4 12.9 11.3
North Africa 3.0 3.4 3.0 3.6
Asia Pacific 8.3 4.2 8.3 4.1
Total Gas production (kboepd) 70.6 80.3 77.5 80.0
Gas production for sale as LNG (kboepd)
Norway - 7.1 - 10.2
Asia Pacific 13.6 13.7 14.1 17.2
Total Gas production for sale as LNG (kboepd) 13.6 20.8 14.1 27.4
Oil production (kbpd)
Norway 14.6 16.5 15.9 17.6
UK - - - -
Netherlands 1.3 1.3 1.4 1.7
Germany 6.1 6.3 6.3 6.2
North Africa 0.4 1.5 0.4 1.5
Asia Pacific - - - -
Total Oil production (kbpd) 22.4 25.6 24.0 27.0
Other Liquid production (kbpd)
Norway 5.4 9.6 7.2 10.4
UK 0.2 0.4 0.3 0.4
Netherlands 0.1 0.2 0.2 0.2
Germany - - - -
North Africa - - - -
Asia Pacific 0.4 0.6 0.4 0.6
Total Other Liquid production (kbpd) 6.1 10.8 8.1 11.6
Total production (kboepd)
Norway 36.0 53.9 42.7 61.0
UK 10.9 19.4 13.2 19.3
The Netherlands 21.5 23.1 22.4 21.2
Germany 18.6 17.7 19.2 17.5
North Africa 3.4 4.9 3.4 5.1
Asia Pacific 22.3 18.5 22.8 21.9
Total production (kboepd) 112.7 137.5 123.7 146.0

Neptune Energy Group Midco Limited
Unaudited Condensed Consolidated Financial Statements
For the period ended 30 June 2021
Neptune Energy Group Midco Limited Report for the period ended 30 June 2021
12
Summary of production by area – equity accounted affiliates
Second quarter
2021
Second quarter
2020
First half 2021
First half 2020
Gas production (kboepd)
North Africa 2.7 11.8 2.5 9.6
Total Gas production (kboepd) 2.7 11.8 2.5 9.6
Oil production (kbpd)
North Africa - 0.3 - 0.2
Total Oil production (kbpd) - 0.3 - 0.2
Total production (kboepd)
North Africa 2.7 12.1 2.5 9.8
Total production (kboepd) 2.7 12.1 2.5 9.8
Summary of production by area – wholly owned and equity accounted affiliates
Second quarter
2021
Second quarter
2020
First half 2021
First half 2020
Total production (kboepd)
Norway 36.0 53.9 42.7 61.0
UK 10.9 19.4 13.2 19.3
The Netherlands 21.5 23.1 22.4 21.2
Germany 18.6 17.7 19.2 17.5
North Africa 6.1 17.0 5.9 14.9
Asia Pacific 22.3 18.5 22.8 21.9
Total production (kboepd) 115.4 149.6 126.2 155.8

Neptune Energy Group Midco Limited
Unaudited Condensed Consolidated Financial Statements
For the period ended 30 June 2021
Neptune Energy Group Midco Limited Report for the period ended 30 June 2021
13
Financial review
This report includes the Group results for the six months ended 30 June 2021.
Results of operations
US$ millions Second quarter
2021 Second quarter
2020 First half
2021 First half
2020
Revenue 506.4 337.2 874.2 816.9
Operating profit/(loss) (note a) 230.8 (72.1) 402.1 83.2
Underlying operating profit (note b) 147.3 86.9 319.2 241.9
Profit/(loss) before tax 162.6 (124.9) 360.0 (6.5)
Taxation (140.2) (35.1) (259.7) (106.5)
Net profit/(loss) after tax 22.4 (160.0) 100.3 (113.0)
EBITDAX (RBL basis) (note c) 346.4 214.7 669.6 537.6
Cash flow from operations, after tax 530.4 417.3
Adjusted development cash capital expenditure (note d) 336.0 430.2
Net debt (book value) (RBL basis) (note e) 2,044.4 1,646.8
Net debt/EBITDAX (RBL basis) (notes e and f) 1.95x 1.31x
a) Operating (loss)/profit comprises current operating income after share in net income of entities accounted for using the equity method and is stated before tax and finance costs, but
after mark- to-market on commodity contracts and non-recurring items. b) Underlying operating profit is calculated as operating (loss)/profit before the impact of impairment gains and losses and net restructuring. A full calculation is shown on page 30. c) EBITDAX comprises net income for the period before income tax expense, financial expenses, financial income, impairment losses, other operating gains and losses, exploration expense and
depreciation and amortisation. EBITDAX as defined by the RBL and shareholder agreement includes our share of net income from Touat in 2020 following the repayment of the Touat Vendor Loan. EBITDAX for the second quarter 2020 excludes our $13.0 million share of net income from Touat and the half year 2020 excludes our $22.3 million share of net income from Touat.
d) Adjusted development cash capital expenditure excludes capital expenditure on acquisitions and includes capital expenditure of $15.9 million for the period (2020: $15.9 million) in respect of the Touat project, held by a joint venture company which Neptune accounts for under the equity method.
e) Net debt excludes Subordinated Neptune Energy Group Limited Loan and Touat project finance facility as defined by the RBL and Shareholder agreements. The Touat project finance facility was repaid at the end of September 2020.
f) EBITDAX is based on a 12-month rolling average value of $1,049.6 million (2020: $1,255.9 million), as defined by RBL and Shareholder agreements and as described in note c above.
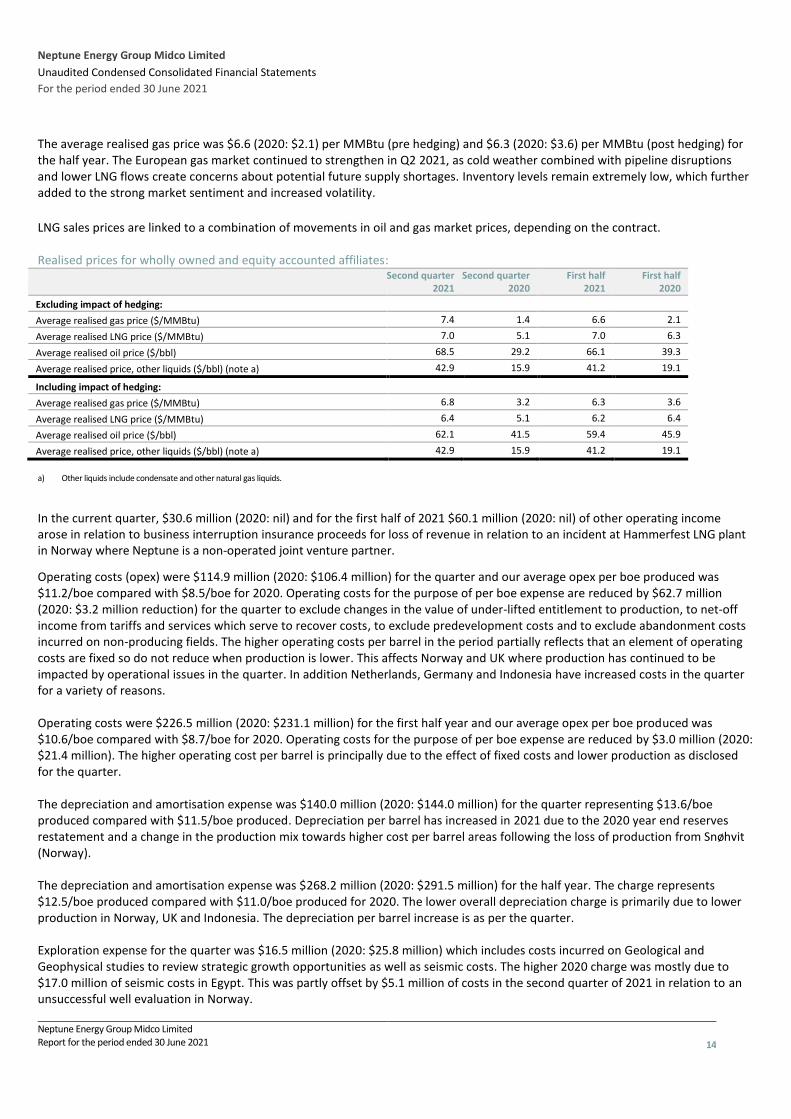
Total revenues for the quarter were $506.4 million (2020: $337.2 million), reflecting total production of 10.3 mmboe (2020: 12.5 mmboe). Realised prices, before and after hedging, are shown in the table below. The significantly higher commodity prices offset in part by lower production are the principal reason for the higher revenues in the quarter. Revenues for the half year were $874.2 million (2020: $816.9 million), reflecting total production from wholly owned subsidiaries of 21.4 mmboe (2020: 26.6 mmboe). Production for the period is lower than 2020 notably in the second quarter but this has been more than offset by higher commodity prices in 2021. The Brent crude price averaged $69.0 (2020: $33.4) per barrel for the quarter and our average realised oil price (pre hedging) was $68.5 per barrel (2020: $29.2) for the quarter. With the oil price higher in 2021 the impact of hedging is also significant with our average realised oil price (post hedging) being $62.1 per barrel (2020: $41.5) for the quarter. The Brent crude price averaged $65.0 (2020: $42.1) per barrel for the half year and our average realised oil price (pre hedging) was $66.1 per barrel (2020: $39.3) for the same period. Including hedging our average realised oil price was $59.4 per barrel (2020: $45.9) for the half year. In the first half of 2021 prices maintained their upward trajectory from 2020’s COVID-19 lows as the OPEC+ group renewed its commitment to supply cuts while the gradual recovery in oil demand continued as vaccine rollouts accelerated. The average realised gas price was $7.4 (2020 $1.4 per MMBtu (pre hedging) and $6.8 (2020: $3.2) per MMBtu (post hedging) for the quarter.
Neptune Energy Group Midco Limited
Unaudited Condensed Consolidated Financial Statements
For the period ended 30 June 2021
Neptune Energy Group Midco Limited Report for the period ended 30 June 2021
14
The average realised gas price was $6.6 (2020: $2.1) per MMBtu (pre hedging) and $6.3 (2020: $3.6) per MMBtu (post hedging) for the half year. The European gas market continued to strengthen in Q2 2021, as cold weather combined with pipeline disruptions and lower LNG flows create concerns about potential future supply shortages. Inventory levels remain extremely low, which further added to the strong market sentiment and increased volatility.
LNG sales prices are linked to a combination of movements in oil and gas market prices, depending on the contract. Realised prices for wholly owned and equity accounted affiliates:
Second quarter
2021 Second quarter
2020 First half
2021 First half
2020
Excluding impact of hedging:
Average realised gas price ($/MMBtu) 7.4 1.4 6.6 2.1
Average realised LNG price ($/MMBtu) 7.0 5.1 7.0 6.3
Average realised oil price ($/bbl) 68.5 29.2 66.1 39.3
Average realised price, other liquids ($/bbl) (note a) 42.9 15.9 41.2 19.1
Including impact of hedging:
Average realised gas price ($/MMBtu) 6.8 3.2 6.3 3.6
Average realised LNG price ($/MMBtu) 6.4 5.1 6.2 6.4
Average realised oil price ($/bbl) 62.1 41.5 59.4 45.9
Average realised price, other liquids ($/bbl) (note a) 42.9 15.9 41.2 19.1 a) Other liquids include condensate and other natural gas liquids.
In the current quarter, $30.6 million (2020: nil) and for the first half of 2021 $60.1 million (2020: nil) of other operating income arose in relation to business interruption insurance proceeds for loss of revenue in relation to an incident at Hammerfest LNG plant in Norway where Neptune is a non-operated joint venture partner.
Operating costs (opex) were $114.9 million (2020: $106.4 million) for the quarter and our average opex per boe produced was $11.2/boe compared with $8.5/boe for 2020. Operating costs for the purpose of per boe expense are reduced by $62.7 million (2020: $3.2 million reduction) for the quarter to exclude changes in the value of under-lifted entitlement to production, to net-off income from tariffs and services which serve to recover costs, to exclude predevelopment costs and to exclude abandonment costs incurred on non-producing fields. The higher operating costs per barrel in the period partially reflects that an element of operating costs are fixed so do not reduce when production is lower. This affects Norway and UK where production has continued to be impacted by operational issues in the quarter. In addition Netherlands, Germany and Indonesia have increased costs in the quarter for a variety of reasons. Operating costs were $226.5 million (2020: $231.1 million) for the first half year and our average opex per boe produced was $10.6/boe compared with $8.7/boe for 2020. Operating costs for the purpose of per boe expense are reduced by $3.0 million (2020: $21.4 million). The higher operating cost per barrel is principally due to the effect of fixed costs and lower production as disclosed for the quarter. The depreciation and amortisation expense was $140.0 million (2020: $144.0 million) for the quarter representing $13.6/boe produced compared with $11.5/boe produced. Depreciation per barrel has increased in 2021 due to the 2020 year end reserves restatement and a change in the production mix towards higher cost per barrel areas following the loss of production from Snøhvit (Norway). The depreciation and amortisation expense was $268.2 million (2020: $291.5 million) for the half year. The charge represents $12.5/boe produced compared with $11.0/boe produced for 2020. The lower overall depreciation charge is primarily due to lower production in Norway, UK and Indonesia. The depreciation per barrel increase is as per the quarter. Exploration expense for the quarter was $16.5 million (2020: $25.8 million) which includes costs incurred on Geological and Geophysical studies to review strategic growth opportunities as well as seismic costs. The higher 2020 charge was mostly due to $17.0 million of seismic costs in Egypt. This was partly offset by $5.1 million of costs in the second quarter of 2021 in relation to an unsuccessful well evaluation in Norway.

Neptune Energy Group Midco Limited
Unaudited Condensed Consolidated Financial Statements
For the period ended 30 June 2021
Neptune Energy Group Midco Limited Report for the period ended 30 June 2021
15
Exploration expense for the half year was $24.1 million (2020: $47.9 million). The higher 2020 charge was mostly due to $11.5 million of costs for an unsuccessful well evaluation in Norway in the first quarter and $17.0 million of seismic costs in Egypt in the second quarter. 2021 includes $5.1 million of costs in the second quarter in relation to an unsuccessful well evaluation in Norway. General and administration expense for the quarter was $19.4 million (2020: $12.6 million) and $37.8 million (2020: $25.9 million) for the half year. The increased G&A costs in 2021 for the quarter and the year to date is due to higher costs in Germany from the office relocation, additional costs for employees allocated to our equity accounted Algerian joint venture and 2020 benefitting from the recognition of R&D recharge credits in Norway due to the high capital expenditure in the period. Share in net income of entities accounted for under the equity method was $6.3 million (2020: $13.3 million) for the quarter. This represents the Touat joint venture of $5.9 million income (2020: $13.1 million income) and tariff income from one of our Dutch pipeline interests of $0.4 million (2020: $0.2 million). The lower income from the Touat joint venture reflects the loss of production in the quarter but also includes $15.4 million in relation to business interruption insurance proceeds for loss of revenue from the production outage. Share in net income of entities accounted for under the equity method was $2.6 million (2020: $22.7 million) for the half year. This represents the Touat joint venture, of $1.8 million (2020: $22.3 million income) and tariff income of one of our Dutch pipeline interests of $0.8 million (2020: $0.4 million). As for the quarter the lower income from the Touat joint venture reflects the loss of production in the year to date. Net impairment gains (pre-tax) for the quarter and for the half year were a total of $82.4 million (2020: net loss of $125.0 million). The 2021 impairments included the reversal of a PP&E impairment of $96.5 million for a single CGU in the Netherlands due to an upward reserves revision offset by a PP&E impairment of $13.2 million for a second CGU in the Netherlands due to a deterioration of underlying reservoir performance and an impairment to intangibles in Denmark of $0.9 million due to the future sale of an asset. The 2020 impairments included PP&E impairments of $53.2 million for a single CGU in the Netherlands and $66.3 million for a single CGU in Indonesia and goodwill impairments of $5.7 million in Egypt and Denmark. These impairments were primarily due to decreases in the long-term price assumptions for the assets. The 2020 total impairment losses also include an impairment to intangibles in a single CGU in Denmark for $7.7 million and an intangible impairment reversal in Norway of $7.9 million due to a discovery. Other operating losses were $41.5 million (2020 $5.1 million) for the quarter. The quarter loss includes a net mark-to-market loss on currency and commodity derivative contracts of $41.0 million (2020: $14.5 million gain), a net restructuring provision release of $1.1 million (2020: $34.0 million charge), and other losses of $1.6 million (2020: $14.4 million gains). Other losses in 2021 includes a $2.0 million licence penalty in relation to a legacy Brazilian subsidiary. Other gains in 2020 included an $18.4 million release of contingent consideration in relation to the Denmark assets that were part of the VNG acquisition in Norway offset by a $5.0 million fee for the termination of the planned acquisition from Energean Oil and Gas. The net restructuring costs recorded in the second quarter of 2020 equalled a charge of $38.5 million in relation to the June 2020 announcement to reduce 400 positions across the business, offset by a release of $4.5 million relating to a 2019 reorganisation. Other operating losses were $57.6 million (2020: $12.3 million) for the half year. The 2021 loss includes a loss on mark-to-market on commodity contracts other than trading instruments of $58.2 million (2020: $3.5 million gain), a restructuring provision release of $0.5 million (2020: $33.7 million cost), a $2.5 million gain from a release of a contingent consideration in relation to the 2018 VNG acquisition and other losses of $2.4 million (2020 $17.9 million gain). 2020 restructuring costs and other gains arose as described in the quarter. The Group’s operating profit for the quarter was $230.8 million (2020: $72.1 million loss) before net finance costs. Underlying operating profit is calculated before the impact of impairment losses and restructuring costs. Underlying operating profit for the quarter is $147.3 million (2020: $86.9 million). The Group’s operating profit for the half year was $402.1 million (2020: $83.2 million) before net finance costs. Underlying operating profit for the half year is $319.2 million (2020: $241.9 million). For more detail on underlying operating profit reconciliation, please see table on the next page.

Neptune Energy Group Midco Limited
Unaudited Condensed Consolidated Financial Statements
For the period ended 30 June 2021
Neptune Energy Group Midco Limited Report for the period ended 30 June 2021
16
US$ millions Second quarter
2021 Second quarter
2020 First half
2021 First half
2020
Operating (loss)/profit before financial items and tax 230.8 (72.1) 402.1 83.2
Add back:
Net impairment (gain)/loss (82.4) 125.0 (82.4) 125.0
Net restructuring cost (1.1) 34.0 (0.5) 33.7
Underlying operating profit before financial items and tax 147.3 86.9 319.2 241.9
Net financing expenses were $68.2 million (2020: $52.8 million) for the quarter. The majority of the change relates to a net foreign exchange loss. The net foreign exchange loss arises on the revaluation of loans and working capital balances for internal funding purposes across the Group and is principally impacted by the exchange rates for Euros, Norwegian Krona, Sterling and US Dollars. Net financing expenses were $42.1 million for the half year compared to $89.7 million in 2020. The majority of the change in the half year relates to a net foreign exchange gain in the period in relation to the revaluation of loans and working capital balances for internal funding purposes across the Group. The Group’s profit before tax for the quarter was $162.6 million (2020: $124.9 million loss). EBITDAX (as defined by the RBL and Shareholders Agreements) for the period was $346.4 million, compared with $214.7 million for the same period in 2020. The increase in EBITDAX principally reflects higher realised commodity prices in the period partly offset by lower production. For the half year the Group’s profit before tax was $360.0 million (2020: $6.5 million loss). EBITDAX (as defined by the RBL and Shareholders Agreements) for the half year was $669.6 million, compared with $537.6 million for the same period in 2020. The increase in EBITDAX principally reflects higher realised commodity prices in the period partly offset by lower production.
US$ millions Second quarter
2021 Second quarter
2020 First half
2021 First half
2020
Profit/(loss) before tax, after financial items 162.6 (124.9) 360.0 (6.5)
Add back:
Net financing expenses 68.2 52.8 42.1 89.7
Other operating losses 41.5 5.1 57.6 12.3
Net impairment (gains)/losses (82.4) 125.0 (82.4) 125.0
Exploration expense 16.5 25.8 24.1 47.9
DD&A 140.0 144.0 268.2 291.5
Share of net income from investments using equity method (note a) - (13.1) - (22.3)
EBITDAX (RBL basis) 346.4 214.7 669.6 537.6
a) In 2Q 2020 and 2H 2020 EBITDAX as defined by the RBL and Shareholder agreements excluded our share of net income from Touat.
The Group’s total tax charge for the quarter is $140.2 million (2020: $35.1 million), comprising a current tax charge for the period of $27.4 million (2020: $198.6 million credit) and a deferred tax charge for the quarter of $112.8 million (2020: $233.7 million charge). The total tax charge for the period represents an effective tax rate of 86% (2020: (28%)). The effective tax rate for the period is predominately impacted by the relative mix of pre-tax losses and profits in jurisdictions which are subject to tax at different rates including the non-taxation of certain income and expenditure and the partial non-recognition of deferred tax assets on current year tax losses partially offset by prior year adjustments to current tax (including the release of an uncertain tax position and loss carry backs in the Netherlands). The tax charge for the half year is $259.7 million (2020: $106.5 million), comprising a current tax credit for the half year of $0.6 million (2020: $174.6 million) and a deferred tax charge of $259.1 million (2020: $281.1 million). This represents an effective tax

Neptune Energy Group Midco Limited
Unaudited Condensed Consolidated Financial Statements
For the period ended 30 June 2021
Neptune Energy Group Midco Limited Report for the period ended 30 June 2021
17
rate for the half year of 72% (2020: (1,638%)). The effective tax rate for the period is impacted by the following items: the partial non-recognition of deferred tax assets on current year tax losses (particularly the Netherlands) and decommissioning provisions, offset by prior year adjustments to current tax (including the release of an uncertain tax position and loss carry backs in the Netherlands) and the non-taxation of certain income, such as some foreign exchange gains and the release of contingent consideration. Net income for the quarter was $22.4 million (2020: $160.0 million loss) and for the half year was $100.3 million (2020: $113.0 million loss) on a reported basis. For the 6 months ended 30 June 2021 $4.5 million (2020: $2.1 million) of additional capital and operating expenditure was incurred in relation to COVID-19. The organisation has been monitoring and reporting significant COVID-19 expenditure since 1 April 2020 and will continue to do so in 2021. Hedging Group policy is to seek to reduce risk related to commodity price fluctuations by using hedging instruments to set a floor for the sales realisations for a proportion of forecast revenues on a rolling basis, with reducing levels of hedging for each of the next three years. The Group actively manages this hedging programme using, among others, swaps and options. As at 30 June 2021, the approximate share of post-tax production (which adjusts for different tax rates on physical sales and hedge gains and losses, meaning that effective post-tax hedges can be achieved through hedging contracts for volumes which may be significantly less than anticipated sales) hedged for future periods is shown in the table below. For gas, hedging provides weighted average floor prices of $6.1/mmbtu for 2021 and $6.0/mmbtu for 2022 and $5.5/mmbtu for 2023 with upside caps at $7.6/mmbtu and $6.7/mmbtu and $7.0/mmbtu respectively. For oil, weighted average downside protection is $45.82/barrel for 2021 and $44.14/barrel for 2022 and $41.78/barrel for 2023 with upside capped at around $57.22/barrel for 2021 and $82.73/barrel for 2022 and no caps for 2023.
Aggregate post-tax hedge ratio:
2021 2022 2023
Oil 44%
Gas 73% 64%
Total weighted average 60% 41% 1) Oil price hedges include hedges of realisations for gas production sold as LNG and priced in relation to oil prices. 2) Post-tax hedge ratios adjust for different tax rates on physical sales and hedge gains and losses, which means that effective post-tax hedges can be achieved through hedging contracts for volumes
which may be significantly less than anticipated sales. 3) Hedge percentages are based on total Group forecast production volumes including Algeria.
The estimated net fair value (comprised of current and non-current assets and liabilities) on a mark-to-market basis of all our commodity derivative instruments at 30 June 2021, was a liability of $375.7 million (31 December 2020: $6.8 million asset), of which contracts with a net liability of $216.0 million expire in 2021.
Cash flow Operating cash flow, after cash taxes, for the half year was $530.4 million (2020: $417.3 million). Cash taxes received were $125.8 million (2020: $123.6 million paid). The net cash tax refunds result predominately from our 2020 Norwegian investment programme and the new temporary Norwegian fiscal changes. Capital expenditure Cash capital expenditure for the half year, was $400.7 million (2020: $472.2 million), including $68.7 million (2020: $57.9 million) of capitalised exploration expenditure. The 2021 figure includes expenditure in Norway on Njord, Duva/Gjøa P1, Fenja and Gudrun projects, the Seagull project in the UK as well as expenditure in Indonesia on the Merakes development project. This excludes expenditure at Touat in Algeria, where the joint venture is accounted for under the equity method of accounting as a joint venture. Our statement of cash flows reflects net investment at Touat in terms of the cash injections and capital reductions made with the joint venture company, which were $15.8 million cash outflow in 2021 (2020: $29.8 million inflow).

Neptune Energy Group Midco Limited
Unaudited Condensed Consolidated Financial Statements
For the period ended 30 June 2021
Neptune Energy Group Midco Limited Report for the period ended 30 June 2021
18
US$ millions First half
2021 First half
2020
Investing cash flows:
Development capex (note a) 320.1 414.3
Acquisitions - development assets 2.9 -
Exploration capex 68.7 57.9
Acquisitions - exploration assets 9.0 -
Total cash capital expenditure 400.7 472.2 a) 2020 includes Saka carry reimbursement of $2.5 million b) Capex figures are for wholly-owned affiliates only
Total exploration expenditure of $87.3 million (2020; $94.4 million) comprised the $68.7 million (2020: $57.9 million) cash capex and $18.6 million (2020: $36.5 million) expensed in respect of G&G and seismic costs. Capex expenditure in 2021 has primarily been in Norway, Indonesia, Netherlands and Australia. Development cash capex was $320.1 million (2020: $414.3 million). The majority of expenditure was in Norway on the Njord, Duva/Gjøa P1, Fenja and Gudrun projects, the Seagull project in the UK as well as progressing the Merakes project in Indonesia. We incurred $14.3 million (2020: $21.8 million) on decommissioning cash expenditure in the half year, this was in the UK, the Netherlands and Germany.
Acquisitions On 19 February 2021 Neptune announced a sale and purchase agreement with Wintershall Dea for the acquisition of interests in six producing oil and gas fields in Germany. The effective date of this transaction from an economic perspective was 1 January 2020. The transaction adds 13 mmboe of 2P reserves and around 1.8 kboepd of production. On 4 May 2021, Neptune announced it had acquired a 38.75% equity interest from Spirit Energy in the Pegasus West discovery and surrounding acreage (P1724, P1727, P4257 and P2128) in the UK Southern North Sea. Financing and liquidity
Management’s financial strategy is to manage Neptune’s capital structure with the aim that, across the business cycle, net debt (excluding vendor loans) to EBITDAX, as defined by the RBL and shareholder agreement, remains modest. The ratio, at the end of the period, equals 1.95. RBL covenants require this ratio to remain below 3.5. We funded our business mainly with cash generated from operations and debt facilities. At 30 June 2021, we had the following debt outstanding:
• $1,245 million drawn under the $2.6 billion committed RBL facility, which matures in 2024;
• $850 million 6.625% senior notes, maturing in 2025;
• $100 million 7.250% Subordinated Neptune Energy Group Limited vendor loan with ENGIE E&P International S.A., maturing in 2024;
• $60 million drawn under bilateral short-term bilateral borrowing facilities.
At 30 June 2021, our cash balance totalled $62.3 million (31 December 2020: $92.5 million) and our available and undrawn headroom under the RBL facility was $1.0 billion. We also had $11 million of letters of credit drawn under an ancillary facility to the RBL and $165 million in surety bonds outstanding. Our weighted average cost of borrowing for the Group equalled 4.4%. Our Corporate Credit Rating with Moody’s, S&P and Fitch remain at Ba3, BB- and BB respectively. Moody’s upgraded their outlook to
Neptune Energy Group Midco Limited
Unaudited Condensed Consolidated Financial Statements
For the period ended 30 June 2021
Neptune Energy Group Midco Limited Report for the period ended 30 June 2021
19
positive in the quarter with S&P and Fitch maintaining the outlook as stable. We will continue to seek to strengthen these ratings over time. All debt, except for the debt drawn under the RBL facility, is carrying a fixed interest rate. As at 30 June 2021, 45% of the debt portfolio was fixed. Financial condition Operating cash flows for the half year were $530.4 million (2020: $417.3 million) with the increase primarily reflecting higher commodity prices partly offset by lower production. Investing cash flows were $416.1 million (2020: $435.3 million) for the half year being covered by operating cash flows. Financing cashflows were an outflow of $144.4 million (2020: $8.8 million inflow) during the period with the outflow primarily due to settlement of the $200 million 2019 dividend. Overall there was a net cash outflow of $30.1 million for the half year ended 30 June 2021 (2020: $9.2 million outflow). We ended the period with gross interest-bearing debt of $2,206.7 million (book value) and net debt on an RBL basis, (excluding Subordinated Neptune Energy Group Limited loan) of $2,044.4 million. This represents a net debt to EBITDAX ratio of 1.95x for the 12 months ended 30 June 2021 (2020: 1.31x). Risks and uncertainties Investment in Neptune involves risks and uncertainties, these are summarised in detail in the Neptune Energy Group Midco Limited 2020 Annual Report and Accounts. As an oil and gas, exploration and production company, exploration results, reserve and resource estimates, and estimates for capital and operating expenditures involve inherent uncertainties. A field’s production performance may be uncertain over time. The Group is exposed to various forms of financial risks, including, but not limited to, fluctuations in oil and gas prices, currency exchange rates, interest rates and capital requirements. The Group is also exposed to uncertainties relating to cyber threats, political risks, the international capital markets and access to capital and this may influence the speed with which growth can be accomplished. Dividend Given the improving commodity and economic outlook, the Board of Directors of Neptune Energy Group Midco Limited declared a 2021 Interim dividend of $80 million on 24 February 2021. This was enabled through the issue of an $80 million promissory note. This enabled the approval of a 2021 interim dividend settlement of $200 million by the Directors of its ultimate parent entity Neptune Energy Group Limited (NEGL) to its shareholders.

Neptune Energy Group Midco Limited Report for the period ended 30 June 2021
20
NEPTUNE ENERGY GROUP MIDCO LIMITED
UNAUDITED CONDENSED CONSOLIDATED FINANCIAL STATEMENTS
For the six months ended 30 June 2021

Neptune Energy Group Midco Limited
Consolidated Financial Statements
For the six months ended 30 June 2021
Neptune Energy Group Midco Limited Report for the period ended 30 June 2021
21
Unaudited condensed consolidated income statement Group In millions of US$ Notes
Second quarter 2021
Second quarter 2020
First half 2021
First half 2020
Revenue from contracts with customers 2 506.4 337.2 874.2 816.9
Other operating income 3 30.6 - 60.1 -
Revenue and other income 537.0 337.2 934.3 816.9
Cost of sales (317.5) (254.1) (497.7) (545.3)
GROSS PROFIT 219.5 83.1 436.6 271.6
Exploration expenses (16.5) (25.8) (24.1) (47.9)
General and administration expenses (19.4) (12.6) (37.8) (25.9)
Share of net income from investments using equity method 6.3 13.3 2.6 22.7
OPERATING PROFIT AFTER EQUITY ACCOUNTED INVESTMENTS 2 189.9 58.0 377.3 220.5
Net impairment gains/(losses) 82.4 (125.0) 82.4 (125.0)
Other operating losses 4 (41.5) (5.1) (57.6) (12.3)
OPERATING PROFIT/(LOSS) BEFORE FINANCIAL ITEMS 230.8 (72.1) 402.1 83.2
Finance income (23.0) (5.2) 48.2 7.1
Finance costs (45.2) (47.6) (90.3) (96.8)
PROFIT/(LOSS) BEFORE TAX 162.6 (124.9) 360.0 (6.5)
Taxation 6 (140.2) (35.1) (259.7) (106.5)
PROFIT/(LOSS), NET OF TAX 22.4 (160.0) 100.3 (113.0)
All profits and losses arise as a result of continuing operations. Unaudited condensed consolidated statement of other comprehensive income Group In millions of US$ Notes
Second quarter 2021
Second quarter 2020
First half 2021
First half 2020
Profit/(Loss) for the period 22.4 (160.0) 100.3 (113.0)
Other comprehensive Income:
Items that may be reclassified to the income statement:
Hedge adjustments net of tax (1),(2) 14 (261.8) (129.3) (323.4) 51.0
Share of hedge adjustments within equity accounted investments(3) 14
(4.2) - (9.2) -
Foreign currency translation 21.8 72.7 (29.2) (188.4)
(244.2) (56.6) (361.8) (137.4)
OTHER COMPREHENSIVE INCOME (244.2) (56.6) (361.8) (137.4)
OTHER COMPREHENSIVE LOSS FOR THE PERIOD, NET OF TAX (221.8) (216.6) (261.5) (250.4)
1) The loss of $261.8 million in the second quarter and the loss of $323.4 million in the first half of 2021 arises due to the higher closing oil price at 30 June 2021 compared to 31 March
2021 and 31 December 2020. 2) Income tax related to hedge adjustments is $43.3 million credit (2020: $33.8 million charge) for the second quarter and $72.4 million credit (2020: $25.5 million charge) for the half year
and is shown net of amounts reclassified to profit or loss or included in finance costs. 3) Income tax related to share of hedge adjustments within equity accounted investments is $1.4 million credit for the second quarter (2020: nil) and $3.1 million credit (2020: nil) for the
half year.

Neptune Energy Group Midco Limited
Consolidated Financial Statements
For the six months ended 30 June 2021
Neptune Energy Group Midco Limited Report for the period ended 30 June 2021
22
Unaudited condensed consolidated statement of financial position
Group In millions of US$ Notes
30 June 2021
31 December 2020
NON-CURRENT ASSETS
Goodwill 7 645.1 649.7
Intangible assets 8 270.2 194.9
Property, plant and equipment 9 4,870.2 4,566.2
Derivative instruments 14 27.4 19.6
Investments in entities accounted for using the equity method 566.3 557.6
Other non-current assets 14 73.1 99.5
Equity instruments 14 20.4 21.1
Deferred tax assets 6 579.0 577.3
TOTAL NON-CURRENT ASSETS 7,051.7 6,685.9
CURRENT ASSETS
Derivative instruments 14 14.8 55.1
Trade and other receivables 14 698.3 526.6
Inventories 91.0 79.0
Cash and cash equivalents 11 62.3 92.5
Income tax receivable 14 30.4 153.4
896.8 906.6
Assets held for sale 10 8.7 -
TOTAL CURRENT ASSETS 905.5 906.6
TOTAL ASSETS 7,957.2 7,592.5
Share capital 15 1,977.2 1,977.2
Hedging reserve 14 (355.2) (22.6)
Foreign currency translation 5.5 34.7
Retained deficit (486.4) (506.7)
TOTAL EQUITY 1,141.1 1,482.6
NON-CURRENT LIABILITIES
Provisions 13 1,963.6 1,870.9
Long-term borrowings 2,146.7 1,971.8
Derivative instruments 14 88.4 11.5
Income tax payable 14 77.2 71.5
Other non-current liabilities 12,14 109.3 131.3
Deferred tax liabilities 6 1,165.3 988.8
TOTAL NON-CURRENT LIABILITIES 5,550.5 5,045.8
CURRENT LIABILITIES
Provisions 13 114.9 114.9
Short-term borrowings 60.0 50.0
Derivative instruments 14 329.5 60.1
Trade and other payables 12,14 307.9 333.5
Income tax payable 14 25.8 28.6
Other current liabilities 12,14 427.5 477.0
TOTAL CURRENT LIABILITIES 1,265.6 1,064.1
TOTAL EQUITY AND LIABILITIES 7,957.2 7,592.5

Neptune Energy Group Midco Limited
Consolidated Financial Statements
For the six months ended 30 June 2021
Neptune Energy Group Midco Limited Report for the period ended 30 June 2021
23
Consolidated statement of changes in equity
Group In millions of US$
Share Capital Hedging
reserve (1)(3)
Foreign currency
translation (2)
Retained earnings
Total
As at 1 January 2021 1,977.2 (22.6) 34.7 (506.7) 1,482.6
Profit for the period - - - 100.3 100.3
Other comprehensive income - (332.6) (29.2) - (361.8)
Total comprehensive income - (332.6) (29.2) 100.3 (261.5)
Transactions with Owners of the Company:
Dividends paid (note 5) - - - (80.0) (80.0)
As at 30 June 2021 1,977.2 (355.2) 5.5 (486.4) 1,141.1
Group In millions of US$
Share Capital Hedging reserve
Foreign currency
translation
Retained earnings
Total
As at 1 January 2020 1,977.2 118.8 (107.0) (103.5) 1,885.5
Loss for the period - - - (113.0) (113.0)
Other comprehensive income - 51.0 (188.4) - (137.4)
Total comprehensive income - 51.0 (188.4) (113.0) (250.4)
As at 30 June 2020 1,977.2 169.8 (295.4) (216.5) 1,635.1
1) The hedging reserve represents gains and losses on derivatives classified as effective cash flow hedges stated net of tax. 2) The foreign currency translation reserve represents exchange gains and losses arising on translation of foreign currency subsidiaries. 3) Included in the hedging reserves other comprehensive loss in the period of $332.6 million is a loss of $9.2 million net of tax related to hedging undertaken by associated entities.

Neptune Energy Group Midco Limited
Consolidated Financial Statements
For the six months ended 30 June 2021
Neptune Energy Group Midco Limited Report for the period ended 30 June 2021
24
Unaudited condensed consolidated cash flow statement Group In millions of US$
First half 2021
First half 2020
Cash flows from operating activities
Profit/(Loss) before taxation 360.0 (6.5)
Adjustments to reconcile profit before tax to net cash flows:
Depreciation and amortisation 268.2 291.5
Unsuccessful exploration costs written off 5.5 11.5
Impairment (gains)/ losses (82.4) 125.0
Finance costs 90.3 96.8
Finance income (48.2) (7.1)
Share of net income from equity investments (2.6) (22.7)
Other non-cash income and expense 7.6 10.8
Fair value movement on commodity-based derivative instruments 58.2 (3.5)
Movement in provisions including decommissioning expenditure (58.5) (45.7)
Working capital adjustments (193.5) 90.8
Income tax received/(paid) (net) 125.8 (123.6)
Net cash flows from operating activities 530.4 417.3
Cash flows from investing activities
Expenditure on exploration and evaluation assets (77.7) (57.9)
Expenditure on property, plant and equipment (323.0) (414.3)
Proceeds from sale of assets 0.2 0.7
Dividends received 0.1 -
Finance income received 0.1 5.2
Net investment made in equity accounted investments (15.8) 31.0
Net cash flows used in investing activities (416.1) (435.3)
Cash flows from financing activities
Proceeds from loans and borrowings 926.5 829.5
Repayment of borrowings (749.4) (713.5)
Repayment of obligations under leases (52.8) (32.4)
Finance costs paid (68.7) (74.8)
Dividends paid (200.0) -
Net cash flows used in financing activities (144.4) 8.8
Net increase/(decrease) in cash and cash equivalents (30.1) (9.2)
Cash and cash equivalents at 1 January 92.5 85.4
Net foreign exchange differences (0.1) (0.8)
Cash and cash equivalents at 30 June 62.3 75.4

Neptune Energy Group Midco Limited
Consolidated Financial Statements
For the six months ended 30 June 2021
Neptune Energy Group Midco Limited Report for the period ended 30 June 2021
25
General information Neptune Energy Group Midco Limited is a limited company, incorporated and domiciled in the United Kingdom. The registered office is located at Nova North, 11 Bressenden Place, London SW1E 5BY. The consolidated financial statements of Neptune Energy Group Midco Limited and its subsidiaries (collectively, the Group) for the period ended 30 June 2021 were authorised for issue in accordance with a resolution of the Board on 10 August 2021. The Group is principally engaged in oil and gas exploration and production. 1. Basis of preparation The condensed consolidated financial statements for the six months ended 30 June 2021 have been prepared in accordance with UK adopted International Accounting Standard 34, “Interim Financial Reporting”. The condensed consolidated financial statements do not include all the information and disclosures required in the annual financial statements and should be read in conjunction with the Group’s consolidated financial statements as at 31 December 2020 which contains additional accounting policy disclosure. The preparation of financial statements in conformity with IAS 34 requires the use of certain critical accounting estimates. It also requires management to exercise its judgement in the process of applying the Group’s accounting policies. The areas involving a higher degree of judgement or complexity, or areas where assumptions and estimates are significant to the consolidated financial statements, are disclosed below in note 1.3. The accounting policies adopted in the preparation of the consolidated financial statements are consistent with those followed in the preparation of the Group’s annual consolidated financial statements for the period ending 31 December 2020 except where, due to the adoption of new standards effective as of 1 January 2021 (see note 1.1). The Group has not early-adopted any other standard, interpretation or amendment that has been issued but is not yet effective. Several amendments apply for the first time in 2021, but do not have an impact on the interim condensed consolidated financial statements of the Group. However it has been necessary to reclassify some intangibles and property, plant and equipment to non-current assets held for sale and therefore our policy in relation to this new class of assets is set out below. Non-current assets held for sale The Group classifies non-current assets and disposal groups as held for sale if their carrying amounts will be recovered principally through a sale transaction rather than through continuing use. Non-current assets and disposal groups classified as held for sale are measured at the lower of their carrying amount and fair value less costs to sell. Costs to sell are the incremental costs directly attributable to the disposal of an asset (disposal group), excluding finance costs and income tax expense. The criteria for held for sale classification is regarded as met only when the sale is highly probable, and the asset or disposal group is available for immediate sale in its present condition. Actions required to complete the sale should indicate that it is unlikely that significant changes to the sale will be made or that the decision to sell will be withdrawn. Management must be committed to the plan to sell the asset and the sale expected to be completed within one year from the date of the classification. Property, plant and equipment and intangible assets are not depreciated or amortised once classified as held for sale. Assets and liabilities classified as held for sale are presented separately as current items in the statement of financial position. Going concern Given the total available liquidity as at 30 June 2021 of $1.1 billion, comprising our cash balance ($62.3 million) and available and undrawn headroom under the RBL facility ($1.0 billion), and capital resources arrangements in place (see note 19 of the Neptune Energy Group 2020 Annual Report), the consolidated accounts have been prepared on a going concern basis. The going concern basis is supported by future cash flow forecasts which project the Group’s available liquidity and compliance with covenants through to 31 December 2022. The cash flow forecasts reflect forecast production consistent with our Board approved plans and externally published guidance and base case commodity prices that are slightly below current market conditions While the short-term outlook is uncertain due to COVID-19, energy markets have stabilised and commodity prices have recovered from the lows of 2020. We believe the longer-term outlook is positive for the oil and gas sector and we are well positioned to benefit from the transition to a lower-carbon energy market. Our low-cost projects, long-life production, strong balance sheet and hedging provides resilience for the Group against softer commodity prices.

Neptune Energy Group Midco Limited
Consolidated Financial Statements
For the six months ended 30 June 2021
Neptune Energy Group Midco Limited Report for the period ended 30 June 2021
26
In reaching the conclusion that the going concern basis is appropriate, we have stress tested future cash flow forecasts and covenant compliance for the Group to evaluate the impact of plausible downside scenarios. These include scenarios that reflect short-term commodity price forecasts significantly below current market conditions as well as scenarios that consider the impact of unforeseen production outages. We have also performed a reverse stress test to inform our judgement, which demonstrated that we are resilient to sustained low commodity prices at more than 50% below our conservative base case cash flow forecast. Under all plausible scenarios, it was concluded that the Group retains sufficient liquidity and headroom over its covenant ratio, and that the going concern basis remains appropriate. The likelihood of the commodity prices identified in the reverse stress test materialising is considered remote on the basis of market consensus for short-term commodity prices and relative to historic market lows. 1.1 New standards, interpretations and amendments adopted by the Group
New standards, interpretations and amendments are considered in note 1 of the Neptune Energy Group 2020 Annual Report and Account or set out below. Interest Rate Benchmark Reform – Phase 2: Amendments to IFRS 9, IAS 39, IFRS 7, IFRS 4 and IFRS 16 The amendments provide temporary reliefs which address the financial reporting effects when an interbank offered rate (IBOR) is replaced with an alternative nearly risk-free interest rate (RFR). The amendments include a number of practical expedients. These amendments had no impact on the interim condensed consolidated financial statements of the Group. The Group intends to use the practical expedients in future periods if they become applicable. There have been no further changes since the start of the year. 1.2 Measurement and presentation basis
The condensed consolidated financial statements have been prepared using the historical cost convention, except for financial instruments, debt and equity financial assets and contingent consideration that are measured at fair value. The carrying values of recognised assets and liabilities that are designated as hedged items in fair value hedges that would otherwise be carried at amortised costs are adjusted to recognise changes in the fair value attributable to the risks that are being hedged in effective hedge relationships The consolidated financial statements are presented in US dollars and rounded to millions, except when otherwise indicated. 1.3 Significant judgements and estimates
Estimates and judgements are continually evaluated and are based on historical experiences and other factors, including expectations of future events that are believed to be reasonable under the circumstances. Significant judgements and estimates are summarised in detail in the Neptune Energy 2020 Annual Report and Accounts in note 1.
2. Segmental information 2.1 Revenue from Contracts with customers and Net operating profit after equity accounted investments Neptune Energy’s reportable segment is that used by the Group’s Board and management to run the business. The Board is responsible for allocating resources and assessing performance of the segment. The Group’s activities consist of a single class of business (upstream), representing the acquisition, exploration, development and production of the Group’s own oil and gas reserves and resources and is focused on two geographical regions comprising seven areas: UK, Norway, Netherlands, Germany, North Africa, Asia Pacific and Corporate.

Neptune Energy Group Midco Limited
Consolidated Financial Statements
For the six months ended 30 June 2021
Neptune Energy Group Midco Limited Report for the period ended 30 June 2021
27
Second quarter 2021
Group In millions of US$
UK Norway Netherlands Germany North Africa
Asia Pacific
Corporate 2021 Total
Production revenue by origin 41.0 210.9 86.5 61.7 6.6 85.9 - 492.6
Other revenue 2.8 1.0 6.2 0.5 - - 3.3 13.8
Revenue from contracts with customers 43.8 211.9 92.7 62.2 6.6 85.9 3.3 506.4
Other operating income - 30.6 - - - - - 30.6
Revenue and other income 43.8 242.5 92.7 62.2 6.6 85.9 3.3 537.0
Current Operating Income 11.5 130.3 27.2 8.3 (0.4) 10.6 (3.9) 183.6
Share of net income from investments using equity method
- - 0.4 - 5.9 - - 6.3
Net Operating Profit After Equity Accounted Investments
11.5 130.3 27.6 8.3 5.5 10.6 (3.9) 189.9
Net impairment gain 82.4
Mark-to-market on commodity contracts other than trading instruments
(41.0)
Restructuring release 1.1
Other losses (1.6)
Profit before financial items 230.8
Financial income (23.0)
Finance costs (45.2)
Profit before tax 162.6
Second quarter 2020
Group In millions of US$
UK Norway Netherlands Germany North Africa
Asia Pacific
Corporate 2020 Total
Production revenue by origin 53.7 119.4 54.0 30.1 7.6 55.2 - 320.0
Other revenue 1.4 9.9 5.5 0.4 - - - 17.2
Revenue from contracts with customers 55.1 129.3 59.5 30.5 7.6 55.2 - 337.2
Other operating income - - - - - - - -
Revenue and other income 55.1 129.3 59.5 30.5 7.6 55.2 - 337.2
Current Operating Income 17.2 59.6 1.7 (10.8) (18.5) 1.5 (6.0) 44.7
Share of net income from investments using equity method
- - 0.2 - 13.1 - - 13.3
Net Operating Profit After Equity Accounted Investments
17.2 59.6 1.9 (10.8) (5.4) 1.5 (6.0) 58.0
Net impairment loss (125.0)
Mark-to-market on commodity contracts other than trading instruments
14.5
Group reorganisation costs (34.0)
Other gains 14.4
Loss Before Financial Items (72.1)
Financial income (5.2)
Finance costs (47.6)
Loss Before Tax (124.9)

Neptune Energy Group Midco Limited
Consolidated Financial Statements
For the six months ended 30 June 2021
Neptune Energy Group Midco Limited Report for the period ended 30 June 2021
28
First half 2021
Group In millions of US$
UK Norway Netherlands Germany North Africa
Asia Pacific
Corporate 2021 Total
Production revenue by origin 94.1 351.6 158.6 111.3 12.8 119.2 - 847.6
Other revenue 4.0 1.5 14.2 1.4 - - 5.5 26.6
Revenue from contracts with customers 98.1 353.1 172.8 112.7 12.8 119.2 5.5 874.2
Other operating income - 60.1 - - - - - 60.1
Revenue and other income 98.1 413.2 172.8 112.7 12.8 119.2 5.5 934.3
Current Operating Income 25.4 276.9 54.9 16.4 (0.4) 9.5 (8.0) 374.7
Share of net income from investments using equity method
- - 0.8 - 1.8 - - 2.6
Net Operating Profit After Equity Accounted Investments
25.4 276.9 55.7 16.4 1.4 9.5 (8.0) 377.3
Net impairment gain 82.4
Mark-to-market on commodity contracts other than trading instruments
(58.2)
Restructuring release 0.5
Other losses 0.1
Profit Before Financial Items 402.1
Financial income 48.2
Finance costs (90.3)
Profit Before Tax 360.0
First half 2020
Group In millions of US$
UK Norway Netherlands Germany
North Africa
Asia Pacific
Corporate 2020 Total
Production revenue by origin 107.4 336.6 110.1 72.7 18.9 144.5 - 790.2
Other revenue 2.9 10.3 11.3 2.2 - - - 26.7
Revenue from contracts with customers
110.3 346.9 121.4 74.9 18.9 144.5
- 816.9
Other operating income - - - - - - - -
Revenue and other income 110.3 346.9 121.4 74.9 18.9 144.5 - 816.9
Current Operating Income 32.2 148.7 19.5 (15.1) (16.8) 35.9 (6.6) 197.8
Share of net income from investments using equity method
- - 0.4 - 22.3 - - 22.7
Net Operating Profit After Equity Accounted Investments
32.2 148.7 19.9 (15.1) 5.5 35.9 (6.6) 220.5
Net impairment loss (125.0)
Mark-to-market on commodity contracts other than trading instruments
3.5
Group reorganisation costs (33.7)
Other losses 17.9
Profit Before Financial Items 83.2
Financial income 7.1
Finance costs (96.8)
Loss Before Tax (6.5)

Neptune Energy Group Midco Limited
Consolidated Financial Statements
For the six months ended 30 June 2021
Neptune Energy Group Midco Limited Report for the period ended 30 June 2021
29
2.2 EBITDAX by country EBITDAX as a Non-GAAP measure is the group performance metric used to measure our ability to produce income from our operations in any given period. This measure is reconciled to its statutory equivalent.
Second quarter 2021
In millions of US$ UK Norway Netherlands Germany North Africa
Asia Pacific
Corporate Total
EBITDAX (including equity accounted affiliates)
28.0 170.5 53.1 38.7 9.9 49.9 (3.7) 346.4
Second quarter 2020
Group In millions of US$
UK Norway Netherlands Germany North Africa
Asia Pacific
Corporate Total
EBITDAX (including equity accounted affiliates)
43.3 97.6 23.8 6.8 16.2 45.1 (5.1) 227.7
First half 2021
In millions of US$ UK Norway Netherlands Germany North Africa
Asia Pacific
Corporate Total
EBITDAX (including equity accounted affiliates)
60.7 358.3 106.6 64.5 10.0 76.9 (7.4) 669.6
First half 2020
Group In millions of US$
UK Norway Netherlands Germany North Africa
Asia Pacific
Corporate Total
EBITDAX (including equity accounted affiliates)
82.2 241.7 60.0 20.1 31.0 129.8 (5.0) 559.8
2.3 Net assets
30 June 2021
In millions of US$ UK Norway Netherlands Germany North Africa
Asia Pacific
Corporate Total
Balance sheet
Assets 1,324.2 3,398.8 696.8 597.5 627.9 1,260.8 51.2 7,957.2
Liabilities (517.9) (2,120.4) (847.8) (711.1) (18.7) (227.1) (2,373.1) (6,816.1)
Net assets 806.3 1,278.4 (151.0) (113.6) 609.2 1,033.7 (2,321.9) 1,141.1
31 December 2020
In millions of US$ UK Norway Netherlands Germany North Africa
Asia Pacific
Corporate Total
Balance sheet
Assets 1,329.8 3,205.2 636.4 576.0 628.6 1,131.8 84.7 7,592.5
Liabilities (357.2) (1,876.0) (672.9) (704.9) (17.2) (153.8) (2,327.9) (6,109.9)
Net assets 972.6 1,329.2 (36.5) (128.9) 611.4 978.0 (2,243.2) 1,482.6
Corporate net liabilities includes amounts of a corporate nature and not specifically attributable to a reportable segment. The liabilities comprise the Group’s external debt and other non-attributable corporate liabilities.

Neptune Energy Group Midco Limited
Consolidated Financial Statements
For the six months ended 30 June 2021
Neptune Energy Group Midco Limited Report for the period ended 30 June 2021
30
2.4 Underlying operating profit For the Group’s single class of business (upstream), the underlying operating profit taking into consideration certain one off items is as below:
US$ millions Second quarter
2021 Second quarter
2020 First half
2021 First half
2020
Operating profit/(loss) before financial items and tax 230.8 (72.1) 402.1 83.2
Add back:
Impairment (gains)/losses (82.4) 125.0 (82.4) 125.0
Net restructuring cost (1.1) 34.0 (0.5) 33.7
Underlying operating profit before financial items and tax 147.3 86.9 319.2 241.9
3. Other operating income
Group In millions of US$
Second quarter 2021
Second quarter 2020
First half 2021
First half 2020
Loss of production insurance 30.6 - 60.1 -
Total 30.6 - 60.1 -
On 26 October 2020, Equinor, the operator of the Hammerfest LNG plant in Norway announced to its joint venture partners that the LNG plant will be closed for up to 12 months for repairs following an incident. The plant processes production from the Snøhvit, Albatross and Askeladd fields. The operator has subsequently advised that the estimated date to restart production is 31 March 2022. Neptune’s loss of revenue is partially being recovered through business interruption insurance, after an initial period of 60 days.
4. Other operating losses/(gains)
Other operating losses/(gains) are those that need to be disclosed separately by virtue of their nature, size or incidence. These include certain remeasurements, business restructuring costs, business combination activity, pension change costs or credits and asset impairments/ write backs.
Group In millions of US$
Second quarter 2021
Second quarter 2020
First half 2021
First half 2020
Mark-to-market on commodity contracts other than trading instruments:
41.0 (14.5) 58.2 (3.5)
Net restructuring provision (release)/ cost (1) (1.1) 34.0 (0.5) 33.7
Release of contingent consideration - - (2.5) -
Other losses/(gains) 1.6 (14.4) 2.4 (17.9)
Total other operating losses/(gains) 41.5 5.1 57.6 12.3
1) 2020 includes new provisions in respect of announcements made in June 2020 in relation to a group wide reorganisation-including closure of Germany and Norway offices
The gain on release of contingent consideration payable has arisen as management no longer expect certain project milestones, related to an asset in Denmark that was part of the VNG acquisition, will now be achieved.

Neptune Energy Group Midco Limited
Consolidated Financial Statements
For the six months ended 30 June 2021
Neptune Energy Group Midco Limited Report for the period ended 30 June 2021
31
5. Dividend
Group In millions of US$
Second quarter 2021
Second quarter 2020
First half 2021
First half 2020
Aggregate amount of dividends declared in the period - - 80.0 -
Aggregate amount of dividends liable to pay at the balance sheet date - - 80.0 -
In the first quarter of 2021 given the improving commodity and economic outlook, the Board of Directors of Neptune Energy Group Midco Limited declared a 2021 Interim dividend of $80 million on 24 February 2021. This was enabled through the issue of an $80 million promissory note. The promissory note is payable on demand but bears no interest. The $200 million promissory note issued in respect of the final 2019 dividend announced on 11 December 2019 was settled on 25 February 2021. This enabled the approval of a 2021 interim dividend settlement of $200 million by the Directors of its ultimate parent entity Neptune Energy Group Limited (NEGL) to its shareholders. 6. Taxation
The Group calculates the period income tax expense using the tax rate that would be applicable to the expected total annual earnings.
The major components of income tax expense in the condensed consolidated income statement are:
Group In millions of US$
First half
2021 First half
2020
Current taxation:
(Credit)/charge for the year 6.1 (137.9)
Adjustment in respect of prior years (5.5) (36.7)
0.6 (174.6)
Deferred taxation:
Origination and reversal of temporary differences in the current year 259.1 281.1
Total income tax expense recognised in income statement 259.7 106.5
The effective tax rate for the Group for the half year was 72% (2020: (1,638%)). The Group’s actual tax charge for the period, of $259.7 million, is in line with the Group’s expected tax charge of $240.7 million, which would equate to an expected effective tax rate of 67%. The Group operates in a number of jurisdictions. Across these jurisdictions, there is a broad variation in statutory tax rates. The Group’s expected tax charge reflects the applicable rates for the countries in which the group earned profits. The Group’s expected tax charge is based on the applicable statutory tax rates for the countries in which the group earned profits and is impacted by, amongst other things, the geographical mix of accounting profits and changes in local tax rates. The main reason for the slightly higher actual tax charge is due to the partial non-recognition of deferred tax assets on current year tax losses (particularly in the Netherlands) and decommissioning provisions, offset by prior year adjustments to current tax (including the release of an uncertain tax position and loss carry backs in the Netherlands) and the non-taxation of certain income, such as some foreign exchange gains and release of contingent consideration

Neptune Energy Group Midco Limited
Consolidated Financial Statements
For the six months ended 30 June 2021
Neptune Energy Group Midco Limited Report for the period ended 30 June 2021
32
6.1 Changes in deferred taxes The net movement in deferred tax assets and (liabilities) is shown below: Group In millions of US$
PP&E Retirement obligations
Pensions Tax losses Other Total
At 1 January 2021 (1,580.1) 432.3 49.4 787.2 (100.3) (411.5)
Reclassification (0.9) 0.9 - - - -
Credit/(charge) for the year (224.6) 14.1 0.7 6.6 (55.9) (259.1)
Charge to equity and other comprehensive income - - - - 72.4 72.4
Currency translation adjustments 4.5 (1.3) (1.0) 8.5 1.2 11.9
At 30 June 2021 (1,801.1) 446.0 49.1 802.3 (82.6) (586.3)
Deferred tax asset 579.0
Deferred tax liabilities (1,165.3)
Deferred tax liabilities net (586.3)
The Group’s net deferred tax liability has increased by $174.8 million since 31 December 2020. The main reasons for the higher deferred tax liability is due to increased capital expenditure and accelerated tax depreciation, particularly as a result of the temporary Norwegian fiscal changes which allow full expensing of investment at the special tax rate of 56%. Other significant impacts on the deferred tax position relate to current period movements in under lift positions (Norway and Indonesia) and movements in our commodity hedges. 7. Goodwill
Group In millions of US$
30 June 2021
Cost at 1 January 2021 664.5
Currency translation adjustments (4.7)
Cost at 30 June 2021 659.8
Impairment losses at 1 January 2021 (14.8)
Currency translation adjustments 0.1
Impairment losses at 30 June 2021 (14.7)
Net book value at 30 June 2021 645.1
Net book value at 31 December 2020 649.7
The goodwill arose on the acquisition in 2018 of ENGIE E&P International S.A. (EPI) (now renamed Neptune Energy International S.A.), an unlisted company based in France which was the holding company of a group involved internationally in oil and gas exploration and production. Further goodwill arose on the acquisition in 2018 of VNG Norge AS (an unlisted company based in Norway) from its parent VNG AG (a German natural gas and energy service provider). The goodwill assigned to Norway is $560.0 million. The remaining goodwill is assigned to the Netherlands and Germany group of CGUs. The carrying amount of the goodwill allocated to these cash-generating units is not significant in comparison with the Group’s total goodwill. The goodwill from these business combinations is reviewed for impairment prospectively at each reporting date, or earlier if there are indications of impairment. For the purpose of impairment testing, goodwill is allocated to groups of Cash Generating Units (CGUs); these represent the lowest level at which goodwill is monitored. The recoverable amounts are determined based on the fair value less cost of disposal method. Further information on the review for impairment is available in the Neptune Energy Group 2020 Annual Report and Accounts in note 12.
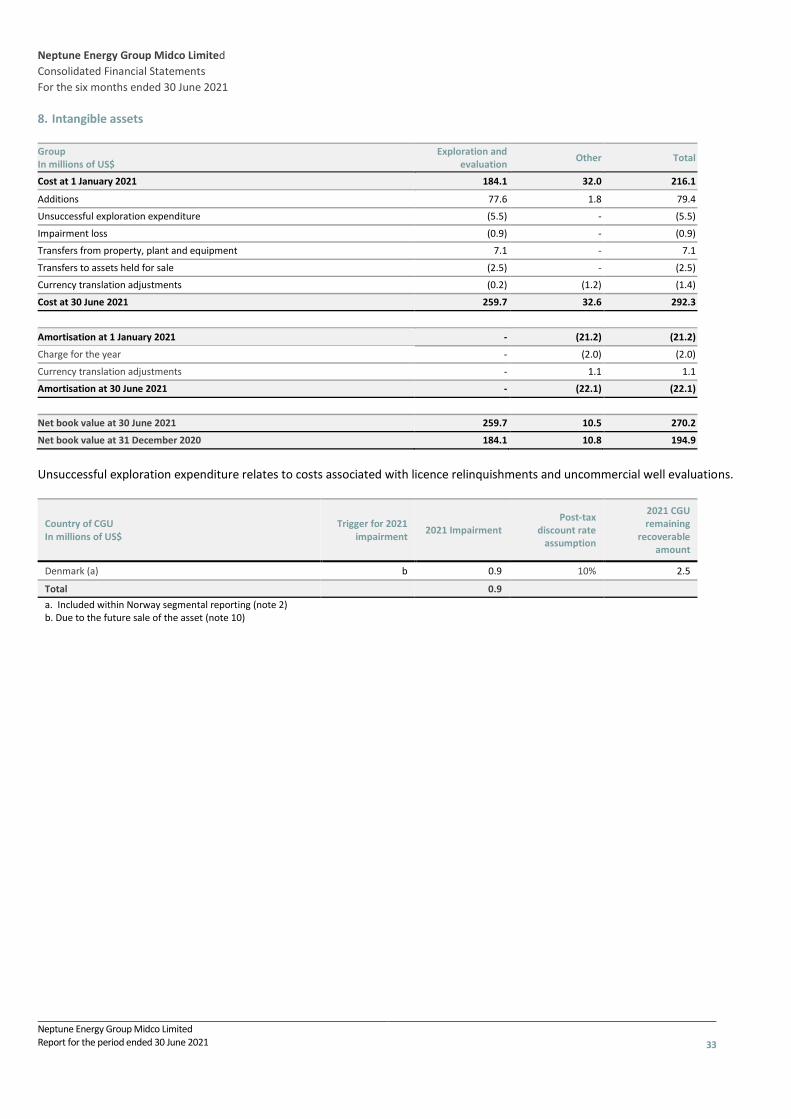
Neptune Energy Group Midco Limited
Consolidated Financial Statements
For the six months ended 30 June 2021
Neptune Energy Group Midco Limited Report for the period ended 30 June 2021
33
8. Intangible assets Group In millions of US$
Exploration and evaluation
Other Total
Cost at 1 January 2021 184.1 32.0 216.1
Additions 77.6 1.8 79.4
Unsuccessful exploration expenditure (5.5) - (5.5)
Impairment loss (0.9) - (0.9)
Transfers from property, plant and equipment 7.1 - 7.1
Transfers to assets held for sale (2.5) - (2.5)
Currency translation adjustments (0.2) (1.2) (1.4)
Cost at 30 June 2021 259.7 32.6 292.3
Amortisation at 1 January 2021 - (21.2) (21.2)
Charge for the year - (2.0) (2.0)
Currency translation adjustments - 1.1 1.1
Amortisation at 30 June 2021 - (22.1) (22.1)
Net book value at 30 June 2021 259.7 10.5 270.2
Net book value at 31 December 2020 184.1 10.8 194.9
Unsuccessful exploration expenditure relates to costs associated with licence relinquishments and uncommercial well evaluations.
Country of CGU In millions of US$
Trigger for 2021 impairment
2021 Impairment
Post-tax discount rate
assumption
2021 CGU remaining
recoverable amount
Denmark (a) b 0.9 10% 2.5
Total 0.9
a. Included within Norway segmental reporting (note 2) b. Due to the future sale of the asset (note 10)

Neptune Energy Group Midco Limited
Consolidated Financial Statements
For the six months ended 30 June 2021
Neptune Energy Group Midco Limited Report for the period ended 30 June 2021
34
9. Property, plant and equipment Group In millions of US$
Oil and gas properties
Other fixed assets Total
Cost at 1 January 2021 6,721.8 94.6 6,816.4
Additions 532.7 10.9 543.6
Asset derecognition - (3.0) (3.0)
Disposals - (1.2) (1.2)
Transfers to intangibles (7.1) - (7.1)
Transfers (4.1) 4.1 -
Transfers to assets held for sale - (20.9) (20.9)
Currency translation adjustments (56.5) (1.4) (57.9)
Cost at 30 June 2021 7,186.8 83.1 7,269.9
Accumulated depreciation at 1 January 2021 (2,223.9) (26.3) (2,250.2)
Charge for the period (1) (276.2) (5.7) (281.9)
Impairment loss (13.2) - (13.2)
Reversal of impairment loss 96.5 - 96.5
Asset derecognition - 3.0 3.0
Transfer to assets held for sale - 14.7 14.7
Disposals - 1.2 1.2
Currency translation adjustments 30.2 - 30.2
Accumulated depreciation at 30 June 2021 (2,386.6) (13.1) (2,399.7)
Net book value at 30 June 2021 4,800.2 70.0 4,870.2
Net book value at 31 December 2020 4,497.9 68.3 4,566.2
1) Includes capitalised depreciation of $15.7 million (2020: $7.4 million) related to right-of-use assets in Norway and the UK.
Country of CGU In millions of US$
Trigger for 2021 impairment
2021 Impairment Post-tax
discount rate
2021 CGU recoverable
amount
Netherlands (1) a (96.5) 10% 120.4
Netherlands (2) b 13.2 10% -
Total (83.3)
a. Increase due to upward reserves revision b. Decrease due to underlying reservoir performance
Incremental price and discount rate sensitivity impairment analysis on CGU recoverable amount (post-tax):
Country of CGU In millions of US$
2021 CGU recoverable
amount Oil and Gas price Post-tax discount rate
Plus 10% Minus 10% Plus 1% Minus 1%
Netherlands (1) 120.4 18.6 (24.2) (1.0) 1.1 For the Netherlands (1) CGU, sensitivity analyses indicate that if reserves were to fall by 10%, the post-tax impairment reversal recognised would have been $24.2m lower. An increase of reserves by 10% would have increased the recoverable amount by $18.6m, but would not have resulted in an additional post-tax impairment reversal.

Neptune Energy Group Midco Limited
Consolidated Financial Statements
For the six months ended 30 June 2021
Neptune Energy Group Midco Limited Report for the period ended 30 June 2021
35
10. Assets held for sale
Group In millions of US$
30 June 2021 31 December 2020
Property, plant and equipment 6.2 -
Intangibles 2.5 -
Total assets held for sale 8.7 -
On 26 May 2021 the Group signed sales and purchase agreements for the disposal of two properties in Germany with a current book value of $6.2 million. Completion of the transactions are expected before the end of the year. On 3 June 2021 the Group signed a sales and purchase agreement for the sale of 100% of the shares in Neptune Energy Denmark Ap, which includes the Solsort exploration licence with a current book value of $2.5 million. Completion of the transaction is expected before the end of 2021. 11. Cash and cash equivalents
Group In millions of US$
30 June 2021 31 December 2020
Cash at bank and in hand 46.8 79.7
Restricted cash 15.5 12.8
Total cash and cash equivalents 62.3 92.5
Cash and cash equivalents comprise cash in hand, deposits with maturity of three months or less and other short-term money market deposit accounts that are readily convertible into known amounts of cash. Restricted cash includes monies held for decommissioning obligations. 12. Trade payables and other liabilities
Group In millions of US$
30 June 2021 31 December 2020
Trade and other payables 307.9 333.5
Other current liabilities 294.2 327.6
Lease liabilities 93.7 98.5
Wages and social security 39.6 50.9
Current trade payables and accruals 735.4 810.5
Other non-current liabilities 45.0 41.7
Lease liabilities 64.3 89.6
Non-current trade payables and accruals 109.3 131.3
Total 844.7 941.8
Trade payables are usually paid within 30 days of recognition. The carrying amount of financial liabilities approximates their fair value and they are all due within one year. Included within other current liabilities on 30 June 2021 is $80 million in respect of a promissory note issued on 24 February to the immediate and ultimate parent undertaking in respect of the 2021 interim dividend declared on 24 February (31 December 2020 is $200.0 million in respect of a promissory note issued on 11 December 2019 to the immediate and ultimate parent undertaking in respect of the 2019 interim dividend declared. The $200 million promissory note was settled on 25 February 2021). The remainder of the balance is principally related to joint venture funding.

Neptune Energy Group Midco Limited
Consolidated Financial Statements
For the six months ended 30 June 2021
Neptune Energy Group Midco Limited Report for the period ended 30 June 2021
36
13. Provisions
Group In millions of US$
30 June 2021 31 December 2020
Current
Restructuring 25.7 52.7
Post-employment benefit and other long-term benefits 11.5 11.3
Decommissioning 74.1 46.0
Other 3.6 4.9
Current total 114.9 114.9
Non-Current
Restructuring 9.7 21.4
Post-employment benefit and other long-term benefits 204.5 211.7
Decommissioning 1,741.8 1,637.8
Other 7.6 -
Non-current total 1,963.6 1,870.9
Total 2,078.5 1,985.8
The Group makes full provision for the future cost of decommissioning oil production facilities and pipelines on a discounted basis on the installation of those facilities. The decommissioning provision represents the present value of decommissioning costs relating to oil and gas properties, which are expected to be incurred up to the end of the operations. These provisions have been created based on the Group internal estimates. Further information on decommissioning provisions is available in the Neptune Energy Group 2020 Annual Report and Accounts in note 22. The discount rate used for discounting decommissioning liabilities at June 2021 is based on the future timing of decommissioning, the expected currency of the expenditure and was in the range 0.7% to 3.2% (2020 year end range 1.1% to 3.5%). The restructuring provision is in relation to the decision in 2019 to close the corporate office in France and also the announcement in June 2020 to reduce 400 positions across our business including proposals to close offices in Oslo in Norway and Lingen in Germany. 14. Financial assets and liabilities Set out below is an overview of financial assets and liabilities, other than cash and short-term deposits, held by the Group as at 30 June 2021 and 31 December 2020, including their maturity.
Group In millions of US$
30 June 2021 31 December 2020
Financial assets at fair values
Commodity derivatives at fair value through profit and loss 10.9 3.0
Commodity derivatives in qualifying hedging relationships 31.3 71.7
Equity instruments designated at fair value through OCI
10.59% interest in Erdgas-Verkaufs-Gesellschaft mbH, Münster 20.4 21.1
Financial assets at Amortised Cost
Trade and other receivables 698.3 526.6
Income tax receivable 30.4 153.4
Other non-current assets 73.1 99.5
Total 864.4 875.3
Total current 743.5 735.1
Total Non-current 120.9 140.2

Neptune Energy Group Midco Limited
Consolidated Financial Statements
For the six months ended 30 June 2021
Neptune Energy Group Midco Limited Report for the period ended 30 June 2021
37
Fair value is the amount at which a financial instrument could be exchanged in an arm's length transaction, other than in a forced or liquidated sale. Where available, market values have been used to determine fair values. The estimated fair values have been determined using market information and appropriate valuation methodologies. Values recorded are as at the balance sheet date and will not necessarily be realised. Non-interest bearing financial instruments, which include amounts receivable from customers and accounts payable are also recorded materially at fair value reflecting their short-term maturity. The Fair values of all derivative financial instruments are based on estimates from observable inputs and are all level 2 in the IFRS 13 hierarchy. The valuation of Neptune’s interest in Erdgas Münster, has been calculated based on an enterprise value/EBITDA multiple taking into account recent transactions involving suitable comparative infrastructure companies, which are based on unobservable inputs and are level 3 in the IFRS 13 hierarchy.
Group In millions of US$
30 June 2021 31 December 2020
Financial liabilities at Fair Value
Commodity derivatives at fair value through profit and loss 16.6 2.4
Commodity derivatives in qualifying hedging relationships 401.3 65.5
Interest rate derivatives in qualifying hedging relationships - 3.7
Contingent consideration 5.3 2.6
Financial liabilities at amortised cost
Reserve base lending facility 1,209.7 1,028.6
Senior Notes 837.0 835.3
DNB uncommitted facility 50.0 50.0
Citi Bank uncommitted facility 10.0 -
Subordinated Neptune Energy Group Limited loan 100.0 107.9
Trade and other payables 307.9 333.5
Wages and social security 39.6 50.9
Lease liabilities 158.0 188.1
Income taxes payable 103.0 100.1
Other liabilities 333.9 366.7
Total 3,572.3 3,135.3
Total current 1,150.7 949.2
Total Non-current 2,421.6 2,186.1
Set out above is an overview of financial liabilities, other than cash and short-term deposits, held by the Group as at 30 June 2021. The Senior Notes have a fair value of $875.1 million, compared to the carrying amount of $837.0 million (31 December 2020: a fair value of $825.3 million, compared with the carrying amount of $835.3 million) reflecting the current volatility in the market environment. This financial liability is classed as Level 1. For all other items held at amortised cost there is no significant difference between their fair value and amortised cost value. The valuation of contingent consideration in 2021 relates to the Company’s acquisition of assets acquired in Germany from Wintershall Dea (2020 related to the Company’s acquisition of VNG) and is based on management’s view of the most likely future liability that will be settled which are based on unobservable inputs and are level 3 in the IFRS 13 hierarchy.
14.1 Financial assets and financial liabilities – hierarchy
Set out below is an overview of the hierarchy of financial assets and financial liabilities, other than cash and short- term deposits, held by the Group as at 30 June 2021 and 31 December 2020. For items held at amortised cost, there is no significant difference between their fair value and amortised cost value.

Neptune Energy Group Midco Limited
Consolidated Financial Statements
For the six months ended 30 June 2021
Neptune Energy Group Midco Limited Report for the period ended 30 June 2021
38
There have been no transfers between fair value levels during the period for either assets or liabilities.
30 June 2021
Group In millions of US$
Date of valuation
Total
Significant observable
inputs (Level 2)
Significant unobservable
inputs (Level 3)
Assets measured at fair value
Derivative financial assets
Commodity derivatives in qualifying hedging relationships 30-Jun-21 31.3 31.3 -
Commodity derivatives at fair value through profit and loss 30-Jun-21 10.9 10.9 -
Non-listed equity instruments
10.59% interest in Erdgas-Verkaufs-Gesellschaft mbH, Münster 30-Jun-21 20.4 - 20.4
Total 62.6 42.2 20.4
31 December 2020
Group In millions of US$
Date of valuation
Total
Significant observable
inputs (Level 2)
Significant unobservable
inputs (Level 3)
Assets measured at fair value
Derivative financial assets
Commodity derivatives in qualifying hedging relationships 31-Dec-20 71.7 71.7 -
Commodity derivatives at fair value through profit and loss 31-Dec-20 3.0 3.0 -
Non-listed equity instruments
10.59% interest in Erdgas-Verkaufs-Gesellschaft mbH, Münster 31-Dec-20 21.1 - 21.1
Total 95.8 74.7 21.1
30 June 2021
Group In millions of US$
Date of valuation
Total
Significant observable
inputs (Level 2)
Significant unobservable
inputs (Level 3)
Liabilities measured at fair value
Derivative financial liabilities
Commodity derivatives in qualifying hedging relationships 30-Jun-21 401.3 401.3 -
Commodity derivatives at fair value through profit and loss 30-Jun-21 16.6 16.6 -
Interest rate derivatives in qualifying hedging relationships 30-Jun-21 - - -
Contingent consideration 30-Jun-21 5.3 - 5.3
Total 423.2 417.9 5.3
31 December 2020
Group In millions of US$
Date of valuation
Total
Significant observable
inputs (Level 2)
Significant unobservable
inputs (Level 3)
Liabilities measured at fair value
Derivative financial liabilities
Commodity derivatives in qualifying hedging relationships 31-Dec-20 65.5 65.5 -
Commodity derivatives at fair value through profit and loss 31-Dec-20 2.4 2.4 -
Interest rate derivatives in qualifying hedging relationships 31-Dec-20 3.7 3.7 -
Contingent consideration 31-Dec-20 2.6 - 2.6
Total 74.2 71.6 2.6

Neptune Energy Group Midco Limited
Consolidated Financial Statements
For the six months ended 30 June 2021
Neptune Energy Group Midco Limited Report for the period ended 30 June 2021
39
14.2 Level 3 fair value movements
The following table presents the changes in Level 3 instruments for the 3 months ended 30 June 2021.
In millions of US$ Equity
Investments Contingent
Consideration Total
Fair value at 1 January 21.1 (2.6) 18.5
Acquisitions - (6.0) (6.0)
Utilisation/Paid - 0.7 0.7
(Losses)/gains recognised in the income statement - 2.5 2.5
(Losses)/gains recognised in other comprehensive income (0.7) 0.1 (0.6)
Closing balance 30 June 2021 20.4 (5.3) 15.1
A 5 per cent change in the EBITDA multiple to the Level 3 instrument above as applied would result in a $1.0 million change in valuation (2020: $1.0 million change). The contingent consideration at 1 January 2021 related to an asset in Denmark that was part of the VNG acquisition. This has now been derecognised with a gain of $2.5 million recognised in the income statement as management no longer expect certain project milestones, will now be achieved. In the first half 2021, a contingent consideration of $6.0 million has arisen on assets acquired in Germany from Wintershall Dea. This would be payable based upon satisfaction of certain criteria, of which $0.7 million has been settled as at the end of June. The possible outcome of the remaining contingent consideration ranges from $nil to $10.7 million.
14.3 Hedging reserve
The hedge reserve represents the portion of deferred gains and losses on hedging instruments deemed to be effective cash flow hedges. The movement in the reserve for the period is recognised in other comprehensive income. The following table summarises the hedge reserve by type of derivative, net of tax effects.
Group In millions of US$
Cash flow commodity
hedge reserve
Cost of commodity
hedging reserve
Cash flow interest rate
hedge reserve
Total hedging reserve
At 1 January 2021 11.5 7.4 3.7 22.6
Add: costs of hedging deferred and recognised in OCI 408.3 62.0 (3.7) 466.6
Less: reclassified from OCI to profit or loss or included in finance costs (63.1) (7.7) - (70.8)
Less: deferred tax (61.8) (10.6) - (72.4)
Less: share of hedge adjustments within equity accounted investments deferred and recognised in OCI
8.8 0.4 - 9.2
At 30 June 2021 303.7 51.5 - 355.2
The Company has identified the following potential sources of hedge ineffectiveness in its hedging relationships:
− CVA/DVA mismatches between the hedging instrument and the hedged item
− the effects from discounting arising from settlement date mismatches between the hedging instrument and hedged item
− the effects from the unwind of discounting from the designation of certain off-market hedging instruments in hedging relationships.

Neptune Energy Group Midco Limited
Consolidated Financial Statements
For the six months ended 30 June 2021
Neptune Energy Group Midco Limited Report for the period ended 30 June 2021
40
15. Called up share capital
Group and Company Number US$ million
Allotted, called up and fully paid $1 shares
At 31 December 2020 and 30 June 2021 1,977,175,201 1,977.2
16. Contingent liabilities During the normal course of its business, the Group may be involved in disputes, including tax disputes. Where applicable the Group has made accruals for probable liabilities related to litigation and claims based on management’s best judgement and in line with IAS 37 and IAS 12. There have been no significant changes in the period since the 2020 year end disclosure. Further details on contingencies can be found in Note 26 of the Neptune Energy Group 2020 Annual Report and Accounts. 17. Related party transactions The following table provides the total amount of transactions that have been entered into with related parties during the six months ended 30 June 2021 and 2020, as well as balances with related parties as at 30 June 2021 and 31 December 2020: 2021 2021 2020 2020
Related party undertaking US$ millions Nature of transactions Purchases Accounts
payable Purchases Accounts
payable
TMF Norway Energy AS (CVC investor) Services 1.6 - - 0.2
ONE-Dyas B.V. (Carlyle investor) Oil and Gas 5.5 - - -
2021 2021 2020 2020
Related party undertaking US$ millions Nature of transactions Sales Accounts
receivable Sales Accounts
receivable
ONE-Dyas B.V. (Carlyle investor) Oil and Gas 4.5 0.8 - 0.5
At 30 June 2021 there is a promissory note for $80.0 million (31 December 2020: $200.0 million) payable to the parent company Neptune Energy Group Limited in respect of an interim dividend declared on 24 February 2021 (31 December 2020 in respect of a dividend declared on 11 December 2019 (see note 5)).
There were no material related party transactions in the half year to 30 June 2020. Terms and conditions of transactions with related parties are summarised in note 27 of the Neptune Energy Group 2020 Annual Report and Accounts. 18. Events after the reporting period There are no reportable post balance sheet events.