nemertes dn3658 benchmark report wan best practices … · nemertes’research’’’’’’...
TRANSCRIPT
N e m e r t e s R e s e a r c h w w w . n e m e r t e s . c o m + 1 8 8 8 . 2 4 1 . 2 6 8 5
Q3 14
08 Fall
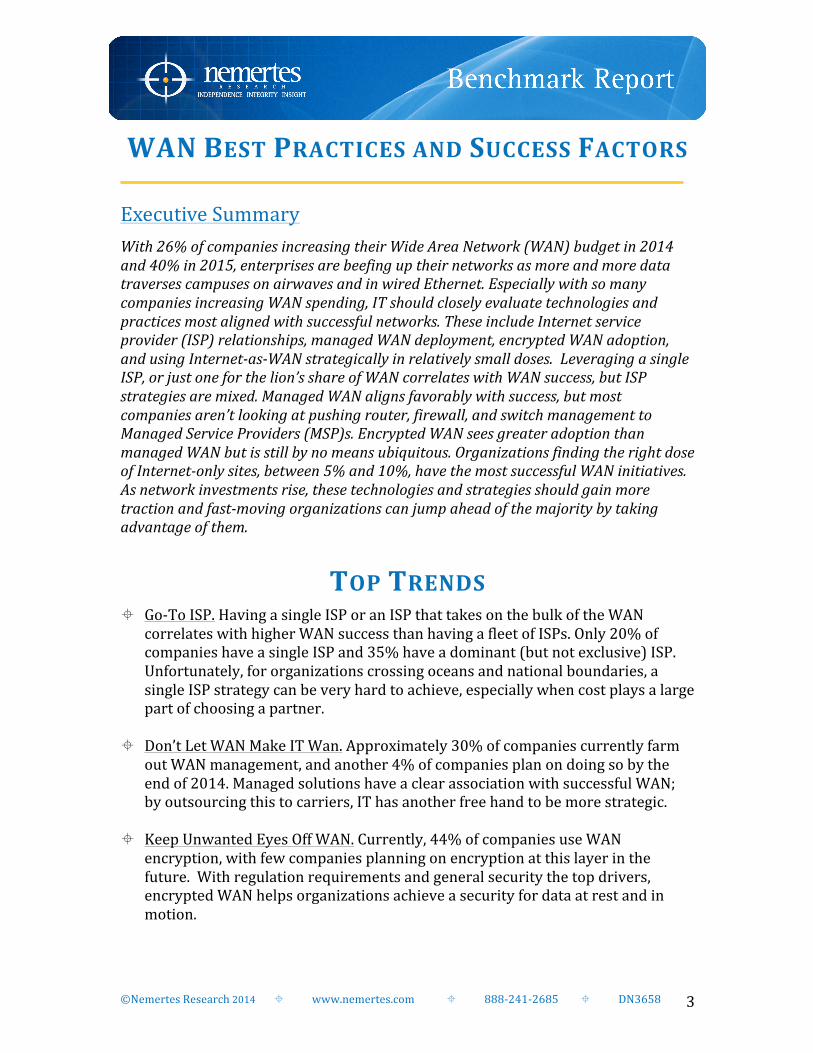
COMPASS DIRECTION POINTS ± Less is More – Leveraging a single ISP for WAN correlates with success, yet
a significant portion of companies uses multiple providers. ± Managed is Better – Companies using managed WAN services tend to be
more successful, but a majority have no plans for this, with 30% already leveraging managed WAN and only 4% planning to.
± Widely Deployed, largely successful – Encrypted WAN correlates with success, and is deployed by 44% of companies with another 10% of companies showing interest in the technology. However, many companies are not looking at encryption at all.
± Internet-‐only in Small Doses – The most successful WAN initiatives leverage a limited and measured percentage of Internet-‐only branches, falling somewhere between 5% and 10%. The vast majority of companies show no direct Internet access growth, but 25% of sites use Internet-‐as-‐WAN and this number is slowly rising.
Nemertes 2014-‐15 Benchmark Report WAN Best Practices and Success Factors Nemertes Research Benchmark Reports provide detailed assessment and analysis of adoption of key technologies and services. Data is based on direct interviews with more than 200 organizations.
©Nemertes Research 2014 ! www.nemertes.com ! 888-‐241-‐2685 ! DN3658 2
TABLE OF CONTENTS WAN Best Practices and Success Factors ........................................................................ 3 Executive Summary ......................................................................................................................... 3
Top Trends ................................................................................................................................ 3 Go-‐To ISP ............................................................................................................................................. 4 Don’t Let WAN Make IT Wan ......................................................................................................... 5 Keep Unwanted Eyes Off WAN ...................................................................................................... 7 Internet-‐Only: Use in Moderation ............................................................................................... 8
Conclusion and Recommendations ................................................................................... 9
Benchmark Methodology ................................................................................................... 10
For Further Information ..................................................................................................... 16
©Nemertes Research 2014 ! www.nemertes.com ! 888-‐241-‐2685 ! DN3658 3
WAN BEST PRACTICES AND SUCCESS FACTORS
Executive Summary With 26% of companies increasing their Wide Area Network (WAN) budget in 2014 and 40% in 2015, enterprises are beefing up their networks as more and more data traverses campuses on airwaves and in wired Ethernet. Especially with so many companies increasing WAN spending, IT should closely evaluate technologies and practices most aligned with successful networks. These include Internet service provider (ISP) relationships, managed WAN deployment, encrypted WAN adoption, and using Internet-‐as-‐WAN strategically in relatively small doses. Leveraging a single ISP, or just one for the lion’s share of WAN correlates with WAN success, but ISP strategies are mixed. Managed WAN aligns favorably with success, but most companies aren’t looking at pushing router, firewall, and switch management to Managed Service Providers (MSP)s. Encrypted WAN sees greater adoption than managed WAN but is still by no means ubiquitous. Organizations finding the right dose of Internet-‐only sites, between 5% and 10%, have the most successful WAN initiatives. As network investments rise, these technologies and strategies should gain more traction and fast-‐moving organizations can jump ahead of the majority by taking advantage of them.
TOP TRENDS ! Go-‐To ISP. Having a single ISP or an ISP that takes on the bulk of the WAN
correlates with higher WAN success than having a fleet of ISPs. Only 20% of companies have a single ISP and 35% have a dominant (but not exclusive) ISP. Unfortunately, for organizations crossing oceans and national boundaries, a single ISP strategy can be very hard to achieve, especially when cost plays a large part of choosing a partner.
! Don’t Let WAN Make IT Wan. Approximately 30% of companies currently farm
out WAN management, and another 4% of companies plan on doing so by the end of 2014. Managed solutions have a clear association with successful WAN; by outsourcing this to carriers, IT has another free hand to be more strategic.
! Keep Unwanted Eyes Off WAN. Currently, 44% of companies use WAN encryption, with few companies planning on encryption at this layer in the future. With regulation requirements and general security the top drivers, encrypted WAN helps organizations achieve a security for data at rest and in motion.
©Nemertes Research 2014 ! www.nemertes.com ! 888-‐241-‐2685 ! DN3658 4
! Internet-‐Only: Use in Moderation. Keeping Internet-‐only branches between 5% and 10% of the entire on-‐ and off-‐site campus aligns with successful WAN initiatives. Using only Internet-‐as-‐WAN configurations reduces WAN costs, making this strategy a likely choice for select remote branches where private services may be cost prohibitive.
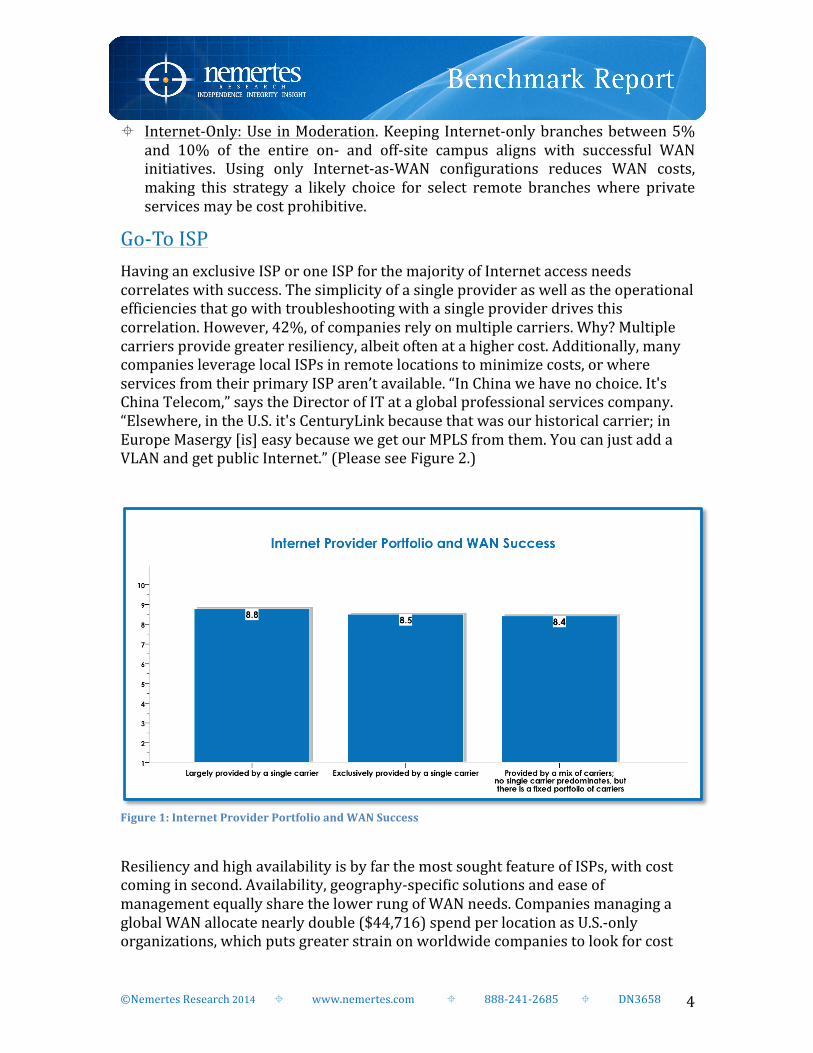
Go-‐To ISP Having an exclusive ISP or one ISP for the majority of Internet access needs correlates with success. The simplicity of a single provider as well as the operational efficiencies that go with troubleshooting with a single provider drives this correlation. However, 42%, of companies rely on multiple carriers. Why? Multiple carriers provide greater resiliency, albeit often at a higher cost. Additionally, many companies leverage local ISPs in remote locations to minimize costs, or where services from their primary ISP aren’t available. “In China we have no choice. It's China Telecom,” says the Director of IT at a global professional services company. “Elsewhere, in the U.S. it's CenturyLink because that was our historical carrier; in Europe Masergy [is] easy because we get our MPLS from them. You can just add a VLAN and get public Internet.” (Please see Figure 2.)
Figure 1: Internet Provider Portfolio and WAN Success
Resiliency and high availability is by far the most sought feature of ISPs, with cost coming in second. Availability, geography-‐specific solutions and ease of management equally share the lower rung of WAN needs. Companies managing a global WAN allocate nearly double ($44,716) spend per location as U.S.-‐only organizations, which puts greater strain on worldwide companies to look for cost
©Nemertes Research 2014 ! www.nemertes.com ! 888-‐241-‐2685 ! DN3658 5
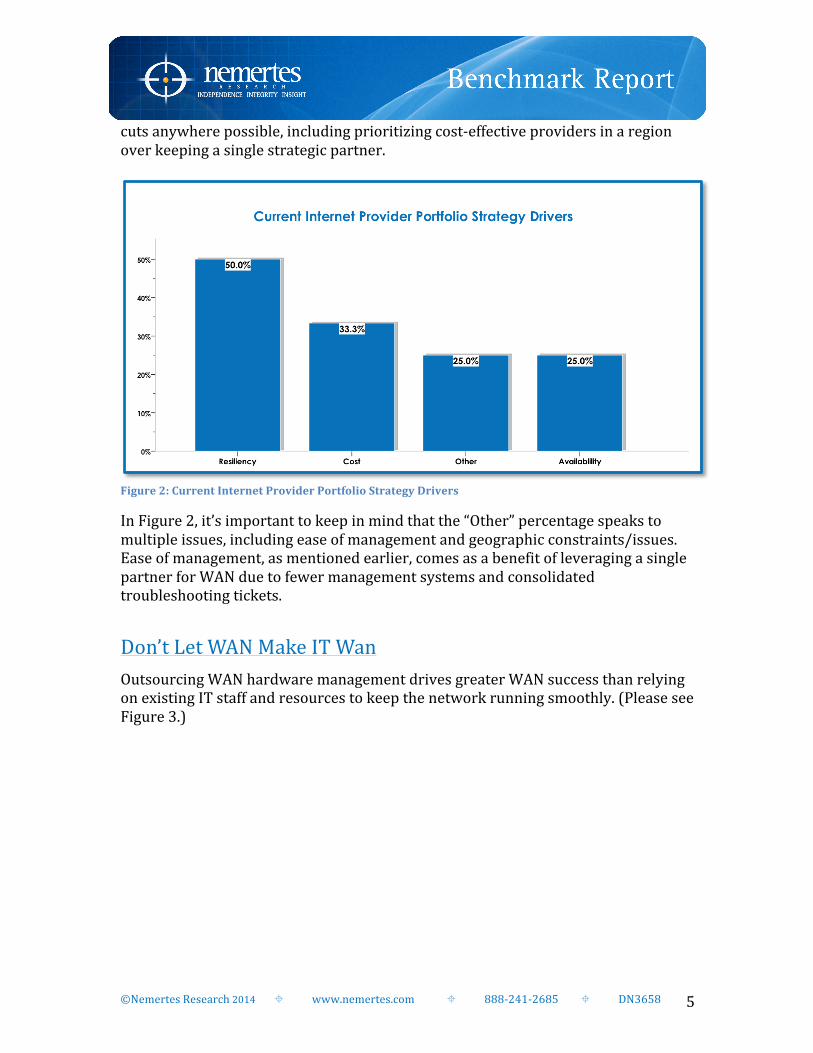
cuts anywhere possible, including prioritizing cost-‐effective providers in a region over keeping a single strategic partner.
Figure 2: Current Internet Provider Portfolio Strategy Drivers
In Figure 2, it’s important to keep in mind that the “Other” percentage speaks to multiple issues, including ease of management and geographic constraints/issues. Ease of management, as mentioned earlier, comes as a benefit of leveraging a single partner for WAN due to fewer management systems and consolidated troubleshooting tickets.
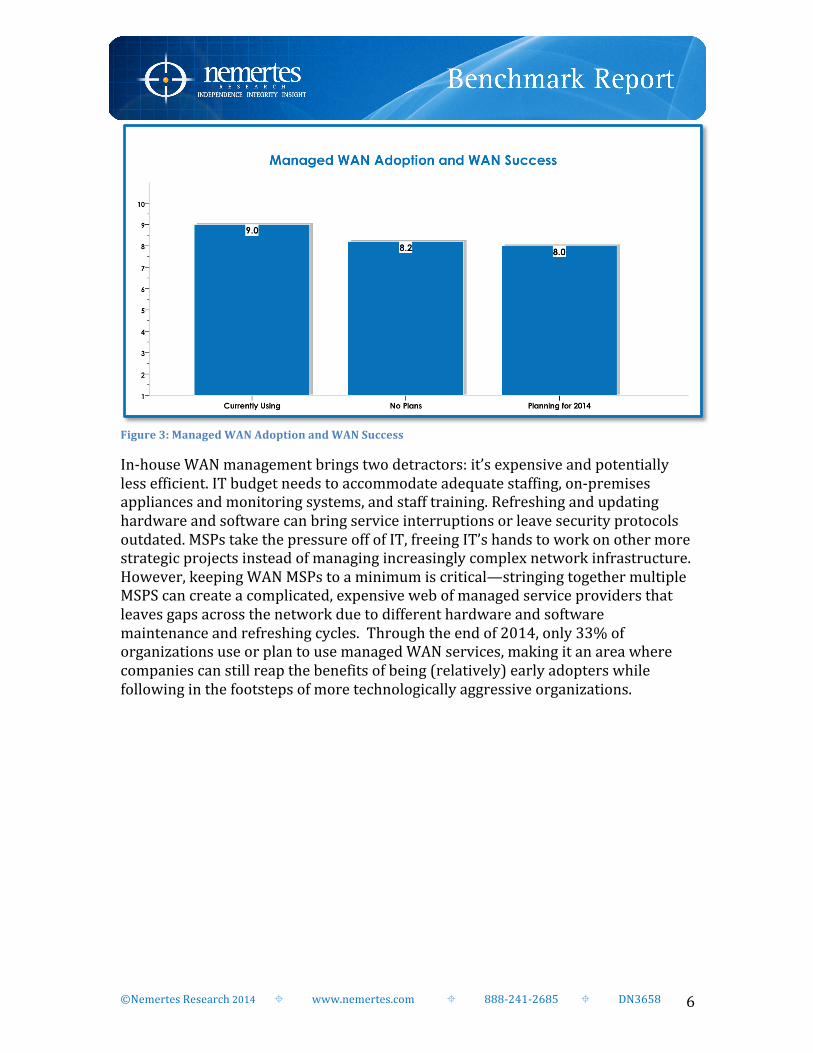
Don’t Let WAN Make IT Wan Outsourcing WAN hardware management drives greater WAN success than relying on existing IT staff and resources to keep the network running smoothly. (Please see Figure 3.)
©Nemertes Research 2014 ! www.nemertes.com ! 888-‐241-‐2685 ! DN3658 6
Figure 3: Managed WAN Adoption and WAN Success
In-‐house WAN management brings two detractors: it’s expensive and potentially less efficient. IT budget needs to accommodate adequate staffing, on-‐premises appliances and monitoring systems, and staff training. Refreshing and updating hardware and software can bring service interruptions or leave security protocols outdated. MSPs take the pressure off of IT, freeing IT’s hands to work on other more strategic projects instead of managing increasingly complex network infrastructure. However, keeping WAN MSPs to a minimum is critical—stringing together multiple MSPS can create a complicated, expensive web of managed service providers that leaves gaps across the network due to different hardware and software maintenance and refreshing cycles. Through the end of 2014, only 33% of organizations use or plan to use managed WAN services, making it an area where companies can still reap the benefits of being (relatively) early adopters while following in the footsteps of more technologically aggressive organizations.
©Nemertes Research 2014 ! www.nemertes.com ! 888-‐241-‐2685 ! DN3658 7
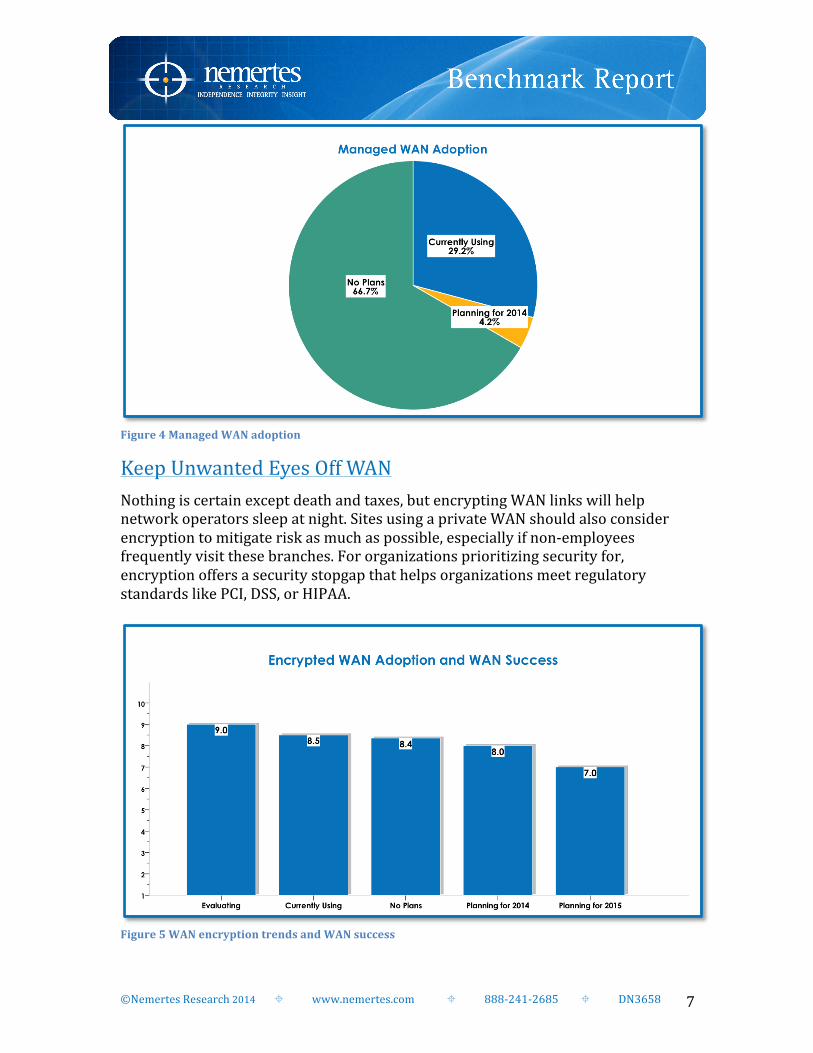
Figure 4 Managed WAN adoption
Keep Unwanted Eyes Off WAN Nothing is certain except death and taxes, but encrypting WAN links will help network operators sleep at night. Sites using a private WAN should also consider encryption to mitigate risk as much as possible, especially if non-‐employees frequently visit these branches. For organizations prioritizing security for, encryption offers a security stopgap that helps organizations meet regulatory standards like PCI, DSS, or HIPAA.
Figure 5 WAN encryption trends and WAN success
©Nemertes Research 2014 ! www.nemertes.com ! 888-‐241-‐2685 ! DN3658 8
Organizations shifting to Internet as WAN need to be cautious of security threats lurking on the net. For Internet as WAN branches, encryption is table stakes, but as such it is still a key component to successful WAN. WAN encryption keeps threats on the Web at a minimum. As essential as security is, network operators need to find a balance. “Encryption on WAN link is almost 20% latency hit, so we encrypt the traffic we want that level of security on,” says the Director of IT Process and Planning at a U.S. university.
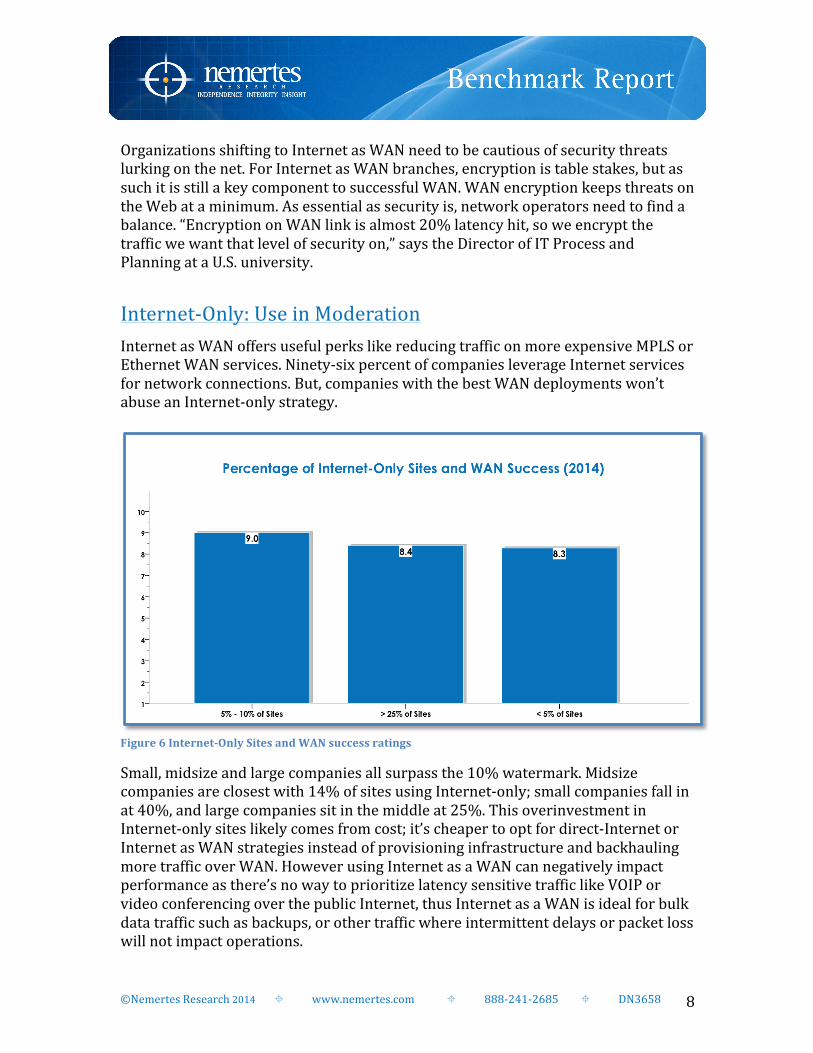
Internet-‐Only: Use in Moderation Internet as WAN offers useful perks like reducing traffic on more expensive MPLS or Ethernet WAN services. Ninety-‐six percent of companies leverage Internet services for network connections. But, companies with the best WAN deployments won’t abuse an Internet-‐only strategy.
Figure 6 Internet-‐Only Sites and WAN success ratings
Small, midsize and large companies all surpass the 10% watermark. Midsize companies are closest with 14% of sites using Internet-‐only; small companies fall in at 40%, and large companies sit in the middle at 25%. This overinvestment in Internet-‐only sites likely comes from cost; it’s cheaper to opt for direct-‐Internet or Internet as WAN strategies instead of provisioning infrastructure and backhauling more traffic over WAN. However using Internet as a WAN can negatively impact performance as there’s no way to prioritize latency sensitive traffic like VOIP or video conferencing over the public Internet, thus Internet as a WAN is ideal for bulk data traffic such as backups, or other traffic where intermittent delays or packet loss will not impact operations.
©Nemertes Research 2014 ! www.nemertes.com ! 888-‐241-‐2685 ! DN3658 9
CONCLUSION AND RECOMMENDATIONS WAN trends and best practices are well established: a single ISP, managed WAN, encrypted WAN, and limited Internet-‐only sites all lean towards a successful deployment. However, adoption of these strategies is not yet the norm, leaving agile organizations an opportunity to pivot and hop ahead of the pack. IT decision makers should consider the following:
! Explore the cost and operational benefits of consolidating ISPs. Engage ISPs to discover if there are discounts for deploying their WAN across the enterprise, ask for measurable data like time-‐to-‐remediation and network uptime, and push for customizable SLAs.
! Obtain an understanding of how much time internal network administrators spend on WAN maintenance. Measure this time against the cost of managed WAN services and the benefits of allocating internal IT resources to other initiatives.
! For organizations emphasizing network security, leverage WAN encryption for all branches. Even private WAN networks could be at risk.
! Establish Internet-‐only sites sparingly; relying too much on public Internet could be counterproductive as there are more opportunities for network compromises and session performance issues due to sharing bandwidth with public traffic.
©Nemertes Research 2014 ! www.nemertes.com ! 888-‐241-‐2685 ! DN3658 10
BENCHMARK METHODOLOGY Nemertes conducted 212 interviews with IT professionals at 201 companies or organizations to compile its 2014-‐2015 benchmark. Nemertes analysts conducted in-‐depth interviews, ranging in duration from 30 minutes to five hours (not always in a single phone call), with all of the benchmark participants. We also conducted several short follow-‐up calls or exchanged emails to clarify and augment data. During interviews, each analyst asked a pre-‐planned list of questions to ensure we asked the questions consistently. Many questions are open-‐ended, providing an opportunity for our participants to provide their own unbiased insight and observations. We did not provide the list of questions to participants ahead of time. To ensure the report is relevant to the largest possible group of readers, we deliberately sought to reach the broadest possible range of industries and company sizes. In particular, we asked open-‐ended questions about best practices, strategic goals, business drivers, company initiatives, costs, vendor successes and failures, and technical and operational challenges. We also asked participants to describe their organizational and operational structures, and to position their specific technology-‐related decisions and operations within the context of IT and overall business goals. As a result, individual interviews varied considerably in the number of questions answered and in the number of subject areas each addressed, as well as in the degree of insight they provided for each topic, based on the interest and expertise of the participants involved. For the interviews, Nemertes drew participants primarily from its database of IT professionals, its non-‐vendor client base, and to a lesser extent, from publicly available lists of IT executives. Nemertes guarantees confidentiality and anonymity for participants and their companies. These reports include quotations from real individuals, identified only by title and/or industry affiliation. Please note these quotes are verbatim, with no changes in content or wording, except to correct grammar.
Timeframe We conducted interviews with benchmark participants from IT organizations between January 2014 and April 2014. We asked participants to provide us with insight into ongoing communications, computing, and security initiatives and those planned for the next two years.
Participants In selecting individual participants, we asked to speak with the individual or individuals within IT (or, where they are separate, security organizations) most closely associated with decision-‐making, operations and overall knowledge in each technology area. For example, to discuss communications technologies we typically speak with VPs, directors, and managers in network management, telecom,
©Nemertes Research 2014 ! www.nemertes.com ! 888-‐241-‐2685 ! DN3658 11
enterprise architecture, systems integration, collaborative applications, and unified communications, as well as CIOs and CTOs. For computing and security topics, we typically speak with directors and managers of data-‐center operations, systems or enterprise architecture, directors of security operations, CIOs, CISOs, and CTOs.
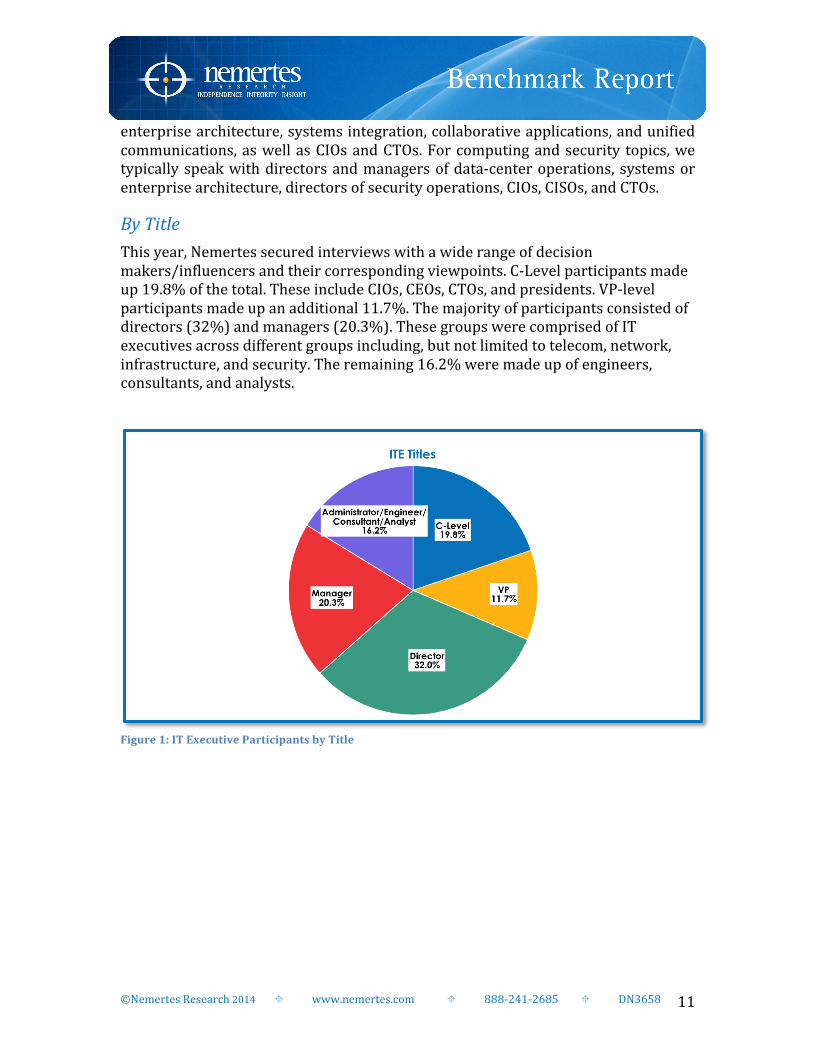
By Title This year, Nemertes secured interviews with a wide range of decision makers/influencers and their corresponding viewpoints. C-‐Level participants made up 19.8% of the total. These include CIOs, CEOs, CTOs, and presidents. VP-‐level participants made up an additional 11.7%. The majority of participants consisted of directors (32%) and managers (20.3%). These groups were comprised of IT executives across different groups including, but not limited to telecom, network, infrastructure, and security. The remaining 16.2% were made up of engineers, consultants, and analysts.
Figure 1: IT Executive Participants by Title
©Nemertes Research 2014 ! www.nemertes.com ! 888-‐241-‐2685 ! DN3658 12
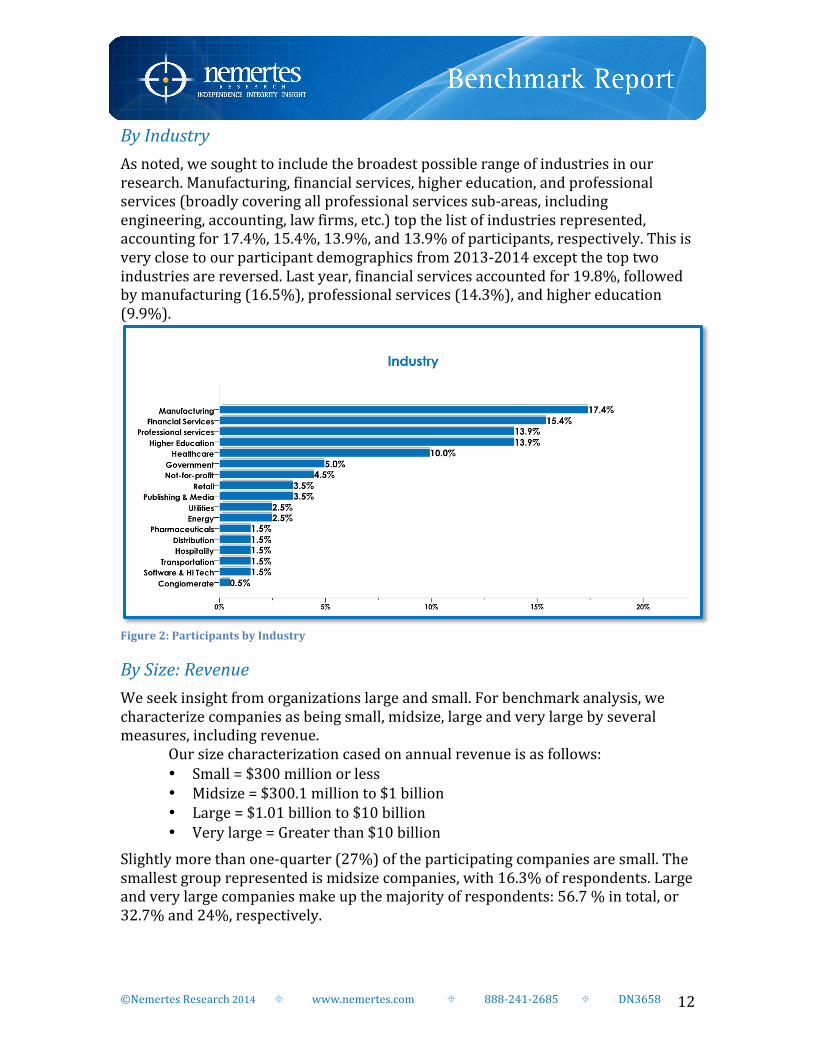
By Industry As noted, we sought to include the broadest possible range of industries in our research. Manufacturing, financial services, higher education, and professional services (broadly covering all professional services sub-‐areas, including engineering, accounting, law firms, etc.) top the list of industries represented, accounting for 17.4%, 15.4%, 13.9%, and 13.9% of participants, respectively. This is very close to our participant demographics from 2013-‐2014 except the top two industries are reversed. Last year, financial services accounted for 19.8%, followed by manufacturing (16.5%), professional services (14.3%), and higher education (9.9%).
Figure 2: Participants by Industry
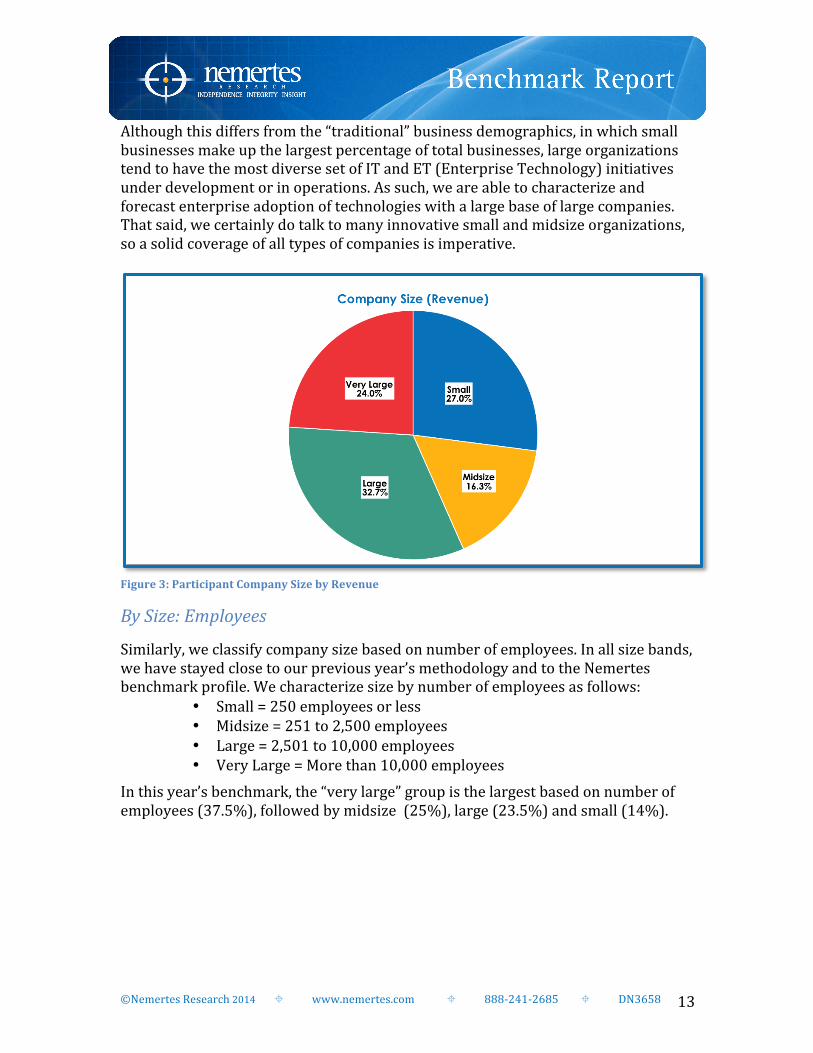
By Size: Revenue We seek insight from organizations large and small. For benchmark analysis, we characterize companies as being small, midsize, large and very large by several measures, including revenue.
Our size characterization cased on annual revenue is as follows: • Small = $300 million or less • Midsize = $300.1 million to $1 billion • Large = $1.01 billion to $10 billion • Very large = Greater than $10 billion
Slightly more than one-‐quarter (27%) of the participating companies are small. The smallest group represented is midsize companies, with 16.3% of respondents. Large and very large companies make up the majority of respondents: 56.7 % in total, or 32.7% and 24%, respectively.
©Nemertes Research 2014 ! www.nemertes.com ! 888-‐241-‐2685 ! DN3658 13
Although this differs from the “traditional” business demographics, in which small businesses make up the largest percentage of total businesses, large organizations tend to have the most diverse set of IT and ET (Enterprise Technology) initiatives under development or in operations. As such, we are able to characterize and forecast enterprise adoption of technologies with a large base of large companies. That said, we certainly do talk to many innovative small and midsize organizations, so a solid coverage of all types of companies is imperative.
Figure 3: Participant Company Size by Revenue
By Size: Employees
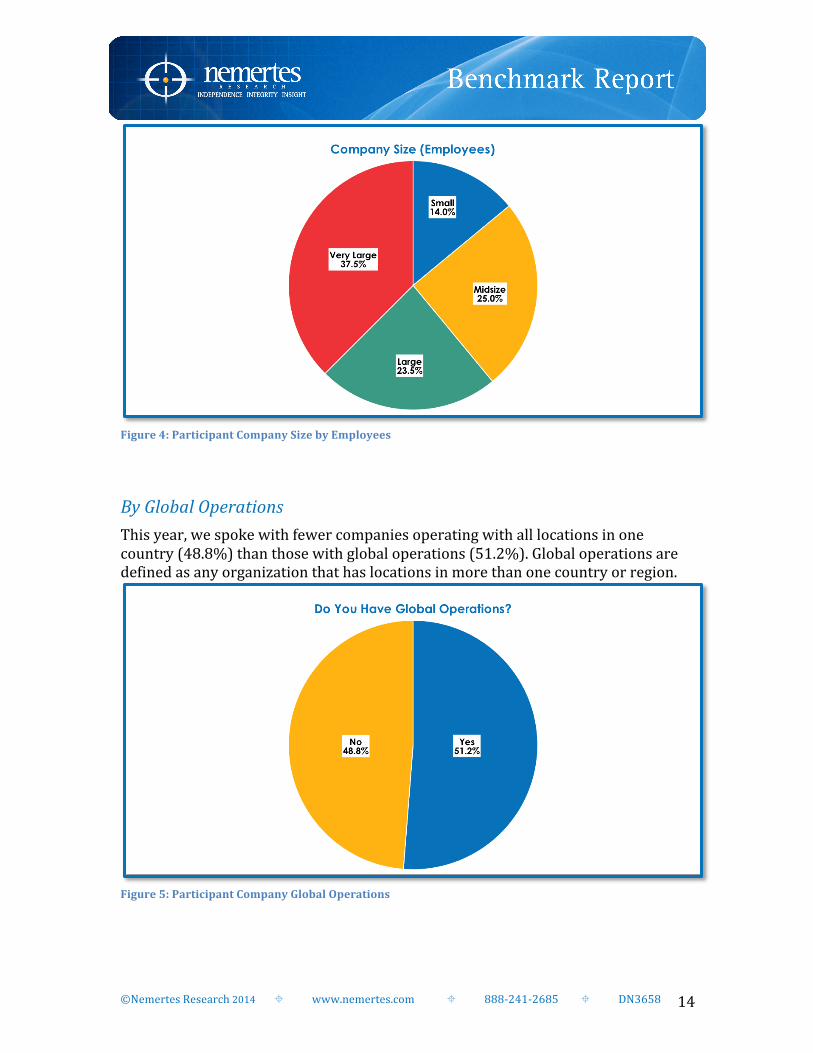
Similarly, we classify company size based on number of employees. In all size bands, we have stayed close to our previous year’s methodology and to the Nemertes benchmark profile. We characterize size by number of employees as follows:
• Small = 250 employees or less • Midsize = 251 to 2,500 employees • Large = 2,501 to 10,000 employees • Very Large = More than 10,000 employees
In this year’s benchmark, the “very large” group is the largest based on number of employees (37.5%), followed by midsize (25%), large (23.5%) and small (14%).
©Nemertes Research 2014 ! www.nemertes.com ! 888-‐241-‐2685 ! DN3658 14
Figure 4: Participant Company Size by Employees
By Global Operations This year, we spoke with fewer companies operating with all locations in one country (48.8%) than those with global operations (51.2%). Global operations are defined as any organization that has locations in more than one country or region.
Figure 5: Participant Company Global Operations
©Nemertes Research 2014 ! www.nemertes.com ! 888-‐241-‐2685 ! DN3658 15
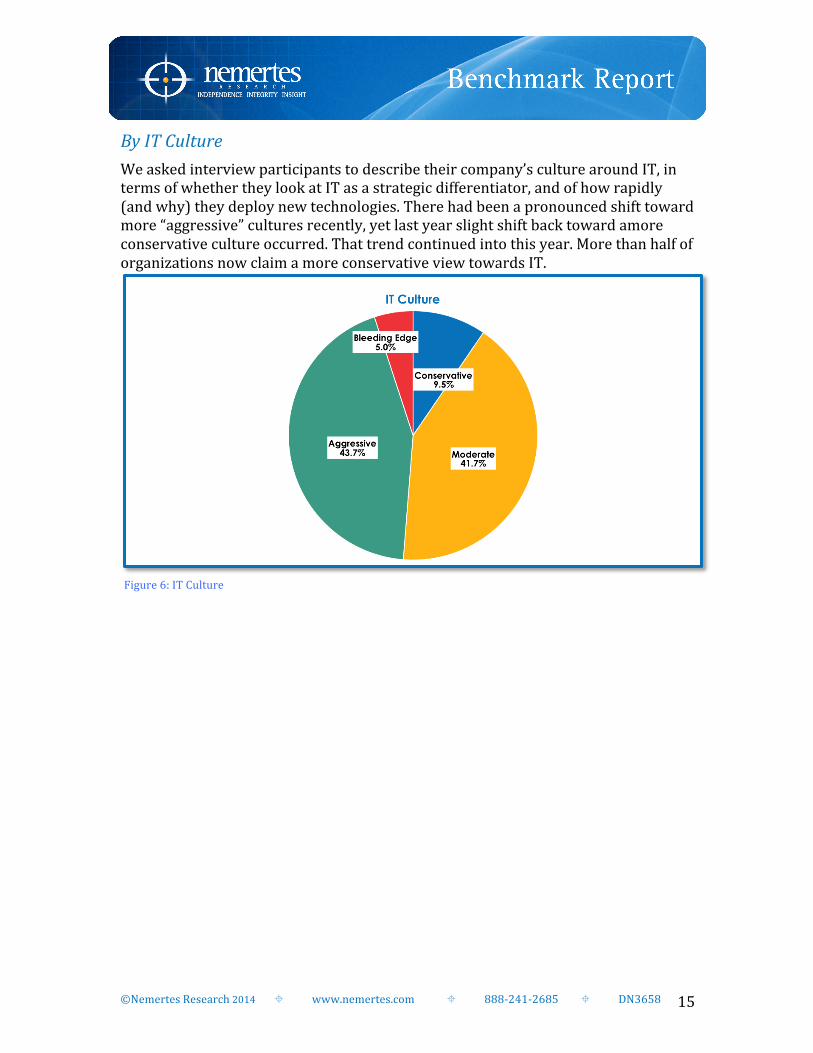
By IT Culture We asked interview participants to describe their company’s culture around IT, in terms of whether they look at IT as a strategic differentiator, and of how rapidly (and why) they deploy new technologies. There had been a pronounced shift toward more “aggressive” cultures recently, yet last year slight shift back toward amore conservative culture occurred. That trend continued into this year. More than half of organizations now claim a more conservative view towards IT.
Figure 6: IT Culture
©Nemertes Research 2014 ! www.nemertes.com ! 888-‐241-‐2685 ! DN3658 16
FOR FURTHER INFORMATION Nemertes has thousands of charts, correlation points, and data analysis for this and numerous other topics. We can provide this information via more detailed papers, presentations, conversations, and Webcasts. If you have further questions, please contact [email protected]. Clients, please contact client-‐[email protected]. About Nemertes Research: Nemertes Research is a research-‐advisory and strategic-‐consulting firm that specializes in analyzing and quantifying the business value of emerging technologies. You can learn more about Nemertes Research at our Website: http://www.nemertes.com