nemas - tools to improve academic results
TRANSCRIPT
Presenter:DrMuaviaGallie(PhD)
School Turnaround
Allourlearnerscanandshouldbesuccessfulinourschools.
NEMASToolstoImproveAcademicResults

TheHOWandWHENofSchoolTurnaroundMethodology
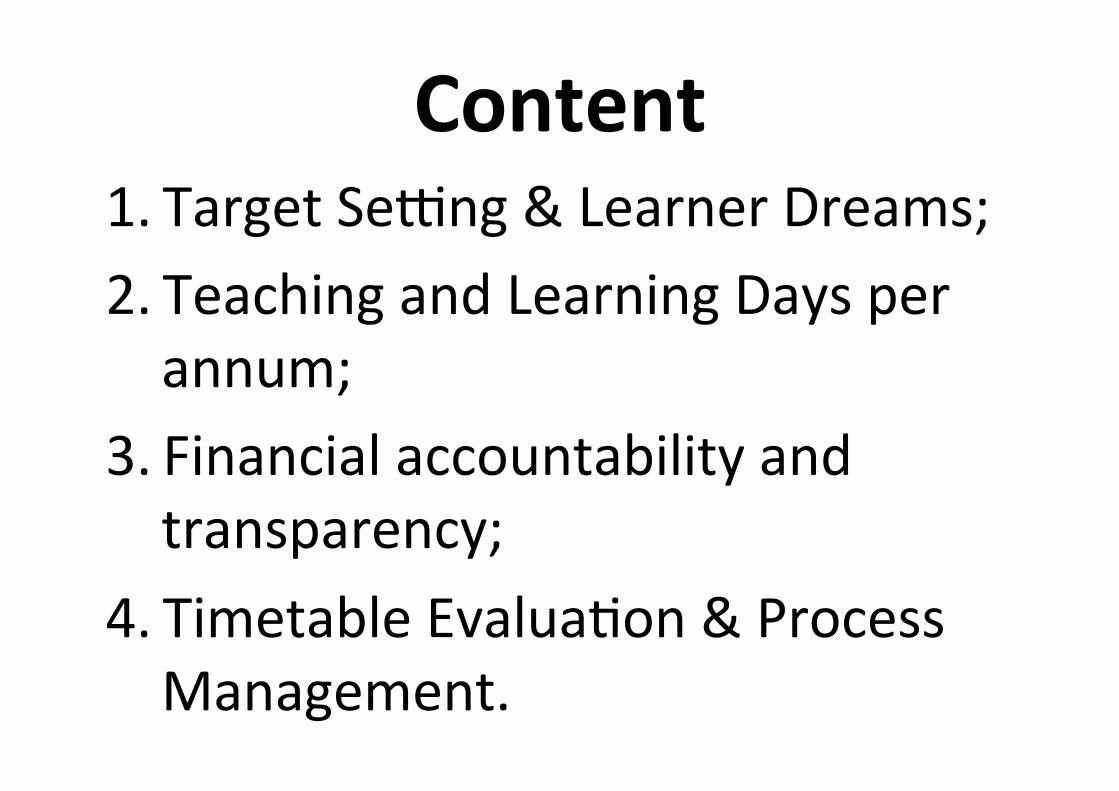
Content1. TargetSe+ng&LearnerDreams;2. TeachingandLearningDaysperannum;
3. Financialaccountabilityandtransparency;
4. TimetableEvaluaCon&ProcessManagement.
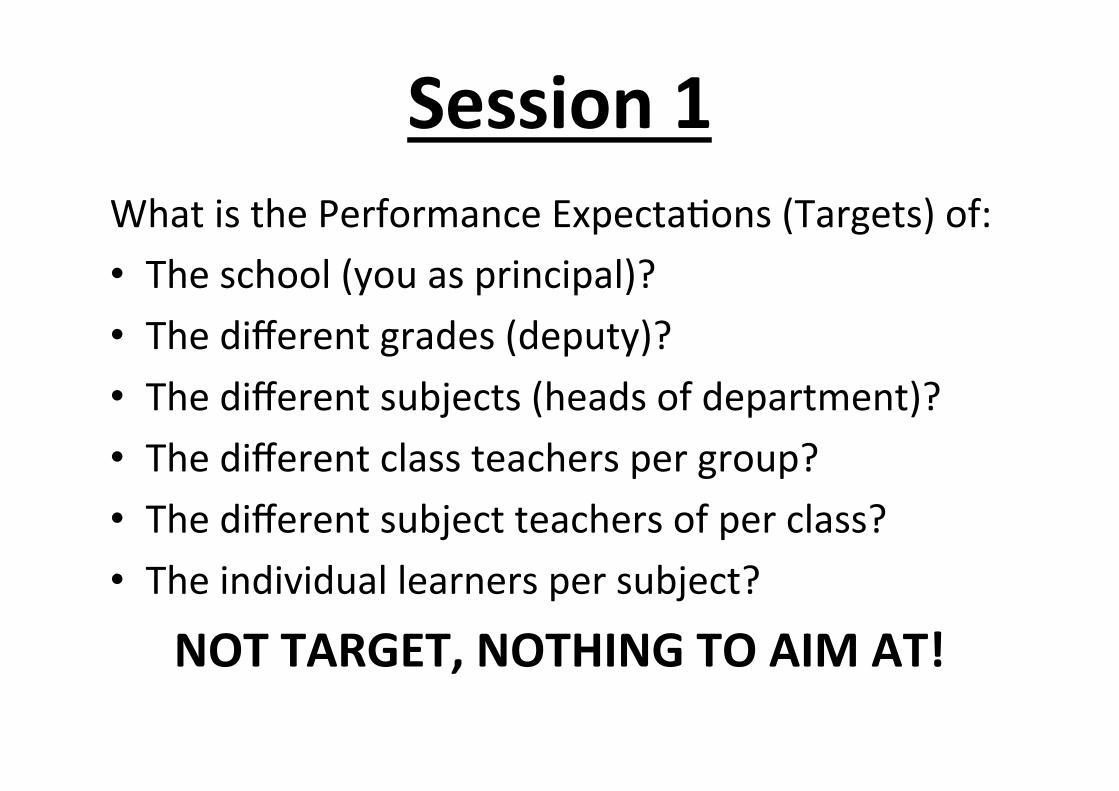
Session1WhatisthePerformanceExpectaCons(Targets)of:• Theschool(youasprincipal)?• Thedifferentgrades(deputy)?• Thedifferentsubjects(headsofdepartment)?• Thedifferentclassteacherspergroup?• Thedifferentsubjectteachersofperclass?• Theindividuallearnerspersubject?
NOTTARGET,NOTHINGTOAIMAT!

TARGETSETTING
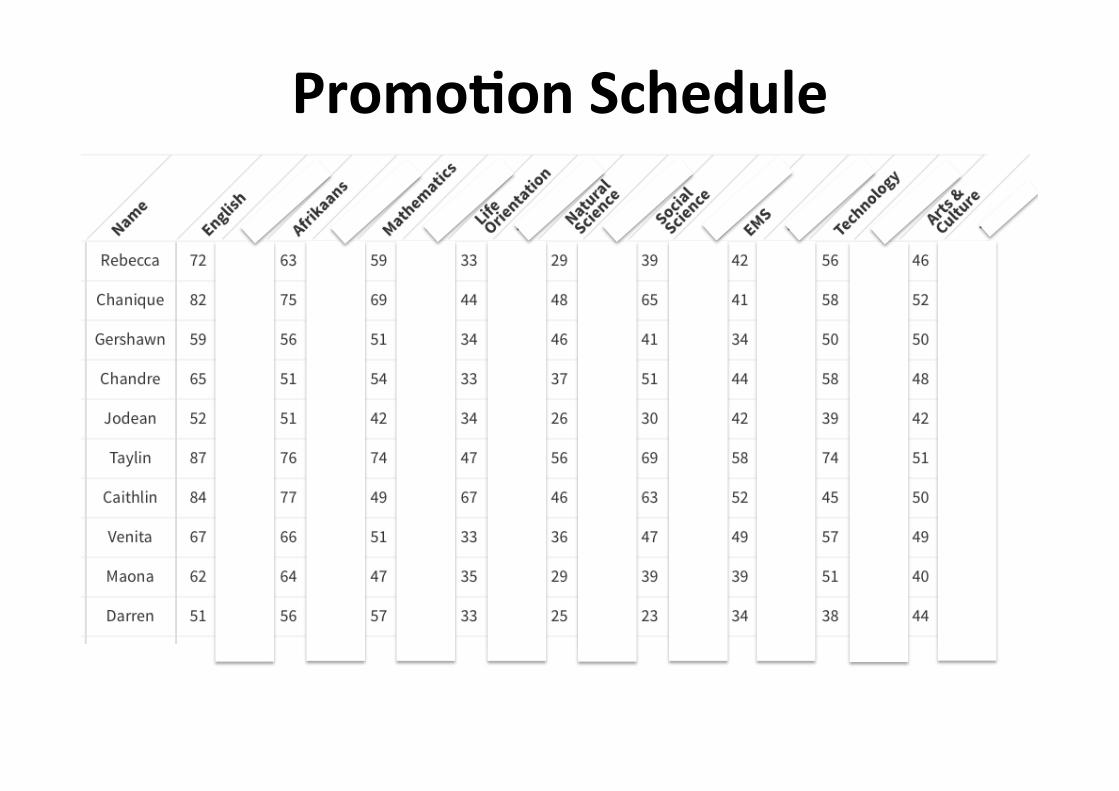
PromoLonSchedule
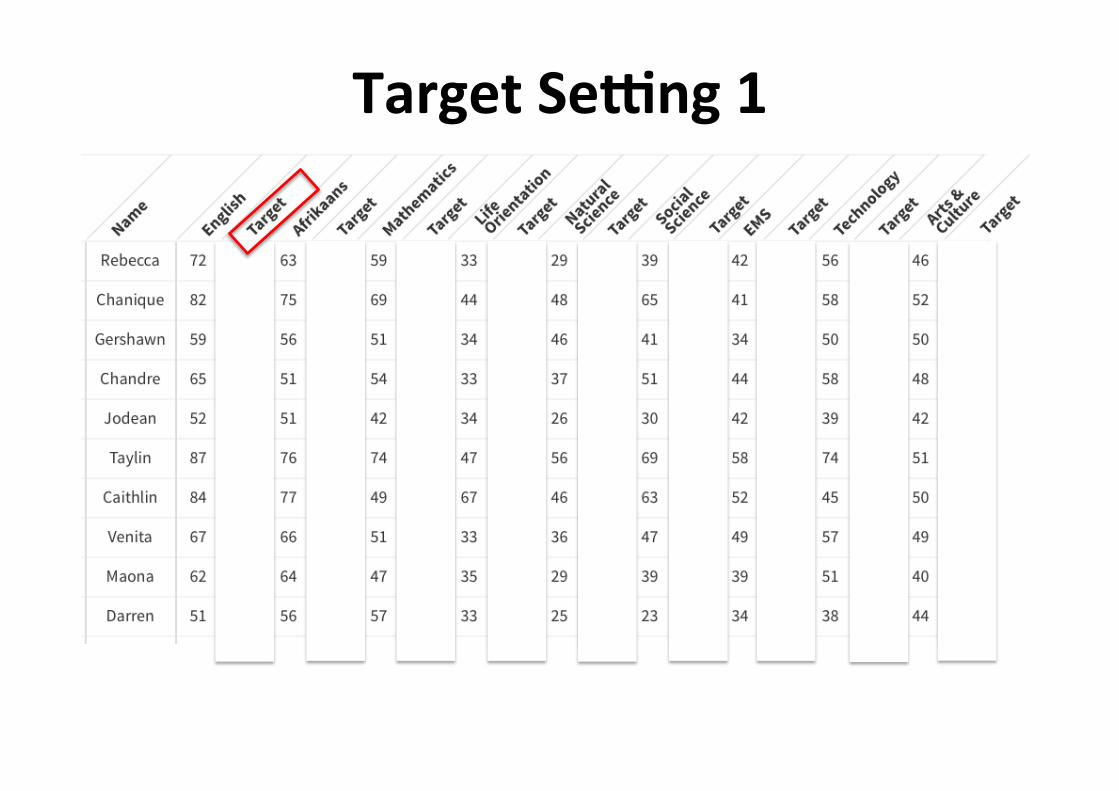
TargetSeMng1

TargetSeMng2
AdequateYearlyProgress=5%
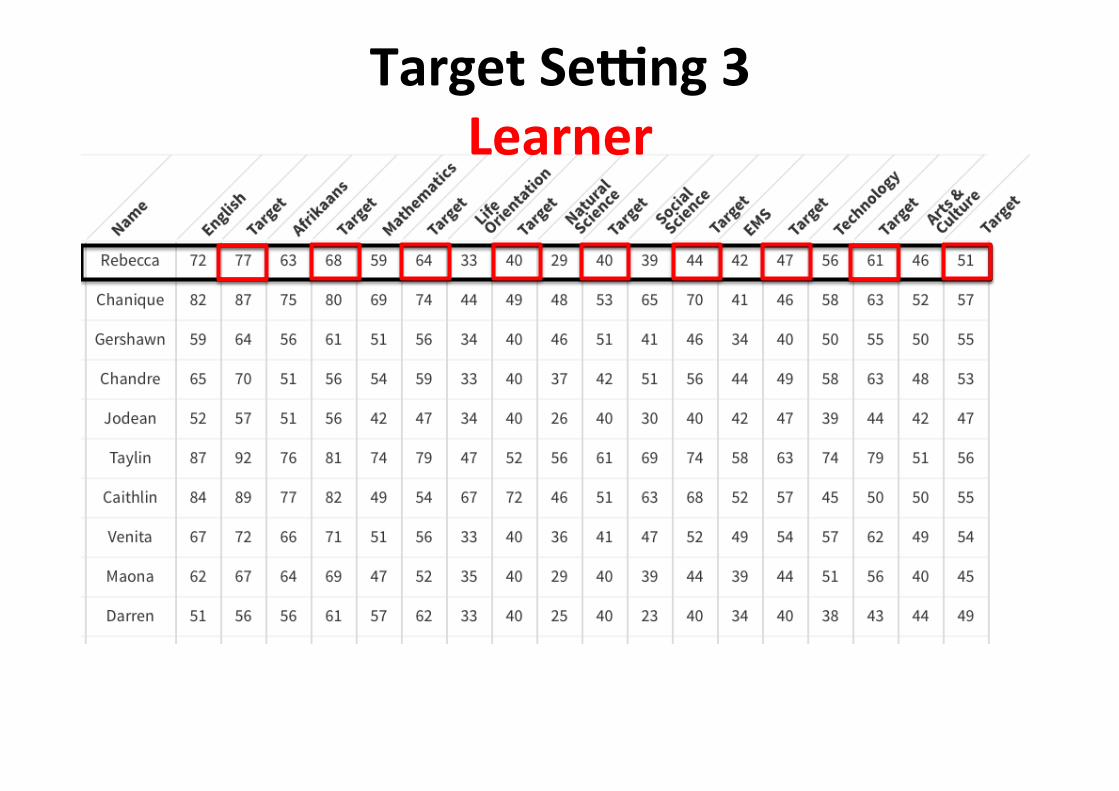
TargetSeMng3Learner
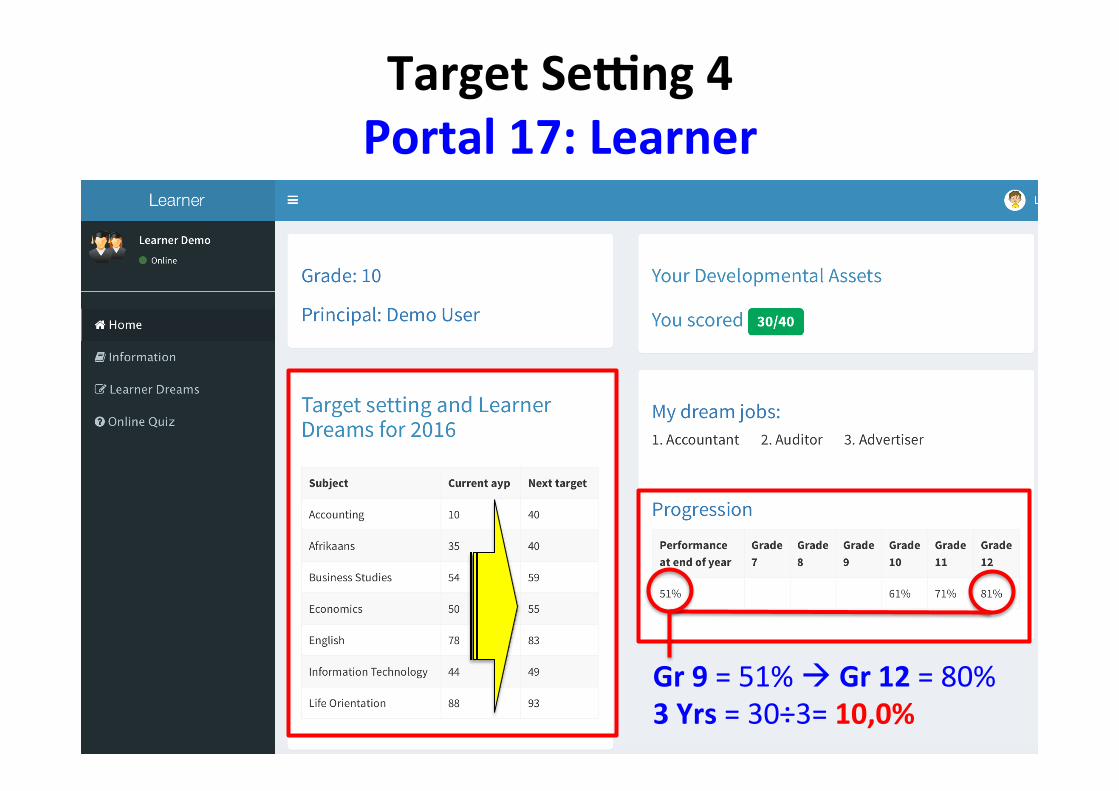
TargetSeMng4Portal17:Learner
Gr9=51%àGr12=80%3Yrs=30÷3=10,0%
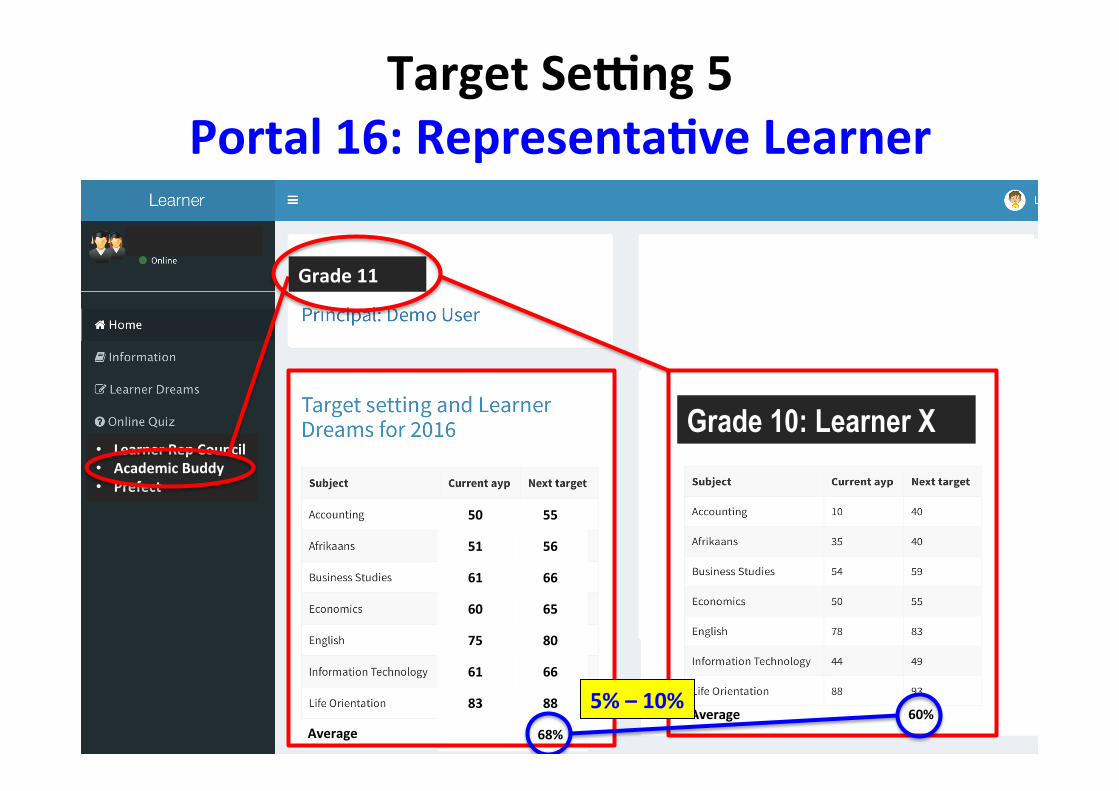
TargetSeMng5Portal16:RepresentaLveLearner
• LearnerRepCouncil• AcademicBuddy• Prefect
Grade11
50 55
51 56
61 66
60 65
75 80
61 66
83 88
68%Average
Grade 10: Learner X
Average 60%5%–10%
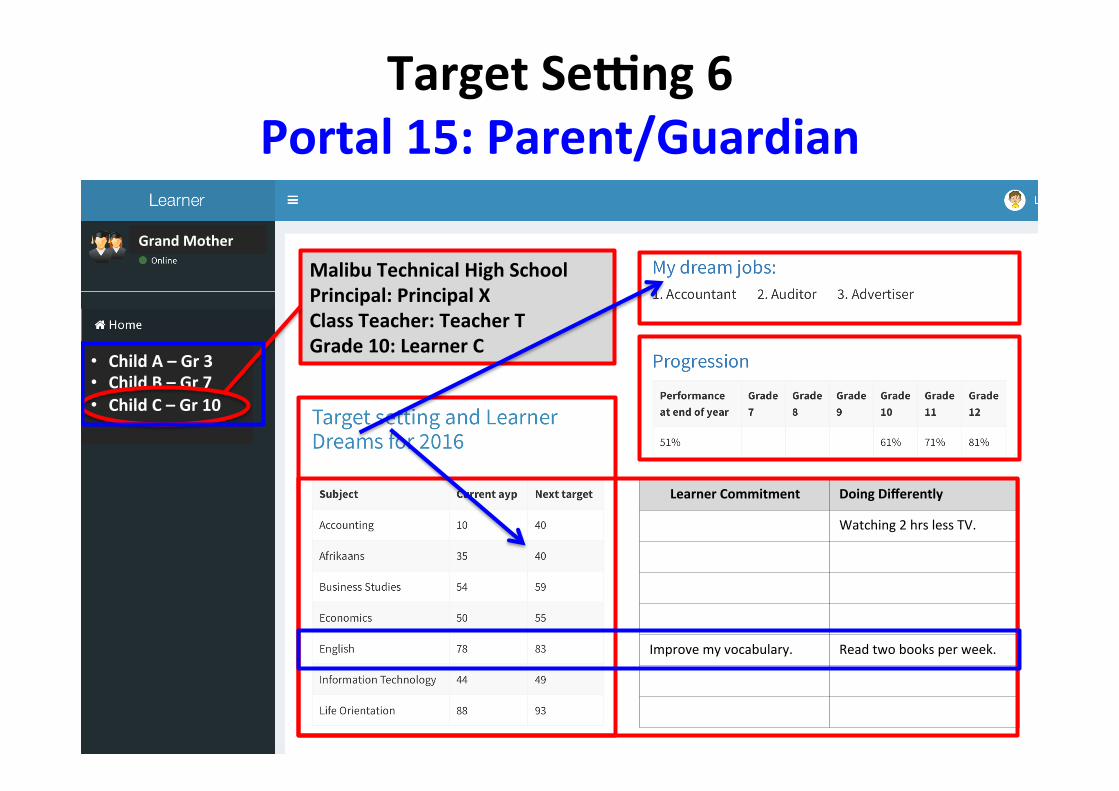
TargetSeMng6Portal15:Parent/Guardian
GrandMother
• ChildA–Gr3• ChildB–Gr7• ChildC–Gr10
MalibuTechnicalHighSchoolPrincipal:PrincipalXClassTeacher:TeacherTGrade10:LearnerC
LearnerCommitment DoingDifferently
Watching2hrslessTV.
Improvemyvocabulary. Readtwobooksperweek.
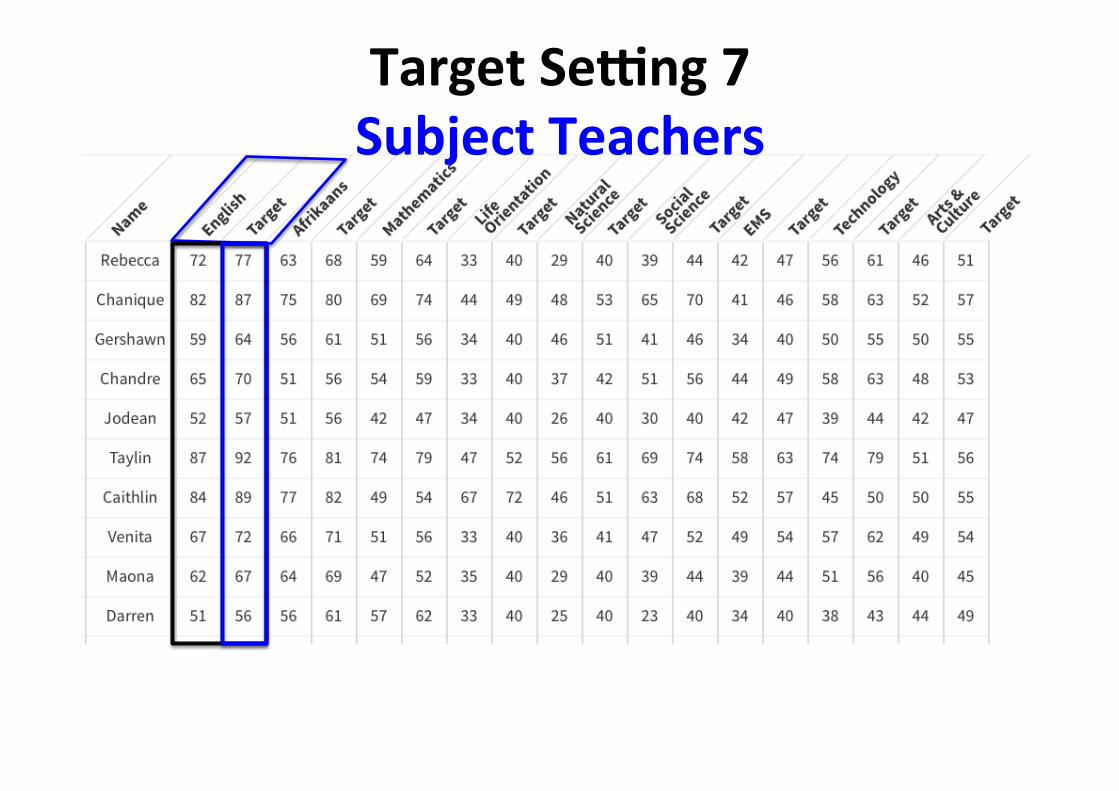
TargetSeMng7SubjectTeachers
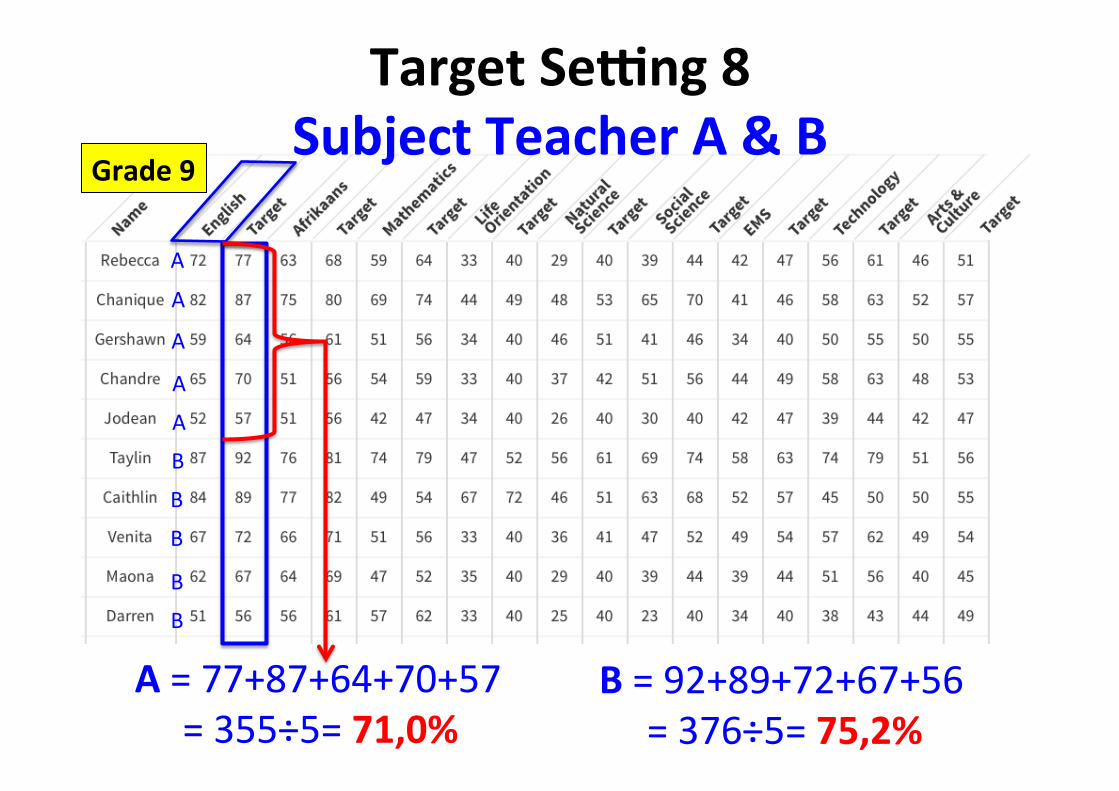
TargetSeMng8SubjectTeacherA&B
A
A
A
A
A
B
B
B
B
B
A=77+87+64+70+57=355÷5=71,0%
B=92+89+72+67+56=376÷5=75,2%
Grade9
English
RebeccaChaniqueGershawn
77
8764
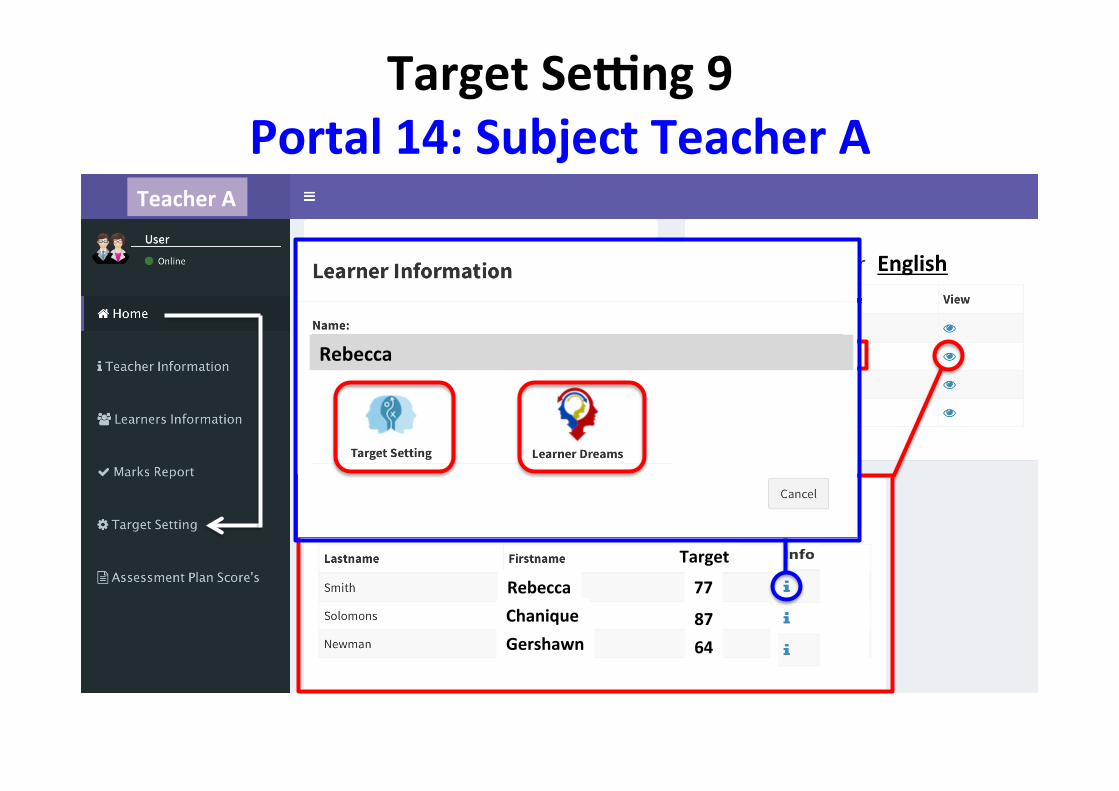
TargetSeMng9Portal14:SubjectTeacherA
TeacherA
71,0%62,1%
Target
Rebecca
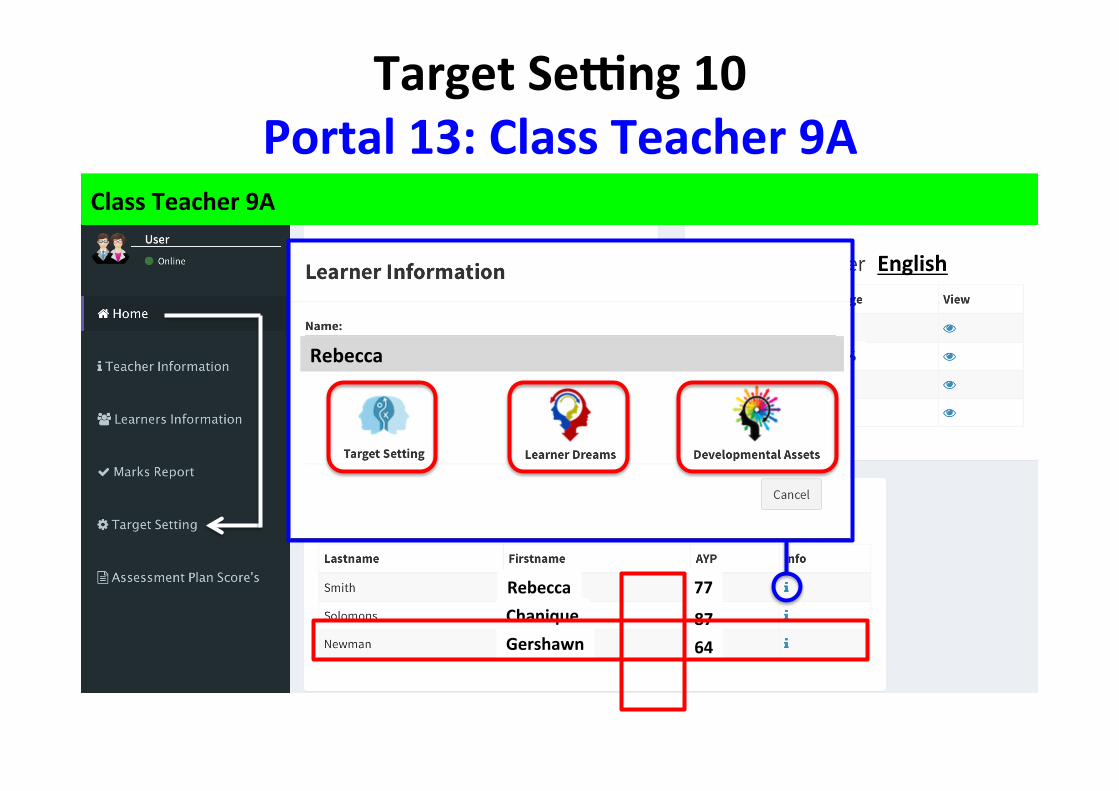
English
RebeccaChaniqueGershawn
77
8764
TargetSeMng10Portal13:ClassTeacher9A
71,0%62,1%Rebecca
ClassTeacher9A
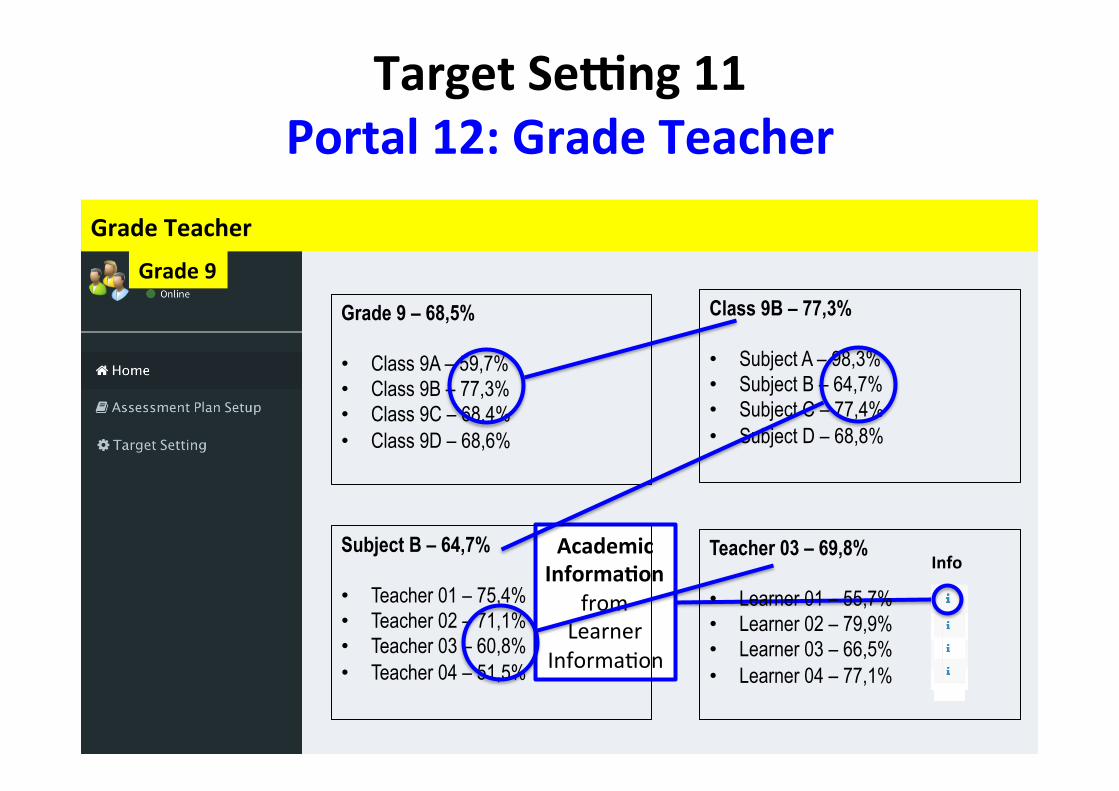
TargetSeMng11Portal12:GradeTeacher
GradeTeacher
Grade9
AcademicInformaLon
fromLearner
InformaCon
Grade 9 – 68,5% • Class 9A – 59,7% • Class 9B – 77,3% • Class 9C – 68,4% • Class 9D – 68,6%
Class 9B – 77,3% • Subject A – 98,3% • Subject B – 64,7% • Subject C – 77,4% • Subject D – 68,8%
Subject B – 64,7% • Teacher 01 – 75,4% • Teacher 02 – 71,1% • Teacher 03 – 60,8% • Teacher 04 – 51,5%
Teacher 03 – 69,8% • Learner 01 – 55,7% • Learner 02 – 79,9% • Learner 03 – 66,5% • Learner 04 – 77,1%
Info
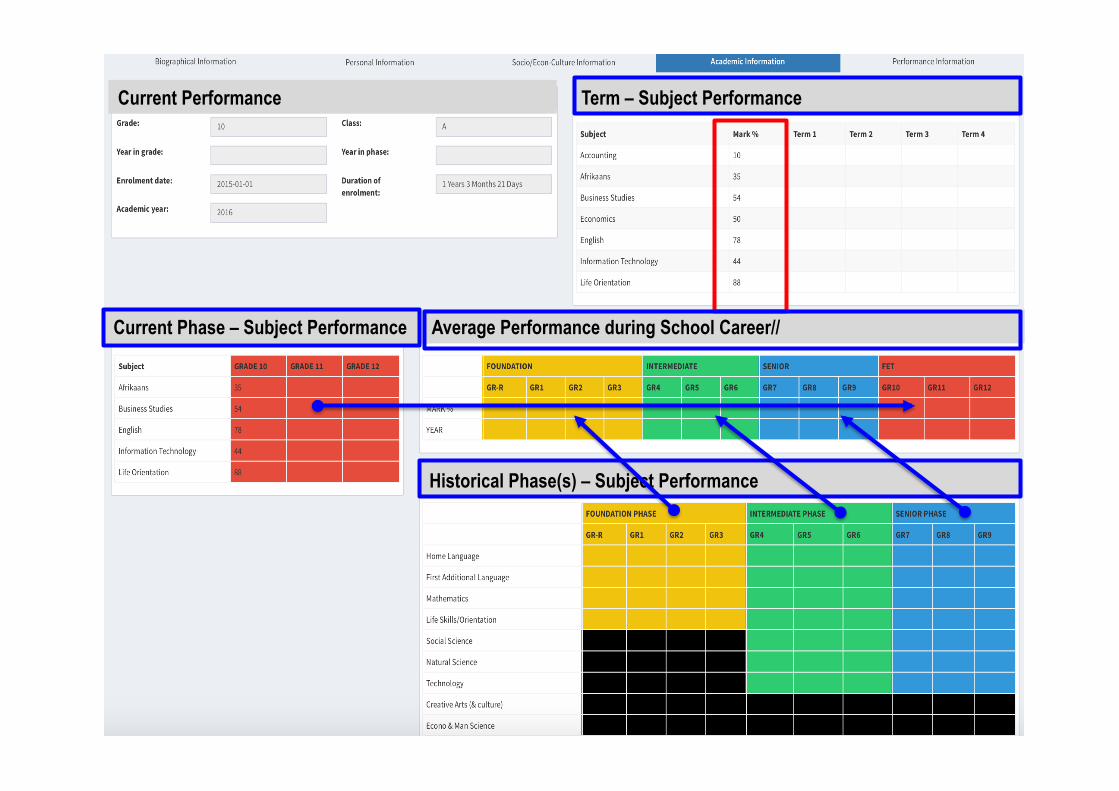
Term – Subject Performance
Current Phase – Subject Performance Average Performance during School Career//
Historical Phase(s) – Subject Performance
Current Performance
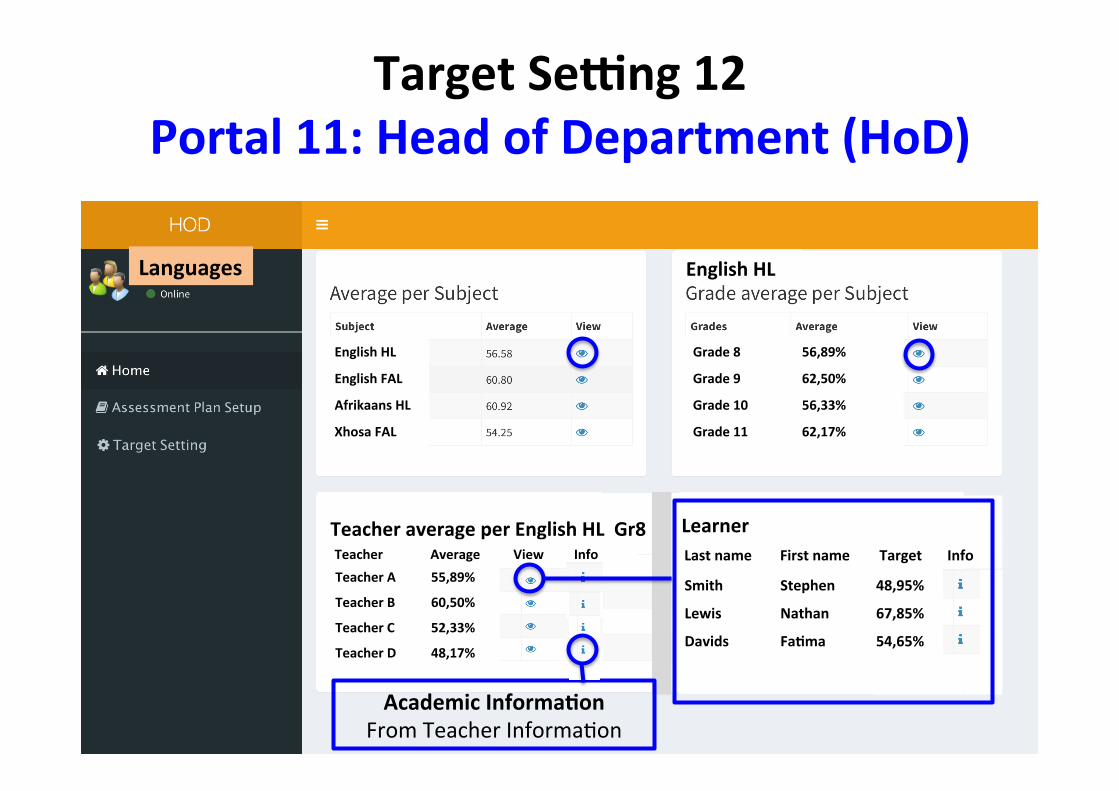
TargetSeMng12Portal11:HeadofDepartment(HoD)
Languages
Grade8 56,89%
Grade9 62,50%
Grade10 56,33%
Grade11 62,17%
EnglishHL
EnglishFAL
AfrikaansHL
XhosaFAL
EnglishHL
TeacheraverageperEnglishHLGr8
TeacherA 55,89%
TeacherB 60,50%
TeacherC 52,33%
TeacherD 48,17%
Teacher AverageView Info
LearnerLastname Firstname TargetInfo
Smith Stephen 48,95%
Lewis Nathan 67,85%
Davids FaLma 54,65%
AcademicInformaLonFromTeacherInformaCon
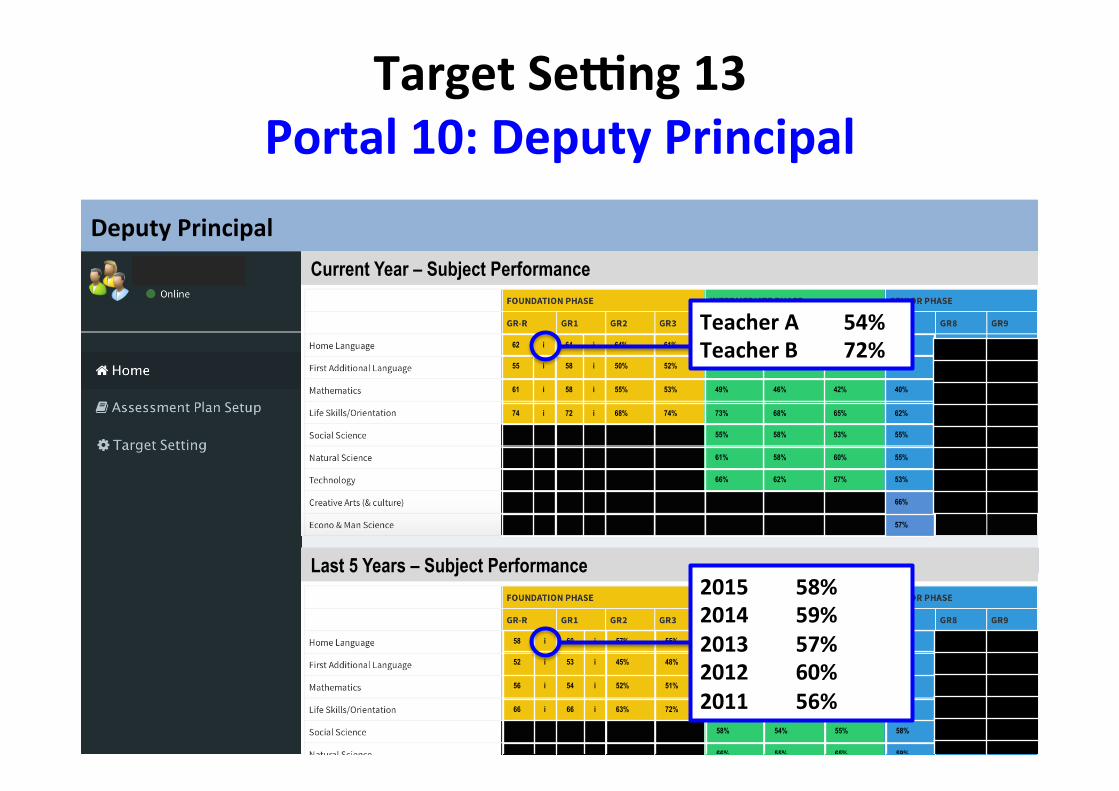
TargetSeMng13Portal10:DeputyPrincipal
DeputyPrincipalCurrent Year – Subject Performance
62 i 64 i 64% 61% 57% 53% 57% 59%
55 i 58 i 50% 52% 50% 47% 51% 55%
61 i 58 i 55% 53% 49% 46% 42% 40%
74 i 72 i 68% 74% 73% 68% 65% 62%
55% 58% 53% 55%
61% 58% 60% 55%
66% 62% 57% 53%
66%
57%
Last 5 Years – Subject Performance
58 i 60 i 57% 55% 54% 53% 59% 53%
52 i 53 i 45% 48% 55% 49% 57% 51%
56 i 54 i 52% 51% 46% 48% 48% 43%
66 i 66 i 63% 72% 77% 64% 62% 60%
58% 54% 55% 58%
66% 55% 65% 59%
68% 67% 59% 57%
69%
57%
TeacherA 54%TeacherB 72%
2015 58%2014 59%2013 57%2012 60%2011 56%
Current Year – Subject Performance
62 i 64 i 64% 61% 57% 53% 57% 59%
55 i 58 i 50% 52% 50% 47% 51% 55%
61 i 58 i 55% 53% 49% 46% 42% 40%
74 i 72 i 68% 74% 73% 68% 65% 62%
55% 58% 53% 55%
61% 58% 60% 55%
66% 62% 57% 53%
66%
57%
Last 5 Years – Subject Performance
58 i 60 i 57% 55% 54% 53% 59% 53%
52 i 53 i 45% 48% 55% 49% 57% 51%
56 i 54 i 52% 51% 46% 48% 48% 43%
66 i 66 i 63% 72% 77% 64% 62% 60%
58% 54% 55% 58%
66% 55% 65% 59%
68% 67% 59% 57%
69%
57%
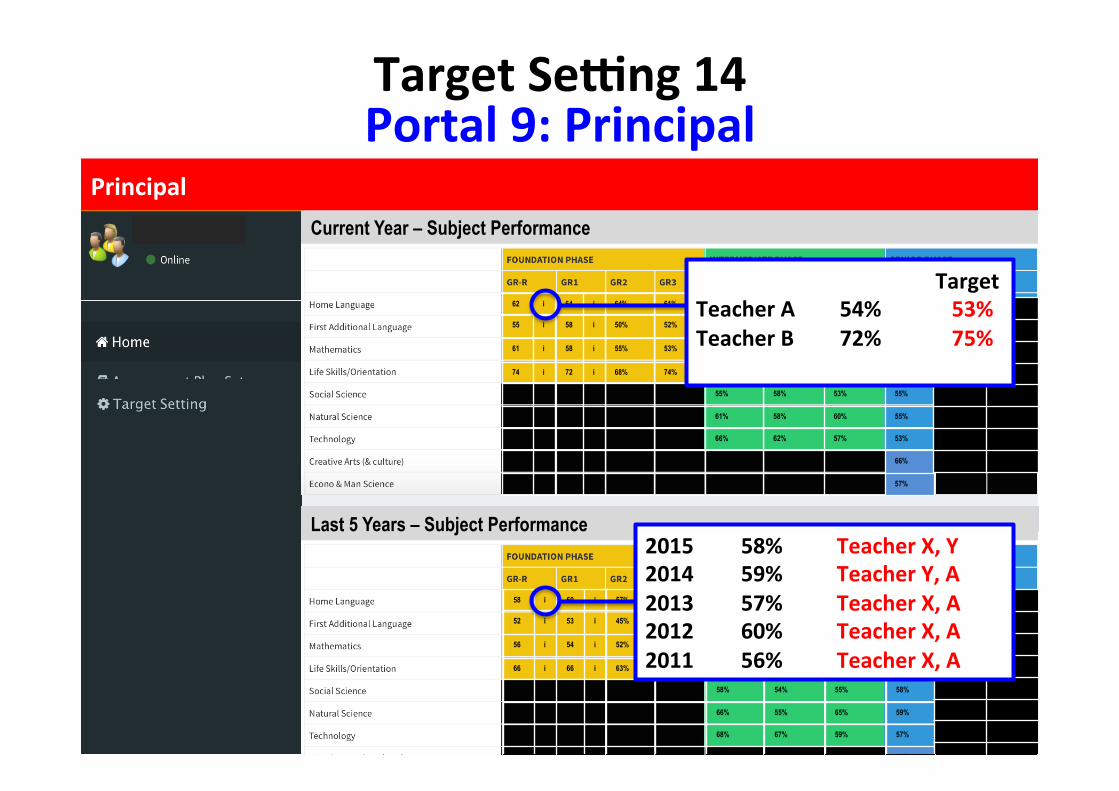
TargetSeMng14Portal9:Principal
Principal
TargetTeacherA 54% 53%TeacherB 72% 75%
2015 58% TeacherX,Y2014 59% TeacherY,A2013 57% TeacherX,A2012 60% TeacherX,A2011 56% TeacherX,A
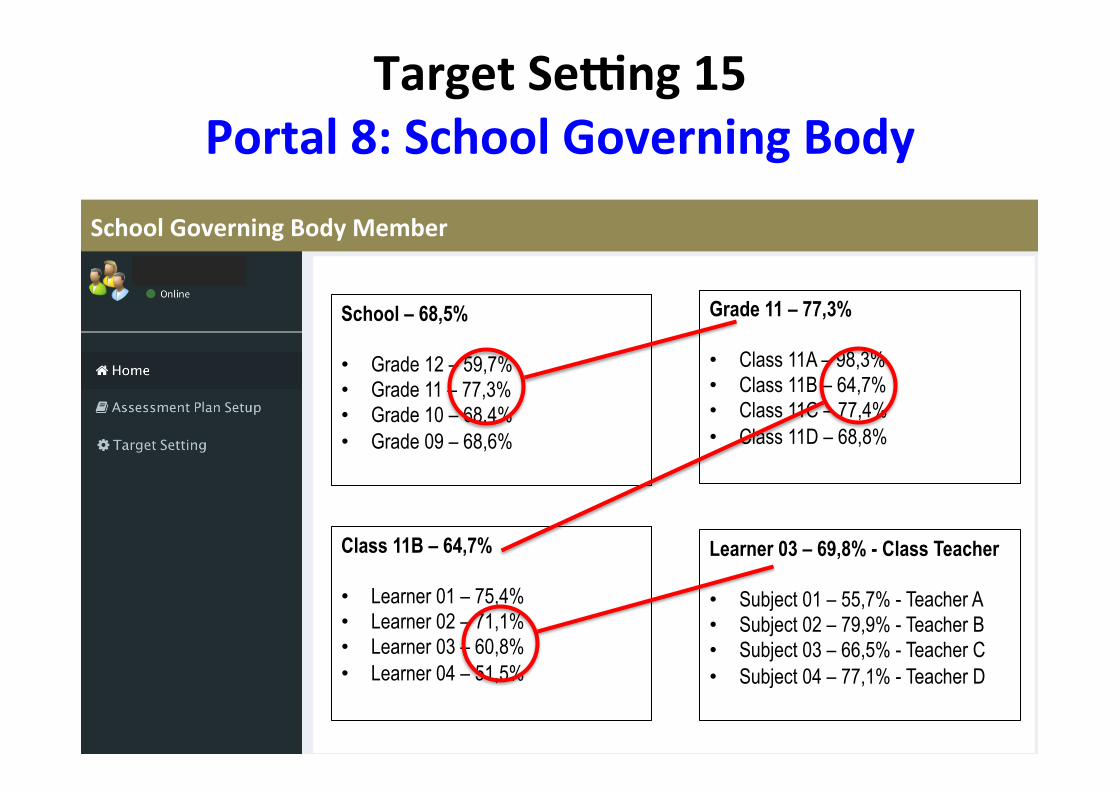
TargetSeMng15Portal8:SchoolGoverningBody
SchoolGoverningBodyMember
School – 68,5% • Grade 12 – 59,7% • Grade 11 – 77,3% • Grade 10 – 68,4% • Grade 09 – 68,6%
Grade 11 – 77,3% • Class 11A – 98,3% • Class 11B – 64,7% • Class 11C – 77,4% • Class 11D – 68,8%
Class 11B – 64,7% • Learner 01 – 75,4% • Learner 02 – 71,1% • Learner 03 – 60,8% • Learner 04 – 51,5%
Learner 03 – 69,8% - Class Teacher • Subject 01 – 55,7% - Teacher A • Subject 02 – 79,9% - Teacher B • Subject 03 – 66,5% - Teacher C • Subject 04 – 77,1% - Teacher D
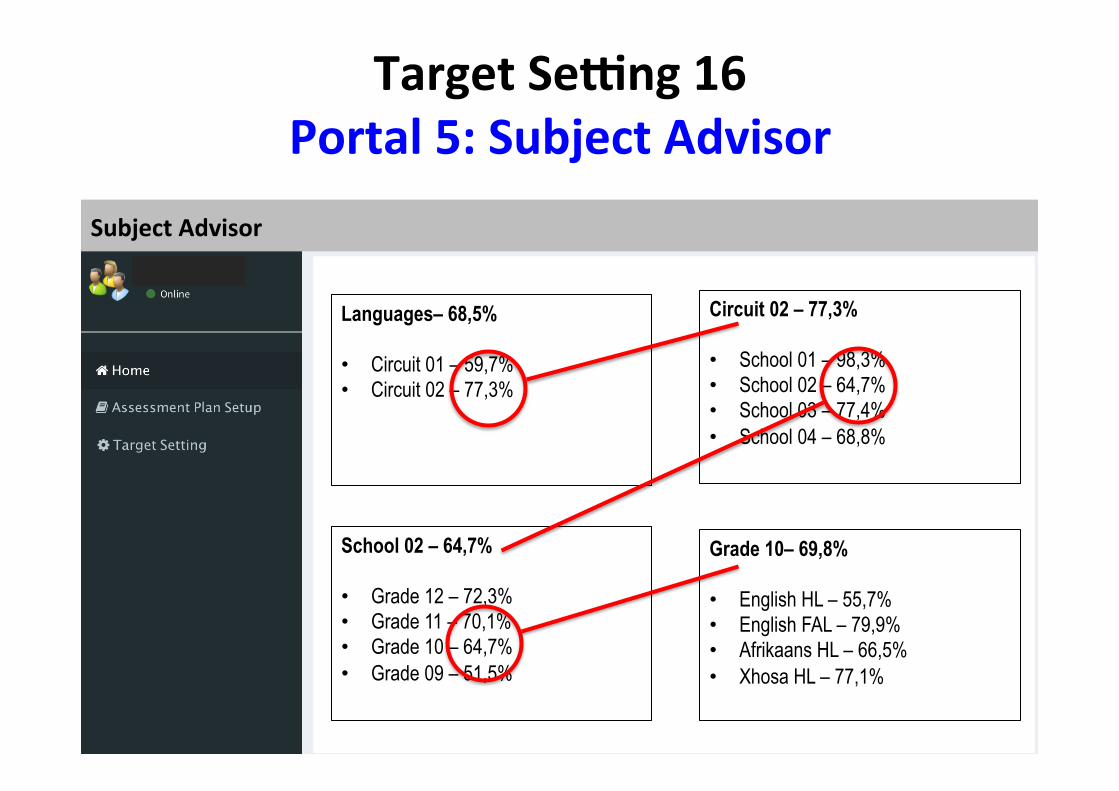
TargetSeMng16Portal5:SubjectAdvisor
SubjectAdvisor
Languages– 68,5% • Circuit 01 – 59,7% • Circuit 02 – 77,3%
Circuit 02 – 77,3% • School 01 – 98,3% • School 02 – 64,7% • School 03 – 77,4% • School 04 – 68,8%
School 02 – 64,7% • Grade 12 – 72,3% • Grade 11 – 70,1% • Grade 10 – 64,7% • Grade 09 – 51,5%
Grade 10– 69,8% • English HL – 55,7% • English FAL – 79,9% • Afrikaans HL – 66,5% • Xhosa HL – 77,1%
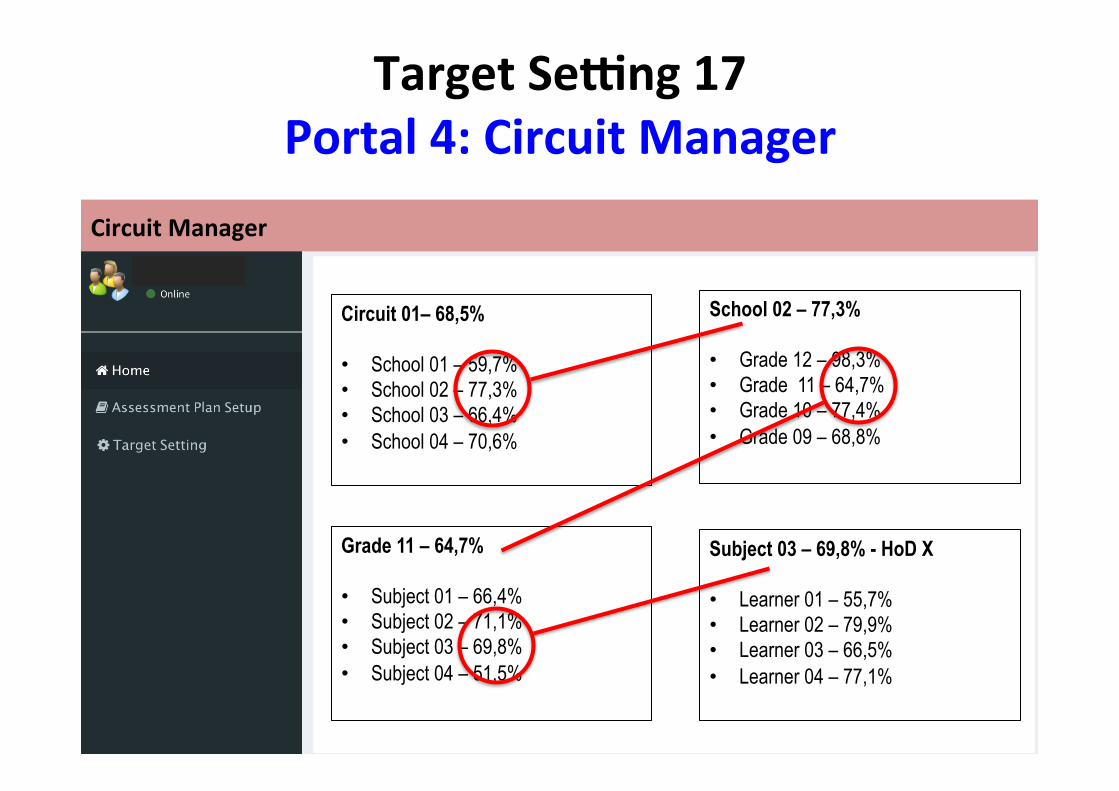
TargetSeMng17Portal4:CircuitManager
CircuitManager
Circuit 01– 68,5% • School 01 – 59,7% • School 02 – 77,3% • School 03 – 66,4% • School 04 – 70,6%
School 02 – 77,3% • Grade 12 – 98,3% • Grade 11 – 64,7% • Grade 10 – 77,4% • Grade 09 – 68,8%
Grade 11 – 64,7% • Subject 01 – 66,4% • Subject 02 – 71,1% • Subject 03 – 69,8% • Subject 04 – 51,5%
Subject 03 – 69,8% - HoD X • Learner 01 – 55,7% • Learner 02 – 79,9% • Learner 03 – 66,5% • Learner 04 – 77,1%

TargetSeMng17Portal3:DistrictCoordinator
District A – 68,5% • Circuit 01 – 59,7% • Circuit 02 – 77,3% • Circuit 03 – 67,9% • Circuit 04 – 69,1%
Circuit 02 – 77,3% • School 01 – 98,3% • School 02 – 64,7% • School 03 – 77,4% • School 04 – 68,8%
School 02 – 64,7% • Grade 12 – 75,4% • Grade 11 – 71,1% • Grade 10 – 60,8% • Grade 09 – 51,5%
Grade 10 – 69,8% - Grade Teacher • Subject 01 – 55,7% • Subject 02 – 79,9% • Subject 03 – 66,5% • Subject 04– 77,1%
DistrictCoordinator
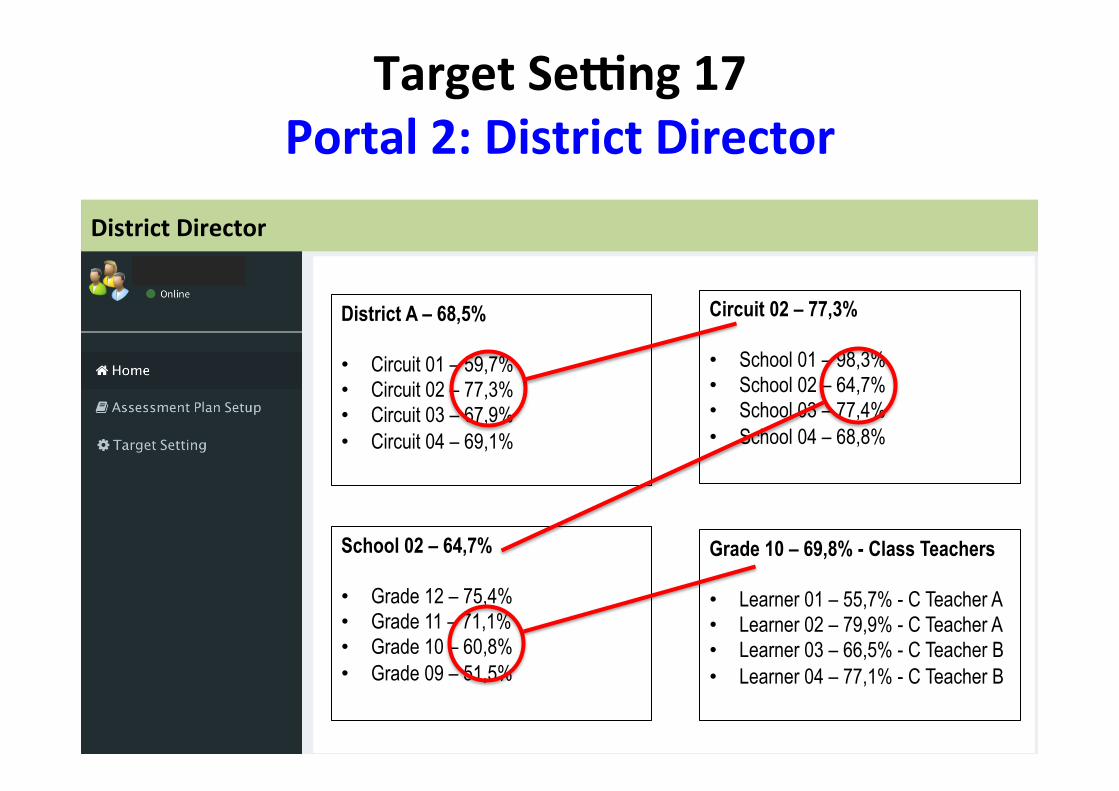
TargetSeMng17Portal2:DistrictDirector
DistrictDirector
District A – 68,5% • Circuit 01 – 59,7% • Circuit 02 – 77,3% • Circuit 03 – 67,9% • Circuit 04 – 69,1%
Circuit 02 – 77,3% • School 01 – 98,3% • School 02 – 64,7% • School 03 – 77,4% • School 04 – 68,8%
School 02 – 64,7% • Grade 12 – 75,4% • Grade 11 – 71,1% • Grade 10 – 60,8% • Grade 09 – 51,5%
Grade 10 – 69,8% - Class Teachers • Learner 01 – 55,7% - C Teacher A • Learner 02 – 79,9% - C Teacher A • Learner 03 – 66,5% - C Teacher B • Learner 04 – 77,1% - C Teacher B
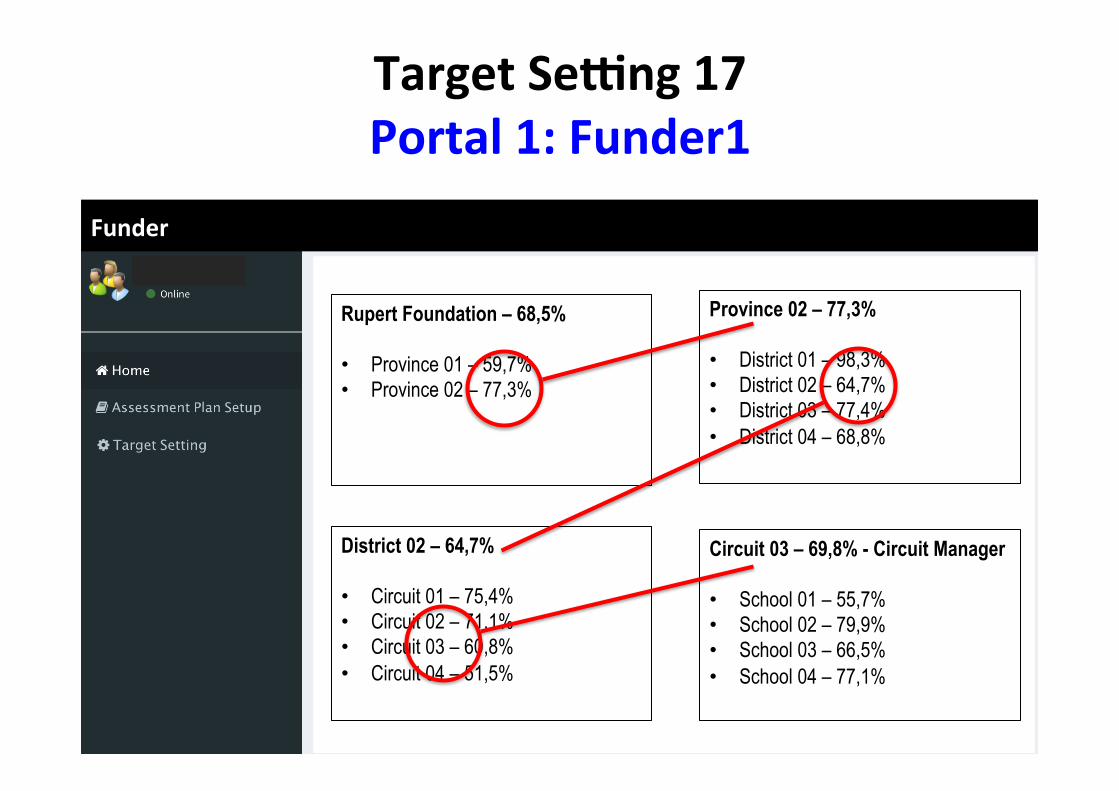
TargetSeMng17Portal1:Funder1
Funder
Rupert Foundation – 68,5% • Province 01 – 59,7% • Province 02 – 77,3%
Province 02 – 77,3% • District 01 – 98,3% • District 02 – 64,7% • District 03 – 77,4% • District 04 – 68,8%
District 02 – 64,7% • Circuit 01 – 75,4% • Circuit 02 – 71,1% • Circuit 03 – 60,8% • Circuit 04 – 51,5%
Circuit 03 – 69,8% - Circuit Manager • School 01 – 55,7% • School 02 – 79,9% • School 03 – 66,5% • School 04 – 77,1%
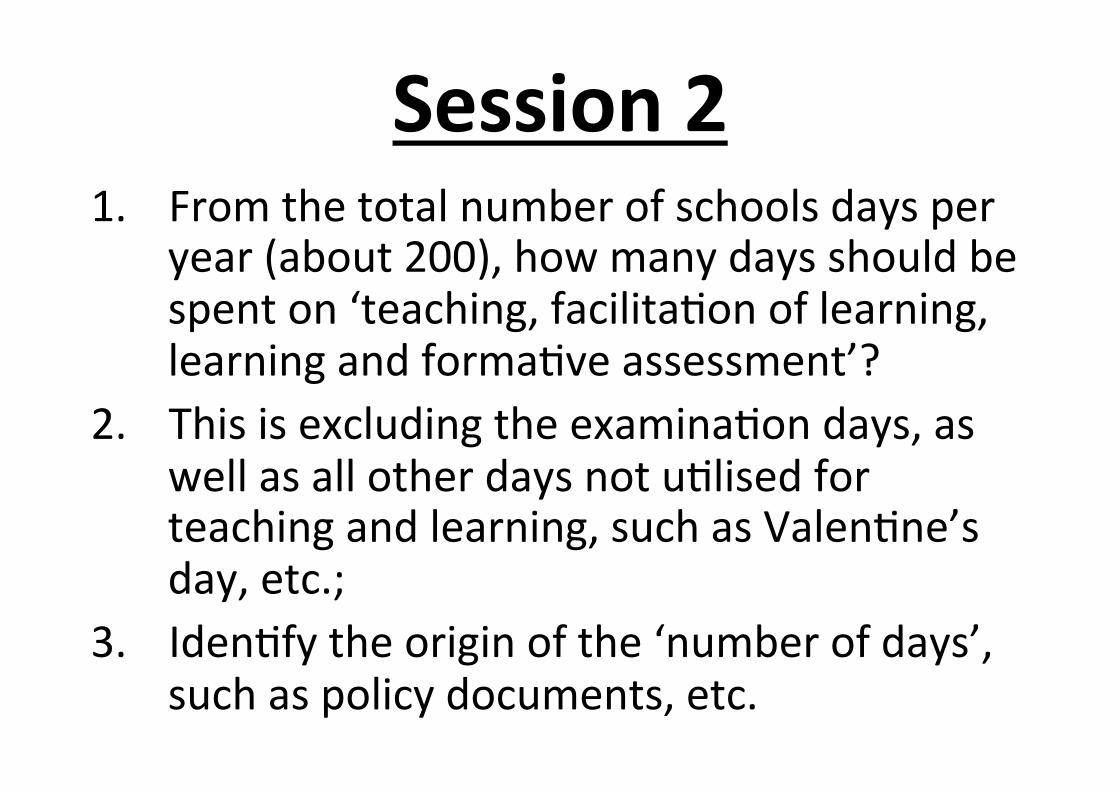
Session21. Fromthetotalnumberofschoolsdaysper
year(about200),howmanydaysshouldbespenton‘teaching,facilitaConoflearning,learningandformaCveassessment’?
2. ThisisexcludingtheexaminaCondays,aswellasallotherdaysnotuClisedforteachingandlearning,suchasValenCne’sday,etc.;
3. IdenCfytheoriginofthe‘numberofdays’,suchaspolicydocuments,etc.
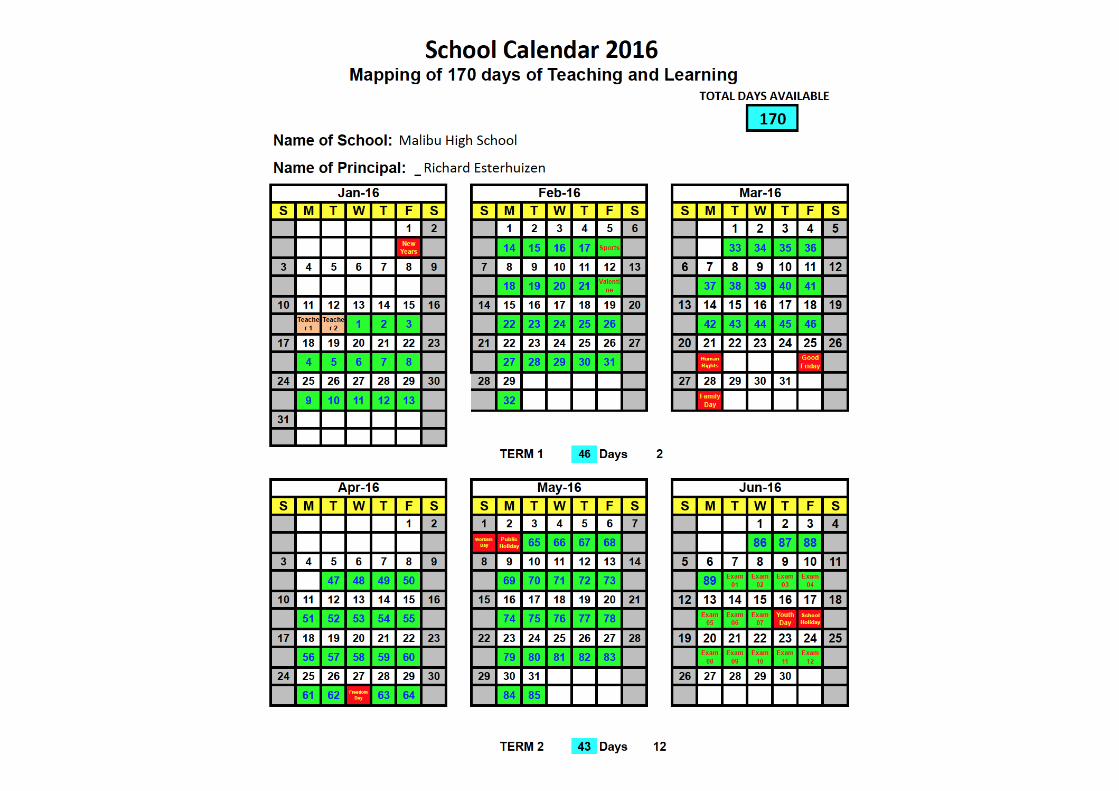
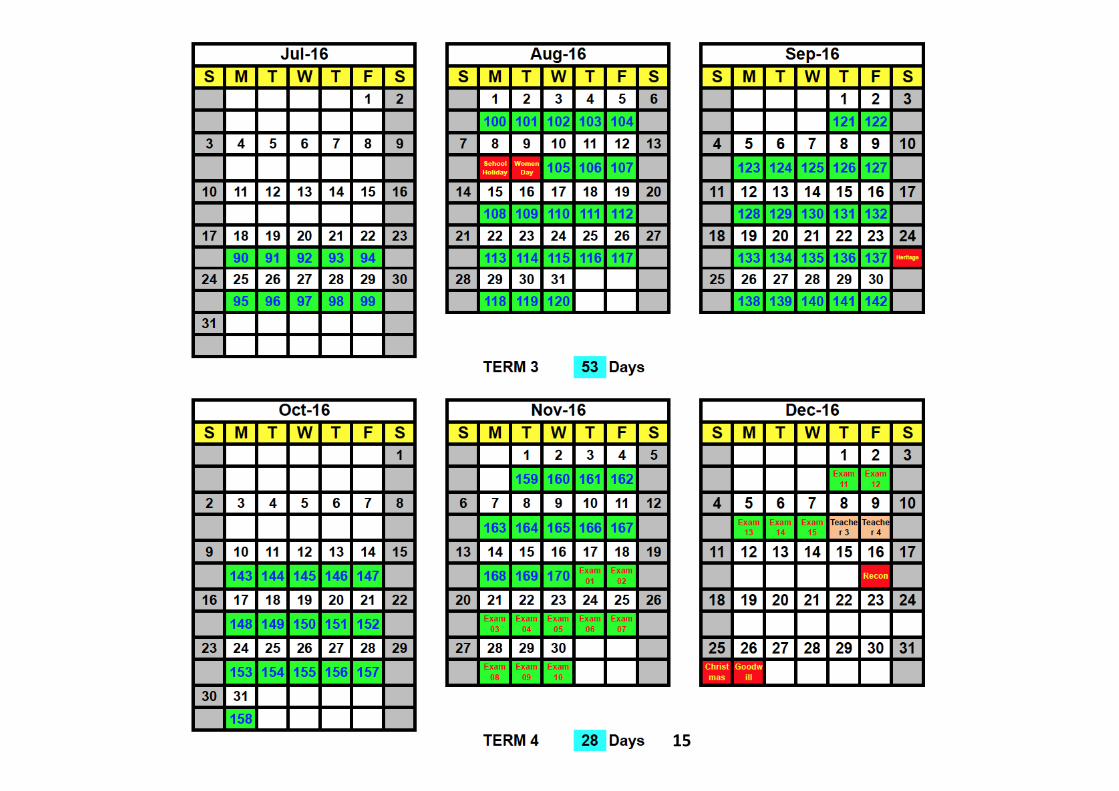
170DAYSOFTEACHING
ANDLEARNING
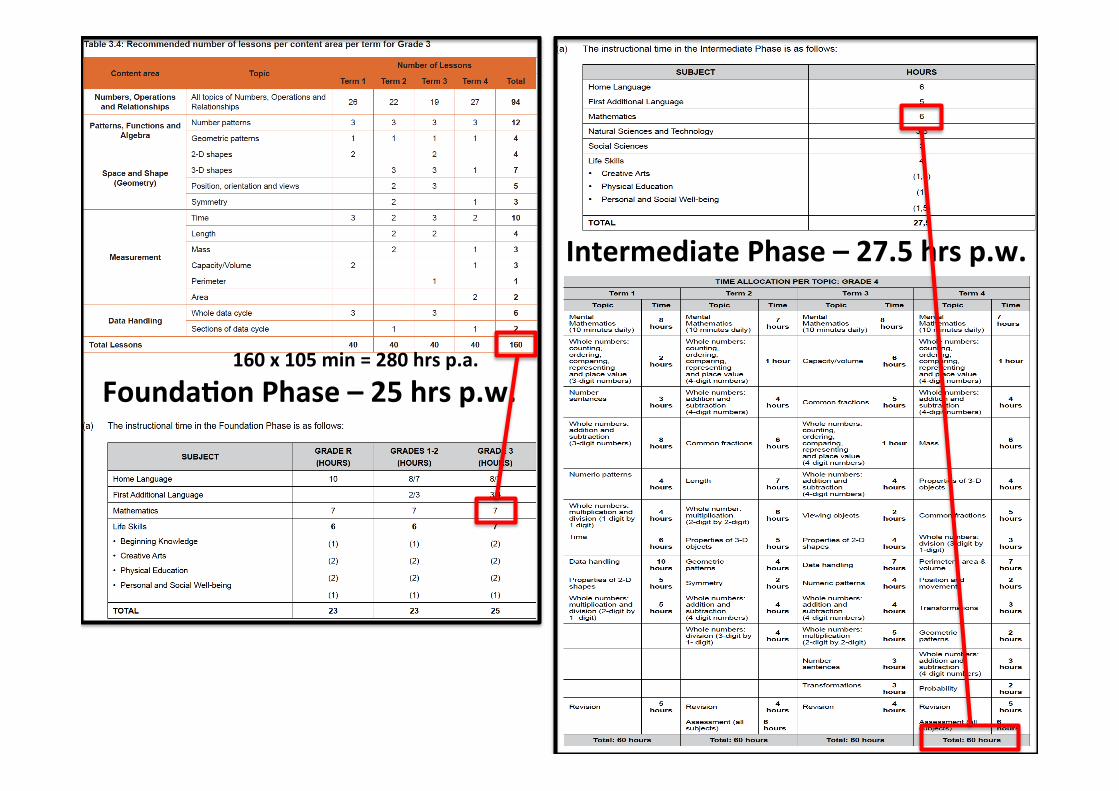
FoundaLonPhase–25hrsp.w.
IntermediatePhase–27.5hrsp.w.
160x105min=280hrsp.a.
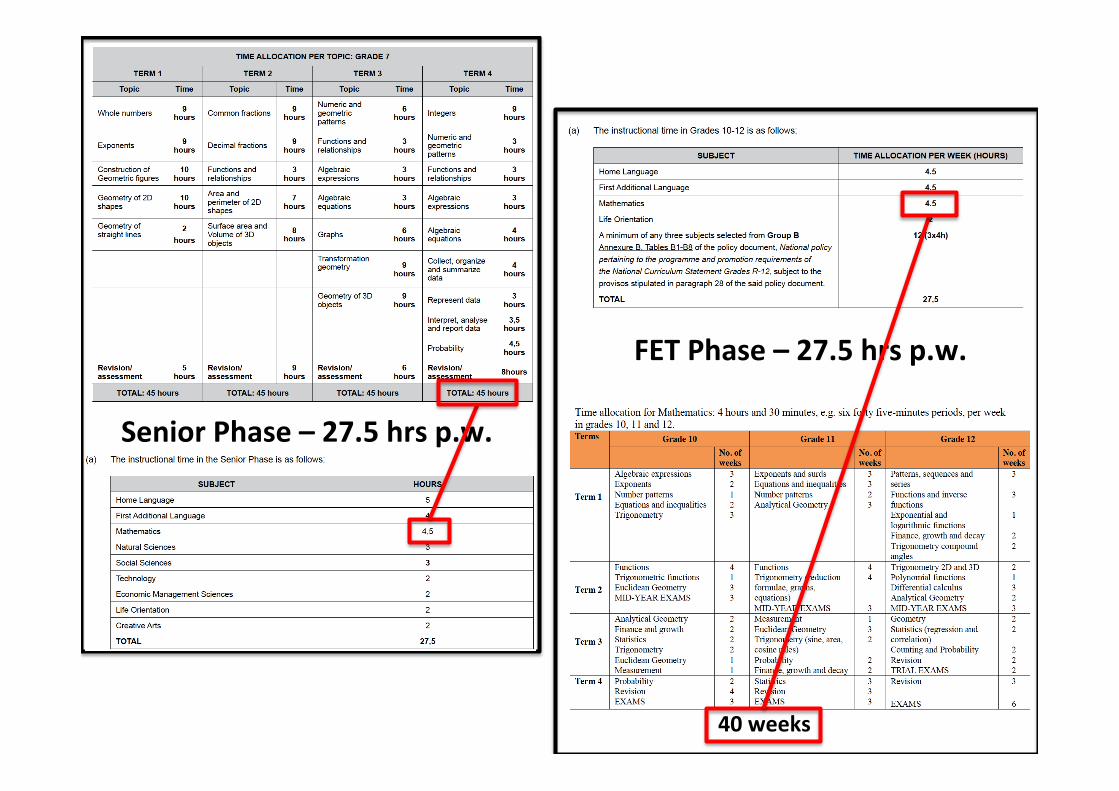
SeniorPhase–27.5hrsp.w.
FETPhase–27.5hrsp.w.
40weeks
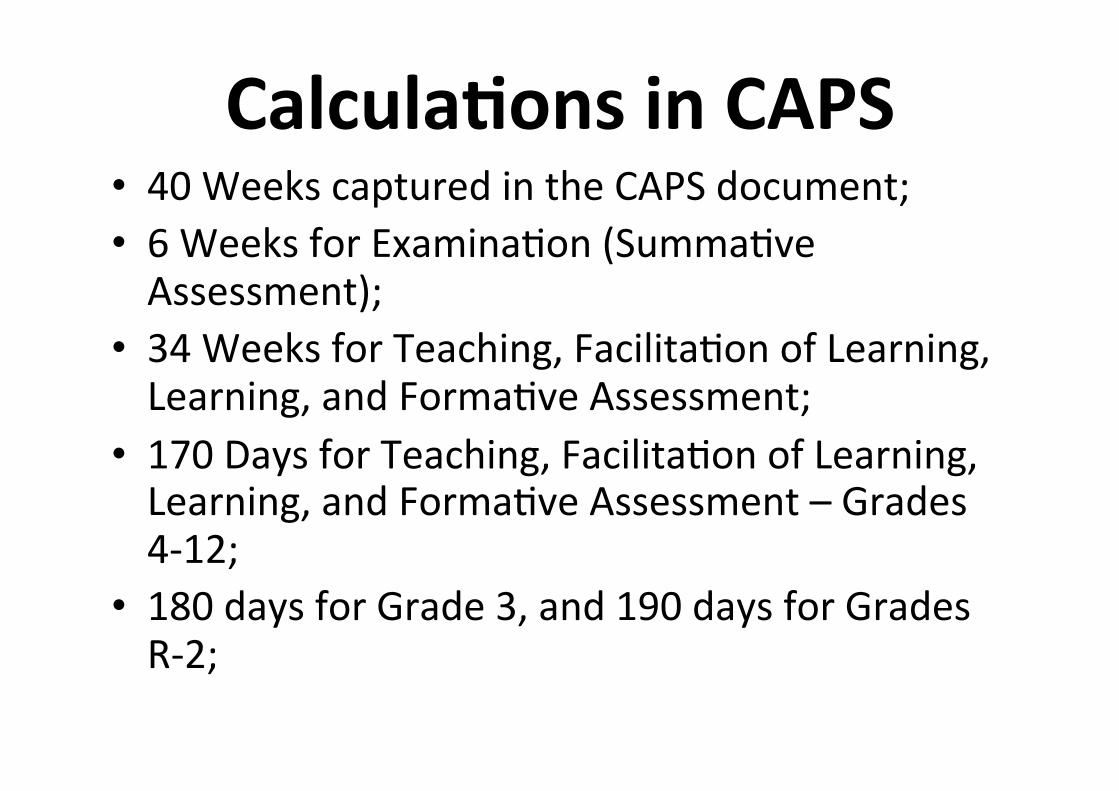
• 40WeekscapturedintheCAPSdocument;• 6WeeksforExaminaCon(SummaCveAssessment);
• 34WeeksforTeaching,FacilitaConofLearning,Learning,andFormaCveAssessment;
• 170DaysforTeaching,FacilitaConofLearning,Learning,andFormaCveAssessment–Grades4-12;
• 180daysforGrade3,and190daysforGradesR-2;
CalculaLonsinCAPS
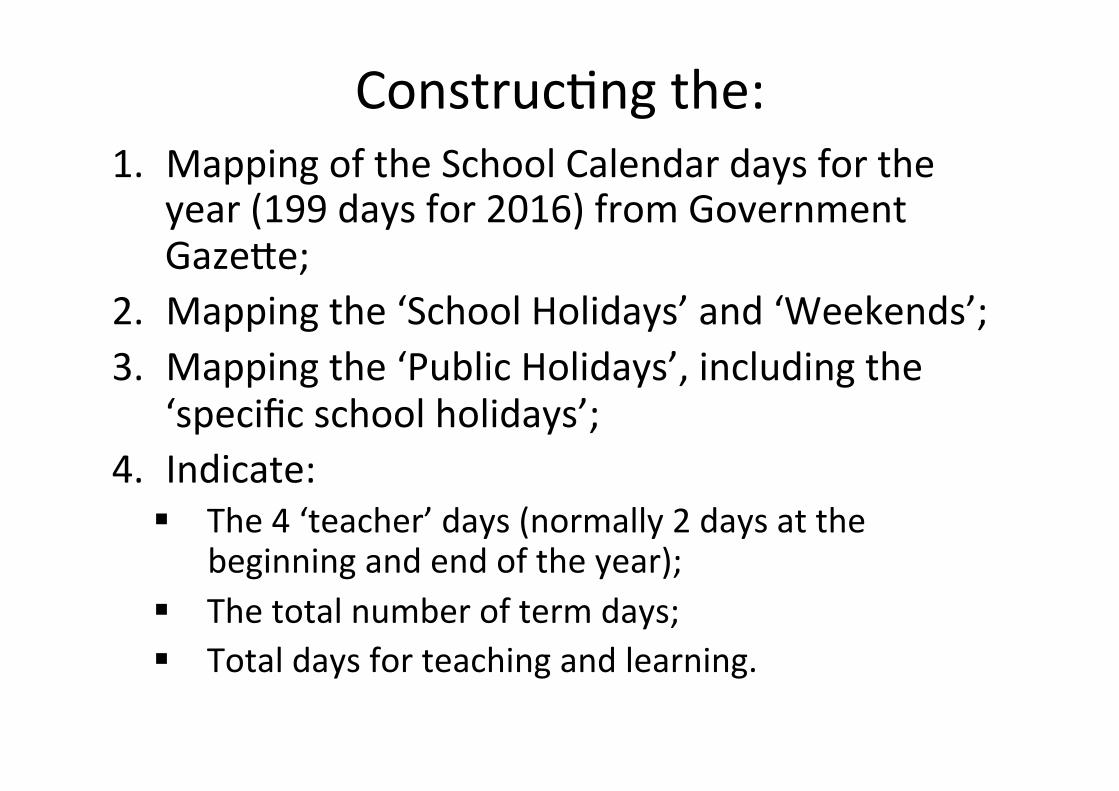
ConstrucCngthe:1. MappingoftheSchoolCalendardaysforthe
year(199daysfor2016)fromGovernmentGazehe;
2. Mappingthe‘SchoolHolidays’and‘Weekends’;3. Mappingthe‘PublicHolidays’,includingthe
‘specificschoolholidays’;4. Indicate:
§ The4‘teacher’days(normally2daysatthebeginningandendoftheyear);
§ Thetotalnumberoftermdays;§ Totaldaysforteachingandlearning.
34
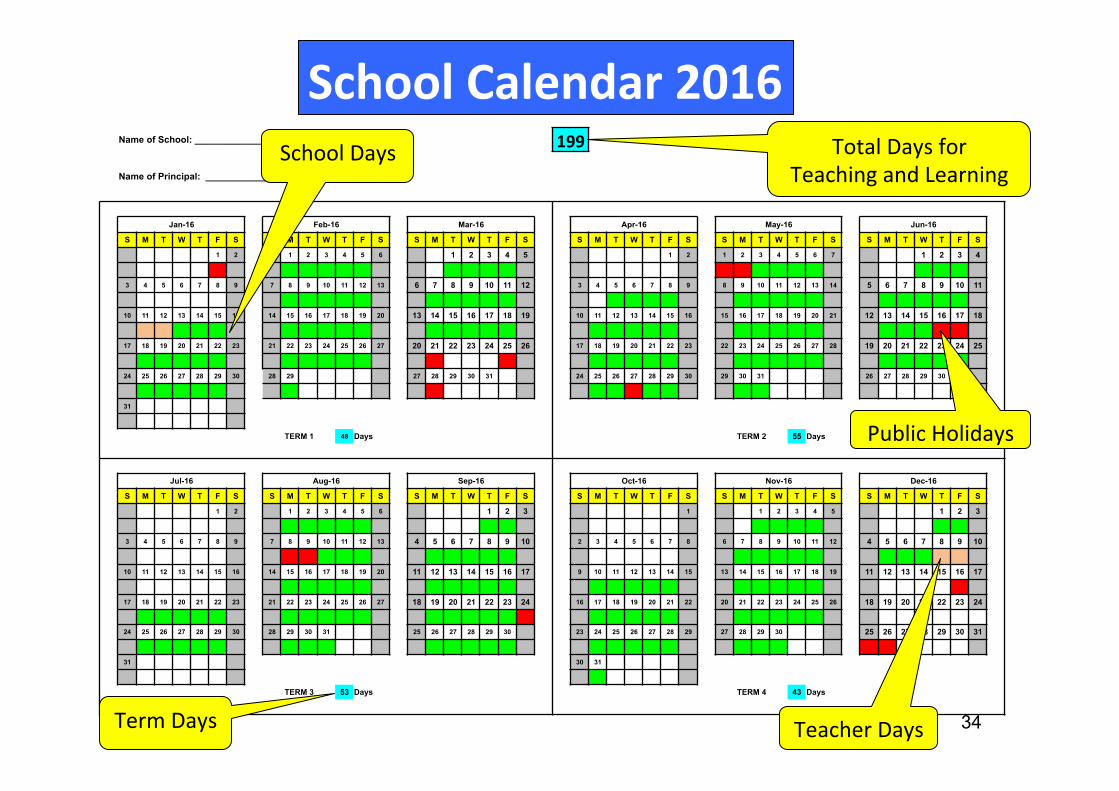
SchoolCalendar2016Name of School: ______________________________________ 199
Name of Principal: ____________________________________
Jan-16 Feb-16 Mar-16 Apr-16 May-16 Jun-16
S M T W T F S S M T W T F S S M T W T F S S M T W T F S S M T W T F S S M T W T F S
1 2 1 2 3 4 5 6 1 2 3 4 5 1 2 1 2 3 4 5 6 7 1 2 3 4
1 1 1 1 1 1 1 1 1 1 1 1 1 1 1 1
3 4 5 6 7 8 9 7 8 9 10 11 12 13 6 7 8 9 10 11 12 3 4 5 6 7 8 9 8 9 10 11 12 13 14 5 6 7 8 9 10 11
1 1 1 1 1 1 1 1 1 1 1 1 1 1 1 1 1 1 1 1 1 1 1 1
10 11 12 13 14 15 16 14 15 16 17 18 19 20 13 14 15 16 17 18 19 10 11 12 13 14 15 16 15 16 17 18 19 20 21 12 13 14 15 16 17 18
1 1 1 1 1 1 1 1 1 1 1 1 1 1 1 1 1 1 1 1 1 1 1 1 1 1
17 18 19 20 21 22 23 21 22 23 24 25 26 27 20 21 22 23 24 25 26 17 18 19 20 21 22 23 22 23 24 25 26 27 28 19 20 21 22 23 24 25
1 1 1 1 1 1 1 1 1 1 1 1 1 1 1 1 1 1 1 1 1 1 1 1 1
24 25 26 27 28 29 30 28 29 27 28 29 30 31 24 25 26 27 28 29 30 29 30 31 26 27 28 29 30
1 1 1 1 1 1 1 1 1 1 1 1
31
TERM 1 48 Days TERM 2 55 Days
Jul-16 Aug-16 Sep-16 Oct-16 Nov-16 Dec-16
S M T W T F S S M T W T F S S M T W T F S S M T W T F S S M T W T F S S M T W T F S
1 2 1 2 3 4 5 6 1 2 3 1 1 2 3 4 5 1 2 3
1 1 1 1 1 1 1 1 1 1 1 1 1
3 4 5 6 7 8 9 7 8 9 10 11 12 13 4 5 6 7 8 9 10 2 3 4 5 6 7 8 6 7 8 9 10 11 12 4 5 6 7 8 9 10
1 1 1 1 1 1 1 1 1 1 1 1 1 1 1 1
10 11 12 13 14 15 16 14 15 16 17 18 19 20 11 12 13 14 15 16 17 9 10 11 12 13 14 15 13 14 15 16 17 18 19 11 12 13 14 15 16 17
1 1 1 1 1 1 1 1 1 1 1 1 1 1 1 1 1 1 1 1
17 18 19 20 21 22 23 21 22 23 24 25 26 27 18 19 20 21 22 23 24 16 17 18 19 20 21 22 20 21 22 23 24 25 26 18 19 20 21 22 23 24
1 1 1 1 1 1 1 1 1 1 1 1 1 1 1 1 1 1 1 1 1 1 1 1 1
24 25 26 27 28 29 30 28 29 30 31 25 26 27 28 29 30 23 24 25 26 27 28 29 27 28 29 30 25 26 27 28 29 30 31
1 1 1 1 1 1 1 1 1 1 1 1 1 1 1 1 1 1 1 1 1
31 30 31
1
TERM 3 53 Days TERM 4 43 Days
TotalDaysforTeachingandLearning
PublicHolidays
TeacherDays
SchoolDays
TermDays

Step1-Mapping:• TheprincipalsmustconsulttheSLTandSMT,andthenmap:
– Theschoolspecificusageofthe29daysbyprioriCsing:• TheexaminaCondays(12daysforJuneand15daysforDecember);• UClisetheother2daysforsport,andotherdayssuchasValenCne,etc.;
• ThiswillbemappedinOctober(duringthe4thterm);• CircuitmanagerscruCnisethedays,andadviseand/oragreeto
the170days;• Documentgetsprintedout,andwillbesignedbythePrincipal,
CircuitManagerandDistrictDirector;• OnthePrincipal’sportal,the170dayswillappearonthe
‘dashboard’,aswellasontheCircuitManager(willhavealltheschoolsresponsiblefor),andtheDistrictDirector(alltheschoolsinthedistrict);
• AllthreeatmanageriallevelwillnowproacCvelyknowandmanageeverydayofthe170daystoensuretheprotecConofthesedays;
15

Step2-Monitoring:• Thespecific170daysforteachingandlearningareknowntoall,andtheseareexpectedtobeprotecteddaily;
• Eachdayismadeupofthe‘Cmetablecomponents’(totalnumberofperiodsoverallthegradesandclasses),whichwillbe‘morethantheperiodsnumberifthereare‘spiltperiods’(aperiodtaughtbymorethanoneteacher);
• Eachperiodmustbetaughtbytheteachers,meaningnoabsenteeismfortheday,inordertoleadto‘100%fortheday’;
• Whenperiodsare‘lost’,duetowhateverreason,theprincipalmustplanhowtheseperiodswillbe‘madeup’,sincetheywilldisplayagainstthe‘learners’as‘lostperiods’;
• When‘periodslost’addupto100%,thesystemwilldisplayitas‘adaylost’.

TimetableoftheSchool50componentsforMonday,
assumingonepersonperperiod.53componentsforTuesday,becauseindividualperiodsarecountedduring‘doubleperiods’.
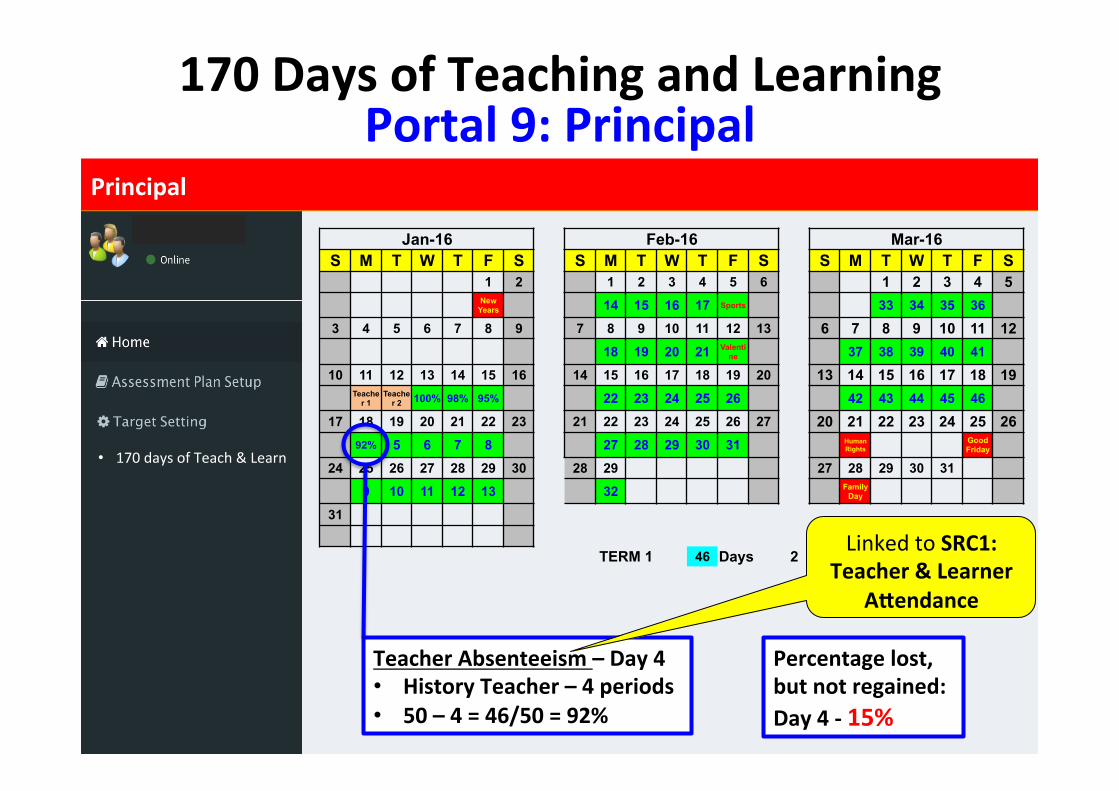
170DaysofTeachingandLearningPortal9:Principal
Principal
TeacherAbsenteeism–Day4
• HistoryTeacher–4periods• 50–4=46/50=92%
Percentagelost,butnotregained:Day4-15%
• 170daysofTeach&Learn
Jan-16 Feb-16 Mar-16 S M T W T F S S M T W T F S S M T W T F S 1 2 1 2 3 4 5 6 1 2 3 4 5 New
Years 14 15 16 17 Sports 33 34 35 36 3 4 5 6 7 8 9 7 8 9 10 11 12 13 6 7 8 9 10 11 12 18 19 20 21 Valenti
ne 37 38 39 40 41 10 11 12 13 14 15 16 14 15 16 17 18 19 20 13 14 15 16 17 18 19 Teache
r 1 Teache
r 2 100% 98% 95% 22 23 24 25 26 42 43 44 45 46 17 18 19 20 21 22 23 21 22 23 24 25 26 27 20 21 22 23 24 25 26 92% 5 6 7 8 27 28 29 30 31 Human
Rights Good Friday
24 25 26 27 28 29 30 28 29 27 28 29 30 31
9 10 11 12 13 32 Family Day
31
TERM 1 46 Days 2 LinkedtoSRC1:
Teacher&LearnerAiendance
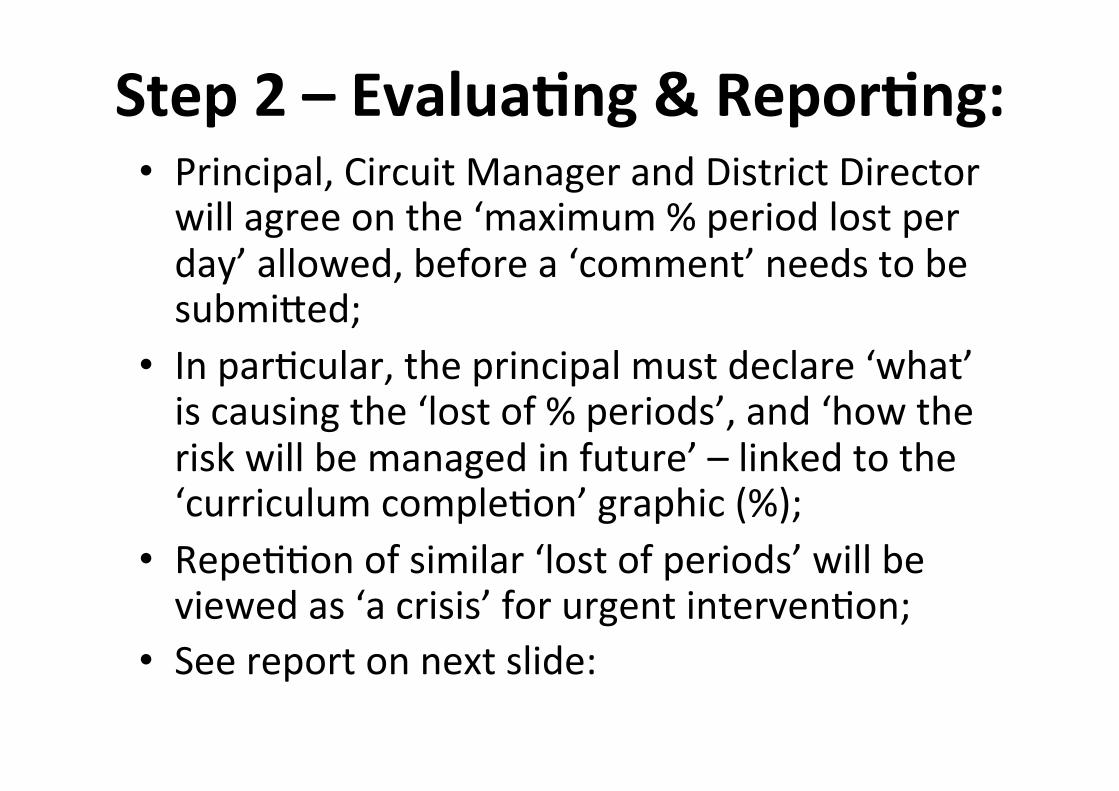
• Principal,CircuitManagerandDistrictDirectorwillagreeonthe‘maximum%periodlostperday’allowed,beforea‘comment’needstobesubmihed;
• InparCcular,theprincipalmustdeclare‘what’iscausingthe‘lostof%periods’,and‘howtheriskwillbemanagedinfuture’–linkedtothe‘curriculumcompleCon’graphic(%);
• RepeCConofsimilar‘lostofperiods’willbeviewedas‘acrisis’forurgentintervenCon;
• Seereportonnextslide:
Step2–EvaluaLng&ReporLng:

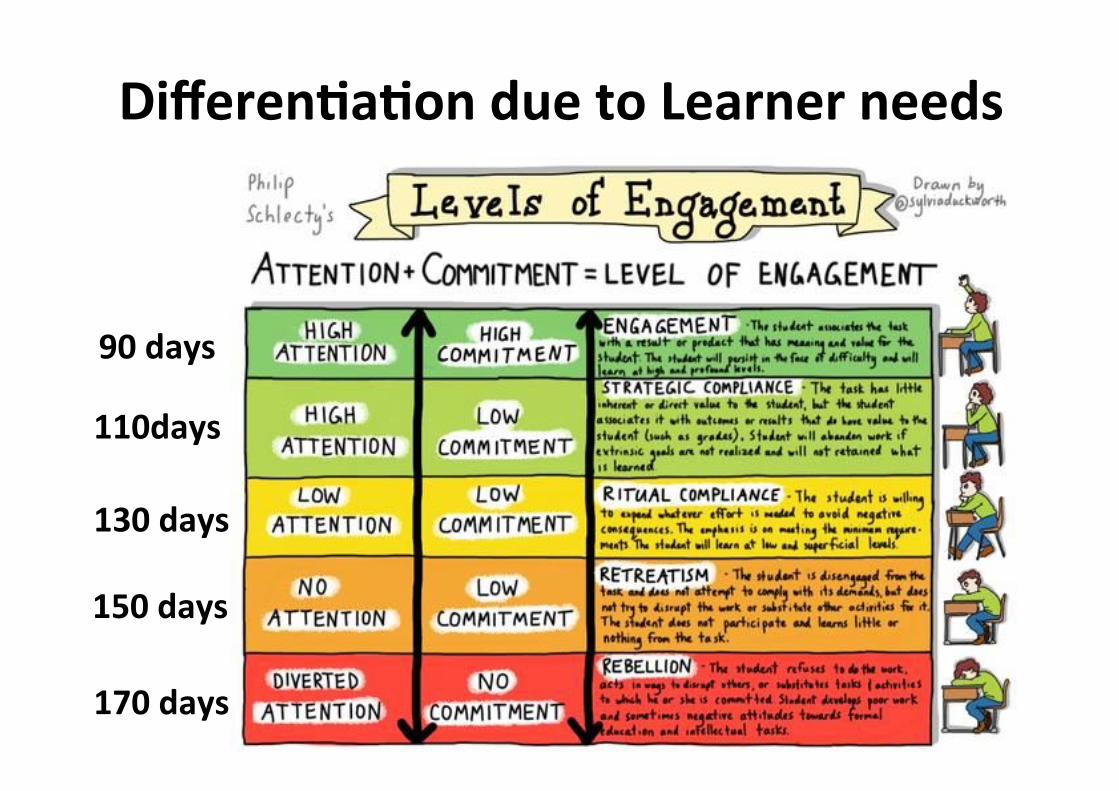
DifferenLaLonduetoLearnerneeds
170days
150days
130days
110days
90days
• Whenyouheartheword‘FinancialAccountabilityandTransparency’whatdoyouthinkitwillcover?Writedownafewword.
Session3

FinancialAccountabilityand
Transparency-SchoolSalaryAdvice-

60 School Quality Systems 1. Leadership 2. Strategic
Planning 3. Human Resource
4. Learning and Teaching
5. Assessment and Feedback
6. Data Monitoring and Evaluation
1.1 Leadership Process
2.1 Development Process
3.1 Work Allocation and Management
4.1 Learner Care Management
5.1 Core Competencies Determination
6.1 Info and Knowledge Design
1.2 Communication Effectiveness
2.2 Action Plan Formulation
3.2 Recruit, Hire, Place and Retain
4.2 Learner Knowledge Determination
5.2 Key Process Determination
6.2 Info and Knowledge Management Process
1.3 Governance Process
2.3 Resource Allocation
3.3 Professional Knowledge, Skills and Application
4.3 Learner Diversity Segmentation
5.3 Process Design and Development
6.3 Info and Knowledge Sharing
1.4 Governance Management
2.4 Resource Redirection
3.4 Professional Ethics, Values and Attributes
4.4 Learner Context Segmentation
5.4 Process Requirements Determination
6.4 Performance and Knowledge Measures and Analysis
1.5 Succession Planning
2.5 Sourcing Process
3.5 Professional Learning
4.5 Teaching Features Determination
5.5 Implementation Management
6.5 Performance, and Knowledge Selection and Use
1.6 Performance Process
2.6 Assumption Development
3.6 Career Progression
4.6 Learner and Teacher Relationship
5.6 Assessment Preparation
6.6 Data and Knowledge Analysis
1.7 Financial Accountability
2.7 Risk Assessment
3.7 Performance Management
4.7 Learner Complaints 5.7 Second Change System
6.7 Data and Knowledge Evaluation
1.8 Financial Transparency
2.8 Resource Commitment
3.8 Performance Review
4.8 Teacher Complaints 5.8 Learner Feedback Process
6.8 Target Setting Management
1.9 Priority Determination
2.9 Deployment Management
3.9 School Climate Assessment
4.9 Learner Satisfaction Determination
5.9 Teacher Feedback Process
6.9 Success Indicators and Comparison Building
1.10 Priority Decision-Making
2.10 Assessment Management
3.10 School Environment Improvement
4.10 Learner Expectation and Achievement
5.10 Parent Involvement Management
5.10 Data, Info and Knowledge Reliability
4618
Whatisthe‘average’costperteacher,perday,inyourschool?

40Staff
members
R1,148,765Divideby
40-----------R28,719Divideby20days=======R1,436
• 200/12 = 16,7 days
• 1800 hrs/8hrs p.d. = 225 days/12 =18,75 days
Shouldthe‘salary’ofteachersaffecttheir‘workload’duringworkallocaLon?
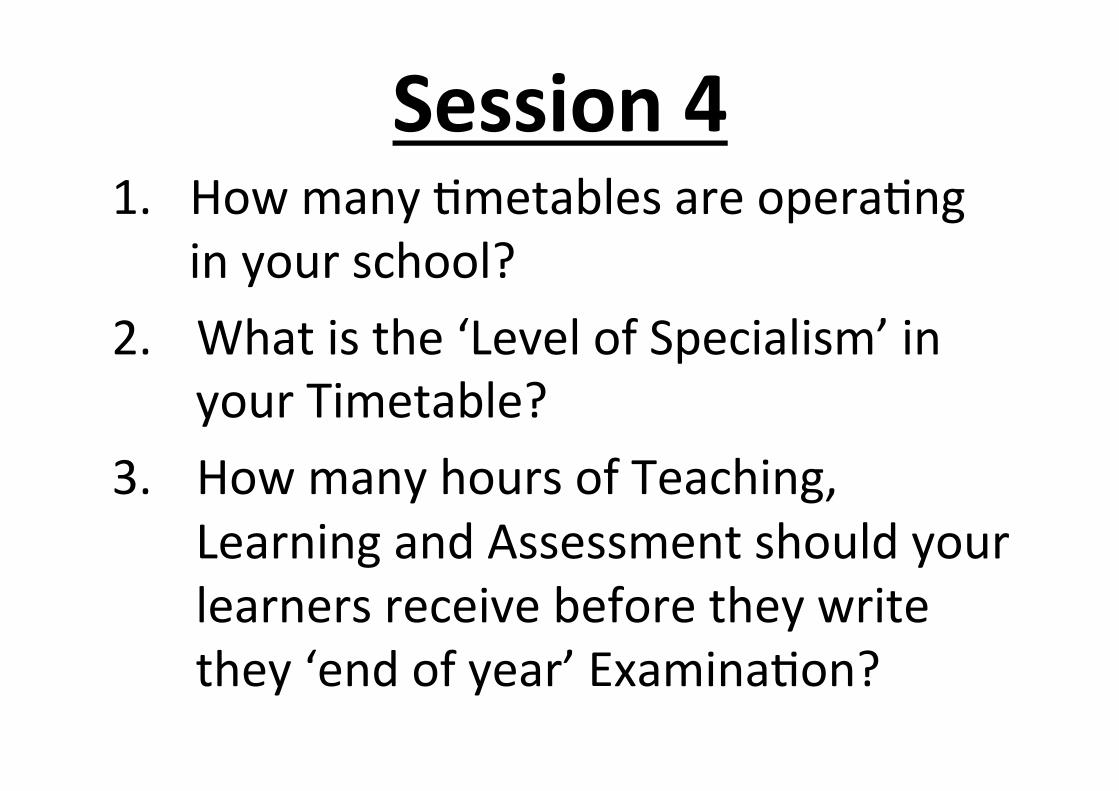
Session41. HowmanyCmetablesareoperaCng
inyourschool?2. Whatisthe‘LevelofSpecialism’in
yourTimetable?3. HowmanyhoursofTeaching,
LearningandAssessmentshouldyourlearnersreceivebeforetheywritethey‘endofyear’ExaminaCon?

TimetableEvaluaLonand
ProcessManagement
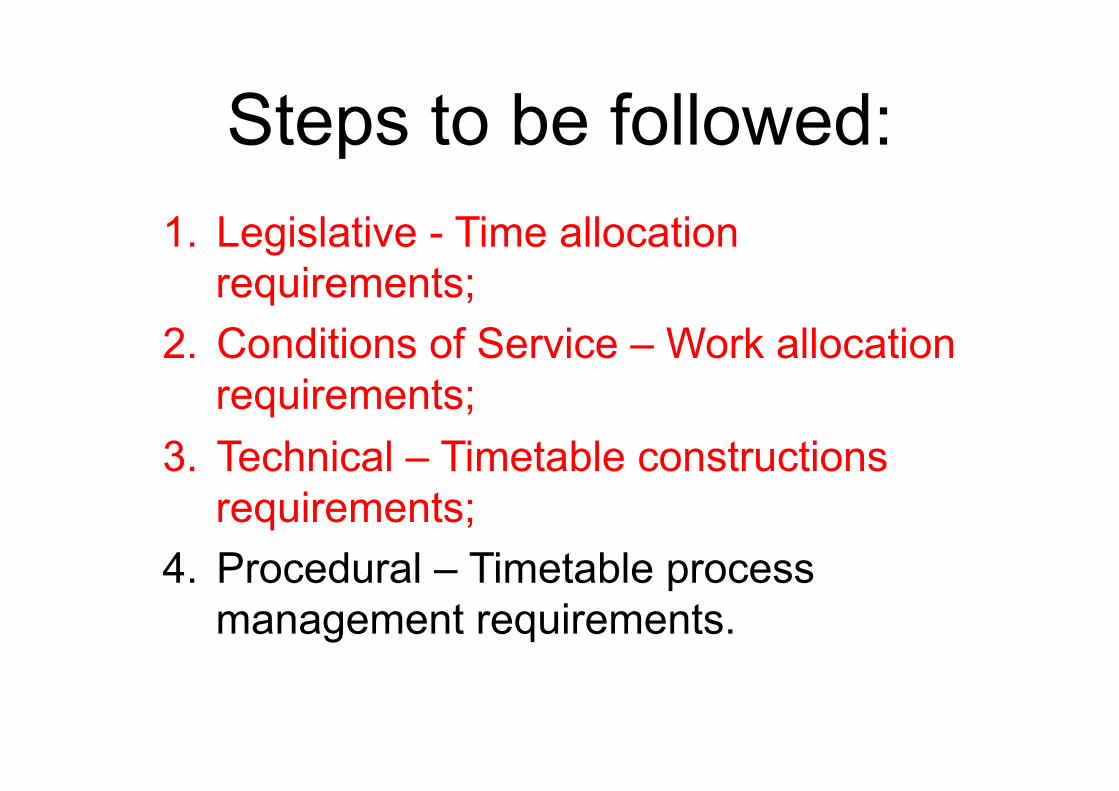
Steps to be followed: 1. Legislative - Time allocation
requirements; 2. Conditions of Service – Work allocation
requirements; 3. Technical – Timetable constructions
requirements; 4. Procedural – Timetable process
management requirements.
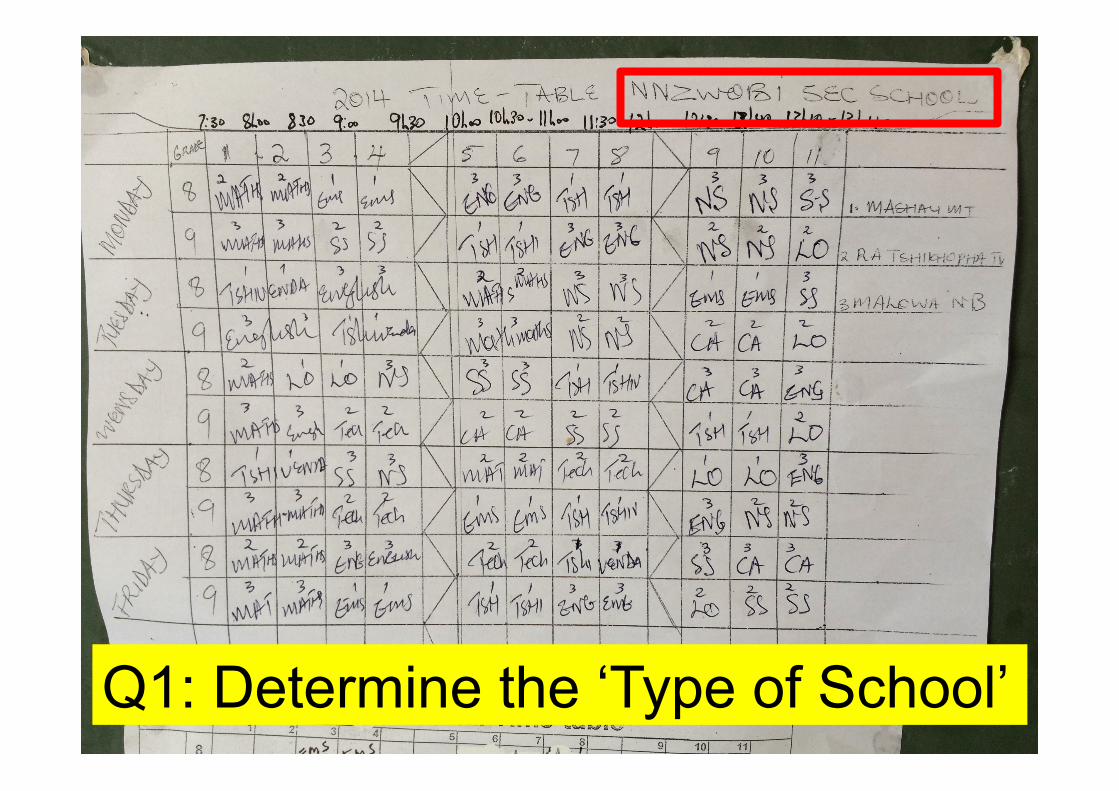
Q1: Determine the ‘Type of School’
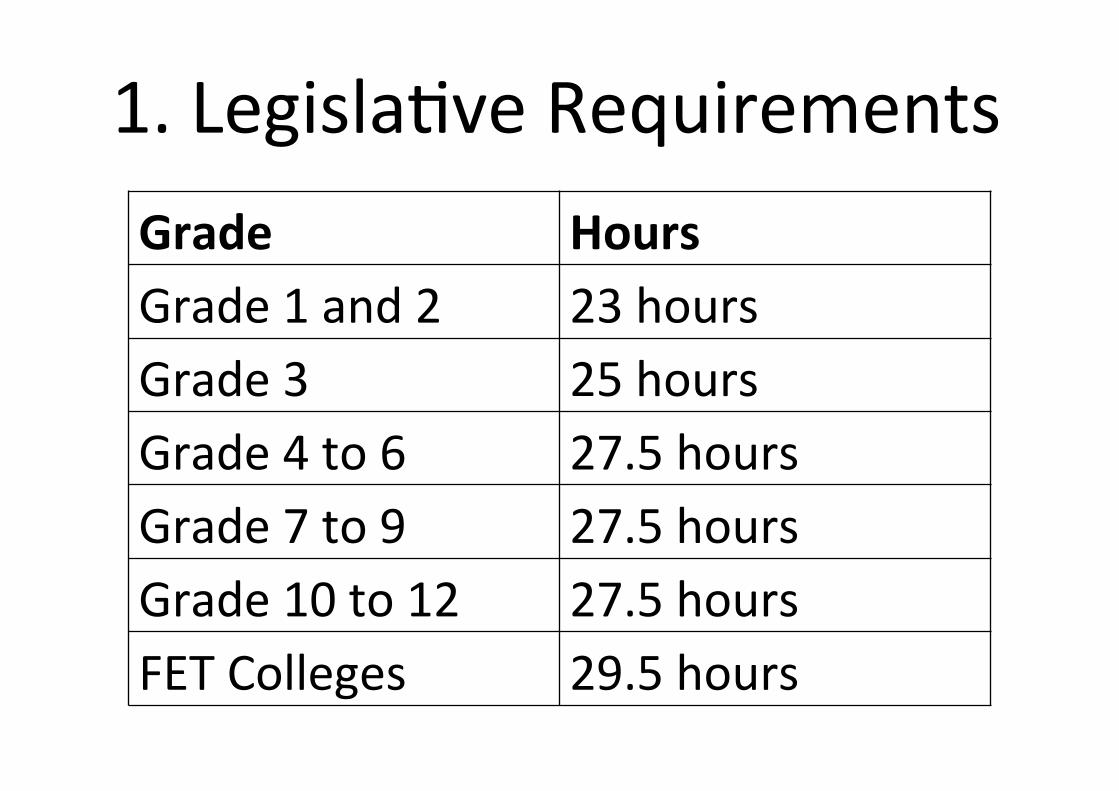
1.LegislaCveRequirementsGrade HoursGrade1and2 23hoursGrade3 25hoursGrade4to6 27.5hoursGrade7to9 27.5hoursGrade10to12 27.5hoursFETColleges 29.5hours
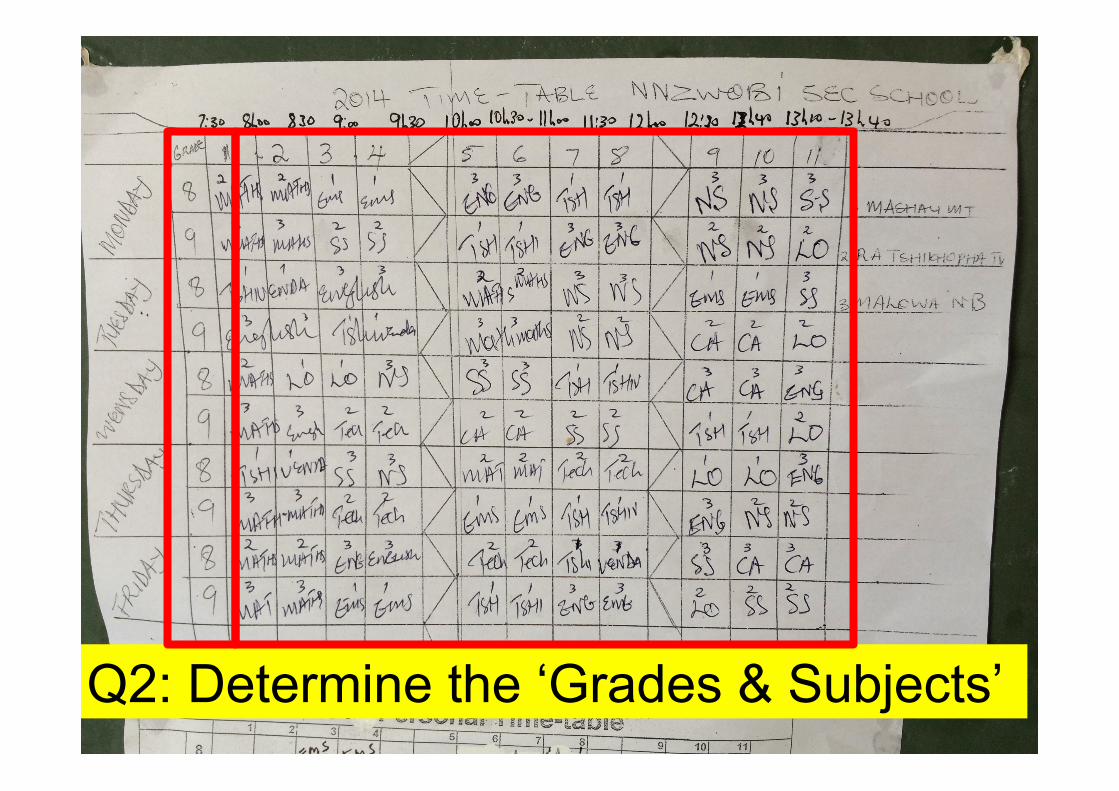
Q2: Determine the ‘Grades & Subjects’
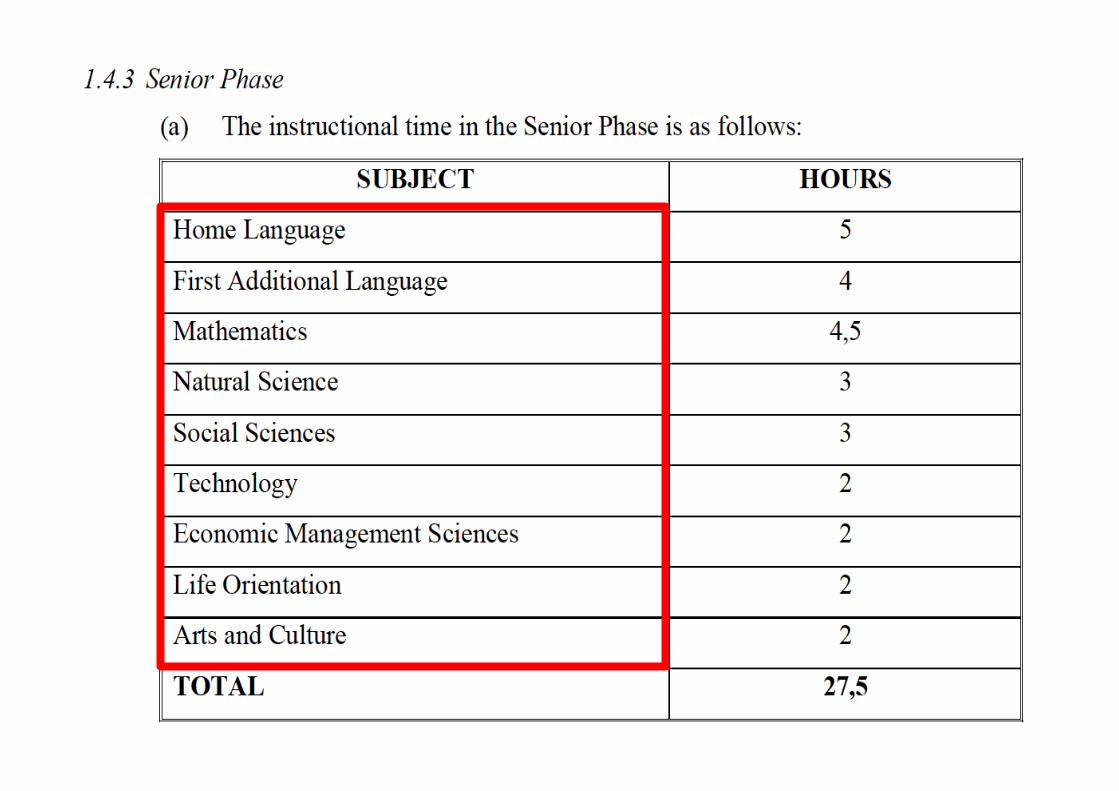

Q3: Determine the ‘T&L Time’
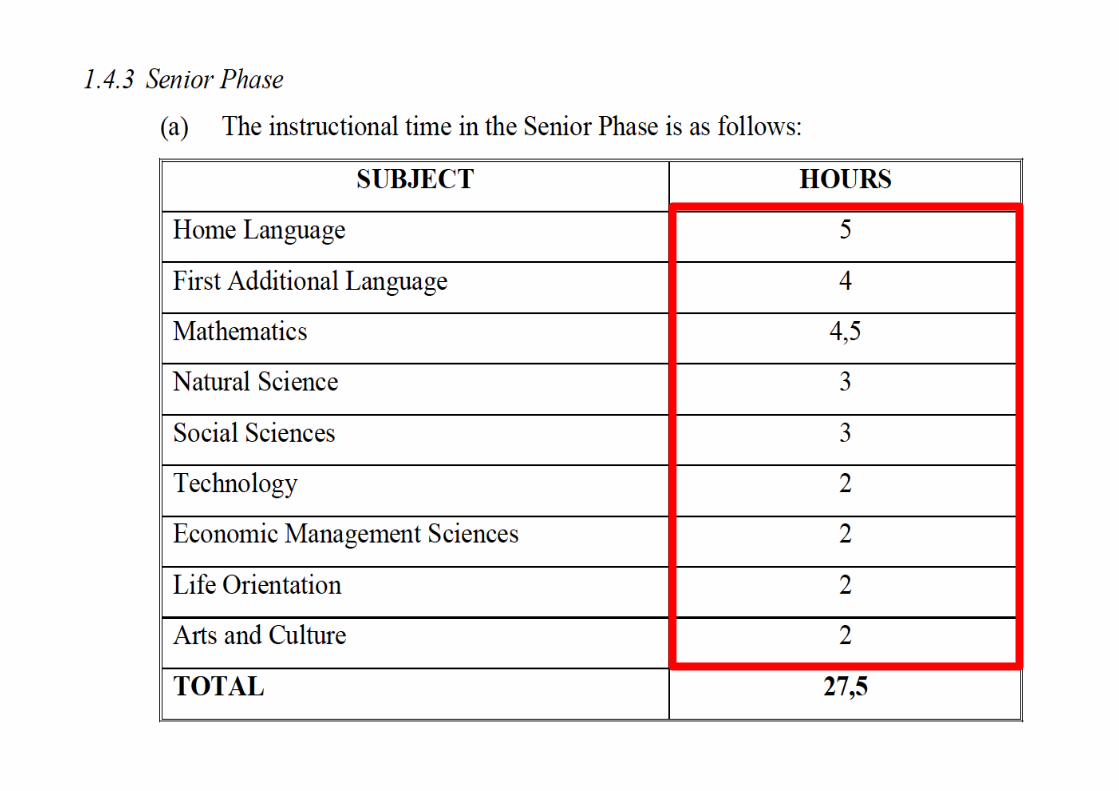
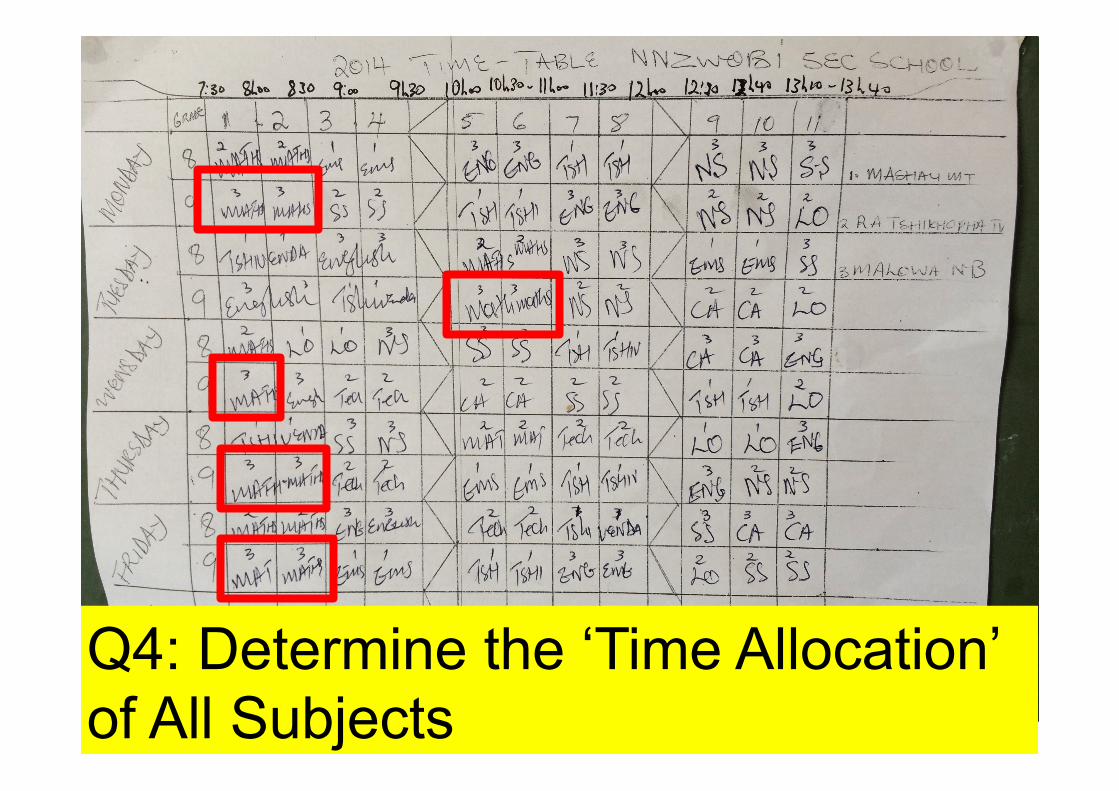
Q4: Determine the ‘Time Allocation’ of All Subjects

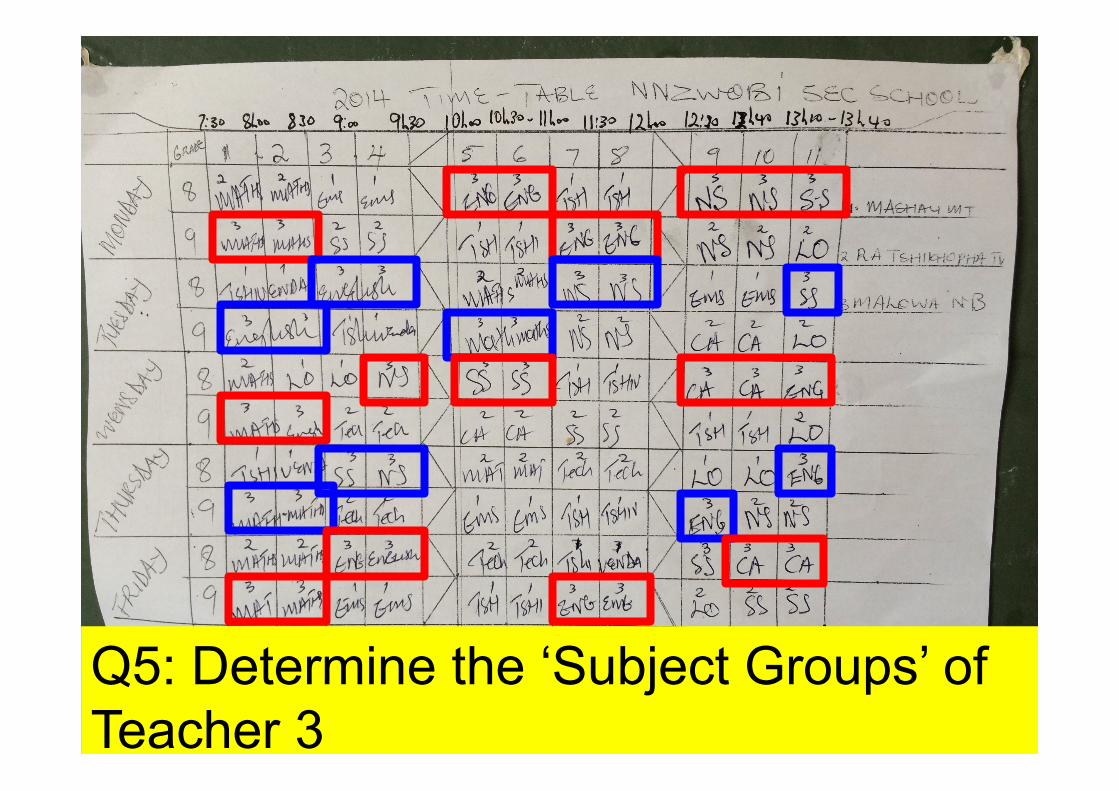
Q5: Determine the ‘Subject Groups’ of Teacher 3
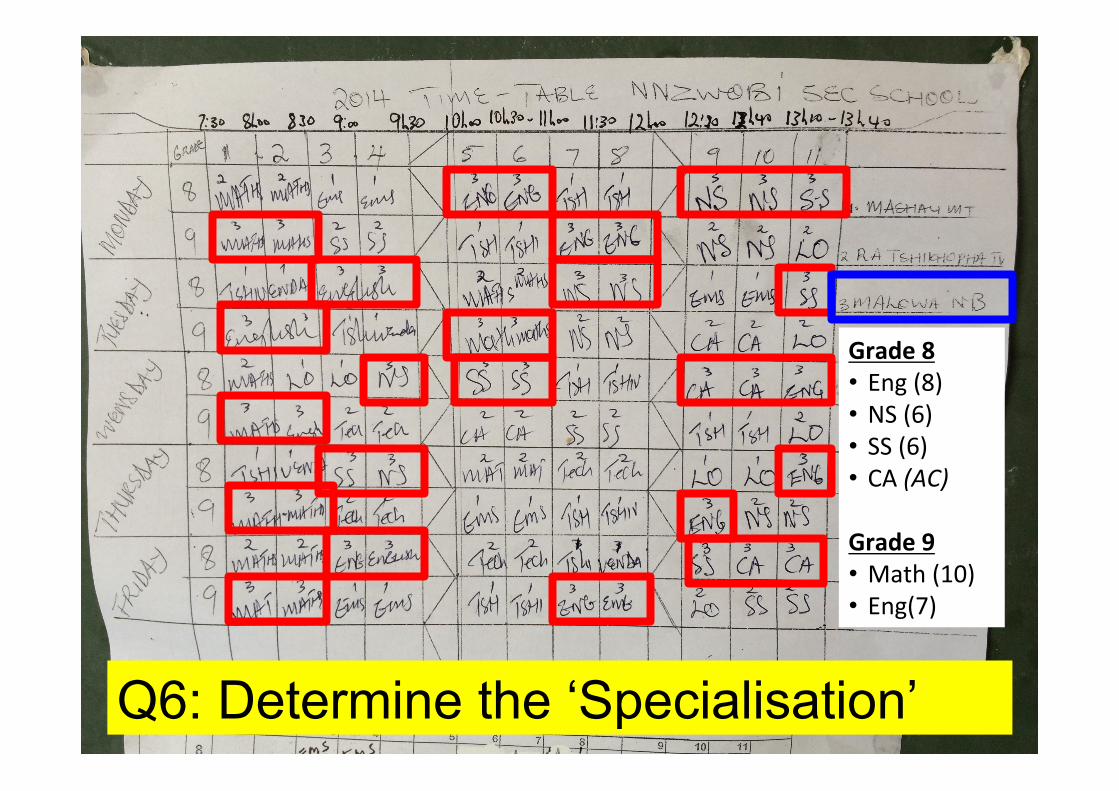
Q6: Determine the ‘Specialisation’
Grade8• Eng(8)• NS(6)• SS(6)• CA(AC)Grade9• Math(10)• Eng(7)
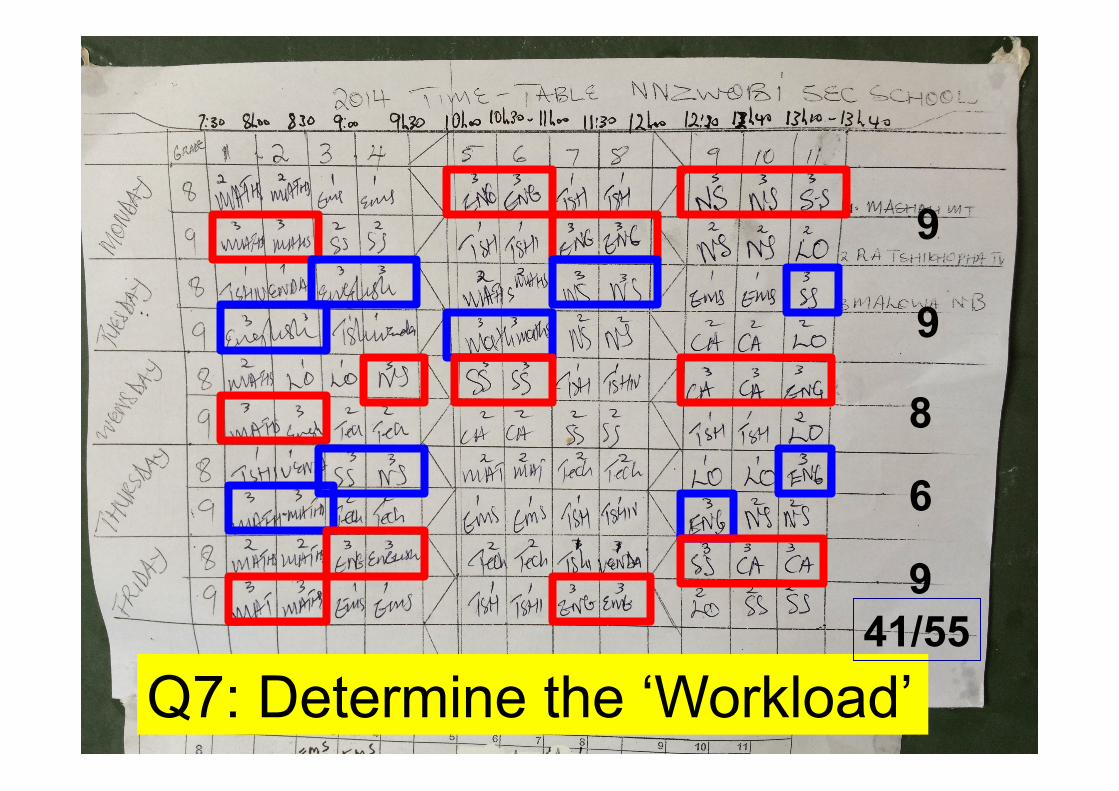
Q7: Determine the ‘Workload’
9
9
8
6
9 41/55

Q8: Determine the ‘% Workload’
41/55 = 75%
1800HoursofAccountability

AvailableAccountabilityTimefortheSchool=
1800hrsXnTeachers------------------------------------
UClisaConofTeachingTimefortheSchool=
ClassgroupsX935hrsp.a.
66
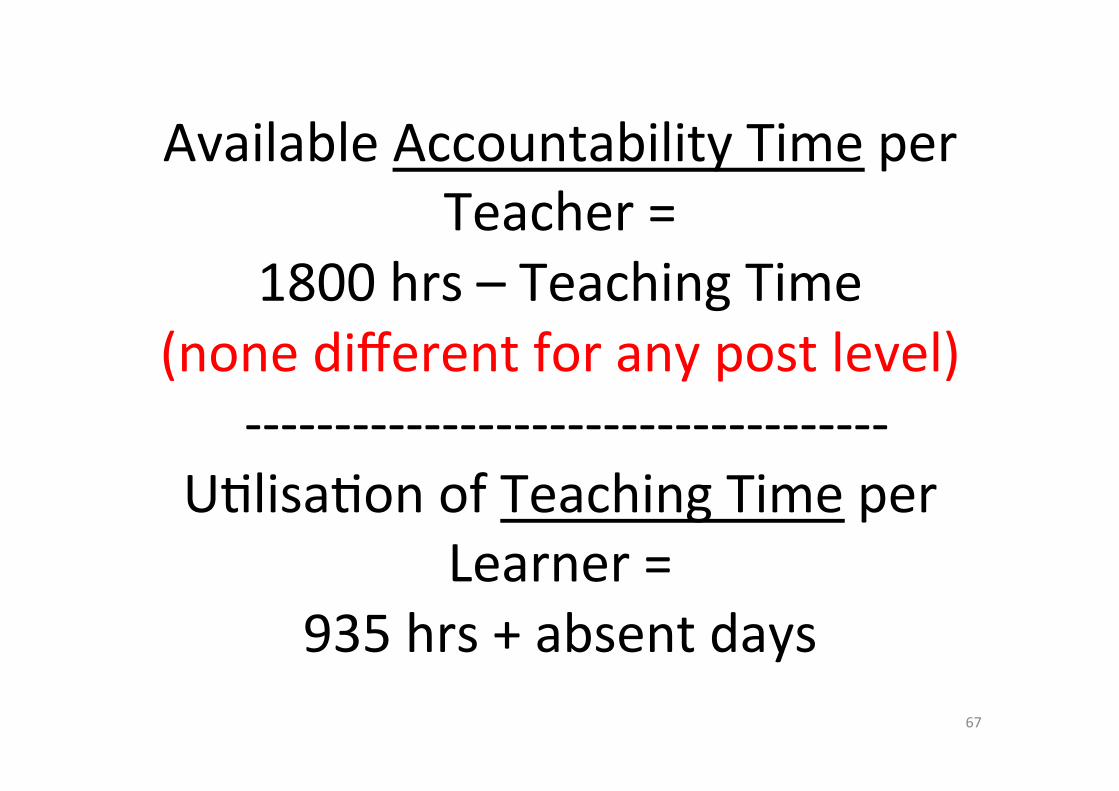
AvailableAccountabilityTimeperTeacher=
1800hrs–TeachingTime(nonedifferentforanypostlevel)
------------------------------------UClisaConofTeachingTimeper
Learner=935hrs+absentdays
67
68
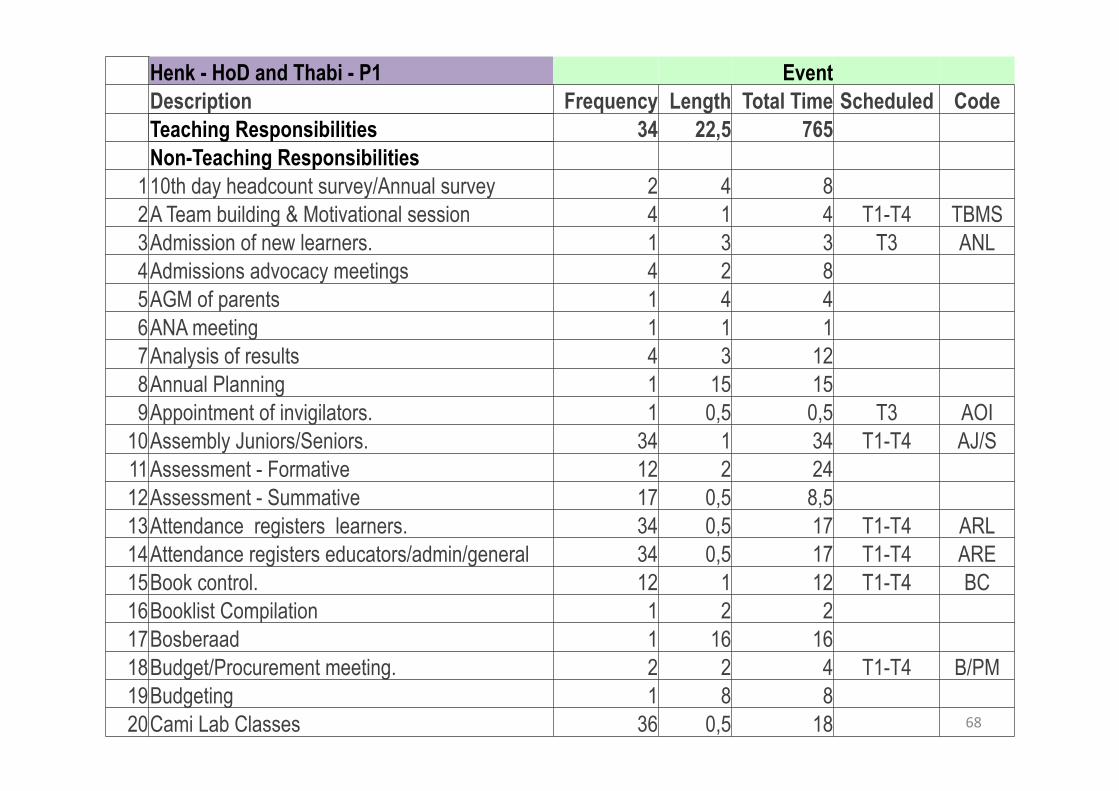
Henk - HoD and Thabi - P1 Event Description Frequency Length Total Time Scheduled Code Teaching Responsibilities 34 22,5 765 Non-Teaching Responsibilities
1 10th day headcount survey/Annual survey 2 4 8 2 A Team building & Motivational session 4 1 4 T1-T4 TBMS 3 Admission of new learners. 1 3 3 T3 ANL 4 Admissions advocacy meetings 4 2 8 5 AGM of parents 1 4 4 6 ANA meeting 1 1 1 7 Analysis of results 4 3 12 8 Annual Planning 1 15 15 9 Appointment of invigilators. 1 0,5 0,5 T3 AOI
10 Assembly Juniors/Seniors. 34 1 34 T1-T4 AJ/S 11 Assessment - Formative 12 2 24 12 Assessment - Summative 17 0,5 8,5 13 Attendance registers learners. 34 0,5 17 T1-T4 ARL 14 Attendance registers educators/admin/general 34 0,5 17 T1-T4 ARE 15 Book control. 12 1 12 T1-T4 BC 16 Booklist Compilation 1 2 2 17 Bosberaad 1 16 16 18 Budget/Procurement meeting. 2 2 4 T1-T4 B/PM 19 Budgeting 1 8 8 20 Cami Lab Classes 36 0,5 18
69
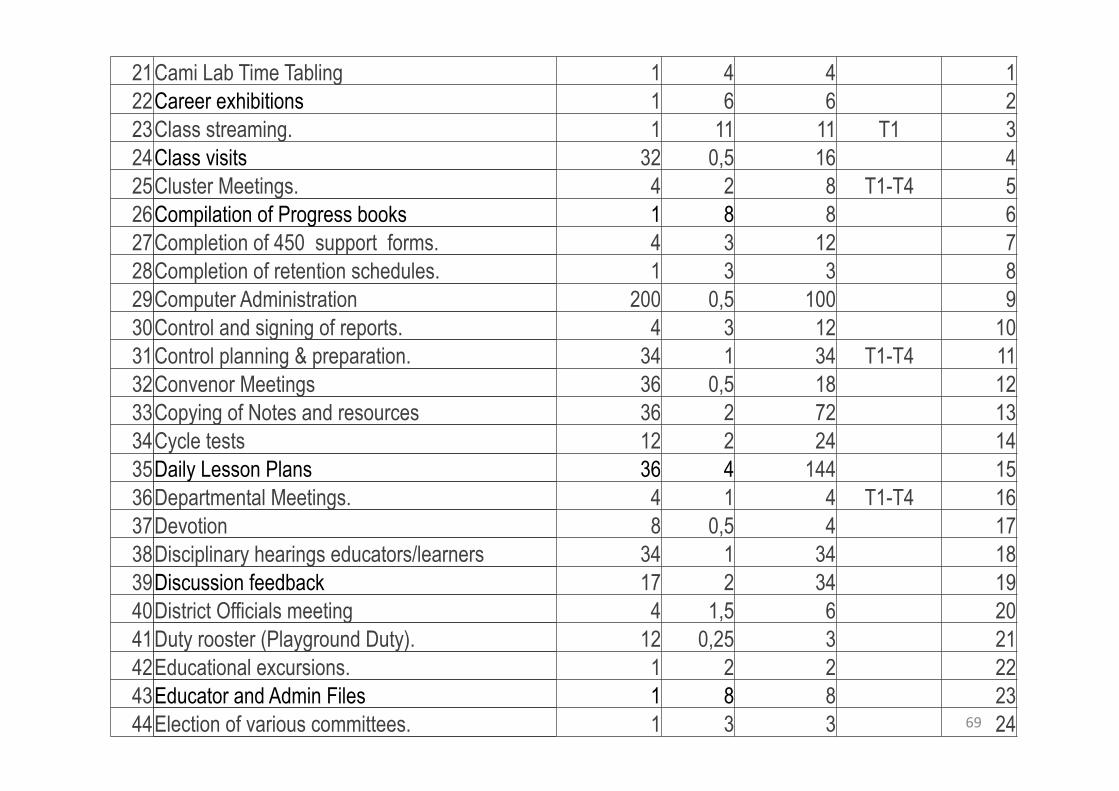
21 Cami Lab Time Tabling 1 4 4 1 22 Career exhibitions 1 6 6 2 23 Class streaming. 1 11 11 T1 3 24 Class visits 32 0,5 16 4 25 Cluster Meetings. 4 2 8 T1-T4 5 26 Compilation of Progress books 1 8 8 6 27 Completion of 450 support forms. 4 3 12 7 28 Completion of retention schedules. 1 3 3 8 29 Computer Administration 200 0,5 100 9 30 Control and signing of reports. 4 3 12 10 31 Control planning & preparation. 34 1 34 T1-T4 11 32 Convenor Meetings 36 0,5 18 12 33 Copying of Notes and resources 36 2 72 13 34 Cycle tests 12 2 24 14 35 Daily Lesson Plans 36 4 144 15 36 Departmental Meetings. 4 1 4 T1-T4 16 37 Devotion 8 0,5 4 17 38 Disciplinary hearings educators/learners 34 1 34 18 39 Discussion feedback 17 2 34 19 40 District Officials meeting 4 1,5 6 20 41 Duty rooster (Playground Duty). 12 0,25 3 21 42 Educational excursions. 1 2 2 22 43 Educator and Admin Files 1 8 8 23 44 Election of various committees. 1 3 3 24
70
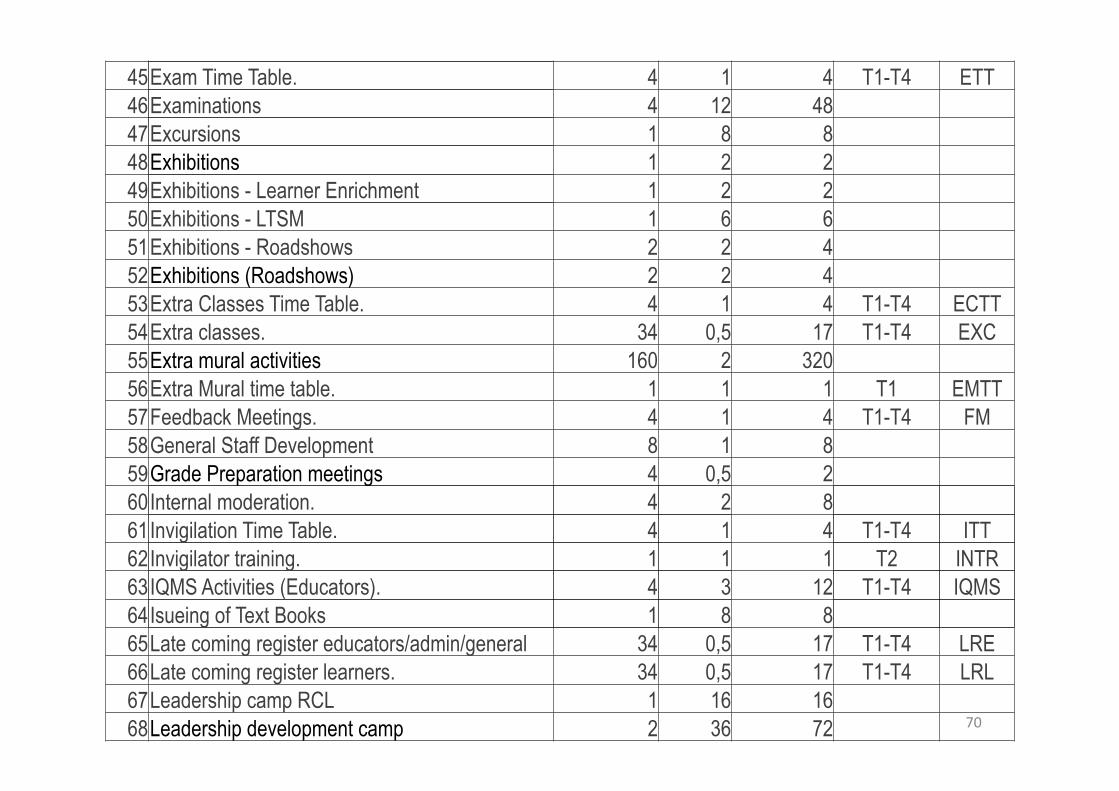
45 Exam Time Table. 4 1 4 T1-T4 ETT 46 Examinations 4 12 48 47 Excursions 1 8 8 48 Exhibitions 1 2 2 49 Exhibitions - Learner Enrichment 1 2 2 50 Exhibitions - LTSM 1 6 6 51 Exhibitions - Roadshows 2 2 4 52 Exhibitions (Roadshows) 2 2 4 53 Extra Classes Time Table. 4 1 4 T1-T4 ECTT 54 Extra classes. 34 0,5 17 T1-T4 EXC 55 Extra mural activities 160 2 320 56 Extra Mural time table. 1 1 1 T1 EMTT 57 Feedback Meetings. 4 1 4 T1-T4 FM 58 General Staff Development 8 1 8 59 Grade Preparation meetings 4 0,5 2 60 Internal moderation. 4 2 8 61 Invigilation Time Table. 4 1 4 T1-T4 ITT 62 Invigilator training. 1 1 1 T2 INTR 63 IQMS Activities (Educators). 4 3 12 T1-T4 IQMS 64 Isueing of Text Books 1 8 8 65 Late coming register educators/admin/general 34 0,5 17 T1-T4 LRE 66 Late coming register learners. 34 0,5 17 T1-T4 LRL 67 Leadership camp RCL 1 16 16 68 Leadership development camp 2 36 72
71
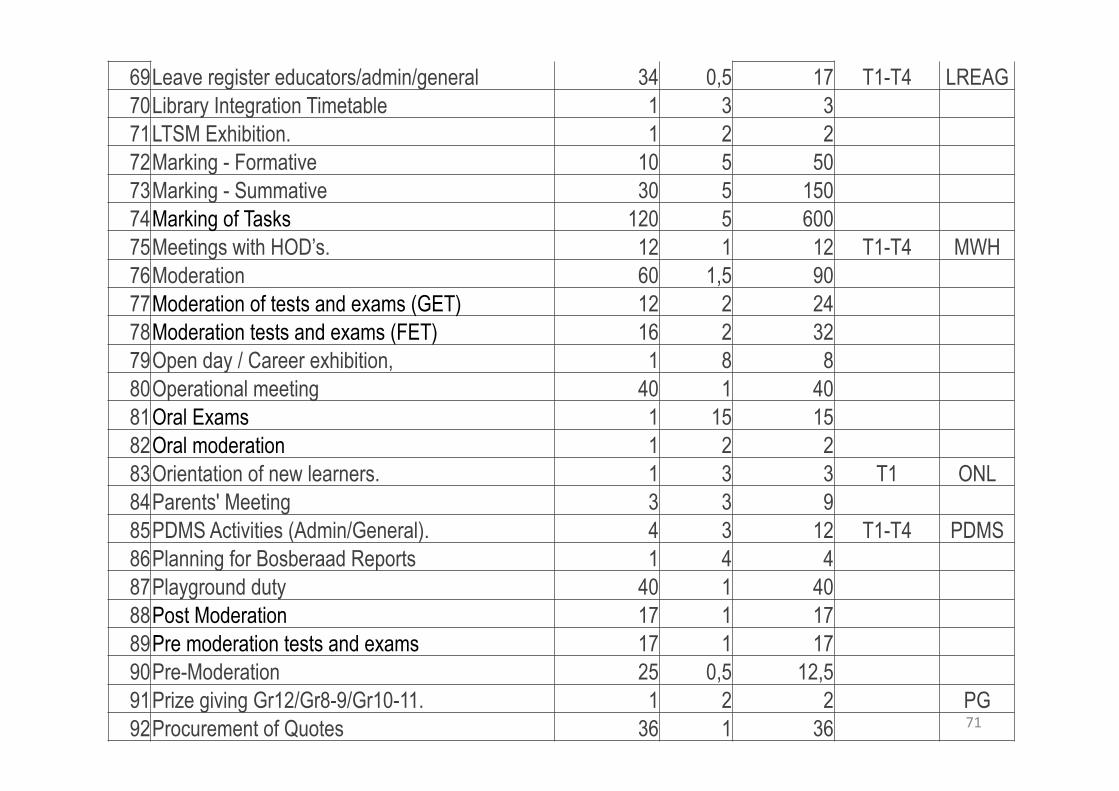
69 Leave register educators/admin/general 34 0,5 17 T1-T4 LREAG 70 Library Integration Timetable 1 3 3 71 LTSM Exhibition. 1 2 2 72 Marking - Formative 10 5 50 73 Marking - Summative 30 5 150 74 Marking of Tasks 120 5 600 75 Meetings with HOD’s. 12 1 12 T1-T4 MWH 76 Moderation 60 1,5 90 77 Moderation of tests and exams (GET) 12 2 24 78 Moderation tests and exams (FET) 16 2 32 79 Open day / Career exhibition, 1 8 8 80 Operational meeting 40 1 40 81 Oral Exams 1 15 15 82 Oral moderation 1 2 2 83 Orientation of new learners. 1 3 3 T1 ONL 84 Parents' Meeting 3 3 9 85 PDMS Activities (Admin/General). 4 3 12 T1-T4 PDMS 86 Planning for Bosberaad Reports 1 4 4 87 Playground duty 40 1 40 88 Post Moderation 17 1 17 89 Pre moderation tests and exams 17 1 17 90 Pre-Moderation 25 0,5 12,5 91 Prize giving Gr12/Gr8-9/Gr10-11. 1 2 2 PG 92 Procurement of Quotes 36 1 36
72
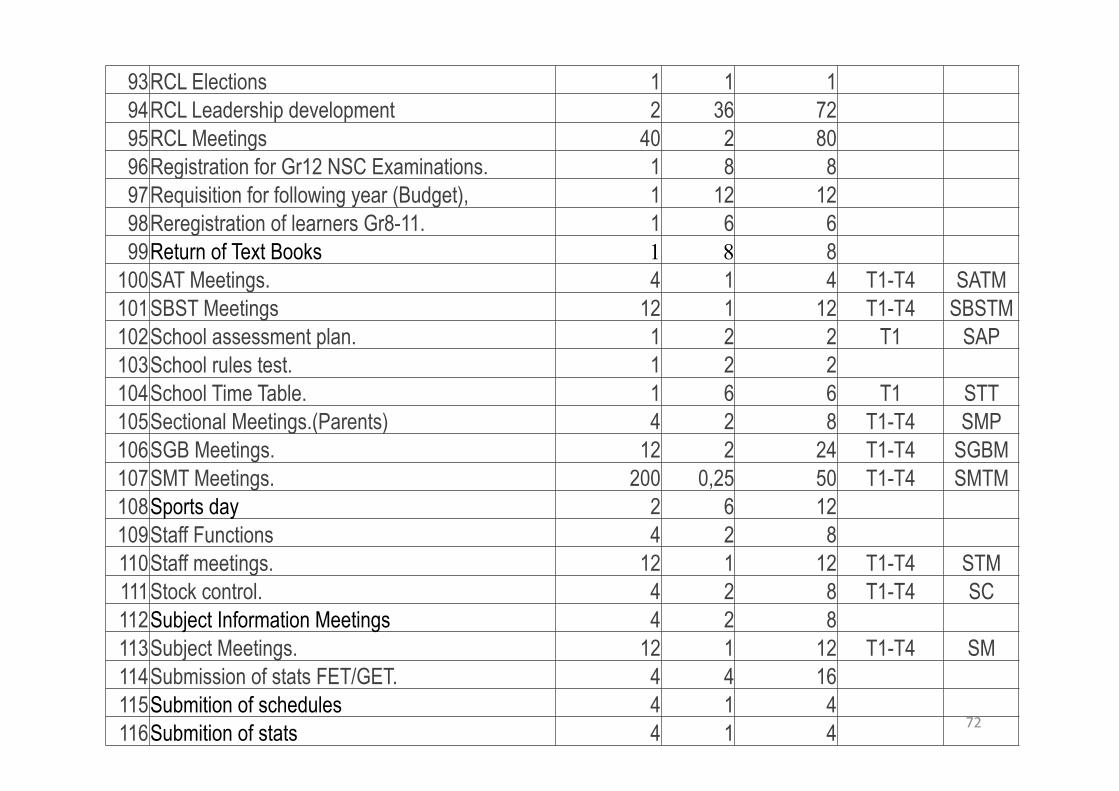
93 RCL Elections 1 1 1 94 RCL Leadership development 2 36 72 95 RCL Meetings 40 2 80 96 Registration for Gr12 NSC Examinations. 1 8 8 97 Requisition for following year (Budget), 1 12 12 98 Reregistration of learners Gr8-11. 1 6 6 99 Return of Text Books 1 8 8
100 SAT Meetings. 4 1 4 T1-T4 SATM 101 SBST Meetings 12 1 12 T1-T4 SBSTM 102 School assessment plan. 1 2 2 T1 SAP 103 School rules test. 1 2 2 104 School Time Table. 1 6 6 T1 STT 105 Sectional Meetings.(Parents) 4 2 8 T1-T4 SMP 106 SGB Meetings. 12 2 24 T1-T4 SGBM 107 SMT Meetings. 200 0,25 50 T1-T4 SMTM 108 Sports day 2 6 12 109 Staff Functions 4 2 8 110 Staff meetings. 12 1 12 T1-T4 STM 111 Stock control. 4 2 8 T1-T4 SC 112 Subject Information Meetings 4 2 8 113 Subject Meetings. 12 1 12 T1-T4 SM 114 Submission of stats FET/GET. 4 4 16 115 Submition of schedules 4 1 4 116 Submition of stats 4 1 4
73
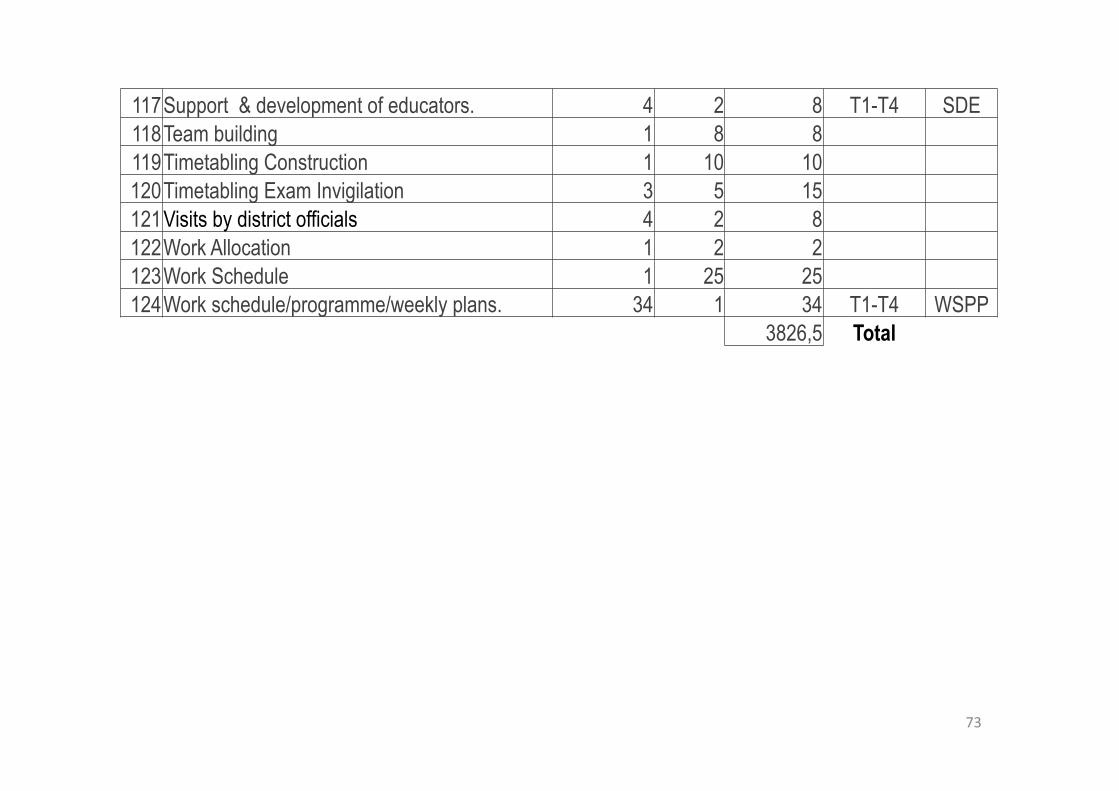
117 Support & development of educators. 4 2 8 T1-T4 SDE 118 Team building 1 8 8 119 Timetabling Construction 1 10 10 120 Timetabling Exam Invigilation 3 5 15 121 Visits by district officials 4 2 8 122 Work Allocation 1 2 2 123 Work Schedule 1 25 25 124 Work schedule/programme/weekly plans. 34 1 34 T1-T4 WSPP
3826,5 Total
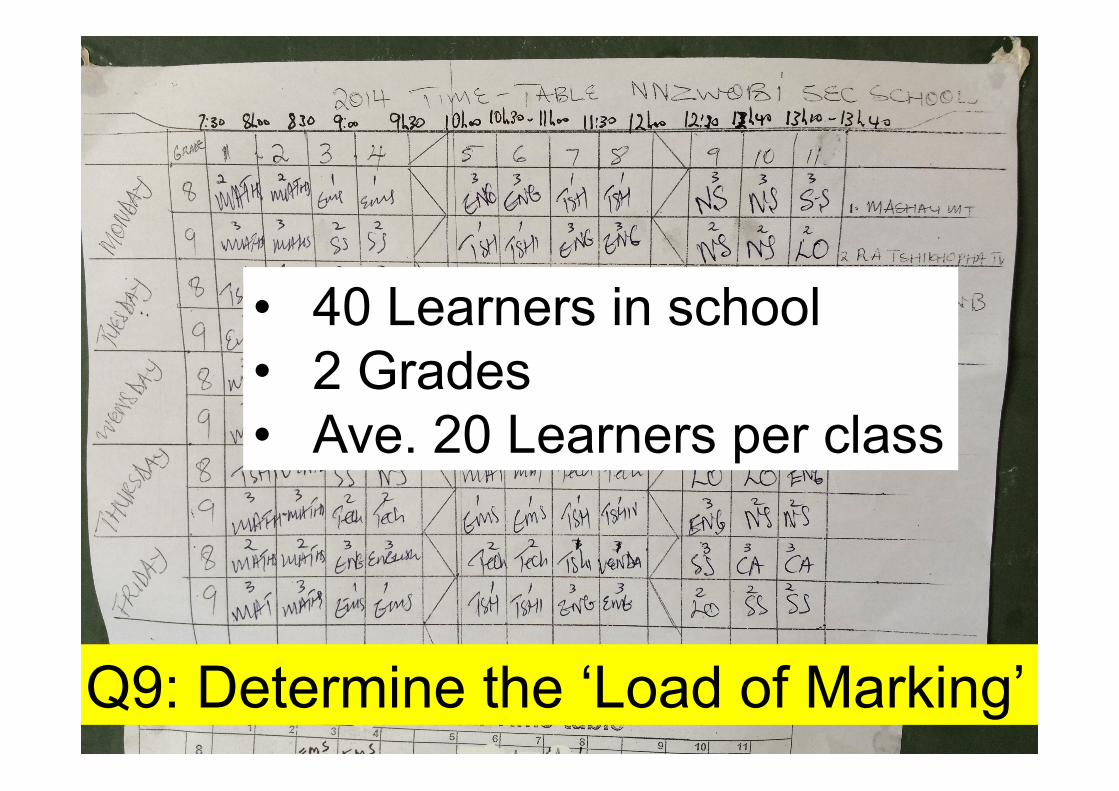
Q9: Determine the ‘Load of Marking’
• 40 Learners in school • 2 Grades • Ave. 20 Learners per class
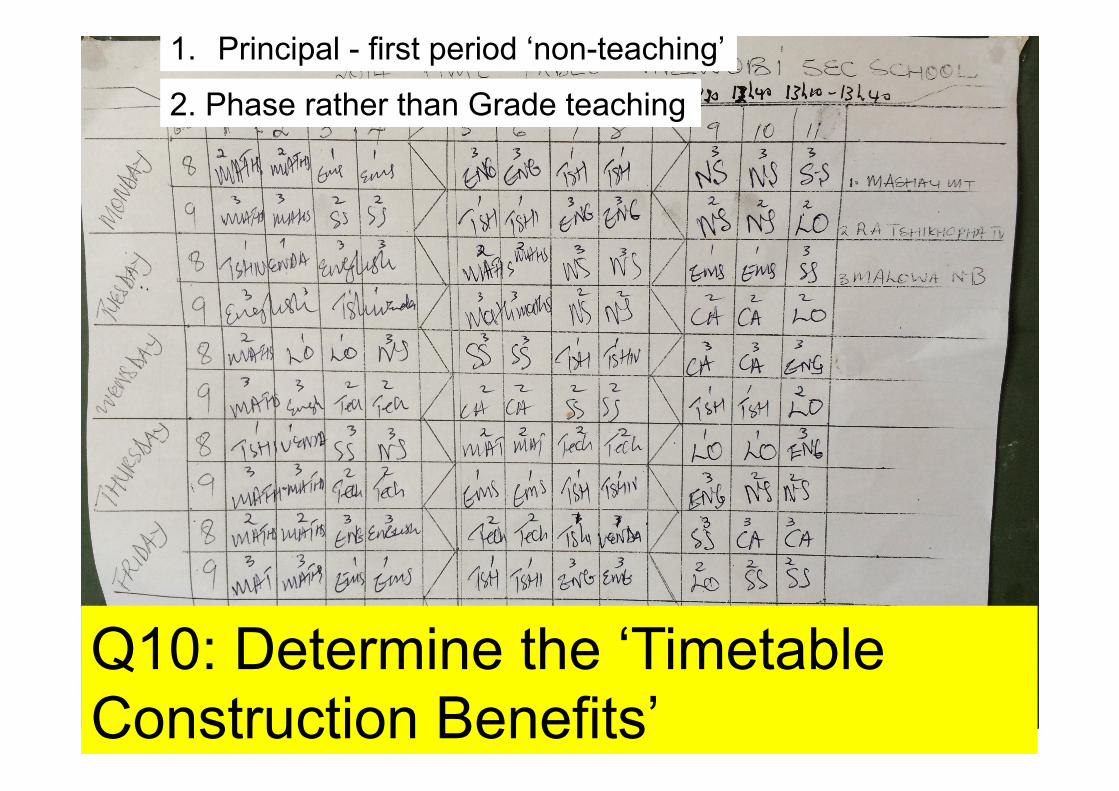
Q10: Determine the ‘Timetable Construction Benefits’
1. Principal - first period ‘non-teaching’
2. Phase rather than Grade teaching
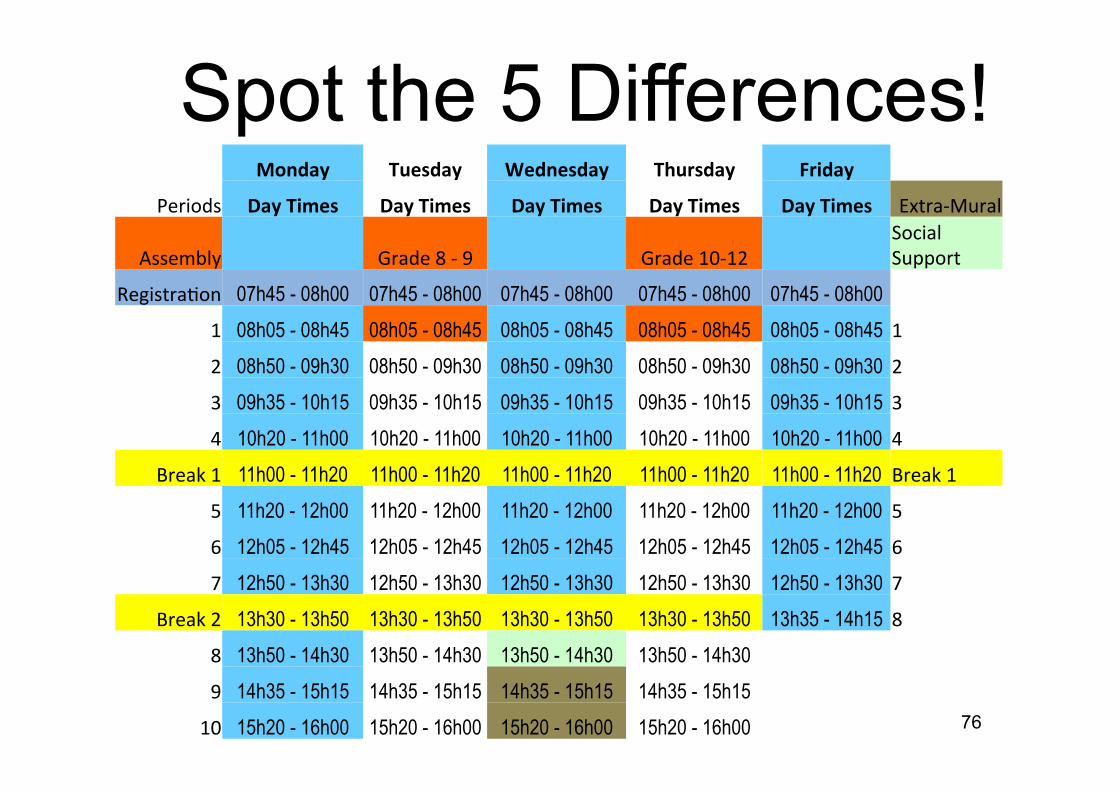
Monday Tuesday Wednesday Thursday Friday
Periods DayTimes DayTimes DayTimes DayTimes DayTimes Extra-Mural
Assembly Grade8-9 Grade10-12SocialSupport
RegistraCon 07h45 - 08h00 07h45 - 08h00 07h45 - 08h00 07h45 - 08h00 07h45 - 08h00 1 08h05 - 08h45 08h05 - 08h45 08h05 - 08h45 08h05 - 08h45 08h05 - 08h45 12 08h50 - 09h30 08h50 - 09h30 08h50 - 09h30 08h50 - 09h30 08h50 - 09h30 23 09h35 - 10h15 09h35 - 10h15 09h35 - 10h15 09h35 - 10h15 09h35 - 10h15 34 10h20 - 11h00 10h20 - 11h00 10h20 - 11h00 10h20 - 11h00 10h20 - 11h00 4
Break1 11h00 - 11h20 11h00 - 11h20 11h00 - 11h20 11h00 - 11h20 11h00 - 11h20 Break15 11h20 - 12h00 11h20 - 12h00 11h20 - 12h00 11h20 - 12h00 11h20 - 12h00 56 12h05 - 12h45 12h05 - 12h45 12h05 - 12h45 12h05 - 12h45 12h05 - 12h45 67 12h50 - 13h30 12h50 - 13h30 12h50 - 13h30 12h50 - 13h30 12h50 - 13h30 7
Break2 13h30 - 13h50 13h30 - 13h50 13h30 - 13h50 13h30 - 13h50 13h35 - 14h15 88 13h50 - 14h30 13h50 - 14h30 13h50 - 14h30 13h50 - 14h30 9 14h35 - 15h15 14h35 - 15h15 14h35 - 15h15 14h35 - 15h15 10 15h20 - 16h00 15h20 - 16h00 15h20 - 16h00 15h20 - 16h00
Spot the 5 Differences!
76

ThankYou!