neighbourhood characteristics, individual attributes and self-rated health among older canadians
TRANSCRIPT
Health & Place 16 (2010) 986–995
Contents lists available at ScienceDirect
Health & Place
1353-82
doi:10.1
n Tel.:
E-m
journal homepage: www.elsevier.com/locate/healthplace
Neighbourhood characteristics, individual attributes and self-rated healthamong older Canadians
D. Walter Rasugu Omariba n
Health Analysis Division, Statistics Canada, 100 Tunney’s Pasture Driveway, R.H. Coats Building 24B, Ottawa, Ontario, Canada K1A 0T6
a r t i c l e i n f o
Article history:
Received 10 November 2009
Received in revised form
3 June 2010
Accepted 12 June 2010
Keywords:
Compositional and contextual effects
Determinants of health
Multilevel modelling
Neighbourhood variation
Place effects
Self-rated health
92/$ - see front matter Crown Copyright & 2
016/j.healthplace.2010.06.003
+1 613 951 6528; fax: +1 613 951 3959.
ail address: [email protected]
a b s t r a c t
This study drew on three cycles of the Canadian Community Health Survey and the 2001 Census to
examine between-neighbourhood variation in positive and negative self-rated health and the relative
effect of individual and neighbourhood characteristics on self-rated health among Canadian adults aged
Z65. Multilevel logistic regression results showed that there was modest, but significant between-
neighbourhood variation in self-rated health. Neighbourhood factors including income, education, and
percentage of people aged Z65, and visible minority accounted for about 50% and 30% of the
neighbourhood variation in negative and positive self-rated health, respectively. Relative to
neighbourhood-level characteristics, individual characteristics had a stronger effect on self-rated
health with involvement in physical activity, alcohol consumption, sense of community belonging,
income, and education being the most important. Although the findings suggest that neighbourhood
effects on self-rated health are modest and that individual-level factors are relatively more important
determinants of health, research concern for contextual influences on health should continue.
Crown Copyright & 2010 Published by Elsevier Ltd. All rights reserved.
1. Introduction
Over the past two decades, social science research on the roleof place in the health of individuals has grown tremendously.These influences are known as ‘‘contextual effects’’ as opposed to‘‘compositional effects’’ which concern individual characteristicswithin places. Contextual effects are attributable to the distinctivefeatures of the places inhabited by individuals including theirsocial, cultural, and environmental characteristics (Boyle andWillms, 1999; Marlmstrom et al., 1999). The implication is thatsimilar individuals will have different health status in differenttypes of places (contextual effects); while similar types of personswill have similar health experiences irrespective of where theyreside (compositional effects) (Marlmstrom et al., 1999). Studiesthat seek to establish whether contexts contribute to healthoutcomes independently of individual characteristics use multi-level analysis. The evidence from these studies on the relativecontribution of contextual and composition effects on health aremixed (e.g., Jones and Duncan, 1995; Kawachi et al., 1999; Belandet al., 2002; Subramanian et al., 2002; Kubzansky et al., 2005;Pampalon et al., 2007; Veenstra, 2005; Stafford et al., 2005;Sheffield and Peek, 2009).
In Canada, studies of place effects on health have, with fewexceptions (Frohlich and Mustard, 1996; Boyle and Willms, 1999),
010 Published by Elsevier Ltd. All
used the neighbourhood or community as the measure of place.There is, however, no common definition of ‘neighbourhood’.Neighbourhood is defined mainly as a census dissemination area(DA) (Oliver and Hayes, 2007; Pampalon et al., 2010), or a censustract area (CT) (Pampalon et al., 1999; Hou and Chen, 2003; Rosset al., 2004). The DA is the smallest geographical unit for whichcensus data are available and typically comprise between 400 and700 people. On the other hand, the CT is a geostatistical areacomprising about 4000 people (Statistics Canada, 2003a). Cana-dian studies on place effects have studied diverse topics includingmortality (Frohlich and Mustard, 1996; Veugelers et al., 2001),birth outcomes (Luo et al., 2006; Urquia et al., 2009), self-ratedhealth (Hou and Myles, 2005; Pampalon et al., 2007; Oliver andHayes, 2007), Body Mass Index (BMI) (O’Loughlin et al., 2000;Veenstra, 2005; Ross et al., 2007), Health Utilities Index (HUI)(Boyle and Willms, 1999; Hou and Chen, 2003), injuries andchronic illnesses (Wilson et al., 2004; Bell et al., 2009; Menecet al., 2010), mental health (Menec et al., 2010); familyfunctioning (Boyle and Willms, 1999), and hospital use (Glazieret al., 2000).
Despite including neighbourhood factors, most Canadianstudies on place effects employ single-level analytic techniques;only a few have utilised multilevel techniques (e.g., Boyle andWillms, 1999; Ross et al., 2007; Pampalon et al., 2007). In general,these studies focus on social and socioeconomic characteristics,and less on the physical characteristics of neighbourhoods. Forinstance, Beland et al. (2002) using multilevel logistic regressionfound that neighbourhood-level factors including average annual
rights reserved.

D. Walter Rasugu Omariba / Health & Place 16 (2010) 986–995 987
household income, proportion of families with both parentspresent, and proportion of non-immigrants were significantlyassociated with self-rated health even with controls for indivi-dual-level factors. In a recent study, Pampalon et al. (2010) usedan individual and area-based version of a deprivation index andshowed that survival inequalities in small towns and rural areasare lower than elsewhere when an area-based index is used, butof equal magnitude when the individual version of the indexwas used. An extensive search of the literature yielded only onestudy that has examined the effect of neighbourhood physicalcharacteristics on health in Canada (Ross et al., 2007). In additionto individual and other neighbourhood characteristics, Ross et al.(2007) examined the association between neighbourhood dwell-ing density and extent of urban sprawl at the metropolitan arealevel and BMI. The results showed that dwelling density was notsignificantly associated with BMI for both men and women, buturban sprawl had a significant effect on men’s BMI perhapsbecause overweight men living in sprawling metropolises aremore likely to be inactive.
In contrast to Canadian studies, international studies ofneighbourhood effects on health are numerous, but they arepredominantly from the US and the UK. Just as in Canadianstudies, there is no common definition of neighbourhood.Researchers in the US have used census tract (e.g., Browningand Cagney, 2002; Kubzansky et al., 2005) or census block(subdivisions of census tracts) (e.g., Borrell et al., 2004), whilethose in the UK have used census ward (e.g., Stafford et al., 2005),or postcode sectors (e.g., Poortinga, 2006) – areas that aremarkedly different spatially and in population size – to defineneighbourhoods. The findings from these studies indicate that thecharacteristics of individuals as well as those of their place ofresidence are important determinants of health but in varyingdegrees. For instance, Browning and Cagney (2003) found thatneighbourhood-level affluence, population size, and residentialstability had a significant effect on self-rated health beyondindividual-level characteristics such as age, sex, education,income, home ownership, and marital status. Similarly, examiningneighbourhood sociopolitical and physical environment, ame-nities, and indicators of economic deprivation and affluence in theUK, and their relationship with self-rated health, Stafford et al.(2005) found that each of these contextual domains wasassociated with self-rated health over and above individualsocioeconomic characteristics, but the effect was larger forwomen than men. On the other hand, Subramanian et al. (2002)in a study that examined individual and contextual effects ofsocial trust on self-rated poor health found that the main effect ofcommunity social trust was statistically insignificant once theycontrolled for individual trust perception. However, they ob-served a complex interaction effect: health-promoting effect ofcommunity trust was significantly greater for high-trust indivi-duals and lower for low-trust persons.
Previous research in Canada and elsewhere suggests thatneighbourhood contexts are important for health and wellbeingespecially for older adults (Robert, 1999; Meersman, 2005; Menecet al., 2010). For example, because of longer length of residence,older adults may have well-entrenched social ties and networksin their neighbourhoods, and less participation in activitiesoutside their communities, and may therefore be more dependenton community resources than younger people (Robert, 1999;Meersman, 2005). This suggests, however, that if communityresources are poor or inadequate, older adults will be moreaffected in their health than younger ones. Also, it is possible thatolder residents possess dispositions or psychosocial resourcesthat enable them to effectively manage both favourable andunfavourable neighbourhood conditions (Meersman, 2005).Nonetheless, despite the fact that neighbourhood contexts are
important for the health of older adults, few studies haveexamined their effects.
This study seeks to establish whether there is significantbetween-neighbourhood variation in self-rated health amongolder Canadians (ageZ65 years) and the relative role ofindividual and contextual variables in explaining observeddifferences. In particular, the study examines whether self-ratedhealth varies between neighbourhoods, and it if does, to identifywhat individual- and neighbourhood-level factors account for thedifferences. Further, it seeks to determine which of the two groupof factors – individual and neighbourhood characteristics – have agreater effect on self-rated health. The measure of neighbourhoodin this study is the dissemination area. Although there is apotential for the results to vary depending on the geographicalunit used, studies in Canada and the US have shown thatcontextual effects are generally similar for the most commonlyused measures of place (Borrell et al., 2004; Ross et al., 2004;Oliver and Hayes, 2007). However, I use the DA because it is thesmallest geographical unit for which census data is collected, andit is therefore more likely to correspond to what most peopleperceive as a neighbourhood. Again, as Willms (2001) suggests, nochoice of geographical unit in the analysis of place effects willsatisfy everyone; it always elicits a challenge.
Several Canadian studies have examined the determinants ofself-rated health including among the older population (e.g., Cottet al., 1999; Shooshtari et al., 2007; Perruccio et al., 2007). Fewerstudies, however, have examined these relationships in a multi-level context. The latter studies are limited in two related ways.First, they are either based on a single province (Pampalon et al.,1999), or focus on geographical units within a metropolitan area(Hou and Chen, 2003; Oliver and Hayes, 2007; Pampalon et al.,2007). The results cannot therefore be generalised to the entirecountry. Second, although some of these studies have explicitlyexamined and reported between-neighbourhood variation in self-rated health (Hou and Chen, 2003; Pampalon et al., 1999, 2007),the extent of this variation across the country, if any, is unknown.This is a particularly significant omission because such an analysisprovides the basis for a wider generalisation besides the moreattractive feature of potentially identifying neighbourhoods thatdeserve greater focus in terms of targeting of resources for healthpromotion. Further, none of the extant studies have specificallyfocused on the growing demographic of seniors (age Z65 years).For instance, between 2005 and 2036, the number of seniors inCanada is projected to increase from 4.2 million to 9.8 million.Further, their share of the population which was only 9.6% in 1981will increase to 24.5% in the same period (Martel and Belanger,1999; Turcotte and Schellenberg, 2006).
This study is unique in two important ways. First, it uses bothindividual- and neighbourhood-level factors in a unitary model toquantify their relative effect on self-rated health. This makes itpossible to distinguish between population-level effects (factorsthat influence average levels of health in the population) andindividual-level effects (factors that influence the distribution ofhealth effects within populations). Further, the use of multilevelmodelling makes it possible to quantify the moderating influenceof contexts (e.g., neighbourhoods) on individual-level health.Second, the study analyses both positive and negative self-ratedhealth; most studies focus on only negative self-rated health.A recurring theme in this line of research is whether thedeterminants of the two extremes of self-rated health are similar.The analysis of factors associated with negative self-rated healthis important because it is associated with different negativehealth outcomes. In contrast, the analysis of predictors of positiveself-rated health is important because it could suggest additionalintervention strategies for improving health (Shooshtari et al.,2007). For example, a study of 487 US seniors found that although
D. Walter Rasugu Omariba / Health & Place 16 (2010) 986–995988
factors indicating overall functioning and vitality were ratedhighly by all participants, those indicating current disease wererated highly by people reporting poor health, while risk factorsand positive indicators were rated highly by those reporting goodhealth (Benyamini et al., 2003). This suggests that poor self-ratedhealth is associated with illnesses and disability, while good self-rated health is associated with good health.
2. Data and methods
2.1. Data
The primary source of data for this study is the CanadianCommunity Health Survey (CCHS) undertaken by Statistics Canada(Statistics Canada, 2003b). It is a cross-sectional survey thatcollects self-reported information on health status, serviceutilisation, and determinants of population health. The CCHStargets Canadians aged Z12 residing in private households,and excludes institutional residents, people living in Canadianmilitary bases, Indian reserves, and certain remote areas.This study makes use of a combined dataset consisting ofthree master files of cycles 1.1, 2.1, and 3.1 of the CCHS. Thedatasets were combined in this study to obtain enough sub-samplesizes at neighbourhood-level to be able to conduct a multilevelanalysis and to obtain reliable variance estimates (Thomas andWannell, 2009). The CCHS is also ideal for combining cyclesbecause data for the same characteristics is collected across cycles.
The CCHS cycles 1.1, 2.1, and 3.1 interviewed 131,535; 135,573;and 132,947 respondents, respectively. The CCHS cycle 1.1 wasundertaken between September 2000 and November 2001; cycle2.1 was carried out between January and December 2003, whereascycle 3.1 was carried out between January and December 2005. Allthe three cycles of the CCHS covered the ten provinces and threeterritories of Canada. A full description of the surveys is availablein different documentations accompanying the public release ofthe data (Statistics Canada, 2003b, 2005a, 2006). For the combinedCCHS dataset, a total of 81,150 respondents were Z65.
To account for neighbourhood factors, the 2001 Census ofCanada was merged with the CCHS data based on the Postal CodeConversion File (PCCF+), a program developed at Statistics Canada(Wilkins, 2007). The PCCF+ program assigns each respondent inthe CCHS a geographical identifier including dissemination area,and census division and tract based on their reported postal-codeof residence. Respondents are assigned the census informationcorresponding to their neighbourhood of residence. In the 2001Census of Canada the country was divided into 52,993 dissemina-tion areas (Statistics Canada, 2003a). However, Statistics Canadasuppresses information for dissemination areas with less than40 people. Further, limited information such a missing or havinginvalid residential postal codes may hamper successful assign-ment of a dissemination area for some people. This study is basedon 80,865 individuals who were Z65, living in 26,820 neighbour-hoods, and whose neighbourhood information was successfullyassigned.
2.2. Individual-level variables Measures
2.2.1. Dependent measure
The dependent variable, self-rated health, represents a respon-dent’s evaluation of his or her own health. Although a subjectivemeasure, self-rated health is established as an important predictorof morbidity and mortality (Burstrom and Fredlund, 2001; Kaplanet al., 2007); activity limitations and loss of independence (e.g.,Branch and Ku, 1989; Mansson and Rastam, 2001), utilisation of
health services (e.g., Mor et al., 1994; Desalvo et al., 2005), andrecovery from illness after treatment (e.g., Wilcox et al., 1996;Schroeder et al., 2001). The association between self-rated healthand diverse health outcomes has also been found to persist evenwhen relevant controls are included. Its predictive power isperhaps one of the reasons self-rated health is routinely includedin most population health surveys besides being easy andinexpensive to measure. This has been confirmed across time,over all age groups and in diverse populations and cultures(Chandola and Jenkinson, 2000; Bailis et al., 2003).
In all three cycles of the CCHS, respondents were asked: ‘‘Ingeneral, would you say your health is: Excellent, Very good, Good,Fair, or Poor?’’ For the analysis, the outcome variable – self-ratedhealth – was categorised into three categories namely, ‘‘Fair orpoor’’, ‘‘Good’’, and ‘‘Very good or excellent’’. ‘‘Good’’ is the basecategory.
2.2.2. Independent measures
Two groups of factors are included as controls consistent withthe multilevel structure of the data and the analytic strategy usedin this study. First, I control for six neighbourhood-level factors:median household income, and proportions of the populationwith less than high school education, of age Z65, ofage Z65 that are non-family persons, that are visible minority,and that are recent immigrants. It is expected that theneighbourhood-level factors will have an independent effect onself-rated health and will account for a substantial portion of theoverall between-neighbourhood variation in self-rated health.Second, I control for individual-level age, sex, visible minoritystatus, sense of community belonging, household living arrange-ments, household income, education, smoking and alcohol usebehaviour, and engagement in physical activity. The first seven ofthese factors closely correspond to the selected neighbourhood-level factors and therefore it is possible to assess the relative roleof each on self-rated health. In addition, these factors are likely tohave an independent association with self-rated health. I includesmoking, alcohol use, and participation in physical activitiesbecause of the observed relationship between these personalhealth-related behaviours and health.
2.2.3. Neighbourhood-level variables
Median household income and education represent theneighbourhood socioeconomic profile, while the rest characterizethe socio-demographic profile. Median household income is themedian of the total income of all households in a neighbourhood.The choice of cut-points was predicated on attaining a balanceddistribution of respondents in each of the categories and roundedand meaningful cut-off values. Neighbourhoods were assignedinto one of the following five groups of median householdincome: o$20,000, $20,000–$40,000, $40,000–o$60,000,$60,000–o$80,000, and Z$80,000. A distinction was madebetween neighbourhoods with o15% and those Z15% of theirresidents with less than high school education.
Further, for each of the socio-demographic characteristics,neighbourhoods were divided into those in which o15% andthose in which Z15% of the population have a given character-istic. Three of these variables need clarification. First, non familypersons are individuals living alone or with people to whom theyare not related. Second, in Canada, visible minorities are definedunder the Employment Equity Act as ‘‘persons other thanAboriginal peoples who are non-Caucasian in race or non-whitein colour’’ and include Arabs/West Asians, Blacks, Chinese,Filipinos, Japanese, Koreans, South Asians and others (Renaudand Costa, 1999). Third, recent immigrants are defined as peoplewho arrived in Canada r5 years before the 2001 census.

D. Walter Rasugu Omariba / Health & Place 16 (2010) 986–995 989
Neighbourhoods with a median household income ofZ$80,000 were the reference group. For all other characteristics,neighbourhoods with o15% of their residents possessing a givencharacteristic were the reference group.
2.2.4. Individual-level variables
Individual-level variables were broadly grouped into socio-demographic (age, sex, visible minority, sense of communitybelonging, living arrangements), socioeconomic (household in-come, education), and health-related behavioural (smokingstatus, alcohol use, physical activity) factors. Respondents weregrouped into one of the following age groups: youngest old (65–69), low middle old (70–74), high middle old (75–79), and oldestold (Z80) with the youngest old group as the reference category.Sex is a binary variable coded as female or male with males as thereference category. Similarly, visible minority status is a binaryvariable coded 0¼White, and 1¼Visible minority; Whites werethe reference category.
Sense of community belonging is a measure based on therespondents’ answer to the survey question: ‘‘How would youdescribe your sense of belonging to the local community?’’Because of sample size considerations, this variable was re-grouped into ‘‘Strong’’ (‘‘Very strong’’ and ‘‘Somewhat strong’’)and ‘‘Weak’’ (‘‘Somewhat weak’’, and ‘‘Very weak’’) sense ofcommunity belonging. The ‘‘Strong’’ was the reference category.Living arrangement is an indicator of the structure of therelationships in the households the respondents reside. Itoriginally comprised nine categories which were reduced intothree because of sample size restrictions namely, ‘‘Unattached’’(individuals living alone or with people with whom he/she isunrelated), ‘‘Married couple living alone’’, and ‘‘Other’’. The lattercategory includes two- and single-parent households, personswho could be living with one or both of their parents, and thoseliving with one or both of their parents and the respondent’ssiblings among others. The ‘‘Unattached’’ was the referencecategory.
Following Statistics Canada (2005b), total household incomefrom all sources in the preceding 12 months of the survey, andadjusted for household size was used to define two levels ofincome: the low income level includes incomes of less than$30,000 for families of two, less than $40,000 for families of threeand four, and less than $60,000 for families of five or more.Families earning more than the cut-off point for a given size wereconsidered high income families. People in households with highincome were the base category. Based on respondent’s highestlevel of education attained, a distinction is made between thosewith less than high school and those with at least high schooleducation. The latter was the reference category.
Based on responses to current smoking behaviour, respondentswere assigned into one of the following groups: non-smoker, dailysmoker, and occasional smoker. The ‘‘Non-smoker’’ was thereference category. Respondents who reported consuming alcoholin the last 12 months preceding the survey were grouped intoeither: habitual drinker (consumed alcohol at least once weekly),and occasional drinker (consumed alcohol less than once weekly).Those who reported not drinking (teetotaller) in the last 12months were the reference category. Physical activity is derivedfrom the responses to the questions on leisure time activitiesengaged by the respondents and the energy expenditure asso-ciated with engaging in the particular physical activity. Thephysical activities included walking, gardening or yard work,swimming, bicycling, popular or social dancing, home exercises,ice hockey, skating, in-line skating or rollerblading, jogging orrunning, golfing, exercise class or aerobics, downhill skiing orsnowboarding, bowling, baseball, softball, tennis, weight-training,
fishing, volleyball, and basketball. Respondents were grouped intoone of the following groups based on their energy expenditure:active, moderate, and inactive. The ‘active’ was the referencecategory.
2.3. Statistical analysis
The data used here have a hierarchical structure comprisingtwo levels; individual respondents (Level 1 units) are nestedwithin neighbourhoods (Level 2 units). Because the outcomevariable is a three-category measure, two-level multinomiallogistic models with i individuals nested in j neighbourhoodswere estimated. Three models were fitted; the first is a null modelwith no covariates, the second added neighbourhood-level factorsto the first model, and the third added individual-level measuresto the second model. The first model responded to the firstobjective to determine whether there is between-neighbourhoodvariation in self-rated health. The second and third modelsresponded to the second objective of examining the determinantsof self-rated health (including the relative effect of individual-versus neighbourhood-level factors), and quantifying the effect ofcontextual and individual factors on neighbourhood variation inself-rated health.
The resulting neighbourhood-level variance estimates wereused to calculate intra-class (neighbourhood) correlation coeffi-cients. This is a measure of the extent to which self-rated healthexperiences of people in the same neighbourhood are homo-geneous. This interpretation is usually better understood in termsof an underlying continuous latent variable representing thepropensity of health outcomes of residents of the same neigh-bourhood to be correlated (Snijders and Bosker, 1999). Theindividual-level residuals (Level 1) are assumed to have astandard logistic distribution with mean 0 and variance p2/3.Another interpretation of the intra-class correlation coefficient isthat it is a measure of neighbourhood-level variation attributableto unobserved factors.
The models were estimated using MLwiN software version2.02 (Rasbash et al., 2005). To account for the complex design ofthe CCHS, the models were fitted using Monte Carlo ChainModelling (MCMC) procedures in MLwiN. MCMC methods aresimulation-based procedures which are run for many iterations,and at each iteration an estimate for each unknown parameter isproduced. The objective of the approach is to generate a sample ofvalues from the posterior distribution of the unknown para-meters. The methods are therefore useful for producing accurateinterval estimates (Browne, 2009).
3. Results
The distribution of the responses on self-rated health and thepredictor variables as defined in this study is presented in Table 1.Overall, 35% of the respondents reported their health status asgood, 37.6% said their health was excellent or very good, while27.4% reported their health as fair or poor. One-fifth of therespondents did not report or had missing information onhousehold income, 9.3% did not state their sense of communitybelonging, 7.7% did not report whether they engage in physicalexercise, 3.3% did not state their educational attainment, while 2%did not state the frequency of alcohol drinking even though theyreported drinking. For each of these variables, a separate categorywas created so as to retain the missing cases in the regressionanalysis. Although this category is of little interpretive value,retaining the cases with missing information ensures that thesample used for the analysis is more complete and therefore lessbiased. However, the results for the category were not reported.

Table 1Self-reported sample characteristics, Canadian Community Health Survey, 2001,
2003, and 2005, and Canadian census, 2001.
Variable
Neighbourhood-level characteristics (N) 26,820
Household median income (%)
o$20,000 2.7
$20,000–o$40,000 31.9
$40,000–o$60,000 42.2
$60,000–o$80,000 16.1
Z$80,000a 7.1
Z15% ohigh school education 85.6
Z15% aged Z65 41.5
Z15% aged Z65 non-family persons 75.2
Z15% visible minority 16.5
Z15% recent immigrants 2.9
Individual-level characteristics (n) 80,865
Self-rated health (%)
Fair/poor SRH 27.4
Good SRH 35.0
Excellent/very good SRH 37.6
Age (%)
65–69a 31.0
70–74 27.0
75–79 20.8
Z80 21.4
Male (%) 44.0
Visible minority (%) 7.5
Sense of community belonging (%)
Stronga 62.8
Weak 27.9
Not stated 9.3
Living arrangements (%)
Unattacheda 32.1
Couple living alone 50.9
Other 17.0
Household income (%)
Low 40.6
Higha 39.3
Income not stated 20.1
Education (%)
oHigh school 44.8
ZHigh schoola 51.9
Education not stated 3.3
Smoking status (%)
Non-smoker 88.9
Daily smoker 9.4
Occasional smoker 1.7
Alcohol drinking (%)
Teetotallera 32.6
Habitual drinker 33.7
Occasional drinker 31.7
Drinking frequency not stated 2.0
Physical activity (%)
Activea 16.6
Moderate 21.2
Inactive 54.5
Physical activity not stated 7.7
Note: The estimates for the individual characteristics are based on normalised
sampling weights.
a Reference category in multivariate analysis.
D. Walter Rasugu Omariba / Health & Place 16 (2010) 986–995990
Other variables including self-rated health, living arrangements,and smoking status had missing information for less than 1% ofthe sample; these cases were assigned the value of the referencecategory.
Although the results are presented in different tables, theestimates are obtained from single multilevel multinomial logistic
regression equations for a dependent variable with three possibleoutcomes. Table 2 shows odds ratios for fair or poor self-ratedhealth, while Table 3 presents similar results examining very goodor excellent self-rated health (Good¼Reference category). Thefirst results correspond to negative self-rated health, whereas thelatter are for positive self-rated health. The last two rows of bothTables 2 and 3 present results of the variance components and thecalculated intra-class correlation coefficient.
The results of Model 1 in both tables, which does not includeany covariates, shows that the estimate of neighbourhood-levelvariance is significant suggesting that there is unexplainedneighbourhood-level variation in the indicators of self-ratedhealth among older adult Canadians. Further, the results showthat the amount of variation attributable to neighbourhoods(intra-class correlation coefficient) is 2.8% and 3.1% for negativeand positive self-rated health, respectively. Although theseestimates declined overall in the subsequent models, they werestill statistically significant. In addition, the results indicate thatcontextual factors accounted for 52.2% and 31.5% of theneighbourhood variation in negative and positive self-ratedhealth, respectively (Models 2). However, the effect of indivi-dual-level factors on the variation between neighbourhoods is notnegligible (Models 3). The results of the null model also showedthat the random effects covariance of the intercepts for fair orpoor and excellent or very good self-rated health was small andstatistically insignificant (0.0007, and a standard error of 0.008)(not shown). To enhance model stability, the covariance term wasdropped from the subsequent models.
3.1. Determinants of negative self-rated health
The results of Model 1 with no covariates indicate that overall,older Canadians were less likely to report their health as fair orpoor than good (OR¼0.80, C.I.¼0.78, 0.82). This rating increasedwith inclusion of controls (Table 2). The results of Model 2 showthat among the neighbourhood factors, three factors (householdmedian income, low educational attainment, and percentage ofpeople aged Z65) were significantly associated with negativeself-rated health. For instance, relative to people living inneighbourhoods where the median household income wasZ$80,000, those living in neighbourhoods where the medianhousehold income was below o$80,000 were more likely toreport their health as fair or poor. Also, people who resided inneighbourhoods where the proportion of the population with lessthan high school education was Z15% were about 30% morelikely to report fair or poor than good self-rated health comparedto those in neighbourhoods where o15% of the population hadless than high school education. The results of Model 3 show thatwhereas neighbourhood income and low education remainedsignificant when individual-level factors were included; thepercentage of people aged Z65 in the neighbourhood was notsignificant over and above individual factors.
Except for visible minority status, all the other socio-demo-graphic factors were significantly associated with negative self-rated health (Model 3). Relative to people aged 65–69, people ofage Z70 were more likely to report fair or poor than good self-rated health. Compared to females, males were 26% more likely toreport fair or poor than good self-rated health. With respect tosocial capital, people with a weak sense of community belongingwere more likely to report their health as fair or poor than good(OR¼1.48). Both of the socioeconomic and the three health-related behavioural variables were significantly associated withnegative self-rated health. For example, compared to people livingin high income households, those living in households withlow income were 33% more likely to report fair or poor than good

Table 2Odds ratios for multilevel logistic regression of negative self-rated health among Canadian seniors (N¼80,865 individuals from 26,820 neighbourhoods).
Variable Model 1 Model 2 Model 3
Intercept 0.80* (0.78, 0.82) 0.51* (0.46, 0.57) 0.22* (0.19, 0.25)
Neighbourhood-level factors
Household median income
o$20,000 1.66* (1.45, 1.90) 1.25* (1.09, 1.42)
$20,000–o$40,000 1.36* (1.23, 1.50) 1.11* (1.01, 1.22)
$40,000–o$60,000 1.21* (1.10, 1.33) 1.06 (0.97, 1.17)
$60,000–o$80,000 1.16* (1.05, 1.29) 1.11* (1.00, 1.22)
Z15% o high school education 1.28* (1.17, 1.40) 1.13* (1.04, 1.22)
Z 15% aged Z65 0.94* (0.90, 0.97) 0.99 (0.95, 1.03)
Z15% aged Z65 non-family persons 1.02 (0.97, 1.07) 1.04 (0.99, 1.08)
Z15% visible minority 1.05 (0.99, 1.12) 1.06 (0.99, 1.12)
Z15% recent immigrants 1.04 (0.90, 1.20 ) 1.02 (0.89, 1.17)
Individual-level factorsAge
70–74 1.15* (1.09, 1.21)
75–79 1.31* (1.24, 1.38)
Z80 1.34* (1.27, 1.41)
Male 1.26* (1.21, 1.31)
Visible minority 1.07 (0.98, 1.16)
Weak sense of community belonging 1.48* (1.42, 1.54)
Living arrangements
Couple living alone 1.06* (1.02, 1.11)
Other 1.03 (0.96, 1.10)
Low household income 1.33* (1.27, 1.39)
oHigh school education 1.26* (1.21, 1.30)
Smoking status
Daily smoker 1.19* (1.13, 1.27)
Occasional smoker 1.24* (1.09, 1.42)
Alcohol drinking
Habitual drinker 0.64* (0.61, 0.67)
Occasional drinker 0.75* (0.72, 0.79)
Physical activity
Moderate 1.17* (1.08, 1.26)
Inactive 1.94* (1.80, 2.08)
Variance componenta 0.099 (0.013)* 0.046(0.012)* 0.051(0.004)*
Intra-class correlation coefficient, % 2.83 1.35 1.50
a Variance component is not an odds ratio, but the estimated parameter.* po0.05.
D. Walter Rasugu Omariba / Health & Place 16 (2010) 986–995 991
self-rated health. Relative to people who engage in leisurephysical activities, those who do not were 94% more likely toreport fair or poor than good self-rated health. Unexpectedly,older people who drink daily were 36%, while those who drinkoccasionally were 25% less likely to report fair or poor than goodself-rated health compared to teetotallers.
3.2. Determinants of positive self-rated health
Generally, the predictors of positive self-rated health aresimilar, but mirror images of those of negative self-rated health(Table 3). Overall, older adult Canadians were more likely to reporttheir health as very good or excellent than good as measured bythe odds ratio for the intercept. Just as in the case of negative self-rated health, this rating increased in magnitude as controls wereincluded (OR¼1.06 in Model 1 compared to 2.67 in Model 3).
Just as in the case of fair or poor self-rated health, neighbour-hood household median income and low educational attainmenthad a significant association with very good or excellent self-ratedhealth. The probability of reporting excellent or very good self-rated health increased with each level of neighbourhood house-hold median income. On the other hand, low neighbourhood
education was associated with lower odds of reporting excellentor very good self-rated health. Unlike negative self-rated health,the percentage of visible minority was significant for positive self-rated health. People living in a neighbourhood where Z15% of thepeople are visible minority, were 7% less likely to report havingvery good or excellent self-rated health.
In Model 3 that includes individual-level factors, the effect ofboth neighbourhood household median income and low educa-tional attainment attenuated, but remained statistically signifi-cant. The effect of percent of visible minority, however, becamestatistically insignificant. Further, controlling for individual-levelfactors, the percentage of neighbourhood population that com-prises people aged Z65 became statistically significant.
Unlike the case of negative self-rated health, all individual-level predictors were significantly associated with positive self-rated health. Additionally, the results show that engagement inphysical activity, alcohol drinking, sense of community belonging,and education were the most important predictors of positiveself-rated health. For example, compared to people who arephysically active, those who are not were 38% less likely to reporttheir health as very good or excellent than good. Relative toteetotallers, habitual alcohol drinkers were 32% more likely toreport their health as very good or excellent than good. Further, a
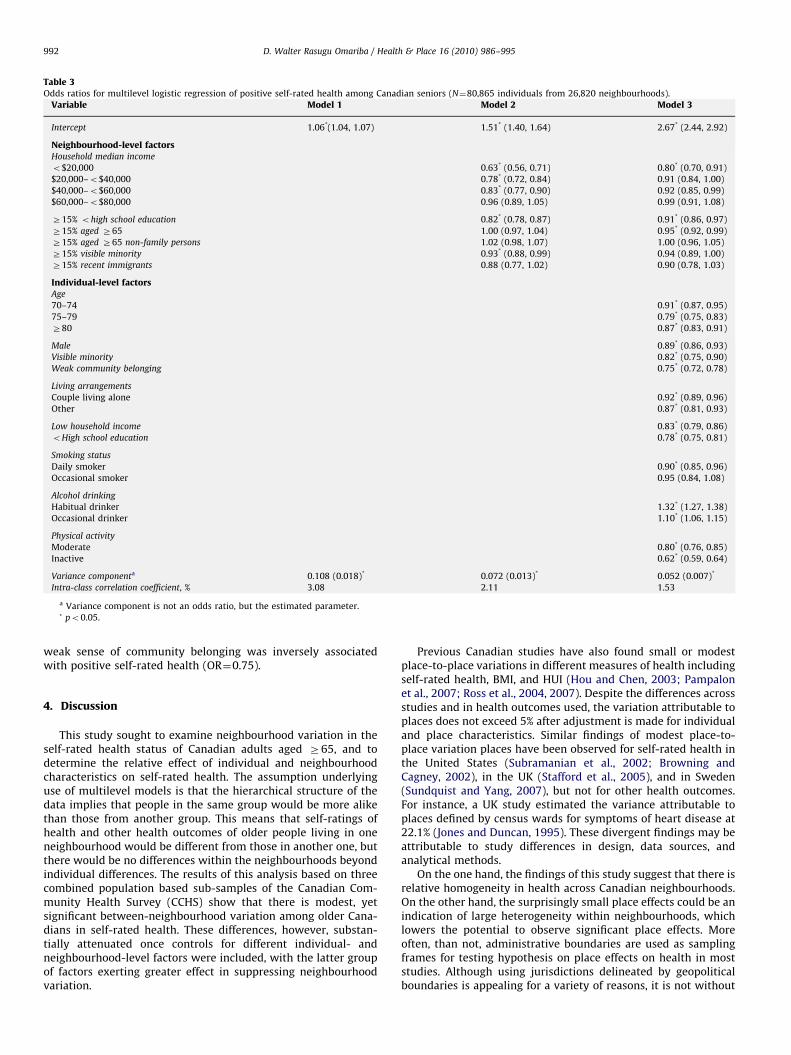
Table 3Odds ratios for multilevel logistic regression of positive self-rated health among Canadian seniors (N¼80,865 individuals from 26,820 neighbourhoods).
Variable Model 1 Model 2 Model 3
Intercept 1.06*(1.04, 1.07) 1.51* (1.40, 1.64) 2.67* (2.44, 2.92)
Neighbourhood-level factorsHousehold median income
o$20,000 0.63* (0.56, 0.71) 0.80* (0.70, 0.91)
$20,000–o$40,000 0.78* (0.72, 0.84) 0.91 (0.84, 1.00)
$40,000–o$60,000 0.83* (0.77, 0.90) 0.92 (0.85, 0.99)
$60,000–o$80,000 0.96 (0.89, 1.05) 0.99 (0.91, 1.08)
Z15% ohigh school education 0.82* (0.78, 0.87) 0.91* (0.86, 0.97)
Z15% aged Z65 1.00 (0.97, 1.04) 0.95* (0.92, 0.99)
Z15% aged Z65 non-family persons 1.02 (0.98, 1.07) 1.00 (0.96, 1.05)
Z15% visible minority 0.93* (0.88, 0.99) 0.94 (0.89, 1.00)
Z15% recent immigrants 0.88 (0.77, 1.02) 0.90 (0.78, 1.03)
Individual-level factorsAge
70–74 0.91* (0.87, 0.95)
75–79 0.79* (0.75, 0.83)
Z80 0.87* (0.83, 0.91)
Male 0.89* (0.86, 0.93)
Visible minority 0.82* (0.75, 0.90)
Weak community belonging 0.75* (0.72, 0.78)
Living arrangements
Couple living alone 0.92* (0.89, 0.96)
Other 0.87* (0.81, 0.93)
Low household income 0.83* (0.79, 0.86)
oHigh school education 0.78* (0.75, 0.81)
Smoking status
Daily smoker 0.90* (0.85, 0.96)
Occasional smoker 0.95 (0.84, 1.08)
Alcohol drinking
Habitual drinker 1.32* (1.27, 1.38)
Occasional drinker 1.10* (1.06, 1.15)
Physical activity
Moderate 0.80* (0.76, 0.85)
Inactive 0.62* (0.59, 0.64)
Variance componenta 0.108 (0.018)* 0.072 (0.013)* 0.052 (0.007)*
Intra-class correlation coefficient, % 3.08 2.11 1.53
a Variance component is not an odds ratio, but the estimated parameter.* po0.05.
D. Walter Rasugu Omariba / Health & Place 16 (2010) 986–995992
weak sense of community belonging was inversely associatedwith positive self-rated health (OR¼0.75).
4. Discussion
This study sought to examine neighbourhood variation in theself-rated health status of Canadian adults aged Z65, and todetermine the relative effect of individual and neighbourhoodcharacteristics on self-rated health. The assumption underlyinguse of multilevel models is that the hierarchical structure of thedata implies that people in the same group would be more alikethan those from another group. This means that self-ratings ofhealth and other health outcomes of older people living in oneneighbourhood would be different from those in another one, butthere would be no differences within the neighbourhoods beyondindividual differences. The results of this analysis based on threecombined population based sub-samples of the Canadian Com-munity Health Survey (CCHS) show that there is modest, yetsignificant between-neighbourhood variation among older Cana-dians in self-rated health. These differences, however, substan-tially attenuated once controls for different individual- andneighbourhood-level factors were included, with the latter groupof factors exerting greater effect in suppressing neighbourhoodvariation.
Previous Canadian studies have also found small or modestplace-to-place variations in different measures of health includingself-rated health, BMI, and HUI (Hou and Chen, 2003; Pampalonet al., 2007; Ross et al., 2004, 2007). Despite the differences acrossstudies and in health outcomes used, the variation attributable toplaces does not exceed 5% after adjustment is made for individualand place characteristics. Similar findings of modest place-to-place variation places have been observed for self-rated health inthe United States (Subramanian et al., 2002; Browning andCagney, 2002), in the UK (Stafford et al., 2005), and in Sweden(Sundquist and Yang, 2007), but not for other health outcomes.For instance, a UK study estimated the variance attributable toplaces defined by census wards for symptoms of heart disease at22.1% (Jones and Duncan, 1995). These divergent findings may beattributable to study differences in design, data sources, andanalytical methods.
On the one hand, the findings of this study suggest that there isrelative homogeneity in health across Canadian neighbourhoods.On the other hand, the surprisingly small place effects could be anindication of large heterogeneity within neighbourhoods, whichlowers the potential to observe significant place effects. Moreoften, than not, administrative boundaries are used as samplingframes for testing hypothesis on place effects on health in moststudies. Although using jurisdictions delineated by geopoliticalboundaries is appealing for a variety of reasons, it is not without

D. Walter Rasugu Omariba / Health & Place 16 (2010) 986–995 993
unwelcome consequences; they comprise large population het-erogeneity. Another possible reason is that the definition andselection of spatial unit used for such studies is done withoutreference to the health issues that are studied. Further, forsubjective measures of wellbeing such as self-rated health, peoplemore likely base their responses about their health in comparisonto others in their neighbourhood, and not how they feel inabsolute terms (Boyle and Willms, 1999). Consequently, there willbe small variation within places for self-rated health. The smallplace effect on health observed in this study and others maycreate an impression that examining the role of place is notimportant. Nonetheless, because most large population surveyshave a hierarchical structure, it is statistically necessary to usemultilevel techniques. Substantively, multilevel modelling is alsojustified because policies and resource allocations referenceplaces.
Relative to neighbourhood factors, individual characteristicshad a greater effect on self-rated health. The most important ofthese were factors associated with health-related behaviours andsocioeconomic status, and the sense of community belonging.Surprisingly, frequent alcohol consumption had a negative effecton poor and a positive effect on better self-rated health. Althoughthis result is consistent with previous Canadian research (e.g.,Shooshtari et al., 2007), it does not suggest that alcoholconsumption per se is beneficial for health. In particular, themeasure of alcohol consumption in the CCHS only captured thefrequency and not the amount consumed. Studies elsewhere thathave included a measure of the amount of alcohol consumed,have found it to be positively associated with poor self-ratedhealth (Guallar-Castillon et al., 2001), and to be negativelyassociated with good, very good, or excellent self-rated health(Brown et al., 2007). Moderate alcohol consumption even on dailybasis, however, is associated with better health outcomesincluding reduced risk of heart attacks and diabetes, bettercognitive function, and increase in bone density (Gaziano et al.,1993; Feskanich et al., 1999; Reid et al., 2006). On the other hand,the effect of engagement in physical activity and smoking were inthe expected directions and consistent with previous research ontheir role in overall health assessments (Shields and Martel, 2003;Bailis et al., 2003). The importance of the results is that thesefactors are within the realm of personal control and involve thingsthat individuals can do to improve their health and do notnecessarily require external intervention.
Education and income were the indicators of socioeconomicstatus. People with less than high school education and thoseliving in households with lower income were more likely to reportnegative self-rated health. An interesting finding relates toneighbourhood median household income and education, whichremained significant even with controls for individual income andeducation. This suggests that there is a benefit to living in aneighbourhood with higher median income that is independent ofpersonal socioeconomic status. Living in such neighbourhoodsmay be associated with certain services and programs whichpromote overall health or influence positive perception ofindividual health that are accessible to everyone living there.For instance, an US study examining whether the associationbetween neighbourhood characteristics and health differs forpeople with and without a chronic condition found that having achronic condition was associated with substantially poorer self-rated health among participants in deprived areas than amongthose in more advantaged areas (Brown et al., 2007). Thissuggested that living in a disadvantaged neighbourhood poses abarrier to the management of a chronic condition. Withoutassessing availability and access to services in the neighbourhood,however, it is difficult to draw firm conclusions on their effect onoverall health including self-rated health.
Similar to other most developed countries, an increasingnumber of older adults could be living alone in Canada becauseof the ageing of the population (Gavrilov and Heuveline, 2003). Itis therefore not surprising that the sense of community belongingis an important predictor of their health. It is also instructive thatolder adults who live in neighbourhoods where Z15% of thepopulation are of age 65 and over were less likely to report poorhealth (Model 2, Table 2). However, the association between theproportion of a neighbourhood population aged Z65 andnegative self-rated health became statistically insignificant inmodels with individual-level factors including sense of commu-nity belonging. However, controlling for individual-level factorsboosted the effect of the proportion of a neighbourhood popula-tion aged Z65 on positive self-rated health. On the one hand, theresults of Model 2 suggest that older adults who live inneighbourhoods with a significant proportion of other olderpeople may have a strong sense of belonging and connectednessin the community (Table 2). Extant research in Canada andelsewhere has shown that a strong sense of belonging andconnectedness in the community, which is also a measure ofsocial capital, is protective for health (e.g., Kawachi et al., 1999;Shields, 2008). On the other hand, the results of both sets of Model3 indicate that the effect of living in a neighbourhood with a largeconcentration of other older adults on health is largely dependenton the personal characteristics of the older adults. In particular,the results suggest that a large concentration of other seniors inone’s neighbourhood may not compensate for a personal weaksense of community belonging.
An offshoot of the current analysis is the potential to assesswhether the determinants of negative self-rated health are similarto those of positive self-rated health. This study shows that thepredictors of negative and positive self-rated health are generallythe same, but mirror images of each other. The results contradictprevious research in Canada (Shooshtari et al., 2007), and in theUS (Benyamini et al., 2003), but concur with a previous study inNetherlands (Mackenbach et al., 1994). The contrast in resultsbetween my study and that of Shooshtari et al. (2007) is notentirely surprising for two reasons. First, their study utilisedlongitudinal data, while the current study is based on cross-sectional data. Second, their study included people aged Z25, andcompared people of age o55 to those of age Z55. In contrast, mystudy is entirely based on people of age Z65. Overall, the resultsof this study suggest that the mechanisms underlying positiveself-rated health are not different from those of negative self-rated health.
No single study can bring together all the potential determi-nants of health into a single framework for analysis, and ours is noexception. For instance, the CCHS did not collect information fromseniors on other individual-level variables such as BMI, emotionalsupport, self-esteem and social involvement. Similarly, physicaland other social characteristics of neighbourhoods such asavailability of resources and services directed at seniors thatcould impact health have not been included in this analysisbecause the information is unavailable. Further, although theinformation was available, the study did not include healthconditions and healthcare utilisation factors to avoid saturatingthe models and also because these are attributes of one’s healthstatus that they use to make their self-rated health assessment.Some of these factors including alcohol abuse, crime rates, druguse, availability of healthcare and exercise facilities, variouscomponents of social capital, quality of housing, and unemploy-ment have been shown to have an impact on health outcomesincluding self-rated health (Felton and Shinn, 1992; Sampsonet al., 1997; Diez-Roux, 1998; Pickett and Pearl, 2001). Thisinformation is important for a better understanding of theinterrelationships between contextual factors, individual char-

D. Walter Rasugu Omariba / Health & Place 16 (2010) 986–995994
acteristics and health, but it is seldom collected in mostpopulation health surveys. It is therefore an area that wouldbenefit from future data collection efforts. Another limitation isthat this analysis did not examine cross-level interactions owingto limited data for each potential pair of neighbourhood andindividual-level variables. For instance, it might be of interest toknow whether low income people accrue any health advantagesby living in a high income neighbourhood.
Although individuals base the assessment of their health oncurrent health condition(s), more often than not, it is a reflectionof cumulative effects of life experiences. Previous research inCanada and elsewhere shows that people rate their overall healthbased on both their current health status, and also on over timechanges relating to chronic diseases, functional ability, socio-economic status, physical and mental health, health behavioursand lifestyle, social support, and body mass index (e.g., Shadbolt,1997; Benyamini et al., 2000; Bailis et al., 2003). Examining theinfluence of past socioeconomic status, health behaviours andlifestyles, and health conditions that impact current health statusassessment, however, was not possible because the analysis wasbased on cross-sectional data. Where the information is availableit can be used to assess the contribution of past health behavioursand conditions, and socioeconomic status on current health.Despite its limitations in respect to changes across time, thisstudy was based on a combined dataset of three cycles of thesame survey with data collected two years apart between eachsuccessive cycle. The findings are consistent with previousresearch on self-rated health and are likely to mirror those thatwould be derived from longitudinal data.
The findings of this study reinforce the longstanding view thatself-rated health is a complex phenomenon, which is influencedby a host of individual and contextual factors even among olderadults. There were modest, but significant between-neighbour-hoods differences in SRH, most of which were accounted for byneighbourhood-level factors especially median household incomeand education. Controlling for individual-level factors reducedsubstantially the magnitude of the effect of neighbourhood-levelfactors suggesting that compositional effects are more importantthan contextual effects on self-rated health among older Canadianadults. Because the environments in which people live are thebackdrop for the influence of individual-level factors includinghealth-related behaviours on health, they cannot be overlooked.
Acknowledgements
I gratefully acknowledge Dafna Kohen, Odwa Atari, and thereviewers for helpful comments on earlier drafts of the paper.
References
Bailis, D.S., Segall, A., Chipperfield, J.G., 2003. Two views of self-rated generalhealth status. Social Science and Medicine 56, 203–217.
Beland, F., Birch, S., Stoddart, G., 2002. Unemployment and health: contextual-level influences on the production of health in populations. Social Science andMedicine 55, 2033–2052.
Bell, N., Schuurman, N., Hameed, S.M., 2009. A Multilevel analysis of the socio-spatial pattern of assault injuries in Greater Vancouver, British Columbia.Canadian Journal of Public Health 100, 73–77.
Benyamini, Y., Leventhal, E.A., Leventhal, H., 2000. Gender differences inprocessing information for making self assessments of health. PsychosomaticMedicine 62, 354–364.
Benyamini, Y., Leventhal, E.A., Leventhal, H., 2003. Elderly people’s ratings of theimportance of health-related factors to their self-assessments of health. SocialScience and Medicine 56, 1661–1667.
Borrell, L.N., Diez Roux, A.V., Rose, K., Catellier, D., Clark, B., 2004. Neighborhoodcharacteristics and mortality in the Atherosclerosis Risk in CommunitiesStudy. International Journal of Epidemiology 33, 398–407.
Boyle, M.H., Willms, D., 1999. Place effects for areas defined by administrativeboundaries. American Journal of Epidemiology 149, 577–585.
Branch, L.G., Ku, L., 1989. Transition probabilities to dependency, institutionaliza-tion and death among the elderly over a decade. Journal of Aging and Health 1,370–408.
Brown, A.F., Ang, A., Pebley, A.R., 2007. The relationship between neighbourhoodcharacteristics and self-rated health for adults with chronic conditions.American Journal of Public Health 97, 926–932.
Browne, W.J., 2009. MCMC Estimation in MlwiN, v2.13. Centre for MultilevelModelling, University of Bristol.
Browning, C.R., Cagney, K.A., 2002. Neighborhood structural disadvantage,collective efficacy, and self-rated physical health in an urban setting. Journalof Health and Social Behavior 43, 388–399.
Browning, C.R., Cagney, K.A., 2003. Moving beyond poverty: neighborhoodstructure, social processes, and health. Journal of Health and Social Behavior44, 552–571.
Burstrom, B., Fredlund, P., 2001. Self rated health: is it as good a predictor ofsubsequent mortality among adults in lower as well as in higher socialclasses? Journal of Epidemiology and Community Health 55 836–840.
Chandola, T., Jenkinson, C., 2000. Validating self-rated health in different ethnicgroups. Ethnicity and Health 5, 151–159.
Cott, C.A., Gignac, M.A., Badley, E.M., 1999. Determinants of self rated health forCanadians with chronic disease and disability. Journal of Epidemiology andCommunity Health 53, 731–736.
Desalvo, K.B., Fan, V.S., McDonnell, M.B., Stephan, D.F., 2005. Predicting mortalityand health care utilisation with a single question. Health Services Research 40,1234–1246.
Diez-Roux, A.V., 1998. Bringing context back into epidemiology: variables andfallacies in multilevel analysis. American Journal of Public Health 88, 216–222.
Felton, B.J., Shinn, M., 1992. Social integration and social support: moving socialsupport beyond the individual level. Journal of Community Psychology 20,103–115.
Feskanich, D., Korrick, S.A., Greenspan, S.L., Rosen, H.N., Colditz, G.A., 1999.Moderate alcohol consumption and bone density among postmenopausalwomen. Journal of Women’s Health 8, 65–73.
Frohlich, N., Mustard, C., 1996. A regional comparison of socioeconomic and healthindices in a Canadian province. Social Science and Medicine 42, 1273–1281.
Gavrilov, L.A., Heuveline, P., 2003. Aging of the population. In: Demeny, P.,McNicoll, G. (Eds.), Encyclopedia of Population. Macmillan, New York, USA, pp.32–37.
Gaziano, J.M., Buring, J.E., Breslow, J.L., Goldhaber, S.Z., Rosner, B., VanDenburgh,M., et al., 1993. Moderate alcohol intake, increased level of high-densitylipoprotein and its subfractions, and decreased risk of myocardial infarction.The New England Journal of Medicine 329, 1829–1834.
Glazier, R.H., Badley, E.M., Gilbert, J.E., Rothman, L., 2000. The nature of increasedhospital use in poor neighbourhoods: findings from a Canadian inner city.Canadian Journal of Public Health 91, 268–273.
Guallar-Castillon, P., Rodrıguez-Artalejo, F., Ganan, L.D., Banegas, J.R.B., Urdinguio,P.L., Cabrera, R.H., 2001. Consumption of alcoholic beverages and subjectivehealth in Spain. Journal of Epidemiology and Community Health 55, 648–652.
Hou, F., Chen, J., 2003. Neighbourhood low income, income inequality and healthin Toronto. Health Reports 14, 21–34.
Hou, F., Myles, J., 2005. Neighbourhood inequality, neighbourhood affluence andpopulation health. Social Science and Medicine 60, 1557–1569.
Jones, K., Duncan, C., 1995. Individuals and their ecologies: analysing thegeographies of chronic illnesses within a multilevel modelling framework.Health and Place 1, 27–40.
Kaplan, M.S., Berthelot, J.-M., Feeny, D., McFarland, B.H., Khan, S., Orpana, H., 2007.The predictive validity of health-related quality of life measures: mortality in alongitudinal population-based study. Quality of Life Research 16, 1539–1546.
Kawachi, I., Kennedy, B.P., Glass, R., 1999. Social capital and self-rated health: acontextual analysis. American Journal of Public Health 89, 1187–1193.
Kubzansky, L.D., Subramanian, S.V., Kawachi, I., Fay, M.E., Soobader, M.-J.,Berkman, L.F., 2005. Neighbourhood contextual influences on depressivesymptoms in the elderly. American Journal of Epidemiology 162, 253–260.
Luo, Z.-E., Wilkins, R., Kramer, M.S., for the Fetal and Infant Health Study Group ofthe Canadian Perinatal Surveillance System, 2006. Effect of neighbourhoodincome and maternal education on birth outcomes: a population-based study.Canadian Medical Association Journal 174, 1415–1421.
Mackenbach, J.P., Bos, J.V.D., Joung, I.M.A., Mheen, H.V.D., Stronks, K., 1994.The determinants of excellent health: different from the determinants ofill-health? International Journal of Epidemiology 23, 1273–1281.
Mansson, N.-O., Rastam, L., 2001. Self-rated health as a predictor of disabilitypension and death—a prospective study of middle-aged men. ScandinavianJournal of Public Health 29, 151–158.
Marlmstrom, M., Sundquist, J., Johansson, S.E., 1999. Neighbourhood environmentand self-rated health status: a multilevel analysis. American Journal of PublicHealth 89, 1181–1186.
Martel, I., Belanger, A., 1999. An analysis of the changes in dependency free lifeexpectancy in Canada between 1986 and 1996. In: Belanger, A., Gilbert, S.(Eds.), Report on the Demographic Situation in Canada, 1986 and 1996.Statistics Canada, Ottawa, pp. 164–186.
Menec, V.H., Shooshtari, S., Nowicki, S., Fournier, S., 2010. Does the relationshipbetween neighborhood socioeconomic status and health outcomes persist intovery old age? A population-based study. Journal of Aging and Health 22, 27–47.
Meersman, S.C., 2005. Objective neighborhood properties and perceptions ofneighborhood problems: using a geographic information system (GIS) inneighborhood effects and ageing research. Ageing International 30, 63–87.
D. Walter Rasugu Omariba / Health & Place 16 (2010) 986–995 995
Mor, V., Wilcox, V., Rakowski, W., Hiris, J., 1994. Functional transitions among theelderly: patterns, predictors and related hospital use. American Journal ofPublic Health 84, 1274–1280.
Oliver, L.N., Hayes, M.V., 2007. Does choice of spatial unit matter for estimatingsmall-area disparities in health and place effects in the Vancouver censusmetropolitan area? Canadian Journal of Public Health 98 (Suppl. 1) S27–S34.
O’Loughlin, J., Paradis, G., Meshefedjian, G., Gray-Donald, K., 2000. A five-yeartrend of increasing obesity among elementary schoolchildren in multiethnic,low-income, inner-city neighborhoods in Montreal, Canada. InternationalJournal of Obesity 24, 1176–1182.
Pampalon, R., Duncan, C., Subramanian, S.V., Jones, K., 1999. Geographies of healthperception in Quebec: a multilevel perspective. Social Science and Medicine48, 1483–1490.
Pampalon, R., Hamel, D., Koninck, M.D., Disant, M.-J., 2007. Perception of place andhealth: differences between neighbourhoods in the Quebec City Region. SocialScience and Medicine 65, 95–111.
Pampalon, R., Hamel, D., Gamache, P., 2010. Health inequalities in urban and ruralCanada: comparing inequalities in survival according to an individual andarea-based deprivation index. Health and Place 16, 416–420.
Perruccio, A.V., Power, J.D., Badley, E.M., 2007. The relative impact of 13 chronicconditions across three different outcomes. Journal of Epidemiology andCommunity Health 61, 1056–1061.
Pickett, K.E., Pearl, M., 2001. Multilevel analyses of neighbourhood socioeconomiccontext and health outcomes: a critical review. Journal of Epidemiology andCommunity Health 55, 111–122.
Poortinga, W., 2006. Social relations or social capital? Individual and communityhealth effects of bonding social capital. Social Science and Medicine 63, 255–270.
Rasbash, J., Browne, W., Healey, W., Cameron, B., Charlton, C., 2005. MLwiN Version2.02. Institute of Education, Multilevel Models Project, London.
Reid, M.C., Van Ness, P.H., Hawkins, K.A., Towle, V., Concato, J., Guo, Z., 2006. Lightto moderate alcohol consumption is associated with better cognitive functionamong older male veterans receiving primary care. Journal of GeriatricPsychiatry and Neurology 19, 98–105.
Renaud, V., Costa, R., 1999. 1996 Census of Population: Certification Report,Population Group. Housing, Family and Social Statistics Division, StatisticsCanada, Ottawa.
Robert, S.A., 1999. Socioeconomic position and health: the independent contributionof community socioeconomic context. Annual Review of Sociology 25, 489–516.
Ross, N.A., Tremblay, S., Graham, K., 2004. Neighbourhood influences on health inMontreal, Canada. Social Science and Medicine 59, 1485–1494.
Ross, N.A., Tremblay, S., Khan, S., Crouse, D., Tremblay, M., Berthelot, J.-M., 2007.Body mass index in urban Canada: neighbourhood and metropolitan areas.American Journal of Public Health 97, 500–508.
Sampson, R., Raudenbush, S., Earls, F., 1997. Neighbourhoods and violent crime: amultilevel study of collective efficacy. Science 277, 918–924.
Schroeder, S., Baumbach, A., Herdeg, C., Oberhoff, M., Buchholz, O., Kuettner, A.,et al., 2001. Self-rated health and clinical status after PTCA: results of a 4-yearfollow-up in 500 patients. European Journal of Internal Medicine 12, 101–106.
Shadbolt, B., 1997. Some correlates of self-rated health for Australian women.American Journal of Public Health 87, 951–956.
Sheffield, K.M., Peek, M.K., 2009. Neighbourhood context and cognitive decline inolder Mexican Americans: results from Hispanic Established Populations forEpidemiologic Studies in the Elderly. American Journal of Epidemiology 169,1092–1102.
Shields, M., Martel, L., 2003. Healthy living among seniors. Health Reports 16, 7–20.Shields, M., 2008. Community belonging and self-perceived health. Health Reports
19, 1–10.Shooshtari, S., Menec, V., Tate, R., 2007. Comparing predictors of positive and
negative self-rated health between younger (25–54) and older (55+) Canadianadults: a longitudinal study of well-being. Research on Aging 29, 512–554.
Snijders, T.A.B., Bosker, R.J., 1999. Multilevel Analysis: An Introduction to Basic andAdvanced Modelling. Sage, London.
Stafford, M., Cummins, S., Macintyre, S., Ellaway, A., Marmot, M., 2005. Genderdifferences in the associations between health and neighbourhood environ-ment. Social Science and Medicine 60, 1681–1692.
Statistics Canada, 2003a. 2001 Census Dictionary. Ministry of Industry, Ottawa.Statistics Canada, 2003b. CCHS Cycle 1.1 (2000–2001), Public Use Microdata File
Documentation. Health Statistics Division, Statistics Canada, Ottawa, ON.Statistics Canada, 2005a. Canadian Community Health Survey Cycle 2.1 (2003)
Public Use Microdata Documentation. Health Statistics Division, StatisticsCanada, Ottawa, ON.
Statistics Canada, 2005b. Canadian Community Health Survey Cycle 2.1 Public UseMicrodata Documentation: Derived and Grouped Variable Specifications.Health Statistics Division, Statistics Canada, Ottawa, ON.
Statistics Canada, 2006. Canadian Community Health Survey (CCHS) Cycle 3.1(2005) Public Use Microdata File User Guide. Statistics Canada, Ottawa.
Subramanian, S.V., Kim, D.J., Kawachi, I., 2002. Social trust and self-rated health inus communities: a multilevel analysis. Journal of Urban Health: Bulletin of theNew York Academy of Medicine 79, S21–S34.
Sundquist, K., Yang, M., 2007. Linking social capital and self-rated health: amultilevel analysis of 11,175 men and women in Sweden. Health and Place 13,324–334.
Thomas, S., Wannell, B., 2009. Combining cycles of the Canadian CommunityHealth Survey. Health Reports 20, 1–7.
Turcotte, M., Schellenberg, G., 2006. A Portrait of Seniors in Canada. StatisticsCanada, Ottawa (Catalogue no. 89-519-XIE).
Urquia, M.L., Frank, J.W., Glazier, R.H., Moineddin, R., Matheson, F.I., Gagnon, A.J.,2009. Neighborhood context and infant birthweight among recent immigrantmothers: a multilevel analysis. American Journal of Public Health 99, 285–293.
Veenstra, G., 2005. Location, location, location: contextual and compositionalhealth effects of social capital in British Columbia, Canada. Social Science andMedicine 60, 2059–2071.
Veugelers, P.J., Yip, A.M., Kephart, G., 2001. Proximate and contextual socio-economic determinants of mortality: multilevel approaches in a settingwith universal health care coverage. American Journal of Epidemiology 154,725–732.
Wilcox, V.L., Kasl, S.V., Idler, E.L., 1996. Self-rated health and physical disability inelderly survivors of a major medical event. The Journal of Gerontology: SocialSciences 51B, S96–S104.
Wilkins, R., 2007. PPCF+ Version 4J User’s Guide: Automated Geographic CodingBased on the Statistics Postal Code Conversion Files Including Postal CodesThrough September 2006. Statistics Canada, Ottawa (Catalogue No. 82F0086-XDB).
Willms, J.D., 2001. Three hypotheses about community effects on social outcomes.ISUMA: Canadian Journal of Policy Research 2, 53–62.
Wilson, K., Elliott, S., Law, M., Eyles, J., Jarrett, M., Keller-Olaman, S., 2004. Linkingperceptions of neighbourhood to health in Hamilton, Canada. Journal ofEpidemiology and Community Health 58, 192–198.