negotiating the geological structure of the enlarged cotter · pdf file ·...
TRANSCRIPT

Q. 94 – R. 5
COMMISSION INTERNATIONALE DES GRANDS BARRAGES
------- VINGT-QUATRIÈME CONGRÈS
DES GRANDS BARRAGES Kyoto, Juin 2012
-------
COMPLEMENTARY USE OF PHYSICAL AND NUMERICAL MODELLING
TECHNIQUES IN SPILLWAY DESIGN REFINEMENT *
James WILLEY
GHD Pty Ltd, Brisbane, QLD,
Thomas EWING
GHD Pty Ltd, Melbourne, VIC,
Bob WARK
GHD Pty Ltd, Perth, WA,
Eric LESLEIGHTER
Lesleighter Consulting Pty Ltd, Cooma, NSW,
AUSTRALIA
1. INTRODUCTION
The design of recent projects involving new or upgraded spillways have
benefited from the complementary use of both Computational Fluid Dynamics
(CFD) techniques and physical scale modelling. As well as providing significant
benefits to the design process for these projects, this parallel use has provided
invaluable data for the comparison of the techniques which may lead to greater
confidence in the future use of standalone CFD analyses in spillway design.
The design process recently adopted for complex spillway designs involved
the initial development of a concept or preliminary design using theoretical and
empirical design methods, together with published data. These arrangements
* Utilisation complémentaire des techniques de modélisation numérique et physique pour
l’amélioration de la conception des déversoirs.
55

Q. 94 – R. 5
were then analysed and optimised through CFD modelling and, where required,
physical scale modelling was used for final verification and refinement.
A comparison of the results from CFD and physical models is presented
where both have been used in the design process and conclusions are drawn on
the applicability of standalone CFD analyses. Projects on which GHD was the
designer and which are discussed herein include the spillway for the new
Enlarged Cotter Dam and remedial works at Lake Manchester, Blue Rock and
Wellington Dams.
2. BACKGROUND
Physical scale modelling has been used in the design and investigation of
hydraulic structures for over 100 years. The design process has typically
involved the development of a preliminary design on the basis of theoretical and
empirical methods. A physical scale model of this arrangement would then be
constructed in two- or three-dimensions and various scenarios run to confirm
whether the hydraulic performance was acceptable and to extract data for input
to the design. The methods are tried and tested and the outputs from the model
testing in terms of data and observations are invaluable in the design process.
However, the construction, operation, and testing of physical models is often a
time-consuming and expensive exercise. Furthermore, the modification of the
model to trial alternative arrangements or to optimise features can add weeks to
a testing programme.
Through recent advances in computing power and modelling software
capabilities, it is now feasible to undertake complex three-dimensional analyses
using CFD techniques. To date, CFD modelling has generally been used as a
valuable tool in the optimisation phase of the project prior to the commissioning
of a physical model study. The major benefit of the CFD modelling in this
capacity was that it allowed the early identification of problematic flow features
and modifications to the layout could be trialled rapidly and cost-effectively.
Although CFD modelling packages now have the capability to analyse complex
hydraulic conditions common in spillways such as air entrainment, flow
separation, turbulence and shock waves, there is however a significant lack of
calibration and validation studies (between CFD and physical models and also
between model and prototype) for these advanced applications and caution
should be applied to their use in design.
56
Q. 94 – R. 5
3. CFD MODELLING CAPABILITIES AND APPLICATION
TO ANALYSIS OF SPILLWAYS
The most common, and reliable CFD analysis of spillways involves model-
ling of flow in the spillway approach, over spillway crests, and around obstacles
such as piers and flow training walls. Models of this type are used to generate
rating curves, predict water surface elevations and identify zones of unfavourable
flow behaviour. Examples of practical and accurate modelling of these flows are
presented in this paper, and many more can be found in the published literature.
In these relatively simple cases the dynamics are dominated by what is
fundamentally a transfer of potential energy to kinetic energy and flow around
abrupt obstacles. Modelling of these processes to a reasonable degree of
accuracy does not require accurate simulation of turbulence or boundary layers,
allowing the use of coarse model grids and simple turbulence models. By
contrast, the dynamics of high speed flow down steep spillways or chutes are
dominated by the production and dissipation of turbulence and require careful
model and mesh configuration.
Aeration of spillway flows is another process that is very dependent upon
the accurate representation of turbulence and boundary layer dynamics. Several
CFD codes do have the capability to model interpenetrating phases (in this
instance air bubbles in water), but at present only a relatively small number of
aerated flows have been modelled successfully using CFD. This was not
considered in the examples presented herein as the CFD modelling in these
cases was used as an initial optimisation tool using a coarser grid resolution for
more rapid processing. Further work is required in this area. Further comments
on the limitations of CFD are included in the conclusions.
4. COMPARISON OF CFD AND PHYSICAL MODEL DATA
4.1 ENLARGED COTTER DAM
4.1.1 Brief Description of the Project
The Enlarged Cotter Dam (ECD) is a new 87 m high roller-compacted
concrete dam under construction at the time of writing in 2011. The spillway
includes a central primary stepped spillway tapering from 70 m at the crest to
approximately 45 m at the entrance to the stilling basin. Stepped secondary
spillways were provided over each abutment and operate for floods greater than
the 1:1000 annual exceedance probability (AEP) discharge. The discharge from
57

Q. 94 – R. 5
the secondary spillways is conveyed to the river channel by stepped abutment
return channels or cascades.
The primary spillway has an ogee crest designed for the maximum head,
while the secondary spillway crest is horizontal with a downstream transition
curve designed for half the maximum head. The primary spillway curve
transitions into steps approximately 9 m horizontally from the upstream face. The
design for the project utilised both two- and three-dimensional CFD analyses
using in-house capabilities and a 1:45 scale three-dimensional physical model by
Manly Hydraulics Laboratory (MHL).
4.1.2 Spillway Discharge Rating
The initial rating curve for the project was derived from published data
in [1]. Discharge coefficients were derived from the two-dimensional CFD
analyses for the primary and secondary spillway crests. From the physical model
study, it was only possible to calculate discharge coefficients for the primary spill-
way crest for discharges up to the 1:1000 AEP event or a unit discharge (q) of
about 8 m³/s/m. Beyond this level, the secondary spillways began to operate and
it was therefore not possible to calculate discharge coefficients for either crest
without making assumptions. The discharge coefficients derived from the various
methods for the primary and secondary spillway crests are presented in Fig. 1.
Fig. 2 presents a comparison of the discharge rating curves derived from the
discharge coefficients plotted in Fig. 1.
Fig. 1
Relationship between unit discharge and discharge coefficient for Cotter Dam
Relation entre le coefficient de débit et le débit unitaire pour le barrage de Cotter
1
1.2
1.4
1.6
1.8
2
2.2
2.4
2.6
0 10 20 30 40 50 60 70 80
Co
eff
icie
nt
of
dis
ch
arg
e
Unit Discharge (m³/s/m)
Primary - USACE WES data
Primary - CFD model data
Primary - physical model data
Secondary - USACE WES data
Secondary - CFD model data
58

Q. 94 – R. 5
Fig. 2
Comparison of discharge rating curves for Cotter Dam
Comparaison des courbes de tarage pour le barrage de Cotter
For the primary spillway crest, the discharge coefficients calculated from
the physical model are within 5% of the USACE values. This was also the case
for the coefficients derived from the CFD analyses for q < 3 m³/s/m and
q > 36 m³/s/m. However, over the intermediate range, the calculated coefficients
were typically 8-13% less than the USACE values. For q > 6 m³/s/m over the
secondary spillway, the CFD analyses yielded discharge coefficients within 5% of
the USACE values. However, at low discharges, the CFD showed the crest was
less efficient than indicated by the USACE data.
Despite the differences in the discharge coefficients noted above, the
difference in the total head over the spillway for the probable maximum flood
(PMF) discharge of 5,710 m³/s was about 0.5%, with a marginally higher head
measured in the physical model. Similarly for the same reservoir level, the
difference in discharge estimates was about 1%.
4.1.3 Pressures
This comparison is based on results from the two-dimensional CFD model-
ling and the three-dimensional physical model, and published data from [1] and
[2]. In the physical model, pressures were measured using 145 pressure tap-
pings connected to manometers on eight sections across the the primary and
secondary spillways. Fig. 3 presents the calculated CFD and measured physical
model pressures over the primary spillway crest for q = 48 m³/s/m together with
published data from [1]. This represents the scenario with H/Hd = 1 (H = actual
head on the crest and Hd = design head. This is plotted using the dimensionless
parameters hp/Hd and x/Hd, (hp = pressure head and x = offset from the ogee
curve origin). Reasonable correlation is evident between the three data sets.
550
551
552
553
554
555
556
557
558
559
0 1000 2000 3000 4000 5000 6000 7000
Re
se
rvo
ir le
ve
l (R
L m
)
Discharge (m³/s)
USACE data
CFD data
Physcial model
59

Q. 94 – R. 5
Fig. 3
Primary spillway ogee crest pressures for Cotter Dam
Pression sur le principal seuil du déversoir en doucine du barrage de Cotter
The comparison in (b) Fig. 4 draws on results of the ECD CFD data as well
as physical model study data presented in [2]. In the Amador et al data [2],
pressure profiles on the horizontal and vertical faces of the steps were measured
in a two-dimensional stepped channel for a range of discharges corresponding to
0.89 < yc/h < 3.21, where yc is the critical depth and h is the step height. This
equates to 3.5 < q < 24 m³/s/m for the ECD arrangement.
(a)
-0.1
-0.05
0
0.05
0.1
0.15
0.2
0.25
0.3
-0.4 -0.3 -0.2 -0.1 0 0.1 0.2 0.3 0.4 0.5 0.6 0.7 0.8
hp/H
d
x/Hd
ECD CFD data
ECD physical model data
USACE WES data
0
0.5
1
1.5
2
2.5
3
3.5
00.10.20.30.40.50.60.70.80.91
Pm
/g/h
x/l
ECD CFD data
Amador et al physical model data
60

Q. 94 – R. 5
(b)
Fig. 1
Comparison of pressures on horizontal step surface for L/ks = 22.64 with
a) yc/h = 1.4 and b) yc/h = 2.7
Comparaison des pressions sur la surface horizontale au pied du déversoir pour
L/Ks = 22.64 avec a) yc/h = 1.4 et b) yc/h = 2.7
The pressure distribution in (b) Fig. 4 is for the horizontal step surface of
the step located at L/ks = 22.64 (with L being the developed length along the
chute from the crest and ks being the roughness height of the steps perpendicular
to the slope) and yc/h values of approximately 1.4 and 2.7. Dimensionless
parameters are plotted here, where Pm is the mean pressure and g is the unit
weight of the fluid. The distance, x, is measured in the upstream direction from
the downstream edge of the step and is plotted as a proportion of the step
length, l.
4.1.4 General Flow Conditions
The flow conditions observed in the physical model were generally well
replicated in the CFD analyses. Fig. 5 shows a comparison of the CFD output
and the physical model flow conditions for the 1:1 000 000 AEP event. Aside
from the specific parameters discussed above, a key aspect which was modelled
well was the deflection of the flow in the abutment return channels by the angled
steps and the shaped downstream wall.
0
0.5
1
1.5
2
2.5
3
3.5
00.10.20.30.40.50.60.70.80.91
Pm
/g/h
x/l
ECD CFD data
Amador et al physical model data
61

Q. 94 – R. 5
Fig. 5
Overview of Cotter Dam CFD and physical model flow conditions for
1:1 000 000 AEP event (Q = 3750 m³/s)
Aperçu des conditions d’écoulement du barrage de Cotter dans le modèle
de MFN et dans le modèle physique pour l’évènement de fréquence annuelle
1 :1 000 000 (Q= 3750 m³/s)
4.2 LAKE MANCHESTER DAM
4.2.1 Brief Description of the Project
Lake Manchester Dam is a 38 m high concrete gravity dam constructed
from 1912 to 1916. A dam safety upgrade was required to address identified
deficiencies including inadequate spillway capacity, erosion of the spillway and
unsatisfactory dam stability. The adopted upgrade solution included two rows of
post-tensioned anchors, raising of the non-overflow crest of the dam,
construction of a new spillway and upgrade of the outlet works. The new spillway
includes widening of the approach channel, a trapezoidal flat-topped crest
section to allow future placement of Fusegates and a steep, converging chute
discharging into a plunge pool. Construction was completed in 2008.
CFD analyses were undertaken by WorleyParsons during the design phase
on a range of geometries to review spillway approach conditions and chute
hydraulics for PMF conditions. MHL was subsequently commissioned to
construct and test a 1:40 scale physical model of the final arrangement for design
validation and refinement over the full range of discharges. The comparison and
data herein is largely based on the assessment presented in [3].
4.2.2 Spillway Discharge Rating
Reservoir levels were recorded over a range of spillway discharges in the
physical model, allowing calculation of the discharge coefficient for a range of
62
Q. 94 – R. 5
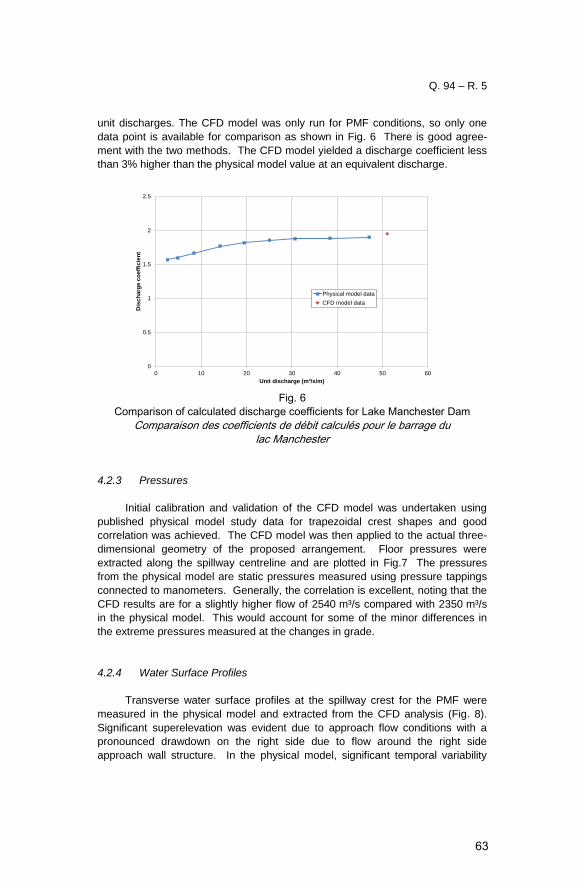
unit discharges. The CFD model was only run for PMF conditions, so only one
data point is available for comparison as shown in Fig. 6 There is good agree-
ment with the two methods. The CFD model yielded a discharge coefficient less
than 3% higher than the physical model value at an equivalent discharge.
Fig. 6
Comparison of calculated discharge coefficients for Lake Manchester Dam
Comparaison des coefficients de débit calculés pour le barrage du
lac Manchester
4.2.3 Pressures
Initial calibration and validation of the CFD model was undertaken using
published physical model study data for trapezoidal crest shapes and good
correlation was achieved. The CFD model was then applied to the actual three-
dimensional geometry of the proposed arrangement. Floor pressures were
extracted along the spillway centreline and are plotted in Fig.7 The pressures
from the physical model are static pressures measured using pressure tappings
connected to manometers. Generally, the correlation is excellent, noting that the
CFD results are for a slightly higher flow of 2540 m³/s compared with 2350 m³/s
in the physical model. This would account for some of the minor differences in
the extreme pressures measured at the changes in grade.
4.2.4 Water Surface Profiles
Transverse water surface profiles at the spillway crest for the PMF were
measured in the physical model and extracted from the CFD analysis (Fig. 8).
Significant superelevation was evident due to approach flow conditions with a
pronounced drawdown on the right side due to flow around the right side
approach wall structure. In the physical model, significant temporal variability
0
0.5
1
1.5
2
2.5
0 10 20 30 40 50 60
Dis
ch
arg
e c
oeff
icie
nt
Unit discharge (m³/s/m)
Physical model data
CFD model data
63

Q. 94 – R. 5
was noted due to “the major effects of flow turbulence interaction with upstream
topography and the spillway structure itself” [3]. Generally, the results from the
physical model and CFD analysis compare well, with the exception of adjacent to
the right side wall.
Fig. 7
Comparison of floor pressures from CFD and physical model for Lake
Manchester Dam
Comparaison de la pression au sol entre le modèle physique et le modèle de
MFN pour le barrage du lac Manchester
Fig. 8
Comparison of floor pressures from CFD and physical model for Lake
Manchester Dam
Comparaison de la pression au sol entre le modèle physique et le modèle de
MFN pour le barrage du lac Manchester
-120
-80
-40
0
40
80
120
160
200
0 5 10 15 20 25 30
Flo
or
pre
ss
ure
(k
Pa
)
Chainage (m)
Physical model data
CFD data
Crest profile
52.5
53
53.5
54
54.5
55
55.5
56
56.5
57
57.5
-30 -25 -20 -15 -10 -5 0 5 10 15 20 25 30
Wate
r su
rface e
levati
on
(R
L m
)
Offset from spillway centreline (m)
Physical model data
CFD data
64

Q. 94 – R. 5
4.2.5 Chute Waves
It was found that the CFD modelling was not able to reproduce the large
fluctuating waves in the converging chute which were identified in the physical
model study. Data on such waves is critical for the design of chute walls in terms
of height and the possible use of overhanging sections as wave deflectors.
4.3 BLUE ROCK DAM
4.3.1 Brief Description of the Project
Blue Rock Dam is located on the Tanjil River, around 30 km north of Moe,
Victoria, Australia. As part of a project to upgrade the spillway and chute, a CFD
study of the existing spillway and chute was undertaken. The hydraulics of the
spillway had previously been investigated in a physical scale modelling study and
reported in [4]. CFD model validation involved comparison of discharge rates,
approach velocities, and water levels in the chute. The domain modelled in the
CFD study is shown in Fig. 9.
Fig. 9
Blue Rock Dam Spillway CFD Model Domain
Domaine modèle de MFN du déversoir du Barrage de Blue Rock
4.3.2 Spillway Discharge Rating
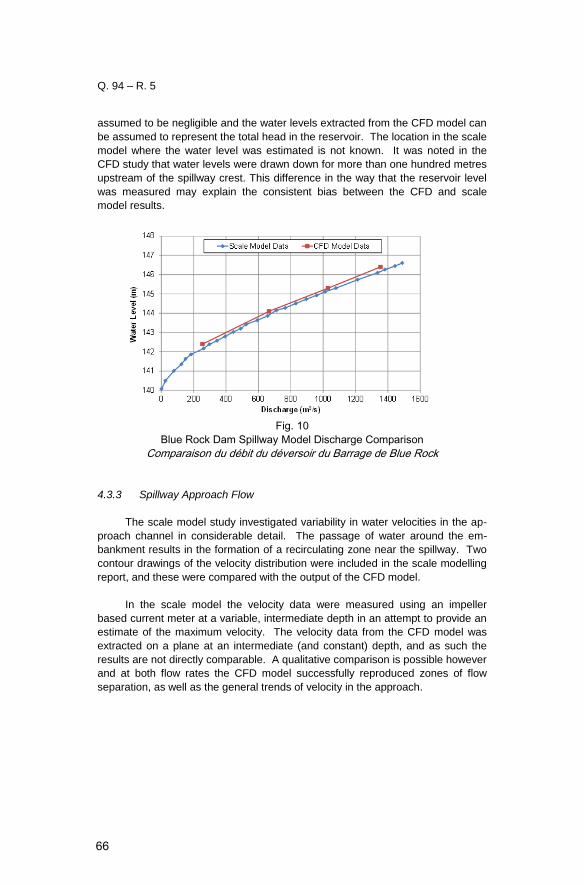
Fig. 10 compares discharge estimates from the scale model to estimates
from the CFD study. The results compare well, with the CFD reservoir head
consistently slightly higher than those estimated from the scale model.
The water levels from the CFD model were extracted at the model
boundary where the water velocity is very low. As such, the velocity head can be
65
Q. 94 – R. 5
assumed to be negligible and the water levels extracted from the CFD model can
be assumed to represent the total head in the reservoir. The location in the scale
model where the water level was estimated is not known. It was noted in the
CFD study that water levels were drawn down for more than one hundred metres
upstream of the spillway crest. This difference in the way that the reservoir level
was measured may explain the consistent bias between the CFD and scale
model results.
Fig. 10
Blue Rock Dam Spillway Model Discharge Comparison
Comparaison du débit du déversoir du Barrage de Blue Rock
4.3.3 Spillway Approach Flow
The scale model study investigated variability in water velocities in the ap-
proach channel in considerable detail. The passage of water around the em-
bankment results in the formation of a recirculating zone near the spillway. Two
contour drawings of the velocity distribution were included in the scale modelling
report, and these were compared with the output of the CFD model.
In the scale model the velocity data were measured using an impeller
based current meter at a variable, intermediate depth in an attempt to provide an
estimate of the maximum velocity. The velocity data from the CFD model was
extracted on a plane at an intermediate (and constant) depth, and as such the
results are not directly comparable. A qualitative comparison is possible however
and at both flow rates the CFD model successfully reproduced zones of flow
separation, as well as the general trends of velocity in the approach.
66

Q. 94 – R. 5
(a)
(b)
Fig. 11
Comparison of CFD and Scale Model Approach Velocity, a) 1:1000 AEP
discharge and b) 1:10 000 AEP discharge
Comparaison de la vélocité entre le modèle de MFN et le modèle physique pour
un débit de fréquence annuelle de a) 1:1000 et b) 1 :10 000
4.3.4 Spillway Chute Water Levels
Cross-sectional water surface profiles were measured at several cross
sections (control points) along the length of the chute. Fig. 12 shows that at a low
flow rate there is a good agreement between the CFD and scale model results,
fluctuations of water level and the formation of standing waves at this flow rate
are limited.
67

Q. 94 – R. 5
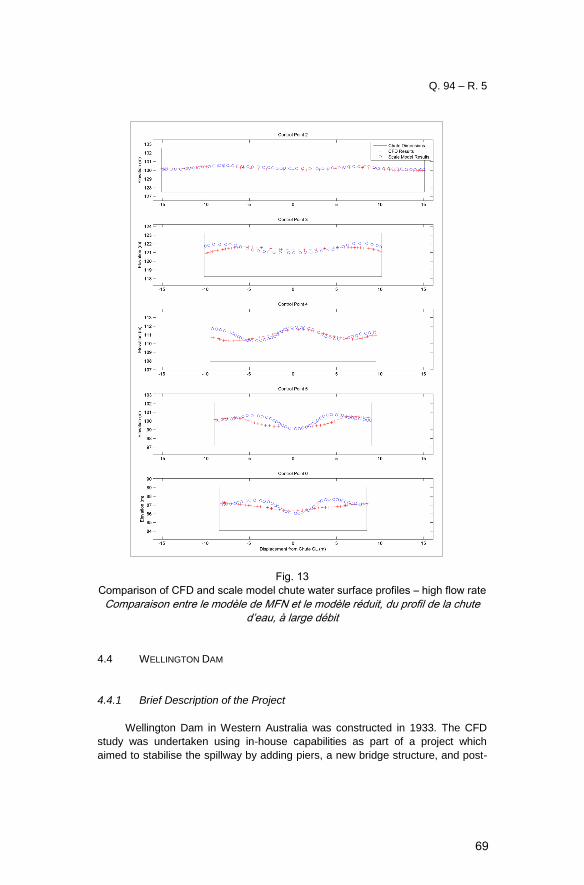
At high flow rates, the formation of standing waves is more pronounced,
and differences between the CFD and scale model results are evident (Fig. 13). It
is likely that these results diverge because of insufficient CFD model resolution in
the near wall area along the length of the chute. This coarse resolution does not
allow the velocity profile in the chute to be modelled accurately, and this has an
impact on the velocity predictions, the effects of roughness, and ultimately the
location of standing waves. In the context of this study, this limitation of the
constructed CFD model was noted and the results interpreted in the context of
this limitation.
Fig. 12
Comparison of CFD and scale model chute water surface profiles – low flow rate
Comparaison entre le modèle de MFN et le modèle réduit, du profil de la chute
d’eau, à petit débit
68
Q. 94 – R. 5
Fig. 13
Comparison of CFD and scale model chute water surface profiles – high flow rate
Comparaison entre le modèle de MFN et le modèle réduit, du profil de la chute
d’eau, à large débit
4.4 WELLINGTON DAM
4.4.1 Brief Description of the Project
Wellington Dam in Western Australia was constructed in 1933. The CFD
study was undertaken using in-house capabilities as part of a project which
aimed to stabilise the spillway by adding piers, a new bridge structure, and post-
69

Q. 94 – R. 5
tensioned anchors. The objectives of the CFD study were to investigate the uplift
generated on the spillway crest under high operating levels, and to investigate
the impact of the piers upon the discharge capacity of the spillway. The CFD
study was undertaken in parallel with a scale modelling study, and the results
were compared after both investigations were complete.
4.4.2 Scale Modelling Study
A scale model investigation was undertaken by the Manly Hydraulics
Laboratory. The model constructed was at 1:24 scale of a two dimensional sect-
ion of the spillway, incorporating three piers (Fig. 14). The scale model was
evaluated at water levels from 1 m to 6 m (relative to the crest), in 1 m
increments.
Fig. 14
Photographs of the Wellington Dam Spillway Scale Model
Photographie du modèle réduit du déversoir du barrage de Wellington
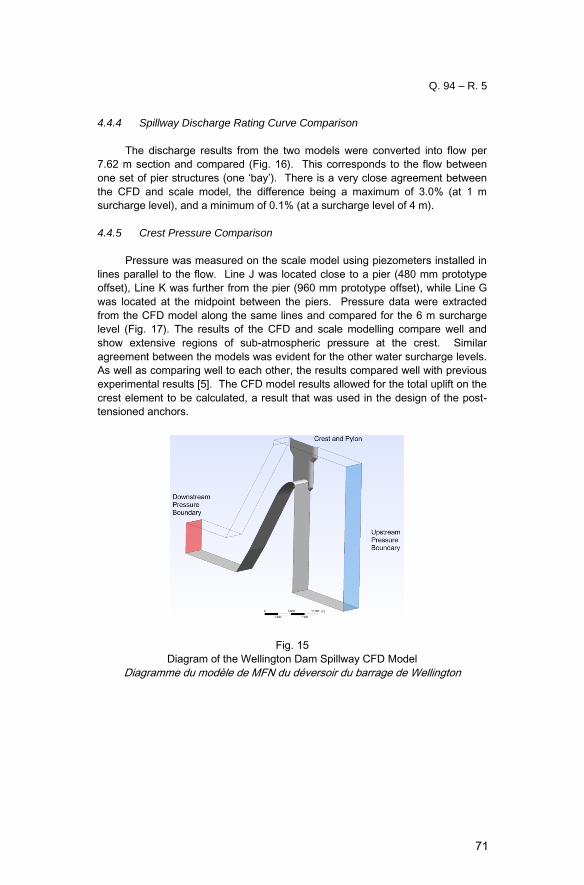
4.4.3 CFD Modelling Study
A three dimensional, multiple phase model of a two-dimensional section of
the spillway and pier was undertaken. The domain was designed to mimic the
design evaluated in the physical modelling study, in order to allow comparisons
between the two sets of data. Conveniently, flow between the pylons has two
planes of symmetry. The first plane intersects the middle of each pylon while the
second intersects at the midpoint between two pylons. Identifying these planes
of symmetry allowed the CFD model to be simplified to the zone shown in
Fig. 15. The spillway is a repeating set of these units, and the use of symmetry
boundary conditions on each side of this domain reduced the size of the domain
to a minimum. As with the scale model, six water levels were evaluated.
70
Q. 94 – R. 5
4.4.4 Spillway Discharge Rating Curve Comparison
The discharge results from the two models were converted into flow per
7.62 m section and compared (Fig. 16). This corresponds to the flow between
one set of pier structures (one ‘bay’). There is a very close agreement between
the CFD and scale model, the difference being a maximum of 3.0% (at 1 m
surcharge level), and a minimum of 0.1% (at a surcharge level of 4 m).
4.4.5 Crest Pressure Comparison
Pressure was measured on the scale model using piezometers installed in
lines parallel to the flow. Line J was located close to a pier (480 mm prototype
offset), Line K was further from the pier (960 mm prototype offset), while Line G
was located at the midpoint between the piers. Pressure data were extracted
from the CFD model along the same lines and compared for the 6 m surcharge
level (Fig. 17). The results of the CFD and scale modelling compare well and
show extensive regions of sub-atmospheric pressure at the crest. Similar
agreement between the models was evident for the other water surcharge levels.
As well as comparing well to each other, the results compared well with previous
experimental results [5]. The CFD model results allowed for the total uplift on the
crest element to be calculated, a result that was used in the design of the post-
tensioned anchors.
Fig. 15
Diagram of the Wellington Dam Spillway CFD Model
Diagramme du modèle de MFN du déversoir du barrage de Wellington
71

Q. 94 – R. 5
Fig. 16
Wellington Dam Spillway Discharge Comparison
Comparaison du débit du déversoir du barrage de Wellington
4.4.6 Water Level Comparison
As with the pressure, the water level was measured in the scale model
along lines parallel to the flow. The CFD and scale model water levels were
compared along Lines K and G. Fig. 18 shows a comparison undertaken for the 6
m surcharge level. There is a close agreement between the two models and this
was also observed at the other water levels.
Fig. 17
Wellington Dam Spillway Crest Pressure Comparison
Comparaison de la pression au seuil du déversoir du barrage de Wellington
0
1
2
3
4
5
6
7
0 50 100 150 200 250
Su
rch
arg
e L
eve
l (m
)
Flow Rate Per 7.62m Section (m3/s)
Scale Model CFD Model
-80000
-60000
-40000
-20000
0
20000
40000
0 2 4 6 8 10 12
Pre
ss
ure
(P
a)
Horizontal Distance from Crest (m)
CFD Line J CDF Line K CFD Line G
Scale Line J Scale Line K Scale Line G
72

Q. 94 – R. 5
Fig. 18
Wellington Dam Spillway Crest Water Level Comparison
Comparaison du profil de la surface de l’eau pour le déversoir du barrage de
Wellington
5. CONCLUSIONS
CFD modelling has been shown in the applications summarised herein to
be an effective modelling tool for spillway design applications. This assessment
was however limited to consideration of static conditions. Comparisons with
scale modelling data show that excellent results can be produced, especially in
areas where the velocity is relatively low, for example the spillway approach and
crest region. For studies of these regions, CFD models using relatively coarse
grids can produce accurate results very rapidly and allow for design alternatives
and multiple upstream water levels or discharges to be evaluated and optimised
rapidly.
It is critical to note that further work is required to improve CFD modelling
techniques in relation to transient pressures, turbulence, cavitation, effects of air,
two-phase flows, structure vibration and pressure pulsations in hydraulic jumps
and on structure boundaries.
Use of CFD in optimisation encourages experimentation and innovation,
and may allow higher performance or lower costs solutions to be found. Once a
preferred design is determined, a physical model can be constructed and tested
in order to increase confidence in the design, as well as investigate phenomena
that are difficult to test in a CFD model such as the points noted above.
160
162
164
166
168
170
172
174
-5 -3 -1 1 3 5 7 9
Wate
r L
ev
el (m
)
Horizontal Distance from Crest (m)
CFD Line K CFD Line G
Scale Line K Scale Line G
73

Q. 94 – R. 5
While it may be tempting from a cost and project delivery point of view to
abandon scale model testing entirely, there are clearly circumstances where
practical CFD modelling fails to deliver accurate results. These include high
Reynolds number flows down spillways and chutes, flow over aerator structures,
aerated flows, and hydraulic jumps. In some cases, these flow conditions may
also be challenging for practical scale models. An engineer, with access to both
sets of results (CFD and scale modelling), can make informed judgements, based
on the advantages and disadvantages of each technique.
Complementary use of CFD and scale models allows for a degree of cross
checking between the two sets of model results, allows for innovation and
refinement of designs, provides greater confidence in the final design and will
inevitably lead to improvements in both CFD modelling methodologies and scale
modelling practices.
ACKNOWLEDGEMENTS
The authors would like to thank GHD for the support provided in the
preparation of this paper. They would also like to thank the following organis-
ations for their permission to use data from their projects in the assessment
presented herein: Bulk Water Alliance and ACTEW Corporation for the Enlarged
Cotter Dam, Seqwater for Lake Manchester Dam, Southern Rural Water for Blue
Rock Dam and Water Corporation Western Australia for Wellington Dam.
REFERENCES
[1] UNITED STATES ARMY CORPS OF ENGINEERS. Hydraulic Design
Criteria. 1987.
[2] AMADOR A., SANCHEZ-JUNY M., DOLZ J. Developing flow region and
pressure fluctuations on steeply sloping stepped spillways. ASCE J.
Hyd. Eng., Vol 135, No 12, pp 1092-1100. 2009.
[3] LESLEIGHTER E., McPHERSON B., RIDETTE K., WILLIAMS J.
Modelling procedures used for the spillway upgrade for Lake
Manchester Dam. ANCOLD Conference: Dams and Water for the
Future. 2008.
[4] STATE RIVERS AND WATER SUPPLY COMMISSION MAJOR
PROJECTS DESIGN DIVISION. Blue Rock Dam – Concrete Lined
Chute Spillway Hydraulic Model Studies. 1983.
[5] HURST P.C., EWING T.C., FOX S., WARK, R. Calculating spillway crest
pressures for high-head operation. NZCOLD/ANCOLD 2007
Conference. 2007.
74

Q. 94 – R. 5
SUMMARY
The design of recent projects involving new or upgraded spillways have
benefited from the complementary use of both Computational Fluid Dynamics
(CFD) techniques and physical scale modelling. The design process recently
adopted for complex spillway designs or upgrades involved the initial
development of a preliminary design using theoretical and empirical design
methods together with published data. These arrangements were then analysed
and optimised through CFD modelling and, where required, physical scale
modelling was used for final verification and refinement.
A comparison of the results from CFD and physical models is presented
where both have been used in the design process and conclusions are drawn on
the applicability of standalone CFD analyses.
CFD modelling has been shown in the summarised applications to be an
effective modelling tool for spillway design applications; however this assessment
was limited to consideration of static conditions. Comparisons with scale model-
ling data show that excellent results can be produced, especially in areas where
the velocity is relatively low, for example the spillway approach and crest region.
For studies of these regions, CFD models using relatively coarse grids can pro-
duce accurate results very rapidly and allow for design alternatives and multiple
upstream water levels or discharges to be evaluated and optimised rapidly.
It is critical to note that further work is required to improve CFD modelling
techniques in relation to transient pressures, turbulence, cavitation, effects of air,
two-phase flows, structure vibration and pressure pulsations in hydraulic jumps
and on structure boundaries.
Complementary use of CFD and scale models allows for a degree of cross
checking between the two sets of model results, allows for innovation and
refinement of designs, provides greater confidence in the final design and will
inevitably lead to improvements in both CFD modelling methodologies and scale
modelling practices.
RÉSUMÉ
La conception de nouveaux déversoirs ainsi que leur amélioration a
bénéficié récemment de l’utilisation des techniques complémentaires de la
Mécanique des Fluides Numériques (MFN) et des techniques de modélisation
physique. Le récent processus adopté lors de la conception ou de l’amélioration
de déversoirs à écoulement complexe comprend un développement préliminaire
qui utilise des méthodes théoriques et empiriques ainsi que des données
75

Q. 94 – R. 5
publiées. Ces développements préliminaires sont ensuite analysés et optimisés
par la MFN et si nécessaire un modèle physique réduit est utilisé pour des
optimisations et vérifications finales.
Une comparaison des résultats de la MFN et des modèles physiques est
présentée. Les deux méthodes ont été utilisées dans le processus de la
conception de déversoir et des conclusions en ont été tirées sur la possibilité de
développer une analyse uniquement en MFN.
La MFN a montré dans les exemples présentés qu’elle était un outil de
modélisation efficace pour la conception de déversoir, cependant cette étude
était limitée à des considérations de conditions statiques.
Une comparaison avec des modèles physiques montre que de très bons
résultats peuvent être produits ; en particulier lorsque la vélocité est relativement
petite, à l’approche et au seuil du déversoir par exemple. Pour l’étude de ces
régions, les modèles de MFN peuvent produire des résultats corrects très
rapidement tout en utilisant un maillage relativement espacé. Ils peuvent aussi
permettre l’évaluation et l’optimisation rapide de différentes idées de conception
pour des débits et hauteurs d’eau multiples.
Il est essentiel de noter qu’il faut plus d’études pour améliorer les
techniques de MFN en relation avec les effets de cavitation ; turbulence ; effet de
l’air ; vibration de structure et les pulsations de pression dans les ressauts
hydrauliques ainsi qu’à la limite des structures.
L’utilisation complémentaire de la MFN et des modèles physiques permet
un élément de vérification de l’ensemble des deux résultats ; elle permet aussi
une plus grande innovation et optimisation dans l’étude de conception ; donne
une plus grande confiance dans le projet adopté et apportera inévitablement des
améliorations dans les techniques de MFN et de modèles physiques.
76