neets - understanding young people who are not in ...€¦ · neets - understanding young people...
TRANSCRIPT

LLP‐Leonardo da Vinci Program, Moving Project, Study “Understanding NEETs” 1
NEETS - Understanding young people who are Not in
Education, Employment or Training
This project is financed and supported by the Lifelong Learning Program of the European Union.
The views expressed herein are the personal views of the author and are not intended to reflect
the views of the Commission, which cannot therefore be held responsible for any improper use of
the information included herein.

LLP‐Leonardo da Vinci Program, Moving Project, Study “Understanding NEETs” 2
Contents
Introduction – The Object of our Study
1. The Neets - Main Findings
2. The Neets in three different Countries
2.1. UK - Merseyside (Liverpool Chamber)
2.1.1. The Neets in the UK
2.1.2. The Neets in Liverpool
2.1.3. Facing the Neets phenomenon – Possible solutions
2.2. Italy - Calabria (Province of Crotone)
2.2.1. Framework
2.2.2. The Youth Condition in the provincial area of Crotone, Calabria
2.2.3. A best practice to reduce the youth unemployment rate in Crotone
2.3. Spain - Andalusia (Junta de Andalusia)
2.3.1. Framework
2.3.2. Economic situation of the region
2.3.3. Statistics and scale of the regional NEET groups (15-19 years-old people who are not in
education, employment or training)
2.3.4. Causes
2.3.5 Current Best Practices for the re-engagement of the Neets
3. Conclusions and recommendations
4. Bibliography
LLP‐Leonardo da Vinci Program, Moving Project, Study “Understanding NEETs” 3
Introduction
By Anne F. Storz – General Coordinator
The term “NEET” has been frequently adopted within the framework of the education policies in
some European countries, particularly in the UK, lately.
Some studies were carried out on a local or national scale in the UK, but never on comparison scale,
that is facing the phenomenon from other points of view, with an eye on local peculiarities
between different European Countries.
The term NEET, also commonly occurring in lower case form as neet or Neet, is an acronym of Not
in Education, Employment or Training, and refers to a young person aged between 15 and 19 (in
some countries, up to 24) who has left school and/or college but has failed to secure a job or
placement in some kind of vocational training. Those people are not just economically, but (they
appear to be) completely inactive, occupying an unconstructive (and potentially threatening)
position within their social topography. The term “lost generation” is more and more coming into
use to classify them.
The Not in Education, Employment or Training is a sort of new generation. These young people feel
and are often excluded from any social activity; as a result, they withdraw into their home or even
into their own room for months, maybe for years, where they remain absorbed in their personal
interests such as the internet, or social networking, video games, etc. They are often demotivated,
reconciled young people who cannot see any future in their lives.
Is this phenomenon affecting only England? Even though the available studies about NEETs are very
few, except for the UK, this phenomenon is silently spreading in many western and westernised
countries.
A critical question is trying to understand and evaluate the extent of this phenomenon together
with its negative impact on young people as well as on society as a whole. This is necessary in order
to inform European policy for the education and training field in a way that will be able to benefit
all young people in the European Union and the Member State economies contained therein.
The research called “NEETS - Understanding young people who are Not in Education, Employment or
Training” is part of the “Moving Project”, it was started on November 2009, and co-financed by the
European Commission under the LLP (Leonardo da Vinci Programme).

LLP‐Leonardo da Vinci Program, Moving Project, Study “Understanding NEETs” 4
The main purposes of our study were to:
‐ 1. Identify the needs of our target group. This report is focused on providing an overview of
the difficulties to be faced by people 'not in education, employment or training', i.e. the
NEET group.
‐ 2. Find proper solutions to reduce the number of Neets and to prevent the phenomenon. In
order to do that, we need to understand the causes and the origins of it, as well as its
consequences, and to improve existing initiatives aimed at facing the issue.
The expected output of our research was the report of the state of art: young unemployment rates
in each region, the census of existing surveys about the Neets’ behaviour and their expectations for
a better understanding of our target group.
This study is focused on the 3EU Member States involved in the project – Italy, United Kingdom, and
Spain, and particularly, on 3 specific regional areas of those Countries: Calabria, Merseyside, and
Andalusia.
The study includes the following key steps:
1. Identifying concepts: Definition of the Neet Group
2. Definition of the structure and methodology of the study
3. Collecting existing literature and data
4. Conclusions
Structure and methodology
Our purpose was to evaluate the size of the phenomenon in different Countries. In order to do this,
our Partners had to collect policy documents, statistical data, existing surveys, and available
reports.
The structure had first to provide an overview of the subject matter, then to define the
peculiarities of the local Neet Groups in the three different areas affected, with a specific view of
the context, economic situation of the region, the statistics and size of each Neet Group in its
region (people aged between 15 and 19 who are not in education, employment or training), and the
percentage/proportion of young people not in employment (unemployment rate of 16-to-24 years
old people). The causes, characteristics of the Neet Group, risks, barriers, and existing
initiatives/policy, best practices for the re-engagement of Neets in the 3 Countries were the last
aspect.

LLP‐Leonardo da Vinci Program, Moving Project, Study “Understanding NEETs” 5
Several problems emerged during this first step:
1. The definition of the term “NEET” is not consistent. The term is unknown within the general
systems of statistical survey or in existing reports, except for the UK area;
2. It was not possible to find out the required data. The only available data often concerned
(except for the UK) youth unemployment and withdrawal from school. The Neets’ phenomenon has
not yet been considered in Andalusia or in Calabria.
Each of the three Partners involved in our research had to deal with their local available data. This
is why the three Regional Sections are so different between them.
3. Different methods of national statistics systems. Compared analysis is very different between
different countries as they do not adopt the same methods for their statistics analysis and term
definitions.
Those problems do not necessarily affect the outcome of our study, as there is a chance, here, to
collect documents and identify critical gaps in the existing studies which would be an interesting
starting point for future research in Europe.
It would be useful and advisable, for the EU, to impose to EU countries a common definition of
NEETs and a common methodology for collecting data for statistics analysis to be used in the next
reports on education and training. If so, we could have a better insight of the phenomenon and find
out more appropriate measures and initiatives to be taken. We stand in front of a real necessity of
a supranational approach: youth unemployment is one of the major concerns for policy-makers at
EU, national, and local level.
The NEET group will grow in and generate a recession. It is necessary to develop concrete measures
and solutions to reduce the number of Neets and increase the percentage of 16-to-18 years old
people (16-24 in other Countries) involved in education, employment or training [Education,
Training and Recession – CRELL, Jan. 2009].
An European approach is therefore to be hoped in order to determine a common acceptable
definition of the term NEET allowing a deeper and closer compared analysis.
Nevertheless, the content of this study is a precious source of knowledge which was so far
unknown, and that might positively influence the decisions and the future initiatives intended to
reduce this phenomenon.

LLP‐Leonardo da Vinci Program, Moving Project, Study “Understanding NEETs” 6
Chapter 1 – The Neets – Main Findings
The Neets Generation – A European priority
The end of compulsory education is a critical time for individuals. “Being NEETS between the ages
of 16-18 is a major predictor of later unemployment, low income, teenage motherhood, depression
and poor physical health” (Source: UK Government Department for Children, Schools and Families).
We need to identify a new approach to the NEETS question, to help them in their transition towards
employment.
One of the major consequences of the phenomenon is a lack of confidence in learning and teaching.
The NEETs groups are unwilling and unmotivated to participate in the educational and training
process as well as in social activities. A UK survey of 2008 (2004 16 to 25 year olds, of which 152
respondents were NEETS) shows that a quarter of NEETs thinks that life has no purpose. In their
interviews, 41% of NEETS said they were less happy now than when they were a child (compared
with 29% of the overall sample)1.
The NEETs phenomenon is accepted to be widespread although in most of the European Union
countries is quantitatively still unknown. It is extremely difficult to collect data about this subject
matter. Collecting data on youth unemployment in Europe is an extremely different operation
which varies from a Member State to another; the term NEET is not consistently defined and the
studies relevant to this phenomenon are not in agreement. The result is that comparing data on a
European scale is quite impossible. The UK is at the moment the only Member State in the European
Union which was able to identify and analyse the NEET phenomenon.
According to the British Government, the term NEET refers to people aged between 16 and 19 who -
owing to their NEET status - are at risk of not making a successful and sustainable future transition
towards education, employment or training. There is a common assumption in the UK, particular in
policy arenas, that while NEETs come from diverse backgrounds, what they do have in common is
“low levels of aspiration and little motivation” (Popham 2003:8) . However, Bynner and Parsons
(2002) have identified several ‘risk’ factors of becoming NEET in the UK. Using data from two
British birth cohorts (the National Child Development Study of 1958 and the British Cohort Study of
1970), they have found that family socioeconomic background (i.e. class), parental education,
parental interest in the child’s education, area of residence, and children’s educational attainment
were all strong predictors of later-life NEET status. Additionally, research undertaken by the UK
1 The Prince’s Trust YouGov Youth Index, 2009

LLP‐Leonardo da Vinci Program, Moving Project, Study “Understanding NEETs” 7
Department for Education and Skills (now Department for Children, Schools, and Families) found
‘ten factors’ associated with being NEET: no educational qualifications, school exclusion, previous
truancy, low skill occupation of parents, living in a household where neither parent worked full-
time, having children at an early age, living outside the family home, having a health problem or
disability, or having parents living in rented accommodation. Clearly these ‘ten factors’ point to
young people who have had negative experiences in their early education experiences and come
from lower socioeconomic backgrounds2.
In England, the Department for Children Schools and Families provides the Statistics and size of
the NEET Group. The DCFs quarterly brief for Quarter 4 - 2007 reported that 21.6% of 16-18 years
olds were not in education, employment or training (NEET). At 16 the figure is 10.8%, at 17 it is
17.8 and rises significantly for 18 year olds to 36.7%. Despite increased participation in training and
education, reduced youth unemployment, the proportion of young people not in education,
employment or training (NEET) has remained stable at around 9-10% since 1994. According to The
Department for Children Schools and Families (2007) the NEET group is a rapidly changing group and
most young people do not spend long periods NEET and at any one time over half of the NEET group
is actively seeking education, employment or training.3
In Italy, according to the outcomes of a survey carried out by TV7 on 19 March 2010 the term NEETs
refers to a generation of young people aged between 15 and 35 years, who are neither studying nor
working. They are young and this is a journey through the expectations to the disillusionment of a
generation: some stay with their family and some instead plan a future somewhere else.
This generation is referred to as 'NEET' (not education employment or training) and amounts to
approximately 1,200,000 people, most of them graduated in communication studies and are still
family dependent.
In Japan, the problem is very widespread so, in 2005, the Japanese government declared that some
640,000 young Japanese people belonged to the NEET category; they are disproportionately likely
to have experienced problems due to a range of issues including special educational needs, poor
attainment at school, health problems, disabilities or parents who are themselves unemployed.
The NEET phenomenon has not appeared all of a sudden, without a cause. If we go through the
probable social and family-related causes, we realise how big the problem is.
2 Dr. Karen Robson, Becoming NEET in Europe: A Comparison of Predictors and Later‐Life Outcomes, 2008 3 DCSF, Reducing the number of young people not in education, employment or training (NEET) by 2013

LLP‐Leonardo da Vinci Program, Moving Project, Study “Understanding NEETs” 8
A critical factor to reduce the NEET phenomenon and therefore identify valuable alternative
solutions on a European scale is a deeper understanding of the causes of it in the affected
countries.
This is a social pathology that could result in serious consequences at an economic level, especially
in times of economic crisis such as we are currently experiencing.
Understanding the phenomenon means to recognize and comprehend the differences among the
affected regions.
Together with the numerous causes and facets of the phenomenon, we should focus on how the
NEETs numbers vary from place to place (Liverpool, Andalusia, Calabria).
Different peculiarities of the NEET groups are also essential in the identification of their key
elements, which are likely to influence what will work well in terms of a NEET reduction. Young
people who are NEET are seen as a heterogeneous group with multiple needs. However, they
appear to fall into two distinct groups:
- Core NEETs - more likely to have social and behavioural problems. This group also comprises
the ‘Generational NEETs’- young people who come from families where the accepted norm for
adults is to be unemployed.
‐ Floating NEETs –young people who are experiencing a lack of directions and motivation,
tending to move in and out of the NEET group, engaging in low paid or temporary work, as
well as in short education courses. This group contributes to the “Neets’ Churn”.4
Too many young people aged between 16 and 19 (16 and 25 in other Countries like Italy and Spain)
fall in the category usually referred to as NEET (not in employment, education or training). Data
concerning youth unemployment is dramatic; the survey “Youth - Investing and Empowering”,
European Commission April 2009, reports that at the EU level, more than 65% of young people with
at most lower secondary education are economically inactive; the figure is only 16% among higher
educated young people.
Among young inactive people, two categories can be distinguished: those who do not want to work
and those who would like to work but do not look for a job for specific reasons, such as own illness
or disability, education or training, family responsibilities.
4 Darshan Sachdev, Bethan Harries, Thomas Roberts, Regional and sub‐regional variation in NEETs –reasons, remedies and impact, March 2006

LLP‐Leonardo da Vinci Program, Moving Project, Study “Understanding NEETs” 9
On average, around 80% of young inactive people aged 15-29 do not seek employment, many of
them still being in the formal education system. At the EU level, 65% of young inactive people aged
15-24 do not seek an employment because of education or training (at Member State level, the
percentages reached a minimum of 76.8% for Sweden and a maximum of 97% for Luxembourg). This
is not surprising as the majority of young people aged 15-24 are still in education.
More than 60% of young inactive people who do not seek any employment are women. Furthermore,
young, inactive people not looking for a job are more widespread among the youngest class with an
only lower secondary education. This percentage decreases together with the level of education,
until it reaches a one digit percentage for those having attained the tertiary level. Since inactivity
is partly due to the growing trend of young people to remain in school beyond their age for
compulsory education, the following indicators consider all those who, voluntarily or involuntarily,
are Not in Education, Employment or Training (NEET), so we will have a better evaluation of the
youngsters who are most at risk in the labour market. This group of either unemployed or inactive
youth that do not follow any education may find it very hard to find a job or may drop out of the
labour force altogether because they have been discouraged from working or for other
undetermined reasons (unlike those who are inactive because of family commitments, military
service, travel or leisure).
In Europe, more than 1/3 of young people between 15 and 24 are NEET. The EU average sometimes
hides significant differences between the Member States. Indeed, this value exceeded 50% in
Bulgaria and Hungary, and is around 20% in Denmark and the Netherlands.
By the age of 25, NEETs percentage is lower compared to the younger age class: one might suppose
that this is mainly due to those who have already found a job or went back into education.
Nevertheless, in many countries there are still more than 20% of young people aged between 25 and
29 who are considered to be NEETs.
The NEETs category was formally created in 1999, though the phenomenon existed before.
However, that category, lately called “Lost Generation”, does not have the same term or definition
in most of the EU statistics systems; definitions and collecting methods also vary between
Countries. The British national statistics accurately analyse the phenomenon. It is therefore
difficult and almost impossible to make comparisons because of diverse national collections of data
and diverse definitions of the term.
To understand the differentiated nature of the NEETs in different Countries, it is imperative to
elaborate a valid alternative to reduce the rate of disengaged young people. Local factors mainly

LLP‐Leonardo da Vinci Program, Moving Project, Study “Understanding NEETs” 10
influence the circumstances to become NEETs and require flexibility and innovative approaches as
well as more sensitive strategies to be locally developed.
Different researches show that disengagement at this age is disastrous in personal terms; this is the
cause of some problems inside the community, such as nuisance and criminal activities; in the long-
term, this phenomenon leads to significant costs in terms of increased criminality, welfare
dependency, housing, and a wide range of social and economic questions.
A research called “Tackling Neets” was presented in the UK last July 2009, which strengthens the
understanding that the NEET problem is complex, rooted in a rich mix of social networking,
alternative life-styles and shadow economic activities available in a locality and the increasingly
complicated and hidden lives that young people lead. The range of issues associated with young
people in the NEET category comprises low educational attainment, homelessness, gang
membership, early criminalisation, drug culture and dependency, care needs, teenage pregnancy,
prostitution and, in many or even most cases, multiple and overlapping disadvantage, for example,
pregnancy, drug dependency and crime.
To fight this growing problem, which is likely to be exacerbated by the recession, we need a
comprehensive research activity focused on disengagement in a local area, in order to tease out the
specific demands of that area.
As the Council of the European Union perfectly remark, “Resolution of the council and of the
representatives of the governments of the member states, meeting within the council, on the
active inclusion of young people: combating unemployment and poverty”, April 2010, the negative
effects of the economic and financial crisis on growth and employment are particularly affecting
groups in vulnerable situations or at risk of exclusion such as the young people, with a consequent
increase in poverty amongst them. Youth unemployment has reached extremely troubling levels: in
the European Union, one out of every five young people under the age of 25 is unemployed.
Furthermore, one out of every five young people aged between 18 and 24 is at risk of poverty.
Investing in young people as an essential resource for growth and employment and facilitating their
social inclusion would consolidate a more cohesive society, with all young people having equal
opportunities to participate. The effects of the recession, however, may be dramatically changing
the landscape and how we see the issue. How to save “the lost generation” is one of the most
important challenges of the future.

LLP‐Leonardo da Vinci Program, Moving Project, Study “Understanding NEETs” 11
Chapter 2. The Neets in three different Countries
2.1. UK - Merseyside (Liverpool Chamber)
2.1.1. The NEETS in the UK
Most of the 16-18 years old people are engaged in education, employment or training activities. The
figures given by the UK Governments Department for Schools and Families in October 2009 are as
follows:
-1,293,000 in full time education
-127,000 in work based learning
-187,000 in training.
-209,000 are NEET
-201,000 are in jobs without training and therefore most at risk of becoming NEET.
Figures from across 16-24 age groups indicate that 935,000 young people are NEET, and rising
unemployment rates are affecting this group particularly badly: in the last quarter of 2008 72,000
young people entered the NEET category.
Over half of NEET young people are seeking education, employment or training, and more than half
of NEET 18-year-olds have a level 2 qualification and a third have a level 3 qualification. In local
area agreements, 115 out of 150 LAs have already agreed reducing the number of 16-18-year-old
NEETs as a key target in their Local Area Agreements; this is the most popular indicator. The
proportion of NEETs varies per LA and per region.
Being NEET can have a lasting impact including a greater likelihood at age 21 of: unemployment or
underemployment, lower income, a criminal record and poor health and depression. The additional
cost to the state over a lifetime of a person who has been NEET aged 16-18 is estimated at
£97,000.
How do young people become part of the NEET group?
Recent research has identified a variety of reasons for this.
- Some young NEETs have “barriers” which prevent them from accessing a job, such as a disability
or a lack of access to childcare. We found the 17% of the total sample is under these circumstances,
with around 37,000 people falling in this category.

LLP‐Leonardo da Vinci Program, Moving Project, Study “Understanding NEETs” 12
-Around 13% of the NEETs we assessed are students who took a gap year, do voluntary and aid work,
unpaid apprenticeship, or under custodial sentences.
-Almost 10% of the group does some unknown/undeclared activities.
-2/3 of the NEETs have no specific barrier or circumstance preventing them from working or
training.
Some of them are at a higher risk of becoming NEET. Causal factors often start before their
sixteenth birthday. High-risk youngsters include:
- Youngsters engaged in jobs without a training
- Victims of bullying, young people with learning difficulties and disabilities (LDD) and teenage
mothers
- Young people with a family history of unemployment or poor qualifications (38 percent of young
NEETs live in households where everyone is unemployed)
- Young people with poor qualifications and a history of truancy and exclusion (1/3 of those who
have no qualifications at the end of year 11 are likely to be NEET at 18)
- Young women (more likely to be NEET than young men, despite more young women staying on at
school) due to less access to jobs or training
- Young white people (as they are less likely to stay in education at the age of 16 and 17)
- Care-leavers, young offenders, and young people with mental health difficulties (they are
overrepresented in the NEET group).
The NEET group is not homogenous or static – there is a strong “churn” within the group. Many
youngsters move in and out of the NEETs category, but 1% of them will be NEET at 16, 17 and 18.
The largest group includes those who are Open to Learning. This accounts for 41 percent of the
young NEETs. They are positive about learning and their experiences of school and are likely to re-
engage soon. Often they are only NEET due to dropping out of a course. These young people could
often be prevented from becoming NEET if they received a better Information Advice and Guidance
(IAG) while at school, and if providers offered more flexible start dates for courses.
Thirty-eight percent of young NEETs can be classed as sustained NEETs. They are unlikely to know
what they want to do, but they have also been excluded from school, or had a low educational
achievement. Young people in this category are more likely to have parents who are unemployed,
or some kind of disability or childcare issues. Young people in this category need support to
reengage, but also to stay engaged and overcome serious personal issues. An increase in work-based
provision below level 2 could also be helpful to them.

LLP‐Leonardo da Vinci Program, Moving Project, Study “Understanding NEETs” 13
Twenty-two percent of young neets are Undecided and NEET. They are quite likely to return to
education, employment or training in the medium term. They often did not really know what they
wanted to do, or have taken courses which were not successful for them. Young people in this
category need to be offered opportunities to try different vocational options and to take part in
taster courses, which allow them to try things out without starting and then dropping out of
courses.
Some progress has been made in reducing the number of young NEET. Post-16 participation is at the
highest level ever, with 79.7 percent of young people staying on. The numbers of NEET at 16 and 17
has fallen for the third year in a row. The economic downturn has had a positive effect on
participation, as young people are staying at school to gain more qualifications so they will be
better able to compete in the market place. However, the number of NEET at age 18 rose in 2009.
While the economic impact affects all three age groups, those aged 18 are most likely to be
exposed to the work place and therefore more likely to be affected by this.
The economic impact has led to increased unemployment, fewer apprenticeships being offered,
lower incomes and reduced hours, and added pressure on family incomes. There is also a lag effect
when young people move between different options. Young people can become disheartened about
their options for the future.
Despite the strong performance of the economy over the last decade, the UK ranks fifth from
bottom in a league table of 28 western countries for the proportion of 15-19 year-olds not in
education, employment or training. This means a cost to the taxpayer as a result of more people
accessing public services and fewer contributing to the economy and tax income. Government
figures suggest that each new entrant into the NEET group aged 16 will cost the public £97,000 over
their lifetime, with those who never re-engage with the world of work costing as much as £300,000.
A single 157,000-strong cohort of 16-18 year-old NEETs would cost the country a total of £15bn over
their lifetime in terms of opportunity costs and the effect on public finances.
Even if the government reach its target of reducing the percentage of young NEETs from 10% to 8%
by 2010, the UK will still lag behind major OECD competitors. Which results in significant costs for
taxpayers.
2.1.2. Liverpool City Region
While the number of young people entering education and achieving good grades is moving in the
right direction, there is still a worrying number not in education, employment or training (NEET). In

LLP‐Leonardo da Vinci Program, Moving Project, Study “Understanding NEETs” 14
2007 the share of 16 to 18-yearolds in Liverpool City Region in the NEET category stood at 10.1%, a
slight drop from 10.9% the previous year. This is higher than the national average and in
comparative urban areas. In hard numbers, there are 5,550 young people not engaged with the
world of work or being trained or in education. It is worth pointing out that there is a clear
variation within Liverpool City Region; NEET levels were highest in Knowsley was 15%, and 11.5% in
each of Halton and Liverpool but 9% in Wirral and 7% in Sefton, closer to the national average.
2.1.3. Facing the Neets phenomenon – Possible solutions
Young people not in education, employment or training (NEET) cost the UK millions of pounds every
year. The NEET condition is harmful to a young person, but has also some bad consequences on
society and the economy. Various initiatives over the past ten years have had some success in
getting young people to stay on in education or get a job, but a significant proportion of them still
need help. Business and society benefit when young people are able to leave school or college with
the qualifications they need to succeed in the world of work. The fact that nearly one in ten of all
16-18 year-olds are not in education, employment or training is therefore a major concern.
Reducing the number of NEETs can help save money, reduce crime and anti-social behaviour and
improve life chances for young people. But doing so is not easy – poor performance at school,
health problems and a lack of social support continue to disadvantage the most vulnerable. Business
has a clear interest in addressing this issue, not just as future employers, but as users, funders and
providers of public services. This report identifies where public services are not giving
disadvantaged young people the support they need and where business can help. UK employers’
organisations believe that closer collaboration between government and business is critical for
further progress:
There is a clear need to tackle the NEET problem: despite a strong economy over the last decade,
the UK does badly compared with other western countries in terms of the proportion of young
people NEET. The subsequent cost to the taxpayer is high – halving the number of young people on
benefits and getting them into work could save the exchequer over £5m a week – more than a
quarter of a billion pounds a year. There are social and personal costs too: NEETs are three times
more likely to get involved in crime and often suffer from poor health
Underlying causes – and solutions – are many and varied:
These young people are disproportionately likely to have experienced problems owing to a range of
issues including special educational needs, poor attainment at school, health problems, disabilities
or parents who are themselves unemployed. This means an effective strategy needs to join up
different parts of public services to provide the variety of support needed by young people

LLP‐Leonardo da Vinci Program, Moving Project, Study “Understanding NEETs” 15
Business has a key role to play in helping young people succeed:
Addressing the root causes requires a consistent strategy aiming at educational improvement,
regeneration and a joined-up approach to public services. Businesses have an important role to play
in this – not just as future employers of young people and as a key player in regeneration, but also
as potential providers of the kind of tailored support and guidance that NEETs often need.
Improving educational outcomes and service provision for young people requires practical and
innovative solutions. Action is being taken at local level, not least because funding for schools and
youth services is now controlled and commissioned by local authorities. An effective commissioning
framework must bring together the expert local knowledge of councils and the professional
experience of service providers. Recognising the value of private and voluntary sector expertise in
providing tailored services for the hardest to reach is an indispensable part of this. While there is
some good practice, much existing local authority provision is not aligned to the needs of those
with multiple disadvantage. This means all partners have a role to play in an effective strategic
commissioning cycle, from initial scoping to ongoing monitoring of service performance, including:
Better strategic commissioning at local level: good commissioning is much more than just
procuring services. It is about identifying needs and delivering outcomes for client groups like young
people NEET, and encouraging providers to create innovative service solutions. It also means
creating contracts that can evolve over time
More integrated commissioning to encourage efficiencies and innovation: an effective strategy
to get disaffected young people into education, employment or training and address the root causes
of disengagement requires a joined-up approach across services. It also requires scaleable delivery
models which match local needs
A level playing field for all service providers: the commissioning process must be fair to all
potential providers. Healthy competition has helped deliver innovation, better quality services and
better value for taxpayers across public services. But there remain obstacles to achieving a truly
level playing field between providers from all sectors, particularly at local level
Regular inspections, monitoring and benchmarking: regular quality assurance is needed to ensure
services for young people are of high quality. This requires a combination of Ofsted inspections,
feedback from young people themselves, and measurement against agreed outcomes.
Disadvantaged young people need services that respond to their specific needs. The real issue for
the NEET group is participation, as the most disengaged young people are failing to take up what is

LLP‐Leonardo da Vinci Program, Moving Project, Study “Understanding NEETs” 16
available to them. Support services must be tailored to effectively engage young people and should
be part of a wider package that integrates Information, Advice and Guidance (IAG), youth services
and employment programmes. This means treating young people as individuals and encouraging
them to become intelligent consumers who can make their own decisions. UK employers
organizations believe that in order to reduce the proportion of NEETs in a sustainable way, the
government should base its strategy on the following principles:
Recognising individual needs and providing tailored services:
giving young people a greater say in shaping the services theyuse can help improve levels of
engagement and effectiveness.The budget-holding leading professional model is one way to do this
Joining up support services for young people: an integrated one-stop-shop support strategy for
young people could help make spending on youth services more efficient by including multiple
services as part of a joined-up package – children’s and adult services must not operate in isolation
if the cycle of disadvantage is to be broken. This should include careers guidance, health
information and advice, legal and housing support, access to internet and other essential hool at 16
needs a range of high-quality career and personal development options, including further eservices
Expanding apprenticeships with success: young people leaving education (FE), apprenticeships,
employment and work-based training. This requires employers, schools, colleges and private and
voluntary sector training providers to work together giving young people employment options:
young people gain valuable skills in work which provides a very different learning environment to
school or college. Employment options for young people should therefore be improved, including
youth enterprise schemes for young people who want to become self-employed.
Two possible solutions to help young people get back into education, employment or training are
apprenticeships and informal learning. This section summarises the key points on these two
approaches, drawing on a presentation given at the Capita conference and on the NFER report
Nonformal learning- good practice in re-engaging young people who are NEET.
Apprenticeships
Apprenticeships play their part in reducing the numbers of young people who are NEET. One key
advantage is that they take place throughout the whole year and can start at any time.
Apprenticeships also give young people jobs with training.
More apprenticeships have to be offered in areas where they are needed. At the moment
apprenticeships on offer don’t always reflect the wider economy. For example, in London the top
LLP‐Leonardo da Vinci Program, Moving Project, Study “Understanding NEETs” 17
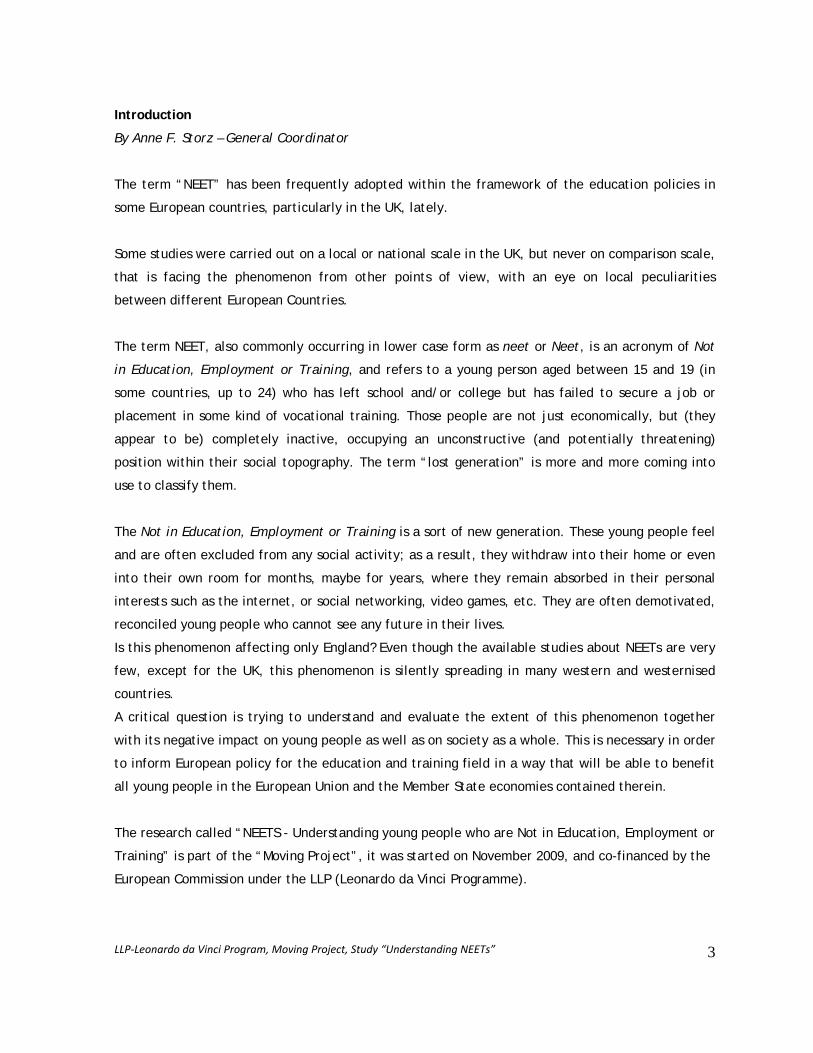
four apprenticeships taken up are childcare, business administration, customer service and
hairdressing.
This is not representative of the overall market. In other areas there is a demand for workers but
no available apprenticeships, for example there is also a massive demand for double glazing but
London had no apprenticeships in this market.
The benefits to young people include positive career benefits and a general feeling of having a
positive experience. They also increase current and future earning power and can lead to future
learning.
Benefits to employers are that apprentices often show more loyalty to a company than other
employees and the cost of their training is recouped within a relatively short space of time.
Apprenticeships provide employers with staff members who have the skills they require. It can also
be more expensive to recruit experienced people from the external labour market, and the supply
of people with the required skills may be limited. Apprentices can also bring new ideas to an
organisation.
Informal Learning
Young people who are NEET can also benefit from taking part in informal learning. These are
structured programmes held in informal settings, which can lead to accredited qualifications or
certificates and incentives. They can allow young people to develop the skills and behaviours they
need for education, employment or training. They may also change their attitudes towards future
participation and lead them to choose to access some form of education, employment or training.
Strategies for successful informal learning programmes
-Successful informal learning involves partnership in working with other agencies and local
providers.
-Recruiting young people through face-to-face approaches or phone calls followed by visits and
outreach work.
-Leaflets and posters in strategic places are more successful than formal letters.
-Motivation to participate, like spurring to join an attractive setting such as a football club, or
economic incentives.
-Flexible start times and dates also encourage young people to join in.
-Offering a relaxed environment helps young people to feel welcome and not shy or scared.
-Project staff should have appropriate skills, and be motivated to help the young people.
-Young people’s needs should be assessed and the activities tailored to meet their requirements.
-Innovative approaches should be used for activities, for example using new technology or group
work.

LLP‐Leonardo da Vinci Program, Moving Project, Study “Understanding NEETs” 18
-Provision should be monitored and regularly evaluated, and planned considering young people’s
views.
-Informal learning should recognise achievement through qualifications and certificates or
informally through awards and praise.
-Offering support to young people in their transition into work or college.
It is this informal learning approach that has been adopted by the MoVing project with a view to
reengaging young people into mainstream provision.

LLP‐Leonardo da Vinci Program, Moving Project, Study “Understanding NEETs” 19
2.2. Italy - Calabria (Province of Crotone)
2.2.1 Framework
In Italy, according to the outcomes of a survey carried out by TV7 on 19 March 2010 the term NEETs
refers to a generation of young people aged between 15 and 35 years, who are not either studying
or working. They are young and this is a journey through the expectations and the disillusions of a
generation: some stay with their family and some instead plan a future somewhere else.
The Italian National Statistics Institute (ISTAT) portrays a dramatic situation. The young are heavily
penalized in the Italian job market; their unemployment rate is 3 times higher than the general
one. In March, the youth (15 -24) unemployment rate was 27.7%, much higher than the EU-27 rate
(20.6%). In some regions, the rate was over 30%. The complex phenomenon of NEETS is growing in a
time of economic crisis in Europe.
According to the 2009 ISTAT report young people entering the NEET condition are likely to remain
so for a longer time, since no alternatives are available.
In 2009 the NEETs in Italy were over 2 millions, (21, 2% of people aged between 15 and 29)
The term NEET does not appear in the statistics made by the Region or Provincia so far. The
Provincia di Crotone survey has been carried out on a provincial level adopting a wider rage of
parameters than required by the MOVING project, since we do not have specific data concerning
the NEETS phenomenon on a local, regional or national scale
2.2.2. Youth condition in Crotone provincial area, Calabria
In Italy, we have no statistics or specific studies on NEETs available. The Province of Crotone
carried out this study on youth condition in Crotone area on its own. The survey is very useful to
understand the causes, the extent and the consequences of youth unemployment, young people
behaviour and their difficulty in personal development and in finding their own place within
society.
The survey on the youth condition in the Province of Crotone was carried out by the Centro
Informagiovani (Youth Information Center) of Caritas Diocesana Crotone Santa Severina, under the
aegis of the Municipality and the Province of Crotone.
Within our local social research scenario, this kind of study is nearly unique as it gives a portrait of
young people opinions and behaviours in a territory which is strongly marked by migration towards
other Italian regions, more attractive in terms of opportunities and social welfare.
We extended the upper age limit to 34 in order to have a higher perception of the transition from
youth into mature age. It is of common knowledge that such a transition takes place quite later

LLP‐Leonardo da Vinci Program, Moving Project, Study “Understanding NEETs” 20
compared to past generations. Not surprisingly, a significant minority of 34 years old people have
not accomplished their passage to mature age yet.
This survey investigates on crucial matters in young people life, such as family relationships, school
experiences, working experiences, participation in political and social activities, religion, use of
their free time, consumption models, and tendency to fall into deviant behaviour.
Furthermore, we decided to pay special attention to matters related to territorial identity, attitude
towards foreigners and immigrants, opinions about European Union, and, finally, the tendency to
incur into bad behaviours.
The survey includes schemes and consequent suggestions from young people regarding their own
territory. These suggestions shall be taken into consideration in the planning and promotion of
youth policies.
Young people shall be asked to represent their territory in workshop activities, during which they
shall discuss specific local problems and peculiarities, and try to find a future policy line.
The whole process aims to activate a local strategical plan for the youth in the area of Crotone, in
line with the guidelines from the Ministero delle Politiche Giovanili (Youth Policy Ministry) with its
Secretary, Mrs. Giovanna Melandri.
Young people were not the only target of this survey. Most of the young interviewees declared that
adults should have a better knowledge of their condition. Therefore, the outcomes of this study are
especially addressed to adults, particularly those (parents, teachers, trainers) who must deal
everyway with the young, and may find it hard to understand their behaviour and lifestyle. This
survey may represent a mirror where you can observe your own image and that of your children.
Methodology chosen by the Crotone Province to carry out the survey
The survey carried out in the area of the Crotone Province represents a benchmark for people
working in social policies as well as for those who, dealing with different aspects of their lives, face
and deal with the needs of young people.
The survey should be made on a regular basis, every three years, as its recurrence allows the
researchers to check and assess the evolution of all the phenomena associated to the youth
condition by means of a vertical comparison of the data collected in different times.

LLP‐Leonardo da Vinci Program, Moving Project, Study “Understanding NEETs” 21
It is important to note how the survey takes into account a wider range of age:
Age
30-34
24-29
19-23
16-18
13-15
HOW WE BUILT OUR SAMPLE To make the sample representative of the youth at our provincial level, the sampling plan was built according to the following stratification variables: > sex > age (15-34 years old); > Municipality; > Educational qualification; People were chosen randomly to be interviewed. Youths were interviewed in Schools, Parishes, Sport centers, Youth Information Points and Youth Associations in the Crotone Province. The survey questionnaire The survey was carried out by means of a structured questionnaire. The questionnaires were made up of closed questions with one possible answer, closed questions with multiple possible answers and open questions. The interviewer would present the questionnaire to the person, each interview would last about 30 minutes. Accurate checks were made in order to guarantee the reliability of the findings. The survey data -Sample: 474 young people (aged between 13 and 34) from the Province of Crotone -Municipalities involved: Crotone, Cotronei, Isola Capo Rizzuto, Strongoli, Rocca di Neto, Ciro’ Marina, Caccuri

LLP‐Leonardo da Vinci Program, Moving Project, Study “Understanding NEETs” 22
Features of the sample Gender Territory School
Class Age
Total M F KR PROV. Media Diploma Univ.Degree
Liceo
30-35 60 30 30 30 30 0 24 36 0
24-29 75 33 42 51 24 9 24 39 3 19-23 111 57 54 63 48 42 69 0 0
16-18 144 87 57 81 63 135 6 0 3
13-15 84 51 33 51 33 84 0 0 0
Totale 474 258 216 276 198 270 123 75 6
100% 54% 46% 58% 42% 57% 26% 16% 1% II. VALUES Family is still one of the major values in young people lives. 19% of the respondents think it is very important. Interpersonal relationships are increasingly relevant. In particular, sentimental relationship and friendship are at the second and third place respectively, together with the family. Work is an important item for 13% of the respondents. This data is connected with the last years’ deep change in the labour market and consequent increasing uncertainties about one's professional future.
The unbundled data per age bracket reveals that work is direcly proportional to the respondent's
age (from 12% in the 13-15 bracket, to 19% in the 30–34 bracket)
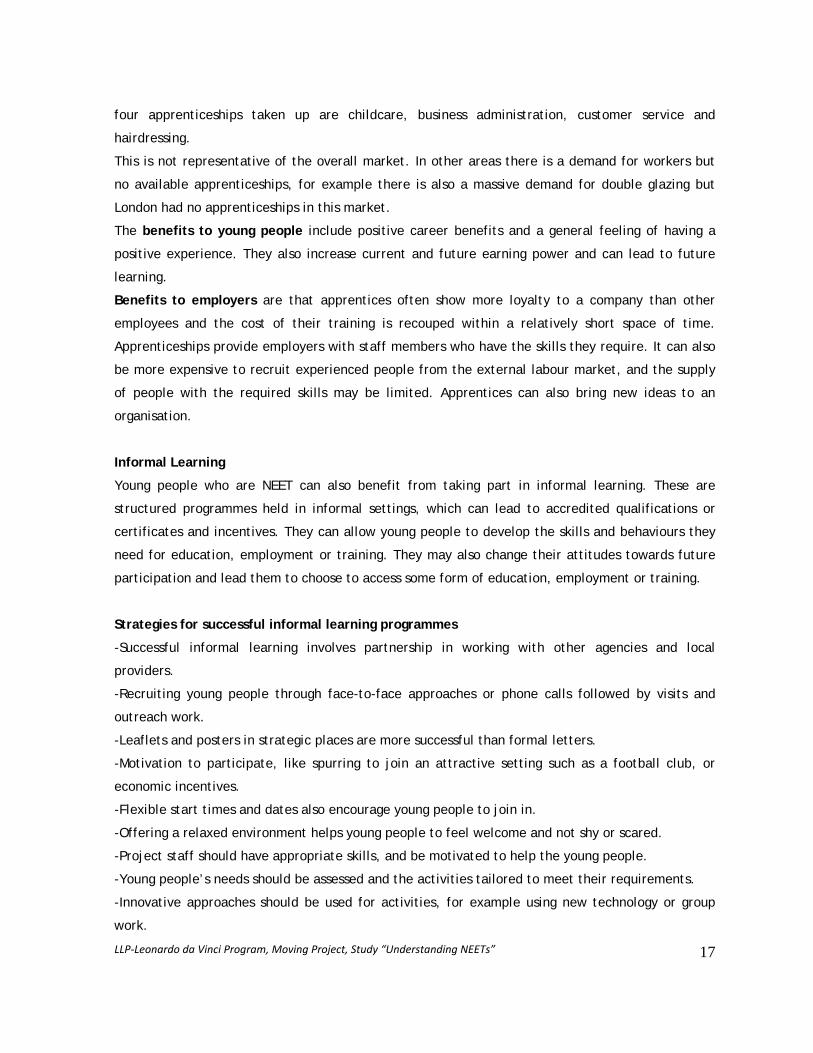
The system of values is clearly evolving towards items like leisure (4.55%), carreer (4.29%), at
the expense of engagement in religious (2.99%) and social (3.64%) activities.
The unbundled data per age bracket is quite interesting. The following table shows all the data divided per age bracket. TABLE 1- System of values "What is important in your life"(%)
Age
System of values 30-34 24-29 19-23 16-18 13-15 Average
Family 19,00 19,49 19,65 19,17 17,39 18,99
Love 15,00 12,71 15,61 15,83 14,49 14,95
Friendship 13,00 13,56 15,61 13,75 13,04 13,91
Job 19,00 16,10 10,98 12,50 12,32 13,52
Freedom and democracy 7,00 8,47 6,36 5,83 7,97 6,89
LLP‐Leonardo da Vinci Program, Moving Project, Study “Understanding NEETs” 23
Fun 2,00 2,54 5,20 5,00 6,52 4,55
Success and Career 3,00 2,54 5,20 4,58 5,07 4,29
Engagement in
religious activities 2,00 2,54 4,62 2,08 3,62 2,99
Solidarity 4, 00 5, 93 2, 31 2, 50 2, 17 3, 12
Sport 1, 00 0, 85 3, 47 3, 75 2, 17 2, 60
Leisure 5,00 0,00 1,73 3,75 2,17 2,60
Comfort 1,00 1,69 1,73 1,67 1,45 1,56
Social equality 1,00 4,24 0,58 1,67 2,17 1,82
Social engagement 3,00 3,39 2,89 1,67 8,70 3,64
Culture and study 1,00 1,69 1,73 3,33 0,00 1,82
Self-fulfilment 4,00 3,39 1,73 0,42 0,72 1,69
Homeland 0,00 0,85 0,58 2,50 0,00 1,04
Other 0,00 0,00 0,00 0,00 0,00 0,00
100,00 100,00 100,00 100,00 100,00 100,00
CHART 1. System of values "What is important in your life –” – (unity)
Patria
Autorealizzazione
Studio ed interessii culturali
Impegno sociale
Eguaglianza sociale
Vita cinfortevole
Svago e Tempo liero
Attività sportive
Solidarietà
Impegno religioso
Successo e Carriera
Divertimento
Libertà e democrazia
Lavoro
Amicizia
Amore
Famiglia
0 50 100 150 200 250 300 350 400 450 500

LLP‐Leonardo da Vinci Program, Moving Project, Study “Understanding NEETs” 24
2- Perception of oneself How do young people in the Province of Crotone describe themselves? What are their ideas and
feelings? What are the beliefs they feel supported by when facing life's challenges?
According to the self-portaits emerging from our survey, we can distinguish four different profiles:
1. Young people describing themselves as serene (33.97%), happy (19.23%), and satisfied (8.97%).
They have strong emotional values, high responsibility and self-esteem.
2. Young people describing themselves as worried (12.18%) and unsatisfied (10.26%).
They are worried about their future and not confident about their real capability of fulfilling
their aims
3. Young people describing themselves as troubled (8.97%).
They have low self-esteem and do not feel they have real power over their lives
3. Young people describing themselves as alone and unhappy (1.28%)
They do not rely on opportunities given by the environment, they do not believe in
interpersonal relationships. They feel alone in facing responsibilities and do not rely on other
people's help.
Youngest people (16-29) belong to this last group (see Unbundled Data)
Note that the respondents distribute to the different profiles according to their age. In particular, we
want to underline that the majority people describing themselves as serene are in their teen (41%)
while this percentage lowers progressively with growing age.
The majority of young adults belong to the group defining itself worried and unsatisfied. (25%) (See
table 2)
TABLE 2.1 Perception of oneself (by age bracket)
Age bracket
Perception of oneself 30-34 24-29 19-23 16-18 13-15 Total
Serene 25.00% 26,92% 36,11% 41,30% 32,14% 33,97
Happy 5, 00% 7, 69% 27, 78% 19, 57% 28, 57% 19, 23
Worried 25, 00% 3, 85% 13, 89% 10, 87% 10, 71% 12, 18
Unsatisfied 25, 00% 19, 23% 2, 78% 4, 35% 10, 71% 10, 26
Satisfied 10, 00% 11, 54% 8, 33% 6, 52% 10, 71% 8, 97
Troubled 10, 00% 15, 38% 8, 33% 10, 87% 0, 00% 8, 97

LLP‐Leonardo da Vinci Program, Moving Project, Study “Understanding NEETs” 25
Fulfilled 0, 00% 7, 69% 0, 00% 0, 00% 0, 00% 1, 28
Alone 0, 00% 0, 00% 2, 78% 2, 17% 0, 00% 1, 28
unhappy 0,00% 7,69% 0,00% 0,00% 0,00% 1,28
o 0,00% 0,00% 0,00% 4,35% 7,14% 2,56
100, 00% 100, 00% 100, 00% 100, 00% 100, 00% 100, 00
CHART 2. Perception of oneself %)
Unhappy
Lonely
Fulfilled
Troubled
Satisfied
Unsatisfied
Worried
Happy
Se rene
0 5 10 15 20 25 30 35 The main part of the young people interviewed declares they are not satisfied with their study or job. (39.85%) Once again, answers vary according to age bracket. (see unbundled data) The number of people unsatisfied with their job or study reaches up to 73.68% in the 30-34 age
bracket. People aged between 16 and 18 feel unsecure (37%), while those between 19 and 23 are
unhappy with their physical appearance. Most of the young people aged between 30 and 34 feel
responsible for making decisions.
TABLE 2.2 What are you unsatisfied with (&)
Age bracket
What are you unsatisfied with 30-34 24-29 19-23 16-18 13-15 Total
Physical appearance 0.00 9.09 29.03 5.26 14.29 12.31
Ability to make decision 5.26 22.73 22.58 23.68 28.57 21.73
Peace of mind 10.53 18.18 6.45 36.84 14.29 18.84
Study or job 73.68 50.00 35.48 21.05 39.29 39.85
Nothing 10.53 0.00 6.45 13.16 3.57 7.24 100.00 100.00 100.00 100.00 100.00 100

LLP‐Leonardo da Vinci Program, Moving Project, Study “Understanding NEETs” 26
What are you satisfied with? 30-34 24-29 19-23 16-18 13-15 Totali
Physical appearence 31.58 25.00 20.00 40.54 17.86 27.03
Ability to make decisions 42.11 37.50 32.50 21.62 35.71 32.43
Peace of mind 21.05 29.17 25.00 13.51 17.86 20.95
Study or job 5.26 8.33 22.50 24.32 28.57 19.59
100.00 100.00 100.00 100.00 100.00 100.00 As far as perception of outside environment is concerned, young peole aged between 24 and 29 feel
anxious (40&), those between 13 and 15 are worried about other people judgement (22%), while those
between 16 and 18 declare that in some circomstaces they feel they are loosing their head (21%).
Please, note that most of the respondents (40&) declared they do not feel as being classified in any of
the proposed conditions.
TABLE 2.3 Perception of outside environment (%)
Age bracket
Outside perception, 30-34 24-29 19-23 16-18 13-15 TOT
I am always afraid of others’ judgement 0.00 8-00 10.81 7.89 22.58 10.60
In some circumstances, I feel I am loosing my head
I often feel confused and anxious
5.00 8.00 8.11 21.05 12.90 11.92 25.00 40.00 18.92 21.05 16.13 23.18
I am often afraid 5.00 4.00 8.11 0.00 3.23 3.97
I am often sad 5.00 8.00 10.81 13.16 12.90 10.60
None of the answers available 60.00 32.00 43.24 36.84 32.26 39.74 100.00 100.00 100.00 100.00 100.00 1
3. Family
As far as the relationship with the family unit is concerned, the data point out how the family still
represents a very important element in the life of the young people, even if they admit with a
percentage of about 71%1 the possibility to live together without being married.
This data is linked more to the work precariousness (the 65 % of the interviewees
declare that they have only an occasional job, a collaboration or to be involved in
underground activities ) than to the lack of confidence in the marriage.

LLP‐Leonardo da Vinci Program, Moving Project, Study “Understanding NEETs” 27
Tab. 3.1 Importance of the family for the young people – (%)
age
Importance of the family 30-34 24-29 19-23 16-18 13-15
high 45% 48% 72% 71% 75%
low 0% 0% 0% 2% 0%
At all 0% 0% 3% 4% 0%
enough 55% 52% 25% 23% 25%
Total % 100% 100% 100% 100% 100%
Chart 3.1. Importance of the family for young people in %
13-15
16-18
19-23
24-29
Molto Poco Per niente Abbastanza
30-34
0% 20% 40% 60% 80% 100%
LLP‐Leonardo da Vinci Program, Moving Project, Study “Understanding NEETs” 28
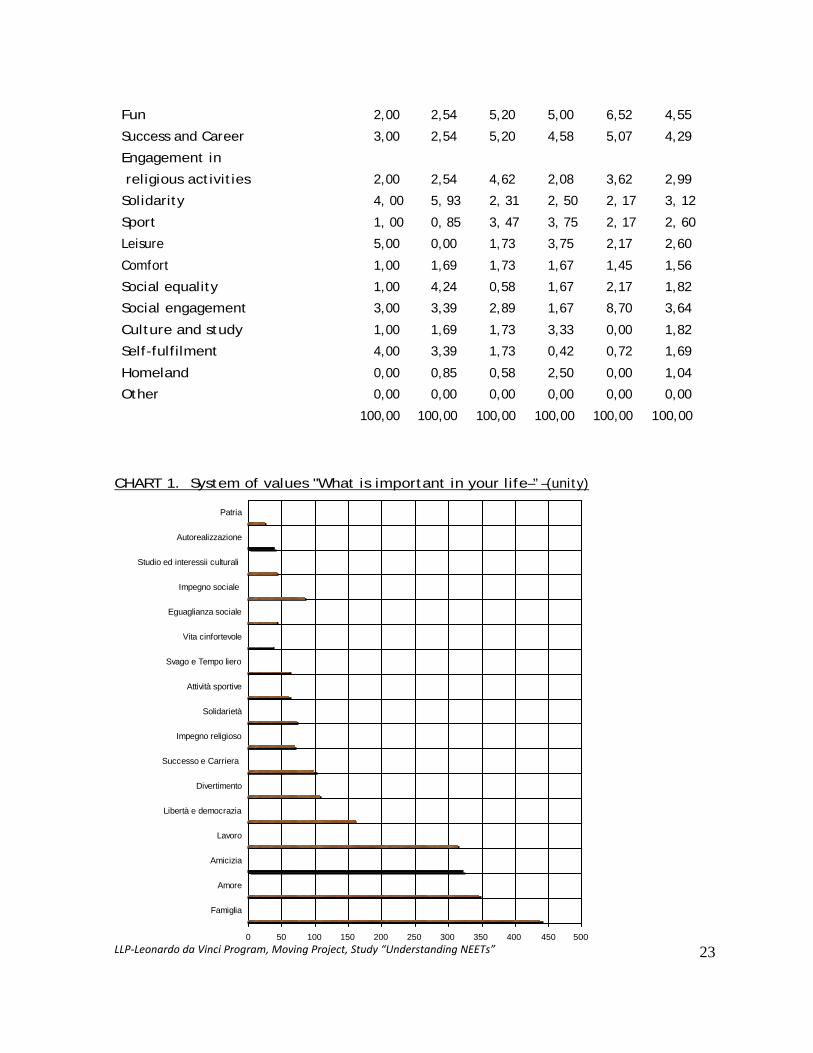
Furthermore, as far as the dialogue with the family members is concerned, the family
model in Crotone is characterized by a high level of communication that witnesses
strong bonds relating to the family. Young people aged between 19 and 23 are those
who have a better dialogue with the parents, on the contrary, young people aged
between 16 and 18 are more reserved and introverted.
Table 3.2. Level of dialogue and communication in the family – (%)
Age
Dialogue 1 30-34 24-29 19-23 16-18 13-15
High 20% 38% 47% 19% 36%
Low 20% 26% 19% 40% 11%
At all 0% 0% 0% 6% 7%
enough 60% 35% 33% 35% 46%
Total % 100% 100% 100% 100% 100%
At the question with whom the communication is better, in the totality of the interviewed young people seem to prevail a strong confidence in the Mother, this because women are generally known as more sensible to problems and in particular mothers. Then follows the father, while the dialogue with brothers and sisters is less frequent; the father represents still today the dictatorial person of the family and often also the tougher one but, even standing in awe of him, it seems that the father is more open minded than in comparison with the past generations.

LLP‐Leonardo da Vinci Program, Moving Project, Study “Understanding NEETs” 29
Tab. 3.3 Level of dialogue and communication – (%)
Classes d à Dialogue 2 30-34 24-29 19-23 16-18 13-15
father 15% 5% 14% 13% 33%
Mother 69% 64% 63% 46% 43%
Brothers and sisters i t i t
15% 32% 23% 39% 17%
Nobody 0% 0% 0% 0% 7%
other 2%
Total % 100% 100% 100% 100% 100%
Chart 3.3. Level of dialogue and communication – (unit)
300
250
200
150
100
50
0 Father Mother Brothers and Sisters Nobody Other
The data point out that abou t 91% o f y o u n g p e o p l e l i v e i n u n i t ed f a m i l i e s , w h i l e t h e r em a i n i n g 1 0 % l i v e i n s e p a r a t e d f a m i l i e s .
Table 3.4. Is your family united or split up – (%)
Age
Family situation 30-34 24-29 19-23 16-18 13-15
United 95% 92% 92% 91% 86%
Split up 5% 8% 8% 9% 14%
Total % 100% 100% 100% 100% 100%

LLP‐Leonardo da Vinci Program, Moving Project, Study “Understanding NEETs” 30
As far as the involvement of the young people in the family unit is concerned, the data point out that
an average of 53% show a high level of cooperation in the family while the 41% show a low
cooperation level and the residual 5% a cooperation level equal to 0.
Table 3.5. Cooperation level in the family – (%)
Classi di à Cooperation 1 30-34 24-29 19-23 16-18 13-15
high 61% 43% 53% 51% 61%
low 39% 52% 39% 45% 32%
none 0% 4% 8% 4% 7%
Total %
Chart 3.5. Cooperation level in the family (Unit)
250
200
150
100
50
0 high low none
Young people aged from 13 to 29 cooperate more in the housework, while the data is reversed for
young people aged between 30 and 34, who cooperate as far as shopping and home economy is
concerned and a little bit less in the housework. Th i s l a t ter data shows the tendency o f
the new generat ion to pro t ract more and more i t s s tay in the i r fami ly and
inc rease the number o f young peop le l i v ing permanent ly w i th the i r parent s .
Th i s t ypo logy o f young peop le cont r ibutes to the i r fami l y budget wi th the i r
own income.

LLP‐Leonardo da Vinci Program, Moving Project, Study “Understanding NEETs” 31
Table 3.6. Kind of cooperation in your family – (%)
Cooperation 2 30-34 24-29 19-23 16-18 13-15
Housework 37% 75% 69% 70% 62%
Economy 37% 10% 16% 14% 19%
shopping 26% 10% 16% 11% 15%
other 5% 5% 4%
Total % 100% 100% 100% 100% 100%

LLP‐Leonardo da Vinci Program, Moving Project, Study “Understanding NEETs” 32
Chart 3.6. Kind of cooperation in your family – (%)
13-15
16-18
19-23 housework
Economy
Shopping
24-29
30-34
0% 20% 40% 60% 80% 100% At the question about the problems in the family, most of the interviewed answered that there were
none, while the problems that more distress the families of the young people of the Province of Crotone
are first of all unemployment, then quarrels, followed by emigration and illness. Only few of them
showed problems associated to drug-addiction.
Table 3.7. Problems inside the family – (%)
age
Problems inside the family in f i li
30-34 24-29 19-23 16-18 13-15
Alcohol 0% 0% 0% 11% 0%
Violence 0% 0% 0% 0% 0%
Drugs 0% 0% 0% 2% 7%
Illness 10% 9% 3% 4% 4%
unemployment 40% 22% 9% 2% 0%
Emigration 10% 0% 9% 9% 0%
Quarrels 5% 22% 18% 2% 11%
None 35% 48% 61% 70% 78%
Total % 100% 100% 100% 100% 100%

LLP‐Leonardo da Vinci Program, Moving Project, Study “Understanding NEETs” 33
4. School With the term school we mean an institution with educational purposes which helps young people to
fetch out something they have hidden inside, through a programme of meticulously organized studies
or activities.
The school can have different functions or purposes:
• The cognitive function based on the teaching of basic knowledge
• The professionalizing function based on the transmission of specific competences
• The socializing function based on the development of relational abilities
• The political-cultural function based on the transmission of the values of the community
In our survey we asked our sample of youth from the Province of Crotone about their
opinion on school, their confidence in teachers and if their teachers do their job well.
The survey showed the interviewees believe that school has first of all the cognitive
function of giving a basic knowledge (33,2%). Young people who think that school has a
professionalizing function are 28.2%, a socializing function 27.6%, while 11.2 % believe
that school has a political-cultural function.
Chart 4.1. School’s Function – (%)
Political-cultural
Socializing
Professionalizing
Cognitive
0 5 10 15 20 25 30 35

LLP‐Leonardo da Vinci Program, Moving Project, Study “Understanding NEETs” 34
Table 4.1. School’s Function- (%)
age
Functions 30-34 24-29 19-23 16-18 13-15
Cognitive 44% 28% 28% 22% 44%
Professionalizing 28% 28% 28% 35% 22%
Socializing 16% 31% 35% 30% 26%
Political-cultural Culturale 12% 14% 10% 13% 7%
Total % 100% 100% 100% 100% 100%
The school experience is prevailingly based on relations with the teachers. The teachers represent
the school. It is meaningful how the teachers’ confidence increases with the age of the young
people; it seems that more one is far from the experience and more one becomes aware of the
contribution of the teachers to their school maturation.
Young people aged between 30 and 34 are rather confident compared to others, but this confidence tends to decrease until the age of 16-18 and then decreases up to 36% for the young people of age between 13-1
Chart 4.1. School’s Function – (%)
Political - Cultural
Socializing
Professionalizing
Cognitive
0 5 10 15 20 25 30 35

LLP‐Leonardo da Vinci Program, Moving Project, Study “Understanding NEETs” 35
Table 4.1. School’s Function- (%)
age
Functions 30-34 24-29 19-23 16-18 13-15
Cognitive 44% 28% 28% 22% 44%
Professionalizing 28% 28% 28% 35% 22%
Socializing 16% 31% 35% 30% 26%
Political-cultural 12% 14% 10% 13% 7%
Total % 100% 100% 100% 100% 100%
The more sceptical are the young people aged 16-18 who have only little confidence in their
teachers.
Table 4.2. Confidence in teachers – (%)
age
Confidence in teachersI ti
30-34 24-29 19-23 16-18 13-15
High 0% 12% 22% 17% 46%
low 37% 36% 33% 54% 11%
none 11% 12% 6% 6% 7%
enough 53% 40% 39% 23% 36%
Total % 100% 100% 100% 100% 100%
As far as the teachers’ training is concerned, 60% is satisfied, 32% believes that they are not well –
trained and only 9% thinks that they don’t have any adequate preparation.

LLP‐Leonardo da Vinci Program, Moving Project, Study “Understanding NEETs” 36
Chart 4.3. Teachers’ preparation
enough
none
low
high
0% 10% 20% 30% 40% 50%
Table 4.3. Teachers’ preparation – (%)
age
Teachers’training 30-34 24-29 19-23 16-18 13-15
high 0% 4% 11% 29% 39%
low 42% 56% 33% 25% 7%
none 16% 0% 17% 6% 7%
Enough 42% 40% 39% 40% 46%
Total % 100% 100% 100% 100% 100%

LLP‐Leonardo da Vinci Program, Moving Project, Study “Understanding NEETs” 37
5. Training Post-school education and training, learning a foreign language and new technologies are crucial items
in the processes of the socio-economical phenomena globalization, European integration, and
particularly integration in the labour market.
Almost 70% of young people from the Province of Crotone admitted they do not attend any extra
training apart from school time.
TABLE 5.1 Attendance of post-school education and training – (%)
Age b k Post-school courses 30-34 24-29 19-23 16-18 13-15
Yes 30% 28% 31% 19% 39%
NO 70% 72% 69% 81% 61%
Total% 100% 100% 100% 100% 100%
TABLE 5.2. Attendance of vocational training – (%) Age bracket
FP Courses 30-34 24-29 19-23 16-18 13-15
Yes 30% 28% 36% 8% 14%
NO 70% 72% 64% 92% 86%
Total% 100% 100% 100% 100% 100%
One of the most outstanding innovations in young people behaviour is connected with new multimedia
technologies, mainly personal computer. A high percentage of the interviewees (90% of all age
brackets) declared they can use a PC.

LLP‐Leonardo da Vinci Program, Moving Project, Study “Understanding NEETs” 38
TABLE 5.3.Use of PC (%) Age bracket
Use of PC 30-34 24-29 19-23 16-18 13-15
Yes 90% 84% 94% 92% 96%
NO 10% 16% 6% 8% 4%
Total% 100% 100% 100% 100% 100% The most common software is Internet Explorer, (surfing and research) and Word (text writing) with about 30%. Other software is scarcely used.
TABLE 5.4. Multimedia software – (%) Age bracket
Software 30-34 24-29 19-23 16-18 13-15
Word 32% 27% 31% 28% 28%
Excel 16% 23% 19% 17% 19%
Power Point 18% 15% 19% 21% 16%
Access 5% 12% 4% 5% 8%
Internet 30% 23% 28% 29% 29%
Total% 100% 100% 100% 100% 100%
Tab. 5.5 Where did you attend your training – (%) Age bracket
Where 30-34 24-29 19-23 16-18 13-15
School 17% 30% 26% 11% 7%
Private schools 6% 13% 6% 9% 15%
Home 78% 57% 69% 80% 78%
Total% 100% 100% 100% 100% 100%

LLP‐Leonardo da Vinci Program, Moving Project, Study “Understanding NEETs” 39
CHART. 5.1 Where did you learn to use a computer – (unity?)
350
300
250
200
150
100
50
0 School Private schools Home
TABLE. 5.6 PC knowledge level - (%) Age bracket
Knowledge level 30-34 24-29 19-23 16-18 13-15
High 28% 29% 38% 7% 22%
Medium 72% 62% 56% 70% 70%
Low 0% 10% 6% 23% 7%
Total% 100% 100% 100% 100% 100%
Table 5.5 and 5.6 show that most of the interviewees have a basic competence (75%), but they do
not attain a higher competence since they prefer to be self-taught.
As far as linguistic competence is concerned, the survey shows encouraging results. Only 15% of the
interviewees admitted they do not speak any foreign language. 85% declared they can speak at least
one foreign language.
TABLE 5.7.Foreign Languages – (%) Age
Foreign Language 30-34 24-29 19-23 16-18 13-15
Yes 90% 88% 94% 75% 86%
NO 10% 12% 6% 25% 14%
Total% 100% 100% 100% 100% 100%

LLP‐Leonardo da Vinci Program, Moving Project, Study “Understanding NEETs” 40
If we examine the knowledge level, we discover that the interviewees have quite a
superficial competence of the foreign language they declare to know.
TABLE 5.8 Knowledge level of foreign language – (%) Age b k Level 30-34 24-29 19-23 16-18 13-15
High 22% 9% 9% 6% 14%
Average 28% 50% 71% 55% 81%
Low 50% 41% 21% 39% 5%
Total% 100% 100% 100% 100% 100%
88% of our sample learnt a foreign language at school. A very low percentage learnt languages by
travelling abroad (8.6%) or attending post-school courses in private schools (3.6%).
The unbundled data shows that young people with a better knowledge of a foreign
language are those who studied abroad or in private schools.
TABLE 5.9 Where did you learn a foreign language – (%) Age bracket
Where 30-34 24-29 19-23 16-18 13-15
School 89% 88% 86% 89% 88%
Private schools 0% 4% 6% 0% 8%
Travelling 11% 8% 9% 11% 4%
Total% 100% 100% 100% 100% 100%
CHART 5.2. Where did you learn a foreign language (%)
90
80 70 60
50 40 30
20

LLP‐Leonardo da Vinci Program, Moving Project, Study “Understanding NEETs” 41
10
0 school ist privati home
English is the most common foreign language (65%), followed by French (25%), Spanish (7%), and
German (2.5%)
TABLE 5.10 Which Foreign Language do you speak (%)
Classi di età Lingue 30-34 24-29 19-23 16-18 13-15 Inglese 56% 71% 64% 66% 71%Francese 32% 25% 23% 19% 24%Spagnolo 12% 4% 4% 4% 6%Tedesco 0% 0% 6% 4% 0%Altro 0% 0% 2% 6% 0%Totale % 100% 100% 100% 100% 100%

LLP‐Leonardo da Vinci Program, Moving Project, Study “Understanding NEETs” 42
The outcomes of our survey reflect some significant changes within the labour market and the
spreading of new modes and trends in working relationships. First of all we need to underline that
50% of young people aged between 30 and 34, 40% between 24 and 29 and 53% between
19 and 23 are unemployed.
TABLE 6.1 Young people under employment– (%)
Age bracket
Employment 30-34 24-29 19-23 16-18 13-15
Yes 50% 60% 47% 25% 22%
NO 50% 40% 53% 75% 78%
Total% 100% 100% 100% 100% 100%
CHART 6.1 Young people under employment – (%)
13-15
16-18
19-23 SI
NO 24-29
30-34
0% 20% 40% 60% 80% 100%
47% of young people are temporary employees or on short-term contracts (odd jobs), 23% has a
fixed-term job, 18% has illegal (off-the-book) jobs. Only 5% has a steady job.

LLP‐Leonardo da Vinci Program, Moving Project, Study “Understanding NEETs” 43
TABLE 6.2 Type of employment (%)
Age b k
Type of employment 30-34 24-29 19-23 16-18 13-15 Average
Fixed 30% 40% 18% 17% 0% 23%
Steady 0% 0% 6% 17% 0% 5%
Occasional 30% 20% 24% 33% 17% 25%
Freelance 30% 13% 41% 0% 17% 22%
Illegal 0% 7% 12% 33% 67% 18%
Other 10% 20% 0% 0% 0% 7%
Total% 100% 100% 100% 100% 100% 100% Data concerning the importance of employment are coherent with the present conditions of labour
market and working life. Most of the young people interviewed declared they are willing to move, in
order to find a job suitable to their expectations and wishes (80%)
.
TABLE 6.3. Are you willing to move – (%)
Age
Moving 30-34 24-29 19-23 16-18 13-15
Yes 65% 80% 61% 91% 96%
NO 35% 20% 39% 9% 4%
Total% 100% 100% 100% 100% 100%
Working is important because it is an opportunity to learn new things for the 8.8% of the
interviewees. Second place goes to safety at work. This data increases for the 30-34 and 24-29
b r a c k e t s (43% and 31% respectively). Safety at work is very important for interviewees aged
between 13 and 15 as well (about 31%). This data - quite anomalous compared with the other
young age brackets- can be due to unemployment problems in young families.
TABLE 6.4 Importance of employment (%)
Age b k Importance 30-34 24-29 19-23 16-18 13-15
S 43% 31% 14% 17% 31%
Learning new things 48% 35% 51% 52% 58%
Improve income 9% 35% 34% 31% 12%
Total% 100% 100% 100% 100% 100%

LLP‐Leonardo da Vinci Program, Moving Project, Study “Understanding NEETs” 44
All the young people interviewed (55% between 30 and 34 and about 30% in the other age brackets)
declared it is difficult to find a job in the Province of Crotone area, since there are little opportunities.
TABLE 6.5. Are there opportunities to find a job (%)
Age bracket
Opportunity to find a jobel
30-34 24-29 19-23 16-18 13-15
Yes, many. It is easy to find other
10% 4% 6% 6% 7%
A few 15% 42% 28% 14% 31%
Yes, but not suitable for my wishes
10% 12% 17% 16% 17%
Yes but they are not interesting ma
0% 4% 6% 0% 7%
No 55% 38% 33% 33% 14%
I don't know 10% 0% 11% 31% 24%
Total% 100% 100% 100% 100% 100% Young people interviewed about possible solutions ask for better training opportunities, customized
support and guidance in looking for a job, tax concessions for employers willing to recruit young people,
better opportunities to make experiences abroad, improved relationship between school and business
enterprises. Their advice on working experience/careers and information on job offers are less precise.

LLP‐Leonardo da Vinci Program, Moving Project, Study “Understanding NEETs” 45
Table 6.5 Measures to be taken – (%)
Age bracket
Measures to be taken 30-34 24-29 19-23 16-18 13-15 Media
Better opportunities for training
16% 26% 18% 14% 11% 17%
Customized support and guidance in
16% 5% 6% 20% 15% 13%
Tax concessions for youth employers
11% 19% 14% 20% 15% 16%
Better opportunities to make experience abroad
16% 5% 9% 13% 22% 13%
More information on job offers
3% 14% 11% 2% 4% 7%
More advice about working careers
5% 2% 3% 7% 4% 5%
Improve join between enterprise and school
11% 12% 23% 8% 9% 13%
More tax concessions and reductions for new, young entrepreneurs
16% 12% 12% 11% 9% 12%
I don’t know 0% 5% 3% 2% 9% 4%
Other 5% 0% 0% 0% 2% 1%
Total% 100% 100% 100% 100% 100% 100%
In order to support the unemployed, most young people interviewed ask for an adequate unemployment
benefit, an economic help for families, and the covering of the education and training
expenses.

LLP‐Leonardo da Vinci Program, Moving Project, Study “Understanding NEETs” 46
TABLE 6.6 Support to the unemployed (%)
Age bracket
Support to unemployed 30-34 24-29 19-23 16-18 13-15
Unemployment benefit 39% 36% 31% 13% 21%
Economic help for renting a house 8% 0% 10% 6% 10%
Utilities payment (gas, water, light)
5% 7% 7% 19% 8%
support to families 24% 29% 21% 16% 17%
Covering the costs for school/training
16% 13% 20% 20% 19%
Free Medical costs 5% 16% 5% 20% 15%
Free public transportation 3% 0% 3% 5% 2%
I don’t know 0% 0% 3% 2% 8%
Totale% 100% 100% 100% 100% 100%
7.Territory
How do the young feel their territoriy? The sense of territorial belonging has diverse references: cities, regions, nation, Europe and the world. They mostly refer to their city (51%), very little to their region (9%). Nation is a prime reference for the young (28%), 9% select the world. Europe is still far, though the monetary and institutional integration in the recent years. only 3% refer to Europe.
Graf. 7.1 Territorial Belonging Degree – (%)
World
Europe
Italy
Region
City
0 10 20 30 40 50 60

LLP‐Leonardo da Vinci Program, Moving Project, Study “Understanding NEETs” 47
As far as the territory is concerned with relevant socio-economic aspects, the young have diverse
opinions on a class round. 30-34-year olds think that the city implies youth policies and issues (38%);
Europe implies environmental issues being entitled to decide about ecofriendly development; again, the
city deals with social issues and Europe and Italy with employment (38%). This outlines how the young
feel poorly represented in Europe and at the same time they trust Europe for employment and labor
matters.
The young trust the national health system (56%), whereas they trust their region 25%.
They believe in the Italian defence, security and justice system.
Tab. 7.2 – Territorial Context relevant to socio-economic aspects– (%)
Class 30-34 City Region Italy Europe World
Young People 38% 6% 25% 25% 6% 100%
Environment 19% 13% 19% 38% 13% 100%
Social 50% 0% 38% 6% 6% 100%
Labor 0% 19% 38% 38% 6% 100%
Health System 0% 25% 56% 13% 6% 100%
Defence 0% 0% 56% 31% 13% 100%
Security 25% 0% 38% 31% 6% 100%
Justice 6% 0% 56% 19% 19% 100%
Legislation 0% 0% 56% 31% 13% 100%

LLP‐Leonardo da Vinci Program, Moving Project, Study “Understanding NEETs” 48
24-29-year olds reckon the city appointed to youth policies and matters (30%), to environmental
issues (39%), social questions (41%); they trust Italy for labor matters (30%). Comparing this with the
rate of the group of 30-34-year olds, there is a shift from Europe to Italy. This group trust the
national health system (43%) and do not really their region (17%). They also trust the Governement’s
Department of Justice and Defense; 62% support the national legislation.
Tab. 7.3 – Territorial Context relevant to socio-economic aspects– (%)
Class 24-29
City Region Italy Europe World
Young People 30% 0% 17% 26% 26% 100%
Environment 39% 9% 22% 9% 22% 100%
Social 41% 5% 18% 14% 23% 100%
Labor 17% 13% 30% 22% 17% 100%
Health System 13% 17% 43% 9% 17% 100%
Defense 14% 10% 33% 10% 33% 100%
Security 26% 13% 35% 13% 13% 100%
Justice 23% 0% 45% 18% 14% 100%
Legislation 0% 5% 62% 19% 14% 100% 18-23 year olds appoint the national government to youth policies and matters (48%), the city and the
region to environmental topics (24%), the natinal Government to social and labor matters (33%). Again a
shift from Europe to Italy like the group of 30-34 year olds. They also trust the national health system
(45%) – their region rank 21% and the national Department of Defense and Justice. 44% trust the
national Legislation.
Tab. 7.4 – Territorial Context relevant to socio-economic aspects– (%)
Class 19-23
City Region Italy Europe World
Young People 24% 12% 48% 9% 6% 100%
Environment 24% 24% 21% 15% 15% 100%
Social 27% 18% 33% 6% 15% 100%
Labor 15% 12% 33% 27% 12% 100%
Health System 9% 21% 45% 12% 12% 100%
Defense 6% 12% 61% 12% 9% 100%
Security 15% 6% 39% 30% 9% 100%

LLP‐Leonardo da Vinci Program, Moving Project, Study “Understanding NEETs” 49
Justice 14% 9% 43% 20% 14% 100%
Legislation 3% 6% 44% 34% 13% 100%
16-18-year olds appoint the national Government and their city for youth policies and matters (38%),
environmental issues (29%) both being able to carry out environmentally-friendly policies; their city
for social problems (36%) and the national Government for labor matters (30%).
Unlike the previous age groups, this one trusts the regional health system (the city and the world
too) with a slight confusion on health competences.
The same with regards to defense, security and justice . 43% totally trust the national legislation
system.

LLP‐Leonardo da Vinci Program, Moving Project, Study “Understanding NEETs” 50
Tab. 7.5 – Territorial Context relevant to socio-economic aspects– (%)
Class 16-18
City Region Italy Europe World
Young People 38% 4% 38% 4% 16% 100%
Environment 29% 9% 29% 18% 16% 100%
Social 36% 17% 17% 15% 15% 100%
Labor 27% 5% 30% 23% 16% 100%
Health System 25% 25% 9% 16% 25% 100%
Defense 16% 16% 31% 24% 13% 100%
Security 30% 11% 25% 14% 20% 100%
Justice 18% 7% 34% 18% 23% 100%
Legislation 18% 7% 43% 16% 16% 100% 54% in the 13-15-year olds appoint the city to youth matters and policies, 50% appoint
the region to environmental matters, 28% the city and the national Government to
social issues and 28% Europe to labor policies. This echoes the group of 30-34-year
olds.
Unlike the previous group, this one trust a possibile world health system, with some
slight confusion about health competences. 27% trust the national legislation system.
Tab. 7.6 – Territorial Context relevant to socio-economic aspects– (%)
Class 13-15
City Region Italy Europe World
Young People 54% 15% 12% 12% 8% 100%
Environment 8% 50% 15% 12% 15% 100%
Social 28% 16% 28% 20% 8% 100%
Labor 20% 0% 24% 28% 28% 100%
Health System 19% 23% 23% 8% 27% 100%
Defense 35% 12% 15% 19% 19% 100%
Security 15% 15% 46% 4% 19% 100%
Justice 0% 48% 16% 4% 32% 100%
Legislation 12% 23% 27% 15% 23% 100%

LLP‐Leonardo da Vinci Program, Moving Project, Study “Understanding NEETs” 51
8. Ethnic Prejudice
Immigration and ethnic relations is a very important aspect in the society of our area.Our survey
aims at understanding the tollerance and hostility degree towards migrants.
Data say that 45% welcome the presence of migrants, 35% do not. Such a diversity outlines that
young people are less tollerant towards migrants.
Tab. 8.1 Tollerance degree on Migrants (%)
Ages
Presence of Migrants 30-34 24-29 19-23 16-18 13-15
agree 60% 48% 50% 29% 36%
Little agree 20% 40% 33% 46% 36%
disagree 0% 4% 11% 25% 7%
Do not know 20% 8% 6% 0% 21%
Total % 100% 100% 100% 100% 100%
As far as prejudice in young people is concerned:
37% think that migrants have cr iminal act iv it ies; the percentatge increases and
the age decreases.
Tab. 8.2 Do migrants have criminal activities? – (%)
Ages
Criminality 30-34 24-29 19-23 16-18 13-15
True 15% 32% 39% 63% 32%
False 70% 32% 31% 15% 29%
Do not know 15% 36% 31% 23% 39%
Total % 100% 100% 100% 100% 100%

LLP‐Leonardo da Vinci Program, Moving Project, Study “Understanding NEETs” 52
To the question “ Do migrants take the jobs of the young?”, 24-34- year olds firmly state the question is
false. On the contrary, younger groups confirm the question.
Tab.8.3 Competition and Labor – (%)
Ages
Labor 30-34 24-29 19-23 16-18 13-15
true 15% 28% 39% 65% 39%
false 75% 44% 36% 31% 36%
Do not know 10% 28% 25% 4% 25%
Total % 100% 100% 100% 100% 100%
To the question whether migrants can enrich the culture of the Country, the trend above is confirmed,
older groups are more tollerant and open.
Tab.8.4 Cultural Enrichment – (%)
Ages
Cultural Enrichment 30-34 24-29 19-23 16-18 13-15
true 70% 48% 53% 29% 39%
false 10% 16% 25% 52% 25%
Do not know 20% 36% 22% 19% 36%
Total % 100% 100% 100% 100% 100%
The data portray that older young people are more tollerant and responsible towards the diverse
ethnic groups in our territory; younger groups show a kind of mistrust.
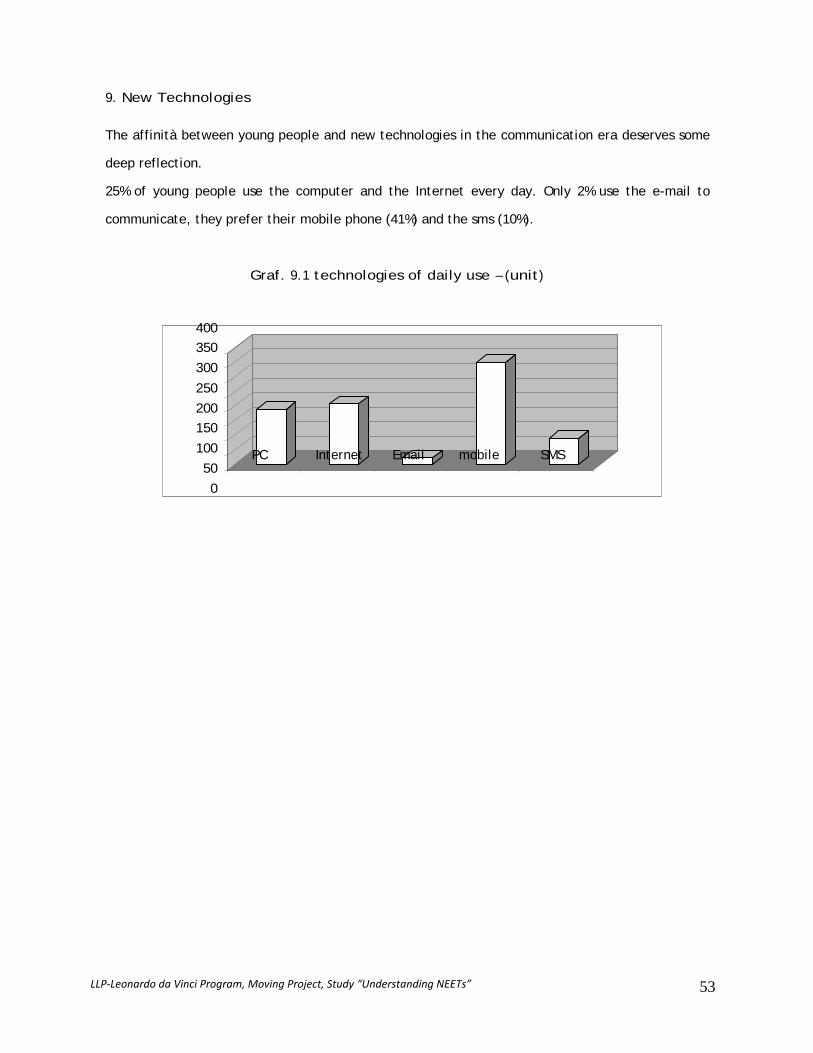
LLP‐Leonardo da Vinci Program, Moving Project, Study “Understanding NEETs” 53
9. New Technologies
The affinità between young people and new technologies in the communication era deserves some
deep reflection.
25% of young people use the computer and the Internet every day. Only 2% use the e-mail to
communicate, they prefer their mobile phone (41%) and the sms (10%).
Graf. 9.1 technologies of daily use – (unit)
400 350
300
250
200 150
100
50
0
PC Internet Email mobile SMS

LLP‐Leonardo da Vinci Program, Moving Project, Study “Understanding NEETs” 54
30-34-year olds seemingly prefer the internet and the e-mail;13-15-year olds prefer their mobile
phone 47%.
tab. 9.1 technology of daily use – (%)
age
technology 30-34 24-29 19-23 16-18 13-15
PC 21% 23% 18% 22% 27%
Internet 31% 26% 26% 23% 16%
Email 10% 0% 3% 0% 2%
Mobile phone 31% 42% 44% 39% 47%
SMS 8% 9% 8% 15% 8%
Total % 100% 100% 100% 100% 100%
As far as the latest technology is concerned, young people love and use the IPOD (55%), which is now a
status symbol to listen to music; WI-FI and Wireless is little used.
tab. 9.2 latest technology – (%)
age
Latest technology 30-34 24-29 19-23 16-18 13-15
Wirelless 25% 48% 17% 16% 33%
WI - FI 13% 4% 17% 14% 26%
IPOD 56% 39% 67% 70% 41%
none 0% 0% 0% 0% 0%
other 6% 9% 0% 0% 0%
Total % 100% 100% 100% 100% 100%
We have also considered the knowlege of softwares within the latest technologies.
Almost 100% of the young people we talked to are familiar with Windows; small
percentages know different softwares too. These are very small numbers and in some
ages. In older groups, there are groups that do not know any software. This analysis is
coherent to the table 5.5, where about 70% learn how to use the PC at home, as an
autodidact.

LLP‐Leonardo da Vinci Program, Moving Project, Study “Understanding NEETs” 55
tab. 9.3 Familiar Kinds of Software– (%)
age
Known software 30-34 24-29 19-23 16-18 13-15
Windows 90% 92% 100% 94% 100%
DOS 0% 0% 0% 0% 0%
none 10% 4% 0% 4% 0%
Other 0% 4% 0% 2% 0%
Total % 100% 100% 100% 100% 100%
10.recreation, holidays and free time
Recreation and sport in the free time, the possibility to relax rank high in the scale of the values of
young people.
In the activities young people particularly do in the week, sport ranks at the top (19%), then TV,
reading and video games. Little time is dedicated to volunteering and arts.
Tab.10.1 frequent activities – ( unit)
Watching TV 204
Sport 201
PUb 147
Reading books 123
videogames 99
Reading newspapers 84
Volunteering 63
Singing/dancing 60
cinema 42
shopping 33

LLP‐Leonardo da Vinci Program, Moving Project, Study “Understanding NEETs” 56
Graf.10.1 frequent activities – (%)
shopping
cinema
singing/dancing
volunteering videogames
reading newspaper
reading books
bar
Sport
watching TV
0% 5% 10% 15% 20%
24-29-year olds read more; 30-34-year olds watch TV more frequently; 13-15-year olds
play with videogames.
Tab. 10.2 frequent activities – (%)
age
Frequent activies 30-34 24-29 19-23 16-18 13-15
volunteering 10% 13% 11% 0% 3%
Sport 15% 9% 20% 22% 24%
Reading books 15% 25% 3% 12% 9%
Reading newspapers 13% 11% 13% 5% 1%
Singing/dancing 3% 5% 5% 5% 9%
Watching TV 21% 20% 18% 19% 19%
Playing with videogames 3% 0% 7% 14% 16%
Shopping 5% 2% 4% 4% 1%
Bar 13% 14% 16% 14% 12%
Cinema 3% 2% 4% 4% 6%
Total 100% 100% 100% 100% 100%
As far as reading is concerned, most of young people read less than 3 bookd (30%), 22% do not read and only 10% read more than 10 books.

LLP‐Leonardo da Vinci Program, Moving Project, Study “Understanding NEETs” 57
Graf.10.2 how many books do you read in a year – (unit)
160
140
120
100
80
60
40
20
0
non e less than 3 from 3 to 5 from 5 to 10 more than 10
young people aged 24-29 read most, than those of 30-34 and finally 13-15. 16-18-year olds read the
least with a percentage of 45%.

LLP‐Leonardo da Vinci Program, Moving Project, Study “Understanding NEETs” 58
Tab.10.4 how many books do you read in a year – (%)
age
reading 30-34 24-29 19-23 16-18 13-15
none 5% 12% 22% 45% 25%
Less than 3 29% 28% 47% 18% 29%
From to 5 24% 36% 19% 10% 21%
from 5 to 10 29% 8% 8% 20% 11%
More than 10 14% 16% 3% 6% 14% 100% 100% 100% 100% 100%
most of young people listen to music in the day, also thanks to the latest technologies such as IPOD.
Only 11% of the sample never do. Younger generations listen the most (35%).
Tab.10.5 how much music do you listen – (%)
age
Music in the day 30-34 24-29 19-23 16-18 13-15
never 20% 12% 0% 13% 11%
1 hour 55% 40% 38% 42% 36%
2 hours 15% 32% 21% 10% 21%
More than 2 hours 10% 16% 41% 35% 32% 100% 100% 100% 100% 100%
Dancing is the activity connected with music young people particularly love (49%); there are only a
small amount of activities connected with the sound and concerts.
.
Graf.10.3 activities connected with music – (unit)
250
200
150
100
50
0 sound dancing rock concerts
classical concerts
none

LLP‐Leonardo da Vinci Program, Moving Project, Study “Understanding NEETs” 59
Tab.10.6 activities connected with music – (%)
age
Activities connected with music 30-34 24-29 19-23 16-18 13-15
Sound 5% 22% 22% 35% 23%
dancing 50% 44% 57% 38% 55%
Rock concerts 35% 34% 22% 13% 19%
Classical Concerts 0% 0% 0% 0% 0%
none 10% 0% 0% 15% 3% 100% 100% 100% 100% 100%
Most of young people go out in the evening at the weekends only (51%); 36% go out almost every evening and a small amount (8%) go out during the holidays.
Tab.10.7 Going out in the evening – (%)
age
Evening going-out 30-34 24-29 19-23 16-18 13-15
Never or almost never 5% 15% 0% 2% 0%
On holiday only 5% 4% 8% 4% 19%
At the weekend only 53% 46% 51% 44% 63%
During the week too 37% 35% 41% 50% 19% 100% 100% 100% 100% 100%
At night, most young people go back home between midnight and 02:00 am (43%), a very small portion
and only 13-18-year olds go back home between 05 – 06.00 am (4%).
Graf.10.4 what time you go back home – (unit)
90 80 70 60 50 40 30 20 10
0 within 22
within 23
within 24
within 1
within 2
within 3
within 4
within 5
within 6

LLP‐Leonardo da Vinci Program, Moving Project, Study “Understanding NEETs” 60
Tab.10.8 when you go back home – (%)
age
Time you go back home 30-34 24-29 19-23 16-18 13-15
Within 10 pm 11% 16% 6% 21% 33%
11 pm 11% 12% 11% 15% 22%
midnight 26% 12% 19% 8% 19%
01 am 11% 8% 11% 19% 11%
02 am 37% 20% 22% 2% 7%
03 am 5% 28% 11% 10% 0%
04 am 0% 4% 11% 10% 0%
05 am 0% 0% 8% 6% 0%
06 am 0% 0% 0% 8% 7% 100% 100% 100% 100% 100%

LLP‐Leonardo da Vinci Program, Moving Project, Study “Understanding NEETs” 61
11. Drugs, smoking and alkohol
In the years, drug abuse has significally changed, so have the addicted and the abuse
itself. Abuse of ecstasy and cocaine is closely connected with the world of the night
entertainment; the number is increasing of teens aged 14 getting familiar with the white
dust. At this age there several new freak-outs: sniffing, cheaper and more accessible,
new drugs such as ketamine (a powder anaesthetic for children and animalas), KHAT, similar
with cannabis, depressing appetize and with the same effects of cocaine. Hashish is largely used and
it implies being together, especially younger people.
The data of our survey report that 16-18-year olds (31%) and 13-15-year olds (18%) are the biggest
drug abusers.
Tab.11.1 Do you use any drugs – (%)
age
drugs 30-34 24-29 19-23 16-18 13-15
NO 85% 84% 89% 69% 82%
yes 15% 16% 11% 31% 18% 100% 100% 100% 100% 100%
Among drug abusers, you should mention the datum reporting that 40% of 13-15-year olds abuse of
heavy drugs, in comparison with the 10% overage in the other age groups.
Tab.11.2 what kind of drug – (%)
age
what 30-34 24-29 19-23 16-18 13-15
light 100% 75% 100% 86% 60%
heavy 0% 25% 0% 14% 40% 100% 100% 100% 100% 100%

LLP‐Leonardo da Vinci Program, Moving Project, Study “Understanding NEETs” 62
Graf.11.1 what kind of drug (unit)
13-15
16-18
19-23
24-29
heavy
light
30-34
0 5 10 15 20 25
Young people of older age abuse of drugs occasionally (67% those aged 30-34 and 75%
those aged 24-29). 13-15-year olds always (50%) or often (25%) do. Among the young,
those aged 13-15 know very little about the effects of drugs (35%).
Tab.11.3 Frequency – (%)
age
frequency 30-34 24-29 19-23 16-18 13-15
always 0% 0% 25% 23% 50%
sometimes 33% 25% 0% 38% 25%
often 0% 0% 25% 23% 25%
occasionally 67% 75% 50% 15% 0% 100% 100% 100% 100% 100%
Tab.11.4 awareness of effects – (%)
age
Awareness of the effects 30-34 24-29 19-23 16-18 13-15
NO 10% 21% 19% 13% 35%
yes 90% 79% 81% 88% 65% 100% 100% 100% 100% 100%

LLP‐Leonardo da Vinci Program, Moving Project, Study “Understanding NEETs” 63
Drug is common in the disco, at school and the public places near the meeting points.
Graf.11.2 where drugs are generally (unit)
other public places amusement arcade group disco school
0 50 100 150 200 250 300
Tab.11.5 where drugs generally pass – (%)
age
Places 30-34 24-29 19-23 16-18 13-15
school 20% 21% 25% 22% 21%
disco 32% 21% 37% 42% 39%
group 16% 31% 13% 11% 9%
Amusement arcade 0% 3% 6% 11% 6%
Public places 28% 21% 19% 10% 15%
other 4% 3% 0% 5% 9% 100% 100% 100% 100% 100%
Hashish 37%, cocaine 23% and marijuana 21% are the most commmon drugs in the places above.
Graf.11.3 most common drugs - (unit)
other
Ecsyasy
heroine
cocaine
Hashish
Mariuana
0 50 100 150 200 250 300 350

LLP‐Leonardo da Vinci Program, Moving Project, Study “Understanding NEETs” 64
On the base of a subdivision per age of the the most common drugs, marijuana, hashish
and cocaine rank top as in the previous table. Data concerning young people report a
spreading of new drugs, such as ecstasy and more (ketamine, MD MA,ecc.) with 20% in the
groups 19-23 and 13-15.
Tab.11.6 Major drugs - (%)
age
sort 30-34 24-29 19-23 16-18 13-15
Marijuana 26% 21% 24% 22% 14%
Hashish 34% 46% 32% 42% 34%
Cocaine 24% 21% 22% 22% 25%
Heroine 8% 0% 1% 6% 7%
Ecstasy 8% 13% 21% 7% 14%
other 0% 0% 0% 0% 7% 100% 100% 100% 100% 100%
To the question why they use drugs, young people first say for curiosity (28.6%), having fun (19.6%) and
to be part of the group (21.2%). Escape from problems and rebellion are the weakest reasons.
Graf.11.4 why they use drugs – (unit)
escape from problems Conformism with the group rebellion pleasure sense of emptiness having fun curiosity
0 20 40 60 80 100 120 140 160 180

LLP‐Leonardo da Vinci Program, Moving Project, Study “Understanding NEETs” 65
Tab.11.7 why they use drugs – (%)
age
Why they use drugs 30-34 24-29 19-23 16-18 13-15
Curiosity 34% 18% 15% 35% 14%
Having fun 19% 15% 23% 23% 18%
emptiness 13% 15% 17% 5% 18%
pleasure 9% 9% 2% 14% 18%
rebellion 3% 6% 7% 5% 5%
Conformism with the group 22% 30% 27% 9% 18%
Escape from problems 0% 6% 10% 9% 9% 100% 100% 100% 100% 100%
With regards to cigarettees and tobacco, most of young people delcare they do not smoke.
The percentages raises to 70% in the older groups, it decreases to 50% in the intermediate levels and
then up again to 68% in the younger groups.
Only 5% of the sample smokes more than one packet per day.
Tab.11.8 Tobacco Consumption – (%)
Age
Do you smoke? 30-34 24-29 19-23 16-18 13-15
Yes, more than 1 packet 0% 4% 6% 6% 4%
From 10 to 20 5% 16% 11% 4% 4%
Less than 10 10% 16% 11% 33% 4%
occasionally 15% 12% 17% 4% 21%
NO 70% 52% 56% 52% 68% 100% 100% 100% 100% 100%
As far as alkohol is concerned, all the people we interviewed of any age, except the youngest, declare
they drink alcohol in remarkable quantities. The least percentage is in the 13-15-year olds (29%).
Most of young people also say they sometimes drink; the daily consumption is very low. Beer is widely
drunk, the younger groups seem to be fond of liquors.

LLP‐Leonardo da Vinci Program, Moving Project, Study “Understanding NEETs” 66
Tab.11.9 Alcohol consumption – (%)
age Do you drink 30-34 24-29 19-23 16-18 13-15
yes 65% 60% 53% 62% 29%
NO 35% 40% 47% 38% 71% 100% 100% 100% 100% 100%
Tab.11.10 frequency – (%)
age
Do you drink 30-34 24-29 19-23 16-18 13-15
Every day 15% 20% 0% 13% 13%
Every week 8% 7% 17% 27% 13%
occasionally 77% 73% 83% 60% 75% 100% 100% 100% 100% 100%
Tab.11.11 sort of alcohol – (%)
age
Do you drink 30-34 24-29 19-23 16-18 13-15
beer 63% 48% 47% 43% 45%
wine 31% 26% 16% 25% 0%
liquors 6% 26% 38% 32% 55% 100% 100% 100% 100% 100%
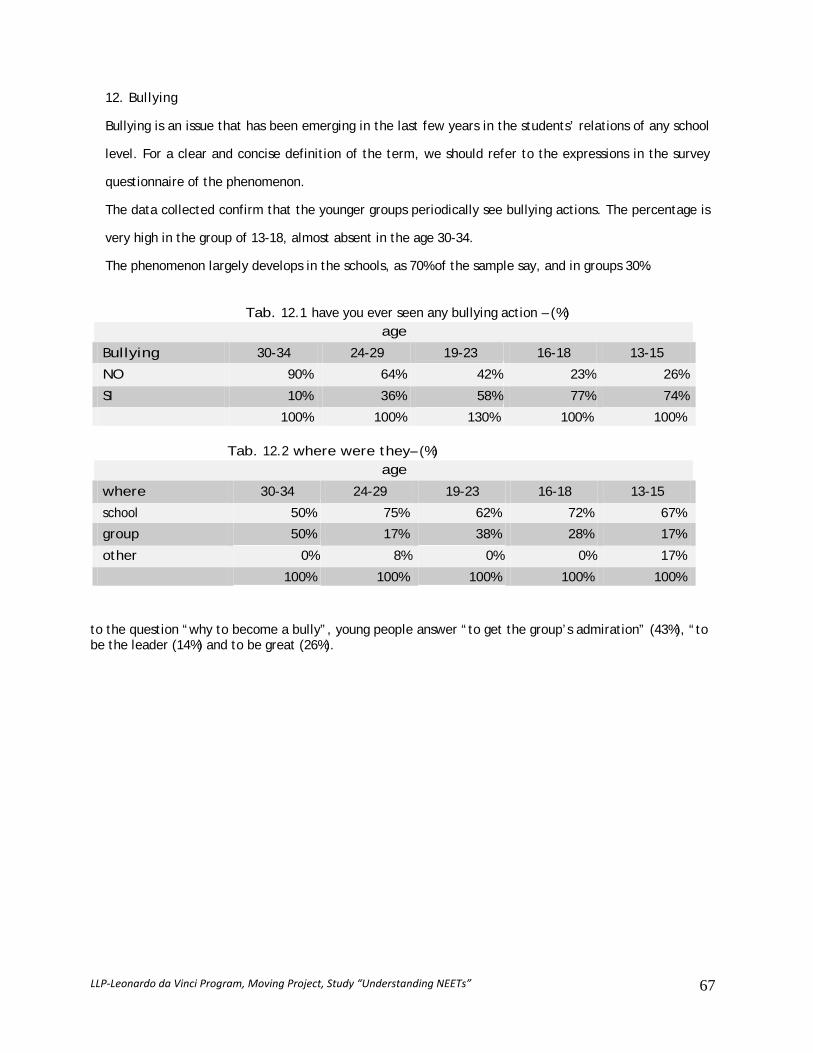
LLP‐Leonardo da Vinci Program, Moving Project, Study “Understanding NEETs” 67
12. Bullying
Bullying is an issue that has been emerging in the last few years in the students’ relations of any school
level. For a clear and concise definition of the term, we should refer to the expressions in the survey
questionnaire of the phenomenon.
The data collected confirm that the younger groups periodically see bullying actions. The percentage is
very high in the group of 13-18, almost absent in the age 30-34.
The phenomenon largely develops in the schools, as 70% of the sample say, and in groups 30%.
Tab. 12.1 have you ever seen any bullying action – (%)
age
Bullying 30-34 24-29 19-23 16-18 13-15
NO 90% 64% 42% 23% 26%
SI 10% 36% 58% 77% 74% 100% 100% 130% 100% 100%
Tab. 12.2 where were they– (%)
age
where 30-34 24-29 19-23 16-18 13-15
school 50% 75% 62% 72% 67%
group 50% 17% 38% 28% 17%
other 0% 8% 0% 0% 17% 100% 100% 100% 100% 100%
to the question “why to become a bully”, young people answer “to get the group’s admiration” (43%), “to be the leader (14%) and to be great (26%).

LLP‐Leonardo da Vinci Program, Moving Project, Study “Understanding NEETs” 68
Tab. 12.3 why to become a bully – (%) age
why 30-34 24-29 19-23 16-18 13-15
Group’s admiration 45% 13% 64% 41% 52%
Be a leader 10% 8% 18% 22% 12%
Appeal the other gender 5% 4% 4% 2% 12%
Prove one’s courage 20% 13% 11% 8% 3%
Feel mighty 20% 63% 4% 27% 18%
other 0% 0% 0% 0% 3% 100% 100% 100% 100% 100% In cases of bullying, young people report to their parents (50%), to their friends and also to their teachers.
Graf. 12.2 who do you report to – (unit)
400 350 300 250 200 150 100 50 0
family ( dad &mom)
school ( principal &teachers)
friends

LLP‐Leonardo da Vinci Program, Moving Project, Study “Understanding NEETs” 69
Tab. 12.4 who do you report to – (%)
age
Who do you report to 30-34 24-29 19-23 16-18 13-15
Family (father & mother) 55% 61% 57% 47% 49%
School (principal & teachers) 6% 5% 8% 15% 16%
friends 36% 34% 33% 36% 35%
none 3% 0% 0% 3% 0%
others 0% 0% 2% 0% 0% 100% 100% 100% 100% 100%
13. youth associations
Youth associationism is not a predominant aspect in the life of the young in the Province of Crotone
compared to other situations of a stronger tradition. About 68.4% of the young are not in any
associations. Data are directly proportional with the age: they raise parallel to the age. There is a sort
of skepticism with the age and in fact, they assert:
- they have never joined any initiatives of active citizenship 40%
- they ignore the meaning of the participation 20%
Tab.13.1 are you a member of any youth associations – (%)
age
Youth Organization 30-34 24-29 19-23 16-18 13-15
Yes 20% 33% 22% 38% 46%
NO 80% 67% 78% 63% 54% 100% 100% 100% 100% 100%
Tab.13.2 level of youth participation – (%)
age
Level of participation 30-34 24-29 19-23 16-18 13-15
high 0% 0% 3% 0% 13%
satisfactory 11% 0% 8% 31% 13%
As in the other Countries I know 0% 0% 3% 10% 17%

LLP‐Leonardo da Vinci Program, Moving Project, Study “Understanding NEETs” 70
Below the average 21% 30% 14% 13% 17%
Too low 42% 57% 53% 27% 23%
I do not know 26% 13% 19% 19% 17% 100% 100% 100% 100% 100%
Tab.13.3 have you ever joined any active citizenship events – (%)
age have you ever joined any active citizenship events 30-34 24-29 19-23 16-18 13-15
Yes, I have 29% 23% 19% 25% 15%
I could not join any 59% 36% 47% 23% 30%
Not interested 0% 14% 14% 29% 37%
I do not know what “active citizenship” means 12% 27% 19% 23% 19% 100% 100% 100% 100% 100%
Young people in Crotone think that being a member of a youth organization is the best
way to be active in the development of the city (32%); 37% do not what the best way can
be. 17% rely on a political party and the remaining 14% the vote.
Graf. 13.1the best way to be an active citizen– (unit)
180 160 140 120 100 80 60 40 20 0
political party
no-profit boards
vote
do not know

LLP‐Leonardo da Vinci Program, Moving Project, Study “Understanding NEETs” 71
Tab. 13.4 the best way to take part in the active citizenship– (%)
age
The best way to participate 30-34 24-29 19-23 16-18 13-15
Be member of a political party 21% 13% 14% 17% 19%
Be member of an organization (no profit, associations) 26% 52% 37% 26% 19%
vote 26% 9% 17% 7% 11%
Do not know 26% 26% 31% 50% 52%
100% 100% 100% 100% 100%
Tab. 13.5 how would you like to be informed – (%)
age
How would you like to be informed 30-34 24-29 19-23 16-18 13-15
Press, magazines 21% 22% 9% 12% 6%
TV, radio 18% 35% 34% 36% 63%
internet 14% 14% 26% 20% 9%
Information centers 36% 27% 19% 2% 3%
school 4% 3% 9% 18% 19%
Do not know 7% 0% 2% 12% 0% 100% 100% 100% 100% 100%
Young people that are members of voIuntary organizations or youth associations are mostly active in
sport, culture/arts and religion.
There is less interest in the environment, and it should be fundamental, and in the fight against
discrimination.
Graf. 13.2 what association are you active in?– (%)
against discrimination environment assistence education culture/arts religion sports
0 5 10 15 20 25 30 35

LLP‐Leonardo da Vinci Program, Moving Project, Study “Understanding NEETs” 72
Tab. 13.6 what association are you active in – (%)
age
sort 34-30 24-29 19-23 16-18 13-15
sports 13% 0% 8% 43% 11%
Culture/arts 40% 11% 8% 13% 5%
religion 13% 39% 38% 30% 37%
environment 7% 6% 0% 0% 26%
education 7% 11% 15% 4% 11%
assistance 13% 33% 23% 9% 0%
Anti-discrimination 7% 0% 8% 0% 11% 100% 100% 100% 100% 100%
With reference to the Institutions and the world of the young, the people we interviewd conclude the
former are completely far (36%), fairly far (29%) totally absent (26%).

LLP‐Leonardo da Vinci Program, Moving Project, Study “Understanding NEETs” 73
Graf. 13.3 do the institutions know the world of the young? – (%)
do not know yes, alot not at all yest, in part yes, but very little
0 5 10 15 20 25 30 35 40
The young people we interviewed claim a prime role and more opportunities.
Graf. 13.4 more opportunities for young people – (%)
NO
yes
0% 20% 40% 60% 80% 100%

LLP‐Leonardo da Vinci Program, Moving Project, Study “Understanding NEETs” 74
2.2.3 Good practice to reduce the young unemployment rate in Crotone Informagiovani – the center was open in December 2006; mostly 24- 29-year olds go there, then 30-34-year olds (60%).
Tab.14.1 do you know the center
age Do you know the center in Crotone 30-34 24-29 19-23 16-18 13-15
yes 60% 90% 41% 17% 7%
NO 40% 10% 71% 83% 93%
60 % of the people we interviewed have visited the center; 57% (24-29) have visited
the Church in Crotone to know about their services.
Tab.14.2 do you know the center
age
Have you been there 30-34 24-29 19-23 16-18 13-15
yes 60% 57% 30% 13% 7%
NO 40% 43% 77% 88% 93%
In the center, people mostly wanted information about a job (30%), schools and training.
15% came to use the Internet free and to see job vacancies.

LLP‐Leonardo da Vinci Program, Moving Project, Study “Understanding NEETs”
75
Tab.14.3 what did you ask for in the center of Crotone
age What did you ask for 30-34 24-29 19-23 16-18 13-15
Labor information 38% 33% 38% 29% 0%
School/training information 23% 40% 25% 43% 100%
Free time/culture 8% 0% 0% 0% 0%
Job vacancies 15% 13% 25% 14% 0%
Use of the internet 15% 13% 13% 14% 0%
About 90% of the young people were satisfied with the center and its services. They think the
services are essential and innovative. Teens of 16-18 were not totally satisfied.
Tab.14.4 Level of Satisfaction
age opinion 30-34 24-29 19-23 16-18 13-15
Not at all 0% 0% 11% 0% 0%
poor 0% 0% 0% 50% 0%
enough 75% 85% 78% 33% 100%
much 25% 15% 11% 17% 0%
63% would like to improve the location and 38% the activities.
Graf. 14.1 what would you improve in the center in Crotone
70
60
50
40 63
30 38
20
10
0 location activities

LLP‐Leonardo da Vinci Program, Moving Project, Study “Understanding NEETs”
76
At present, there are no data concerning the phenomenon of Neets in Calabria. The project and
particularly this survey encouraged the local boards, policy-makers and people active in juvenile
policies to understand the issue and to identify possible solutions to reduce the juvenile discomfort.

LLP‐Leonardo da Vinci Program, Moving Project, Study “Understanding NEETs”
77
2.3. Spain - Andalucia (Junta de Andalucia)
2.3.1 Context
It is the most populous (8,285,692 inhabitants in 2009: 4.113.383 men, 4.189.540 women) and the
second largest, in terms of land area, of the seventeen autonomous communities of the Kingdom of
Spain. Its capital and largest city is Seville. The region is divided into eight provinces: Huelva, Seville,
Cádiz, Córdoba, Málaga, Jaén, Granada and Almería and 771 municipalities. It has a total area of
87.268 km2, its density of population is 102,07 inh/km2 .
The population is concentrated, above all, in the provincial capitals and along the coasts, so that the
level of urbanization is quite high; half the population is concentrated in the 28 cities of more than
50,000 inhabitants. The population is aging, although the process of immigration is countering the
inversion of the population pyramid. There is around 8.1% immigrant population.
Andalusia is in the south of the Iberian peninsula, immediately south of the autonomous communities of
Extremadura and Castile-La Mancha; west of the autonomous community of Murcia and the
Mediterranean Sea; east of Portugal and the Atlantic Ocean; and north of the Mediterranean Sea and
the Strait of Gibraltar, which separates Spain from Morocco, and the Atlantic Ocean. The small British
overseas territory of Gibraltar shares a three-quarter-mile land border with the Andalusian province of
Cádiz at the eastern end of the Strait of Gibraltar.
2.3.2. ECONOMIC SITUATION OF THE REGION
Since the Industrial Revolution, Andalusia has been an economically poor region in comparison with the
rest of Spain and the European Union at large. Agriculture and the service sectors predominate in the
economy. Andalusia is traditionally an agricultural area, but the service sector (particularly tourism,
retail sales, and transportation) now predominates. The once booming construction sector, hit hard by
the 2009 recession, was also important to the region's economy. The industrial sector is less developed
than most other regions in Spain. During the period for the 2000–2006 period was 3.72%, one of the
highest in the country. Still, according to the Spanish Instituto Nacional de Estadística (INE), the GDP
per capita of Andalusia (€17,401; 2006) remains the second lowest in Spain, with only Extremadura
lagging behind.
The region has, however, a rich culture and a strong cultural identity. Many cultural phenomena that
are seen internationally as distinctively Spanish are largely or entirely Andalusian in origin. These
include flamenco, bullfighting, and certain Moorish-influenced architectural styles.

LLP‐Leonardo da Vinci Program, Moving Project, Study “Understanding NEETs”
78
2.3.3. STATISTICS - DATA OF YOUNG POPULATION FROM 16-29 YEARS OLD
Variación sobre
4º Trim. 2009
Variación sobre
1er. Trim. 2009
Absolute numbers in thousands of
people and percentages in hundred
per cents
Cifras
1er. Trim.
2010 Dif. % Dif. %
YOUNGSTERS BETWEEN 16 AND 29
YEARS
7.755,6 -76,3 -0,97% -303,9 -3,77%
- Men 3.960,4 -42,0 -1,05% -171,6 -4,15%
- Women 3.795,2 -34,3 -0,89% -132,2 -3,37%
Youngsters in education (official and
unofficial)
3.559,9 82,9 2,38% 122,2 3,55%
- Men 1.724,5 49,6 2,96% 81,7 4,97%
- Women 1.835,4 33,3 1,85% 40,5 2,25%
ACTIVE YOUNGSTERS (looking for
employment)
4.959,1 -77,4 -1,54% -379,0 -7,10%
- Men 2.636,2 -61,9 -2,29% -251,6 -8,71%
- Women 2.323,0 -15,5 -0,66% -127,4 -5,20%
Active youngsters in education
(official and unofficial)
1.203,2 20,0 1,69% -9,5 -0,78%
- Men 574,7 11,3 2,00% 14,2 2,54%
- Women 628,5 8,7 1,41% -23,7 -3,64%
Employed Youngsters 3.379,7 -138,0 -3,92% -497,0 -12,82%
- Men 1.736,4 -102,8 -5,59% -323,3 -15,70%
- Women 1.643,2 -35,1 -2,09% -173,7 -9,56%
Employed youngsters under official
education (11,65%)
393,6 -15,1 -3,69% -35,4 -8,26%
- Men 181,2 -13,3 -6,84% -20,0 -9,96%
- Women 212,4 -1,8 -0,83% -15,4 -6,76%
Unemployed Youngsters 1.579,5 60,6 3,99% 117,9 8,07%
- Men 899,8 40,9 4,76% 71,7 8,66%
- Women 679,7 19,6 2,98% 46,2 7,30%
Unemployed youngsters under
education (official and unofficial)
(26,88%)
424,5 31,6 8,05% 72,2 20,49%
- Men 214,3 20,5 10,57% 47,6 28,59%
- Women 210,2 11,1 5,60% 24,5 13,21%
Unemployed youngsters with high
education
287,0 8,8 3,18% 49,4 20,77%

LLP‐Leonardo da Vinci Program, Moving Project, Study “Understanding NEETs”
79
- Men 129,3 10,7 9,00% 19,3 17,59%
- Women 157,6 -1,8 -1,15% 30,0 23,52%
Non-active youngsters 2.796,4 1,1 0,04% 117,5 4,20%
- Men 1.324,2 19,9 1,52% 92,0 6,94%
- Women 1.472,2 -18,8 -1,27% 25,5 1,73%
Non-active youngsters in education
(oficial and unofficial)
2.356,7 62,9 2,67% 210,7 8,94%
- Men 1.149,8 38,3 3,33% 109,6 9,53%
- Women 1.206,9 24,6 2,03% 101,1 8,38%
ANDALUCÍA DATA
Variación sobre 4º Trim. 2009
Variación sobre 1er. Trim. 2009 YOUNG POPULATION
Cifras 1er Trim. 2010
Dif. % Dif. % TOTAL 7.755,6 -76,3 -0,97% -364,1 -4,69% Andalucía 1.534,3 -11,4 -0,74% -56,1 -3,65%
ACTIVE YOUNGSTERS
TOTAL 4.959,1 -77,4 -1,54% -379,0 -7,10% Andalucía 969,4 4,8 0,50% -79,3 -8,18%
EMPLOYED YOUNGSTERS
TOTAL 3.379,7 -138,0 -3,92% -497,0 -12,82% Andalucía 588,6 -21,4 -3,51% -136,7 -23,22%
UNEMPLOYED YOUNGSTERS
TOTAL 1.579,5 60,6 3,99% 117,9 8,07% Andalucía 380,8 26,2 7,38% 57,4 15,07%
NON-ACTIVE YOUNGSTERS
TOTAL 2.796,4 1,1 0,04% 117,5 4,20% Andalucía 564,9 -16,2 -2,79% 23,2 4,10%

LLP‐Leonardo da Vinci Program, Moving Project, Study “Understanding NEETs”
80
During last decades the educational level of Spanish youngsters has increased notably. Nowadays,
education is compulsory for all population between 6-16, and schooling rate at 17 is nearly 80%. Even
though it is not compulsory, schooling is universal for children between 4 and 6 years old.
Despite this evolution, there are worrying aspects that generate deficits in terms of equity. Firstly, the
training level of young population is lower than the rest of European countries –the proportion of
youngsters that have finished post-compulsory education is low, according to standards of OECD
countries.
Secondly, there is a group of young people that is at risk, because they have dropped out the
educational system, they have not joined the labour market and they have abandoned job seeking.
According to OECD data, a 2.7% of youngsters between 15 and 19 years old is outside the educative
system and is not seeking a job; this percentage rises up to a 5.2% in the group of 20-24 years old. At
the same time, if we add those youngsters not in education but seeking a job, we could conclude that a
22% of youngsters 15-24 are not neither in education nor in employment.
As a consequence of the ageing of the population and the lowering of fecundity in the last decades,
active youngsters under 30 have lost weight with respect to total active population. They have passed
from a 30% of active population in 1999 to a 23% in 2009. This situation is more noticeable in the 16-19
group that represents a 2% from the total in 2009. The reduction had been even more manifest without
the immigration phenomenon, as immigrants are contributing to an increase of active population in
Spain.
Activity rate of youngsters under 30 is 66%, whereas the rest of the population has a rate of 60% in
2009. Both rates have had an increasing evolution, due to incorporation of women to the labour market
and the arrival of immigrants, whose activity rate is higher than that of native population.
On the other side, the increase of activity is conditioned by economic growth of Spain in the last years
that allowed the incorporation of youngsters to labour market in the building sector and in the hotel
and tourism sector. This situation has favoured that some youngsters drop out school without having
completed their compulsory education. Nonetheless, economic crisis has maintained activity rates with
the level of 2006, what makes us infer that some youngsters are coming back to their studies.
In the same way activity rates have gender gaps in the whole population (69% men, 52% women in
2009), that have a replica between youngsters, although with a different nuance: despite male
youngsters have an activity rate (70%) higher than female youngsters (62%), the lowering in the gap is
due to a higher educational level of female youngsters.

LLP‐Leonardo da Vinci Program, Moving Project, Study “Understanding NEETs”
81
We find the lowest activity rates between youngsters 16-19. In turn, the group 25-29 presents the
highest rates, overcoming in 36 percentage points the national average in 2009. The low activity rates
in the youngest group confirms that these are still studying, while as they are growing, they complete
their studies or they drop out and they come into the labour market.
2.3.4. CAUSES
Objective causes by which youngsters become NEETS are very difficult to assess, because of the
impossibility of obtaining reliable data. In any case, it seems clear that there exist a series of ‘generic’
factors that may cause youngsters being unemployed or educationally inactive. These factors are:
• truancy and early school drop-out
• precarious social and economic family situation
• parent’s demotivation and/or lack of qualification
• degradated social and economic environments
• serious health problems/disabilities
2.3.5. Existing policy to reduce the Neet phenomenon
NATIONAL AND REGIONAL POLICIES ANDALUSIAN EMPLOYMENT SERVICE (REGIONAL GOVERNMENT)
MEASURES IN FORCE FOR 2010:
• Elaboration of an action plan to foster juvenile employment, DUO programme, addressed to
youngsters 18-22 with low educational attainments
• Incentives for unemployed youngsters to retake training
• Programmes for making compatible training and professional practices
• Promotion of ‘professional certificates’
• Budget 2010: 23.000.000 €
LEARNING AND TRAINING INITIATIVES
REGIONAL MINISTRY FOR EDUCATION
JES · YOUTH ENTREPRENEUR SOLIDARITY
It is a programme to promote entrepreneurship and solidarity among students of Primary, Secondary
and Tertiary School and Vocational Training, also fostering their motivation and interests.
ESFUERZA PROJECT
This is a project launched in 2010 by the regional government of Andalusia to improve the quality of
education in our region.
Half of the measures included in ‘Esfuerza’ project aim to universalise school success, increasing the
rate of graduated pupils and reducing school failure and drop-out. Up to 40 initiatives are focused to

LLP‐Leonardo da Vinci Program, Moving Project, Study “Understanding NEETs”
82
these objectives, including more places in first cycle of Primary Education, monitoring Primary students
with difficulties in literacy and numeracy, school reinforcement afternoon classes, extending Initial
Qualifying Vocational Programmes.
Andalusian Government will reinforce programmes addressed to attendance after compulsory education
with the objective of increasing the number of youngsters with university degrees. Programmes like
‘Beca 6000’ or free school transport will continue. Training courses for access to Vocational Training
Cycles and independent tests to get Secondary, Vocational Training or Baccalaureate Degree.
MORE YOUNGSTERS IN EDUCATIVE SYSTEM AFTER COMPULSORY EDUCATION.
• Reinforcing academic and vocational counselling to encourage students’ stay in educative
system.
• Promoting training courses for access to medium and high degrees in Vocational Training
• Focusing vocational training cycles towards professional activity, with less emphasis in
academic knowledge.
• New call for proposals of ‘Beca 6000’, for graduates in secondary education with economic
difficulties to continue studying.
• Free school transport in post-compulsory education.
• Fostering mobility of students from university to no-university degrees, and mutual recognition
of training.
EXTENDING EXTRACURRICULAR SERVICES AND ECONOMIC SUPPORT TO FAMILIES.
• Maintenance of current economic support lines to families with grants programmes, free
textbooks, free transport, free laptops and bonuses for complementary services.
• Fostering social and educational services for reconciliating family and professional life and
counselling for using extra-curricular time for the improvement of school performance
FAMILY, KEY ASPECT FOR SCHOOL SUCCESS.
• Supporting parent’s training in their educational role, especially in those families with more
difficulties.
• Fostering schools for parents to develop activities to fight against early drop-outs.
MORE GRADUATES, MORE EMPLOYMENT.

LLP‐Leonardo da Vinci Program, Moving Project, Study “Understanding NEETs”
83
• Increasing the number of people receiving lifelong education, facilitating the (re)incorporation
of unemployed youngsters and of those who need improve their qualification.
• Making easier the obtaining the basic qualification through the network of public centres, as a
means of having new opportunities, particularly for people at risk of social exclusion or failure
and drop out youngsters.
• Increasing the offer of vocational training courses addressed to young workers or unemployed
with little qualifications.
• Launching annual call for proposals to obtain basic qualification for those who have dropped out
in the two previous years with subjects waiting for a ‘pass’ mark.
• Extending initial professional qualification programmes to facilitate a professional qualification
for labour insertion.
• Fostering blended courses and distance learning through virtual educational platforms.
• Developing tests to obtain different qualifications of educative system
WITH A NEW IMPULSE TO PROFESSIONAL TRAINING.
• Approving the II Andalusian Plan of Professional Training that will include more collaboration
from companies, the development of integrated centres, the development of evaluation
procedures and crediting of new professional competences, a bet for training cycles related to
new economy and the progressive incorporation of secondary schools to the network of
collaborators for training for employment.
• Fostering the functioning of Andalusian Council for Professional Training and the Andalusian
Institute for Professional Qualifications.
• Establishing coordination mechanisms between Andalusian Employment Service and the
Regional Ministry of Education to facilitate professional orientation and counselling the
population.
• Providing access to vocational training courses for those people that are out of the system and
wish to improve their qualification, through agreements with companies, giving counselling and
support for the acquisition of basic competences, and adapting the offer of professional training
to the rhythms of job demands.
• Developing training programmes in companies in Andalusia and in the EU for students of
professional training.
LLP‐Leonardo da Vinci Program, Moving Project, Study “Understanding NEETs”
84
AWAKENING SCIENTIFIC VOCATIONS.
• Counselling at academic and professional level the students of compulsory secondary education
to awake scientific vocations.
TEACHING ENTREPRENEURSHIP.
• Encouraging entrepreneur abilities of students at every level of educative system, training
citizens able to generate new projects and initiatives.
• Developing working tools addressed to baccalaureate and professional training levels to
simulate working environments to materialise business ideas.
• Call for prizes to contribute to materialisation of business ideas in the last years of professional
training.
• Developing cooperation programmes with the business world, to make students know more
about companies.
• Organising raising awareness campaigns, addressed to the society, about the value of education
and training.
LLP‐Leonardo da Vinci Program, Moving Project, Study “Understanding NEETs”
85
3. Conclusions and recommendations
The NEETS phenomenon is surely a priority of the European policies, both on a learning and educational
prospective and juvenile employment. Data, in particular in UK, portray a dangerous situation, tending
to get worse with the present economic crisis.
The phenomenon affects all the EU Countries, even unconsciously because the term NEET is not yet in
the vocabulary of many Countries. England and few other Countries have only perfectly identified the
dimensions, the causes and the consequences of the issue.
The diverse existing studies do not lead to a real transnational comparison because it is difficult to
collect data and especially comparable data. England has inserted the study of the phenomenon in its
national statistics and data are really many. It is however the only Country in Europe.
We cope with extremely different methodologies to collect regional and national statistics that are
incomparable as a consequence. Absence of harmonization in Europe of analysis of the phenomenon;
lack of reliable data. It is necessary for the Boards in Europe and therefore their chance to agree on a
definition and on the age of NEETs in the Countries, on the methodology of data collection.
It is a complex problem with diverse sides. In times of economic crisis, it is necessary to support
solutions to include young unemployed on a local stage, particularly through innovation and creativity.
Partners share Mr. Flores’ conclusions from his study in Andalusia, which are an important aspect of our
project to bear in mind and to transmit to the European Boards to fill in current gaps.
The Difficulty to obtain reliable data; the disparity in the definitions of the NEET Group in the
different Countries and in the different regions; complexity of the problem and multiple situations
faced by youngsters; very bleak picture offered by the global economic situation; necessity of creative
and innovative solutions; multidisciplinary approach needed.
Across the UK the number of young people classified as NEET (not in education, employment or
training) remains stubbornly high. In the first quarter of 2010 17.6% of 18-24 year olds were NEET, with
the number of unemployed 16-24 year olds nearing a million. The former UK government set a Public
Service Agreement to cut the number of NEETs to 7.6% for the whole of 2010. Although, final figures
will not be published until June 2011, current statistics suggest this target is likely to missed.
In June 2009, Jon Coles of the Department for Education cited a study in the North East of England,
which found that 15% of long-term NEET's die within 10 years. The social cost of NEETs is far reaching,
with research undertaken by the London School of Economics showing that each NEET costs the
taxpayer £97,000 over the course of their lifetime, with a total annual cost of £3.65billion.

LLP‐Leonardo da Vinci Program, Moving Project, Study “Understanding NEETs”
86
While the number of young people in the Liverpool City Region entering education and achieving good
exam grades is moving in the right direction, there is still a worrying number not in education,
employment or training (NEET). In 2007 the share of 16 to 18-yearolds in Liverpool City Region in the
NEET category stood at 10.1%, a slight drop from 10.9% the previous year. This is higher than the
national average and in comparative urban areas. In hard numbers, there are 5,550 young people not
engaged with the world of work or being trained or in education.
The former UK government initiated several strategies to combat the NEET problem. The September
Guarantee introduced in 2007, later extended to January, guaranteed a suitable place in education or
training for all 16-17 year olds. Further strategies included the creation of 35,000 additional
apprenticeships and the investment of £650 million in financial support to 16-18 year olds. The question
is how should Governments seek to tackle the NEET problem?
In May 2010, the UK government announced plans to introduce a National Citizen Service, the project
aims to provide all 16 year olds an opportunity to develop skills and give them experience of the work
place. The government also announced plans to scrap other training initiatives reinvesting some savings
into alternative schemes thus demonstrating in a time of extreme financial austerity the priority that
the UK gives to eliminating, or at the very least drastically reducing, the NEETs group.
The tough economic climate and public service spending cuts pose many challenges in the effort to
reengage young people into education, employment and training. On-going investment is vital in both
preventative and interventionist strategies to ensure young people do not become permanently
disengaged.
NEET young people are not a homogenous group and the group can be divided into several categories
with different issues. Different geographical areas can also have localised problems.
In the UK programmes and incentives have been put in place to try to re-engage young people who have
become NEET and tackle their specific problems (but this is not the case in most other EU Member
States), and many examples of successful practice haveemerged. However, despite the efforts of those
working with NEET young people, the current economic situation is increasing the level of disadvantage
these young people face and is making their transition back to education employment and training more
difficult.
The UK is to be applauded for the extensive research that it has conducted into the NEETs group and
the programmes that it has put in place to combat the problem. It has identified that the larger the
NEETs group is the greater the cost to the economy further down the line in additional crime, policing,
incarceration facilities, social services, health care and benefits payments. As stated above 15% of long
term NEETs actually die within ten years which is a staggering statistic. Other Member States have not

LLP‐Leonardo da Vinci Program, Moving Project, Study “Understanding NEETs”
87
identified these problems associated with NEETS. This does not mean that they are not experiencing
similar problems and that this is largely a UK problem. It is far more likely that the problem is merely
hidden due to an absence of research and available statistical data and as a result no measures have
been put in place to combat it.
So what will be the result if the EU and its Member States take no action to combat the NEETs problem?
The evidence emerging from the UK indicates that the NEETS problem arose, or was at least identified,
between 1999 and the present day ie in a time of unparalleled economic prosperity. How much worse is
it likely to get during the next few years during a time of economic recession and public sector
cutbacks? The UK has put in place measures to reduce the NEETS group and demonstrated that these
programmes actually save money in the long run as the money spent on them is far exceeded by the
savings that are made in crime reduction, benefits payments, health care, policing and social services
further down the line. The situation in other EU Member States is unlikely to be very different. In fact it
is likely to be worse since, unlike the UK, most Member States have not had measures in place to
combat the NEETs phenomenon for over a decade.
So the question posed by the project is not “can the EU and its Member States afford in a time of
economic austerity implement innovative programmes aimed at reducing the NEETs group” but “can
they afford not to given the social costs that the UK has identified result from inaction?”

LLP‐Leonardo da Vinci Program, Moving Project, Study “Understanding NEETs”
88
Bibliography
Andrew Anderson, Bee Brooke, Alex Doyle, Dan Finn and Sean Moley, Understanding Young People in
Jobs without Training, Centre for Economic and Social Inclusion 2006
Bynner, John and Samantha Parsons. 2002. “Social Exclusion and the Transition from School to Work:
The Case of Young People Not in Education, Employment, or Training (NEET).” Journal of Vocational
Behavior
COMMUNICATION FROM THE COMMISSION TO THE COUNCIL, THE EUROPEAN PARLIAMENT, THE
EUROPEAN ECONOMIC AND SOCIAL COMMITTEE AND THE COMMITTEE OF THE REGIONS, An EU Strategy
for Youth – Investing and Empowering, A renewed open method of coordination to address youth
challenges and opportunities, 27 April 2009
Communication from the Commission to the European Parliament, the Council, the European Economic
and Social Committee and the Committee of the Regions, Key competences for a changing world, Draft
2010 joint progress report of the Council and the Commission on the implementation of the “Education
& Training 2010 work programme, Novembre 2009
Council of the European Union, Council conclusions of 12 May 2009 on a strategic framework for
European cooperation in education and training (‘ET 2020’)
Darshan Sachdev, Bethan Harries, Thomas Roberts, Regional and sub-regional variation in NEETs –
reasons, remedies and impact, March 2006
Dr. Karen Robson, Becoming NEET in Europe: A Comparison of Predictors and Later-Life Outcomes, 2008
Department for Children, Schools and Families (2007) – Participation in education, training and
employment by 16-18 year olds in England Statistical First Release.
Department for Children, Schools and Families, Reducing the number of young people not in education,
employment or training(NEET): the Strategy, 2008
Department for Children, Schools and Families, Investing in Potential, Our Strategy to increase the
proportion of 16–24 year olds in education, employment or training, 2009

LLP‐Leonardo da Vinci Program, Moving Project, Study “Understanding NEETs”
89
European Commission, EUROBAROMETER SURVEY ON POVERTY AND SOCIAL EXCLUSION | 2009
European Commission, A European strategy for smart, sustainable and inclusive growth, 3.3.2010
Eurostat, Youth in Europe, A statistical portrait of the lifestyle of young people, 2009
Joint conclusions of the Spanish Presidency EU Youth Conference “youth employment and social
inclusion”, Jerez, Spain 13-15 April 2010
Maguire S. Thompson J. (2007) – Young People not in education, employment or training (NEET) – Where
is Government policy taking us now? Youth and Policy Journal Summer 2007
New Skills for New Jobs: Action Now, report by the Expert Group on New Skills for New Jobs prepared
for the European Commission, Brussels, 2010
Payne J. (2003) – Vocational Pathways at age 16-19 – An Analysis of the England and Wales Youth Cohort
Study Research Brief
Popham, I. 2003. Tacking NEETs: Research on Action and Other Factors that Can Contribute to a
Reduction in the Numbers of Young People Not in Education, Employment or Training (NEET), DfES
Publications
Princes Trust, 2007. The Cost of Exclusion. Counting the Cost of Youth Disadvantage in
the UK.
Princes Trust, 2009 - The Prince’s Trust YouGov Youth Index, 2009