neep residential lighting strategy 2012
DESCRIPTION
ÂTRANSCRIPT

Northeast resideNtial lightiNg strategy
PreseNted by Northeast eNergy efficieNcy PartNershiPs
March 2012

Northeast resideNtial lightiNg strategyPresented by Northeast Energy Efficiency Partnerships - March 2012
PriMary author:
With critical aNalysis & suPPort froM:
about NeePNEEP transforms the way we use and think about energy. We are a non-profit organization that builds partnerships among the efficiency industry, communities, businesses and policymakers in the Northeast and Mid-Atlantic states. Through advocacy, collaboration and education, we accelerate energy efficiency and make visible its impacts on the region, the economy, the planet, and future generations.

ackNoWledgeMeNts
This Northeast Residential Lighting Strategy was published to address the role of high efficiency lighting products in capturing all cost-effective energy efficiency in the region while also providing broad energy, economic and environmental benefits. This report highlights efficient lighting’s major role in residential energy efficiency programs across the region. Detailed within are key strategies and recommendations necessary to achieve the goal of full market transformation by 2020.
This report reflects the invaluable contributions of multiple individuals. Linda Malik, NEEP’s Residential Program Manager, served as the report’s project manager. Glenn Reed from Energy Futures Group is the report’s primary author of its contents, guided by critical analysis and support from the project team:
Glenn Reed Energy Futures Group
Linda Malik NEEP
Gabe Arnold & Alek Antczak Optimal Energy
Stephen Bickel & Toby Swope D&R International
Chris Calwell & Laura Moorefield Ecova
NEEP would like to recognize and thank the Advisory Panel for its participation in the development of the Residential Lighting Strategy. The industry experts listed below provided important input into creation of this document.
Jennifer Amann Buildings Program Director, ACEEE
Jennifer Burns Utility Marketing Manager, Philips Lighting Company
Katya Carman Utility Relations Manager – Northeast, GE Lighting
Scott Dimetrosky Vice President, Opinion Dynamics Corporation
Pete Feroli Vice President, Applied Proactive Technologies, Inc
Tina Halfpenny Director of Energy Efficiency, Massachusetts DOER
Kerry Hogan Assistant Project Manager, NYSERDA
Lynn Hoefgen President, NMR Group, Inc.
Jamie Howland Policy Analyst, Environment Northeast
Nikola Janjić TRM & Evaluation Coordinator, Efficiency Vermont
Taylor Jantz-Sell Lighting Marketing Manager; US EPA
Brian Kearney Manager of Residential Energy Efficiency, National Grid
Steven F. Keller Chief - Analysis, Modeling & Evaluation, New York State DPS
Christopher G. Lubeck Head – Commercial Engineering, Osram SYLVANIA Inc
Barry Murphy Technical Manager for Energy Efficiency, Vermont DPS
Charles A. Olsson Manager, Residential Energy Efficiency, NSTAR Electric & Gas
Kate Ringe-Welch Program Manager, National Grid
Michael Russom Efficient Products Market Manager, Efficiency Vermont
Joseph Swift Operations Supervisor - Conservation and Load Management Department, Northeast Utilities
The following NEEP staff served as reviewers and provided feedback, inputs, and edits as warranted: Sue Coakley,
Executive Director; Natalie Hildt, Public Policy Outreach Manager; Dave Lis, Appliance Standards Project Manager;
Julie Michals, Director - Evaluation, Measurement & Verification Forum; Jim O’Reilly, Director of Public Policy
and Elizabeth Titus, Research & Evaluation Manager. Layout and formatting provided by Alicia Dunn, Marketing
Communications Manager.

table of CoNteNts
Executive Summary i
Overview & Analysis 1
Situation Analysis 5
Remaining Savings Potential 6
Key Strategies 8
Section 1: Situation Analysis 13
Current Program Administrator Activities 13
Federal Lamp Standards and Building Codes 23
ENERGY STAR Qualification and Quality Assurance Testing 29
FTC Lamp Labeling 30
Consumer Education 32
Regulatory and EM&V Treatment of Program Administrator Residential Lighting Efforts 34
Technology Status: Price, Efficacy, Functionality and Availability 40
Section 2: 2012 - 2020 Regional Lighting Savings Potential 44
Regional and State Level Savings Estimates 44
Number of In-Program Products Promoted by PA Programs 45
Estimated Annual Program Incentive Costs 46
Costs per Annual and Lifetime kWh Saved 47
General Model Description 48
Possible Differences with PA Screening Approaches 50
Other Model Caveats 50
Limitations of Model and Outputs 50
Key RLS Savings and Cost Assumptions 51
Regional Savings Estimates from Attaining a 90 Percent Efficient Lighting Socket Saturation 55
Recommendations: Key Strategies and Criteria for Success of the RLS 57
Appendix A: CFL Technology Synopsis a-1
Appendix B: LED Technology Synopsis b-1
table of figures
Figure ES-1: Annual Socket Saturation Percentage ii
Figure 1: 1st Net Year Savings 7
Figure 2: Incentive Costs 8
Figure 1-1: Plot of Lamp Efficacies and Lumens 27
Figure 1-2: FTC Lamp Label 31
Figure 1-3: DOE Lighting Facts Label for SSL Lamps 31
Figure 1-4: LED A-Lamp Performance Trends 41
Figure 2-1: Regional Savings Estimates from Implementation of Recommended RLS Strategies 44
Figure 2-2: Incentive Costs 46
Figure 2-3: Incentive $/1st Year kWh 48
Figure 2-4: Incentive $/Lifetime kWh 48
Figure 2-5: Regional Savings - by state - from Implementation of Recommended RLS Strategies 49
Figure 2-6: Annual Socket Saturation Percentage 55
Table 1: Expected Outcomes from Implementation of a Regional Residential Lighting Strategy 3
Table 2: Assumed Number of Program-Supported Efficient Lamps per Household 7
Table 3: RLS Strategies and Actions 10-12
Table 1-1: CFL Socket Saturation and 2011 Planned Program Administrator CFL Levels of Support 18
Table 1-2: Breakout of 2011 PA Incentive Efforts by CFL Product Category 19
Table 1-3: 2011 Planning CFL Net to Gross Ratios for Select Northeast States/Regions 22
Table 1-4: Percentage of MA Non-Retail Lighting Program Savings Coming from CFLs and Compact Flourescent Fixtures
23
Table 1-5: EISA Requirements for Standard Spectrum General Service Bulbs 24
Table 1-6: EISA Impacts on Assumed Baseline Wattages for Incandescent A-Lamp Replacement 26
Table 1-7: Comparison of Lighting Technologies 42-43
Table 2-1: First Year Savings from PA Program Activity 45
Table 2-2: Assumed Number of Program-Supported Efficient Lamps per Household 46
Table 2-3: Estimated per Lamp PA Incentives 47
Table 2-4: Standard CFL Modeling Inputs 52
Table 2-5: Specialty CFL Modeling Inputs 53
Table 2-6: LED Modeling Inputs 54
Table 3-1: Expected Outcomes from Implementation of a Regional Residential Lighting Strategy 71

NORTHEAST RESIDENTIAL LIGHTING STRATEGYI
executive suMMaryKey fiNdiNg
Even with new minimum federal lighting efficiency standards, energy efficient lighting prod-ucts continue to offer a major opportunity to cost-effectively reduce household energy use over the next 8-9 years. As a result, high efficiency products offer an important role to as-sist New England and New York to realize the capture of all cost-effective energy efficiency as articulated in their policy goals and provide broad energy, economic and environmental benefits. To realize the full measure of cost-effective savings, efficient lighting products should continue to play a major role in residential energy efficiency programs across the region with the goal of full market transformation.
regioNal goal
Maximize cost effective energy savings by the end of the decade by filling at least 90 percent of lighting sockets with an ef-ficient light source (45 lumens/watt or greater). Doing so in New England and New York would reduce household lighting con-sumption by 47 percent and save on average 636 kWh per year or $111 per household1. At the regional level, the cumulative annual savings by 2020 will amount to 43,800 GWH hours and cumulative first year demand sav-ings of 837 MW, and reduce projected car-
bon emissions by over 25 million metric tons. The annual energy savings in 2019 would be equivalent to the energy usage of nearly 1.2 million households (Nine percent of the house-holds in the Northeast). The demand savings is comparable to displacing more than two 500 MW combined cycle power plants at an assumed 75 percent capacity factor. Finally, the projected carbon emissions would equate to removing almost five million cars from the road for a year2.
While efficiency Program Administrator (PA) costs to promote a broader range of new efficient lighting products will be higher than current programs costs, increased market adoption of a broader array of efficient products will provide significant costs savings compared to reliance on products that minimally meet new federal lighting standards – providing cumulative cost savings net of efficiency program incentive costs of over $6.8 billion through the end of 2019.
1 Based on a $0.175/kWh regional average residential rate. Average Price by State by Provider, 1990-2010. Energy Infor-mation Agency
2 http://www.epa.gov/cleanenergy/energy-resources/refs.html#vehicles
Maximize cost effective
energy savings by the end
of the decade by filling at
least 90 percent of lighting
sockets with an efficient
light source

NORTHEAST RESIDENTIAL LIGHTING STRATEGYII
To achieve this transformation of the residential lighting market continued promotion of compact fluorescent lamps (CFLs) and growing support of light-emitting diode (LED) lighting technology by the region’s efficiency program administrators, retailers and manufacturers is necessary. By the end of the decade the typical household will have a mix of CFLs, LEDs and linear fluorescent lamps. Figure ES-1 provides a projection of what the residential socket saturation of lighting technologies might look like.
figure es-1
regioNal strategy
To achieve this, NEEP’s recommended regional strategy for New England and New York calls for:
1. A continued strong role for ratepayer funded energy efficiency programs to support consumer adoption of energy efficient lighting products with a near-term focus on ENERGY STAR® CFLs, 2x halogens3 and other specialty lighting solutions with a growing focus on white-light LEDs as products improve and prices become more competitive.
2. A strong commitment to build consumer knowledge of and satisfaction with high efficiency lighting products including implementation of clear and consistent consumer messages from programs and industry.
3. Continued vigilance to maintain a high level of lighting product quality and perfor-mance to meet or exceed consumer expectations.
4. Regional collection of key market data to inform ongoing program planning, imple-mentation and assessment of impacts and progress towards outcomes
3 Halogen lamps that are twice the efficiency of standard (pre-EISA) incandescents and twice the lifetime, e.g., 100W→ 50W; 1000 hours→2000 hours

NORTHEAST RESIDENTIAL LIGHTING STRATEGYIII
5. Continued input to federal processes to set future lighting standards that reflect the market adoption of lighting products in the Northeast as well as integration of light-ing efficiency into national model building energy codes, and, eventually, state building energy codes.
6. Regulatory support for a multi-year strategy to transform the residential lighting market with flexible programs responsive to market developments and new approaches to program evaluation, particularly with regard to cost-effectiveness.
MARKET LIFT
“Market lift” is an upstream market transformation strategy, whereby an energy efficiency program administrator pays incentives to participating retailers during a pre-determined program delivery period (“lift duration”). The incentives are based on pre-arranged terms that allow participating retailers to receive payment for sales of certain efficient lighting products over and above pre-determined baseline conditions.

NORTHEAST RESIDENTIAL LIGHTING STRATEGY1
overvieW aNd aNalysisThis market transformation goal and strate-gy depends on continued collaboration be-tween government agencies, energy effi-ciency programs, and lighting product manufacturers and retailers with an in-creased emphasis on achieving a high level of consumer understanding and satisfac-tion with energy efficient lighting solutions. Engaging broad consumer interest requires development of a nationally used and refer-enced message platform that will ease con-sumer selection of lighting products for spe-cific applications. Our recommended strategy also requires a long-term commit-ment to the final result with flexibility to respond to market developments and re-sponses. The ability to respond more nimbly to changing market conditions will require better and increased provision of market
data from manufacturers and retailers, coupled with ongoing assessments of socket saturation rates as well as consumer knowledge of and satisfaction with high efficiency lighting products.
The strategy calls for continued use of multiple program strategies including co-promotions with retailers and delivery through retrofit programs. It also calls for some departures from business as usual. For example, new program models are needed to better assess the im-pact of program promotions on retail sales (e.g., the market lift model).
The strategy projects that the cost to achieve savings will be significantly higher than past programs given CFL cost increases and—for the near term—the higher cost of LED prod-ucts—peaking at a projected regional program incentive expenditure of $136 million in 2015. With this, PAs need program flexibility and support from regulators to quickly and flexibly respond to changing market conditions to achieve long-term goals. This includes a performance approach focused on socket saturation as well as savings with increased cer-tainty about how savings are calculated along. It also calls for potential modifications to cost-effectiveness methods (e.g., to apply analyses at the program or, ideally, the residen-tial sector portfolio level) to support the broad range of high-efficiency lighting solutions needed to fill 90% of residential lighting sockets in the context of a rapidly growing list of new, innovative product options.
NORTHEAST RESIDENTIAL LIGHTING STRATEGY2
Success will also require collaboration with national and federal efforts such as the ENERGY STAR Program to maintain strong standards for product quality supported by performance testing. Given the overlapping markets as well as common efficiency program interests in the Northeast, continued regional collaboration is needed to effectively interface with re-tailers, manufacturers and national efforts as well as to monitor, evaluate and learn from various efforts to build market momentum to achieve the goal of 90 percent socket satura-tion of high efficiency lighting products by 2020.
The market for residential lighting is quickly evolving in the region and nationally. Efficien-cy program administrators (PAs) have actively supported compact fluorescent lamps (CFLs) for nearly two decades in some states in the Northeast region and currently all of the states in the region have active residential lighting programs. These PA efforts have generated large electricity savings such that lighting programs represent the largest source of annual residential savings for nearly all PAs in the region.
While the residential lighting landscape will change significantly over the next few years, significant cost-effective savings from residential lighting can and should continue to con-stitute a large proportion of residential sector portfolios for much of the rest of the decade. PAs will be able to procure these savings, working cooperatively with manufacturers, re-tailers, and other stakeholders, through aggressive promotion of multiple efficient lighting technologies. By the end of the decade these efforts should result in nearly every residen-tial lighting socket filled by an efficient light source.
The strategies and recommendation provided in this regional Residential Lighting Strategy (RLS) provide PAs, industry and others a path to a future in which efficient lighting is the norm in the Northeast. The following strategies are based on a number of assumptions re-garding the future cost, availability, and consumer acceptance of various lighting products. In addition, successful PA implementation of these strategies is contingent upon adequate program funding. To keep this regional strategy relevant, NEEP intends to provide an an-nual strategy update to respond to changing circumstances as well as highlight regional best practices to accelerate market adoption of high efficiency residential lighting products.
Table 1 summarizes projected outcomes of continued efficiency program intervention in the residential lighting market with suggested milestones to track progress in achieving these projected outcomes.

NORTHEAST RESIDENTIAL LIGHTING STRATEGY3
table 1exPected outcoMes froM iMPleMeNtatioN of a regioNal resideNtial lightiNg strategy
Outcomes Milestones/Indicators of Success
By 2020, achieve a 90 percent socket saturation of high efficiency lighting (45 lumens/watt or better) – CFLs, LEDs and high efficiency halogens - in homes
• By 2014, the large majority (70% or more) of eligible LED products on retailer shelves in the region are ENERGY STAR qualified
• By 2015, 90 percent of residential screw-based sockets can be filled with ENERGY STAR LEDs
• By 2016, the majority of lighting products purchased by consumers are high efficiency
• By 2018, all ENERGY STAR eligible LED products on par-ticipating retailer shelves are ENERGY STAR qualified
By 2015 the large majority of consumers are highly satisfied with high efficiency lighting (45 lumens/watt or better) lighting products.
• By 2014, the large majority (70% or more) of ENERGY STAR eligible LED products on retailer shelves are EN-ERGY STAR qualified
• By 2014, the large majority (80% or more) of consumers select lighting products based on lumen rating rather than wattage
• By 2015, the majority of industry lighting marketing ef-forts targeting consumers promote the benefits of LEDs
• By 2015, 90 percent of residential screw-based sock-ets controlled by dimmers can be filled with dimmable ENERGY STAR LEDs
Energy efficiency programs in the Northeast maintain a high level of net savings from residential lighting through 2015 or longer.
• Net residential lighting program savings are maintained at or near 2011 savings levels through 2015 or longer
• PAs, with industry support, implement alternative program strategies such as market lift to complement current upstream activities to help address gross vs. net savings concerns
• By 2016, in the majority of states in the region PAs and regulators reach agreement on key program planning as-sumptions prior to submission of PA plans
The unsubsidized purchase cost of ENERGY STAR light-ing products, in particular LEDs, is significantly less by 2015 compared to 2011.
• The percentage reduction in the cost of ENERGY STAR LEDs is equal to or greater than that for all LED products as projected in DOE’s SSL Multi-year Plan
By 2015, the range of ENERGY STAR LED product options expands to address at least 90 percent of all screw-based residential lighting applications. (i.e., a bulb for every socket).
• Dimmable directional and non-directional ENERGY STAR LEDs in both medium and candelabra bases are available in a full range of lumen outputs and color temperatures

NORTHEAST RESIDENTIAL LIGHTING STRATEGY4
The opportunity for continued significant residential lighting program savings is potentially complicated—and compromised—by the convergence of a number of events that are all oc-curring within a fairly compressed timeframe. These include:
• EISA lamp standards - Federal residential lighting standards as specified in the En-ergy Independence and Security Act (EISA) phase in from 2012 through 2014, eliminating current inefficient―and inexpensive―incandescent lamps in most general service applica-tions. Manufacturers have responded to EISA by developing a comprehensive offering of halogen lamps to replace nearly all applications covered by EISA. These halogen lamps, not CFLs, will define the baseline by which PA program savings should be determined.
• Emergence of more efficient lighting technologies – Light emitting diode (LED) lamps are becoming increasingly available at retail. While these products have attributes that make them preferable to CFLs in many applications, they are expensive and most products at retail are not currently ENERGY STAR qualified, raising questions of product quality and performance. Additionally, more efficient halogen lamps may become available in early 2012, representing additional, though short-term, efficiency opportunity for PAs.
• Lighting labels – Starting in 2012, most residential lamps will be required by the Fed-eral Trade Commission (FTC) to be labeled. These labels will focus on lumens rather than the lamp wattage. This will require consumers to be able to make informed lamp choices based on a largely unfamiliar metric of performance.
• Customer confusion arising from the above – Customers will be faced with an increasing number of lighting technology choices at a wide variety of price points, new federal standards, and new lamp labels all at the same time. They will need assistance and clear and consistent direction to continue to make the right efficient lighting choices.
While the above represent challenges to PAs and other interested stakeholders to continue to procure significant residential lighting savings, they also represent opportunities to tran-sition from CFL- to LED-based lighting programs. As is often the case with new technologies, accelerating the market adoption of more costly LED products will increase lighting program costs compared to the promotion of CFLs (which now cost much less today than they did 10-20 years ago). This raises possible regulatory concerns about cost-effectiveness in the very near-term versus the large long-term savings that will come from eventual market transfor-mation for residential LED products. The RLS addresses this issue as well as the inherent uncertainty in the rapidly evolving residential lighting market and recommends approaches that, while meeting regulatory oversight needs, afford PAs the necessary program flexibility to move forward with lighting efficiency efforts to achieve near-term as well as long-term goals. Program savings levels at or near current levels will require continued aggressive pro-motion of CFLs in the near term until LEDs become more available at lower costs.

NORTHEAST RESIDENTIAL LIGHTING STRATEGY5
This regional Residential Lighting Strategy details proposed strategies and actions for PAs, manufacturers, retailers, regulators and other stakeholders to continue to maintain lighting savings at or near current program levels for most of the remainder of the decade, and ulti-mately to transform the market such that by 2020, 90 percent or more of sockets in homes in New England and New York use an efficient light source.
situatioN aNalysis
Most Residential Sockets in the Region are Still Filled with Inefficient LightingThrough longstanding program efforts, efficient lighting has made significant inroads in the resi-dential sector. However, the majority of sockets in homes in the region are still filled with inef-ficient incandescent lamps. It is estimated that approximately 36 percent of the sockets in homes in the region were filled with efficient lighting in mid/late-2011. Of this, 27 percent were CFLs, one percent were LEDs, and eight percent were linear fluorescent lamps. As discussed below, those sock-ets not currently employing efficient lighting rep-resent a large remaining opportunity for regional residential lighting savings.
Lighting Represents the Largest Source of Residential Sector Savings for Most PAs in the RegionLighting program savings attained through PA retail-based programs represent approximate-ly 40-50 percent of all planned 2011 residential (including low income) sector savings in the region. However, savings from other residential efficiency programs – including limited income, single family retrofit, multifamily, and new construction – all rely heavily on light-ing, particularly those programs that have an active direct installation component. When the lighting savings from these programs are added to those from retail-based programs, lighting represents an estimated 60-70 percent of all planned 2011 residential sector savings in the region – more than any other measure category or end use.
Lighting Savings are Currently “Cheap” Compared to Other Measures or Programs, but the Cost of these Savings is Expected to IncreaseWhile residential retail-based lighting programs represent a large percentage of total resi-dential sector savings, they comprise a considerably smaller percentage of residential sec-tor budgets, approximately 15-25 percent across the region. Historically, lighting programs have been able to deliver “cheap” efficiency savings, and for many programs the cost of saved energy from lighting programs has fallen over time. Contributing to these reduc-tions are declining incentives, mirroring the large drop in CFL prices over the last decade,

NORTHEAST RESIDENTIAL LIGHTING STRATEGY6
and the use of upstream incentive promotions which are typically more cost efficient than coupon-based programs. As noted below and discussed in more detail in the main body of the report, future residential lighting savings will likely come at a higher cost per annual and per lifetime kWh. These higher costs per saved unit of energy will be driven by several factors, including:
• Significantly higher incentive levels for LEDs given their much higher incremental costs over much of the analysis period.
• Higher near to mid-term costs for CFLs due to price increases in the cost of phos-phors due to dramatic increases in rare earth elements, key constituents of fluorescent lamp phosphors. These price increases may necessitate increases in PA incentive levels.
• Smaller gross savings due to the minimum lighting efficiency standards set by EISA
• Increased free-ridership for CFL savings and, later in the decade, for LED savings as both technologies become increasingly common. Free-ridership presumes that the pur-chase of efficient lighting technologies cannot be attributed solely to PA incentives and marketing efforts as some consumers may choose these efficient products absent PA inter-vention. Alternate program approaches such as market lift models may be able to reduce free ridership concerns and are among the RLS recommendations.
remaiNiNg saviNgs PoteNtial
There is Significant Remaining Lighting Program Savings Potential in the Region Figure 1 provides an estimate of regional residential lighting savings potential for 2012 through 2020. Savings are expressed on an annualized or first year savings basis. These are net savings with both free-ridership and spillover used to adjust gross savings esti-mates. Regional savings start at approximately 514 GWh in 2012 and decrease over the remainder of the decade. As a point of comparison, 2011 regional lighting savings from retail-based programs is estimated to be approximately 598 GWh. However, the estimates calculated in this RLS use more conservative assumptions for a number of key variables than are used by many PAs in their filed 2011 efficiency plans. As a result the two savings estimates are not directly comparable.
The contribution of LEDs to the total residential savings potential grows over time and re-mains relatively constant from 2015 through 2019 reflecting greater product availability, de-clining incremental costs, and higher net savings relative to comparable CFLs due to lower free-ridership assumptions. CFL savings fall over the analysis period, particularly those for standard CFLs, which incur higher free-ridership adjustments than do either specialty CFLs (such as reflector, dimmable, and three-way CFLs) or LEDs. Program savings drop to zero in 2020 as the second tier of EISA standards become effective in 2020 requiring that nearly all lamps attain efficiencies equivalent to current CFL or LED lamps.

NORTHEAST RESIDENTIAL LIGHTING STRATEGY7
figure 1
The savings in Figure 1 assume aggressive support for CFLs for at least several years, includ-ing the 2012-2014 period covered by the phase-in of the EISA lamp standards. Table ES-2 shows the assumed number of efficient lamps supported by PA retail-based programs over the nine year (2012-2020) analysis period. It is not until 2016 that the number of LEDs pro-moted by PA programs exceeds that of CFLs. The approximate two lamps per household per year assumed for most of the analysis period is higher than the current regional level of PA program support, but less than what both Vermont and Connecticut plan to support in 2011.
table 2assuMed NuMber of PrograM-suPPorted efficieNt laMPs Per household
2012 2013 2014 2015 2016 2017 2018 2019 2020Standard CFL 1.40 1.20 1.00 0.80 0.60 0.40 0.20 0.10 0.00
Specialty CFL 0.50 0.60 0.70 0.60 0.60 0.50 0.40 0.20 0.00
LED 0.05 0.15 0.30 0.60 0.80 1.00 1.20 1.30 0.00
2.0 2.0 2.0 2.0 2.0 1.9 1.8 1.6 0.0
Future Lighting Savings will Come at a Higher CostTo achieve these savings, PA lighting program budgets will need to increase several-fold as shown in Figure 2. Note that Figure 2 provides a projection of program incentive costs; the main component of lighting program budgets. Total program costs are likely to increase somewhat less dramatically. The incentive budgets below are driven primarily by the in-creasing number of LEDs supported by the programs and by the higher incentives that are

NORTHEAST RESIDENTIAL LIGHTING STRATEGY8
assumed necessary to promote LEDs, particularly in the first few years of the analysis pe-riod. The incentive costs below assume that incentive levels are 70 percent of incremental cost. ENERGY STAR LED retail lamp prices are assumed to decline from an average of $30 per lamp in 2012 to $5 in 2020. Nonetheless, as explained in Section 2, residential lighting savings will likely continue to be cost-effective for the next several years.
figure 2
Key strategies
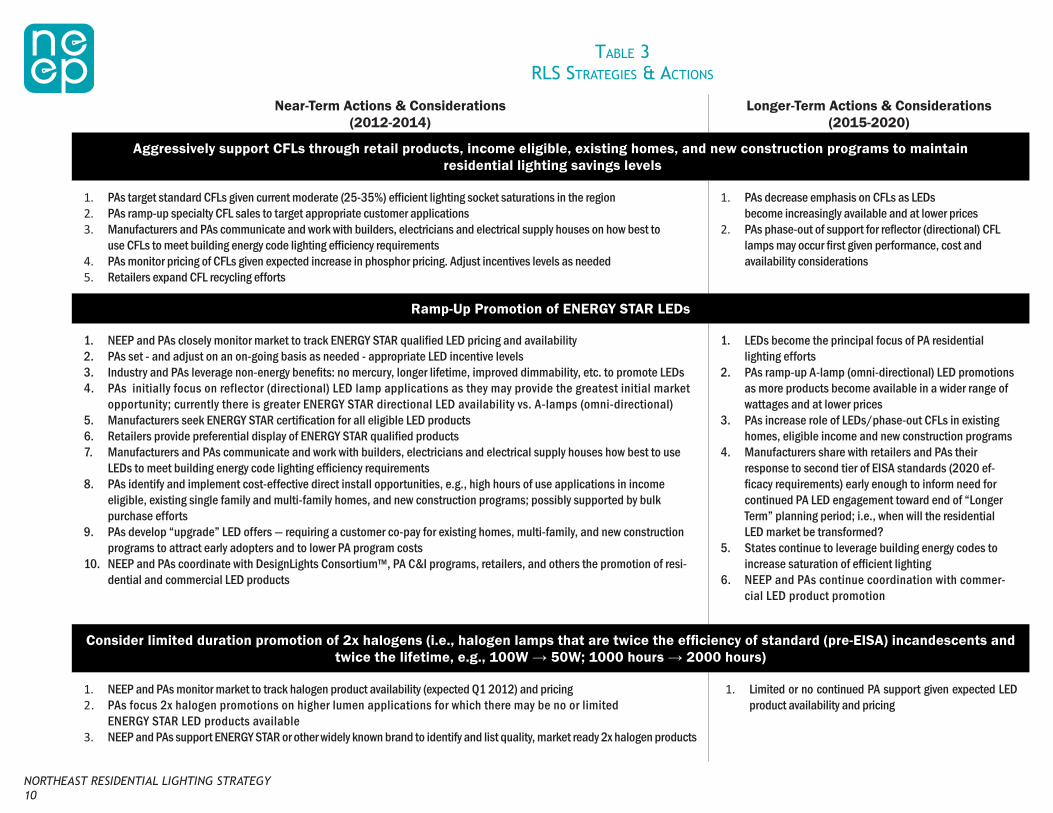
To achieve the above estimated savings NEEP, the RLS Leadership Group, and NEEP’s project consultants developed a set of comprehensive near and longer-term strategies to maintain significant regional residential lighting savings through 2020. Table ES-3 details these rec-ommendations which focus on:
1. Continued strong role for ratepayer funded energy efficiency programs to support consumer adoption of energy efficient lighting products with a near-term focus on ENERGY STAR CFLs, 2x halogens (halogen lamps that are twice the efficiency of standard (pre-EISA) incandescents and twice the lifetime, e.g., 100W → 50W; 1000 hours→ 2000 hours) and other specialty lighting solutions with a growing focus on white-light LEDs as products improve and prices become more competitive.
2. A strong commitment to build consumer knowledge of and satisfaction with high efficiency lighting products including implementation of clear and consistent consumer messages from programs and industry.
3. Continued vigilance to maintain a high level of lighting product quality and perfor-mance to meet or exceed consumer expectations.

NORTHEAST RESIDENTIAL LIGHTING STRATEGY9
4. Regional collection of key market data to inform ongoing program planning, imple-mentation and assessment of impacts and progress towards outcomes (e.g., such as through the Regional EM&V Forum, which includes a 2012 project to collect lighting sales data).
5. Continued input to federal processes to set future lighting standards that reflect the market adoption of lighting products in the Northeast as well as integration of lighting efficiency into state building energy codes.
6. Regulatory support for a multi-year strategy to transform the residential lighting market with flexible programs responsive to market developments and new approaches to evaluation and cost-effectiveness.
This Regional Residential Lighting Strategy lays out in detail the roles and actions required of lighting stakeholders to continue to achieve the significant savings that residential light-ing solutions can continue to provide efficiency programs in the Northeast.
NORTHEAST RESIDENTIAL LIGHTING STRATEGY10
Near-Term Actions & Considerations (2012-2014)
Longer-Term Actions & Considerations (2015-2020)
Aggressively support CFLs through retail products, income eligible, existing homes, and new construction programs to maintain residential lighting savings levels
1. PAs target standard CFLs given current moderate (25-35%) efficient lighting socket saturations in the region2. PAs ramp-up specialty CFL sales to target appropriate customer applications3. Manufacturers and PAs communicate and work with builders, electricians and electrical supply houses on how best to
use CFLs to meet building energy code lighting efficiency requirements4. PAs monitor pricing of CFLs given expected increase in phosphor pricing. Adjust incentives levels as needed5. Retailers expand CFL recycling efforts
1. PAs decrease emphasis on CFLs as LEDs become increasingly available and at lower prices
2. PAs phase-out of support for reflector (directional) CFL lamps may occur first given performance, cost and availability considerations
Ramp-Up Promotion of ENERGY STAR LEDs
1. NEEP and PAs closely monitor market to track ENERGY STAR qualified LED pricing and availability2. PAs set - and adjust on an on-going basis as needed - appropriate LED incentive levels 3. Industry and PAs leverage non-energy benefits: no mercury, longer lifetime, improved dimmability, etc. to promote LEDs4. PAs initially focus on reflector (directional) LED lamp applications as they may provide the greatest initial market
opportunity; currently there is greater ENERGY STAR directional LED availability vs. A-lamps (omni-directional)5. Manufacturers seek ENERGY STAR certification for all eligible LED products6. Retailers provide preferential display of ENERGY STAR qualified products7. Manufacturers and PAs communicate and work with builders, electricians and electrical supply houses how best to use
LEDs to meet building energy code lighting efficiency requirements8. PAs identify and implement cost-effective direct install opportunities, e.g., high hours of use applications in income
eligible, existing single family and multi-family homes, and new construction programs; possibly supported by bulk purchase efforts
9. PAs develop “upgrade” LED offers ― requiring a customer co-pay for existing homes, multi-family, and new construction programs to attract early adopters and to lower PA program costs
10. NEEP and PAs coordinate with DesignLights Consortium™, PA C&I programs, retailers, and others the promotion of resi-dential and commercial LED products
1. LEDs become the principal focus of PA residential lighting efforts
2. PAs ramp-up A-lamp (omni-directional) LED promotions as more products become available in a wider range of wattages and at lower prices
3. PAs increase role of LEDs/phase-out CFLs in existing homes, eligible income and new construction programs
4. Manufacturers share with retailers and PAs their response to second tier of EISA standards (2020 ef-ficacy requirements) early enough to inform need for continued PA LED engagement toward end of “Longer Term” planning period; i.e., when will the residential LED market be transformed?
5. States continue to leverage building energy codes to increase saturation of efficient lighting
6. NEEP and PAs continue coordination with commer-cial LED product promotion
Consider limited duration promotion of 2x halogens (i.e., halogen lamps that are twice the efficiency of standard (pre-EISA) incandescents and twice the lifetime, e.g., 100W → 50W; 1000 hours → 2000 hours)
1. NEEP and PAs monitor market to track halogen product availability (expected Q1 2012) and pricing2. PAs focus 2x halogen promotions on higher lumen applications for which there may be no or limited
ENERGY STAR LED products available 3. NEEP and PAs support ENERGY STAR or other widely known brand to identify and list quality, market ready 2x halogen products
1. Limited or no continued PA support given expected LED product availability and pricing
table 3rls strategies & actioNs

NORTHEAST RESIDENTIAL LIGHTING STRATEGY11
Near-Term Actions & Considerations (2012-2014)
Longer-Term Actions & Considerations (2015-2020)
Pursue alternative program and promotional approaches and/or markets to maximize impacts while minimizing potential free-ridership
1. PAs implement strategies such as market share and/or market lift with industry support, i.e., provision of required sales data
2. PAs to work together and with other interested stakeholders to develop and adopt consistent approaches to evaluate program impacts, such as through Regional EM&V Forum protocol development.
3. PAs seek up-front regulatory engagement/ approval as needed 4. PAs target hard-to reach retailers and customer segments that are otherwise unlikely to adopt efficient
lighting products
1. PAs continue to pursue alternative/ complementary program designs and markets to maintain high net program savings
Deliver a clear and consistent message to consumers on efficient lighting choices
1. All parties work with national (LUMEN) and regional groups (NEEP) to develop consistent consumer messages informed by ongoing market research to understand how to build consumer acceptance of and satisfaction with high efficiency lighting products
2. PA messaging may need to be more targeted on driving consumers to efficient product choices and/or value of ENERGY STAR label
3. All parties leverage EISA standards and new FTC lamp labeling as an opportunity to move consumers to efficient lighting choices
4. Federal entities fund ongoing efforts and assist with enhanced industry partnerships5. PAs structure NCP submissions to include industry marketing/educational component6. PAs leverage on-going, planned and proposed industry market research and PA EM&V efforts to inform
“local content” of this messaging
1. PAs shift focus of marketing and consumer education to LEDs2. NEEP and PAs continue market research and EM&V efforts to
inform messaging
Support adoption and implementation of strong lighting efficiency requirements in building energy codes and 2020 EISA Standards
1. In anticipation of IECC 2012 75% efficient lighting requirement, NEEP and PAs work with builders, lighting designers, code development officials and others to educate them on best lighting choices in RNC
2. In anticipation of EISA 2020 lighting standard setting proceeding to begin in 2014, NEEP with the PAs collect information to inform setting a strong standard in 2020
1. NEEP and PAs provide documentation of RLS success to DOE to inform possibly higher 2020 federal efficacy standard
2. NEEP, the PAs and states participate in US DOE’s 2020 EISA stan-dard setting proceeding to support a strong 2020 standard
3. Builders and their lighting designers collaborate with code enforc-ers to develop a checklist and website as tools to verify compli-ance
Ensure that PA efforts are focused on promoting quality lighting products
1. PAs only support ENERGY STAR qualified LEDs and CFLs with PA incentive and marketing2. DOE CALiPER and ENERGY STAR third-party testing efforts continue with active NEEP and PA participation,
where failed products are delisted3. PAs withdraw funding from delisted products quick
1. Continue and enhance near-term actions
table 3rls strategies & actioNs
NORTHEAST RESIDENTIAL LIGHTING STRATEGY12
Near-Term Actions & Considerations (2012-2014)
Longer-Term Actions & Considerations (2015-2020)
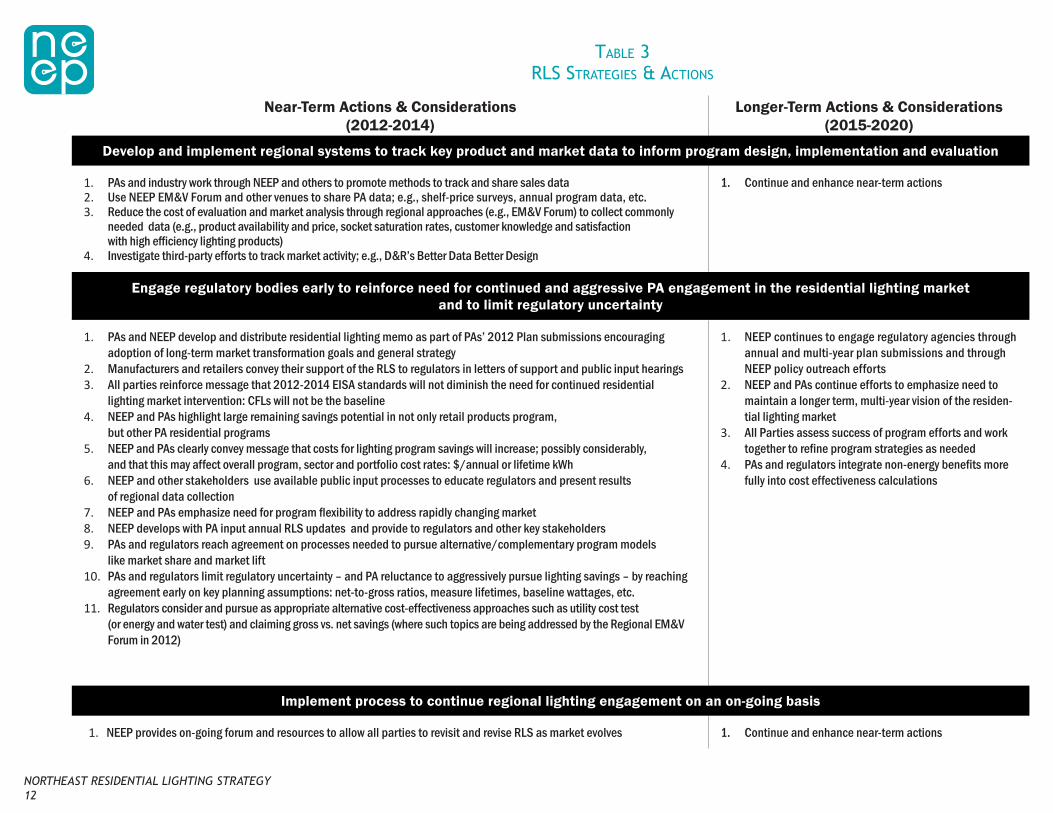
Develop and implement regional systems to track key product and market data to inform program design, implementation and evaluation
1. PAs and industry work through NEEP and others to promote methods to track and share sales data2. Use NEEP EM&V Forum and other venues to share PA data; e.g., shelf-price surveys, annual program data, etc.3. Reduce the cost of evaluation and market analysis through regional approaches (e.g., EM&V Forum) to collect commonly
needed data (e.g., product availability and price, socket saturation rates, customer knowledge and satisfaction with high efficiency lighting products)
4. Investigate third-party efforts to track market activity; e.g., D&R’s Better Data Better Design
1. Continue and enhance near-term actions
Engage regulatory bodies early to reinforce need for continued and aggressive PA engagement in the residential lighting market and to limit regulatory uncertainty
1. PAs and NEEP develop and distribute residential lighting memo as part of PAs’ 2012 Plan submissions encouraging adoption of long-term market transformation goals and general strategy
2. Manufacturers and retailers convey their support of the RLS to regulators in letters of support and public input hearings3. All parties reinforce message that 2012-2014 EISA standards will not diminish the need for continued residential
lighting market intervention: CFLs will not be the baseline4. NEEP and PAs highlight large remaining savings potential in not only retail products program,
but other PA residential programs5. NEEP and PAs clearly convey message that costs for lighting program savings will increase; possibly considerably,
and that this may affect overall program, sector and portfolio cost rates: $/annual or lifetime kWh6. NEEP and other stakeholders use available public input processes to educate regulators and present results
of regional data collection 7. NEEP and PAs emphasize need for program flexibility to address rapidly changing market 8. NEEP develops with PA input annual RLS updates and provide to regulators and other key stakeholders 9. PAs and regulators reach agreement on processes needed to pursue alternative/complementary program models
like market share and market lift10. PAs and regulators limit regulatory uncertainty – and PA reluctance to aggressively pursue lighting savings – by reaching
agreement early on key planning assumptions: net-to-gross ratios, measure lifetimes, baseline wattages, etc.11. Regulators consider and pursue as appropriate alternative cost-effectiveness approaches such as utility cost test
(or energy and water test) and claiming gross vs. net savings (where such topics are being addressed by the Regional EM&V Forum in 2012)
1. NEEP continues to engage regulatory agencies through annual and multi-year plan submissions and through NEEP policy outreach efforts
2. NEEP and PAs continue efforts to emphasize need to maintain a longer term, multi-year vision of the residen-tial lighting market
3. All Parties assess success of program efforts and work together to refine program strategies as needed
4. PAs and regulators integrate non-energy benefits more fully into cost effectiveness calculations
Implement process to continue regional lighting engagement on an on-going basis
1. NEEP provides on-going forum and resources to allow all parties to revisit and revise RLS as market evolves 1. Continue and enhance near-term actions
table 3rls strategies & actioNs

NORTHEAST RESIDENTIAL LIGHTING STRATEGY13
sectioN 1: situatioN aNalysis
iNtroductioN
This Situation Analysis provides an overview of the current residential lighting market in the seven state Northeast region (New England and New York) and of stakeholder efforts to pro-mote efficient lighting in the region. It summarizes recent and current efficiency program administrators’ (PAs) activities, including budgets and savings goals, to support efficient lighting sales and installations. These 2011 program savings estimates provide a benchmark against which the projected remaining regional lighting savings potential can be compared.
This section also describes and discusses current and potential PA retail lighting program designs as well as regulatory treatment of these programs. Current estimates of the satura-tion of efficient lighting are provided where such data are available. The Analysis also de-scribes current and planned consumer educational efforts being pursued both by individual stakeholders and by groups of key stakeholders. Finally, the status and projected evolution of efficient lighting technologies are described both in this section and in more detail in Appendices A and B.
CurreNt Program admiNistrator aCtivities
Efficient Lighting/Product ProgramsCurrently, efficiency program administrators (PAs) in the entire seven-state Northeast region covered in the Situa-tion Analysis support the sale of efficient lighting products at retail. The large majority – approximately 85 percent – of projected 2011 PA retail lighting program incentives are focused on the promotion of compact fluorescent lamps (CFLs). The remainder of pro-jected 2011 incentives will
be for compact fluorescent fixtures and light emitting diode (LEDs) lamps and fixtures, with the majority going to support compact fluorescent fixtures.
Most PA incentive dollars, as detailed below, are used to provide incentives to manufactur-ers and/or retailers to reduce the price of products at retail. Smaller amounts are used for rebates going directly to consumers.
NORTHEAST RESIDENTIAL LIGHTING STRATEGY14
Current and proposed retail lighting program structures and budgets
Current Program StructuresAt present, most PA lighting programs rely on upstream incentives paid to retailers or manu-facturers. These upstream incentives are often referred to as markdowns or buy downs. This upstream approach reflects a marked change from the early 2000s when all rebates were tar-geted to consumers,either through mail-in rebate forms or in the form of an “instant coupon.” Instant coupons were available at a participating retail venue and could be redeemed at checkout similar to using a manufacturer coupon at a grocery store. The movement toward upstream incentives began in 2001 with NEEP initially facilitating the efforts of many of the PAs in the region to more actively engage industry in jointly promoting the sale of CFLs. This process was informed by similar upstream incentive efforts pursued in the Pacific Northwest.
The upstream incentive process facilitated by NEEP was referred to as “Negotiated Cooper-ative Promotions” and this term, and its acronym NCP, is still often used in the region to re-fer to upstream lighting promotions. The initial NEEP-facilitated NCP process involved the development of a request for proposal and subsequent responses from retailers and manu-facturers. From these responses, participating PAs selected those proposals best meeting their needs. PAs then negotiated with the manufacturer and/or retailer the final details of the planned promotion.
These participating NEEP sponsors pursued the NCP process as an alternative to the then current mail-in rebate forms and instant coupons for several reasons:
• Lower incentive redemption costs: The costs for PAs to redeem and process an instant coupon or mail-in rebate do not vary significantly with the rebate amount. As CFL incentive levels dropped - tracking declining retail prices – the proportion of program costs devoted to rebate redemption and processing rose. This became a concern for some PAs. NCPs do not require the processing of individual rebate forms. As a result, the per lamp redemption and processing costs for NCPs are notably lower than for mail-in rebates or instant coupons.
• Using competitive procurements practices to attain the “best deal” for PAs and ratepayers: PAs determined which industry proposals they would fund based on a number of criteria: proposed retail price, product quality, any matching retailer or manufacturer price reductions, proposed retailer or manufacturer marketing efforts and store placement considerations, type of lamp(s) to be promoted, e.g., standard vs. specialty lamps1, etc.
• Better control over budgets: Typically a memorandum of understanding (MOU) is executed between a PA and a joint retailer/manufacturer team that spells out the details of a given upstream promotion including duration, store locations, incentive amounts,
1 Throughout this report a distinction is made between “standard” and “specialty” CFLs reflecting how many PAs incent and track savings from these two lamp types. Typically, standard CFLs are non-dimmable, non-covered CFLs, sometimes in-correctly referred as “spirals”. “Specialty” CFLs are all other CFL types including A-lamp, globe, reflector, flood, dimmable, three-way, and candelabra-base CFLs. Note that a dimmable or three-way spiral is considered a specialty lamp.

NORTHEAST RESIDENTIAL LIGHTING STRATEGY15
number and type of products to be promoted, etc. These MOUs usually include a cap on the number of products that will be subsidized by the PA.
• Ability to target specific retailer groups or customer segments: PAs have suc-cessfully used the NCP process to target specific retailer groups that have historically not been active participants in PA retail lighting programs. These include grocery and drug stores. PAs have also used the upstream incentive model to target non-English speaking customers through promotions with retailers that serve these populations. Finally, PAs in Massachusetts and Rhode Island use the upstream incentive process to target “Hard to Reach” (HTR) customer segments. The value to these PAs of targeting HTR populations is discussed more fully below.
Future Program StructuresThe NCP process has created successful PA and industry partnerships to jointly promote CFLs at retail. However, PAs are beginning to investigate alternative program models to ad-dress concerns regarding declining net to gross ratios (NTGRs) for their CFL programs. These lower NTGRs are driven by increasing free-ridership as CFLs become increasingly common and PA support of CFLs becomes one of several factors influencing consumers’ decisions to purchase them.
The alternative program models under consideration by PAs include market lift and market share models. The key feature of these alternative approaches is to both focus on and limit PA support to the incremental increase in product sales over a prescribed baseline during a defined time period. It is assumed that targeting incremental sales will lower customer free-ridership and raise NTGRs, and hence net savings, for CFLs sold during these promotions.
To implement these alternative models requires a more intensive engagement with par-ticipating retailers than does the typical NCP upstream promotion. For current NCP promo-tions, retailers or manufacturers are paid their incentive based on submission of sales data (though in the past there was greater reliance on shipment data) to document the number of eligible products sold during the promotional period defined in their NCP. No other data on prior sales is typically required.
Market lift or market share models, however, require that a pre-promotional baseline level of prior sales be established. Only sales above this baseline are supported by PA incentives. This baseline can be based on either prior sales from participating stores, or preferably, a combination of participating store sales data and sales from stores in non-program areas. If using non-program stores to help define the baseline, ideally sales data are available for both the pre-promotion period and the promotional period.
Prior to beginning a market lift/share promotion the PA(s) and participating retailers and/or manufacturers establish the baseline against which promotional sales would be based.

NORTHEAST RESIDENTIAL LIGHTING STRATEGY16
Depending on data availability, this might entail constructing more than one possible base-line and then determining which would best meet the needs of all parties.
PAs in Massachusetts, Vermont, New York, and Rhode Island have expressed interest in pilot-ing a market lift model to promote CFL sales. This model requires developing a baseline using a combination of sales data from participating stores and from stores in non-pro-gram areas. NYSERDA has already used a market share program model to support ENERGY STAR appliance sales. For the market share model the baseline is set based on previous same store (or chain) sales data. This model requires that the participating stores provide past sales data for the entire targeted appliance category, i.e., refrigerators, and for the ENERGY STAR sales in that appliance category. Incentives are paid for sales that exceed the previous market share for the product category. The ENERGY STAR market share for a participating retailer is defined as:
ENERGY STAR sales/Sales for the entire product category
As discussed below, these alternative models require access to sales data that retailers have often been reluctant to provide in the past, in part due to confidentiality concerns. These data provision requirements may limit the number of retailers willing to participate in these alternative program models.
Total CFLs and CFLs Rebated per Household
There are a number of ways that PA, regula-tors and others can measure the success of efforts to promote the stocking and sale of efficient lighting products. These include:
• Shelf space inventories: Some PAs have their program implementation vendors per-form surveys of retail shelf space. These sur-veys determine the percentage of shelf space dedicated to different types of lighting, includ-ing those lamp types promoted by their pro-grams. The surveys can also be used to collect pricing information. However, the shelf space and sales levels for a specific lamp model or lamp category may not directly correlate.
• Socket saturation surveys: The most accurate means to estimate the current satu-ration of efficient lighting in homes is to complete onsite survey of homes and determine the lamp type in each socket in the home. These surveys are expensive to complete, but have been completed by PAs in many of the states in the region. Socket saturation of

NORTHEAST RESIDENTIAL LIGHTING STRATEGY17
efficient lighting is considered a key measurement of the success of PAs, retailers, and manufacturers to promote efficient lighting. The typical cost per household for such sur-veys is approximately $1,100 to $1,500.
• Level of PA program activity: PA program activity can be benchmarked for a given program year based on the number of CFLs rebated per household. While demographic differences between service territories may account for some differences among PAs—e.g., single vs. multifamily split—this is still a useful means to compare past, current and projected program activity. Note that this report’s remaining savings potential analysis is largely driven by projected per household numbers of standard CFLs, specialty CFLs and LEDs sold through PA supported efforts.
Table 1-1 presents by state the best available information on CFL saturations and projected 2011 CFL PA program unit numbers on both a total statewide and total per household basis. For some states both sets of data were not available. For New York data are provided on a somewhat more disaggregated basis reflecting data availability and the differing PA struc-tures in the state. It is estimated that approximately 36 percent of the sockets in homes in the region were filled with efficient lighting in mid/late-2011. Of this, 27 percent were CFLs, one percent was LEDs, and eight percent were linear fluorescent lamps. The pro-jected 2011 levels of PA support vary considerably across the region with Connecticut and Vermont having the highest levels of support at 3.28 and 2.77 CFLs per household, respec-tively. Connecticut’s 2011 level of program support is driven in large part by a 2010 regula-tory mandate that the utilities attain 36 percent CFL socket saturation by the end of 2011. In comparison, the projected CFLs/HH values for New Hampshire and New York (excluding the Long Island Power Authority) are 0.40 and 0.63, respectively.

NORTHEAST RESIDENTIAL LIGHTING STRATEGY18
table 1-1cfl socket saturatioNs aNd 2011 PlaNNed
PrograM adMiNistrator cfl levels of suPPort
(Data were not available for blank areas of chart)
CFL Socket Saturation
Year of Study
2011 Projected CFLs through PA Programs
Number of Households served by PAs
2011 CFLs/HH
Connecticut 23% 2009 4,089,569 1,245,000 3.28
Maine 1,000,000 705,000 1.42
Massachusetts 27% 2010 3,358,742 2,053,361 1.64
New Hampshire 242,595 601,000 0.40
New York (less NYC & LIPA)
23% 2010
New York (less LIPA)
4,438,568 7,012,894 0.63
New York: NYC 25% 2010
New York: LIPARhode Island 21% 2010 481,258 404,000 1.19
Vermont 18% 2009 850,000 307,127 2.77
Spirals vs. Specialty vs. Hard to Reach (HTR) CFLsAs the market for CFLs expanded over the past decade, PAs’ promotional efforts became more targeted to better address consumer needs. This is evidenced by PA promotional ef-forts and incentives to distinguish between “plain vanilla” standard (non-dimmable) spirals and other CFL types typically grouped as specialty CFLs. While standard CFLs meet many consumer needs, the availability of various specialty lamp types allow more sockets to be filled with CFLs. Specialty CFLs include:
• Dimmable and three-way lamps• Reflector lamps – primarily flood lamps given the more diffuse distribution of light
from a CFL• Other covered lamps – globe and ‘traditional” A-lamp form factors• Candelabra-based lamps – until the ENERGY STAR Version 3.0 specification only me-
dium-base lamps could qualify for ENERGY STAR.
Retail prices for specialty CFLs are much higher than those for standards CFLs. The unsub-sidized price of standard CFLs sold in multi-packs can be less than $2.00 a lamp. Specialty CFL prices typically vary from $4.00 to over $15 for some dimmable reflector lamps. Average 2011 PA incentives for standard CFLs are in the $1.50 to $2.25 range across the region while average incentives for specialty CFLs are in the $4.00 to $6.00 range.
PA promotion of specialty CFLs has generally increased over the past few years. More spe-cialty products have become available from manufacturers and their performance has also improved, particularly that for reflector lamps as discussed below. Further, specialty CFLs

NORTHEAST RESIDENTIAL LIGHTING STRATEGY19
typically yield higher net savings per lamp than do standard lamps due to the higher net to gross ratios applied to specialty lamps in many PA service areas. These higher net savings help offset some of the higher incentive levels that PAs offer for specialty CFLs.
To help address free-ridership and lower net to gross ratios for CFLs, PAs in both Massachu-setts and Rhode Island have developed a “Hard to Reach CFL” measure category (HTR). These CFLs are defined by the consumer markets that they are targeted to. The evaluation of the 2009 Massachusetts lighting program found that the net to gross ratio (NTGR) for CFLs had fallen from over 1.3 to 0.41. Concerned that subsequent evaluations would find even lower NTGRs, PAs and other stakeholders agreed that CFLs marketed to those customers that did not typically purchase CFLs would be assigned a higher NTGR. In Massachusetts and Rhode Island HTR CFLs have been promoted through NCP efforts that target specific retail-ers which more typically serve lower income and non-English speaking populations.
Table 1-2 shows the breakout of planned PA 2011 CFL efforts in several states in the region that target market by standard, specialty and hard to reach product categories. For Mas-sachusetts there is an additional “School Fundraiser” planning category. While these are nearly all standard spirals, different net savings are assumed for these CFLs due to lower assumed installation rates. For Vermont, the hard to reach number are all specialty CFLs that have been given away at food banks in the state.
table 1-2breakout of PlaNNed 2011 Pa iNceNtive efforts by cfl Product category
Standard Specialty Hard to Reach School FundraiserConnecticut 80% 20%
Massachusetts 25% 43% 27% 5%
Rhode Island 58% 26% 16%
Vermont 41% 41% 19%
Free ridership, Spillover, and Net to Gross RatiosPAs’ savings claims for efficiency measures are typically adjusted to account for the esti-mated impact that the PAs’ program had on consumers’ decisions to purchase the measure. These adjustments measure the extent to which a consumer’s purchase can be attributed to PA incentives and marketing efforts. Measure gross savings, typically derived from engi-neering calculations and evaluation results, are adjusted by one or more factors to develop net savings estimates. PAs in many states use net savings estimates for planning and report-ing purposes. The key net savings adjustments are2:
• Free-ridership (FR) – Accounts for the proportion of customers participating in a PA program that would have purchased the efficient product absent any PA program intervention.
2 EM&V Glossary : http://neep.org/emv-forum/forum-products-and-guidelines#glossary

NORTHEAST RESIDENTIAL LIGHTING STRATEGY20
• Spillover (SO) – Accounts for efficient measure purchases outside of the program that would have not occurred if there had been no PA program. PA programs have the ability to influence consumer decision making outside of those directly participating in programs. Factors driving spillover include greater product availability, reduced unsub-sidized product prices, greater consumer awareness of efficient product choices, etc. Sometimes two types of spillover are measured. Participant spillover measures additional measure purchases made by program participants outside of the program. Nonparticipant spillover estimates additional measure purchases by consumers that were not program participants.
• Net to Gross Ratio (NTGR) – The factor applied to gross savings to develop measure net savings estimates. It can be measured directly or derived from separate measurement of free ridership and spillover:
NTGR = (1-FR+SO)
NTGR for CFLs have generally fallen over the past several years both in and outside the region, though several states in the Northeast have not conducted recent NTGR lighting studies. While there is some evidence that NTGRs have stabilized of late, PAs continue to be concerned that these values will continue to fall.
Note that NTGRs are determined retrospectively based on actual program activity. PAs do not empirically derive these values from a forward looking perspective. This represents a challenge for planning as the available NTGRs are always historical, but must be applied to future planning estimates. This challenge is further compounded in states where PAs’ net savings claims are retrospectively adjusted based on current evaluations as is the case in Massachusetts. For the other six states in the region, the net savings estimates used for planning purposes are used for reporting purposes with no further true-up if more current evaluation results become available.
Table 1-3 below provides 2011 NTGRs planning assumptions for several states in the region. In some cases free-ridership and spillover values are also provided when they were sepa-rately derived. Further, in some states different NTGRs are used depending on the lamp type. Note that for both Massachusetts and Vermont the values were negotiated values developed during their multi-year planning processes. For Massachusetts these NTGR values were subject to retrospective adjustment for general reporting purposes, but not for meet-ing shareholder performance incentives.
Estimating the net to gross relationship in evaluations of savings from residential lighting programs poses various methodological and programmatic challenges. These issues are be-ing explored by the Regional EMV Forum in a series of projects pertaining to net savings and

NORTHEAST RESIDENTIAL LIGHTING STRATEGY21
in a 2012 project that includes collection of sales data from lighting retailers3. The most common method for attributing savings to lighting (and many other programs) accounts for free ridership and spillover; it is based on customer self-reported data from surveys. How-ever, in addition to concerns about the reliability of such results due to response bias, it is difficult to attribute the influence of any given program year’s participation by a customer from the influence of previous years as well as from all the other media influences on cus-tomers’ decisions about lighting purchases in this rapidly evolving market.
In working towards the recommended goal of 90 percent socket saturation by 2020, ad-ditional education, marketing and incentives will be needed to influence consumers to fill additional light sockets with high efficiency products. Achieving this at the lowest cost to PAs suggests a strong and increasing role for manufacturers and retailers to influence and encourage consumers to fill the remaining sockets with efficient bulbs. The key, then, is to clarify the desired result each year linked to the 90% socket saturation goal, and reward PAs for achieving this by leveraging market player resources and influence. This is a very different approach to savings attribution than trying to calculate free riders or spillover to estimate net savings.
An alternative method to estimate year-by-year savings relies on sales data from the pro-gram area and comparison areas; it yields estimates of the combined effects as an overall net to gross ratio. While sales data from many retailers and locations is not consistently available and has proven costly and difficult to acquire, D&R’s “market lift” strategy holds promise as an opportunity for more rapid, comparable, and reliable estimates of net to gross ratios. The Regional EMV Forum is now working with D&R International on a 2012 proj-ect to develop market intelligence on residential lighting for many Forum sponsors.
Evaluations to understand impacts directly attributable to programs (“attribution”) and customer behavior are important to regulators and program designers, respectively. How-ever, a focus on the short-term aspects of programs measured as net savings or net to gross ratios runs the risk of undermining the ultimate long-term goal of achieving all cost-effective energy efficiency. For residential lighting, the short term focus can lead to deci-sions that inhibit increased socket saturation and lead to misalignment with the market transformation goals such as those suggested in this study. One example is New York, where a free-ridership study resulted in a 2011 Public Service Commission finding that ratepayer-funded lighting programs should no longer promote CFL products, although a 2010 satura-tion survey revealed only 25 percent CFL socket saturation in New York City. An alternative strategy could be to adopt an approach that allows for closer alignment between market transformation goals (e.g., 90% socket saturation) and program design. Better alignment
3 See the Net Savings Scoping Paper, the Powerpoint from the Net Savings Webinar. In addition, an ongoing protocol development project is to develop common definitions for adjusted gross savings and net savings. A project taking place in 2012 in collaboration with D&R International will analyze retail residential lighting sales data collected from states with and without promotions of energy efficient lighting via D&R’s Market Lift model. More information on these is available at www.neep.org/emv-forum.

NORTHEAST RESIDENTIAL LIGHTING STRATEGY22
can be achieved by using adjusted gross savings estimates instead of net savings estimates to measure progress toward market transformation goals, accompanied by market analysis and other information such as customer surveys - including socket saturation surveys - to inform program designs and incentives. Such alternative strategies will be explored by the Regional EM&V Forum in 2012.
table 1-32011 PlaNNiNg cfl Net to gross ratios for select Northeast states/regioNs
Standard Specialty Hard to Reach School FundraiserConnecticut 106% 106%
Massachusetts 25% 80% 50% 50%
New Hampshire 100% 100%
Rhode Island 50% 80% 100%
Vermont 50% 118% 118%
Current PA Support of LEDsPA support for LEDs has been understandably much more limited to date than that for CFLs due to lim-ited ENERGY STAR product availability and high re-tail prices. Efficiency Vermont was the first state in the region to support LEDs. In 2008 Efficiency Vermont began to offer rebates for the Cree LR6 recessed can retrofit product, prior to its qualifica-tion as an ENERGY STARR product. Since then other PAs in the Northeast have offered incentives for the CR6 and for other ENERGY STAR LED fixtures, mostly recessed cans. Only in 2011 did PAs begin to offer upstream incentives for LED lamps.
The limited support for LED lamps is in large part due to limited product availability. The ENERGY
STAR specification for LED fixtures became effective in September of 2008 while the speci-fication for LED lamps only became effective in September 2010.
As of early October 2011 there were 293 ENERGY STAR qualified LED lamps. Of these, 85 per-cent were reflector lamps, eight percent were globe lamps, and five percent were reflector lamps. Only two percent or six listed models were A-lamps, the most frequently purchased residential lamp type. However, of particular importance for consumer acceptance is that 82 percent of all the listed ENERGY STAR LED lamps were dimmable, including five of the six A-lamps. In comparison, less than four percent of listed ENERGY STAR CFLs are dimmable.
In late 2011 PA incentives – mostly upstream – for ENERGY STAR LEDs typically ranged from $20
NORTHEAST RESIDENTIAL LIGHTING STRATEGY23
to $30 reflecting retail prices in the $30 to $55 range. The resulting subsidized retail prices to consumers were in the $10 to $30 range. Note that the retail prices for non-ENERGY STAR LED lamps available at retail in the Northeast are usually lower than for a comparable ENERGY STAR qualified model.
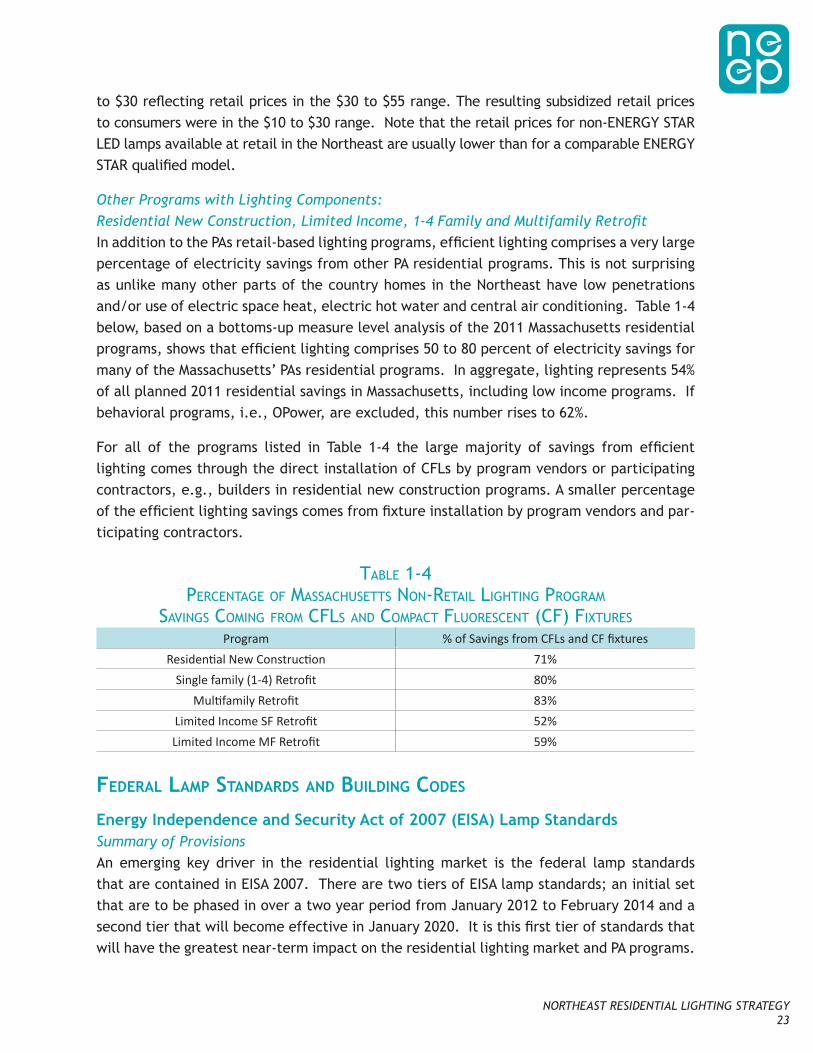
Other Programs with Lighting Components: Residential New Construction, Limited Income, 1-4 Family and Multifamily RetrofitIn addition to the PAs retail-based lighting programs, efficient lighting comprises a very large percentage of electricity savings from other PA residential programs. This is not surprising as unlike many other parts of the country homes in the Northeast have low penetrations and/or use of electric space heat, electric hot water and central air conditioning. Table 1-4 below, based on a bottoms-up measure level analysis of the 2011 Massachusetts residential programs, shows that efficient lighting comprises 50 to 80 percent of electricity savings for many of the Massachusetts’ PAs residential programs. In aggregate, lighting represents 54% of all planned 2011 residential savings in Massachusetts, including low income programs. If behavioral programs, i.e., OPower, are excluded, this number rises to 62%.
For all of the programs listed in Table 1-4 the large majority of savings from efficient lighting comes through the direct installation of CFLs by program vendors or participating contractors, e.g., builders in residential new construction programs. A smaller percentage of the efficient lighting savings comes from fixture installation by program vendors and par-ticipating contractors.
table 1-4PerceNtage of Massachusetts NoN-retail lightiNg PrograM
saviNgs coMiNg froM cfls aNd coMPact fluoresceNt (cf) fixtures
Program % of Savings from CFLs and CF fixturesResidential New Construction 71%
Single family (1-4) Retrofit 80%Multifamily Retrofit 83%
Limited Income SF Retrofit 52%Limited Income MF Retrofit 59%
federal lamP staNdards aNd buildiNg Codes Energy Independence and Security Act of 2007 (EISA) Lamp Standards Summary of ProvisionsAn emerging key driver in the residential lighting market is the federal lamp standards that are contained in EISA 2007. There are two tiers of EISA lamp standards; an initial set that are to be phased in over a two year period from January 2012 to February 2014 and a second tier that will become effective in January 2020. It is this first tier of standards that will have the greatest near-term impact on the residential lighting market and PA programs.

NORTHEAST RESIDENTIAL LIGHTING STRATEGY24
The first set of EISA standards establishes maximum rated wattages for four bins of lamps defined by their light output (lumens). EISA covers many, but not all, medium base general service lamps (Table 1-5). EISA is technology neutral and neither bans any particular tech-nology (incandescent lamps) nor requires the use of any technology (compact fluorescent lamps). Unfortunately there has been a fair amount of consumer misinformation related to these two facts. Such misinformation only further complicates efforts by industry and PAs to inform consumers as to appropriate efficient lighting choices.
table 1-5eisa requireMeNts for staNdard sPectruM geNeral service bulbs
EISA Effective Dates
Typical Incandescent
Replaced
Typical Incandescent
Lumen Output
Typical Incandescent
Efficacy
EISA Replacement
EISA Lumen Ranges
EISA Minimum
Efficacy Ranges
1/1/2012 100 W 1600 17 lm/W 72 W 1490-2600 21 – 36 lm/W
1/1/2013 75 W 1150 16 lm/W 53 W 1050-1489 20 – 28 lm/W
1/1/2014 60 W 800 14 lm/W 43 W 750-1049 17 – 24 lm/W
1/1/2014 40 W 450 12 lm/W 29 W 310-749 11 – 26 lm/W
There are a number of exemptions to the EISA lamp standards. These include appliance, black light, bug, colored, infrared, left-hand thread, marine, plant light, reflector (cov-ered under separate DOE standards which DOE may now be revisiting), rough service, shatter-resistant, sign service, silver bowl, showcase, 3-way incandescent, traffic signal, vibration service, and G shape. Note that the requirements for modified spectrum lamps are less stringent than for the above standard spectrum lamps.
The 2020 second tier of EISA standards are tied to two future DOE rulemakings that DOE is required to initiate to determine whether lamp standards should be made more stringent. DOE is required to initiate a rulemaking in 2014 to consider whether it is technologically feasible and economically justified to make the standards for “general service lamps” higher than the EISA 2007 levels. The definition of “general service lamps” includes general service incandescent lamps as well as: compact fluorescent lamps, general service light emitting diode (LED or OLED) lamps, and “any other lamps that the Secretary determines are used to satisfy lighting applications traditionally served by general service incandescent lamps”. If this rulemaking cannot produce savings that are greater than or equal to the savings from a minimum efficacy standard of 45 lumens per watt, effective January 1, 2020, then DOE will prohibit the sale of any general service lamp that does not meet a minimum efficacy standard of 45 lumens per watt (this is referred to in EISA as a “backstop requirement”)4.
4 FACT SHEET: General Service Incandescent Lamp Provisions Contained in EISA 2007. http://www1.eere.energy.gov/build-ings/appliance_standards/residential/pdfs/lighting_legislation_fact_sheet_03_13_08.pdf

NORTHEAST RESIDENTIAL LIGHTING STRATEGY25
In early 2012 a new federal budget bill was signed into law that explicitly prohibited the expenditure of funds by DOE to enforce the EISA general service lamp standards. This pro-hibition is for the current fiscal year ending September 30, 2012. Initially this “defunding” of EISA enforcement was incorrectly interpreted by some media outlets as a repeal of EISA. That is not the case. All major lamp manufacturers and their trade association, the National Electrical Manufacturers Association (NEMA), have confirmed their commitment to comply with EISA. The lack of funding by DOE to enforce EISA is not expected to have any impact on manufacturers’ and retailers’ plans to begin phasing in the initial 2012 EISA standards.
Impact on Claimed Savings by PAsAll other things being equal, an EISA compliant lamp will use approximately 25 to 30 per-cent less energy than a non-compliant “standard” incandescent lamp of the same lumen output. The federal lamp standard is applied to bins defined by lumen ranges, not by point estimates of lumen output. As discussed below, actual savings may vary and be considerably less than the often cited 25 to 30 percent savings.
For the savings analysis presented in this study baseline wattages were developed for 2012-2014. For each of the four EISA bins incandescent baseline wattages were estimated. For each year the wattages in each of the four EISA bins were then weighted by lamp sales. These baseline wattages (Table 1-6) vary somewhat from Table 1-5 above for several rea-sons. Note that the first two factors will increase the assumed baseline wattage, while the last one will decrease it.
• Inventory clearance: There will still be non-compliant lamps on the shelves follow-ing the effective date of the standards.
• Bin jumping: Minimally compliant EISA lamps may provide less light output than the stan-dard incandescents they are meant to replace. As a result, consumers may choose a higher lumen, and hence higher wattage, lamp instead. This impact is discussed in more detail below.
• EISA compliant lamps will be available before the effective date of the standard under which they are covered. This will result in baseline wattages decreasing prior to the effective date of a given standard.

NORTHEAST RESIDENTIAL LIGHTING STRATEGY26
table 1-6eisa iMPacts oN assuMed baseliNe Wattages for iNcaNdesceNt a-laMP rePlaceMeNt
Lamp Type Sales Weighting 2012 Baseline watts
2013 Baseline watts
2014 Baseline watts
100W Equivalent 21% 90 80 7675W Equivlalent 19% 72 64 57
60W Equivalent 46% 58 55 4840W Equivalent 13% 39 37 29Average w/ Sales Weighting 64.3 59.1 52.6
Response by Industry: Minimally Compliant HalogensAt the time that EISA was drafted it was thought that manufacturers would comply with the general service lamp standards by expanding their then current limited offer-ings of IR halogens. These lamps are more efficient, and more expensive, versions of standard halogen lamps. However, manu-facturers were able to sufficiently improve their standard halogen technology to devel-op a line of EISA compliant lamps at a lower cost than would have been possible if they had to use IR halogen technology.
However, manufacturers were able to use standard halogen technology to meet the EISA standards in part by producing lamps that barely met the lumen outputs specified in Table 1-5. These “minimally compliant” halogens meet the EISA standard, but do so by providing lower light output than the standard incan-descents they are intended to replace.
Figure 1-1 plots a large dataset of lighting products employing various technologies. The red saw-tooth line is the plot of the EISA lamp standards for general service lamps. As can been seen, there are a number of halogen lamps (green dots) that just meet EISA and provide the minimum lumen output allowed for the lumen bin they occupy. Most leading lamp manufac-turers are producing such minimally compliant halogen lamps.
It remains to be seen how prevalent these minimally compliant halogens become at retail. If they do then the question arises as to whether consumers will notice the lower light out-put from these lamps and “trade up” to the next higher lumen output lamp. If this occurs, then such “bin jumping” will negate much of the estimated 25 to 30 percent savings that was expected from lamps meeting the EISA standards.

NORTHEAST RESIDENTIAL LIGHTING STRATEGY27
figure 1-1Plot of laMP efficacies aNd luMeNs
Building Code Treatment of Lighting: IECC 2009 and 2012While the rate of new home building in the North-east is one of the lowest in the country, residential new construction still represents an important channel to promote and showcase efficient lighting installations. Historically, residential building codes, unlike commercial building codes, have not until recently addressed lighting efficiency. In many commercial buildings lighting is often the single largest use of both electricity and total energy. Further, inefficient lighting energy use contributes significantly to air conditioning loads as commer-cial buildings are much more internally load domi-nated than are residential buildings. For over two decades commercial energy codes required that conditioned spaces not exceed prescribed installed lighting power densities (installed watts of lighting per square foot of the space or building area).
Unlike commercial buildings, where straight tube fluorescent lamp fixtures are the domi-nant fixture type, most residential fixtures have been designed to accept a medium screw base lamp. It has not been until the last decade that efficient lighting options, specifically CFLs, have become widely available to fill these sockets. In response, the two most recent iterations of the International Energy Conservation Code (IEEC) now contain requirements for efficient residential lighting.

NORTHEAST RESIDENTIAL LIGHTING STRATEGY28
As of mid-October 2011 all of the states in the region had IECC 2009 in effect. Connecticut just recently adopted the 2009 edition in September, effective October 7th. IECC 2009 requires in its residential Chapter 4 that:
A minimum of 50 percent of the lamps in permanently installed lighting fixtures shall be high-efficacy lamps.
High-efficacy lamps are defined as:
Compact fluorescent lamps, T-8 or smaller diameter linear fluorescent lamps, or lamps with a minimum efficacy of:
• 60 lumens per watt for lamps over 40 watts;• 50 lumens per watt for lamps over 15 watts to 40 watts; and• 40 lumens per watt for lamps 15 watts or less.
However, this 50 percent requirement is only mandatory if the home is complying through the prescriptive compliance approach. A home that complies by using the optional perfor-mance approach is not required to meet this efficient lighting requirement.
Unlike IECC 2009, the lighting requirements in IECC 2012 are mandatory regardless of compli-ance approach. Currently, IECC 2012 has not yet been adopted by any state in the region as it has only recently been published and made available. While several states in the region have regulatory or legislative mandates that require the adoption of the most recent version of IECC, the actual process of making any model code into a state regulation can be lengthy.
For lighting, IECC 2012 requires that:
A minimum of 75 percent of the lamps in permanently installed lighting fixtures shall be high-efficacy lamps or a minimum of 75 percent of the permanently installed light-ing fixtures shall contain only high efficacy lamps.
Low-voltage lighting is exempted from the high-efficacy lamp requirement. The definition of high efficacy lamps is unchanged from IEEC 2009.
The PAs’ residential new construction programs (RNC), as described above, are already helping prepare the market for this change. Most RNC programs, either through adoption of ENERGY STAR Homes Program requirements or through other prescriptive program require-ments, require that 80 percent of lighting meet the minimum efficacies listed above. As IECC 2012 is adopted by states in the region, state building code authorities, energy of-fices, and PAs should make certain that builders, local building code officials, electricians, and electrical supply houses are aware of the mandatory requirements of IECC 2009. Giv-en longstanding efficient lighting requirements for ENERGY STAR homes and the expected availability of a growing number of LED fixtures and lamps, meeting the minimum manda-tory lighting requirements should not pose a problem for builders.

NORTHEAST RESIDENTIAL LIGHTING STRATEGY29
eNergy star QualifiCatioN aNd Quality assuraNCe testiNg
ENERGY STAR Qualification for CFLs, LEDs and FixturesThe ENERGY STAR label has played a pivotal role both in PA programs and more broadly as a means to assure consumers that the lighting product they were purchasing would meet minimum performance expectations. With a few small exceptions (cold cathode lamps) PAs throughout the region have restricted their marketing and incentive support of efficient lighting to ENERGY STAR qualified products.
ENERGY STAR has been qualifying CFLs for over a decade and the specification for CFL qualification has become increasingly rigorous since its inception. Efficacy (lumens/watt) requirements have increased as has the minimum rated lifetime for CFLs. ENERGY STAR has also required additional testing requirements such as the rapid cycle stress test and elevated temperature testing for reflector CFLs.
Compact fluorescent lamp fixtures are covered in a separate specification document (Resi-dential Light Fixture V4.2) as are LED fixtures (Solid State Luminaires V1.3). The first ENER-GY STAR fixture specification was effective in 1997 with coverage extended to LED fixtures in September 2008. A new ENERGY STAR Luminaires V1.1 specification covering all lighting types will become effective on April 1, 2012.
As noted above, LED lamps first became eligible for the ENERGY STAR label in September 2010. EPA is currently developing a new product specification for lamps, intended to replace the Compact Fluorescent Lamps (CFLs, V4.2) and Integral LED Lamp (V1.3) specifications with a technology neutral ENERGY STAR Lamps V1.0 specification.
Quality Assurance TestingThe performance and quality of CFLs has long been a concern of industry, retailers, con-sumers and manufacturers. The current improved performance of CFLs can largely be credited to increased efforts by ENERGY STAR to address these issues through expanded quality assurance testing.
Initially, all ENERGY STAR products were self certified by manufacturers with no post-certifica-tion third-party quality assurance testing. Unfortunately, there was growing evidence in the early 2000s of poor CFL performance, including that of ENERGY STAR qualified products. In response to this issue a group of concerned PAs, organized by the Natural Resources Defense Council (NRDC) and funded in part by ENERGY STAR, formed the Program for the Evaluation and Analysis of Residential Lighting (PEARL). From 2002 through 2007 PEARL undertook nine rounds of test-ing of ENERGY STAR qualified products purchased at retail. While the quality of CFLs generally improved over the six years of testing performed by PEARL, performance and quality issues remained. ENERGY STAR valued the work of PEARL and starting with the third round of PEARL testing in 2003 ENERGY STARbegan to use PEARL data to delist previously qualified ENERGY STAR products.

NORTHEAST RESIDENTIAL LIGHTING STRATEGY30
While PEARL played an important role in addressing CFL quality, its resources were limited. Typically PEARL was only able to test 30 models in any given testing round and no more than two rounds of testing were performed in a year. As a result of discussions with ENERGY STAR the responsibility for CFL testing shifted to ENERGY STAR and became part of the ENERGY STAR lighting specifications. ENERGY STAR now requires that initial product qualification be done by an independent certified lab and ENERGY STAR undertakes quality assurance testing of lighting products purchased at retail. Products that fail to meet ENERGY STAR specifications are subject to delisting. The Northeast is encouraged to nominate products for ENERGY STAR quality assurance testing on a bi-annual basis so that incentivized products continue to meet the highest quality standards of ENERGY STAR.
ftC lamP labeliNg
Starting on January 1, 2012 all residential medium base lamps sold in the U.S. will be re-quired to carry specific lamp performance information. This Federal Trade Commission (FTC) labeling requirement represents both a challenge and an opportunity for PAs and other stakeholders. While lamp wattage will be listed, lamp lumens will be listed first. This is important as consumers will increasingly need to make their lamp choice based on light output, not wattage. Different lighting technologies will deliver similar light outputs at very different wattages and consumers should be encouraged to choose the lamp with the appropriate lumen output at the lowest wattage. As discussed below, there will be a clear need for PAs, manufacturers, and retailers to better educate consumers on their lamp decision making.
The new FTC label (Figure 1-2) requires:• The front of the packaging must provide information on brightness (lumen output)
and estimated annual energy cost.
• The back of the packaging must include the FTC Lighting Facts label, which pro-vides information on brightness, energy cost, the bulb’s life expectancy, light appearance, wattage, and the mercury content (if any).
• Lumen output must be printed directly on the bulb, along with mercury content (if any).
Note that DOE has also developed a Lighting Facts label to be used specifically for SSL Prod-ucts (Figure 1-3). However, this label cannot be used on packaging once the FTC labeling requirement is effective at the start of 2012. The DOE label can, however, continue to be used on product specification sheets, promotional literature, and websites. Also, the FTC label does not specifically require test procedures to verify the stated performance or life-time claims. DOE requires appropriate testing for products that are listed with its voluntary Lighting Facts program.
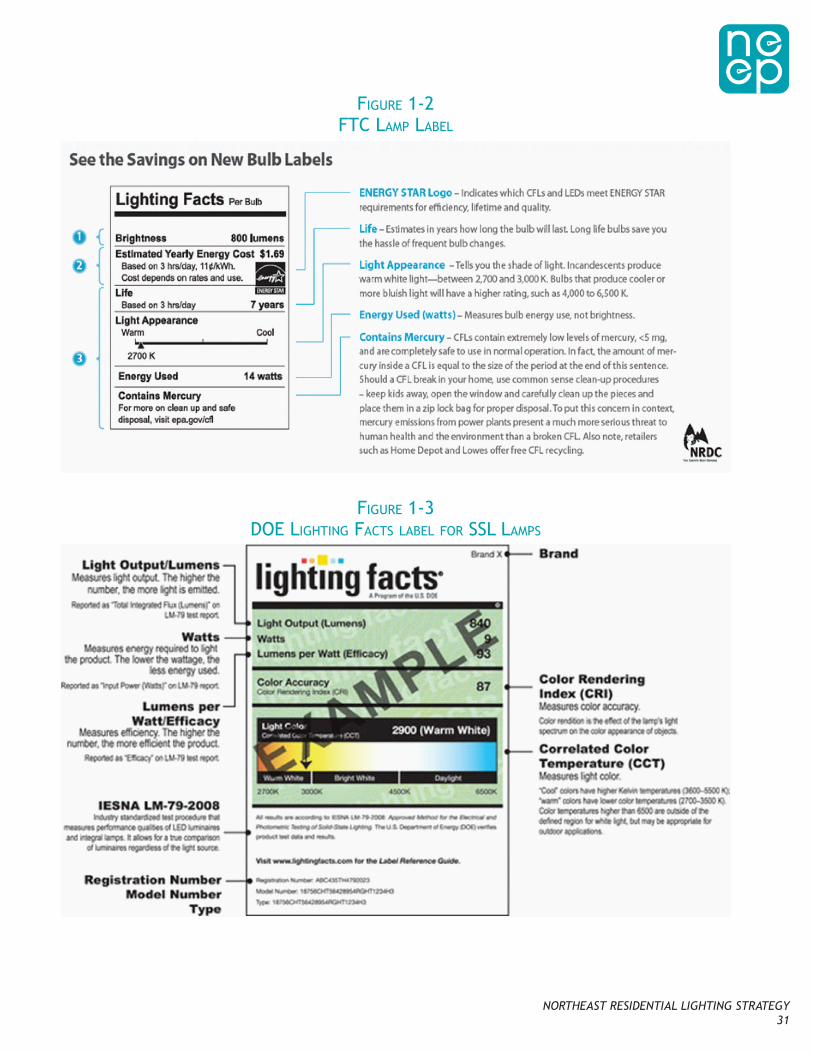
NORTHEAST RESIDENTIAL LIGHTING STRATEGY31
figure 1-2ftc laMP label
figure 1-3doe lightiNg facts label for ssl laMPs

NORTHEAST RESIDENTIAL LIGHTING STRATEGY32
The principal differences between the two labels are5:• The FTC label is directed to consumers. The DOE label enables retail buyers, utili-
ties, and lighting professionals to evaluate solid-state lighting (SSL) product performance.
• The FTC label applies to all medium screw base bulbs, while the DOE label applies to all SSL.
• The FTC label is mandatory; the DOE label is voluntary. DOE will not encourage the use of its label on packaging once the FTC label is required, but Lighting Facts partners should still rely on the verified information on the DOE Lighting Facts label, which can be found on manufacturer specification sheets or www.lightingfacts.com/products when reviewing products.
• The FTC label does not require test procedures to verify performance claims. DOE will continue to require appropriate testing for products listed with the voluntary Light-ing Facts program.
CoNsumer eduCatioN The convergence of the first phase of the EISA lamp standards, the new FTC lamp labels, and the increas-ing presence of halogen and LED lamps at retail will represent a challenge for consumers to sort through. It will be critical for PAs, retailers, and manufactur-ers to begin as soon as possible to help consumers make sense of this potential information overload. Otherwise consumers will face increasing difficulties in navigating through the rapidly changing residential retail lighting landscape. The result may be a default decision to purchase “efficient” minimally compliant halogen lamps.
While PA and industry needs regarding consumer edu-cation are similar and undoubtedly overlap, they are not fully congruent. PAs will need to clearly com-municate to consumers that the minimally compliant
halogen lamps on retailer shelves are not an efficient lamp choice. This messaging may take a more positive direction by promoting CFLs and LEDs as the efficient lighting option. At the same time industry communications will likely note that these EISA compliant halogens are indeed more efficient than the standard incandescent lamps they replace, leading to consumer confusion and a greater likelihood to choose a lighting product that resembles the incandescent lamp they are replacing.
5 Frequently Asked Questions: The FTC Lighting Facts Label. http://www.lightingfacts.com/downloads/FAQ_FTC_4.2011.pdf

NORTHEAST RESIDENTIAL LIGHTING STRATEGY33
Stakeholder PartnershipsUnder the direction of the Alliance to Save Energy (ASE) a broad consortium of interested stakeholders have been in discussions for the past two years to better address consumer education through the Lighting Understanding For a More Efficient Nation (LUMEN) Coali-tion. ASE describes the LUMEN Coalition as:
“…an ad hoc consortium of organizations and professionals united to facilitate con-sumer educated energy-efficient lighting decisions.”
The Coalition’s stated goals are6:
• To increase public awareness of the effects and benefits involved with the transition to energy efficient lighting sources.
• To curb public misunderstanding of the transition to energy efficient lighting sources relating to both use and effects of available lighting options.
• To empower the public with increased awareness of new lighting products be-coming available and the knowledge to make the best lighting decisions for their personal circumstances.
• To address consumer dissatisfaction regarding various lighting technologies.
Make-up of the Coalition includes industry trade groups, individual manufacturers, PAs, non-profit advocacy groups including NEEP and NRDC, and others. PAs from the Northeast who are members include National Grid and Efficiency Vermont.
LUMEN has developed a number of “products”, including FAQs that may be of value to PAs and others. The LUMEN website http://lumennow.org/ is a fairly content rich website that might be an appropriate link for PAs and possibly other stakeholders that want to provide their “customers” with more information on EISA, the use of lumens vs. watts to make lamp selections, and energy saving lamp choices.
Regional and Individual Stakeholder EffortsDifferent stakeholder groups may have different needs relative to informing their customers about residential lighting choices in 2012 and beyond. However, there are clearly several mutual areas of common interest as shown by the efforts of the LUMEN Coalition. For con-sumer education and marketing efforts specific to efficiency activities in the Northeast the following will be considerations:
• Focus increasingly on lumens, not wattage, in consumer messaging and help consum-ers understand the difference and how they relate to the choice of efficient lighting.
• Direct consumers to the most efficient lighting choices: LEDs and CFLs. PA outreach efforts may not need to focus directly on EISA, but rather act on consumer needs for clear and consistent messaging on efficient lighting product choices.
6 http://lumennow.org/who-we-are/

NORTHEAST RESIDENTIAL LIGHTING STRATEGY34
• Structure ongoing evaluation activities to help inform consumer education and mar-keting efforts. PAs in Massachusetts completed focus groups in the summer of 2011 to inform such efforts. Connecticut has similar focus groups planned for the fall of 2011. Such market research – to track and assess consumer understanding of and satisfaction with high efficiency lighting products – is essential to inform program design and messag-ing going forward.
• Leveraging of upstream promotions with manufacturers and retailers to include ex-plicit educational components, with opportunities to provide point of purchase displays that illustrate various efficient technologies and light output.
• Achieve stakeholder “buy-in” and economies of scale by engaging industry regionally to develop common messaging and educational platforms
• NEEP can play a role to facilitate PA learning exchange on such activities and, where desired and appropriate, support joint or coordinated activities among PAs to leverage resources and industry engagement.
regulatory aNd em&v treatmeNt of Program admiNistrator resideNtial lightiNg efforts
Detailed below are considerations of how PA light-ing programs develop and support their annual and lifetime savings claims. To date these savings have been almost solely focused on CFLs and CF fixtures. Moving forward PA planning and evaluation staff will need to develop more robust savings estimates for LEDs. Further, the 2012-2014 and 2020 EISA standards will also need to be considered in the de-velopment of both annual and lifetime savings es-timates for both CFLs and LEDs. The EISA standards will decrease both the annual and lifetime savings that PAs will be able to claim for CFLs and LEDs.
Savings Assumptions: Net to Gross Ratios, Delta Watts, Hours of Use and LifetimeSavings claims for residential programs are subject to fairly intensive scrutiny by regulators and stakeholders as part of both the program planning and annual PA reporting process. This is not surprising as retail lighting programs constitute the single largest source of residential sector savings for most PAs in the region. Further, this scrutiny has been focused on a single technology: CFLs. Moving forward PAs and regulators will also need to more carefully con-sider planning assumptions for LEDs.

NORTHEAST RESIDENTIAL LIGHTING STRATEGY35
Any planning process must deal with uncertainty. For lighting programs there are a number of key assumptions that affect the PAs’ net savings claims. These include net to gross ratios, wattage reduction, hours of use, and measure lifetime. Each of these is discussed below.
Net to Gross RatiosAs noted above, NTGRs for CFLs vary considerably across PAs. These differences are due in part to the vintage of the NTGR studies, but also reflect differences in program design and implementation. In general NTGRs have fallen over the past several years, but have shown some signs of stabilizing in the past couple of years. Currently, there have been no studies of LED NTGR in the region given their small market presence. This will likely change in the next year or two as LEDs account for a growing proportion of PA program activity.
In Massachusetts where claimed savings are subject to retrospective adjustment, uncer-tainty in CFL NTGRs, particularly for standard CFLs, generated reluctance on the part of PAs to aggressively promote this product. PAs had been concerned that subsequent evaluations would only further degrade their savings claims, making it difficult for the PAs to achieve their savings goals. As discussed below, this concern was addressed as part of negotiations during the PAs’ three-year planning process in 2009.
Delta WattsAnnual gross savings for residential lighting measures are driven by two factors. The first is the assumed reduction in installed wattage between the efficient lamp and the inefficient lamp it replaces. The second is the assumed hours of use. Wattage reduction can be either deemed for all CFLs that are promoted by a program or calculated based on the actual mix of measures that a program rebates in a given year. Deemed savings are typically calculated based on a review of the historical distribution of CFLs rebated by a program. For Connecti-cut, annual savings for CFLs are based on the actual distribution of CFL wattages rebated in a given year. For their Retail Products Program the Connecticut PAs assume that the watt-age reduction is three times the wattage of the installed CFL.
Moving forward PAs will need to revisit their wattage reduction assumptions given the im-pact of EISA. As shown in Table 2-6 the assumed baseline wattages from which delta watts are calculated will decline. These impacts may be small in 2012 but will grow as EISA is fully phased-in by 2015. PAs’ gross savings assumptions will need to be adjusted accordingly. For 2012 planning both Massachusetts and Rhode Island are accounting for the EISA standards by reducing their claimed measure life. This is done as a proxy for reducing the wattage reduction in each program year as most PAs’ cost-effectiveness screening tools do not cur-rently have that functionality.
Hours of UseMany PAs in the region assume that a CFL will operate for 2.8 hours per day, or 1,022 hours per year. This estimate is based on a 2009 evaluation of CFLs rebated by PAs in Massachusetts, Rhode

NORTHEAST RESIDENTIAL LIGHTING STRATEGY36
Island, and Vermont7. Note that this hours-of-use estimate is higher than the 1.9 hours per day estimate used in calculating the 2012-2020 Regional Savings Potential in Section 3. This value comes from more recent studies performed in California on a very large sample of households8,9.
Given the vintage of the 2009 study (based on hours of use metering in 2008) and the large increase in the number of CFLs in homes in the region since 2008, it may be time for the PAs in the Northeast to revisit their residential lighting hours of use assumptions.
Measure LifetimeEstimates of measure lifetime are critical savings variables. Measure lifetimes are used to calculate program and portfolio lifetime savings. Measure lifetimes are also used in deter-mining measure, program and portfolio cost effectiveness. The longer the measure lifetime the greater are the benefits from installing the measure. As discussed below, these benefits consist of the value of the avoided costs from a measure’s lifetime energy savings and the value of any deferred O&M.
Most PAs in the region assume a five to eight year lifetime for CFLs sold at retail10. For LEDs current claimed measure lifetimes are in the 18 to 20 year range. In this analysis CFLs are assigned a ten year lifetime to account for the lower hours of use assumption. Note that these lifetime assumptions, particularly those for LEDs, do not consider the likely impact of the second tier of EISA standards which has a “backstop” of 45 lumens per watt in 2020. This standard will significantly diminish, if not entirely negate, any post-2020 savings claims for CFLs and for LEDs. Most PAs, with the notable exception of Efficiency Vermont, have not comprehensively addressed this as part of their measure savings estimates or measure cost-effectiveness screening. Connecticut for its 2012 Conservation and Load Management Plan has reduced its residential LED measure lifetime assumption to 10 years to account for the 2020 EISA standard. Other PAs in the region should similarly revisit their CFL and LED lifetime assumptions.
Single vs. Multi-year PlanningOne approach to mitigating uncertainty in the planning process is to undertake multi-year planning. Such multi-year planning is done in Massachusetts, Rhode Island, Vermont, New Hampshire, and New York (NYSERDA). These multi-year plans typically provide some de-gree of certainty for PAs at the portfolio and sector level in terms of budgets and savings goals. However, these plans typically permit annual adjustments to allow re-allocation of budgets among programs. Such re-allocation of budgets also allows PAs flexibility to meet
7 Nexus Market Research, RLW Analytics and GDS Associates (2009). Residential Lighting Markdown Impact Evaluation. Pre-pared for Markdown and Buydown Program Sponsors in Connecticut, Massachusetts, Rhode Island, and Vermont
8 KEMA Inc. Final Evaluation Report: Upstream Lighting Program (Volume 1). Prepared for the CPUC Energy Division. Febru-ary 8, 2010
9 D&R International. Better Data, Better Design Market Insight. CFL Savings Take Another Hit. November 2011.
10 Nexus Market Research and RLW Analytics (2008). Residential Lighting Measure Life Study. Prepared for New England Residential Lighting Program Sponsors.

NORTHEAST RESIDENTIAL LIGHTING STRATEGY37
their annual and multi-year program savings goals. As noted below, development of specific net savings factors for residential lighting programs have been part of multi-year planning efforts in Vermont and Massachusetts. In Massachusetts these values have been adjusted in subsequent annual updates to the PAs’ Three-Year Plans.
Negotiated Net Savings Assumptions: Vermont, Massachusetts and Rhode IslandA related approach to lessen the uncertainty of estimating net savings from future program efforts is to negotiate key savings parameters upfront and to receive regulatory approval for these values. Such an approach provides greater certainty to PAs, particularly for multi-year planning. Such negotiations have occurred in Vermont, Massachusetts, and Rhode Is-land. For the latter two states these negotiations included the involvement of stakeholders prior to filing the PAs’ energy efficiency plans with regulators.
Vermont As a key component to its 2009-2011 Three Year Plan, EVT negotiated a series of net savings values for both standard and specialty CFLs sold through retail channels. These net savings values included assumptions of declining NTGRs and hours of use. EVT is currently in the process of developing similar net savings values for CFLs for its next Three Year Plan.
Massachusetts While the Massachusetts PAs were developing their first ever Three-Year Plan in 2009 (for the years 2010-2012) preliminary residential lighting NTGR results became available. These results indicated that the NTGR for CFLs had plummeted from over 1.3 to less than 0.4. As the residential lighting program comprised the single largest source of savings in the resi-dential sector, this was a cause of concern for the PAs as to how to apply these results to their Three Year Plan. To address this uncertainty the PAs negotiated NTGR values for the Three-Year Plan with consultants to the Massachusetts Energy Efficiency Advisory Council. For each of the three years consensus NTGRs were developed for planning and reporting purposes. While these values were used for 2010, they have been subsequently modified to better reflect current market conditions as well as more recent program evaluation results.
Rhode IslandInformed by the 2009 evaluation findings in Massachusetts, National Grid similarly negotiat-ed NTGR values for its 2010 and 2011 Energy Efficiency Plans with consultants to the Rhode Island Energy Efficiency Resource Management Council.
Benefit/Cost TreatmentUtility efficiency programs are subject to cost-effectiveness tests as part of the regulatory review of their efficiency plans. These tests quantify the costs and benefits of operating a program (or portfolio of programs). The tests can also be applied at the measure level. With the exception of pilot programs, it is expected that the benefits of a program will at least be equal to, if not greater than, its costs. The ratio of a program’s benefits to its costs

NORTHEAST RESIDENTIAL LIGHTING STRATEGY38
is its benefit/cost ratio (BCR). A BCR of 1.0 or greater means a program is cost effective. The two most prevalent cost effectiveness tests in the region are the total resource cost test (TRC) and the utility (or program administrator) test. The TRC test is the predominant test throughout the region with the exception of Connecticut. In Connecticut utilities are re-quired to use the utility test, but the utilities also screen their programs using the TRC test.
In both tests the benefits of saved energy are evaluated at the avoided cost of the saved energy. These avoided costs represent projections of the future marginal cost of energy. However, there are a number of key differences between the tests. Specifically:
• Utility Testo Costs: Only the costs incurred by the PA to administer the program are quantified.
These include incentives, marketing, PA staff and overhead, evaluation, etc. No participant costs are included.
o Benefits: Only the avoided costs benefits from the saved energy that the utility sells are quantified. For example, in Connecticut the electric utilities do not include any benefit from saved oil in their utility test calculations.
• TRCo Costs: All costs incurred by both the PA and participants are quantified. This includes
the full measure cost, including any installation and O&M costs where appropriate.
o Benefits: The benefits in the TRC test are considerably broader than in the utility test. These benefits include the savings from all resources: all fuels and water. They also include any deferred O&M costs. For lighting measures and programs this ben-efit can be substantial. Longer lived CFLs and LEDs incur O&M benefits from the de-ferred costs associated with incandescent lamps that would have been installed. In some states non-energy benefits (NEBs) can also be included in the TRC. These may include health and comfort benefits, emission reduction benefits, etc. For some mea-sures these NEBs can be substantial, even larger than a measure’s energy benefits.
Typically residential lighting programs have easily passed both the utility test and the TRC test. Recently, TRC BCRs for lighting programs have often been in 2.0 to 5.0 range. These program BCRs are usually the highest of all residential sector programs. However, lighting program BCRs will likely fall over the next several years. There are two main contributors to this decline. First, both annual and lifetime savings per unit will decrease for many lighting measures due to declining delta watts and measure lifetime assumptions. Second, as PAs increase the number of LEDs promoted in their programs the total costs to both PAs and participants will increase significantly. While LED incentives are expected to fall over time, the average LED incentive is expected to exceed that for CFLs over the 2012-2020 timeframe. This expected increase in PA program costs is further examined in Section 3: 2012-2020 Regional Lighting Savings Potential.

NORTHEAST RESIDENTIAL LIGHTING STRATEGY39
While lighting programs will likely continue to be cost effective for at least the next sev-eral years, if not through the end of the decade, there has been increased discussion in the Northeast as to whether some modified version of the utility test might be a better indica-tor of cost effectiveness. Parties, including some PAs, have proposed that this modified test would include all resource benefits – all energy and water savings - in the BCR numerator. One argument made for this alternative test is that while the TRC includes all costs, it rarely includes all benefits. Either NEBs are not allowed to be included in the test, or the NEBs are not adequately and fully quantified11.
Evaluation, Measurement & Verification (EM&V) Efforts and Data NeedsSavings attributable to lighting programs are subject to evaluation and subsequent adjust-ment as the key savings parameters discussed above are modified. Lighting program impact evaluations typically focus on net to gross ratios and hours of use. Measuring these param-eters is both time consuming and expensive. Increasingly, measurement of net to gross ratios requires collecting data from non-program areas to help determine what effect PAs’ programs have on customer lighting choice. These data requirements typically include in-home socket saturations and retail lamps sales. As a result the cost for these NTGR studies have become increasingly expensive.
PAs in multiple states in the region have been working together to address the high, and in many cases increasing, costs for lighting program evaluation. This has been the case for both recent NTGR and hours of use metering studies. The Regional EM&V Forum has also served as a means to indentify and implement multi-state evaluation activities, with residential lighting recently being an area targeted by this group. Going forward, regional evaluation activities should consider joint studies such as socket saturation and customer satisfaction surveys to inform progress towards the 90% socket saturation goal.
Obtaining retailer sales data is an important data need to support both evaluation efforts and alternative program designs such as the market lift model described above. Histori-cally, retailers have been reluctant to share comprehensive sales data with PAs to assist them with their evaluation and program implementation efforts. They do provide sales data to document invoicing for upstream promotions, but these data are limited to only those efficient products receiving PA incentives. Retailers often cite confidentiality concerns, as well as the challenge of working with multiple PAs in multiple states.
Recently, there have been efforts by third parties such as D&R International to serve as an intermediary between retailers and PAs to collect and provide comprehensive sales data. D&R International’s Better Data Better Design effort is working with both PAs and retailers to collect sales data to support early market lift efforts. In the Northeast PAs in Massachu-setts, Rhode Island, Vermont, as well as NYSERDA, are considering implementing market
11 Is it Time to Ditch the TRC? Proceedings of ACEEE 2010 Summer Study on Energy Efficiency in Buildings, Volume 5. Chris Neme and Marty Kushler.

NORTHEAST RESIDENTIAL LIGHTING STRATEGY40
lift program components in 2012 to supplement their current upstream program activities. The Regional EM&V Forum is coordinating with D&R’s Better Data Better Design Residential Market Lift project in 2012 which includes obtaining sales data for lighting products in the participating states.
teChNology status: PriCe, effiCaCy, fuNCtioNality aNd availability
Each of the lighting technologies discussed in this report varies in a number of key attri-butes that will affect its near and long term market acceptance. Most notably, the price and availability of LEDs represents a very significant near-term barrier to wider acceptance. While there were over 290 ENERGY STAR qualified LED replacement lamps as of early Oc-tober 2011, only six were the common A-lamp form factor that most consumers purchase. Further, four of these were 40 watt (450 lumens) equivalents and only two were 60 watt equivalents. Currently there are no ENERGY STAR rated 75 watt equivalent A-lamps, though models are expected in late 2011 or in early 2012. Over 80 percent of the available ENERGY STAR rated LEDs are reflector lamps; taking advantage of the directional, point source na-ture of LEDs.
Retail prices for ENERGY STAR labeled LEDs range from approximately $25 to over $50, de-pending on the wattage and lamp type. In comparison, the cost of standard CFLs approach-es $2.00 or less per lamp when purchased in multipacks, while specialty CFLs can cost as much as $15 for a dimmable reflector lamp. EISA compliant halogens are currently in the $0.55 to $2.50 range. While current prices provide some indication of market acceptance it is expected that prices for several of these technologies will change over the next few years. CFL prices are expected to increase somewhat in the near term – and already have for some models – due to dramatic increases in the cost of rare earth elements which are used in CFL phosphors. Conversely, LED prices have continued to decrease and this decline is expected to continue for the foreseeable future.
Figure 1-4 shows a projection of expected A-Lamp LED performance and product avail-ability through 2015. It is worth noting that in its 2011 Multi-Year Program Plan (MYPP) for the commercialization of solid state lighting that DOE moved forward its projected LED replacement lamp price declines by two years compared to the prior 2010 MYPP12.
LED prices are declining rapidly and will continue to do so for several years, though the exact rate of this decline can only be estimated.
Comparisons of the four key lighting technologies are presented in Table 1-7. Price informa-tion was current as of mid-2010. More detailed background on CFLs and LEDs is provided in Appendices A and B, respectively.
12 Lighting Research and Development Building Technologies Program, Office of Energy Efficiency and Renewable Energy, U.S. Department of Energy. Solid-State Lighting Research and Development: Multi Year Program Plan. March 2011 (Updated May 2011).
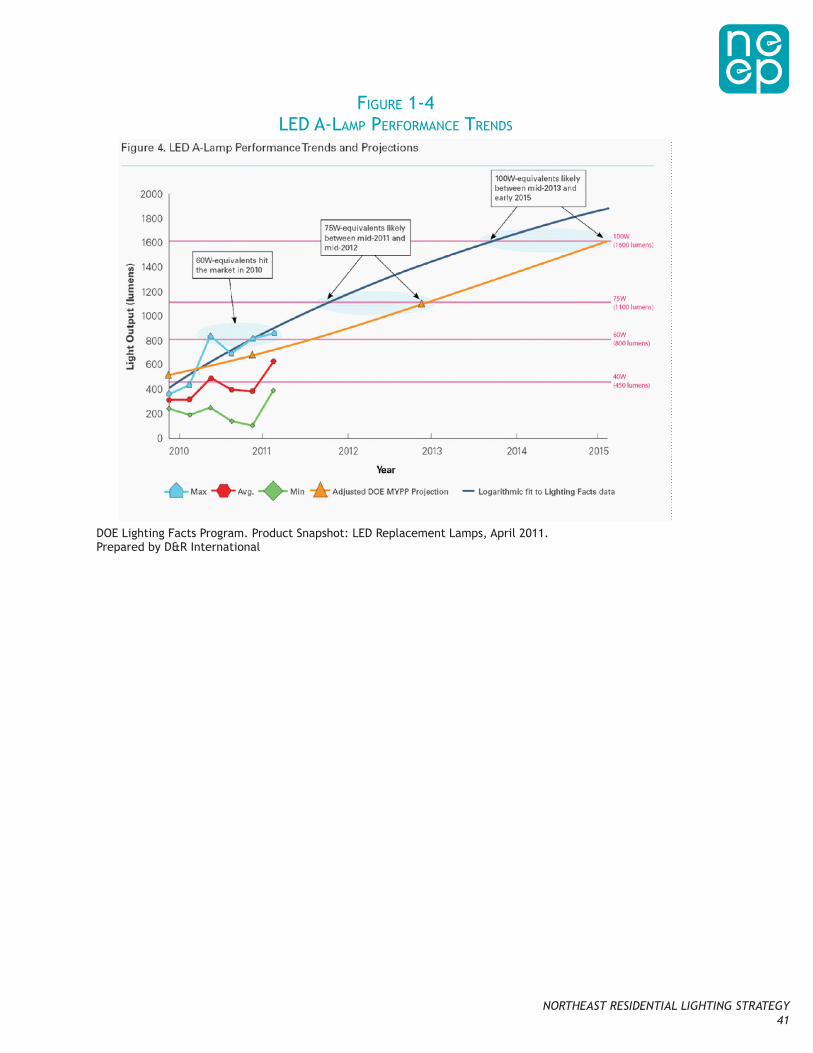
NORTHEAST RESIDENTIAL LIGHTING STRATEGY41
figure 1-4led a-laMP PerforMaNce treNds
DOE Lighting Facts Program. Product Snapshot: LED Replacement Lamps, April 2011. Prepared by D&R International

NORTHEAST RESIDENTIAL LIGHTING STRATEGY42
table 1-7coMParisoN of lightiNg techNologies
EISA Halogen IR Halogen CFL LED
General technology pros
Low cost first; famil-iar aesthetics
Familiar aesthetics; 1:1 replacement for nearly all current general service incandescents with equivalent output
High efficacy; long life
Highest theoretical efficacy; long life; durable
General technology cons
Dimmer than stan-dard incandescent lamp it replaces; small gain in lu-mens/watts
Higher first cost; not yet available across the full lumen range and in a wide vari-ety of shapes and sizes
Dimming in very low lumen ranges can suffer from flicker-ing; control circuit/ballast may contain hazardous materials; flourescent tech-nologies require the use of mercury
High price point. Higher lumen ranges currently not avail-able; heat man-agement; control circuits are temper-ature sensitive and may contain hazard-ous materials
Commercilization status (limitations in wattages and/or lamp types)
Commercialized in 40, 60, 75 and 100 watt replacements
Commercialized in 60 and 100 watt replacments; 2x versions expected in 75 and 100 watt replacement by late 2011
Dimmable can-dleabra base lamps not currently avail-able
Currently only avail-able for lower lumen ranges; maximum lumen output com-mercially available is currently around 1000 lumens
Commercial availability
Products available from all 3 major manufacturers and some smaller ones
Philips Halogena Energy Saver today; other models pend-ing
5,099 products on ENERGY STAR quali-fied products list (10/10/11)
293 ENERGY STAR qualified LED replacement lamps (10/5/11); A-Shape: 6Globe and Candle: 37Reflector: 2503,493 products on the Lighting Facts list (10/5/11).
Form factor: weight and size
Typically identical form factor to stan-dard A-lamp; similar weight
Similar form factor to standard A-lamp; similar weight
Small products com-patible with most fixtures
Small products com-patible with most fixtures; heat sinks increase weight of high wattage products
Lifetime (hrs) 1000-2000 Typically 1000-3000; 2x will offer repla-cable capsules to minimize total cost of ownership
Distribution EN-ERGY STAR CFLs by lifetime: 6000 hrs - 2%8000 hrs - 19%100000 hrs - 22%12000 hrs - 49%15000 hrs - 8%
25000-50000

NORTHEAST RESIDENTIAL LIGHTING STRATEGY43
EISA Halogen IR Halogen CFL LED
Current efficacy (lumens/watts)
13.1 (mod spec) to 18.3
20 (Halogena Energy Saver) to 26.7 (2x, when available)
Varies by lamp type: Bare Medium Base = 55-80Covered Medium Base = 40-80Reflectors = 35-65Bare Candleabra Base = 55-70Covered Candleabra Base = 35- 60
Varies by lamp type: Omnidirectional = 26-90 Directional = 8-105Decorative = 12-75Lighting Facts: 10-100 (Median = 45)
Projected 2015 efficacy (lumens/watts)
13.1 to 18.3 26.7 No change MYPP 2011: Lumi-naire efficacyWarm-white: 139 lm/WLighting Facts A19 lamp efficacy linear projection: 160 lm/W
2011 Price $0.55 to $2.50/bulb $3.00 to $4.50/bulb (2x will launch later that year at ~ $3.00 in brighter configu-rations
Varies by lamp type and channel; Bare Medium Base = $1.00 to $3.00See figures from CLF MP
450 lumen = ~$20.00800 lumen = ~$40.00
Projected 2015 Price
$0.50 to $1.25/bulb $2.00/bulb 20% increase 450 lumen = $4.50800 lumen = $8.00
Control compatibility
Fully compatible with existing con-trols
Fully compatible with existing con-trols
Majority are on/off compatible only; small number are 3-way or dimmable compatible; true dimmable now avail-able from TCP
Over half of prod-ucts are dimmable; not always compat-ible with installed base of dimmers
Color temperature 2800-2900 K 2800-2900 K CCT in all catego-ries; 100% within 7 MacAdam Ellipse Steps; CRI: 80-87
CCT in all catego-ries; CRI: 80-87; generally only lower CCT lamps have higher CRI
Major manufacturers
Philips, Osram Syl-vania, GE, Bulbrite, Satco
Philips, TCP/ADLT FEIT, GE, Osram Syl-vania, Philips, TCP, MaxLite
LEP Chip/Pack-age: Cree, Philips, Nichia, Seoul Semi-conductor, Epistar, SylvaniaLED A-Lamp: Philips, Osram Sylvania, Lighting Science Group, GE
Environmental/disposal considerations
None None Requirements vary by state; recycling recommended or required due to materials on control circuits and mercury in tube
No requirments; recycling recom-mended due to materials on control circuits

NORTHEAST RESIDENTIAL LIGHTING STRATEGY44
sectioN 2:
2012-2020 regioNal lightiNg saviNgs PoteNtial
regioNal aNd state level saviNgs estimates
Figure 2-1 provides an estimate of regional residential lighting savings potential for 2012 through 2020 based on the implementation by PAs of strategies and recommendations pro-posed in the RLS. Savings are expressed on an annualized or first year savings basis. The estimated net savings peak in 2012 at 514 GWh and decline over the forecast period. Both free-ridership and spillover are used to adjust gross savings estimates to derive these net savings estimates. As a point of comparison, 2011 regional lighting savings from retail-based efficiency programs is estimated to be 598 GWh based on filed PA program plans. However, the estimates calculated in this RLS use more conservative assumptions for a number of key variables than are used by PAs in their filed 2011 efficiency plans. As a result the two savings estimates are not directly comparable.
figure 2-1regioNal saviNgs estiMates froM iMPleMeNtatioN of recoMMeNded rls strategies
CFLs constitute the majority of savings through 2015 (Figure 2-1). Beginning in 2016 sav-ings from LEDs (196 GWh) exceed that of the combined savings from standard and specialty CFLs (192 GWh). The contribution of LEDs to the total residential savings potential grows over time and remains relatively constant from 2015 through 2019 reflecting greater prod-uct availability, declining incremental costs, and higher net savings relative to comparable CFLs due to lower free-ridership assumptions. CFL savings fall over the analysis period, particularly those for standard CFLs, which incur higher assumed free-ridership adjust-

NORTHEAST RESIDENTIAL LIGHTING STRATEGY45
ments than do either specialty CFLs (such as reflector, dimmable, and three-way CFLs) or LEDs. Program savings drop to zero in 2020 as the second tier of EISA standards become effective in 2020 requiring that nearly all lamps attain efficiencies equivalent to current CFL or LED lamps.
While this RLS includes a recommendation that PAs consider the promotion of highly ef-ficient halogen lamps – so-called 2x and 3x halogens – savings from this technology have not been explicitly included in the estimate of regional lighting savings. Comments from several PAs on the RLS Leadership Group raise questions as to the likelihood that they will promote this technology in the near-term. If this position changes, the RLS savings esti-mates will be updated and revised.
table 2-1first year (aNNual) saviNgs (gWh) froM Pa PrograM activity
2012 2013 2014 2015 2016 2017 2018 2019 2020Standard CFL 306 195 110 69 44 25 12 6 - Specialty CFL 186 223 202 148 148 103 82 41 -
LED 22 53 80 184 196 214 220 201 - Total GWh 514 471 392 401 389 342 315 248 -
Number of iN-Program ProduCts Promoted by Pa Programs
The savings presented above are based on the continued – and for some PAs increased – mod-erately aggressive support for CFLs for at least several more years, including the 2012-2014 period covered by the phase-in of the EISA lamp standards. Table 2-2 shows the assumed number of efficient lamps supported by PA retail-based programs over the nine year (2012-2020) analysis period. It is not until 2016 that the number of LEDs promoted by PA programs exceeds that of spiral CFLs. The approximately two lamps per household per year assumed for most of the analysis period is higher than the current average regional level of PA pro-gram support, but less than what both Vermont and Connecticut plan to support in 2011.

NORTHEAST RESIDENTIAL LIGHTING STRATEGY46
table 2-2assuMed NuMber of PrograM-suPPorted efficieNt laMPs Per household
2012 2013 2014 2015 2016 2017 2018 2019 2020Standard
CFL1.40 1.20 1.00 0.80 0.60 0.40 0.20 0.10 0.00
Specialty CFL
0.50 0.60 0.70 0.60 0.60 0.50 0.40 0.20 0.00
LED 0.05 0.15 0.30 0.60 0.80 1.00 1.20 1.30 0.00
2.0 2.0 2.0 2.0 2.0 1.9 1.8 1.6 0.0
estimated aNNual Program iNCeNtive CostsHowever, to achieve these savings, PA lighting program budgets will need to more than double as shown in Figure 2-2. Total PA incentive budgets are projected to increase from $60 million in 2012, peak at $136 million in 2016, and then decline to $92 million in 2019. Note that Figure 2-2 provides a projection of program incentive costs; the main component of lighting program budgets. Total program costs are likely to increase somewhat less dra-matically as non-incentive program costs will not generally increase at the same rate as incentives. The incentive budgets below are driven primarily both by the increasing number of LEDs supported by the programs and by the higher incentives that are assumed necessary to promote LEDs. LED incentive budgets increase from $13 million in 2012, peak at $104 million in 2015, and then decline to $83 million in 2019. Estimated LED incentives first ex-ceed those for CFLs in 2014, while the number of LEDs supported by PA programs does not exceed that for CFLs until 2017.
figure 2-2

NORTHEAST RESIDENTIAL LIGHTING STRATEGY47
The total PA incentive costs below assume that the average incentive for LEDs does not exceed 70 percent of incremental cost. ENERGY STAR LED retail lamp prices are assumed to decline from an average of $30 per lamp in 2012 to $5 in 2020. The assumed incentive amounts paid per unit by PAs in each year are presented in Table 2-3.
table 2-3estiMated Per laMP Pa iNceNtives
2012 2013 2014 2015 2016 2017 2018 2019 2020Standard
CFLs$1.33 $1.26 $0.88 $0.71 $0.73 $0.74 $0.75 $0.77 $0.00
Specialty CFLs
$3.50 $3.50 $2.63 $2.45 $2.45 $2.45 $2.45 $2.45 $0.00
LEDs $20.58 $18.76 $16.80 $13.30 $9.80 $6.30 $6.30 $4.90 $0.00
Cost Per aNNual aNd lifetime KWh saved
An important metric of program effectiveness is the PA cost to generate a kWh of savings. Lighting programs have typically had the lowest cost per kWh of savings of any residential program, sometimes by as much as an order of magnitude. This is particularly the case in the Northeast where residential retrofit and new construction programs save oil and natural gas, but less electricity given low saturations of electric heat and central cooling, and the region’s low full load cooling hours.
The cost to PAs per saved lighting kWh is expected to increase significantly over the analysis period (Figure 2-3) rising from $0.12 per first year kWh in 2012 to $0.37 per first year kWh in 2019. The costs used in these calculations are program incentive costs; total program costs would yield a proportionately higher cost per saved kWh. The rising cost for lighting savings is a function of several factors:
• Increasing LED and decreasing CFL unit numbers over the analysis period (Table 2-2)
• Higher per unit incentives for LEDs and specialty CFLs relative to standard CFLs (Table 2-3)
• Decreasing per unit savings for all lamp types due to lower baseline wattages (EISA) and lower net-to-gross ratios (Tables 2-4 through 2-6). Both factors results in lower net savings per lamp.
Note that the values in Figure 2-3 provide a PA perspective on the cost to attain savings from the promotion of efficient lighting. Consumer economics may be very different due to additional factors such as O&M savings generated by the longer lifetimes of CFLs and LEDs.
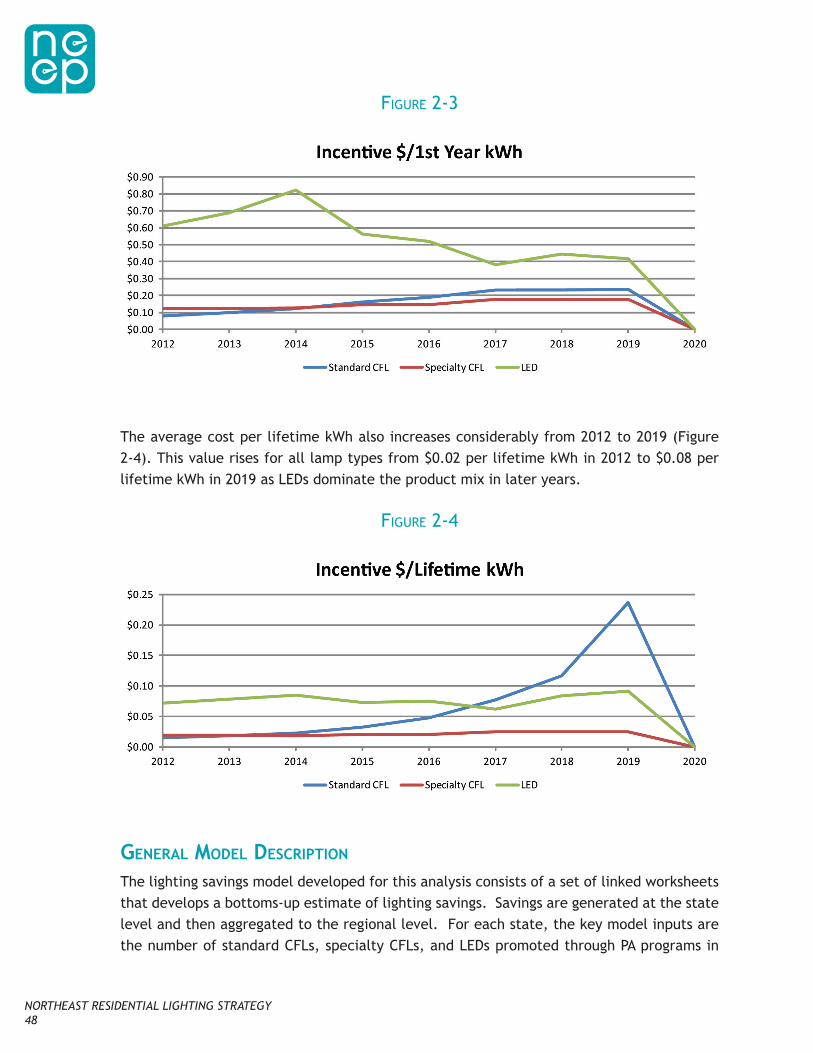
NORTHEAST RESIDENTIAL LIGHTING STRATEGY48
figure 2-3
The average cost per lifetime kWh also increases considerably from 2012 to 2019 (Figure 2-4). This value rises for all lamp types from $0.02 per lifetime kWh in 2012 to $0.08 per lifetime kWh in 2019 as LEDs dominate the product mix in later years.
figure 2-4
geNeral model desCriPtioN
The lighting savings model developed for this analysis consists of a set of linked worksheets that develops a bottoms-up estimate of lighting savings. Savings are generated at the state level and then aggregated to the regional level. For each state, the key model inputs are the number of standard CFLs, specialty CFLs, and LEDs promoted through PA programs in

NORTHEAST RESIDENTIAL LIGHTING STRATEGY49
each year. These values are inputted on a per household basis (Table 2-2). These values can be customized for each state to reflect likely future program activities, as well as any budgetary considerations.
The model and calculated savings currently assumes identical levels of PA lamp penetration on a per household basis for each of the seven states in the region. PAs were given the op-portunity to comment on the initial lamp/household values used in earlier iterations of the savings analysis. NEEP received limited comments on the assumed efficient lamp penetra-tion rates. Figure 2-5 shows state level first year net savings. However, as the assumed lamp penetration rates are identical for each state, any differences in savings are only a function of differences in household numbers.
Savings are then calculated based on the number of lamps of each type promoted in each year times the estimated savings per lamp. The savings per lamp values, which can change in each year, are explained in more detail below.
figure 2-5regioNal saviNgs estiMates - by state -
froM iMPleMeNtatioN of recoMMeNded rls strategies

NORTHEAST RESIDENTIAL LIGHTING STRATEGY50
Possible differeNCes With Pa sCreeNiNg aPProaChes
During discussions of draft presentations of the RLS savings results, questions arose as to the comparability of the input values, analysis approach, and results to those that are gen-erated by the PAs’ cost-effectiveness screening models. Possible differences between the RLS analysis and that done by PAs as part of their measure and program cost-effectiveness screening include:
• Most PA screening tools do not vary measure characteristics, e.g., savings or incen-tives, when screening multiple program years. The RLS savings model allows for all key lamp variables to be changed during each year of the analysis.
• As noted, the cost per saved kWh in the RLS analysis only includes incentive costs. PA screenings include all program costs. Including all program costs would raise the cost per saved energy values by approximately 25-35%.
• Most PAs in the region determine measure and program cost effectiveness using some variant of the total resource cost test or societal test. In both tests, the total of both PA and net (after incentive) customer costs are used. Including customer costs in these tests allows for the higher costs of longer-lived CFLs and LEDs to be offset by reduced O&M costs due to fewer lamp replacements. In the RLS analysis, only PA costs are considered. This is more consistent with the utility cost or program administrator tests that is used (along with the TRC test) in Connecticut and, until recently, in Rhode Island.
other model Caveats
The model does not directly calculate stock turn-over for the various lamp technologies in place each year. Thus, the model does not explicitly consider that some efficient lamps may be used to replace failed existing CFLs. However, the 0.85 in-service rate used for standard CFLs is an intentionally conservative estimate and should be considered as accounting for this model limitation.
limitatioNs of model aNd outPuts
The savings and cost estimates from the regional RLS savings model are driven by a large number of assumptions that are detailed in this section. Some of these assumptions are dependent largely on future PA program implementation decisions, such as proposed level of program activity (lamps per household per year, or total lamps supported per program year) and incentive levels. Other input assumptions are influenced by broader market considerations that are not entirely in the control of PAs such as net to gross ratios. Even PA-determined incentive levels will be heavily influenced by the actual costs of products, particularly LEDs, in future years.

NORTHEAST RESIDENTIAL LIGHTING STRATEGY51
NEEP Sponsors have the ability to develop revised savings and cost estimates on their own by adjusting any of the state or technology-specific inputs in the RLS savings model. Further, NEEP expects to continue to refine these RLS savings and cost estimates as better and/or more current data become available.
Key rls saviNgs aNd Cost assumPtioNsKey assumptions for each of the three technologies modeled in this analysis are presented in Tables 2-4 through 2-6. These values were derived by integrating information from a number of resources, including but not limited to:
• Current PA planning assumptions and program activity levels• Current and planned PA incentive levels• Recent PA lighting program evaluation results, including those from outside the region• DOE’s CFL and LED Market Profiles• DOE’s 2011 SSL Multi-Year Program Plan (MYPP)• Draft EPA Residential Lighting White Paper• Comments from RLS Leadership Group

NORTHEAST RESIDENTIAL LIGHTING STRATEGY52
table 2-4staNdard cfl ModeliNg iNPuts
Baseline Technology Inputs
2012 2013 2014 2015 2016 2017 2018 2019 2020
Baseline Description/Adjustments
100W - 72 W
75W - 53W
60W-43W, 40W-29W
Halo-gen
Halo-gen
Halo-gen
Halo-gen
Halo-gen
CFL
Baseline Watts 64.3 59.1 52.6 48.7 48.7 48.7 48.7 48.7 16.7
Baseline Cost $0.60 $0.70 $1.00 $0.98 $0.96 $0.94 $0.92 $0.90 $2.00
Efficient Technology InputsEfficient Description
CFL CFL CFL CFL CFL CFL CFL CFL CFL
Efficient Watts 16.7 16.7 16.7 16.7 16.7 16.7 16.7 16.7 16.7
Efficient Cost $2.50 $2.50 $2.50 $2.50 $2.50 $2.50 $2.50 $2.50 $2.50
EM&V InputsHours per Year 694 694 694 694 694 694 694 694 694
Measure Life 10 10 10 10 10 10 10 10 10
NTG Ratio 0.60 0.50 0.40 0.35 0.30 0.25 0.25 0.25 0.00
ISR (if applicable)
0.85 0.85 0.85 0.85 0.85 0.85 0.85 0.85 0.85
Program Planning InputsIncentive per Unit
$1.33 $1.26 $1.05 $1.06 $1.08 $1.09 $1.10 $1.12 $0.35
Incremental Cost
$1.90 $1.80 $1.50 $1.52 $1.54 $1.56 $1.58 $1.60 $0.50

NORTHEAST RESIDENTIAL LIGHTING STRATEGY53
table 2-5sPecialty cfl ModeliNg iNPuts
Baseline TechnologyInputs
2012 2013 2014 2015 2016 2017 2018 2019 2020
Baseline Description
Inc Inc Inc/BR Std
Inc/BR Std
Inc/BR Std
Inc/BR Std
Inc/BR Std
Inc/BR Std
Inc/BR Std
Baseline Watts 76.5 76.5 70.0 70.0 70.0 70.0 70.0 70.0 70.0
Baseline Cost $3.50 $3.50 $4.50 $4.50 $4.50 $4.50 $4.50 $4.50 $4.50
Efficient Technology InputsEfficient Description
CFL CFL CFL CFL CFL CFL CFL CFL CFL
Efficient Watts 19.1 19.1 19.1 19.1 19.1 19.1 19.1 19.1 19.1
Efficient Cost $8.50 $8.50 $8.50 $8.50 $8.50 $8.50 $8.50 $8.50 $8.50
EM&V InputsHours per Year
694 694 694 694 694 694 694 694 694
Measure Life 10 10 10 10 10 10 10 10 10
NTG Ratio 0.80 0.80 0.70 0.60 0.60 0.50 0.50 0.50 0.50
ISR (if applicable)
0.90 0.90 0.90 0.90 0.90 0.90 0.90 0.90 0.90
Program Planning InputsIncentive per
Unit
$3.50 $3.50 $2.80 $2.80 $2.80 $2.80 $2.80 $2.80 $2.80
Incremental
Cost
$5.00 $5.00 $4.00 $4.00 $4.00 $4.00 $4.00 $4.00 $4.00

NORTHEAST RESIDENTIAL LIGHTING STRATEGY54
table 2-6led ModeliNg iNPuts
Baseline Technology Inputs
2012 2013 2014 2015 2016 2017 2018 2019 2020
Baseline Description
100W - 72 W
75W - 53W
60W-43W, 40W-29W
Halo-gen
Halo-gen
Halo-gen
Halo-gen
Halo-gen
CFL
Baseline Watts 64.3 59.1 52.6 48.7 48.7 48.7 48.7 48.7 16.7
Baseline Cost $0.60 $0.70 $1.00 $1.00 $1.00 $1.00 $1.00 $1.00 $2.00
Efficient Technology InputsEfficient Description
LED LED LED LED LED LED LED LED LED
Efficient Watts 21.6 21.6 21.6 12.9 12.9 12.9 12.9 12.9 9.2
Efficient Cost $30.00 $27.50 $25.00 $20.00 $15.00 $10.00 $10.00 $8.00 $5.00
EM&V InputsHours per Year 694 694 694 694 694 694 694 694 694
Measure Life 20.0 20.0 20.0 20.0 20.0 20.0 20.0 20.0 20.0
NTG Ratio 1.20 1.10 1.00 1.00 0.80 0.70 0.60 0.50 0.40
ISR (if applicable)
0.95 0.95 0.95 0.95 0.95 0.95 0.95 0.95 0.95
Program Planning InputsIncentive per Unit
$20.58 $18.76 $16.80 $13.30 $9.80 $6.30 $6.30 $4.90 $2.10
Incremental Cost
$29.40 $26.80 $24.00 $19.00 $14.00 $9.00 $9.00 $7.00 $3.00

NORTHEAST RESIDENTIAL LIGHTING STRATEGY55
regioNal saviNgs estimates from attaiNiNg a 90 PerCeNt effiCieNt lightiNg soCKet saturatioN
The above discussion of savings and costs is explicitly focused on the projected lighting pro-gram activities of PAs from 2012 through 2019. However, this discussion does not capture the full savings from all efficient lighting products expected to be installed over this time-frame. Some portion of household sockets will be filled outside of PA efforts. The energy and dollar savings discussed below are based on attaining the overall RLS objective of a 90 percent socket saturation of efficient lighting. Figure 2-6 shows how the regional 2012-2020 efficient lighting socket saturation is projected to change to reach this 90 percent efficient socket goal.
figure 2-6
Achieving this 90 percent efficient socket saturation in New England and New York would reduce household lighting consumption by 47 percent and save on average 636 kWh per year or $111 per household13. At the regional level, the cumulative annual savings by 2020 will amount to 43,800 GWH hours and cumulative first year demand savings of 837 MW, and reduce projected carbon emissions by over 25 million metric tons. The annual energy sav-ings in 2019 would be equivalent to the energy usage of nearly 1.2 million households (Nine percent of the households in the Northeast). The demand savings is equivalent to displacing over two 500 MW combined cycle power plants at an assumed 75 percent capacity factor. Finally, the projected carbon emissions would equate to removing almost five million cars from the road for a year14.
13 Based on a $0.175/kWh regional average residential rate. Average Price by State by Provider, 1990-2010. Energy Information Agency
14 http://www.epa.gov/cleanenergy/energy-resources/refs.html#vehicles

NORTHEAST RESIDENTIAL LIGHTING STRATEGY56
As detailed above, efficiency Program Administrator (PA) costs to promote a broader range of new efficient lighting products will be higher than current programs costs. Additionally, increased market adoption of a broader array of efficient products will provide significant costs savings compared to reliance on products that minimally meet new federal lighting standards – providing cumulative cost savings net of PA incentive costs of over $6.8 billion through the end of 2019.

NORTHEAST RESIDENTIAL LIGHTING STRATEGY57
recoMMeNdatioNs:
key strategies aNd criteria for success of the rls
iNtroduCtioN
Summarized in Table 3-1 and then discussed in greater detail are a series of recommenda-tions to achieve the large residential lighting potential that will continue to be available in the Northeast through 2019. These recommendations are to inform all stakeholders that are expected to have an active role in the future direction of residential lighting in the re-gion: PAs, manufacturers, retailers, regulators, and other regional and national stakeholder groups like NEEP, ENERGY STAR, DOE, the LUMEN Group, etc.
Recommendations are given over two timeframes to better inform how interested stake-holders should best devote their resources. Recommendations are provided for the near term (2012-2014) and for the longer term (2015-2020).
NEEP recognizes that the ability of PAs to fully implement the RLS will be contingent on funding levels and regulatory approval. Further, the recommendations below are informed by the best available information on the likely direction of residential lighting technology development and commercialization, future product pricing, etc. These factors may evolve at a pace different than assumed in this document. As discussed below, NEEP views this RLS as the beginning of an on-going process to continue to help monitor the market for residen-tial lighting, and to refine the RLS and the recommendations below over time.
Also put forward in this section are a number of outcomes and criteria that can be used by stakeholders to assess the relative success of the implementation of the proposed regional Residential Lighting Strategy.

NORTHEAST RESIDENTIAL LIGHTING STRATEGY58
Key strategies aNd reCommeNdatioNs
CFLsAggressively support CFLs through retail products, income eligible, existing homes, and new construction programs to maintain residential lighting savings levels. Given expect-ed product availability and most importantly pricing, PAs, retailers, manufacturers and others should continue to focus on the continued promotion of CFLs in the near-term. EISA standards will not establish CFLs as the baseline for residential lighting either in the 2012-2014 timeframe during which the EISA standards will be phased in, or post 2014 when the first tier of EISA standards will be in effect. Rather, the marketing of new EISA compliant halogens as “efficient” may serve as a barrier to efforts to continue to convince consumers to purchase and install CFLs.
Key near term strategies and considerations regarding the continued promotion of CFLs include:
1. PAs target standard CFLs given current moderate (25-35 percent) efficient lighting socket saturations in the region. Standard CFLs, even with lowered NTG ra-tios, will continue to be the most cost efficient lighting technology for PAs to promote in the near term.
2. PAs ramp-up specialty CFL sales to target appropriate customer applications. This recommendation is predicated in part on assumed higher NTG ratios for specialty CFLs and declining proportions of sockets that can be filled by standard CFLs. However, LEDs will most likely first compete against specialty CFL applications, particularly reflector and dimming CFLs, because of their directional light distribution patterns, better dimming characteristics, and the higher cost of specialty CFLs relative to standard CFLs. PAs should monitor the market for these LED products and adjust their specialty CFL promotional ef-forts accordingly.
3. Manufacturers and PAs communicate and work with builders, electricians and electrical supply houses on how best to use CFLs to meet building energy code lighting efficiency requirements. The 2009 and 2012 editions of the residential IECC promote, and in the 2012 version require, the installation of efficient lighting. Manufacturers and PAs should work together to inform the affected stakeholders of these changes well in advance to ensure that efficient and quality lighting is installed in new homes. These ef-forts may include the provision of design guidelines that specifically address the lighting characteristics of CFLs and CFL fixtures in new construction.
4. PAs monitor pricing of CFLs given expected increase in phosphor pricing; adjust incentives levels as needed. During the development of this RLS all of the major CFL manufacturers announced increases in CFL prices due to the dramatic rise in the price of rare earth materials – mostly coming from China – needed to produce the phosphors

NORTHEAST RESIDENTIAL LIGHTING STRATEGY59
used in CFLs. Price increases in the 15-25 percent range are expected for standard CFLs; somewhat less for specialty CFLs. To maintain or to increase current standard CFL market penetrations may require that PA incentives be increased.
5. Retailers expand CFL recycling efforts. Many, if not most retailers, participating in PA programs already offer CFL recycling. Efforts should continue to make consumer recycling of available at an increasing number of participating retailers.
Longer term strategies and considerations related to the continued promote of CFLs include:1. PAs decrease emphasis on CFLs as LEDs become increasingly available and at
lower prices. PAs will need to carefully monitor the market to continually assess LED product availability and pricing. The transition to LEDs will also be informed by updated estimates of CFL NTG ratios which will affect CFL net saving claims, cost-effectiveness and net benefits relative to LEDs.
2. PAs phase-out of support for reflector (directional) CFL lamps may occur first given performance, cost and availability considerations. As noted above, LEDs may be able to best compete “against” CFLs for consumer dollars in this product category.
Alternative program/promotional designsPursue alternative program and promotional approaches and/or markets to limit free-ridership concerns. One of the challenges facing the continued promotion of CFLs is the concern over falling NTG ratios for CFLs, particularly standard CFLs. While there are some indications that CFL NTG ratios may have stabilized in the near term, the RLS does assume that CFL NTG values will fall over time. To reduce CFL NTG concerns, and possibly LED NTG concerns in the longer term, PAs should pursue alternative program designs that may potentially limit the impact of free-ridership on PAs’ net savings claims. These efforts are seen as complementing PAs’ current, traditional upstream incentive efforts.
In the near term:
1. PAs implement strategies such as market share and/or market lift with industry support, i.e., provision of required sales data. These efforts reward industry partners for the incremental increase in the sale of efficient lighting products. Such efforts typi-cally require the provision of both historic and current sales data from participating and non-participating stores. The requirement for the provision of such sales data may limit the number of retailers that participate in such alternative program strategies.
2. PAs work together and with other interested stakeholders to develop and adopt consistent approaches of evaluating program impacts, such as through Regional EM&V Forum protocol development. Ideally, PAs in the region will develop consistent approach-es to both establishing baseline sales and to measuring net savings from these alternative program activities. NEEP can facilitate such efforts through the EM&V Forum.

NORTHEAST RESIDENTIAL LIGHTING STRATEGY60
3. PAs seek up-front regulatory engagement/ approval as needed. The proposed alternative program strategies assume that there is an agreed to baseline in sales above which program savings are claimed. For some proposed program models, this baseline is based on sales in non-program areas. Some PAs may prefer to obtain prior regulatory ap-proval before pursuing such program approaches.
4. PAs target hard-to reach (HTR) retailers and customer segments that are other-wise unlikely to adopt efficient lighting products. Several states have identified CFLs purchased by hard-to-reach customers as a distinct measure category with higher NTG ratios and hence, higher net savings. However, there has only been limited use of PA cus-tomer demographic data to help better define who these customers are and which retail-ers serve them. National Grid has leveraged such data to help define the HTR customer segment for its gas heating and hot water programs in Massachusetts and Rhode Island. Further, increased use of such data would allow PAs to better target these customers not only through retail outlets, but also through community-based events.
In the longer-term:1. PAs continue to pursue alternative/ complementary program designs and markets to
maintain high net program savings.
LEDsPAs, retailers and manufacturers ramp-up promotion of ENERGY STAR LEDs. One of the key outcomes of the RLS is the transition from a CFL to an LED focus by all key stakeholders. This transition will occur over time and is expected to include the continued promotion of both technologies over nearly all of the 2012-2020 timeframe.
In the near term these LED-focused efforts will consist of:
1. NEEP and PAs closely monitor market to track ENERGY STAR qualified LED pricing and availability. LED pricing and availability are expected to change quickly given the huge investments made in manufacturing capacity to support this technology. PAs will need to monitor the market for this technology on a more intensive basis than they had to for CFLs to stay abreast of product and market changes.
2. PAs set – and adjust on an on-going basis as needed – appropriate LED incentive levels. Expected changes in LED product availability and pricing may require PAs to make more frequent changes in LED incentive levels than they have for CFLs over the past sev-eral years. More frequent changes in incentive levels will need to be balanced against retailer and manufacturer stated preferences for stability in incentive levels.
3. Industry and PAs leverage non-energy benefits: no mercury, longer lifetime, im-proved dimmability, etc. to promote LEDs. Any effort to promote the “mercury-free” aspect of LEDs will need to be considered carefully in light of continued parallel promo-tion of CFLs. Similarly, other benefits of LEDs vs. CFLs will need to be promoted in such

NORTHEAST RESIDENTIAL LIGHTING STRATEGY61
a way as to not unduly dissuade consumers from the continued purchase of CFLs for the appropriate applications.
4. PAs initially focus on reflector (directional) lamp applications as they may pro-vide the greatest initial market opportunity. Currently there is much greater ENERGY STAR product availability vs. omni-directional A-lamps. In addition, the higher cost of both incandescent/halogen and CFL reflectors may make the cost differential for LED reflector lamps more palatable to consumers.
5. Manufacturers seek ENERGY STAR certification for all eligible LED products. It will be important that the poor performing LEDs currently being manufactured and offered at retail exit the market as soon as possible. It will be critical that all stakeholders not re-peat the product quality mistakes that hampered the promotion and consumer uptake of CFLs for several years. ENERGY STAR certification is the best way to ensure this outcome.
6. Retailers provide preferential display of ENERGY STAR qualified products. Pre-ferred product placement can be included as a selection criterion for PAs’ NCP efforts.
7. Manufacturers and PAs communicate and work with builders, electricians and electrical supply houses around how best to use LEDs to meet building energy code lighting efficiency requirements. The challenge here will be to provide tools and recom-mendations as to the appropriate selection and installation of LEDs vs. CFL screw-in lamps and fixtures as the market for LEDs rapidly evolves.
8. PAs Identify and implement cost-effective direct install opportunities; e.g., high hours of use applications in income eligible, existing single family and multi-family homes, and new construction programs; possibly supported by bulk purchase efforts. While much of the RLS is focused on the retail purchase of efficient lighting, PAs attain significant lighting savings in most of their other residential and income eligible programs. Opportunities for direct installation of LEDs should be identified and pursued, particularly where the longer lifetime and avoided O&M costs of LEDs make them more attractive, e.g., multifamily common area spaces. Bulk purchase efforts for LEDs should be exam-ined as one way to lower the costs to PAs and their program contractors for LEDs used in direct installation applications. Such bulk purchase efforts have proven to be successful in Massachusetts in significantly reducing the costs to PAs for CFLs used in programs with direct install components. However, the expected decline in LED prices may argue against “locking-in” to any LED pricing for any extended period of time.
9. PAs develop “upgrade” LED offers – requiring a customer co-pay – for existing home retrofit, multifamily and new construction programs to attract early adopters and to lower PA program costs. Some customers may be willing to pay a premium to have LEDs rather than CFLs installed as part of PAs’ direct installation efforts. PAs and their program contractors will need to be able to clearly communicate the relative costs and savings of such upgrade packages. NEEP could facilitate the development of a regional consumer fact sheet that would meet this need.

NORTHEAST RESIDENTIAL LIGHTING STRATEGY62
10. NEEP and PAs coordinate with DesignLights™, PA C&I programs, retailers, and others the promotion of residential and commercial LED products. PAs should be con-sistent in their customer messaging and incentive offerings across all of their efficiency programs. This consistency applies to both incentive levels and, to the extent practical, technical requirements between residential and C&I programs.
In the longer term:
1. LEDs become the principal focus of PA residential lighting efforts. The RLs es-timates that in 2017 the number of LEDs and CFLs supported by PA programs will be ap-proximately equivalent, though first year net savings from LEDs will be nearly equivalent to those from CFLs a year earlier in 2016 due to lower CFL NTG ratio assumptions.
2. PAs ramp-up A-lamp (omni-directional) LED promotions as more products become available in a wider range of wattages and at lower prices. While the current avail-ability of these products is minimal and the quality debatable, we expect significant im-provements by 2015, making this product an attractive alternative to other high efficient A-lamps. The availability and competitive pricing of A-lamp LEDs will be critical to the long term success of stakeholder efforts to promote LEDs.
3. PAs increase role of LEDs/phase-out CFLs in existing homes, eligible income and new construction programs. As LED pricing falls and CFL NTG ratios decline, PAs will be able to better justify from a cost-effectiveness and cost efficiency perspective the instal-lation of LEDs in non-retail based programs.
4. Manufacturers share with retailers and PAs their response to the second tier of EISA standards (2020 efficacy requirements) early enough to inform the need for continued PA LED engagement toward the end of the “Longer Term” planning period; i.e., when will the residential LED market be transformed? The RLS presented in this document assumes that the market for residential lighting will be largely transformed by the end of 2019 given both EISA, LED technology evolution and the resulting growing LED market penetration. To the extent possible, manufacturers should share on an on-going basis with PAs and retailers their assessment of the transformation of the residential light-ing market to better inform PAs’ plans towards the end of the RLS planning horizon. If LEDs are projected to become baseline earlier, PA plans should be adjusted accordingly.
5. States continue to leverage building energy codes to increase saturation of efficient lighting.
6. NEEP and PAs continue coordination with commercial LED product promotion.
Efficient halogensConsider limited duration promotion of 2x halogens (i.e., halogen lamps that are twice the efficiency of standard (pre-EISA) incandescents and twice the lifetime; e.g., 100W→50W; 1000 hours→2000 hours). Many if not most of the PAs participating in the RLS Leadership Group were hesitant to commit to supporting efficient halogens as a near-

NORTHEAST RESIDENTIAL LIGHTING STRATEGY63
term transitional strategy. Nonetheless, when these products first become available in late 2011 or early 2012 they will provide PAs with an opportunity to provide consumers with another efficient lighting choice. While the technology is not as efficient as CFLs, by targeting higher wattage incandescent replacements, the average net savings will likely be comparable to what PAs currently claim for their average per lamp CFL savings.
In the near term:
1. NEEP and PAs monitor market to track product availability (expected Q1 2012) and pricing. Ideally these products should be available from multiple manufacturers before they are actively promoted by PAs.
2. PAs consider 2x halogen promotions on higher lumen applications for which there may be no or limited ENERGY STAR LED products available. Higher lumen (100 watt incandescent equivalent and above) ENERGY STAR LEDs will not likely be available from multiple manufacturers until 2013 or later. Efficient halogens represent a transi-tional technology and program opportunity, particularly for those consumers unwilling to purchase CFLs. Focusing on higher lumen lamps will also increase the per lamp savings.
3. NEEP and PAs support ENERGY STAR or other widely known brand to identify and list quality, market ready 2x halogen products. Interested stakeholders should work together to develop minimum performance criteria and a requirement for manufacturer submission of these data if there is sufficient regional interest in promoting the 2x (or greater) efficient halogen technology. Such a process could be informed by the success of the NEEP’s DesignLights™ Consortium efforts focused on LEDs used in commercial building applications. Key performance criteria such as efficacy (lumens/watt) should be commu-nicated to manufacturers as soon as possible.
In the longer-term:
1. Limited or no continued PA support expected given expected LED product avail-ability and pricing. Once higher lumen ENERGY STAR LEDs become routinely available at competitive prices, continued support of efficient halogens will no longer be needed.

NORTHEAST RESIDENTIAL LIGHTING STRATEGY64
Consumer education/marketingDeliver a clear and consistent message to consumers on efficient lighting choices. The number of lighting choices, particularly efficient ones, will expand considerably over the coming months and years driven by EISA and new technology introductions. Further, efforts to educate consumers on efficient lamp choice will shift from watts to lumens due to both new FTC labeling requirements and the use of Lighting Facts labels.
In the near term these residential lighting education and marketing efforts will consist of:
1. All parties work with national (LUMEN Group) and regional groups (NEEP) to develop consistent consumer messages informed by ongoing market research to un-derstand how to build consumer acceptance of and satisfaction with high efficiency lighting products. A number of PAs and NEEP are already active in LUMEN Group efforts to develop consistent messaging on lighting choices. Leveraging these along with CEE and other national efforts will provide a compendium of best practices to utilize for educating consumers.
2. PA messaging may need to be more targeted at driving consumers to efficient product choices and/or value of ENERGY STAR label. While LUMEN Group and other simi-lar messaging are of a more general educational nature, PA marketing efforts, particularly those tied to in-store promotions, may need to be more explicit to drive consumers to specific technology choices. Lacking agreed-to and uniform naming conventions on labels, some manufacturers are currently calling the EISA compliant baseline technology “ef-ficient incandescent.” This can potentially cause backsliding and harm efforts to get the highest energy efficient products into the homes of consumers.
3. All parties leverage EISA standards and new FTC lamp labeling as an opportunity to move consumers to efficient lighting choices. It will be important for stakeholders to get in front of the rapidly changing residential lighting landscape if they are to address what might be potential sources of confusion for consumers. The FTC lamp label and growing use the Lighting Facts label will also serve as a means to transition consumers from choosing lighting based on wattage to choosing lighting based on lumens. Messaging platforms illustrating technology differences and correlating label information enhance and guide consumer understanding in choosing best bulb type for specific applications.
4. Federal entities fund ongoing efforts and assist with enhanced industry part-nerships. DOE and ENERGY STAR support efforts by industry and PAs to develop and implement consistent consumer messaging, particularly choosing lighting based on lumens rather than watts. Funding towards and production of national campaigns reduce the burden on regions to be solely responsible for necessary educational efforts.
5. PAs structure NCP submissions to include industry marketing/educational compo-nent. Many PA NCP RFPs already give consideration to industry-supported education and marketing efforts as a selection criterion. Such efforts will become of even greater

NORTHEAST RESIDENTIAL LIGHTING STRATEGY65
value to PAs to require clear consumer messaging and educational components; NCP selec-tion criteria should be modified accordingly.
6. PAs leverage on-going, planned and proposed industry market research and PA EM&V efforts to inform “local content” of this messaging. PA evaluation efforts and PA and industry market research will allow PAs to refine their messaging over time and to increase its effectiveness. PAs should work with industry to ensure that industry market research is shared with PAs in a timely manner.
In the longer term:
1. PAs shift focus of marketing and consumer education to LEDs. This will need to be done carefully as to not diminish a continued reliance on strong CFL sales though most of the 2012-2020 timeframe.
2. PAs continue market research and EM&V efforts to inform messaging.
Codes and standardsPAs and industry can both leverage and influence codes and standards by supporting adoption and implementation of strong residential lighting efficiency requirements in building energy codes and 2020 EISA Standards.
In the near term:
1. In anticipation of IECC 2012 75% efficient lighting requirement, NEEP and PAs work with builders, lighting designers, code development officials and others to edu-cate them on best lighting choices in Residential New Construction (RNC). As noted above (LED Near-term action #7), this may include the development and provision of tools and guidelines to allow for the selection of appropriate efficient lighting technologies – both screw-in lamps and fixtures – in new construction.
2. In anticipation of EISA 2020 lighting standard setting proceeding to begin in 2014, NEEP with the PAs collect information to inform setting a strong standard in 2020. Availability of accurate and up to date lighting market data will be essential in developing aggressive and informed 2020 standard levels. NEEP will work with regional PAs to plan and conduct market assessment studies in preparation of the next Rulemaking (Final rule due 2017 with 2020 effective date).
In the longer-term:
1. NEEP and PAs provide documentation of RLS success to DOE to inform possibly higher 2020 federal efficacy standard. The federal EISA lighting standards contain a “back stop” efficacy requirement of 45 lumens per watt for the second tier of EISA stan-dards that are to go into effect in 2020. Under EISA, DOE is to undertake rulemaking to as-certain the appropriate efficacy requirement; the “back stop” only comes into play if DOE

NORTHEAST RESIDENTIAL LIGHTING STRATEGY66
fails to complete its rulemaking in time. Potentially, DOE could propose a higher efficacy standard for 2020 than is currently in EISA or expand the coverage of the standard to a wider variety of lamp types. Documentation of the successful implementation of the RLS, particularly as to promotion and sales of LEDs, may assist DOE in its rulemaking efforts.
2. NEEP, the PAs and states participate in US DOE’s 2020 EISA standard setting pro-ceeding to support a strong 2020 standard. Through the NEEP-facilitated Northeast Ap-pliance Standards Project, the regions program administrators and state energy offices will engage the federal rulemaking for general service lamps. Historically, NEEP has pro-vided rulemaking details to the working group which has allowed for informed involve-ment. The Project will collaboratively develop written comments to the federal process at the appropriate opportunities to help drive a strong outcome.
3. Builders and their lighting designers collaborate with code enforcers to develop a checklist and website as tools to verify compliance. Through DSM funding provided for residential utility programs–lighting designers, builders & code enforcers partner to pro-duce a checklist that will increase the level of communication and minimize problems in qualifying the installations, and assist in verifying compliance. Developing a website and smartphone app to check for de-listed products would assist builders before placing orders.
Product qualityEnsure that PA efforts are focused on promoting quality lighting products. It will be criti-cal to the continued and growing success of stakeholder efforts to promote efficient lighting technologies that the CFLs and LEDs on retailer shelves meet consumer expectations. Tying stakeholder promotion of efficient residential lighting technologies to ENERGY STAR certifi-cation is the best way to ensure this outcome.
Over both the near and long term:
1. PAs only support ENERGY STAR qualified LEDs and CFLs with PA incentives and marketing. This is consistent with the general direction of nearly all PA residential lighting promotional efforts over the last several years and should continue.
2. DOE CALiPER and ENERGY STAR third-party testing efforts continue with active NEEP and PA participation; failed products are delisted effectively. The rapid and timely distribution of product test results is one of the most important roles that DOE and EPA can play to help “police” the residential lighting market and to inform PAs of the hoped for improvement in product quality over time. For those products that do not meet ENERGY STAR criteria, and are labeled as such, ENERGY STAR should seek their rapid delisting, while ensuring that manufacturers have the opportunity to adequately address ENERGY STAR’s concerns before a delisting is made final.

NORTHEAST RESIDENTIAL LIGHTING STRATEGY67
3. PAs withdraw incentive funding from delisted products quickly. NCPs should clearly communicate that PA funding will be withdrawn for delisted products with any inventory clearance periods kept to a minimum.
Data needs and trackingDevelop and implement regional systems to track key product and market data to inform program design and implementation efforts. Given the rapidly changing residential light-ing market it will be important that PAs develop, share, and have access to information on the status and direction of the market. This includes information on product availability, product sales, and product pricing.
Over both the near and long term:
1. PAs and industry work through NEEP and others to promote methods to track and share sales data. While similar efforts to develop regional market tracking and data sharing have been of limited success, PAs, NEEP and others should actively pursue such an engagement with industry. Any such efforts may need to include a means to address anti-trust concerns and industry concerns regarding data confidentiality.
2. Use Regional EM&V Forum and other venues to share PA data; e.g., shelf-price surveys, annual program data, etc. The Regional EM&V Forum is an existing and successful venue where PAs already interact to address similar EM&V needs and should be expanded to include residential lighting market data.
3. Reduce the cost of evaluation and market analysis through regional approaches (e.g., EM&V Forum) to collect commonly needed data; e.g., product availability and price, socket saturation rates, customer knowledge and satisfaction with high efficien-cy lighting products. By working regionally, the Northeast captures economies of scale by leveraging resources across program administrators in the region to research and collect data that can inform program design and evaluation of savings impacts.
4. Investigate third-party efforts to track market activity; e.g., D&R’s Better Data Better Design. Involving third-parties to provide these data may help address industry con-fidentiality concerns as well as leverage the interest and resources of PAs outside the region.
Regulatory engagementEngage regulatory bodies early to reinforce need for continued and aggressive PA en-gagement in the residential lighting market and to limit regulatory uncertainty. The suc-cessful implementation of the RLS may require PAs in many states to engage their regulators early. These efforts would educate them on key elements of the RLS and dispel misconcep-tions on the remaining opportunity for savings in the residential lighting market, particu-larly as to the impacts of EISA on the need for the continued promotion of CFLs.

NORTHEAST RESIDENTIAL LIGHTING STRATEGY68
Near term strategies to be pursued include:
1. PAs and NEEP develop and distribute residential lighting memo as part of PAs’ 2012 Plan submissions encouraging adoption of long-term market transformation goals and general strategy. Through the current RLS process, NEEP and the Leadership Group should ensure that the RLS Executive Summary conveys the necessary information to regulators regarding continued PA engagement in the residential lighting market. PAs should include this document in their 2012 Plans.
2. Manufacturers and retailers convey their backing of the RLS to regulators in letters of support and public input hearings. To assist with the implementation of the RLS, industry stakeholders should convey their support of the RLS in letters and in appro-priate public hearings. These letters can be included in PAs’ 2012 Plans. Manufacturers could potentially coordinate their engagement through NEMA.
3. All parties reinforce the message that 2012-2014 EISA standards will not diminish the need for continued residential lighting market intervention: CFLs will not be the baseline. This will be a critical message that should be delivered clearly and repeatedly to regulators. While the RLS envisions a transition to an LED-dominated residential light-ing market, failure to continue to pursue the promotion of CFLs will significantly diminish lighting program savings and net benefits, particularly in the near to midterm.
4. NEEP and PAs highlight large remaining savings potential in not only retail prod-ucts program, but other PA residential programs. The estimated regional savings poten-tial is large; however, individual PAs or states may want to use the RLS savings workbook to “fine tune” the savings estimates specific to their service territory. Further, communi-cations to regulators should highlight the significant reliance on lighting by PAs’ non-retail lighting programs.
5. NEEP and PAs clearly convey message that costs for lighting program savings will increase, possibly considerably, and that this may affect overall program, sector and portfolio cost rates: $/annual or lifetime kWh. Lighting programs and lighting measures have historically delivered the least expensive annual and lifetime savings in PAs’ residen-tial portfolios. As discussed in this report, several factors will likely increase the cost of saved energy to PAs that are obtained from the promotion of efficient lighting. Incentive costs per first year kWh saved are estimated to increase over three-fold from 2012 to 2019. While this cost increase will not be as large when full program costs are considered (not just incentive costs), it will still be significant. However, while cost per saved kWh will increase from 2012 through 2019, lighting will continue to be a lower cost efficiency resource than many, if not most, other residential efficiency measures.
6. NEEP and other stakeholders to use available public input processes to educate regulators and present results of regional data collection. All possible means of engag-ing regulators on the RLS should be pursued and key stakeholders should be prepared to provide public input in support of the RLS.

NORTHEAST RESIDENTIAL LIGHTING STRATEGY69
7. NEEP and PAs emphasize need for program flexibility to address rapidly changing market. Ideally regulators should acknowledge the inherent uncertainty surrounding the rapidly changing residential lighting landscape. As a result PAs should be allowed, and in fact encouraged, to move forward with a less than a perfect understanding of all of the underlying market dynamics that might influence the outcomes of their residential light-ing program efforts.
8. PAs and regulators reach agreement on processes needed to pursue alternative/complementary program models like market share and market lift. As noted above, it may be critical for PAs to reach prior agreement on defining how baseline sales and net savings are to be determined using these alternative program models.
9. PAs and regulators limit regulatory uncertainty – and PA reluctance to aggres-sively pursue lighting savings – by reaching agreement early on for key planning as-sumptions: net-to-gross ratios, measure lifetimes, baseline wattages, etc. While most states in the region do not undertake retrospective true-up of savings, some do. In those states it may be important to get prior agreement with regulators on key net savings planning assumptions. Even for those states where there is no retrospective true-up of savings, developing an agreement on key multi-year planning assumptions may be useful to limit future regulatory uncertainty and “second guessing” in the implementation of PAs’ residential lighting programs.
10. Regulators consider and pursue, as appropriate, alternative cost-effectiveness approaches such as utility cost test (or energy and water test) for claiming gross vs. net savings (where such topics are being addressed by the Regional EM&V Forum in 2012). Arguments have been made that the current approach to cost-effectiveness de-termination in some states should be reviewed and potentially modified. While the total resource cost (TRC) test is the principal means of assessing cost-effectiveness in most states in the region, parties have expressed concerns that while the test fully captures costs, it does not similarly capture all of a measure’s or program’s benefits. In addition, use of the TRC at the measure level versus the program or portfolio level sometimes precludes whole lighting solutions that are, in aggregate, cost-effective and maximize energy savings. Beyond application of the TRC at the program or portfolio level, some stakeholders have proposed the adoption of the utility cost test, or a variant of this test – the energy and water test – that includes all resource benefits in the numerator. Further, some parties have also suggested that our ability to measure net to gross ratios for lighting technologies and lighting programs accurately and on a timely basis is limited. As an alternative, these parties have suggested that PA savings goals be tied to gross, rather than net savings.

NORTHEAST RESIDENTIAL LIGHTING STRATEGY70
In the longer-term:
1. NEEP continues to engage regulatory agencies through annual and multi-year plan submissions and through NEEP policy outreach efforts. As better information is made available over time and the RLS is revised to reflect this, NEEP’s messaging to regulators will be similarly refined. Continued engagement on residential lighting by NEEP will support PAs’ own on-going efforts to inform and educate regulators on the evolving residential lighting market and the most appropriate means for PAs to engage this market.
2. NEEP and PAs continue efforts to emphasize need to maintain a longer term, multi-year vision of the residential lighting market. This multi-year emphasis will be necessary to allow for continued flexibility in program development and implementation given the degree of uncertainty as to the evolution of the residential lighting market.
3. All Parties assess success of program efforts and work together to refine program strategies as needed. Through an agreed-upon prescribed collaborative ef-fort, stakeholders regularly convene to discuss challenges and opportunities to en-hance efficiency initiatives.
4. PAs and regulators integrate non-energy benefits more fully into cost effective-ness calculations. Through the EM&V Forum and other venues the PAs and regulators develop a consistent approach to quantifying and incorporating non-energy benefits into their required cost-effectiveness determinations.
On-going updating of RLS and market engagementImplement process to continue regional lighting engagement on an on-going basis. This RLS represents an important resource to inform stakeholders as to their engagement in the Northeast residential lighting market. The details of this engagement are likely to change as all parties develop a better understanding of new technology introductions, consumer response to these technologies, etc. NEEP should continue to facilitate an engagement of key stakeholders to engage on the refinement of the RLS over time.
Over both the near and long term:
1. NEEP provides on-going forum and resources to allow all parties to revisit and revise RLS as market evolves. NEEP to facilitate yearly meetings of the Leadership Group and annually update the RLS.

NORTHEAST RESIDENTIAL LIGHTING STRATEGY71
rls outComes aNd Criteria for suCCessProvided below are several expected outcomes that would result from the proposed imple-mentation of the RLS. For each outcome, a number of more specific milestones or indicators are provided that would allow stakeholders to gauge their attainment of these outcomes over time.
table 3-1exPected outcoMes froM iMPleMeNtatioN of a regioNal resideNtial lightiNg strategy
Outcomes Milestones/Indicators of Success
By 2020, achieve a 90 percent socket saturation of high efficiency lighting (45 lumens/watt or better) – CFLs, LEDs and high efficiency halogens - in homes
• By 2014, the large majority (70% or more) of eligible LED products on retailer shelves in the region are ENERGY STAR qualified
• By 2015, 90 percent of residential screw-based sockets can be filled with ENERGY STAR LEDs
• By 2016, the majority of lighting products purchased by consumers are high efficiency
• By 2018, all ENERGY STAR eligible LED products on par-ticipating retailer shelves are ENERGY STAR qualified
By 2015 the large majority of consumers are highly satisfied with high efficiency lighting (45 lumens/watt or better) lighting products.
• By 2014, the large majority (70% or more) of ENERGY STAR eligible LED products on retailer shelves are ENERGY STAR qualified
• By 2014, the large majority (80% or more) of consumers select lighting products based on lumen rating rather than wattage
• By 2015, the majority of industry lighting marketing ef-forts targeting consumers promote the benefits of LEDs
• By 2015, 90 percent of residential screw-based sock-ets controlled by dimmers can be filled with dimmable ENERGY STAR LEDs
Energy efficiency programs in the Northeast maintain a high level of net savings from residential lighting through 2015 or longer.
• Net residential lighting program savings are maintained at or near 2011 savings levels through 2015 or longer
• PAs, with industry support, implement alternative program strategies such as market lift to complement current upstream activities to help address gross vs. net savings concerns
• By 2016, in the majority of states in the region PAs and regulators reach agreement on key program planning as-sumptions prior to submission of PA plans
The unsubsidized purchase cost of ENERGY STAR light-ing products, in particular LEDs, is significantly less by 2015 compared to 2011.
• The percentage reduction in the cost of ENERGY STAR LEDs is equal to or greater than that for all LED products as projected in DOE’s SSL Multi-year Plan
By 2015, the range of ENERGY STAR LED product options expands to address at least 90 percent of all screw-based residential lighting applications. (i.e., a bulb for every socket).
• Dimmable directional and non-directional ENERGY STAR LEDs in both medium and candelabra bases are available in a full range of lumen outputs and color temperatures

NORTHEAST RESIDENTIAL LIGHTING STRATEGYA-1
aPPeNdix a: cfl techNology syNoPsis
ProduCt Name: ComPaCt fluoresCeNt lamPs (Cfls)
teChNology tyPe: fluoresCeNCe
Advantages/Positive Aspects:Bare spiral, medium screw-base CFLs have seen improvements in quality, light output, and efficacy over the past few years. At the majority of lumen output ranges, CFLs are presently the most efficacious lamps available on the market. CFLs are available at most common residential lumen output levels and typically last 10 times longer than traditional incandes-cents (10,000 hours vs 1,000 hours).
CFLs are inherently omnidirectional light sources, as the light is created by the phosphor coating on the inside surface of the glass tube and thus originates from every direction. Through simple glass coverings, CFLs can be manufactured in a variety of shapes familiar to consumers, including A-line, globe, candle, and others, although CFLs perform the best un-covered and in omnidirectional applications. In recent years, manufacturers have produced CFLs with smaller profiles that fit nearly all fixtures.
CFLs are the least expensive residential light source, based on the total output of lumens over the life of the lamp. The average per-lamp purchase price of bare spiral CFLs ranges from $1 to $3 (or $2 per kilolumen) and is highly dependent on channel and pack-size. CFLs are widely available through many sales channels and retail outlet types.
Disadvantages/Negative Aspects:Despite high efficacy and high lumen output, CFLs suffer from a few technological short-comings and variable performance across brands and lamp type.
Cycle 1 of ENERGY STAR’s Third Party Testing and Verification Program for CFLs indicated that the great majority (70%) of covered products fail to meet the performance criteria specified in the ENERGY STAR CFL Program Requirements. The categories where products most often fail include lifetime, color quality, lumen maintenance, start-up time, and run-up time tests.
In general CFLs do not provide instantaneous full brightness in the way incandescent technologies do. Most products now light up nearly immediately (median start-up time is 69 ms for bare spiral and 117 ms for covered products). Median run-up time (the time needed for the lamp to reach its full lumen output) is 36 seconds for bare spiral lamps and 77 seconds for covered products.

NORTHEAST RESIDENTIAL LIGHTING STRATEGYA-2
Degradation of light output over time is also a concern with CFLs, as was demonstrated by cycle 1 of ENERGY STAR’s Third Party Testing and Verification Program. The third party testing program found that median 1000 hour lumen maintenance is 94%, while median 40 percent lumen maintenance is 86%.
Truly dimmable CFLs that can reduce light output to 10% of full brightness are not commer-cially available.
Commercialization Status:Currently, CFLs are widely commercially available for nearly all screw-based applications, although a few categories remain unavailable such as dimmable candelabra lamps. CFL sales volumes and in-home socket inventories indicate that the vast majority of people use CFLs in general service applications that require omnidirectional light. The number of CFL manufacturers has remained constant – at approximately 100 – since 2003.
No public sales data on CFL market share by lamp type is currently available. However, the number of lamp models of each type that are manufactured can serve as a rough proxy. Among the more than 1,600 models on the ENERGY STAR qualified products list:
• 72% of these lamps are omnidirectional replacement lamps, most of which are bare spiral lamps.
• 15% are decorative replacement lamps, such as globes or candles. As covered prod-ucts, A-line CFLs are also considered to be specialty products.
• 13% are directional replacement lamps.
Commercial Availability:CFLs are available in most retail outlets that sell traditional incandescents, although they are most commonly purchased at big box stores such as home improvement and mass mer-chant retailers. Prices are cheapest at these outlets, and can be as much as three times as expensive at less commonly used retail outlets, such as grocery stores and drugstores. The following figure displays consumer-identified purchase locations for CFLs and incandescent lamps. (Average likelihood = 1)

NORTHEAST RESIDENTIAL LIGHTING STRATEGYA-3
coNsuMer-ideNtified Purchase locatioNs for laMPs
Source: 2010 ENERGY STAR CFL Market Profile, September 2010
Form Factor:Compared to the incandescents they are designed to replace, today’s CFLs are generally of equivalent size. While the basis for all CFLs is a small fluorescent tube – typically in a spiral shape –glass covers are used to imitate shapes that are more familiar to consumers, such as A-line, globe, or candle lamps.
CFLs require integrated ballasts to maintain optimal current, voltage, and power. For cer-tain applications, these ballasts can increase the diameter of the neck of the lamp, leading to occasional difficulties fitting lamps with some fixtures.
Lifetime:CFL lifetime is defined as the number of hours a lamp lasts before it ceases to emit light. The following figure displays the rated lifetimes for all CFLs currently found on the ENERGY STAR qualified product list, by the year that each product was qualified. It can be seen that the majority of CFLs have lifetimes between 8,000 and 10,000 hours. Lamps with 12,000 hour lifetimes have become increasingly common since 2008, representing close to 30% of new products in 2010. It is expected that, as technologies improve, CFLs will continue to shift toward higher lifetimes.
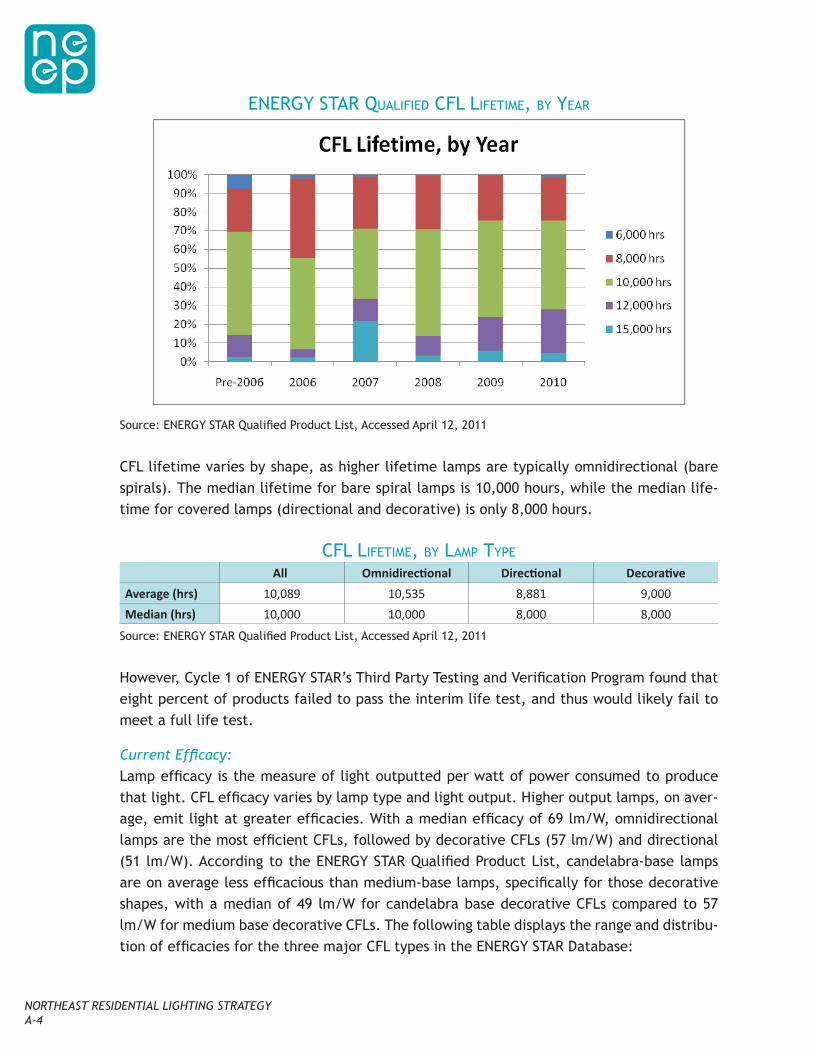
NORTHEAST RESIDENTIAL LIGHTING STRATEGYA-4
eNergy star qualified cfl lifetiMe, by year
Source: ENERGY STAR Qualified Product List, Accessed April 12, 2011
CFL lifetime varies by shape, as higher lifetime lamps are typically omnidirectional (bare spirals). The median lifetime for bare spiral lamps is 10,000 hours, while the median life-time for covered lamps (directional and decorative) is only 8,000 hours.
cfl lifetiMe, by laMP tyPe
All Omnidirectional Directional DecorativeAverage (hrs) 10,089 10,535 8,881 9,000Median (hrs) 10,000 10,000 8,000 8,000
Source: ENERGY STAR Qualified Product List, Accessed April 12, 2011
However, Cycle 1 of ENERGY STAR’s Third Party Testing and Verification Program found that eight percent of products failed to pass the interim life test, and thus would likely fail to meet a full life test.
Current Efficacy:Lamp efficacy is the measure of light outputted per watt of power consumed to produce that light. CFL efficacy varies by lamp type and light output. Higher output lamps, on aver-age, emit light at greater efficacies. With a median efficacy of 69 lm/W, omnidirectional lamps are the most efficient CFLs, followed by decorative CFLs (57 lm/W) and directional (51 lm/W). According to the ENERGY STAR Qualified Product List, candelabra-base lamps are on average less efficacious than medium-base lamps, specifically for those decorative shapes, with a median of 49 lm/W for candelabra base decorative CFLs compared to 57 lm/W for medium base decorative CFLs. The following table displays the range and distribu-tion of efficacies for the three major CFL types in the ENERGY STAR Database:

NORTHEAST RESIDENTIAL LIGHTING STRATEGYA-5
distributioNs of cfl efficacies, by laMP tyPe
Count Minimum
25th
Percentile Median
75th
Percentile MaximumDirectional 206 34.2 45.6 50.5 53.3 63.3Omnidirectional 1183 35.0 66.3 69.1 71.6 80.2Decorative 249 37.5 53.0 56.8 60.2 70.2
Source: ENERGY STAR Qualified Product List, Accessed April 12, 2011
The following three figures are scatter plots displaying each lamp in the ENERGY STAR data-base by light output and efficacy. In all three cases, 80% of qualified CFLs fall between the blue bars.
oMNidirectioNal cfl efficacy
Source: ENERGY STAR Qualified Product List, Accessed April 12, 2011
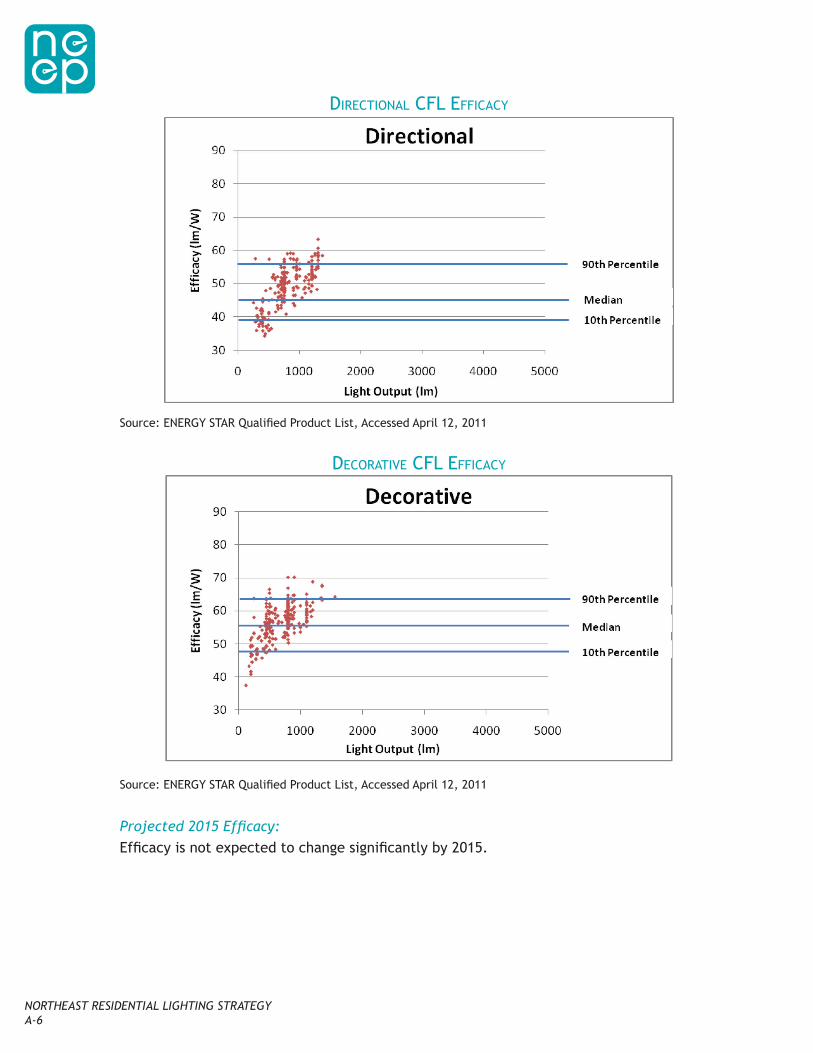
NORTHEAST RESIDENTIAL LIGHTING STRATEGYA-6
directioNal cfl efficacy
Source: ENERGY STAR Qualified Product List, Accessed April 12, 2011
decorative cfl efficacy
Source: ENERGY STAR Qualified Product List, Accessed April 12, 2011
Projected 2015 Efficacy:Efficacy is not expected to change significantly by 2015.

NORTHEAST RESIDENTIAL LIGHTING STRATEGYA-7
Current Price:CFL lamp prices have decreased significantly in recent years, although prices remain higher for dimmable and other specialty lamps. Standard CFLs are four times the cost of a com-parable incandescent, though they remain one twenty fifth the cost of a comparable LED lamp. Dimmable CFLs are twenty times the cost of a comparable incandescent and one fifth the cost of an LED replacement lamp.
coMParisoN of laMP costs, by tyPe
Lamp Type Price ($/kilolumen)Incandescent Lamp (A19 60W high efficiency) $0.50
Compact Fluorescent Lamp (13W) $2.00Compact Fluorescent Lamp (13W dimmable) $10.00Fluorescent Lamp and Ballast System (F32T8) $4.00
LED Lamp (A19 60W dimmable) $50.00
Source: U.S. Department of Energy, “Solid-State Lighting Research and Development: Multi Year Program Plan,”
March 2011.
2015 Projected PriceCFL prices are expected to increase due to increased phosphor prices, although specific data on projected prices are not currently available.
Control Compatibility:Specialized products designed for dimmable or 3-way switches are currently available on the market, however truly dimmable CFLs that can reduce light output to 10% of full bright-ness are not commercially viable. Currently manufacturers claim that 26% of ENERGY STAR qualified directional products, 4% of omnidirectional, and 3% of decorative products are dimmable. There is not currently a test for CFL dimmability, so whether or not a lamp will be compatible with dimmable controls is based solely on manufacturer claims.
Color Temperature and Quality:The Color Rendering Index (CRI) measures the CFL’s ability to accurately render the color of illuminated objects. Color rendering for CFLs (measured in CRI) is generally between 80 and 87. CRI over 80 is considered acceptable for residential lighting, while 100 is considered equivalent to incandescent lamps. The range in CRI displayed by CFLs is comparable to the majority of LED replacement lamps currently on the market. For the 46 lamps tested in cycle 1 of ENERGY STAR’s Third Party Testing and Verification program, the median CRI was 82.4. The minimum required CRI for ENERGY STAR qualification is 80.

NORTHEAST RESIDENTIAL LIGHTING STRATEGYA-8
tested cfl color reNderiNg
Source: ENERGY STAR CFL Third Party Testing and Verification Final Report: Cycle 1, June 2011
CFLs are capable of producing light in all spectrum categories, however 60% have nominal correlated color temperatures (CCT) of 2700K, with the remaining 40% distributed amongst the other common color temperatures.
cfl color teMPerature distributioN
Source: ENERGY STAR Qualified Product List, Accessed April 12, 2011
Major Manufacturers:The majority of CFLs are made by a handful of original equipment manufacturers (OEMs), primarily located overseas, and then rebranded by a private labeler for sale. In many cases, one model of CFL is sold by multiple private labelers under different brand names. The fol-lowing table shows the top OEMs and private labelers.
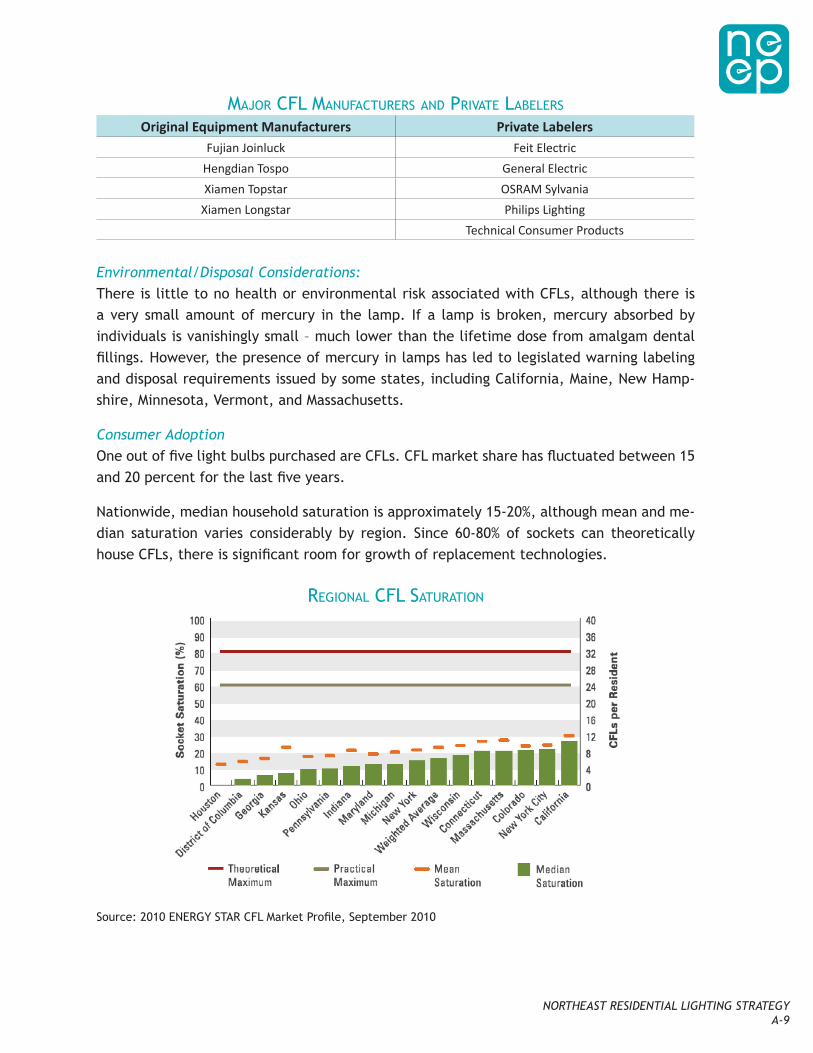
NORTHEAST RESIDENTIAL LIGHTING STRATEGYA-9
Major cfl MaNufacturers aNd Private labelers
Original Equipment Manufacturers Private LabelersFujian Joinluck Feit Electric
Hengdian Tospo General ElectricXiamen Topstar OSRAM Sylvania
Xiamen Longstar Philips LightingTechnical Consumer Products
Environmental/Disposal Considerations:There is little to no health or environmental risk associated with CFLs, although there is a very small amount of mercury in the lamp. If a lamp is broken, mercury absorbed by individuals is vanishingly small – much lower than the lifetime dose from amalgam dental fillings. However, the presence of mercury in lamps has led to legislated warning labeling and disposal requirements issued by some states, including California, Maine, New Hamp-shire, Minnesota, Vermont, and Massachusetts.
Consumer AdoptionOne out of five light bulbs purchased are CFLs. CFL market share has fluctuated between 15 and 20 percent for the last five years.
Nationwide, median household saturation is approximately 15-20%, although mean and me-dian saturation varies considerably by region. Since 60-80% of sockets can theoretically house CFLs, there is significant room for growth of replacement technologies.
regioNal cfl saturatioN
Source: 2010 ENERGY STAR CFL Market Profile, September 2010

NORTHEAST RESIDENTIAL LIGHTING STRATEGYA-10
Room for growth in most households is actually larger than the median saturation would indicate because the distribution is highly left-skewed, meaning that there are many house-holds with very few CFLs and a few households with many. The following figure demon-strates this skew in the state of California, which was found to have the highest mean and median CFL saturations in the nation.
distributioN by household cfl saturatioN (califorNia)
Source: 2010 ENERGY STAR CFL Market Profile, September 2010

NORTHEAST RESIDENTIAL LIGHTING STRATEGYB-1
aPPeNdix b: led techNology syNoPsis
ProduCt Name: light emittiNg diodes (leds)/solid state lightiNg (ssl)
teChNology tyPe: eleCtrolumiNesCeNCe
Advantages/Positive Aspects:LEDs are seen as the light source of the future: highly efficient, accurate color rendering, and very long lived. LEDs’ theoretical potential efficacy is the greatest of all current tech-nologies, exceeding 200 lumens/watt. Currently, the brightest A-line LEDs only produce 1100 lumens of light – equivalent to a 75W incandescent and efficacy for directional prod-ucts is on par with that of CFLs (44-55 lm/W for most LEDs and 46-53 lm/W for most CFLs).
LEDs also claim to offer the longest service life of any lighting technology (up to 50,000 hours) and are capable of producing light of exceptional quality. Lifetime has yet to be fully validated.
In theory, LEDs can be configured into any shape, from A-lamp replacements to linear tube lamp replacements, but the technology is inherently directional and is therefore most ap-propriate for directional applications such as reflectors (PAR, MR, and R). LED technology is more readily adaptable to dimming applications than CFLs and other fluorescent tech-nologies. However, not all LED lamps are dimmable and not all dimmable LED lamps are compatible with traditional dimming switches.
As a solid state product, LED replacement lamps are potentially more durable, especially at present when most lamp bodies are made of aluminum and serve a dual purpose as heat sinks. The lamps do not contain a filament and tend to be more shatter resistant than CFLs, halogen-incandescents, and traditional incandescent lamps. The lamps will not release mercury or other harmful substances if broken.
Disadvantages/Negative Aspects:LED technology is far from its theoretical potential. At present, light output tends to be low, with most lamps outputting less than 500-700 lumens, with a limited number of higher output lights (60-75W equivalent) currently available.
Like CFLs, light output for LEDs degrades over time, which can affect the useful life of the lamp. LED lamps require electronic components to be incorporated into the lamp design which increases the number of components that could fail and complicates reliability and lifetime predictions. A further challenge is that the technology is inherently directional which, while a plus for directional applications, poses a challenge to manufacturers at-
NORTHEAST RESIDENTIAL LIGHTING STRATEGYB-2
tempting to develop omnidirectional replacement lamps. Many lamps that are being mar-keted as replacements for general service lamps do not in fact have true omnidirectional distribution of light.
Because LEDs are a relatively young product, product performance varies considerably across product lines in all metrics including color quality, lifetime, lumen output, lumen maintenance, and other factors. Testing of off the shelf products by DOE’s CALiPER program has found that many products perform far below manufacturers claimed levels, though this situation appears to be improving in part due to the DOE Lighting Facts® truth-in-labeling initiative.
Normalized for light output, first cost for LEDs is currently the highest among replacement lighting technologies. Prices at present are approximately $20-40 for omnidirectional lamps and $20-60 for directional lamps, approximately 25 times the cost of a CFL and 100 times the cost of an incandescent.
LEDs are not manufactured with mercury, although hazardous materials can still be a con-cern as the control circuits and driver may contain potentially toxic materials, such as cad-mium. Recycling is thus recommended for these lamps. Control circuits are also tempera-ture sensitive, and heat management can be a challenge. To dissipate heat, manufacturers often must add heat sinks and cooling fins, which can increase the weight and significantly alter the form factor of the product.
Significant progress has been made on these detractors, and the technology is expected to improve in the coming years, specifically in terms of cost and light output.
Commercialization Status:LED lamps are becoming increasingly available at a number of retail outlets, although they are typically only available at low to medium light outputs – up to 1100 lumens. DOE has been investing significant R&D dollars towards developing LED technology and manufac-turing. Light output has been increasing at a rapid rate and cost per kilolumen has been declining at a similar rate. DOE predicts that $10, 800-lumen LEDs will be available by 2015. Whether product performance improves across all metrics remains to be seen.
Commercial Availability:As of February 23, 2012 there were 551 products listed on the ENERGY STAR LED Light Bulbs qualified product list. These are all integrated LED lamps (ILLs), meaning that the driver, LED chip(s), and ANSI standardized base are integrated into a single lamp.
• 2% of these lamps are omnidirectional replacement lamps, which are comparable to spiral CFLs or A-line incandescents.
• 17% are decorative replacement lamps, such as globes or candles.• 81% are directional replacement lamps, such as MR and PAR lamps.• 73% of ENERGY STAR qualified LED lamps are dimmable.

NORTHEAST RESIDENTIAL LIGHTING STRATEGYB-3
As of March 1, 2012 there were 4,463 LED lamps and fixtures listed in DOE’s Lighting Facts1 database. These can be broken out into the following categories:
Form Factor:According to the CALiPER Summary Report (Summary of Results: Round 12 of Product Test-ing, June 2011), compared to the incandescent lamps that they are designed to replace, A-line LEDs appear to be of equivalent size and shape, although LED lamps may weigh con-siderably more. LED lamps require a driver to convert AC mains power to DC power. LED drivers, as well as the LED light sources themselves, generate heat. This heat must be dis-sipated through the use of heat sinks, fans, and other methods to allow the LED to perform optimally. These tend to increase the weight and size of higher lumen LED replacement lamps, such that these products are typically heavier than equivalent incandescent, halo-gen, and CFL lamps.
High light output LEDs are effectively semiconductor chips and are inherently directional light sources. Manufacturers that wish to produce an omnidirectional lamp must use the placement of multiple chips and advanced optics to achieve a uniform distribution of light in all directions. Manufacturers have employed a wide array of designs that, coupled with variations in heat sink design, have led to light bulbs in new shapes that may seem strange to consumers.
1 Products in the Lighting Facts database have undergone LM-79 testing and had their reports independently verified.
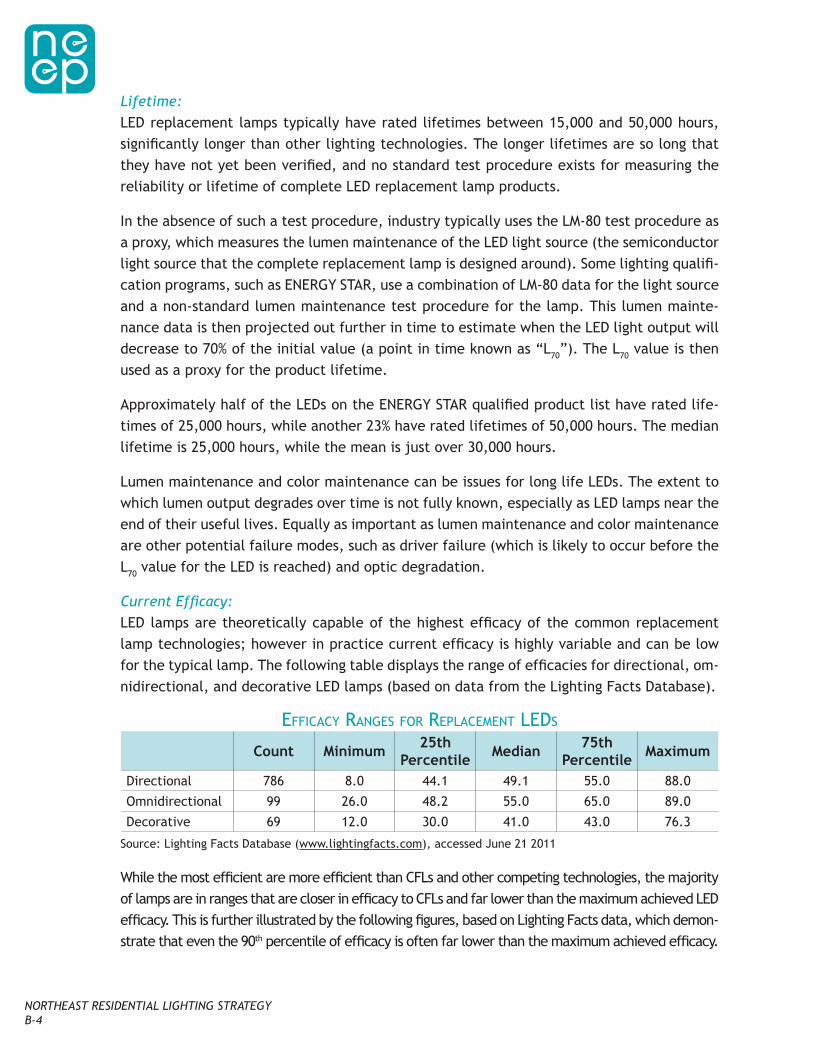
NORTHEAST RESIDENTIAL LIGHTING STRATEGYB-4
Lifetime:LED replacement lamps typically have rated lifetimes between 15,000 and 50,000 hours, significantly longer than other lighting technologies. The longer lifetimes are so long that they have not yet been verified, and no standard test procedure exists for measuring the reliability or lifetime of complete LED replacement lamp products.
In the absence of such a test procedure, industry typically uses the LM-80 test procedure as a proxy, which measures the lumen maintenance of the LED light source (the semiconductor light source that the complete replacement lamp is designed around). Some lighting qualifi-cation programs, such as ENERGY STAR, use a combination of LM-80 data for the light source and a non-standard lumen maintenance test procedure for the lamp. This lumen mainte-nance data is then projected out further in time to estimate when the LED light output will decrease to 70% of the initial value (a point in time known as “L70”). The L70 value is then used as a proxy for the product lifetime.
Approximately half of the LEDs on the ENERGY STAR qualified product list have rated life-times of 25,000 hours, while another 23% have rated lifetimes of 50,000 hours. The median lifetime is 25,000 hours, while the mean is just over 30,000 hours.
Lumen maintenance and color maintenance can be issues for long life LEDs. The extent to which lumen output degrades over time is not fully known, especially as LED lamps near the end of their useful lives. Equally as important as lumen maintenance and color maintenance are other potential failure modes, such as driver failure (which is likely to occur before the L70 value for the LED is reached) and optic degradation.
Current Efficacy:LED lamps are theoretically capable of the highest efficacy of the common replacement lamp technologies; however in practice current efficacy is highly variable and can be low for the typical lamp. The following table displays the range of efficacies for directional, om-nidirectional, and decorative LED lamps (based on data from the Lighting Facts Database).
efficacy raNges for rePlaceMeNt leds
Count Minimum 25th Percentile Median 75th
Percentile Maximum
Directional 786 8.0 44.1 49.1 55.0 88.0
Omnidirectional 99 26.0 48.2 55.0 65.0 89.0
Decorative 69 12.0 30.0 41.0 43.0 76.3
Source: Lighting Facts Database (www.lightingfacts.com), accessed June 21 2011
While the most efficient are more efficient than CFLs and other competing technologies, the majority of lamps are in ranges that are closer in efficacy to CFLs and far lower than the maximum achieved LED efficacy. This is further illustrated by the following figures, based on Lighting Facts data, which demon-strate that even the 90th percentile of efficacy is often far lower than the maximum achieved efficacy.

NORTHEAST RESIDENTIAL LIGHTING STRATEGYB-5
directioNal led efficacy
Source: Lighting Facts Database (www.lightingfacts.com) , accessed June 21 2011
decorative led efficacy
Source: Lighting Facts Database (www.lightingfacts.com) , accessed June 21 2011

NORTHEAST RESIDENTIAL LIGHTING STRATEGYB-6
oMNidirectioNal led efficacy
Source: Lighting Facts Database (www.lightingfacts.com), accessed June 21 2011
Projected 2015 Efficacy:The following figure, published by DOE in its report, “Solid-State Lighting Research and Development: Multi-Year Program Plan”, illustrates the expectation that LEDs will in-crease significantly in efficacy, eventually overtaking CFLs, linear fluorescents, and other competing technologies. It should be noted that this figure presents the maximum projected efficacy for these lamps. Data on the projected average or mean efficacy for LEDs has not been published.

NORTHEAST RESIDENTIAL LIGHTING STRATEGYB-7
historical aNd Predicted efficacy of light sources
Source: U.S. Department of Energy, “Solid-State Lighting Research and Development: Multi Year Program
Plan,” March 2011.
Current Price:According to DOE, the current price for a 60 watt dimmable A-line LED replacement lamp is approximately $50 per kilolumen. This corresponds to a $20 retail price for a 400 lumen lamp (40W equivalent) or $40 for an 800 lumen lamp (60W equivalent). The 2010 cost for directional lamps was approximately $20-30 for lamps in the 250-350 lumen range, and $40-60 for lamps in the 750-850 lumen range.
The following table demonstrates the price per lumen of LEDs compared to other compa-rable technologies:
coMParisoN of laMP costs, by tyPe
Lamp Type Price ($/kilolumen)Incandescent Lamp (A19 60W high efficiency) $0.50
Compact Fluorescent Lamp (13W) $2.00Compact Fluorescent Lamp (13W dimmable) $10.00Fluorescent Lamp and Ballast System (F32T8) $4.00
LED Lamp (A19 60W dimmable) $50.00
Source: U.S. Department of Energy, “Solid-State Lighting Research and Development: Multi Year Program Plan,” March 2011.

NORTHEAST RESIDENTIAL LIGHTING STRATEGYB-8
2015 Projected Price:The following table shows DOE’s projected LED prices, on a price per kilolumen basis. Assuming CFL prices remain constant, DOE expects that LEDs will approach price competi-tiveness with CFLs between 2015 and 2020, when their cost is predicted to drop below $10 per kilolumen.
White light iNtegrated led laMP Price ProjectioN
Source: U.S. Department of Energy, “Solid-State Lighting Research and Development: Multi Year Program Plan,”
March 2011.
Control Compatibility:73% of ENERGY STAR qualified LED replacement lamps are dimmable, demonstrating a sig-nificantly higher rate of dimmability than CFLs. LED technologies are highly compatible with dimmer switches, however not all products are made to be dimmable. Data on con-trol compatibility for non-qualified LEDs are not currently available. There is not currently a standard test for LED dimmability, so whether or not a lamp will be compatible with dimmable controls is based solely on manufacturer claims.
Color Temperature and Quality:Color rendering for LEDs is quite variable at present, with replacement lamps on the market that range in CRI from 33 to 95. 80% of the market, however, falls between 73 and 88 CRI, where 80 CRI and above are considered acceptable for residential use. The mean across all LED replacement lamps in the Lighting Facts database is 81.4, while the median is 82.

NORTHEAST RESIDENTIAL LIGHTING STRATEGYB-9
led color reNderiNg distributioN
Source: Lighting Facts Database (www.lightingfacts.com), accessed June 21 2011
Color temperature is also variable for LEDs. While lamps range from 2500K to more than 8000K, 80% of LEDs fall between 2700K and 5300K, with high concentrations at 2700K and 3000K. The average CCT is 3568K while the median is 3000K.
led color teMPerature distributioN
Source: Lighting Facts Database (www.lightingfacts.com), accessed June 21 2011
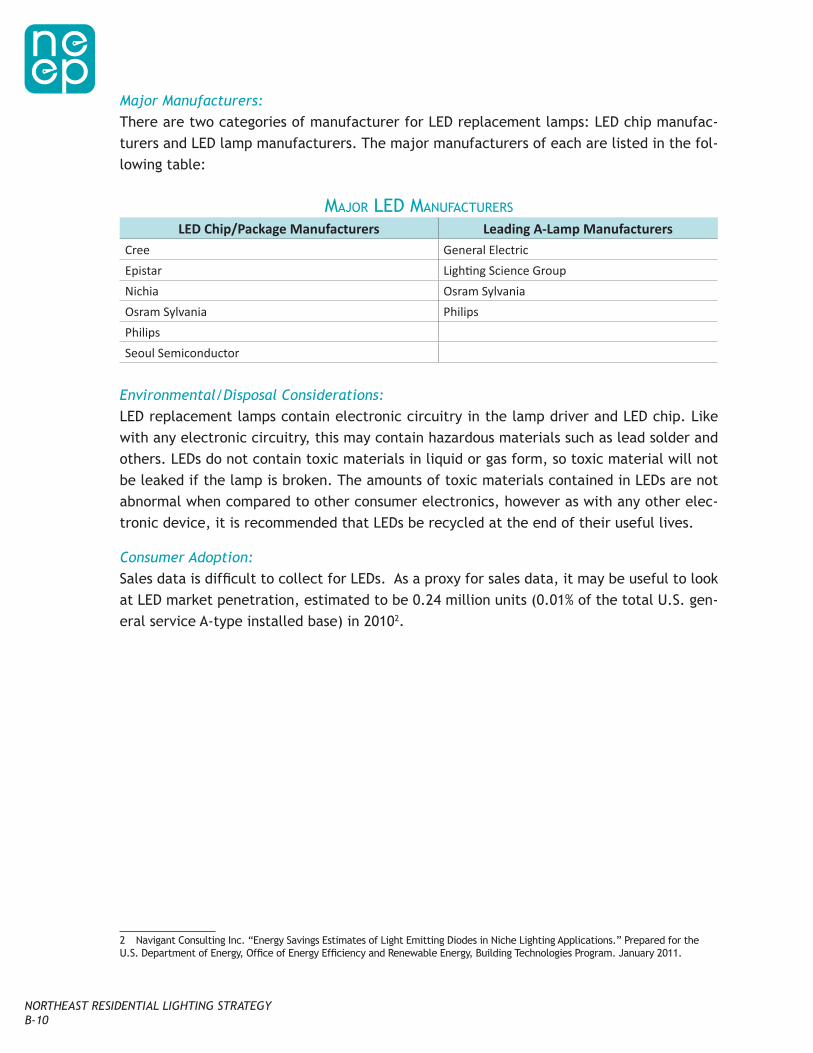
NORTHEAST RESIDENTIAL LIGHTING STRATEGYB-10
Major Manufacturers:There are two categories of manufacturer for LED replacement lamps: LED chip manufac-turers and LED lamp manufacturers. The major manufacturers of each are listed in the fol-lowing table:
Major led MaNufacturers
LED Chip/Package Manufacturers Leading A-Lamp ManufacturersCree General ElectricEpistar Lighting Science GroupNichia Osram SylvaniaOsram Sylvania PhilipsPhilipsSeoul Semiconductor
Environmental/Disposal Considerations:LED replacement lamps contain electronic circuitry in the lamp driver and LED chip. Like with any electronic circuitry, this may contain hazardous materials such as lead solder and others. LEDs do not contain toxic materials in liquid or gas form, so toxic material will not be leaked if the lamp is broken. The amounts of toxic materials contained in LEDs are not abnormal when compared to other consumer electronics, however as with any other elec-tronic device, it is recommended that LEDs be recycled at the end of their useful lives.
Consumer Adoption:Sales data is difficult to collect for LEDs. As a proxy for sales data, it may be useful to look at LED market penetration, estimated to be 0.24 million units (0.01% of the total U.S. gen-eral service A-type installed base) in 20102.
2 Navigant Consulting Inc. “Energy Savings Estimates of Light Emitting Diodes in Niche Lighting Applications.” Prepared for the U.S. Department of Energy, Office of Energy Efficiency and Renewable Energy, Building Technologies Program. January 2011.