need for speed: tools for jvm tuning for geecon prague 2016
TRANSCRIPT
01

About me02
Andrey AdamovichJava/Groovy developer
(Sometimes) application performance analyst
Coauthor of Groovy 2 Cookbook
Coorganizer of @latcraft and @devternity
••••
03

Contact detailsEmail: [email protected]
Linkedin: http://www.linkedin.com/in/andreyadamovich
Lanyrd: http://lanyrd.com/profile/andreyadamovich
GitHub: https://github.com/aadamovich
SO: http://stackoverflow.com/users/162792/andreyadamovich
Twitter: @codingandrey, @aestasit
••••••
04

What's in thispresentation?
05

The tools06

The game07

RulesPicture is shown
You guess what the next topic is
First one to guess gets a sticker!
•••
08

Let's try!09

10
Java's(Hash)Map11

12

BigData13

Let the gamesbegin!
14

15

GC Pauses16

What are thegood
parameters?17

So manyoptions....
18

So many options....> java ‐XX:+PrintFlagsFinal ‐version | wc ‐l
java version "1.8.0_45"
Java(TM) SE Runtime Environment (build 1.8.0_45‐b15)
Java HotSpot(TM) 64‐Bit Server VM (build 25.45‐b02, mixed mode)
714
01.
02.
03.
04.
05.
19
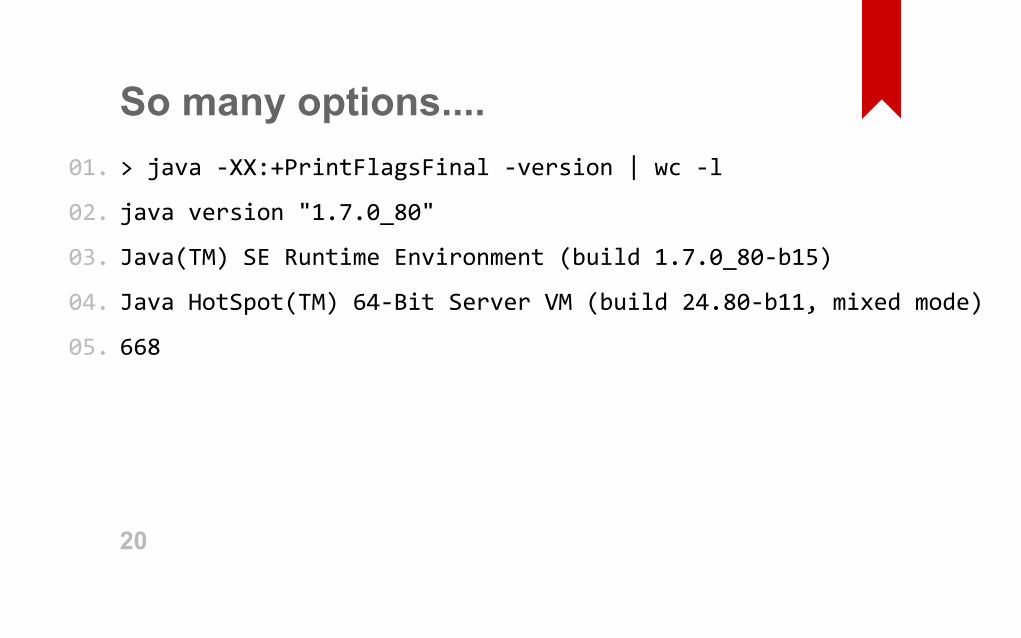
So many options....> java ‐XX:+PrintFlagsFinal ‐version | wc ‐l
java version "1.7.0_80"
Java(TM) SE Runtime Environment (build 1.7.0_80‐b15)
Java HotSpot(TM) 64‐Bit Server VM (build 24.80‐b11, mixed mode)
668
01.
02.
03.
04.
05.
20

So many options....> java ‐XX:+PrintFlagsFinal ‐version | wc ‐l
java version "1.6.0_45"
Java(TM) SE Runtime Environment (build 1.6.0_45‐b06)
Java HotSpot(TM) 64‐Bit Server VM (build 20.45‐b01, mixed mode)
670
01.
02.
03.
04.
05.
21

So many options....> java ‐XX:+PrintFlagsFinal ‐version | grep GC | wc ‐l
65
01.
02.
22
Gazzillion permutationsImagine all those parameters are Boolean
2^65 combinations
2^65 ~ 10^21 = 1 sextillion
•••
23
Use casesWeb application
Background job
Streaming/reactive application
Low latency application
••••
24
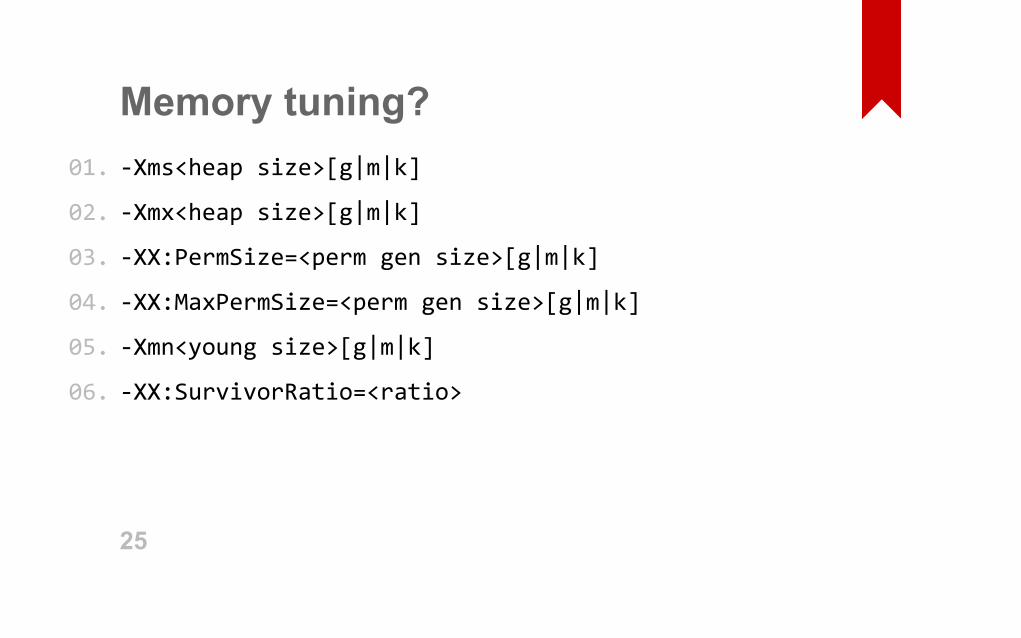
Memory tuning?‐Xms<heap size>[g|m|k]
‐Xmx<heap size>[g|m|k]
‐XX:PermSize=<perm gen size>[g|m|k]
‐XX:MaxPermSize=<perm gen size>[g|m|k]
‐Xmn<young size>[g|m|k]
‐XX:SurvivorRatio=<ratio>
01.
02.
03.
04.
05.
06.
25
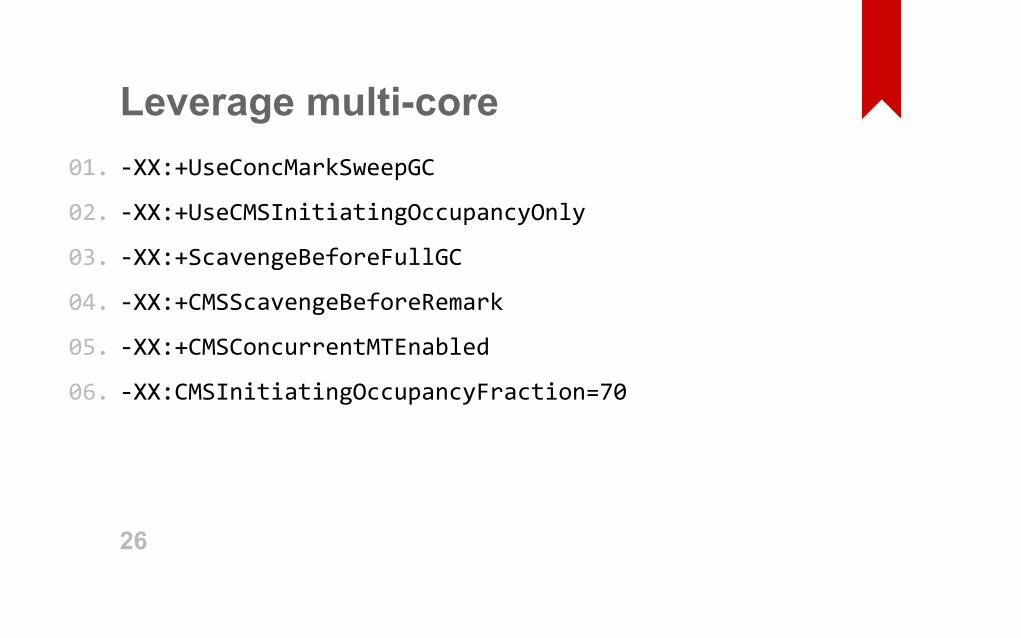
Leverage multicore‐XX:+UseConcMarkSweepGC
‐XX:+UseCMSInitiatingOccupancyOnly
‐XX:+ScavengeBeforeFullGC
‐XX:+CMSScavengeBeforeRemark
‐XX:+CMSConcurrentMTEnabled
‐XX:CMSInitiatingOccupancyFraction=70
01.
02.
03.
04.
05.
06.
26
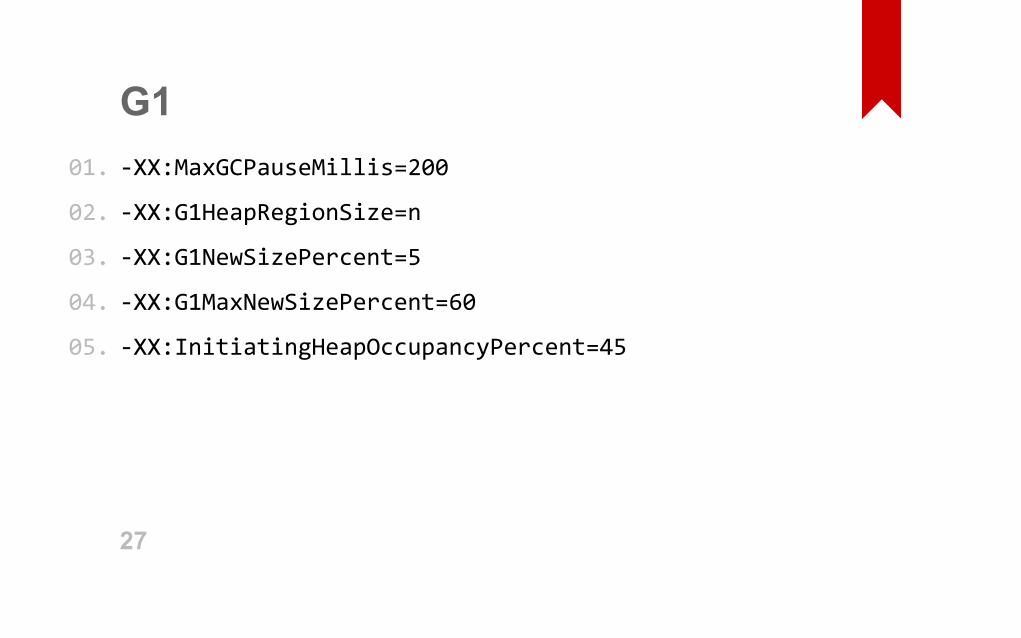
G1‐XX:MaxGCPauseMillis=200
‐XX:G1HeapRegionSize=n
‐XX:G1NewSizePercent=5
‐XX:G1MaxNewSizePercent=60
‐XX:InitiatingHeapOccupancyPercent=45
01.
02.
03.
04.
05.
27
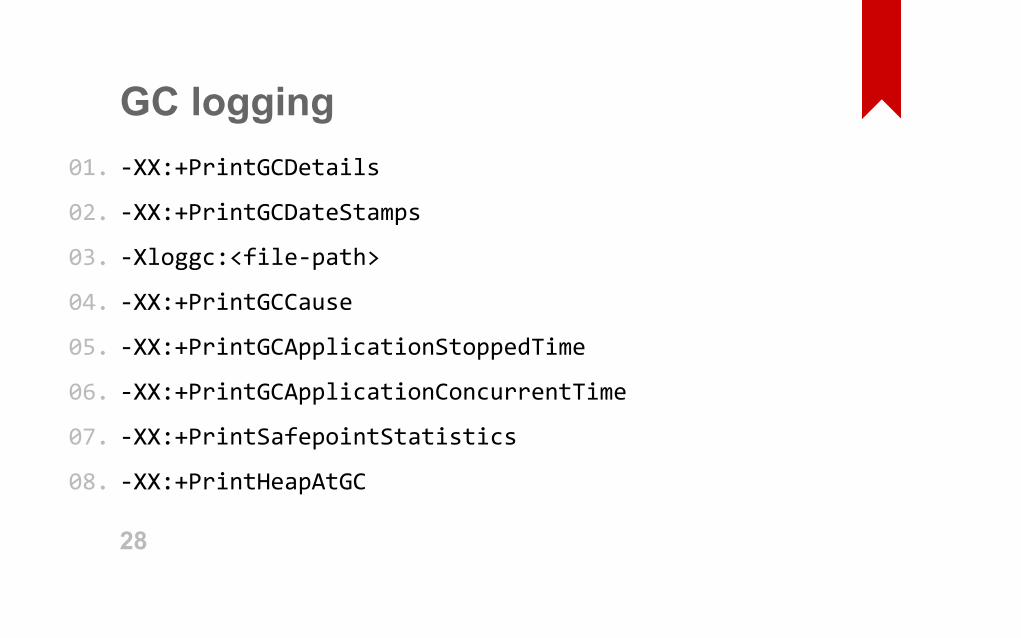
GC logging‐XX:+PrintGCDetails
‐XX:+PrintGCDateStamps
‐Xloggc:<file‐path>
‐XX:+PrintGCCause
‐XX:+PrintGCApplicationStoppedTime
‐XX:+PrintGCApplicationConcurrentTime
‐XX:+PrintSafepointStatistics
‐XX:+PrintHeapAtGC
01.
02.
03.
04.
05.
06.
07.
08.
28
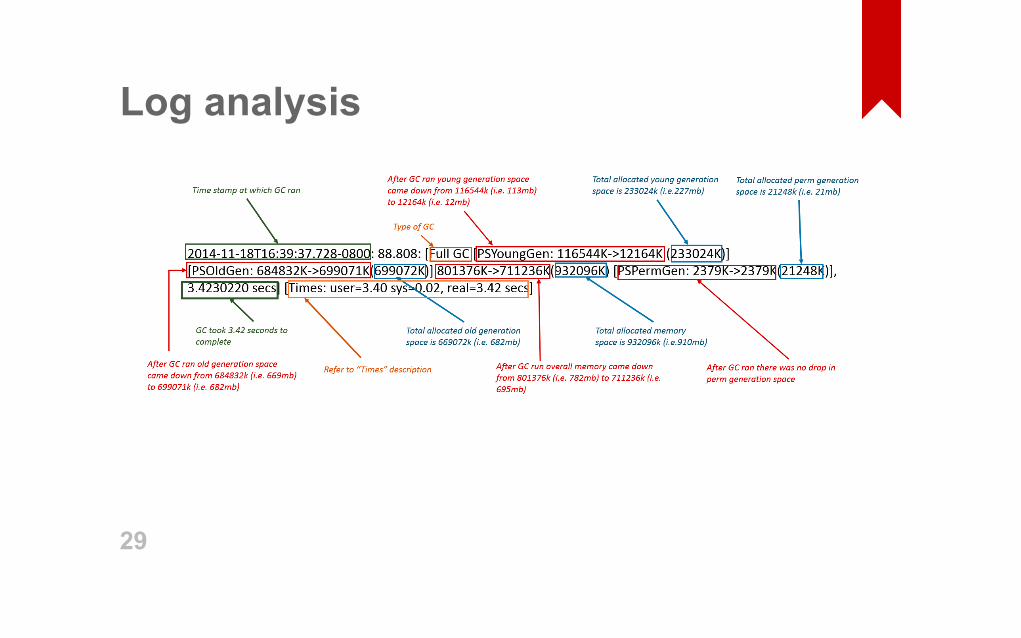
Log analysis
29
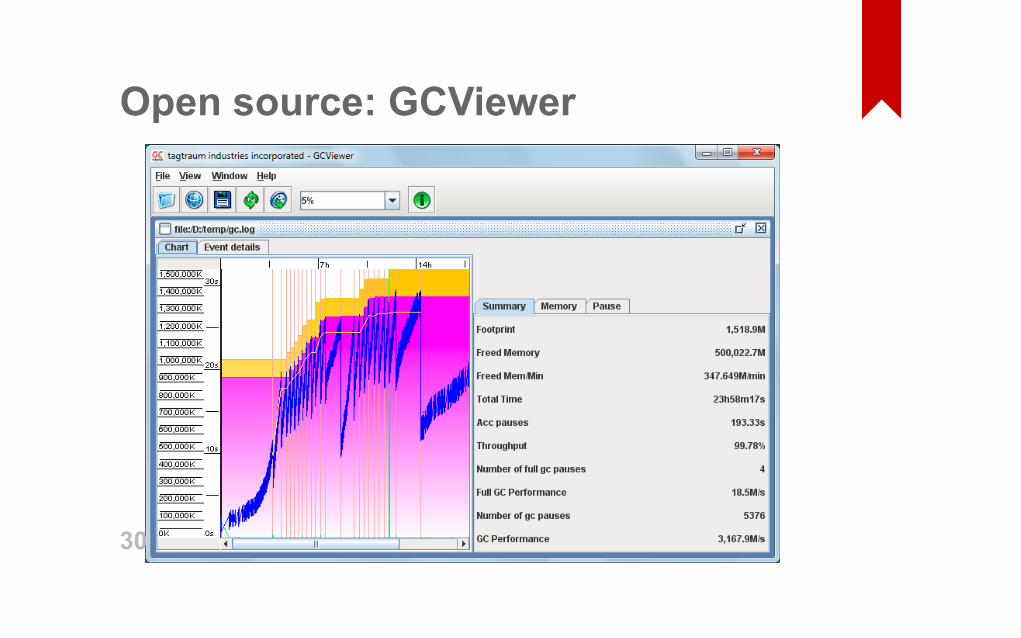
Open source: GCViewer
30
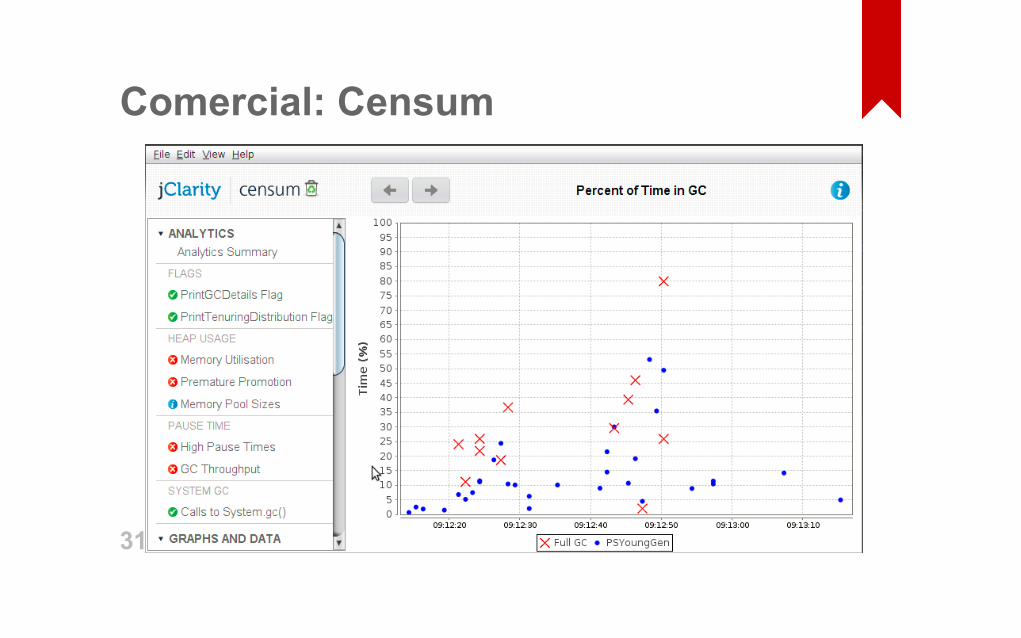
Comercial: Censum
31

Next riddle32

33

Memorydumps
34

How to take?On out of memory:
‐XX:+HeapDumpOnOutOfMemoryError
‐XX:HeapDumpPath=<path to dump>`date`.hprof
Or manually:
jmap ‐dump:file=<path to dump> <java process id>
01.
02.
01.
35
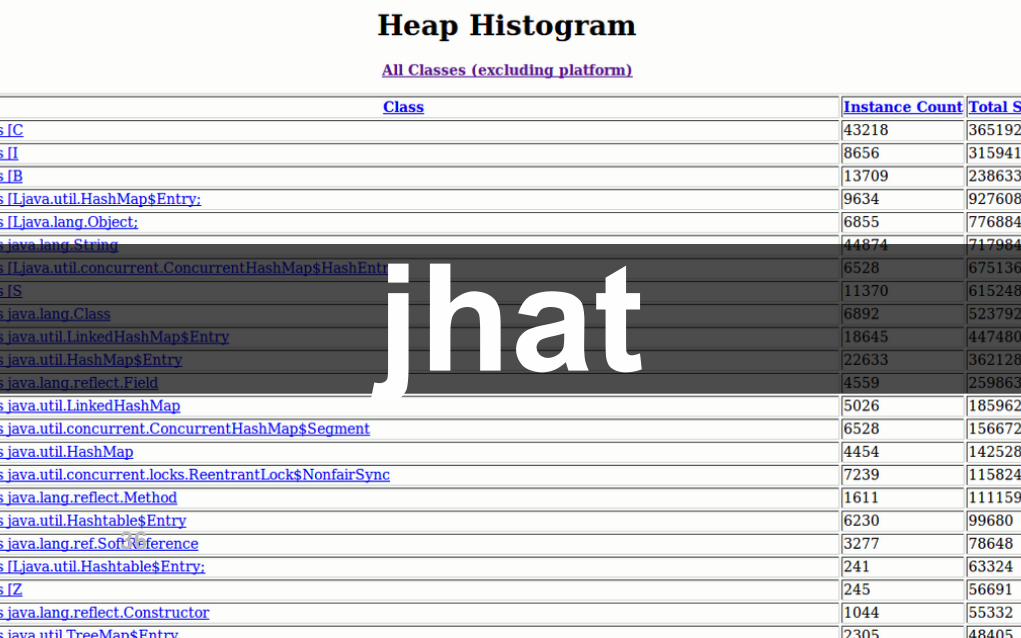
jhat36
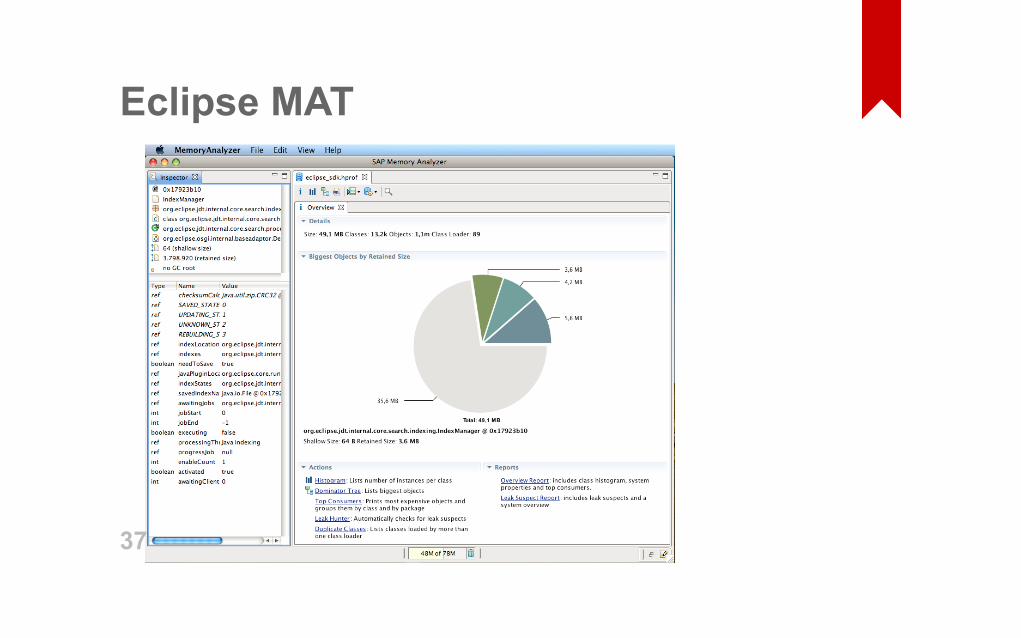
Eclipse MAT
37
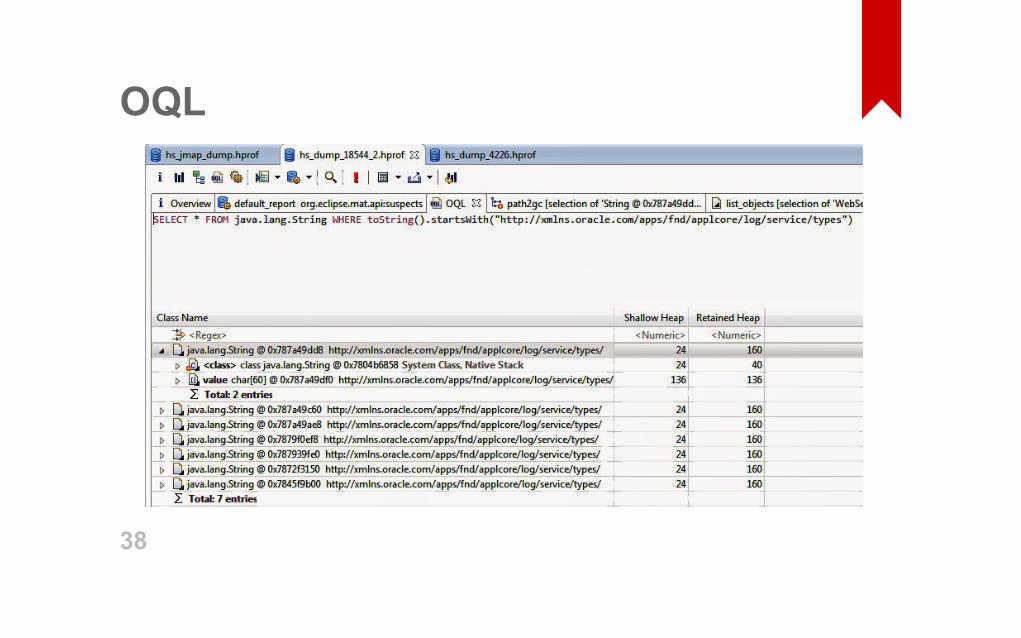
OQL
38
Useful characteristicsObject Shallow Size
Object Retained Size
Stale Objects (not connected to GC roots)
•••
39
Take several dumpsAt application start
At load time (several)
At quiet time
•••
40

ComercialYourKit
jProfiler••
41

Next riddle42

43

Threaddumps
44
SituationsDead locks
100% CPU load
Hanging I/O
•••
45
jstackjstack <java process pid>01.
46
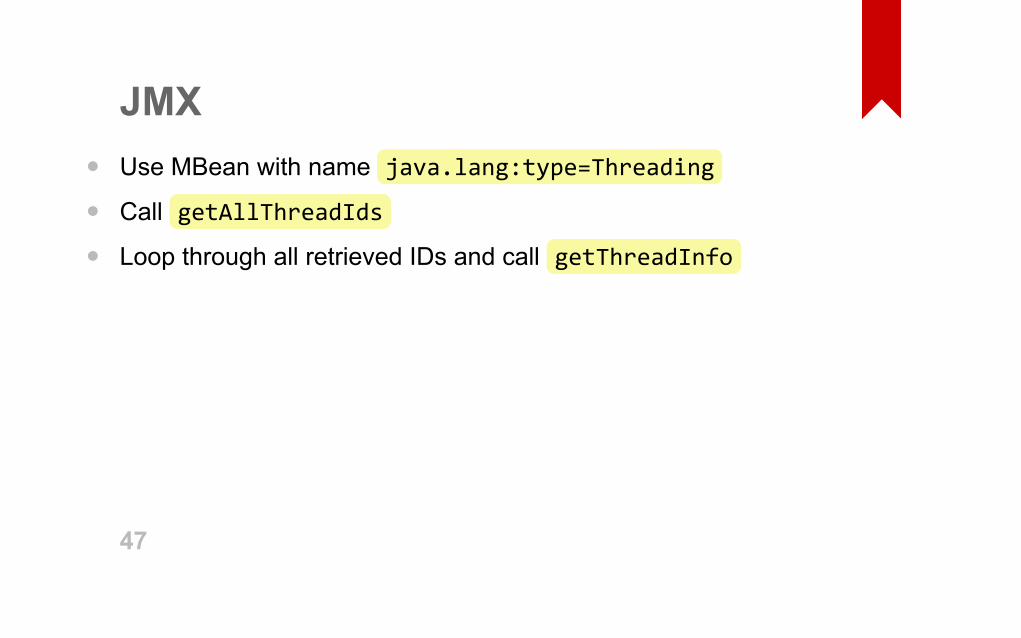
JMXUse MBean with name java.lang:type=Threading
Call getAllThreadIds
Loop through all retrieved IDs and call getThreadInfo
•••
47
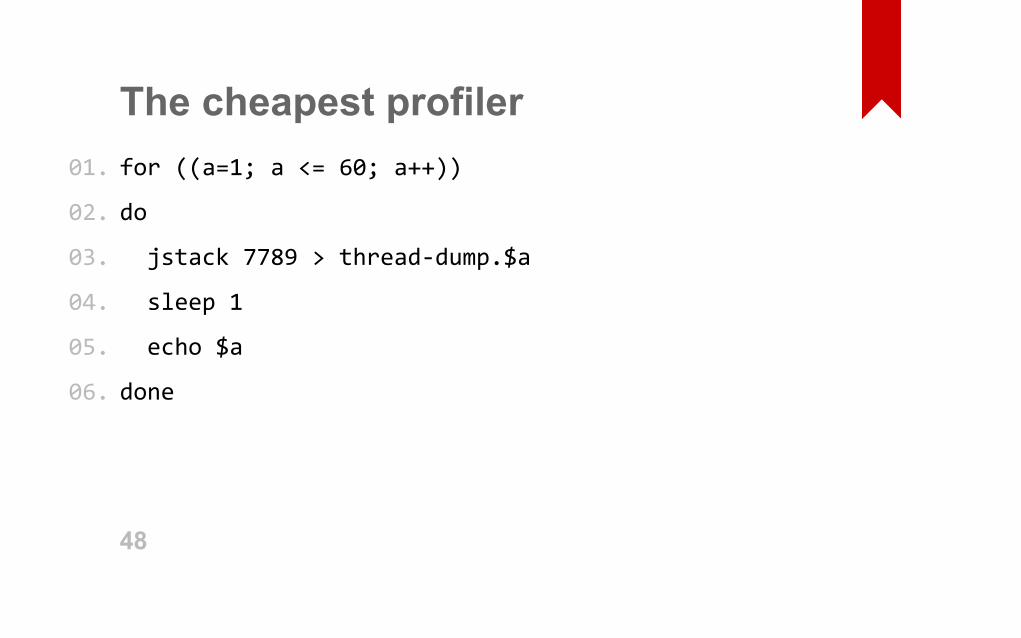
The cheapest profilerfor ((a=1; a <= 60; a++))
do
jstack 7789 > thread‐dump.$a
sleep 1
echo $a
done
01.
02.
03.
04.
05.
06.
48
Thread dumpanalysis
49
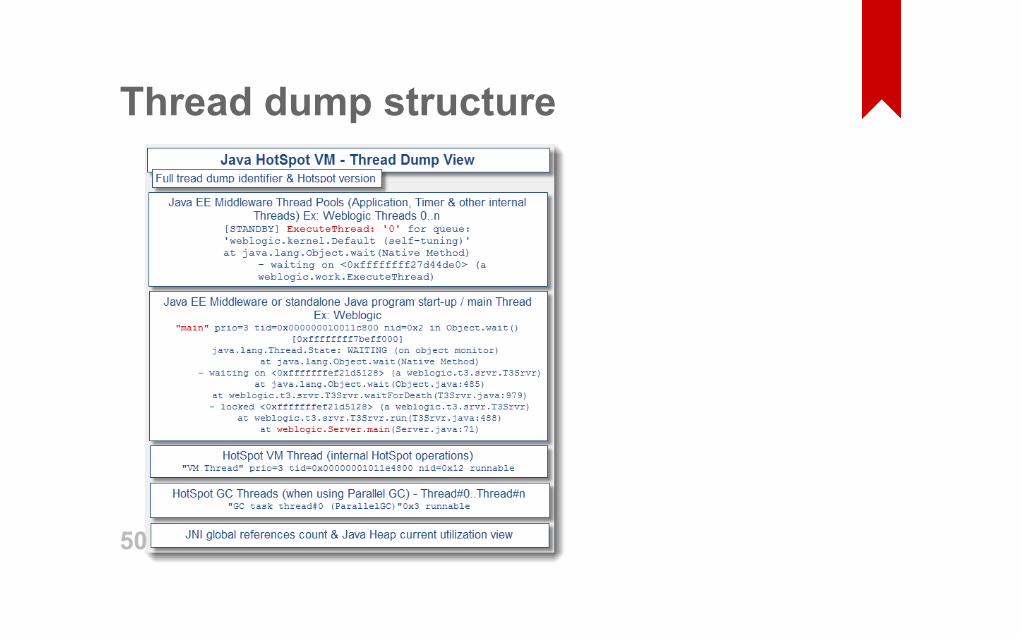
Thread dump structure
50
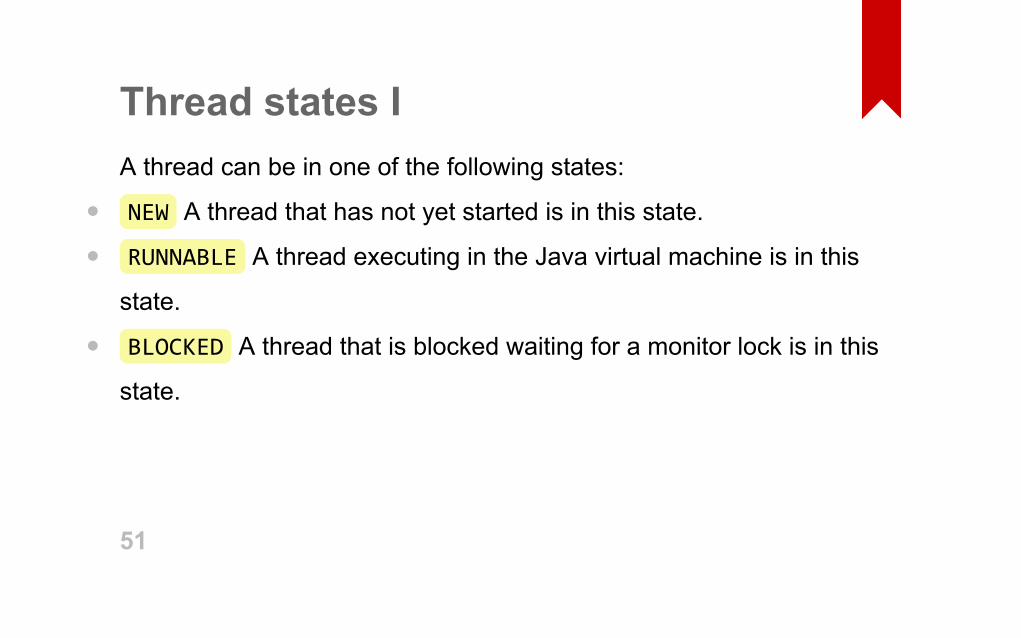
Thread states IA thread can be in one of the following states:
NEW A thread that has not yet started is in this state.
RUNNABLE A thread executing in the Java virtual machine is in this
state.
BLOCKED A thread that is blocked waiting for a monitor lock is in this
state.
••
•
51
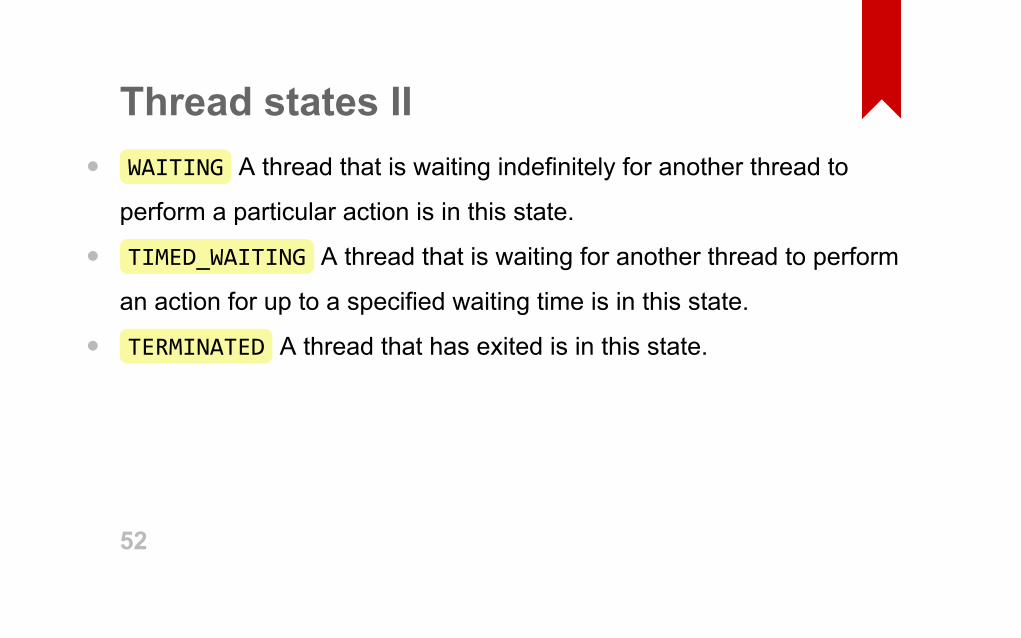
Thread states IIWAITING A thread that is waiting indefinitely for another thread to
perform a particular action is in this state.
TIMED_WAITING A thread that is waiting for another thread to perform
an action for up to a specified waiting time is in this state.
TERMINATED A thread that has exited is in this state.
•
•
•
52
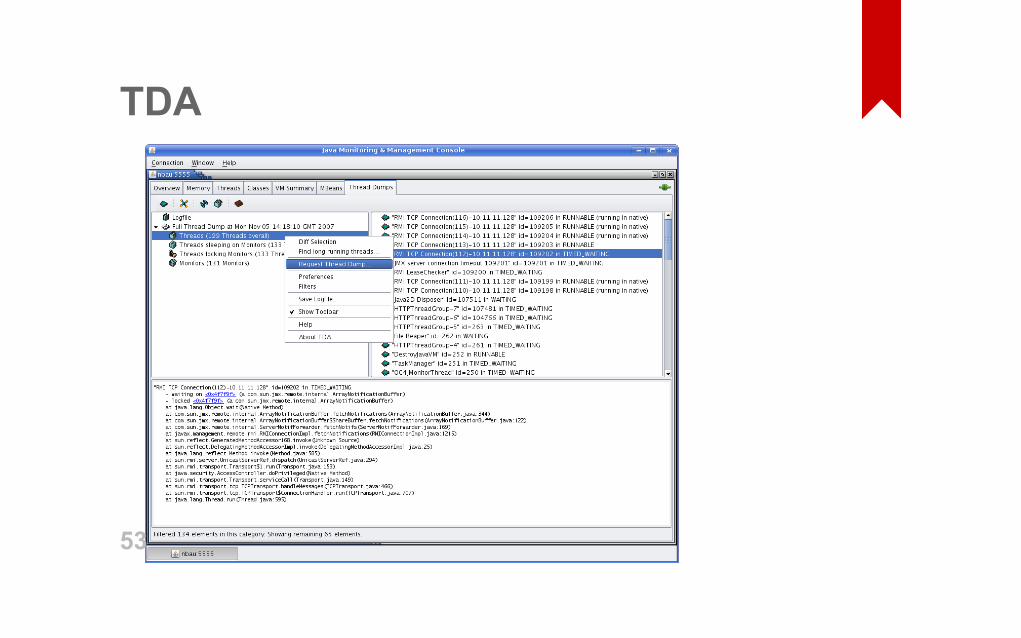
TDA
53

SamuraiTDA
54
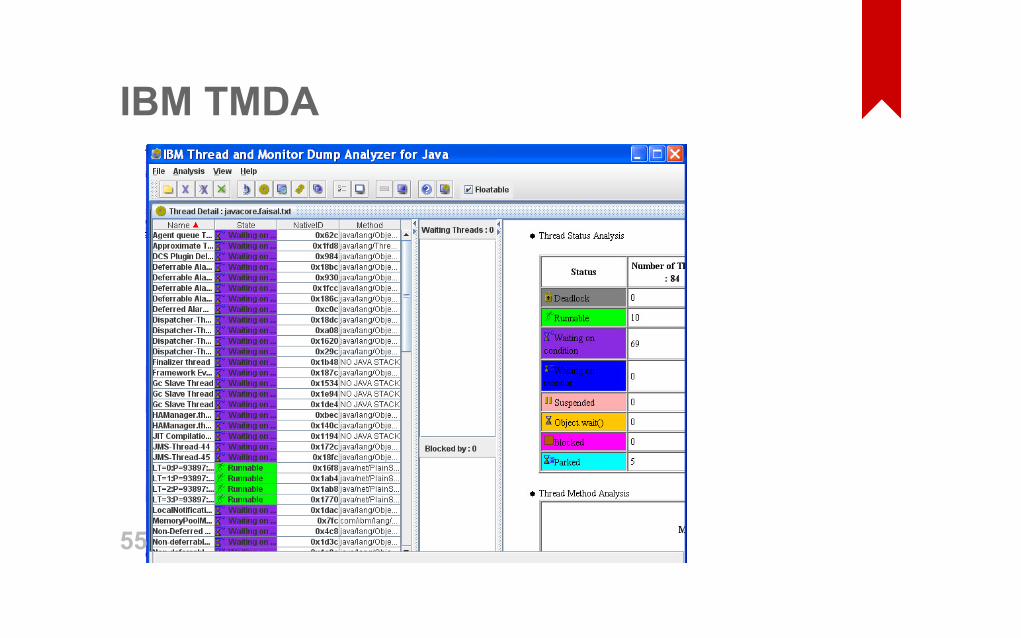
IBM TMDA
55

Use customscripts
56

Next riddle57

58

Debugging59
We need it when we have...Nonreproducable issues
Hardtounderstand code••
60
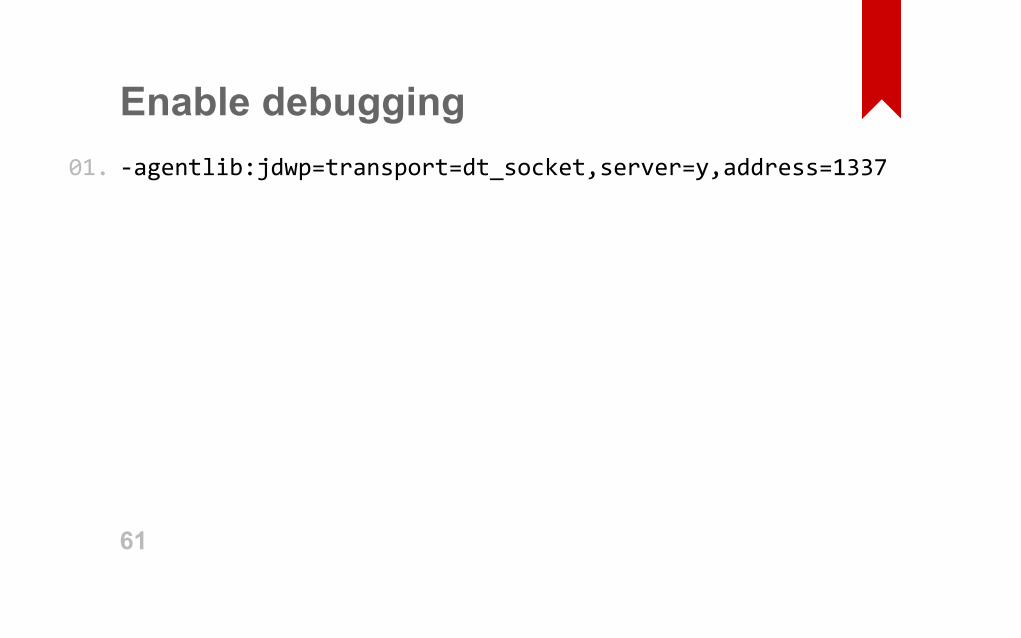
Enable debugging‐agentlib:jdwp=transport=dt_socket,server=y,address=133701.
61
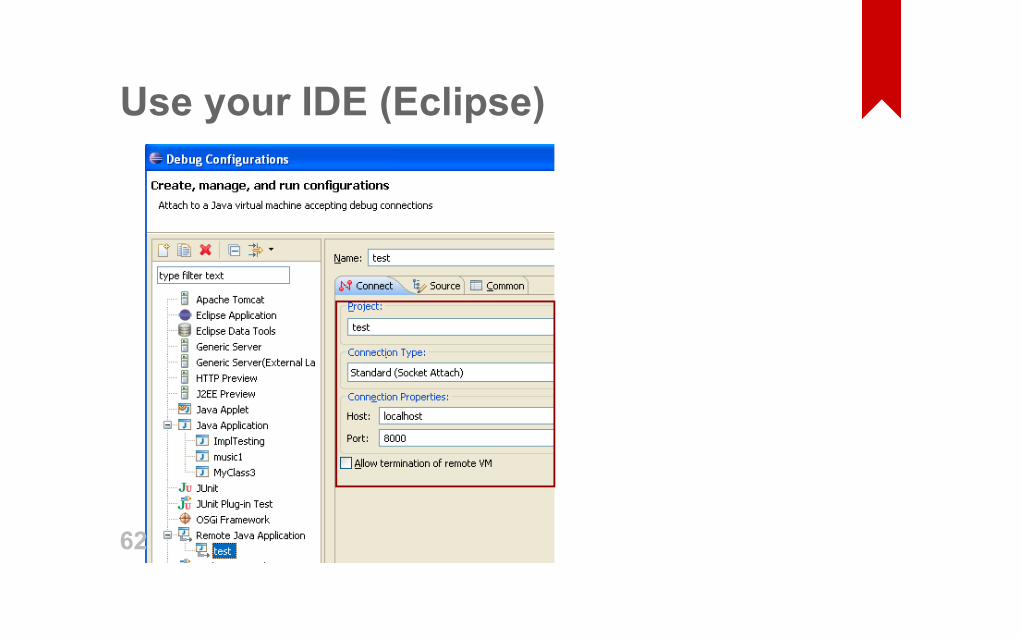
Use your IDE (Eclipse)
62
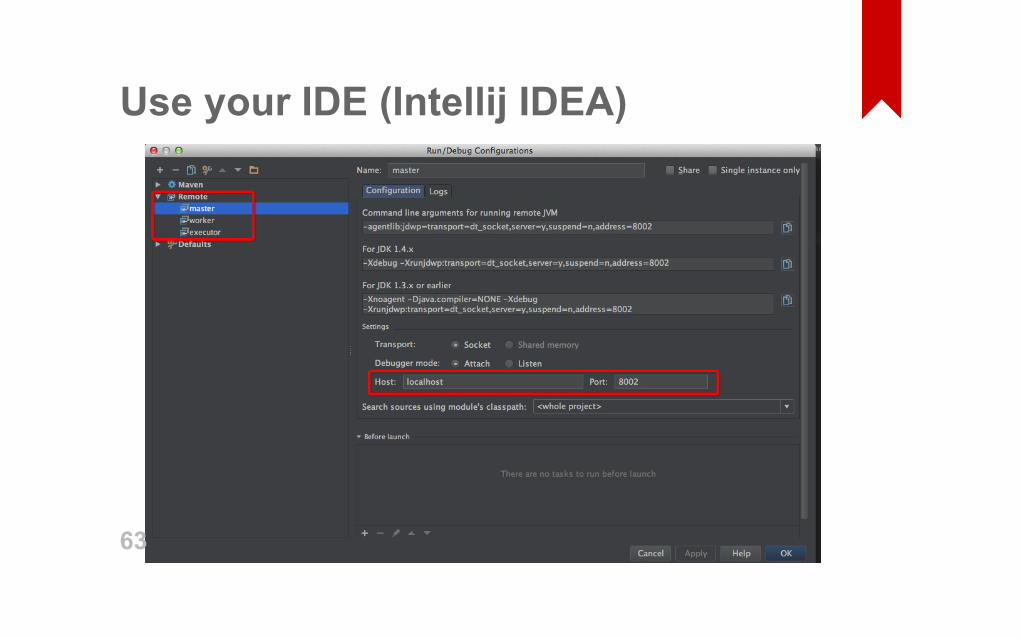
Use your IDE (Intellij IDEA)
63

jdb64
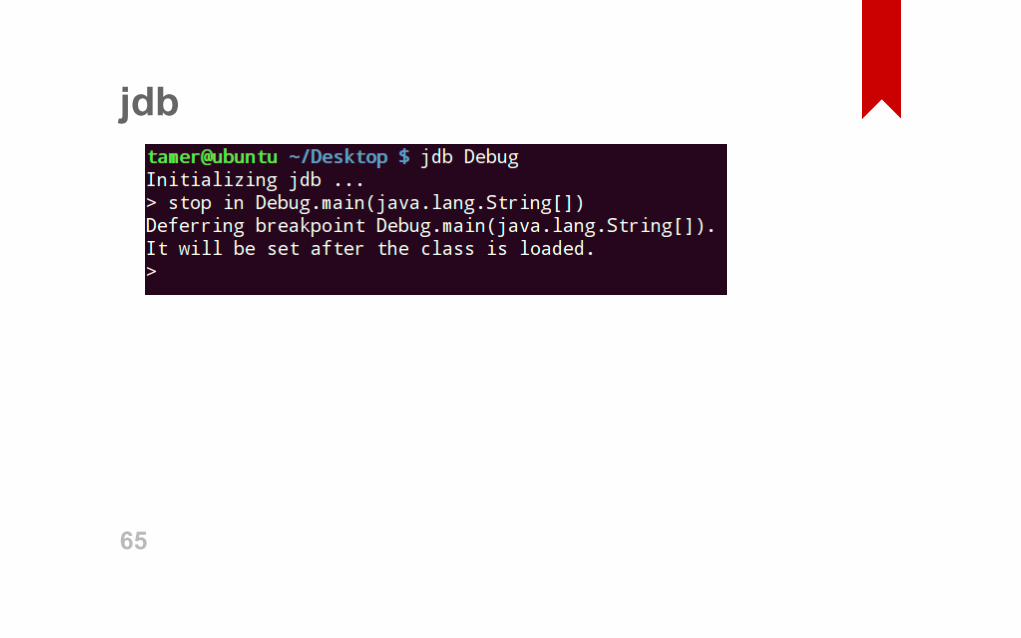
jdb
65

YouDebug66
YouDebugYouDebug is a noninteractive debugger scripted by Groovy to assist
remote troubleshooting and data collection to analyze failures.“67

YouDebughttp://youdebug.kohsuke.org/
https://github.com/kohsuke/youdebug••
68
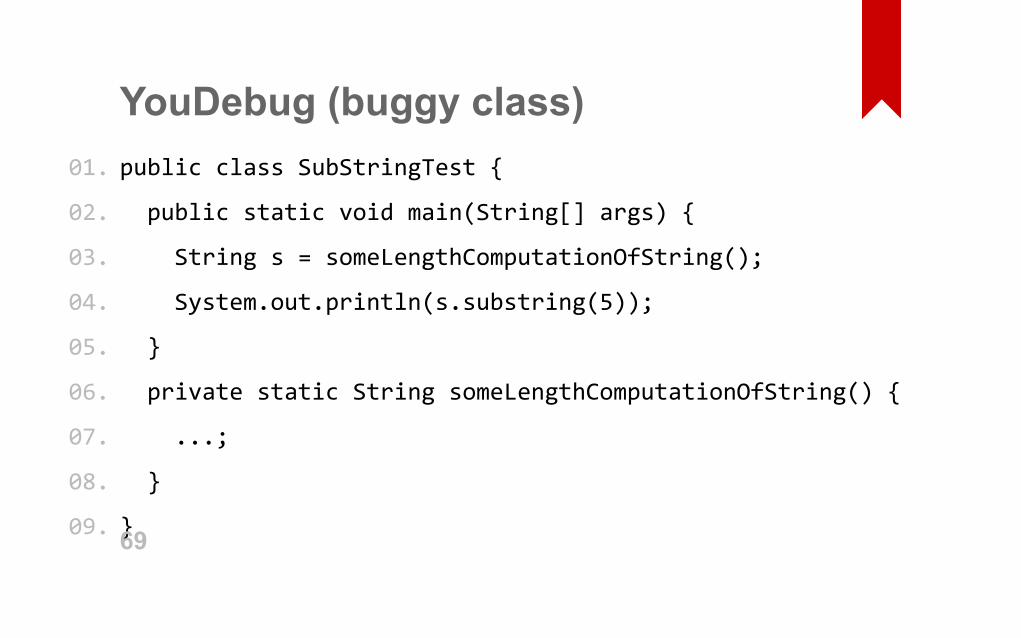
YouDebug (buggy class)public class SubStringTest {
public static void main(String[] args) {
String s = someLengthComputationOfString();
System.out.println(s.substring(5));
}
private static String someLengthComputationOfString() {
...;
}
}
01.
02.
03.
04.
05.
06.
07.
08.
09. 69
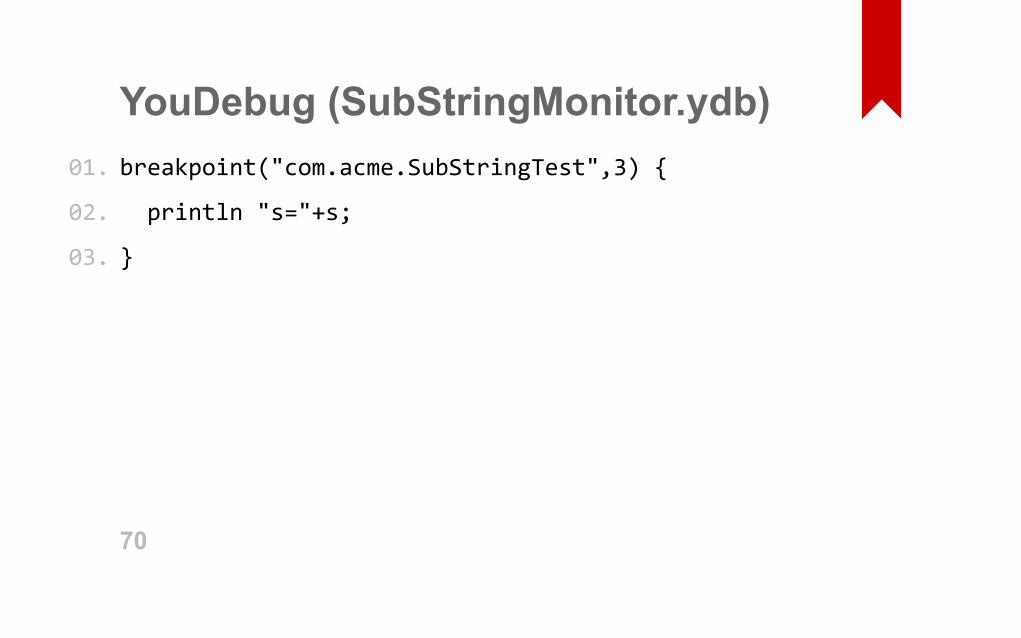
YouDebug (SubStringMonitor.ydb)breakpoint("com.acme.SubStringTest",3) {
println "s="+s;
}
01.
02.
03.
70
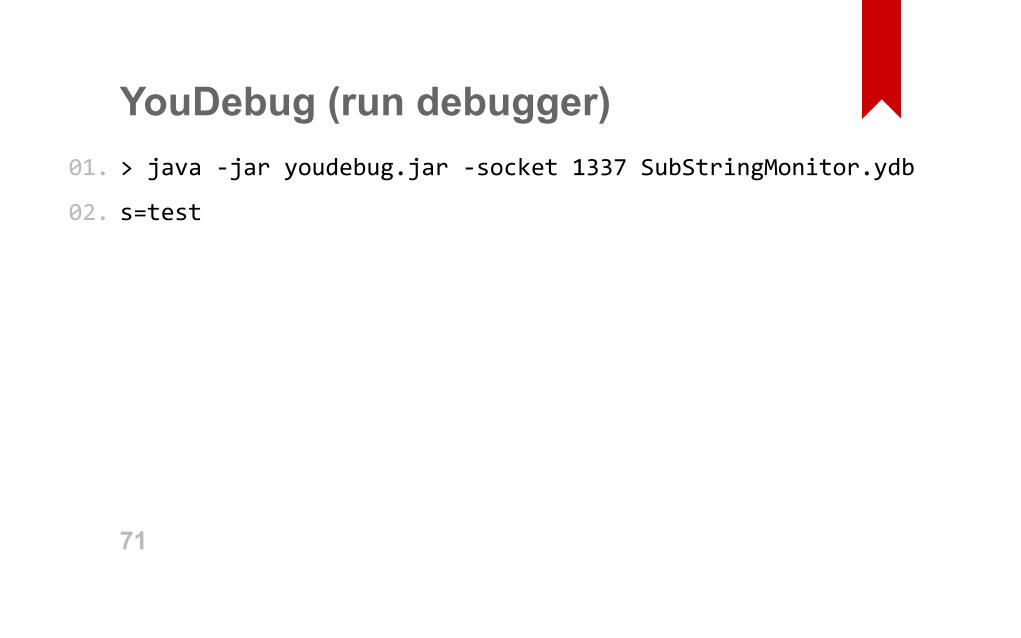
YouDebug (run debugger)> java ‐jar youdebug.jar ‐socket 1337 SubStringMonitor.ydb
s=test
01.
02.
71

Next riddle72

73

Decompiling74
Java Decompiler
75
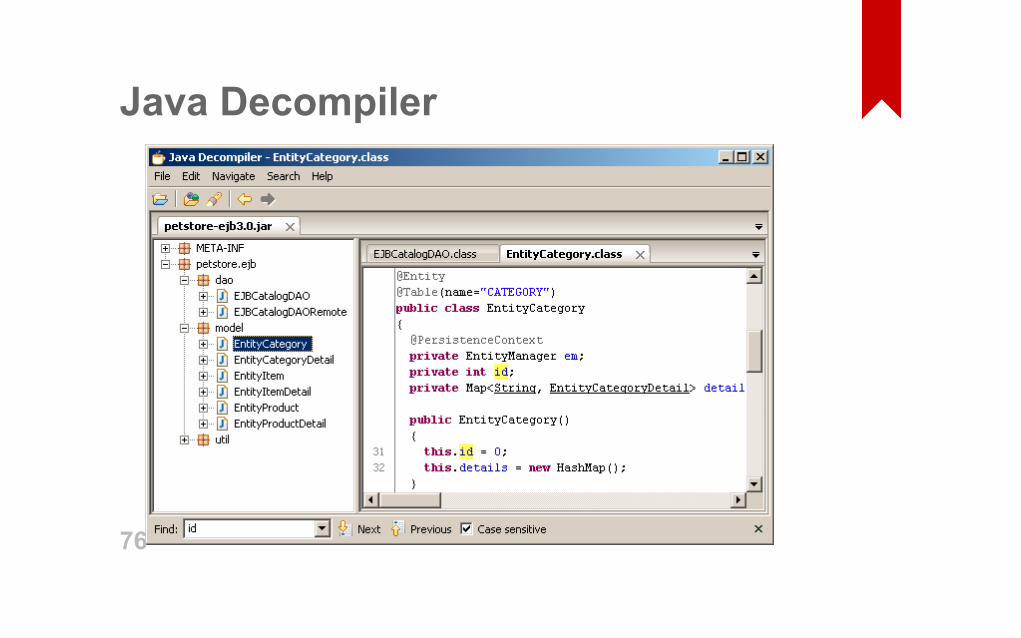
Java Decompiler
76
IssuesLack of support for latest JVM features
Lack of support for other JVM langauges
Obfuscation is always an issue
•••
77

Next riddle78

79

Profiling80

Types of profilingAllocation profiling
CPU profiling
Lock profiling
•••
81
Types of profilingSampling
Intrumented••
82
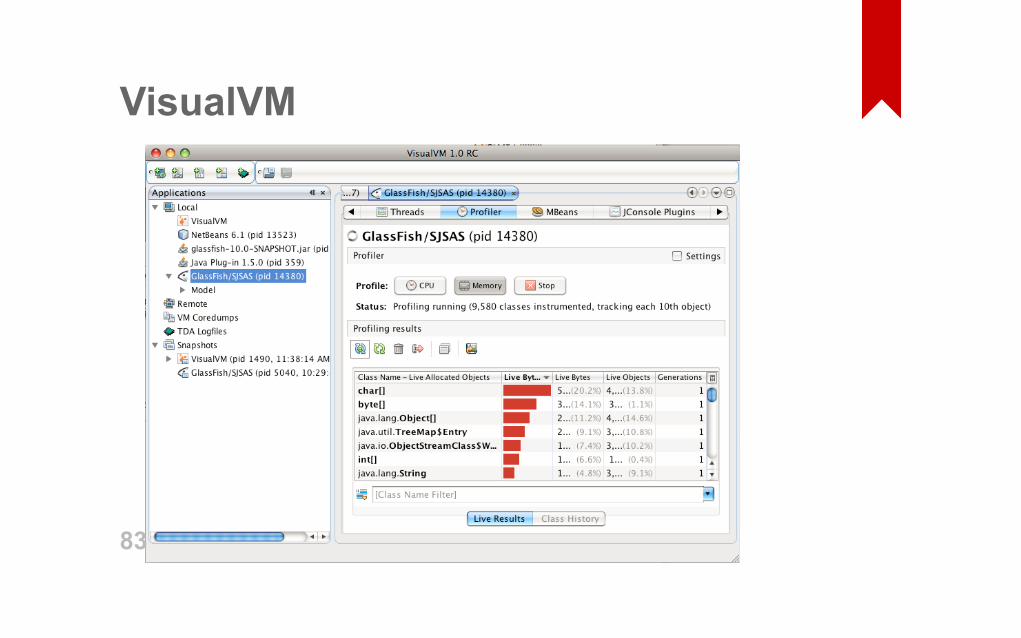
VisualVM
83
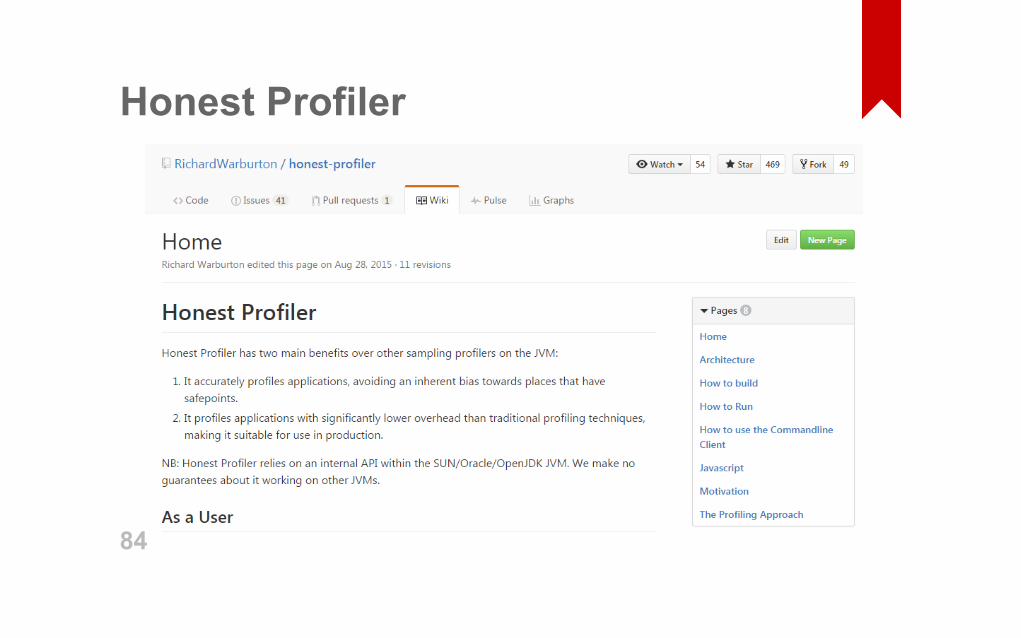
Honest Profiler
84
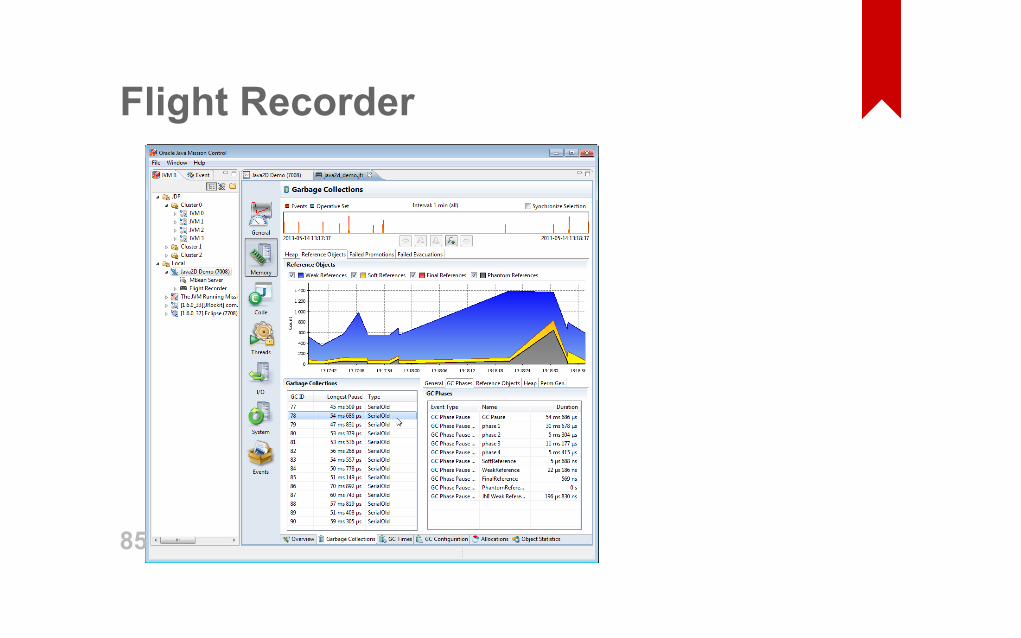
Flight Recorder
85
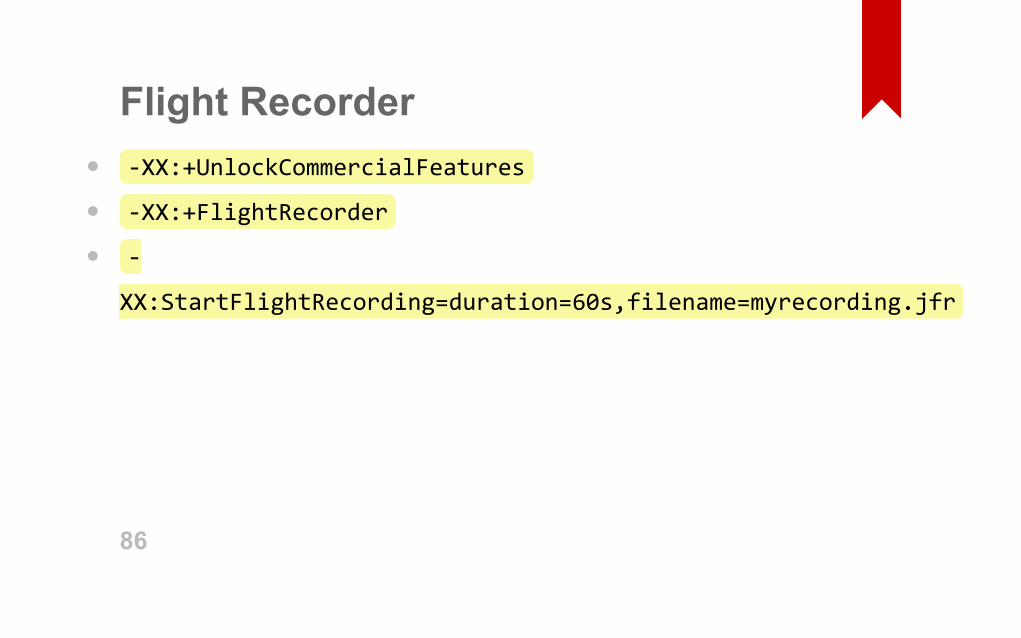
Flight Recorder‐XX:+UnlockCommercialFeatures
‐XX:+FlightRecorder
‐
XX:StartFlightRecording=duration=60s,filename=myrecording.jfr
•••
86

ComercialYourKit
jProfiler••
87

Next riddle88

89

Benchmarks90
JMHMH is a Java harness for building, running, and analysing
nano/micro/milli/macro benchmarks written in Java and other
languages targetting the JVM.“91
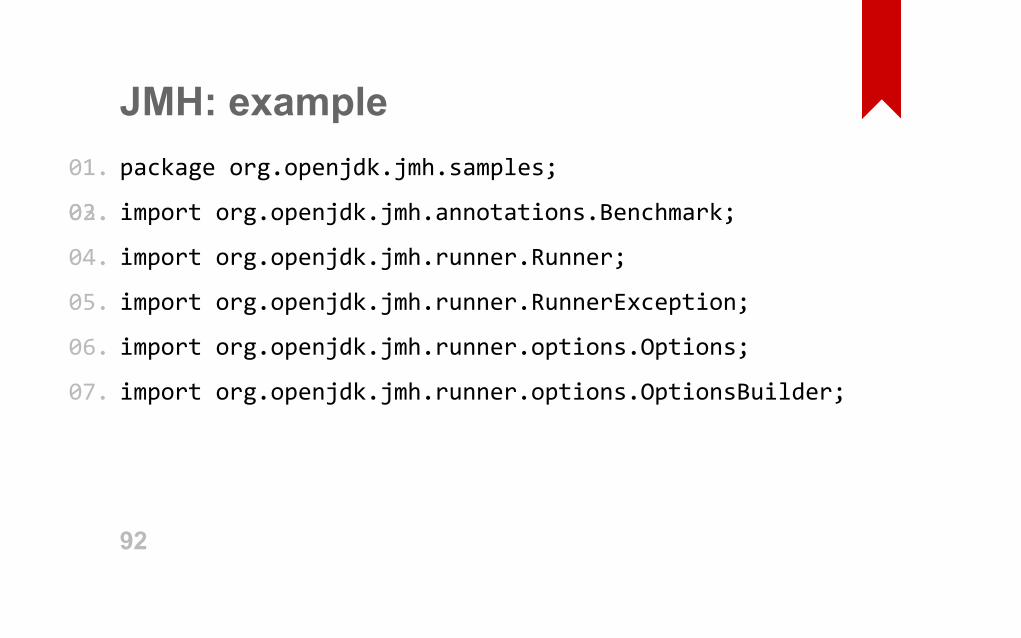
JMH: examplepackage org.openjdk.jmh.samples;
import org.openjdk.jmh.annotations.Benchmark;
import org.openjdk.jmh.runner.Runner;
import org.openjdk.jmh.runner.RunnerException;
import org.openjdk.jmh.runner.options.Options;
import org.openjdk.jmh.runner.options.OptionsBuilder;
01.
02.03.
04.
05.
06.
07.
92
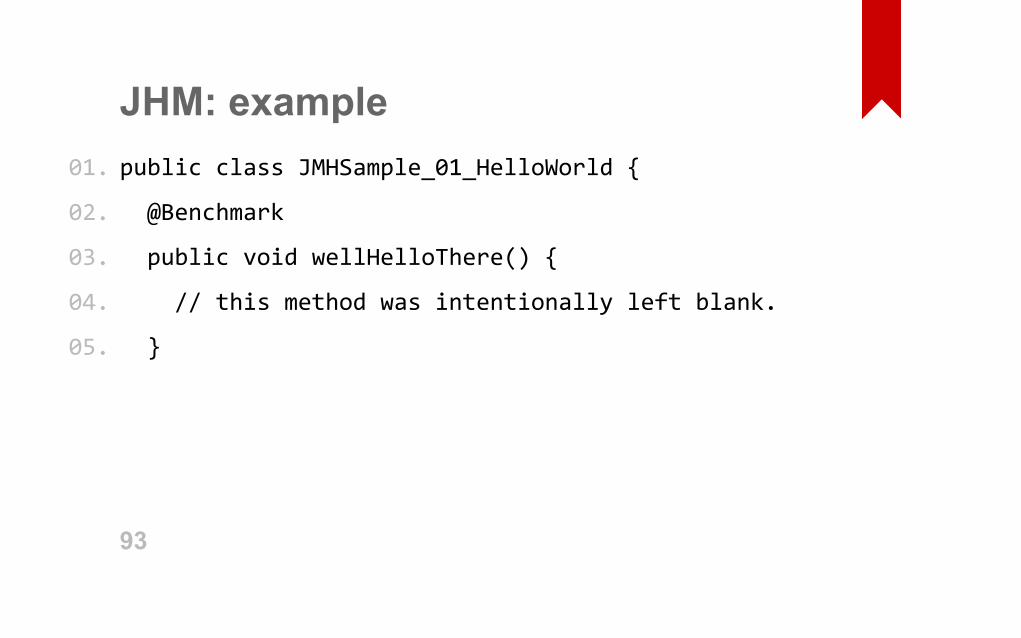
JHM: examplepublic class JMHSample_01_HelloWorld {
@Benchmark
public void wellHelloThere() {
// this method was intentionally left blank.
}
01.
02.
03.
04.
05.
93
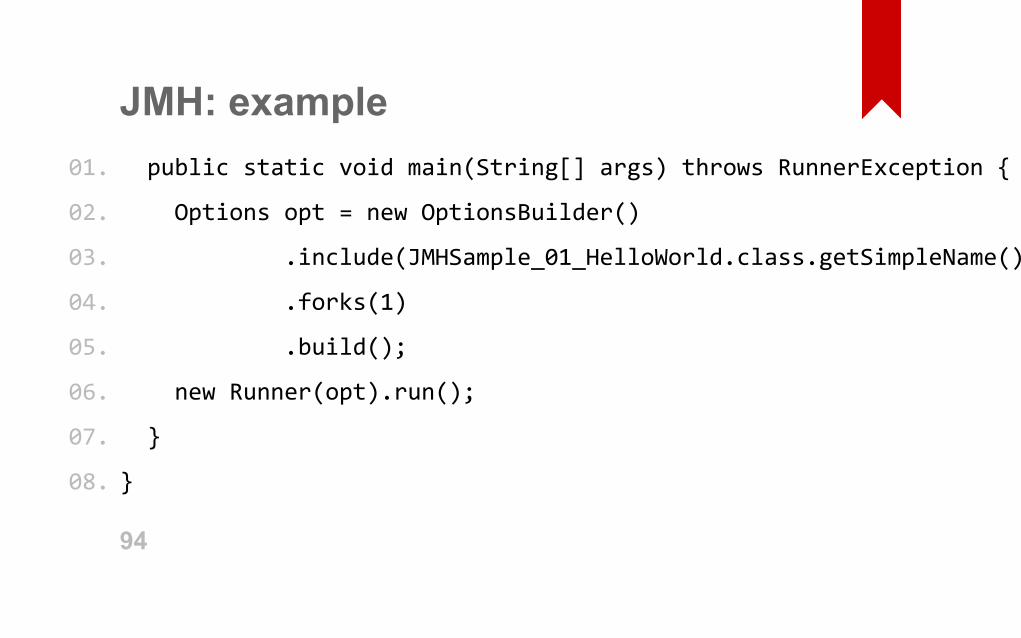
JMH: example public static void main(String[] args) throws RunnerException {
Options opt = new OptionsBuilder()
.include(JMHSample_01_HelloWorld.class.getSimpleName())
.forks(1)
.build();
new Runner(opt).run();
}
}
01.
02.
03.
04.
05.
06.
07.
08.
94
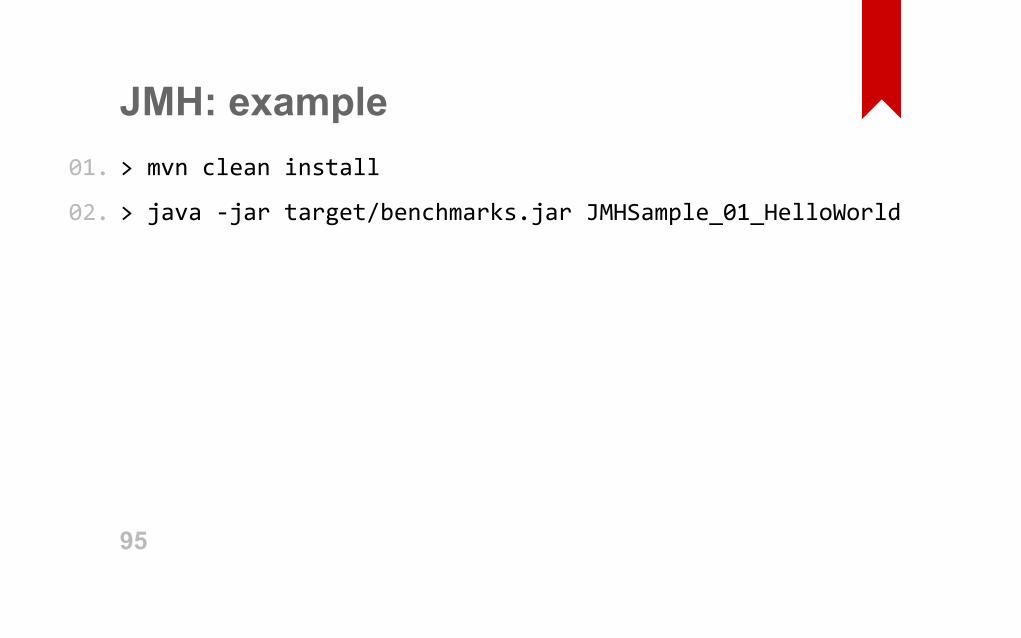
JMH: example> mvn clean install
> java ‐jar target/benchmarks.jar JMHSample_01_HelloWorld
01.
02.
95
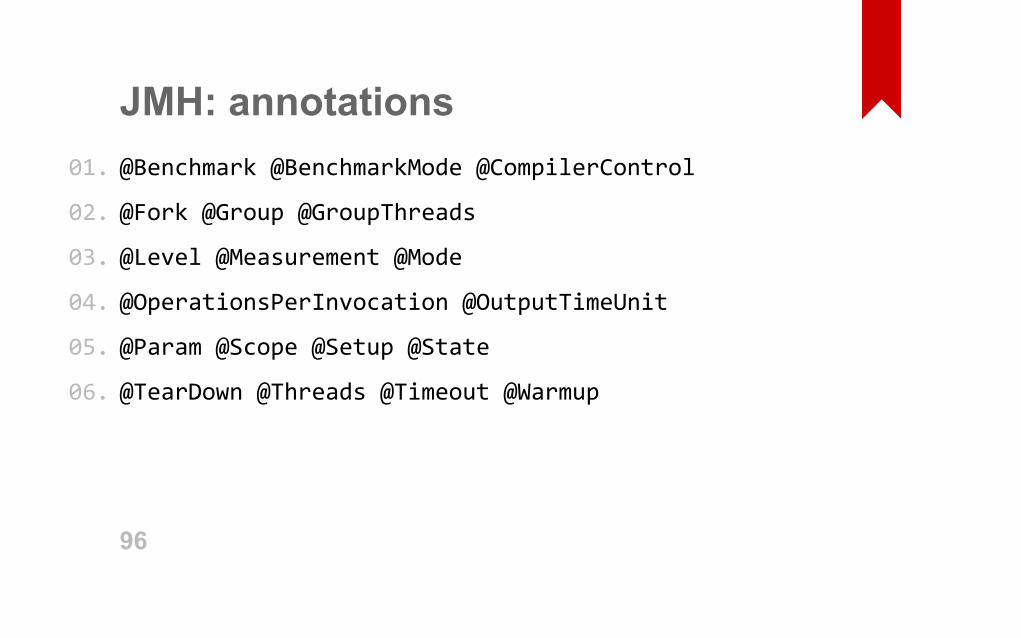
JMH: annotations@Benchmark @BenchmarkMode @CompilerControl
@Fork @Group @GroupThreads
@Level @Measurement @Mode
@OperationsPerInvocation @OutputTimeUnit
@Param @Scope @Setup @State
@TearDown @Threads @Timeout @Warmup
01.
02.
03.
04.
05.
06.
96
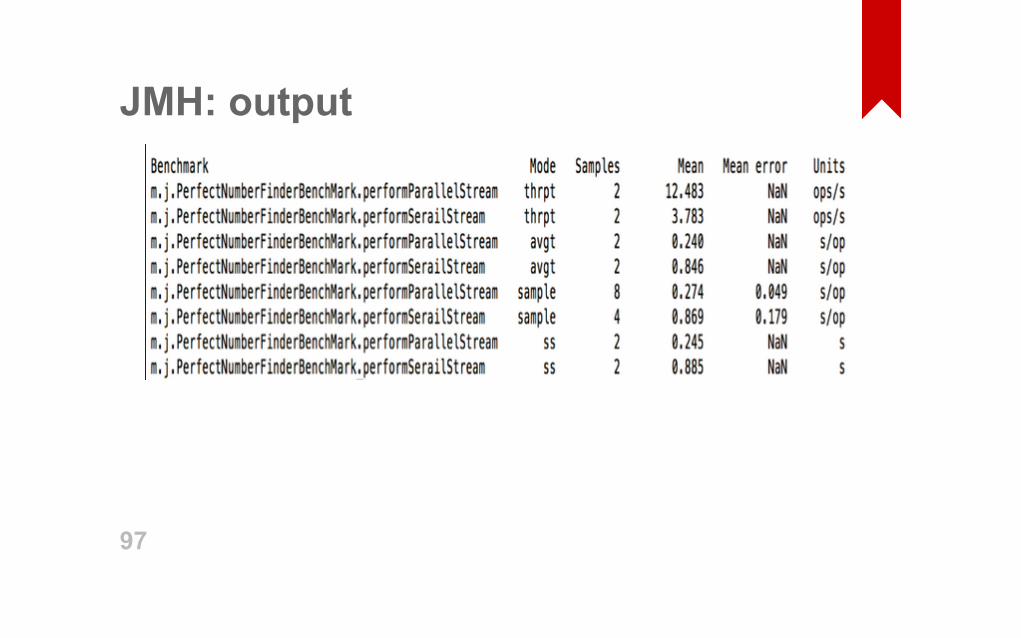
JMH: output
97
Load testing toolsjMeter (http://jmeter.apache.org/)
ab (http://httpd.apache.org/docs/2.4/programs/ab.html)
gatling (http://gatling.io/)
Faban (http://faban.org/)
••••
98

Next riddle99

100

Leakdetection
101

Open sourceLeak Prevention Library
Leak Canary••
102

ComercialPlumbr
AppDynamics
NewRelic
•••
103

Next riddle104

105

Monitoring106
jstatMonitors Java Virtual Machine (JVM) statistics. This command is
experimental and unsupported.“107

JMX is yourfriend!
108
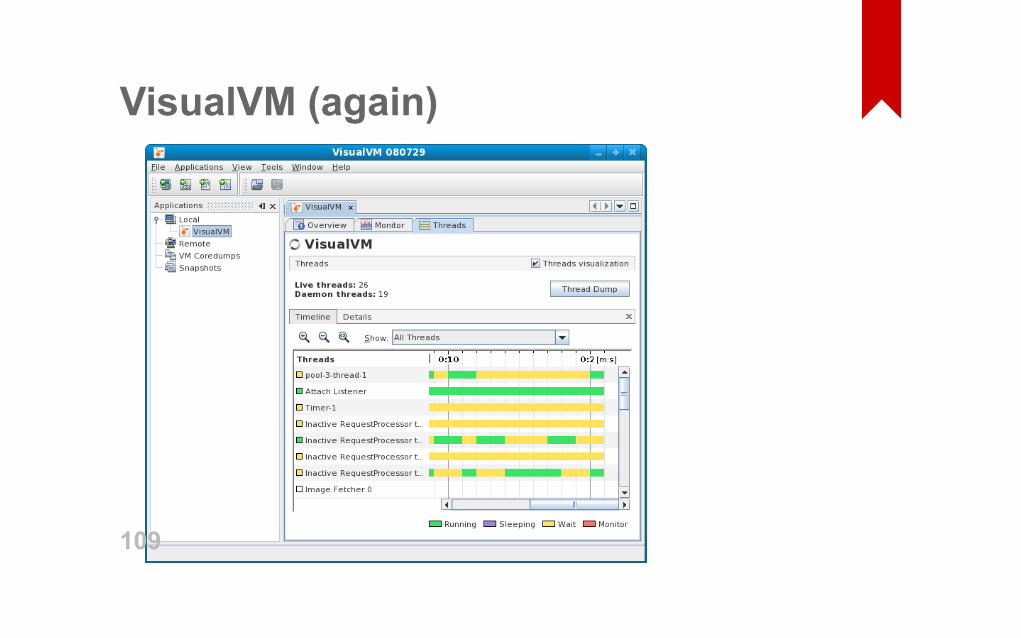
VisualVM (again)
109
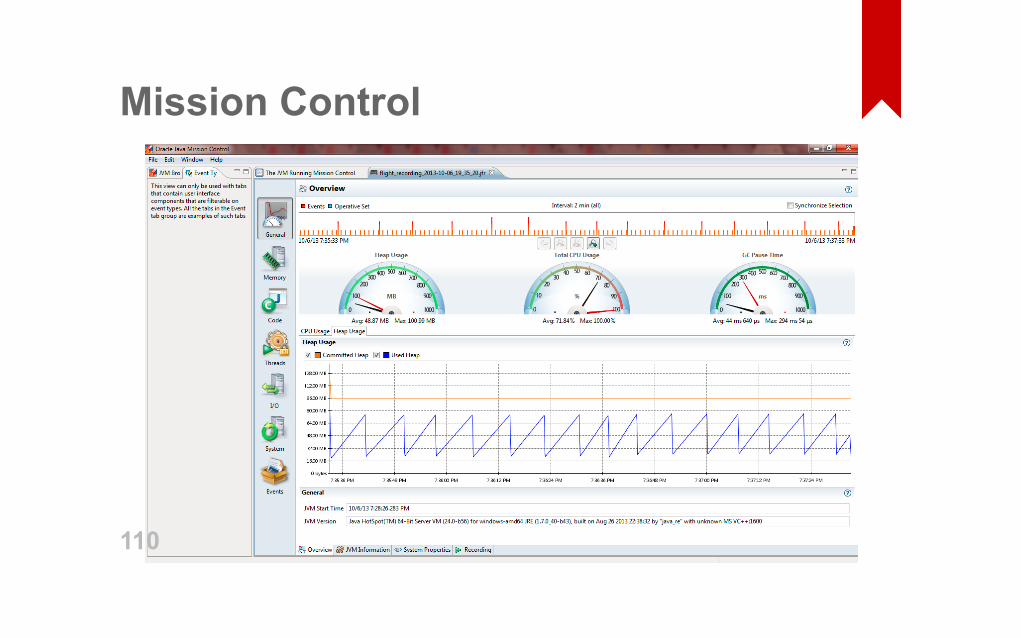
Mission Control
110

Metricscollection
111
JMXTransThis is effectively the missing connector between speaking to a JVM
via JMX on one end and whatever logging / monitoring / graphing
package that you can dream up on the other end.“112
jHiccupjHiccup is a nonintrusive instrumentation tool that logs and records
platform "hiccups" including the JVM stalls that often happen when
Java applications are executed and/or any OS or hardware platform
noise that may cause the running application to not be continuously
runnable.
“113

jHiccup> java ‐javaagent:jHiccup.jar MyProgram01.
114
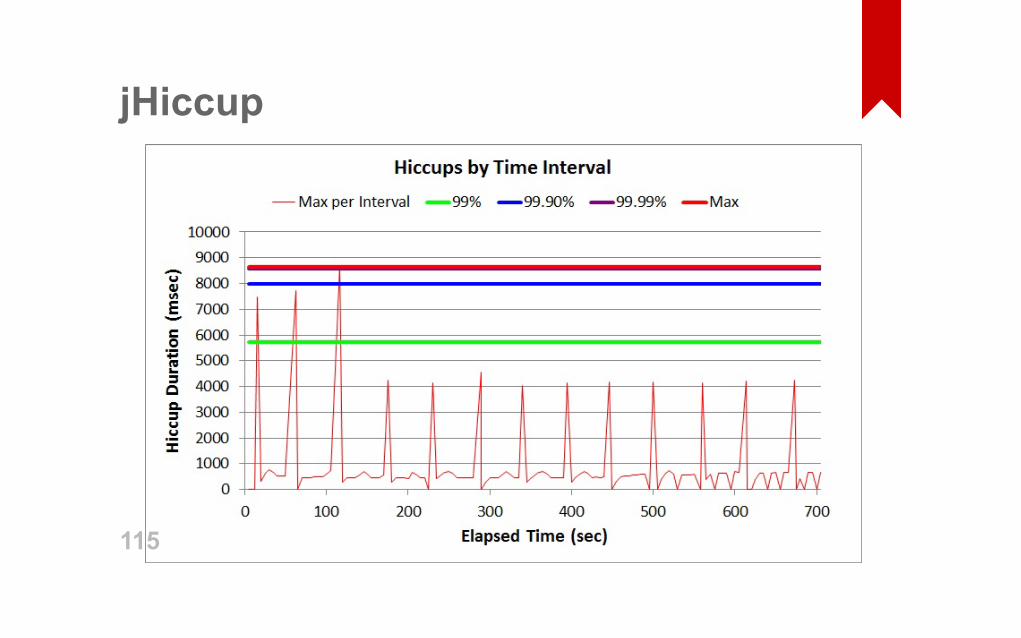
jHiccup
115
Drop Wizard MetricsMetrics provides a powerful toolkit of ways to measure the behavior of
critical components in your production environment.“116
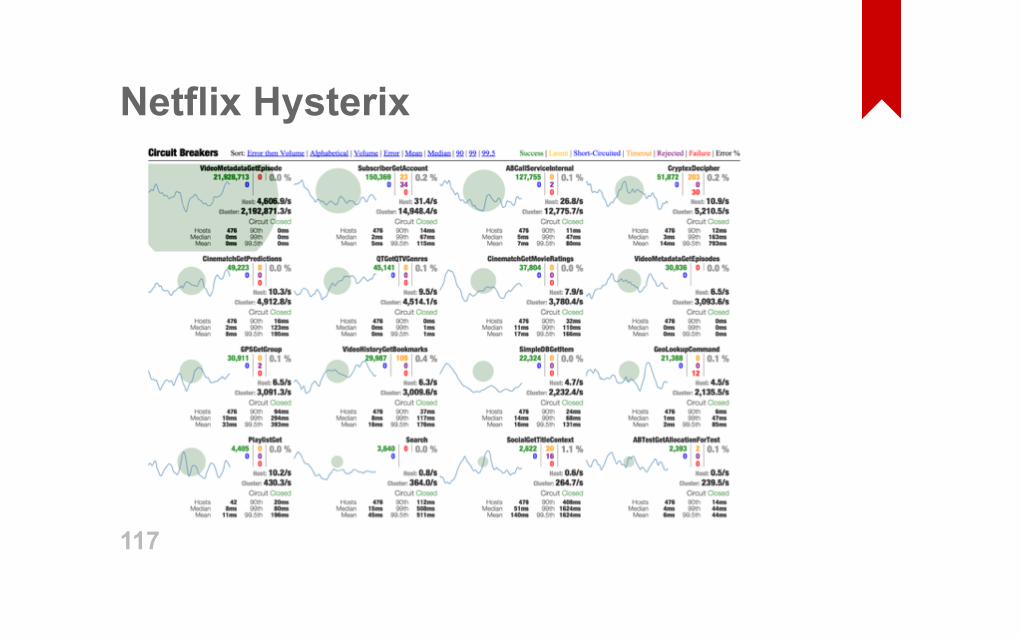
Netflix Hysterix
117
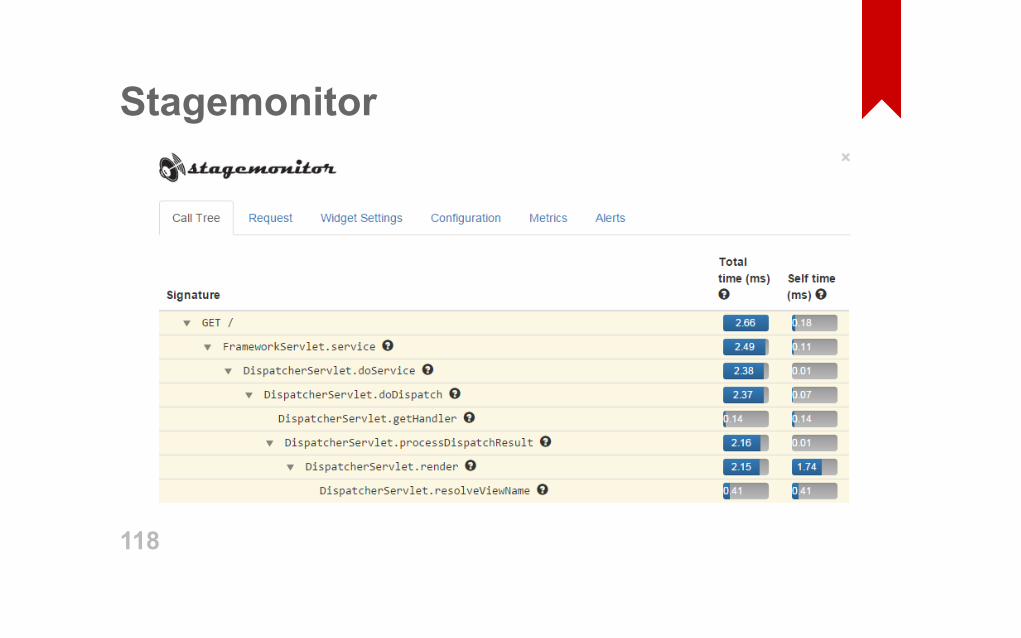
Stagemonitor
118

119

Single JVM?120

Really?121

122

Dead JVM123

124

Many JVMs125
Opensource toolsGraphite
Graphana
Logstash
Kibana
Graylog2
Fluentd
••••••
126
Comercial toolsNewRelic
Plumbr
AppDynamics
Dynatrace
Takipi
Hyperic
••••••
127

Final riddle128

129

Links130
Links: GChttp://spin.atomicobject.com/2014/09/03/visualizinggarbage
collectionalgorithms/
http://techblog.netflix.com/2013/05/garbagecollection
visualization.html
http://blog.sokolenko.me/2014/11/javavmoptionsproduction.html
https://blog.codecentric.de/en/2013/10/usefuljvmflagspart7cms
collector/
•
•
••
131
Links: GChttp://blog.ragozin.info/2011/09/hotspotjvmgarbagecollection
options.html
http://blog.tier1app.com/2014/11/19/understandgarbagecollection
log/
http://www.tagtraum.com/gcviewervmflags.html
•
•
•
132
Links: GChttp://fasterj.com/tools/gcloganalysers.shtml
https://github.com/chewiebug/GCViewer
http://www.jclarity.com/censum/
•••
133

Links: Thread dumpshttp://www.javacodegeeks.com/2012/03/jvmhowtoanalyzethread
dump.html
http://www.slideshare.net/buzdin/threaddumpanalysis
http://docs.oracle.com/javase/7/docs/api/java/lang/Thread.State.html
•
••
134
Links: Toolshttps://github.com/akullpp/awesomejava
https://github.com/aragozin/jvmtools
http://openjdk.java.net/projects/codetools/jmh/
•••
135
Links: Toolshttp://youdebug.kohsuke.org/
https://java.net/projects/tda
http://samuraism.jp/samurai/en/index.html
•••
136
Links: Toolshttps://github.com/jmxtrans/jmxtrans
http://www.stagemonitor.org/
http://jamonapi.sourceforge.net/
https://github.com/Netflix/Hystrix
••••
137
Links: Toolshttp://www.eclipse.org/tptp/home/documents/tutorials/profilingtool/profilingexample_32.html
https://github.com/mjiderhamn/classloaderleakprevention••
138
Links: ToolsjMeter (http://jmeter.apache.org/)
ab (http://httpd.apache.org/docs/2.4/programs/ab.html)
gatling (http://gatling.io/)
Faban (http://faban.org/)
••••
139

Readingmaterial
140
Java Performance
141
Java Performance Companion
142
Java Performance: The Defenetive Guide
143
Java Performance And Scalability
144

This is it!145

Questions?146

Thank you!147
Devternity12 of December, 2016, Riga
Software Excellence Conference
4 tracks, 30+ speakers, 6 workshops
http://devternity.com
••••
148