near-infrared reflectance instrument analysis of grain...
TRANSCRIPT

919049
~ Near-Infrared Reflectance
Instrument Analysis of Grain
Constituents A Cost Study~
Floyd F Niernberger
~r-Ui[~rrJ of ~ IImCirJn it~iiar EconomIcs
[1Jclil~iaff[m ~nter
DEC 2 0 i978
US Department of Agriculture
Economics Statistics and Cooperatives Service
I
BIBLIOGRAPHIC DATA I Report No 3 RicipienlsAccession No12
SHEET ESCS-20 4 Titlela~dSubdde 5 Repon Date
JUI)e 1978NEAR-INFRAREP REFLECTANCE INSTRUMENT ANALYSIS OF GRAIN CONSTITUENTS A Cost Study 6
7 AUlhor(s) s P~~forming-Organjzalion Rept Floyd F Niernberger No E~CS-20
9 Performinp Or8anization Name and Address 10 Proie_CfTask~rork Unit-No Comri-odi ty EcorlOrriics Division
Sta_tisectitLcS and Cooperatives Service~cpnomJcs 11 COn[raCfGrafl-l No US Department oK~Agriculture
Wa_~hin-gton DC 20250 12 Spons_orinOrsanizatin Name and Address 13 Type of Repon amp Period
COveed
Final
IS Supplemenlary Nares
n AbslfIiclS Costs of using near-infrared reflectance (NIR) in~trumerits for determining protein and
moisture con tent of grains and their- products are gynthesized for five levels of and 80 samples per shift Variable costs are substa~tiallyoperation 5 10 20 40
greater than fixed costs ith operat_or wages the major contributing fact0-W Cost a~d ~lia~ges for Kjeldcihl sample analysiscomparisons bet een NIR per-sampl~ eStimates
y commercIal laboratories indfcate lower NIR costs at 20 40 and 80 samples per
s~ift 1pound econolflic yalue ere pl~ced on advantageous factors of the NIR method over
the Kjeldahl method cost comparison would be even mor~ favorable fo~ the NIR method
17 Key Words~und DJcuentilnalysis 17a D_escjiptor~
Chemical analysis Cost comparisons Economic analysis Economic evaluations Economic factors Grains (food) Infrared equipment Moisture cont-emt Proteins Water content
17b ldenifiersOpen~Ended Terms Air oven moiseure test 22 Price Federal Grain Inspection Service Paper copy $460 Gratn ana1ysi~ costs Fiche copy $300 Grain protein determination NTIS prices subject to change afeer Kjeldahl method October 1 1978 After that date Near-infrared reflectance instruments for new price schedule N~ar-infrared refiectance anaiysis ~osts for paper copy and
_7~ COSAfIFielJGrollp 02-B 02-C 06-H 13-H ~~~c~o co~~~ A02
contact NTis
19 Se_curity Class (This 21 No of PageslB Avil~hility Starement 24After iriitial distribution this puli1icatio9- will be Re~~~tr ltltIFI~D for sale by NTIS US Department of Commerce ~SeCurity Class (Thi~ 22 Price
Pug _ 5285 Pore Rovai Road Sprinfield Virginia 22161 UNCLASSIFIED ltpp aboup
FOR~ ijTIs-3~ IREI tomiddot~) ENOORSED BY MUlt ASD UNESCO useomiddotoc Bl6S 4
June 1978Washing con DC 20250
CONTENTS
-Summary bull
Introduction
Methodology _
Costs- Inve-stment costs 6p~rating costs
Economic relationships
Cost comparisons
Appendix A--Per-bushel cost$
AppendiX B--Basic equipment
Appendix C--NIR irtstrumetlt depreciation
Mention 9f a company trademark or proprietJirY prodll~t in this report is for refe-renee Drily It neither constitutes a guarantee- or warranty of a product by the US Department of Agriculture nor implies appr~val to the exclusion of other suitable co~p~tlies or produc t S
iv
1
2
4 4 4
9
11
13
14
15
iii
SUMMARY
Cost estimates indicate that using near-infrared reflectance (NIR) instruments to measure pr-oteln aiid lloistu~r_e content in grains and their products is a practical method of analysis Also the N(R method generates rapid analysis (45 to120 seconds includshying sample preparation depending on the instrument model and operations performed) wh~ch allows its use in a multitude of grain ind~~ty operations previously denied protein monJtoring applications by slower methods of dete~inatfoll
Per-sample operating costs of the N~~ method are estimated for five -levels of operation 5 10 20 40 middotand 80 samples per 8-hour shift These are further diVided into two categories low-cost estimates for when the NIR instrumEmt is installed in a controlled-enVironnient laboratory and high-cost estimat~s which require additlonal expenditures to provide minimum instrument operating condition-s in other locations
Comparisons between N~~middotper-sainple cost estimates and charges for kjeldahl saII1ple analysis by commercial laboratories indita_te lower NIR costs in low-cost estimates with 10 samples per shift and for both 10- and high-cost est1mates at 20 40 and 80 samp)es per shift In addition NIR users report otheradvantage_smiddot overmiddot the Kjeldahl method of analysis spatemiddot requiremgfits are smallerbull installation and maintenance ~re less expensive there are fewer safety haz-ards an-d operator training is less time conshysuming and less rigorous If economic value were placed on these advantageous factors of the NIR method t_he cost compar-ison would be even more favorable over the Kj ~1dahl method
Investment re_quirements for equipment and installation range from $16460 t~ $17720 Operating costs decrease ~onsiderably as the number of samples analyzed increases Fixed costs at atl sample lev-~l~ aie assumed to be constant thus they decJine in percentage of total cost as the number of samples analyzed per shift -inshycreases Variable costs increase primarily because of increased labor cOsts associated with l~igher num~ers_ 9f samples analyzed
I
iv
I
NEAR-INFRARED REFLECTANCE INSTRUMENT ANALYSIS
OF GRAIN CONSTITUENTS A Cost Study
Floyd F Niernberger
INTRODUCTION
Grain quali ty is de termined by cons ti tuent value (protein oil starch etc) which must be -properly identified so only grain with similar constituent values wi_ll be commingled This means a grain I 5 content must he determined at the -beginning of handling and storage so R may be set aside for l_ater us-e
Coun try terminal and port eleva tors have developed unload ing tech~iq~es and equipment which move grain from receivihg vehicles to storage biDS as qUickly ~s 2 to 5 minutes In order for a constituent analysis method to be practical it must detershymine gri3-in cOQteIlt within these time limits
Cost estimates indfcate that an economically feasible anE~iei m~y be near-infrared reflectance (NIR) instruments which can aI)alyze samples in 45 to 120 seconds (includshyi~g sample prepa~ation) depending on the instrument model and operations performed
This report gives estimates of investment and operating ltosts of u~i-llg NJR instruments to Cleiermine protein and Iloisture co~tent in grains a~d their products Annual cost schedules of per-sample ~nalysis are presented for five levels of operashytion Procedures to convert per-sample costs to per-bushel costs also are provided These estimated costs of NIR instrument analysis are compared with sample-testing charges of commercial laboratories
The information and cost estimates contained in this report should provide useful guidelines for anyone in the grain industry considering investment in an NIR instru-middot ment Grain producers handlers merchandisers and labora tqri~s concern~ed wi th grail) content testing can use this information to plan improvement of their specific operashytions and t~eir profit
The standard laboraio~y method for estimating protein in grains and their prod~middot ucts -is the Kjeldahl test () I which is based on nitrogen content and h~s been wideJy accepted since ntroducti6n of the original procedure in 1883 11 In 1975 Pomeranz and Moore reviewed the method and desLribed its usefulness in grain protein evaluation lt~) Other types of chemical tests for proteln and modifications cif the cjfJicial
Niernberger is an agricultural economist with the Commodity Economics Division Economics Statistics and Cooperatives Service stationed at the US Grain Marketing Research Center Manhat tan Kans
XI ~Grain holdmiddoting bins may be installed in the unioading system to allow time for slower analYSis methods but costs escalate rapidly as grain volume increases ~ Underscored numbers in Rarentheses refer to references listed at the end of this
report
1
Kjeldahl met~od also are used by the grain trade These were developed primarily to meet a need for decreasing the t~e required to perform the standard Kjeldahl test
The middotstandard method for estimating moisture has been the single-stage air oven moisture test (~) Other methods also are used in commercial grain trade and by the Federal Grain Inspection Service (FGIS)
Research investigations into procedures and techniques for 4eve10ping ~IR spectroshypl1otometry to determirie the quality constituents of agricultural products have been carried out since the sixties A review of these investigations and a description of NIR instruments used for determInation of protein oil and moisture in grains oil shyseeds and feedstuffs have been reported by Watson (l1)
The NIR technique for protein and moisture determination has gained steady acceptshyance by the grain industry since the first commercial instruments were introduced in early 1971 (1) The Federal Grain Inspection Service began NIR use on May 1 1978 for official protein test~ng on hard red winter and hard red spring wheats upon request (11) In implementing official protein testii1g on US grain exports approved NIR equipment will be used exclusive~y for origi~al supervision and appeal testing For tlomestically mark~ted hard red winter and hard red spring wheats -official agencies may use NIR equipment or any other wheat protein device approved by the FGIS adminisshytrator
The NIR methods capacity for rapid protein and moisture c-ontent anaiysLs makes it llseful to a multitude of grain industry operations heretofore denied protein content monitoring by slower methods Grain firms 1)ormally operate processing facilities through continuous commodity flow procedures rather than individual batch o-perations Constituent analyses of continuous process flow grains require fast testing for proper qltality co_n~rol parti~u)arly ~he~e the grain products are to be blended -(together) with other h-~gher valued ingredier~ts into consumer products
In addition to the rapid testing capability other advantages of the NIR over the Kjeldahl method have been reported by manufacturers and users (~ 10) When the NIR instrument -is chosen over the Kl~~dahl unit- space reqllirements are smaller insta11a-shytion and maintenance are less expensive there are fe~er safety hazards arid operator training is less time consuming and less rigorous
Estimates of costs incurred in NIR instrument use to test grain for protein and mOistlre hav-~ been rep9rted by ~i11iams lt1)- Costs were prepared using data from the Canadian Grain Commissionls main inspect ion- laboratory in Winnipeg and --are applicable to Canada Costs of operating this highly automated NIR system averaged $074 per sample on 135000 samples analyzed between June and December 1975
METHODOLOGY
The economic-engineering approach is used to develop cost estimates for five usage levels of NIR instruments in determining -protein and moisture content of grains and their prodllcts 1 Lo-- and high-c_ost estimates for eacl) level of operation also are figured Low-cost estimates appiy when the NIR instrument and associatedequipment are
11 This approach required determining input needs (equipment space and labor) and output resu-lts (samples performed per time period) for development of cost relationshyships at seier_al levels of operation Costs determifed in this manner are ter~ed synshythetic chey do not reflect costs actually experienced in any firms or individuals operations but represent a synthesis of operations observed in a--number of cases The costs are contingent upon assumptions and specifications used in setting up the study
2
installed in a controlled-environment qual-ity-assurance laboratory These estimates could b~- co~sidered minimum costs because such a laboratory would have been designed to provide operating conditions well-suited for sample preparation g~inding and NIR instrument operation High-cost estimates require additional expenditures to provide minimurn NIR instrument operating conditions in nonlaboratory locations These highshycos t es tima tes provide for stabilizing the vol tage supply to the ins trument c6~-trolshy
ling dust and noise in the sample preparation and grinding area and loc~ling the- NIR instrument within an area of genera11y constant room temperature to avoid temperature extremes The high-cost ~i~uation would apply to installatilt-q of NIR -instruments in elevator grain unLoading areas plant processing locations ~nd grain and product loadout facilit~es already existing where some prote~tio~ is needed from surrounding
-conditions and equipment operations
The categories used fo_r cost analyses in this study are based on -an average daily number of samples analyzed during a single 8-hour shift by 9ne operator Workloads and operator performance may fluctuate greatly throughout the year consequently an1ual sample c~pacity for each category also should be considered The anIlUal sample capacity is based on 260 operating days per year Thii3 number of operating days was selected becaus-e it is felt that Saturday and Sunday operation of grain industry firms at peak handling periods probably equal weekday shutdowns due to holidays during t he yea r
For this study it is assumed that a single ope~ator can analyze an average of 80 samples of grains and their products for protein and moisture content during an 8-hour shift ~ith a yearly average of 20800 This assumption takes into account that several kinds of commodit-ies would be analyzed and that samples can be analyzed at a much greater rate for rush needs6 Furthermore the operator would have the usual rest per_iads and other nonoperating times experienc~~ in actual operation The time allowed for analysis includes grinding- loading and removing samples recording data on necessary forms cleaning up and disposing of ground samples G~neral m~~ntenance
of the equipment and premise-s also is included in tne sample-rate estimate
The rate of samples analyzed per shift in this study does not include labor and time in obtaining the sample grain or prod~ct to be tested Estimates of labor and time for sampling different contai_ners vehicles storage facili ties and proltesses are believed too variable to be meaningful Thus it is assumed that samples of commodishyties to be analyzed are l~cated within a short distance of the analysis area and are easily access~ble to the operator This assumption would be logical for most laborashytory operations however users at isolated locatio~s or processes should be cautioned that if the operator also must tak~ the sample physically from the commoditY-or prodtict to be analyzed a lower rate than 80 samples per shift should be expected
Using this maximum level of operation as a baSis additiqnal levels of sample analyses per shift are estimated to provide a range of situations for potential user examination Thus cost data are estimated for 80 40 20 10 and 5 samples per shift ll applicable to a 260-day ~nual operation 1
Managers of grain firms would have available from past recons expenditures and numbers of analyses made anriually for their particular operation They could compare
It 1s generally accepted that NIR instniments presently being marketed can mee t criteria consisting of total measurement time for protein and moisture per ~afnple of hard wheats less gr-inding but including sample cup packing of less than 90 seconds as specified by FGI5 in 5T NOTICE 15 December 30 1977
1 Appendix A describes a procedure to develop cos~ data on a per-bushel basis for those in the grain industry preferring to make a cost analysis on a bushel rather than a sample basis Appendix table i provides a limited range of annual throughput quantities applicable to the five usage levels
3
the estimated NIR analysis per-sample cost at the closest use level to their own data and determine cost differences Managers who feel that it would be advantageous to their operation to perform many more analyses could determine estimated per-sample costs at higher sample-per-shift levels
Practices applicable to an individual firm may not be covered by this study since it is designed to provide general information on a limited number of costs In such instances equipment manufacturers and engineering firms may be consulted to provide estimates for a specific operation
COSTS
Costs are classified as investment and operating with the latter further classishyfied as fixed and variable Investment and operating costs are representative of the Kansas City Mo area as of January 1 1978 Costs for other locations may vary from this reference site and should be determined for each application Fixed costs include depreciation interest on investment space assessment training expenses taxes and insurance Variable costs include operator wages maintenance repairs calibration tests and utilities
Investment Costs
Initial investment costs include the NIR instrument itself associated equipment and installation costs Equipment costs vary by manufacturer model and recommended accessories (see appendix B) Installation costs vary with the facility and the location within the facility where the equipment is installed A major factor influencing installation costs is whether a controlled-environment for the NIR equipment already exists in the proposed location Installation in quality-assurance laboratories may require no more than clearing an existing table or setting up an inshystrument bench and plugging the sample grinder and NIR instrument into electrical receptacles Nonlaboratory locations can necessitate installing electrical circuits and voltage regulator closing in the analysis area and providing noise dust and temperature control equipment (in general providing satisfactory equipment and operator conditions for accurate sample preparation and analysis) Table 1 presents equipment and installation costs for these two situations
Equipment costs were furnished by the manufacturers Installation costs were obtained from both manufacturers and firms using NIR instruments
Operating Costs
Operating cost estimates are shown in table 2 They do not include costs of obtaining the grain or commodity sample to be tested or costs of recording data preparing forms and keeping information transcribed from the NIR instrument operators daily log sheets High-cost estimates include the higher cost of accessories and other equipment listed in table 1
Fixed Costs
Depreciation on the initial investment in equipment including installation is spread over the estimated productive life of the equipment and makes up the major portion of fixed costs Other costs that do not vary with output are interest on investment space assessment training expenses taxes and insurance
4
~ I
-
Table l--Equipmeni- and inst~llation costs of near-infrared Iefle(~ance instrument grinder-middot and a-ssociated asltessories B78
In-~tallat-ion Equipment costs 1 electrical and sec_up Total costs JCost item
cost~ 1) 0
Low High Low High Low High
Dollars
Direct NIR instrument- 2 14500 14500 25 100 14525 14600 Saflple grinder 745 745 25 100 770 845 Accessories 55 155 55 155 Tax and freight 790 795 790 795
Total direct 16090 16195 50 200 16140 16395
Indirect Instrument beLlCh and chair 175 175 10 50 185 225 Work table and chair 125 125 10 50 135 175
Total indi[ect 300 300 20 100 320 400
Other Air c0Ilditi9rier 300 75 375 Room heater 100 25 125 Hood and exhaust fan 250 75 325 Accessories 100 100
Total other 750 175 925
Total 16390 17245 70 45 16460 17720
-_- __Ii not applicable- Low figure is minim~m c-ost estimate where the NIR in_st-rument is -installed in controLled-environment
Iabqr~tqry HigI figure is cost estimate fo( TiJntmum instrument operating co~ditions in other locations I Average cost of three instrum_~nts l-i5ted in appendix B iable 1 FOB factory
Table 2-~Estimated annual operating costs of NIR instruments for five levels of piotein and moisture determinat~ons i978 j
Cost by number of samples analyzed per 8-hour shift ~
Cost item 5 10 20 40 80
Low High Low High Low High Low High Low High
Dollars
Fixed- Depre~--ation 3292 3544 3292 3544 3292 3544 3292 3544 3292 3544 Interest on investment 741 797 741 797 741 797 741 797 741 797 Space assessment 120 300 120 300 120 300 120 300 120 300 rainirig expense Taxes and insuranc~
126 75
189 80
126 fs
189 80
126 75
189 80
126 75
189 80
126 75
189 80
Total fixed 4354 4910 4354 4910 4354 4910 4354 4910 4354 4910
Variable Operator wage_s 1 3640 3850 3640 3850 7280 7700 10920 11550 14560 15400 Maintenance and repair 200 875 220 875 250 875 290 875 340 875 Calibration tests 100 150 150 300 250 600 400 1200 600 2400
520Utilities 85 500 87 502 90 505 95 510 105
-Total variable 4025 5375 4097 5527 7870 9680 11705 14135 15605 19195
Total 8379 10285 8451 10437 12224 14590 16059 19045 19959 24105
Per-sample cost 644 791 325 401 235 280 1 54 1 83 96 116
1 Annual capacitYbased on 260 operating days Five samples per day equaJ 1300 samples a~nually 10 samples per day 2600 20 ~amples per day 5200 40 samples per day 10400 and 80 samples per day 20800
2 Low figure is middotminimum cost estimate where the NIR in_sect~rument is in-stalled inmiddot controlled-environment laboratory High figllre is cost estimate for m-inimum instrument operating c-onditicins in other locatigfls
1 See operator wages 5_e(~tion in tex~- for explanation of wage differe1ce in low- and high-cost p$timates
- -e
Depreciation-Equipment costs including installation and electrical are depreciated at an an~ual rate of 20 percent over a 5-year period J The service life of NIR instruments is -difficult to estimate because of the rapid technological advances since their commercial introduction to the grain industry in 1971 and because the reladveiy recent introduction precludes sufficient life expectancy inJorm~tion
Interest on investment--Interest on investment is calculated at 9 percent on half the equipment cost in-Cluding installation and electrical expense
Space assessment --A space estimate of 60 square feet is needed for satisfactory operation of the analysis ~quipment
It is assumecJ that installation would bemade in an existing facility Charges suggested by a grain industry appraisal firm are $2 per square foot for the low-cost estimate and $5 for the high-cost estimate The suggested a_nnual space charge for a facii-ity under construction is $160 to middot$170 per $1000 of building expense
Training expense--Several types of training programs ~re of~ered by NIR instrumenl manufacturers It is assumed that as a minimum for the low-cost estimate two operators would requiJe training over the 5-year lfe of the instrument The high-cosl es~imate includes one add_itional operator Salary and local travel expenses within a ISO-mile radius of the facility aremiddot included for each operator It is further assumed that on-the-job training of part-time or ext~a operators could be done)y an operator cOf1pleting the NIR manufacture_z s training program
Taxes and insurance--Taxes are calculated at 1 percent of assessed value Assessee valu_e for the Kansas City locatlon is ~stimated at 35 percent of total cost Insurance is estimated at 10 mills per $1 investment (1 percent on 100 percent of the
replacemerit cost)
Variable Costs
Variable costs in this estimate include such ifems as op-erator wages maintenance and r-epairs calibration tests and utilities that are a function of the number of sam- pIes analyzed Wages paid to ciperator~ make up a large portion of variable costs and a ~ajor portion of total costs
Operator wages --The operator wage rate is based on a total wage of $7 pe_r hour ($5 80 for wages plus 20 percent for fringe benefits) for semiskilled laboratory pershysonnel in Kansas City Local wage rates may be higher or lower for a particular firm Itis assumed that 80 samples per day require one operator for the 8--hour shift The annu~l wage is based on 260 days I operation and the assump~ion is made that the operashytor would need replacement for vacation or sickness for middot15 days The low-cost estimate assumes the firm-middotwill be able to replace the operator du-rlng the 15 days with dive~sion of personnel fiom other jobs at no additional labor charge The high-c9st estimate in~ eludes replacemeni~ persomiel wages for the additional 15- days It also is assumed tliat at the other four testing lev~ls the operator who is not busy ful) time with middotNIR test shying wourd be able to perform othermiddotwork th-lIs reducing labor charges directly attribshy
utable to NIR instrument opera-tion However levels of operation below 80 samples per shi_ft probably result in labor iI~efficiency in actuat in~ustry practice According to NIR manufacturer~ and several NIR instrument users 40 samples per shift shoul4 require one operator an average of 6 hours The 20- 10- and 5-samplas per shift operations would necessitate labor use of 4 2 and 2 hours respectively The minimum labor selection qf 2 hours of operation time aft_er sample workloads decline past 10
I Appendix C contains cost information on the effects of increasing the deprec~ation period beyond the 5-year assUI~ption
7
samples per shift assum_es that tim~ in instrument checking c~libration tests sample cleanup and general maintenance of equipment and premises i~ fixed Therefore it must be alloca~ed to instrument costs regardless of low average numbers of samples tes ted per day
Some potential buyers may consider that NIR instrument operation particularly at lower leveJs of use could be performed qy an ex~isting employee who is underemployed in his present job Such a labor division could be IDPSt efficient and profitable from an individual firms point of view However for purposes of cost analYSiS the
middotalternat-ive use ofthe underemployed workers time should- be considered and time allocated to NIR instrument operti9n must be cos ted at the assumed labor rate
Maintenance and repairs--The cost of ~intenance and replacement parts for equipment othei than theNIR instrument is estifnated at 1 percent of the purchase price
TJlere is a gen-eraJ lack of documented data on maintenance -and repair cost of NIR instruments The rapid technological change in the instruments arid t~eir relatively recent introduction to commercial operation llake repair cost analysis difpound-cul~ 1 Furthermo~e se_rvice and repair charges reported to date may possibly be understated because of competition and introductory sales promotion practices Instruments are fully warranted for 1 year Low-cast estimates for maintenance are ba~ed on a~erage r~pair costS of three users a( variaus levels of samp)es analyzed per day Maintenanc~
costs are estimated to ~increase as the number of samples analyzed per day increases Individual users repair costs may yary greatly from this estimate- H-intenance cant racts are available from NIR instrument manufacturers at an average annual cost of $845 over the assumed 5-year depreciation period This cost plus ~he estimated mainteshynance and repai-r expense of the rema-ining equipment is used for t11e high-cost estimate at all five levels af s(3mples tested per shif( Note howeve~ that the cost of mainshytenance and repair for machines ~nder contract although initially high compared to the low-comiddotst estimates guarantees that the instrument purchaser will not be surprised with the passibility of l-nexpectedly high repair costs at some future date within (he conshytract period
Calibration tests--Manufacturers and users agree that after initial calibration folloing purchase NIR instrument an~lyses should be monitored through check samples from a service laborator-y by duplicate sample te_sting using another method of cons-ti shytuent determination_ at by daily moni-torin~ of sealed cells of known protein va-lues 8f The frequency of testing would of course vary wi-th (he firms type of activity ~ economic implications of tes(i~g error and number of samples analyzed annu03llY The lot-cost estimate for each level of -sample rate per shift is based on a minimum need basis and ass--mes costs covering both cal-ibr~tions and la~oratory fees for check test shying of samples The hi~h-cost estima~e assumes additiona~ ch~ck sample testing which causes the cost to double as the sample level doubles Check sampl_ing pro~_edures also are assumed to be correlated to the degree of determination importance That is during periods of large incoming or outgoing_ grain movements more monitoring might be advisable Fur_thenno-re grain determinations made for in-house binning purposes probably require fewer check samples than determinations made on shipments to purchasshyers
Jj One NIR instrument manufacfiirer developed mean-time-b~tween-failure (MTBF) data o-r an early model of the type oK instrument studied herein A number of instrument fa~~ures occurred soon after introdus-tion but failures steadily d~crea_sed until midshy1977 whenMTBF for the instrument was about 28 months (8)
if A special infrared protein checkmiddot sample program was-recently announced by the American Association of Cereal Chemists to enable iaboratories with NIR instruments to maintain an accurate check 011 NIR instrument calibration Proposed cost would be $7 weekly for participants lt~)
B
Utilities--The cost for electrical power the only utility cost estimated varies with equipment running time Hanufacturers instrucfions for the NIR instrument recomshymend that the instrument be left on continuous-ly One reason is the le~gthy startup time for instrument stabilization a Eter shutdown Another reason is that the instruments electronic system is probably less adversely affected by being on all the time than by repetitive on-oEf cycles of operation Grinder r~quirements for intershymitten-t operatipn according to the TIumber of samples ground pe~ day are included in electrical usage for the low-cost estimate A more important faccor in utilicy cost decermination is equipment location The high-cost utility estimate reflects costs of operating equipmenc to concrol dust and avoid cemperature ex cremes in nonlaboratory instrument locat~ons The kilowatt hour (kWh) usage of equ~pment for both low-- and high-cost estimates is multiplied by a kHh rate of 3 c~_nts to obtain lltility costs
ECONOHIC RELATIONSHIPS
Certain economic relationships covering varying output levels of an 8-hour operacion and cost ratios betwee~ 8- 16- and 24-hour operations can be assumed from the foregoing cost data However these cost figures do not include other factors which individual firms may wish to consider when evaluating economic feasibility of NIR instrument use The rapid const-ituent analyses by NIR instruments 1s a major economic co~sideration and for certain types of operations such as on-line process monitoring and truck grain unloading access (0 grain content information is vitally important Other factors which may mnke NIR instruments more ~ttractive than chemical methods are the use of less-skilred operators fewer saEety concerns disposal eas_e~ of inaterials used in the analysis and general freedom from the neeCl for ertvironniental regulation
For a comprehensive cost analysis estimates should be made on-the probable number of samples handled yearly rather than on peak operation per-sample costs As indicated eaclie-r most fixed costs cerna in the same regardless of sample output and use Certain variable costs--maintenance repair and utilities--incrense very little as the number of samples analyzed increases because of the electronic construction-of the NIR instrument
Analysis needs v-Yy particularly for grain elevators because receipts and ship ments are seasonal wfth the heaviest need at harvesttime It is est~mated that adding a second operator to the 80-sample-per-shift operation would double the output to 160 samples per day over a sustained period (One operator would prepare samples for a seco~d operator running the NIR instrument) The ability to handle even greater workshyloads during p~ak periods would be p-ossible because t~~ pcr-sarnple measurement time used here is substantially within instrument capacity The s-econd operators wages would be the major additional cost encountered (table 3) However per-sample costs would decline The other four -levels of ooeration could of course have sample out put ~rycreased ~y lengthening an operators hours per shift or by adding another partshytime operator Increasing sa~ple output will also help to increase operator efficiency at the lower sample levels and combined with little additional cost increase except operators wages will reduce per-sample costsmiddot for these operations
An alternative to adding operators to a particular 8-hour operatjon as sample analysis needs increase is to ihcrease the number of shifts during a day This is particularly attractive in conjunction with 24-hour operations such as grain exportshying flour milling and other grain processes Cost estimate_s fqr 40- and 8Q-sample multiple shift operations are shown in table 3 Fixed costs except additional training expenses reIIlin the same as those in table 2 -iith the exception of addishytional operator wages variable costs increase only slightly over a single-shift operation Wage rates for second- and third-shitt operations increase to $725 and $750 per hour respectively
9
Table 3--Estimated annual o-perating costs of NIR instruments for var-ious levels of sample determinat-ions and shifts 1978 I
Cost item
160 samples per 8-hr shift
2 4- -
Low High
40 samples per 8-hr shift 1 ~
Two shifts
Low High
Three shifts
Low High
80 samples per 8-hr shift 1 ~
Two shifts
Low High
Three shifts
Low High
Dollars--shyF-ixed
Depreciation Tnterest on investment Space assessment Training expense Taxes and insuran~e
3292
741 120 189
75
3544 797 300 252 80
3292 741 120 189
75
3544 797 300 252 80
3292 741 120 315
75
3544 797 300 378
80
3292 741 120 189
75
3544 797 300 252
80
3292 741 120 315
75
3544 797 300 378
80
Total fixed 4417 4973 4417 4973 4543 5099 4417 4973 4543 5099
Variable Operator wages 2 Maintenance and repair Calibration tests Utilities
Total variable
29120 510
1200 120
30950
30BOO 900
2BOO 535
35035
22230 425 BOO 105
23560
23512 900
2400 520
27 332
33930 510
1000 120
35560
3588] 950
2600 535
- 39972
29640S10
1200 120
31470
31350 900
2BOO 535
35585
45240 680
1400 130
47450
47850 950 3000
545
52345
Total 35367 40008 27977 32305 40103 45071 35887 40558 51993 57444
Per-sample cost B5 96 1 34 155 1 28 144 86 97 83 92
1 AnnuCll capacity based on 260 operating days One hundred sixty s~mples p~r day equ~l 41600 sa~ples annually 40 -for two shifts- 20S00 40 for three shifts 31200 SO -f~r two ~hifts 4)600 nd SO for three shifts 62400
2 Requires two operators1 One operator per shift 4 Low figure is minimum cost estimate where the NIR instrument is install~d in controlled-envir0flIIlent -laboratory
~igh figu1~ is cost estimate for minimum instrument operating conditions in other locations ~ See operator wages section in text for explanation of ~age difference in low- and high-cost estimates
t
COST COMPARISONS
Estimated NIR per-sample costs (table 2) are compared with Kansas City-area laboratory chargEs for Kjeldahl protein and moisture determinations of g~ain (table 4) Kansas and Missouri sample charges_a_re required by the States charters to reflect ins9far as p-ossible actual cltsts of performing the indicated tests profit on services is not permitted This of course fs not the case for a private concern which must make ~ return on investment and cbver the risk of business operation Doty L3borat_o_ries Inc bull a private c~ncern located in north Kan_sas City therefore charges a higher fee than the State laboratories However Doty Laboratories speci~lizes in more complete t~_sting of a grain or commo~ity for multiple quality factors than do the State laboratories Therefore the total testing charge for users requiring the more complete service would include lower charges for protein and moisture than the testing fees shown in table q
P~t-sample NIR cost estimat~s for protein and moistur~ tests are lower for 20 4q and 80 samples pet 8-hour shift than those at the three Kjeldahl laboratqries for which charges are shown The low-cost estimate for 10 samples per shift is also lower than at all three laboratories- The only level at which estimated NIR ~osts are above what D6tY Laboratories charges is 5 samples per shift
The NIR instrument models considered in this cost study have the capability to dete-rrnine other qualimiddotty measureme~ts such as starch and oil c~mien~ of middotgrains and oilseeds and their products Once the expense of NIR instrument ownership is undershyt-aKen these tests can be done at little add-itional c~st besides operator time Additionally more ~ophi~ticated NIR in~truments re available at great~t cost which show promise for ~tJlino acid analysis of the protein content and for constituent determination of blended products such as flour and animal feeds
Rapid analysis smailer space needs and fewer safety haza-rds -re among the advant~ges NIR-instrument analysis has over the Kjeldahl method forprotein analysis It appears that NIR inst rllmen to use to determine protein and moisture content of grains and their products i- ecoriomically feasible at all but s samples per shift and the high-cost estim~t~e of 10 samples per shift If economic value were placed on the apparent advantages of NIR instrument analysis the cost comparison would be even moore -~~vorable over t-he Kjeldhl method
11
Table 4--Estimated NIRcosts and representative Kansas City-area laboratory chargesforprotein and moisture determinations of grain January 11978
Item
NIR estimates 5 samplesshift
10 samplesshift
20 samplesshift
40 sample I shift
80 samplesshift
Representative Kyeldahl rates
Doty Labo_ratories Inc
Kansas State Grain Inspection Service
Missouri State In gpec t ion Bueau
Situation estimate fj
Low High Low High Low High Low High Low High
Protein
222222222I
275
250
250
Per-sample costs
Moisture
Dollars
2 2222222 21 I
200
LOO
LOO
Total
i 4
644 I791
325 I401 235 280 154 L83
96 l l16
475
350 1 I I
350
-- = Not applicable 1 Low estimate is minimum cost where the NIR instrument is installed in a
controlled~environment laboratory High estimate is the cost for minimum -instrurneIft opera-ting conditions in other locations
1 Costs of proteIn and moisture determinations are combined since moisture content measurement is required in rE~porting grain protein content on lt
st~ndard mo-isture bBsis C
I I i
i I I
12
REFERENCES
1 American As-so~iati0tl of Cereal Chemists Cereal Laboratory Methods Hethod 46-11 46-12 and 44-16 St Paul Minn 1969 and revised editions
2 ________ Cereal Laboratory Methods Method 45-15A St Paul Minn 1969
3 Pomeranz Y_ and RB Moore Reliability of Several Methods for Protein petermination in ~neat 11 Bakers Digest 49 No1 44 1975
4 Rosenthal RD IIThe Grain QLiality Analyzers Paper presented at the ttJ11ing and Baking Division (AACC) 1973 annual meeting April 12 1973 Neotec Inst Inc Silver Spring Md (Revised Mar 1975)
r 5 Sbsland Publishing Co AACC Supplies Check Program for NIR Instruments II - i-iiiling and Baking News- Vo~ 56 55 Kansas Ci ty I Mo Feb 14 1978 p 24
6 bull Back New Instrumentation at AACC Mill-ing and Baking News Vol 5638 Kansas City Mo Nov 1977 p n
7 nickey-john Enters lnfrarpd FieId1 Milling and Baking News Vol 5641 Kansas City Mo Nov 22 197 pp49-50
8 bull Neot~~ Uses I Aerospace r Techniques Hilling and Baking News ----77---0------
Vol 5656 Kansas City Mo Feb 21 1978 pp36 38 and 40
9 Norris Predic~-s New Strides in NIR Technology Mitring and Baking News Vol 5639 Kansas City Mo Nov 8 1977~ pp 15 arid 18
10 Stroda~) B InfraAlyzer ~roves Best Apparatus f~nmiddot Dete I1ll ining Protein for Small Grain Business 11 Proceedings of the 1976 Technicon Internat-ional Congress TechnicoTI Inst Corp Tarry~own N y 1977
11 VS_ Federal Register Grain Standards Vol 43 no 62 Mar 30 1918 pp 13406 and 13467
12 Watson CmiddotS~ liNear Infrared Reflectance Spectrophotometric Analysis of Agricu+tural Products I Anal Chern 49835a 1977
13 Wi_11iams PC The Economics of Near Infra~red Reflectance Spectroscopy in Testing Grain for Protein and Moisture II proccentedings of the 1976 Technicon Int-ernational Congress Technicon Ins t Corp Ta rry town N Y 1977
13
APPENDIX A--Per-Bushe1 Costs
The Costsmiddot shown in- this study we-re developed for use bymanageTs and researchers in c-ompa-ing NIR per-sample costs 0pound protein middotand moisture i_ontent 6f grain with other methods of determination The grain industry in the United States presently operates on a bushel basis for most financial accounting and price-reporting activities prices shown for grain bought and sold 0perating margins futures trading a~d volume handled generally are reported on a bushel basis Per-sample cost can be converted to a bushei hasis by grain industry members preferring a bushel-bas-is anal-ysis
Several problems arise with the preparation of NIR cost data on a per-oushel basis Every bushel of grain need not be saI1-pled for aI1ilysis since grain is assemb~led afld traded RY lot sample (a lot being a quantity 6f gmiddotrmiddotain from one area where al-~ grain charactemiddotristics amiddotre assumed to be the same as defined by a sample taken in a prescribed manner depending on the lot size) Thus samples to be analyzed represent widely varying quantities of graiD
A seeond problem is middotthat the var-iety of venicles used middotto transport grain ranges from sinall trucks and wagons to large semitraimiddotlers rail~amiddotrs and barges Additionally the number and sizcent of storage bins bin turnovers and general operating conditions can lead middotto greatly differfng sample numbers needed There is tremendous variation even in grain elevator operat-ions--froTTJmiddot satellite country buying statmiddotions active only part of middotthe year to export elevators engaged in 24-hour middotY_~aI--long operation Even among storage fac~l~ties and processors of similar sfze and commoditlesmiddot purch~se and sales schedules differ greatly and affect operating characteristics and needs
Ele-vator middotoperators middotshould be able to determine fr9m their middotpast crop season and customer middotrecords ~lifficient information to convert NIR inst--ument o-peration costs shown in text table 2 to per-qushel costs For illustrative purposes only cOlsider the following example middotas a guieje either to developing an approximate per-bushel cost for general middotuse orbullby substituting actual costs -for tho~e in text table 2 developing a per-bu~1el cost for a specific firm application
Example
The manager of a country middotelevator in northwesmiddott Kansas is interested in the NIR method of d~termining pmiddotr9tein and moisture content of the wheat handled The intent is to sample each truc~load received from farmers and segregate each load insofar as possible in t~e elevator bin~ a~cording to a protein rang~ rnaintafnmiddoting this identity through loadout to buyers Addimiddottionmiddotally middotthe manag~r wishes to provide service for customers who may request testing of some wheat samples from on-farm storage prior to delivery
Data
1 The 2S0OOO-bushel elevator hand~es approximately 500000 busheJs of- wheat and sorghum annually
2 From past records and forecasting it may be assumed that wheat throughput will be 300000 bushels annually for the next several years
3 Receipt records indicate incoming wrye_at from sellers will for all practical purposesmiddot average 180 bushels per truckload
middot4 The elevamiddottor consistsmiddot of eight large bins approximately 30606 bushels each and 12 small workingmiddotblns
14
1
5 Outgoing transportation to buyers in the past has averaged nearly 75 percent by railCar and 25 percent by truck
Procedure -r
The approximate number of sample analyses handled annually can -(hen be estimated as follows
I The 300000 bushels received from producers divided by 180 bushels per truckload equals 1667 sample analyses
2 Bin samples tsectl~en during bin filling turning wheat and loadout for shipment are e-stimated to lrequire approx~mately -225 analyses
3 Service testing of samples from on-farm whe~t and special customer requests are estimated attapproximat-ely 100 analyses
4 The total number of -samples estirna ted to be analyzed would be 1667 plus 225 plus 100 or nearly 2000 samples annually This equa~s about eight samples per day for 260 operating days
To estimate approx1mate per-bushel costs for general use appendix table 1 has been p_repared frqm text table 2 using total ~ixed and Yltlriable costs at the five sample levels (ppendix table 1 provides a range of annual grain throughput quantities at the five sample levels which can be read direct_ly as per-bushel costs of NIR instrument analyses For the example using the 300OOO-b-ushel annual throughpLt at 10 samples per day per-bushel costs are- 28 cents and 35 cents for the low- and high-cost estimates respectively Th_is is anapproximate cost because the es-timated number of samples to be run -in the middotexample (2000) is less than the 2600 annual capacity of the 10 samples-per-day level
A manager w~o has actual cost infomation avatlable could obtain a comparIson of per-~ushel costs by dividing the total annual operating cost of using the NIR inst-rument by the estimated number of bushels handled annually~
APPENDIX B--Basic Equipment
Basic equipment fcjr NI~ instrument analysis of gr~in constituents is itemized by cost category in appendix table 2 The low-cost estimate described in the metJ~odology sectj9n necessitates only equipment listed under the direct and indirect categories The high-cost estimate inclu-des this equi-pment plus that listed in the ather category
NIR instrument models shown in appendix table 2 are of similar capacity J and each should per~orm adequately at the maximum sample level although each differs iri o-pe~atshying characteristics and features Jj Dickey-john Corporation has been marketing its
models under the InfraAlyzer name in recent years The model listed was introduced in late 1977 (J) Operating-cost information contained 1n the text was devetoped from reshysponses of Neotec and Technicon instrument vendors and grain industry users Research filves-cigations 0tl the basic principles of NIR instrument operation continue and ney feacures characteristics and techniques are frequently reporied by suppliers and researchers (sect~ 2) Additional NIR models besides those listed herein also are avail shyable from the suppliers for users having special needs Potential buyers shoulddisshycuss -their needs with several suppliers to determine the particular instrument and model suit~ble for their specific business operation
~ General specifications of NIR instrument models approved manufac~urers and instrument models are contained in ST NOTICE 19 February 1 1978 FGIS
15
Any of a number of grinders may be used for sample prep-aration of cOlIIITlodities prior to measurement by the NIR instrument for constituent content ~ Res-e~rch is conshytinuiI)g in this area also as particle size of the sample -appears to influence NIR instri+ment operation At this time the grinder most often recommended byNIR instrushy
ment suppliers is the un Corporation model (The UDY cyclonE grinder is the only FGISshyapproved gr-inder at this time for NIR sample preparation 10) The speed of sample grindIng and the cleanout feature appear to be important~determinants in its selection
The re~ainingl equipment listed is of a general naturemiddot apd numerousl suppliers are available Buyers may wish to select suppliers based on prey-iou-s purchases price service and location
The purchase and installation of equipment for NIR analysis of grain constituents does not comprise a large investment ($17 i20 for high-cost e-stimate) for most grain firms Sinc~ mos-t of the operating expense will be fCr oper~tor wages a firm should consider equipment installation so as to maximize operat9r efficiency as well as equipshyment longevity
APPENDIX C--NIR Instrument Depreciation
Although the serviceable life of NIR instruments is difficult to estimate the instrument is depreciated over 5 years in the development of cost information contained in text table 2 Deprelt--iatio~ expense is by far the largest fixed-cost item and is very nearly the largest overall cost item for 5 and 10 samples per shift At these low sample levels at least three considerations cast doubts on the assumption of a 5~year
deprecia t ion scheltlule ~ One lower rer-day sample use inay affect service l-ife t although recommended procedures are to leave the NIR instrument on coritinuQu-sly Second a firm operating the NIR instrument at low-use levels may well be satisfie9 for many years with a model it has purchased even though newer more sophisticated models have been introduced_ Th-ird the expected Ii fe of NIR inst-iuments is unknown since information on in~-trument failure and repair cost records ar~ not yet avilable for long enough periods to provide ~n economic evaluation Therefore appendix ta~le 3 was developed to provide a sensitiv~ty cost analysiS of depreciation schedule change-sshy~ll other items in the cost schedule of text taqe 2 are held constant while deprecia_tion is- changed in 1-year increments frof 5 to 10 years
The reader is cauti__oned that the evaluation may be unfairly biased by th_e assumpshytion that all other cost~ remain cons_tanto since maintenance and repair costs Inay _~_ncrease because the instrument is operatemiddotd for longer periods Also possible price inflation e~fects on other costs may become important (o_nsiderations due to extending the depreciation period_ Data shmvn in appendix table 3 indicate that C3sect the depreciashyt-ion period is extended costs for the lowsample-per-shift levels great]y decrease Per-sample costs of the low estimate for 5 samples pershift decrease $042 as t0e deprec_iation schedtile increases from 5 to 6 year_s_ and decrease $126 as the depreCiashytion schedule increases to 10 years_
Managers (If fi-rms cbi1side~ring investment in an NI-R_ instrument for ll~~ at t1e lower samples-per-shiftmiddot rle~ei~ -should prbQ~bly investigate instrument depreciation aspects since estimated eosts at lower sample levels are -heavily influenced by the depr~ciation schedule used
10 General specifications- for this grinder are contained in ST NOTICE 12 December 9 1977 FGIS
16
Appendix tble l--Estimated cost of NIR instrument analysis at selected annual tlirughpui rates 1978
Total cost Jj Cost perbushelISamples
analyzed 1 Low High Low High Low High Low High Low High
Annual throughput (1000 bushels)
50 100 150 200
---0011ars--- ------------------------- - - - --------- -Cen t s --------- ---------- - ----- - - ------- - -- shy5 samplesshift 8379 10285 168 206 84 103 -- 56 68 42 51
(l300yea)
Annual throughput (1000 bushels)
200 300 400 _ 500
---Dollars--- ------middot--------------------------------Centa--------------------------------------- shy10 samplesshift 8~5l lO~37 42 52 28 35 -- 21 26 17 21
(2600year) Annual throughput (1000 bushels)
500 650 BOO 950
---Dollars--- ----~---------------------------------Cents--~-------------------------------------
20 samplesshift 12224 14590 24 29 19 22 -- 15 loB 13 15 (5200 -year)
Annual throughput (1000 bushels)
1000 1300 1600 1900
---0011ar8--- - --- - -- - --- ----------- - - ----------- ----Cents --- - - --------- - - - ----- -- --- ---- - ------- shyc
~O samplesshift 16059 19045 16 19 12 15 -- 10 12 B 10 (10400yea)
Annual throughput (1000 bushels)
2000 3000 4000 5000
---D011ar5--- ----------------------------------------Cents--------------------------------------- shy80 samplesshift 1995~ ~~105 10 12 7 8 --5 6 4 5
(20800year)
1 Average number of samples analyzed per ~-tiour shift annual capacity based on 260 operating ~ays1 Low figure is minimum cost estimate where NIR inst-rument is installed tn controiled-e~vironm~ft laboratory High figur_e_ is cost esti shy
mate for minimum suf(icient instrument operating conditions in other loc_ations
Appendix table 2--Basic equipmen_t spec-ificaticins- available suppliers and costsect
Elec-Units Model Size or -
Cost item re- trl- Supplier Cost y ~ Salient features ~numbercapaclty quj~red Clty
Watts Dollars
Direct NIR instrument 1 GAG HI 15 ier-I 460 Dickey-john Corporation 147 50 I~cludes printer Wave-Iength
sample Aubti~n Ill cap-city of 10 filters 48 constituents
GQA31EL 10 secl 350 Neotec Instruments Inc l49~O AI19~s measurement of 4 const-i shysample Silv~~ Spriris Md tuents at once includes 3
caLibration -~ards--ii-~ximum 12 constituents
Infrashy 15 secr 500 Technicon Industrial 13800 Allows measur~~ent of 3 consti shyAlyzer sample Systems Tarrytown N Y tuents at on~e additional 25A calibrations available at $600
fpr -3 chan~els--maximurn 9 cons
Grinder 1 UDYMS 1 gmsec 885 UD Corporatia~ 745 12600 RPM belt driv~n No Cyc- lone Boulder Colo clean out required bEtween sam-pie sampJes mill
Indirect Instrument bench 1 5 x 30 Local suppl-ier 50 2 large storage drawers
)0 11Work table 1 4 x Local supplier 100 1 sJlall drawer Chaix 2 standard Loca~ supplier 50 sw~ve_l withoiit arms
Other Air conditioner 1 8000 Btu Local supplier 300 Ro0n heater 1 10500 Btu Local s-upplier 100 Hood and exhaust
fan 1 30 X 24 Local supplier 250 300 cfm exhaust
I As of January 1 1978 Does not include freight charges for NIR instrument or grinder Local purchase pri~e estimates for remaining ttems ~ NIR instrument suppliers have availa~le lea~~ agreements deferred payment contracts and per-sample -rental
contract$ for clfstomers desiring other than imme-di~te-t~rDi~ instrument purchase
Appendlx table 3--Estimated annual cost of NIR unit
Equipment depreciation II
Cost item
Depreciation
Fixed-cost percentage
Total cost 5 samplesshift
10 samples shift 20 samplesshift 40middot samplesshift 80 samplesshift
Per-sample cost 2 5 samplesshift
10 samplesshiftshy20 samplesshift 40 samplesshift 80 samplesshift
Depreciation
Fixed-cost percentage
Total cost 5 samplesshift
10 samplesshift 20 samplesshift 40 samplesshift 80 samplesshif t
Per-sample cost 1 5 samplesshift
10 samplesshift 20 samplesshift 40 samplesshift 80 samplesshift
Unit 5
Low
Dol 3292
Pet 76
Dol do do do do
-8379 _8451 12224 16059 19959
do do do db do
644 325 235 154
96
8
Low
Db1
Pet
2058
66
Dol do do do do
7145 7217
10990 i4825 18725
do do do do do
550 278 211 142
90
years 6 years 7 years
High Low
High Low High
3544 2743 2953 2351 2531
72 72 68 69 65
10285 7830 9694 7A38 9272 10437 7902 9846 7510 9424 14590 11675 13999 11283 13577 19045 15510 18454 15118 18032 24105 ig410 23514 19018 23092
791 602 746 572 713 401 304 379 289 362 280 224 269 217 261 183 1 49 177 1 45 173 116 93 113 91 L-H
Equipment deprec~ation
years 9 years 10 years
High Low High Low High
2215 1829 1969 1646 1772
62 62 59 61 56
8956 6916 8710 6733 8513 9108 6988 8862 6805 8665
13261 10761 13015 10578 12818 17716 14596 17470 14413 17273 22776 18496 22530 18313 22333
689 532 670 518 655 350 269 341 262 333 255 207 250 203 246 1 70 140 1 68 1 38 1 66 110 89 1 08 88 1 07
)) Low figure isffilnlmum cost estimate where NIR instrument is ins-talled in a conshytrolled-environment laboratory H_igh figure is cost estimate for ritinimurr sufficient instrument operating conditions in- other locations 2 Annual sapac-itybased on 260 operating dais Five samples per day equal 1300 anri~ally 10 samples -2600 20 sample~ 200 40 samples 10400 and 80 sarnples 20800
19
UNITED STATES DEPARTMENT OF AGRICULTURE
WASHiNGTO~ DC 20250 POSTAGE ANO FEES PAID
US DEPARTMENT OF AGRICULTURE
AGR101
THIRD CLASS
BIBLIOGRAPHIC DATA 11 Report No SHEET ESCS-20 4 Tide and Subtirle S Report Date
June 1978XEAR- I~lrJRED REFLECTAXCE INSTRWIENT ANLlSIS Of GRAIN 6CONSTITUENTS A COST STUDY
7 Author(s) 8 Performing Organization Repr
Floyd F Niernberger No ESCS-20 9 Performing Organization Name and Address 10 ProjectTaskUork Unit No
Commodity Economics Division Economics Statistics and Cooperatives Service 11 CODlr3ctGraot No
US Department of Agriculture Washington DC 20250
12 Sponsoring Organization Name and Address 13 Type of Report amp Period Covered
Final 14
15 Supplementary Notes
16 AbStr3CtS
Costs of using near-infrared reflectance (NIR) instruments for determining protein and moisture content of grains and their products are synthesized for five levels of operation 5 10 20 40 and 80 samples per shift Variable costs are subshystantially greater than fixed costs with operator wages the major contributing factor Cost comparisons between NIR per-sample estimates ond charges for Kjeldahl sample analysis by commercial laboratories indicate lower NIR costs at 20 40 and 80 samples per shift Tf economic value were placed on advantageous factors of the NIR method over the Kjeldahl method cost comparison would be even more favorable for the NIR lnethod ~~1 65CS
17 Kcy Words and Document Analysis 17a DescripttfsLCheW i ell) ana 1) Sis COS I ona VS 1S
Ges t eempltI isollS wo t-er () uD J tV Economic analysis 1l Economic evaluation9 ntoDomie factors Grains (~)
IHfraFea e~uipllieJlt
Haistlclre eoutelit p~
hster cQflteftt 17b~ IdentifiersOpen-Ended Terms
Ai~ oven moisture test Fedfral Grain In ction rvice Grain a~nsis (ost~ra~~F0t in de termmiddot na ion NTIS prices subj ect to ch~nge after KJel~l ~e lod September 30 1978 After that conshyNcar-infrared reflectance ins r cnt tact NTIS for new price schedule re~r-infrared reflectance anllYsis costs NTIS price Lodes illl ocmiddot 02 for
l7e ~((ll )cl (mmiddot 02-11~ 02-C 06-11 1-11 paper and Mil for fiche
Hi AmiddotII hlIJl gtlol~lJ[IrIH f19~~7i C) (lhfi 21 l1 (111-- shy
~b~l crom NATlONL TECIINICAL lNFORlIATION RerJi lEll2_____24 SLf[Cl J28S IOlt Hoyal Hd Springfield VA 0-11 --2 Ic--------I
701(1 i l lf- S I -- ) r I []-Jrn ec ~1 HH t
I~ gt II ~ ~-]~ 1-r----~C--middot--middotmiddotmiddot-vc-c--=---=-====---------~-----------------~----- --- shyt --1 -[) In bull ~1 1) IJ-L-SCI) lltl~ I)I~ -11 - 11 (IHll lCImiddot~-middotmiddotmiddotO ~_ ~
---- ---~
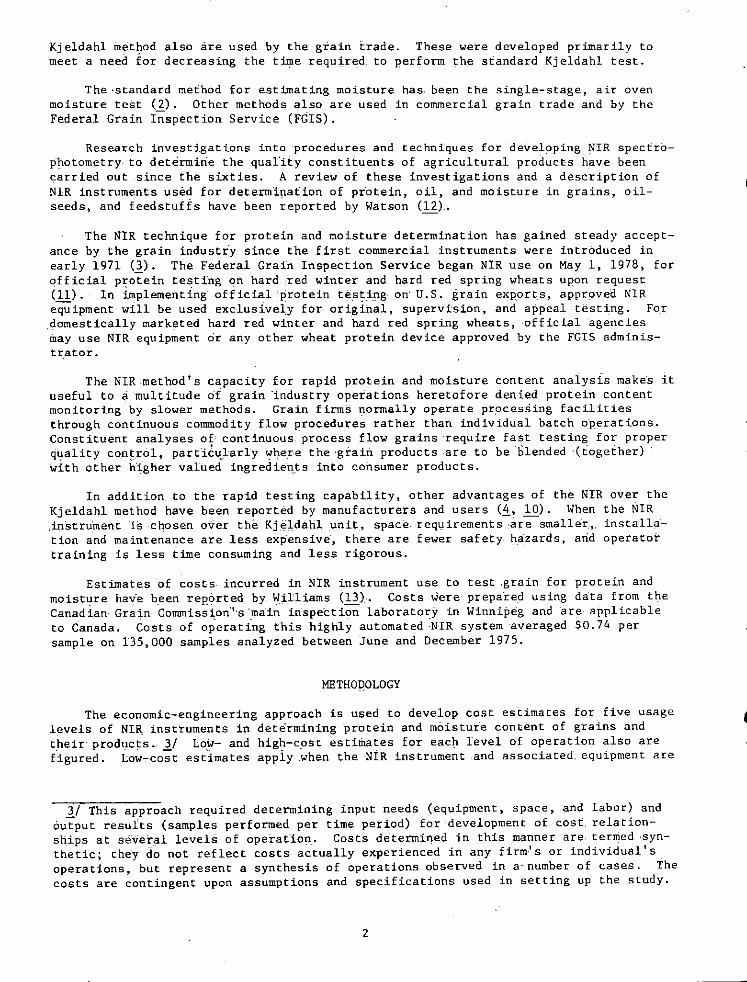
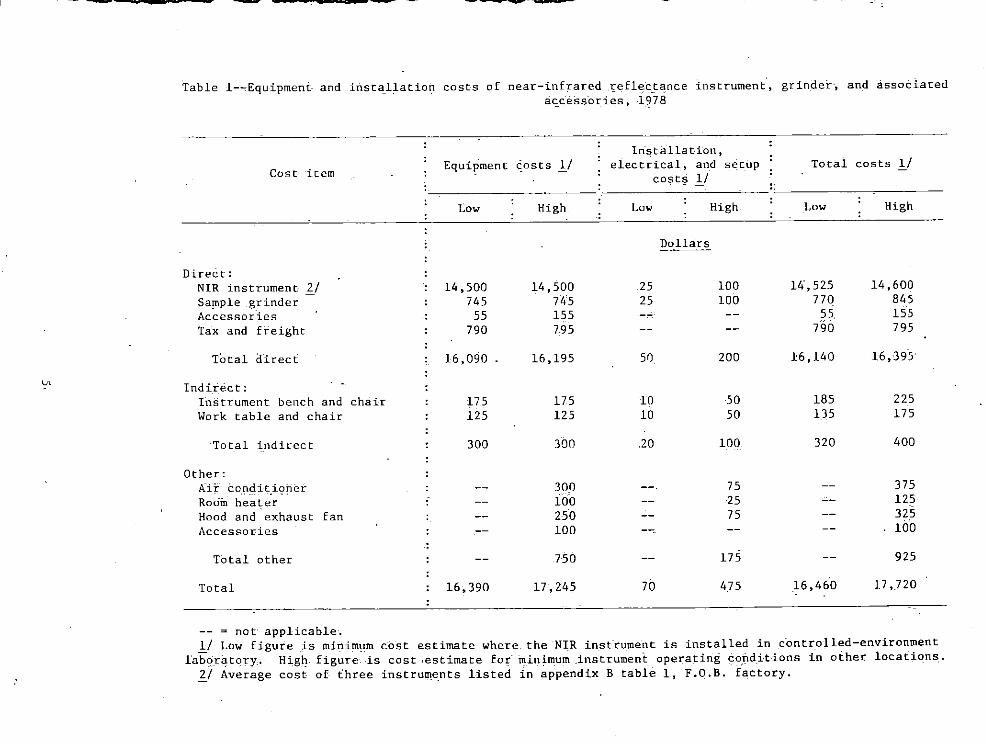
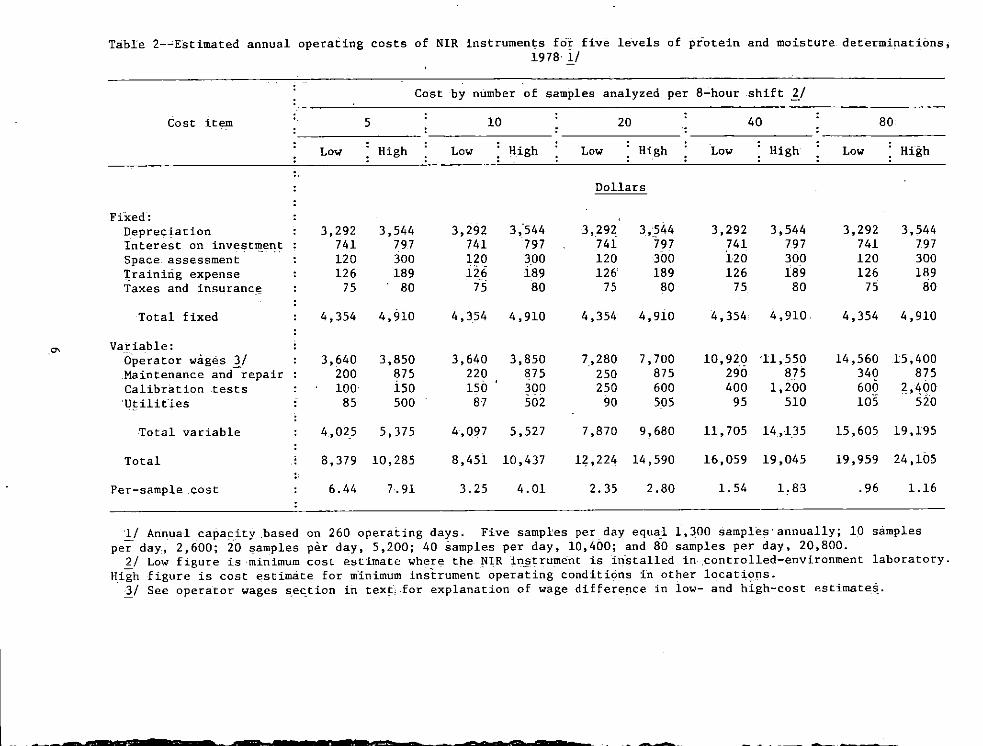
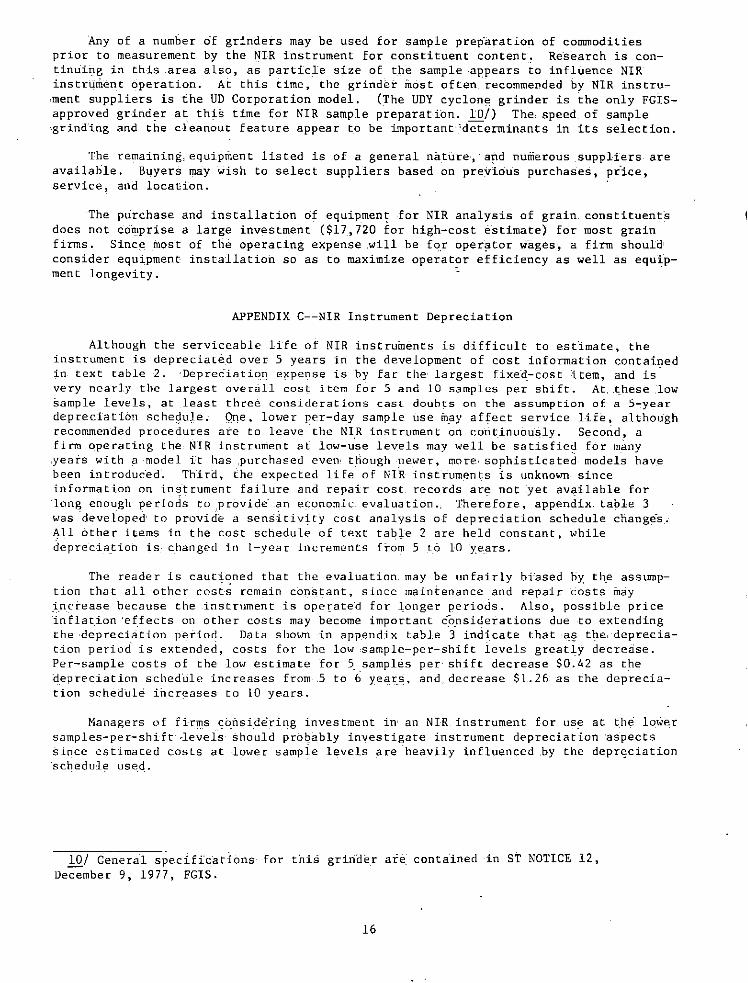
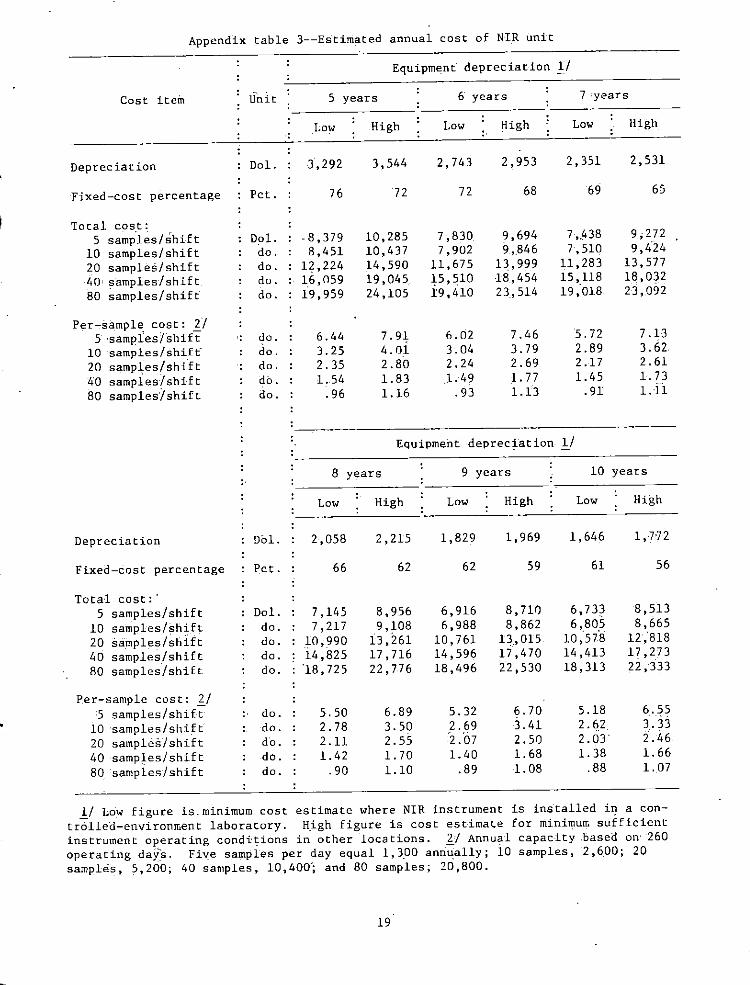