near infrared and raman spectroscopy for in-line ... · near infrared and raman spectroscopy for...
TRANSCRIPT

Institute of Polymer Research Dresden
Near Infrared and Raman Spectroscopy for in-line Monitoring of Polymers -
Applications in the Polymer Industry
µ 1. Applications with NIR-diodearray-processspectrometer SentroProc
PP/EVA, PA/FSM
µ 2. Application with the combined NIR- and Raman-spectrometer
PP/EVA (Raman), PE/PS (NIR)
µ 3. Application of in-line NIR- und Raman-spectroscopy in a mixer
control of the reaction PS/DGEBA + PS/MDEA and DMP 30
µ 4. Summary

Institute of Polymer Research Dresden
Process monitoring – comparison of in-, on-, and off-line

Institute of Polymer Research Dresden
NIR Process Analysis
Modern Product Philosophies• Just-in-time manufacturing• Total Quality Management• Zero defect product
Aim is reduction of production cycle time from the raw material to the final product and maintenance of quality.
Extrusion is one of the most important processes in plastic engineering for the production of polymer blends and polymer/additive systems (fillers, UV-stabilizer, etc.)
Process analysis in the polymer industry has a significant growth because of • increased demands on the quality of polymeric products• increased legislative demands• reduction of production costs by avoidance of polymers of insufficient quality • environmental protection

Institute of Polymer Research Dresden
NIR Process Analysis
These demands require rapid, reliable non-invasive and cost effective analytical methods for process control
---> Spectroscopic methods like IR (ATR), NIR and RAMAN
On-line systemextracts the sample continuously (bypass) and presents it to the instrumentadvantage: separated from the process stream, so temperature and
pressure can be controlleddisadvantage: time lag between sampling and measurement
In-line systemmeasurement is done directly in the process lineadvantage: no sampling delays disadvantage: measurement is limited by temperature and pressure variations
the probe can interfere with the main process stream

Institute of Polymer Research Dresden
Extrusion monitoring of polymer melt streams on a twin screw extruder with ATR-IR, NIR und Raman probes

Institute of Polymer Research Dresden
Extrusion monitoring Equipment and experimental conditions
Single and twin screw extruders
melt pressure: 20 - 270 bar (4000 psi) melt temperature: 120 - 280 °C
a melt-at-die interface is adapted on the end of the extruders
NIR probes are in the interfaces, the probes are connectedvia optical fibers to the NIR spectrometer
NIR-probes: Transmission probes (Axiom) Diffuse reflectance probe (BTO)
NIR-spectrometer: diodearray (InGaAs) – process spectrometer SentroProc (Sentronic), 900 - 1700 nm (5800 – 11000 cm-1)with an internal drift correction for longtime stability andno moving parts inside for mechanical stability

Institute of Polymer Research Dresden

Institute of Polymer Research Dresden
Extruder with
NIR- and Raman-probe
Raman-probe
Adapter
melt
NIR-probe

Institute of Polymer Research Dresden
Determination of the content of Vinylacetate (VA)in PP/EVA-blends by in-line NIR-spectroscopy
EVA is a random copolymer. The incorporation of VA lead to better flexibility and clarity and to better mechanical properties, e. g. impact strength.
Applications for PP/EVA blends are:# hot melt adhesives # resins# coatings# textiles
PP: EVA:CH2 CH CH2 CH2 CH2 CH
O
C
CH3
OCH3

Institute of Polymer Research Dresden
Determination of the content of Vinylacetate (VA)in PP/EVA-blends by in-line NIR-spectroscopy
Aim was the determination of the efficiency of NIR-spectroscopy for the quantitative limit of detection and the accuracy and reproducibility of this blend in real time during extrusion.
Measure time: 5 ms / scan (1000 scans in 5 sec for one spectrum)Measurement in Transmission (5 mm pathlength)25 different PP/EVA mixtures with a VA-content from 0 to 10 % were extruded
ChemometricsPLS (GRAMS32/PLSplus/IQ (Galactic))21 mixtures for calibration - 168 spectra (8 spectra for every mixture)4 mixtures for validation
Wavelength region: 1100 bis 1300 nm (9090 – 7690 cm-1)R2 = 0,999 (6 main components)

Institute of Polymer Research Dresden
Determination of the content of Vinylacetate (VA)in PP/EVA-blends by in-line NIR-spectroscopy
.05
.1
.15
.2
.25
.3
.35
.4
1100 1200 1300 1400 1500 1600
Absorbance / Nanometers Overlay Y-Zoom CURSOR
File #17 : PP-EVA_11_2001.08.21_12;21;19 Res=None
Probe 25 PP-EVA 10,0%
In-line spectra

Institute of Polymer Research Dresden
Determination of the content of Vinylacetate (VA)in PP/EVA-blends by in-line NIR-spectroscopy
.1
.15
.2
.25
.3
.35
1140 1160 1180 1200 1220 1240 1260 1280
Absorbance / Nanometers Overlay Y-Zoom CURSOR
File #14 : PP-EVA_11_2001.08.21_11;04;34 Res=None
Probe 21 PP-EVA 6,0%
C-H 2nd overtone

Institute of Polymer Research Dresden
Determination of the content of Vinylacetate (VA)in PP/EVA-blends by in-line NIR-spectroscopy
process.tdf,10 (R² = 0.999109134)process.tdf,10 (R² = 0.999109134)
Actual Concentration ( C1 )Actual Concentration ( C1 )
Pre
dict
ed C
once
ntra
tion
( F6
C1
)P
redi
cted
Con
cent
ratio
n ( F
6 C
1 )
-1
2
5
8
11
0 3 6 9 -1
2
5
8
11
0 3 6 9
234567891011121314151617181920212223242526272829303132
33343536373839404142434445464748495051525354555657585960616263
66676869707172 7374757677787980
8182838485868788
8990919293949596
979899100101102103104 105
106107108109110111112
113114115116117118119120
121122123124125126127
130131132133134135136
137138139140141142143144
145146147148149150151152
153154155156157158159160
161162163164165166167
-1
2
5
8
11
0 3 6 9
SECV = 0.09 %

Institute of Polymer Research Dresden
In-line real time determination of the contentof VA in PP/EVA-blends
blend with 0,9 % VA
0,80
0,85
0,90
0,95
1,00
1,05
1,10
0 50 100 150 200 250 300
time [ s ]
VA-c
onte
nt [
% ]
accuracy (average error) = 0.08 %

Institute of Polymer Research Dresden
blend with 0,9 % VA (2 x extruded)
0,80
0,85
0,90
0,95
1,00
0,00 50,00 100,00 150,00 200,00 250,00 300,00 350,00 400,00
time [ s ]
dete
rmin
ed V
A-co
nten
t [%
]
In-line real time determination of the content of VA in PP/EVA-blends
accuracy (average error) = 0.02 %

Institute of Polymer Research Dresden
Determination of the content of the flame retardant melamine cyanurate (MC) in polyamide 12 (PA) during extrusion
Flame retardants are chemicals that are added to a large varietyof materials to increase their fire safety.
Many plastics are easy to ignite, therefore they are providedwith flame retardants.
The increasing use of plastics in application areas that have special demands for flame protection provides a wide arena for their use.
We can find flame-protected products in the most varied of areas:
• Buildings (insulation material, water pipes, facade facings) • Electronics (monitor housings, cables, plugs, fuse boxes, circuit boards) • Automotive (seats, roof liners, sun shades) • Airplanes/trains (seats, textiles/carpets, interior cladding, drive heads)

Institute of Polymer Research Dresden
Determination of the content of the flame retardant melamine cyanurate (MC) in polyamide 12 (PA) during extrusion
The demands placed on modern flame retardants have changed considerablyover the past years. In addition to effectiveness in the case of fire, environmental considerations also play a role in all phases of the product life cycle - from production, processing, application and recycling, which increasingly plays an important role.
Gas formation by melamine break down

Institute of Polymer Research Dresden
Determination of the content of the flame retardant melamine cyanurate (MC) in polyamide 12 (PA) during extrusion
PA is widely used in industry and for household products. It is flammable and so it is necessary to add a flame retardant.The content of the flame retardant vary according to application.
Measure time: 5 s / scan (10 scans in 50 sec for one spectrum) Measurement in Diffuse Reflectance
24 different PA12/MC mixtures with a content from 5 to 16 % MC were extruded
ChemometricsPLS, GRAMS32/PLSplus/IQ (Galactic)21 mixtures for calibration - 126 spectra (6 for every mixture)3 mixtures for validation
Data pretreatments: without pretreatment, MSC, SNV (standard normal variation)Wavelength region: 1132 – 1622 nm (8830 – 6165 cm-1) R2 = 0.999 (3 main components)

Institute of Polymer Research Dresden
Determination of the content of the flame retardant melamine cyanurate (MC) in polyamide 12 (PA) during extrusion
NIR-probe
RAMAN-probe

Institute of Polymer Research Dresden
Determination of the content of the flame retardant melamine cyanurate (MC) in polyamide 12 (PA) during extrusion
Inte
nsity
In-line spectra
Wavelength (nm)

Institute of Polymer Research Dresden
Determination of the content of the flame retardant melamine cyanurate (MC) in polyamide 12 (PA) during extrusion
calc
ulat
ed c
onte
ntM
C (%
)
true content MC (%)
R2 = 0.999
SECV = 0.06 %

Institute of Polymer Research Dresden
Determination of the content of the flame retardant melaminecyanurate (MC) in polyamide 12 (PA) during extrusion
0
2
4
6
8
10
12
14
16
calc
ulat
ed c
onte
nt M
C (%
)
no pretr. MSC SNV
no pretr. 7,52 10,49 13,44MSC 7,61 10,5 13,48SNV 7,47 10,47 13,45
1 2 3= 7,5 % = 10,5 % = 13,5 %true content MC

Institute of Polymer Research Dresden
robust, fast and combined spectrometers for NIR and Raman with embedded computers
NIR- and RAMANprocess spectrometerSentroProcNIRRAMAN(Sentronic)
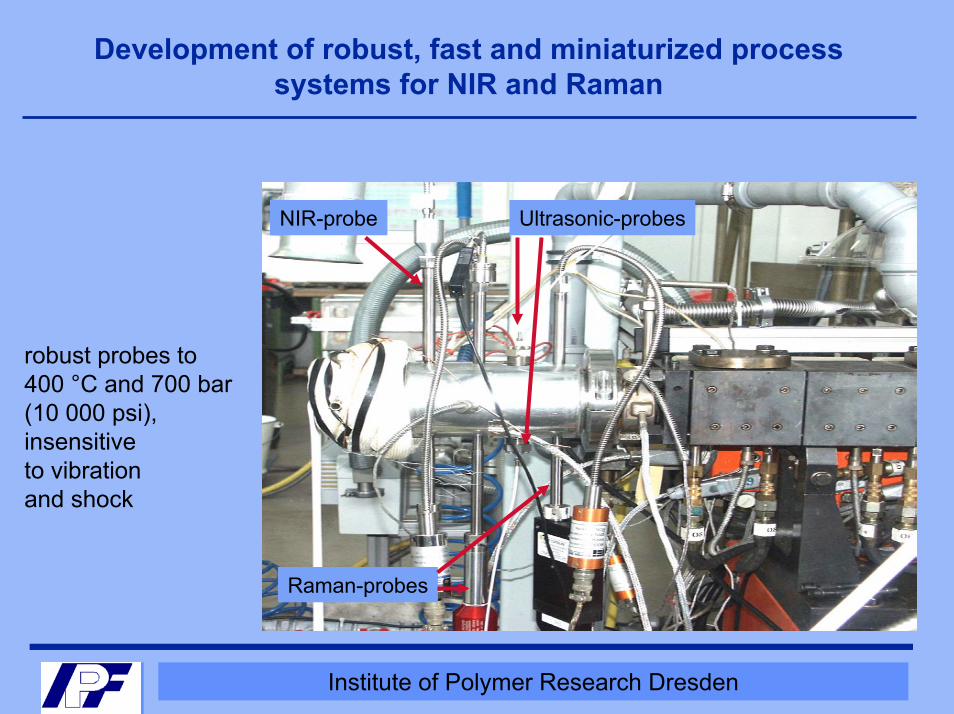
Development of robust, fast and miniaturized process systems for NIR and Raman
Institute of Polymer Research Dresden
robust probes to400 °C and 700 bar(10 000 psi), insensitive to vibration and shock
NIR-probe Ultrasonic-probes
Raman-probes
Development of robust, fast and miniaturized process systems for NIR and Raman

Institute of Polymer Research Dresden
Determination of the composition of PE/PS-blendsduring extrusion by NIR
11 different PE/PS blends with 0 – 100 % PS were extruded in a twin screw extruder (Micro-Leistritz) at 200 °C and 70 bar.
NIR-diodearray(InGaAs)-spectrometer (SentroProc, Sentronic GmbH),900 - 1700 nm, measure time 50 s (10 Spectra); NIR-DR-probe (BTO),fibers: 400 und 600 µm.
110 Spectra (10 spectra for every mixture)
Quantitative Analysis - NIR
Chemometrics (1132 bis 1622 cm-1)PLS - R2 = 0,997 (6 components)Standard error (SECV) = 0.97 %

Institute of Polymer Research Dresden
NIR spectra of PE/PS-blends during extrusion

Institute of Polymer Research Dresden
Validierung der NIR-Messungen der PE/PS-Blends (40 u. 65% PS)
35
40
45
50
55
60
65
70
75
1 2 3 4 5 6 7 8 9 10
Messung
Geh
alt P
S [%
]
peps40 peps65 wahrer Wert

Institute of Polymer Research Dresden
Determination of the composition of PP/EVA-Blends During extrusion by in-line Raman-Spectroscopy
24 different PP/EVA Blends from 0 to 6,65 % Vinylacetate-content were extruded in a single screw extruder (Viskosystem, Reifenhäuser) at 200 °C and 100 bar
Raman-Spectrometer (Holoprobe, Kaiser Optical Systems Inc.)Laser: 785 nm, CCD-diodearray detectorRaman high temperature and high pressure probemeasure time: 300 ms/scan, 40 scansfibers: 50 und 100 µm
20 blends for calibration, 4 blends for an independent validation
240 Spectra (10 spectra for every mixture

Institute of Polymer Research Dresden
PP/EVA - in-line RAMAN-Spectra

Institute of Polymer Research Dresden
PP/EVA - in-line RAMAN-Spectra (630 cm-1)

Institute of Polymer Research Dresden
Determination of the composition of PP/EVA-Blends During extrusion by in-line Raman-Spectroscopy
Quantitative Analysis
I. Chemometrics – PLS (350 bis 1600 cm-1)
R2 : 0,9937 (3 components)detection limit: 0.19 % Vinylacetate
II. Integration of the band area at 630 cm-1 (590-665 cm-1 )
detection limit: 0.095 % Vinylacetat

Institute of Polymer Research Dresden
Determination of the content of hemp fibers in PP/hemp-fiber composite materials by NIR
Investigation of PP/hemp-mixtures with hemp contents from 10 to 30 %
.4
.5
.6
.7
.8
6000 6500 7000 7500 8000 8500
cm-1
First overtone of OH of Cellulose

Institute of Polymer Research Dresden
Determination of the content of hemp fibers in PP/hemp-fiber composite materials by NIR
R2 = 0.98 SEP = 1,26Determination of independentValidation samples
Original Property / Predicted Property
All Spectra
True Property hanf
Pred
icte
d Pr
oper
ty h
anf
10 15 20 25 30
10
15
20
25
30
Validation Spectra f(x)=0.9888x+0.2301 r=0.980147Calibration Spectra f(x)=0.9733x+0.5340 r=0.986560Validation SpectraCalibration Spectra
User Spectra
sample
True
value
Calc.
value
1
12 %
12,4 %
2
18 %
20,0 %
3
20 %
21,5 %
4
28 %
27,9 %
Nirc
al:p
p-ha
nf-2
001.
nir5
/7,s
moo
th, 4
440-
9000
. 31.
07.0
2 15
:11:
20 A
dmin
istra
tor

Institute of Polymer Research Dresden
In-line NIR- und Raman-Spectroscopy in a Mixer
On-line NIR and Raman Spectroscopy of the Reaction PS/DGEBA with PS/MDEA and DMP 30
Mixer: Haake Rheomix 600p (Roller-Rotors R600). temperature for all experiments: 164 °C rotation speed: 60 rpm.
NIR measurements:spectrometer SentroProc NIR (Sentronic GmbHDresden, Germany) and with a diffuse reflectance fiber optic probe with a sapphire window.wavelength region: 1030 - 1660 nm time for one spectrum (50 accumulations): 1 min
Raman measurements: spectrometer HoloProbe (Kaiser Optical Systems, Inc., USA) and with a fiber optic probe with sapphire window.measure time for one spectrum (20 accumulations): 1 min

Institute of Polymer Research Dresden
In-line NIR- und Raman-Spectroscopy in a Mixer
Change of the baseline of the NIR spectra at 1250 nm(reaction 50PS/50DGEBA + 73PS/27MDEA, 07.11.01)
0,4
0,6
0,8
1
1,2
1,4
1,6
1,8
2
0 600 1200 1800 2400 3000 3600 4200 4800 5400 6000 6600 7200
time in s
abso
rban
ce a
t 125
0 nm

Institute of Polymer Research Dresden
In-line NIR- und Raman-Spectroscopy in a Mixer
.7
.8
.9
1
1.1
1200 1400 1600
1144 (reference)
1425 (OH)1497 (NH2)
X-Zoom CURSORAbsorbance / NanometersFile #17 : EPOXY+PS_123456_2001 Res=None
Figure 5: online NIR spectra of the reaction 50PS/50DGEBA + 73PS/27MDEA, 07.11.01

Institute of Polymer Research Dresden
In-line NIR- und Raman-Spectroscopy in a Mixer
. Change of relative absorbance for the NIR bands at 1425 nm and 1497 nm (reference at 1144 nm)
0,9400
0,9900
1,0400
1,0900
1,1400
1,1900
0 10 20 30 40 50 60 70 80 90 100 110 120
time in min
rela
tive
abso
rban
ce
NIR band at 1425 nmNIR band at 1497 nm
OH
NH2
Figure 6: Experiment A: reaction 50PS/50DGEBA + 73PS/27MDEA, 07.11.01
Institute of Polymer Research Dresden
In-line NIR- und Raman-Spectroscopy in a Mixer
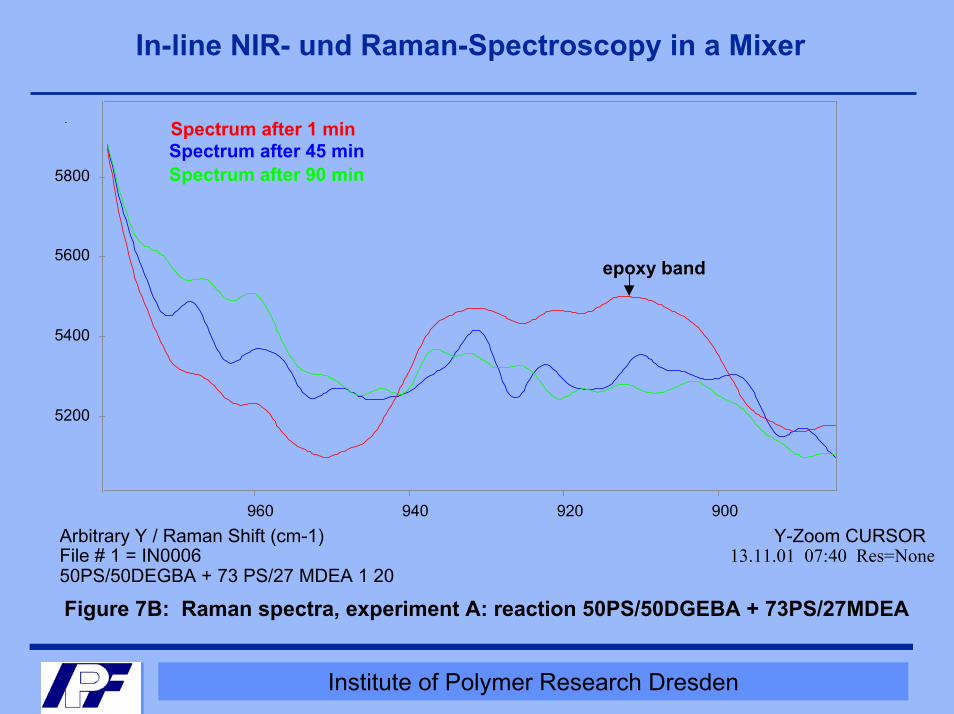
Spectrum after 1 minSpectrum after 45 minSpectrum after 90 min
epoxy band
.
5200
5400
5600
5800
960 940 920 900 Arbitrary Y / Raman Shift (cm-1)File # 1 = IN0006 50PS/50DEGBA + 73 PS/27 MDEA 1 20
Y-Zoom CURSOR13.11.01 07:40 Res=None
Figure 7B: Raman spectra, experiment A: reaction 50PS/50DGEBA + 73PS/27MDEA
Institute of Polymer Research Dresden
In-line NIR- und Raman-Spectroscopy in a Mixer
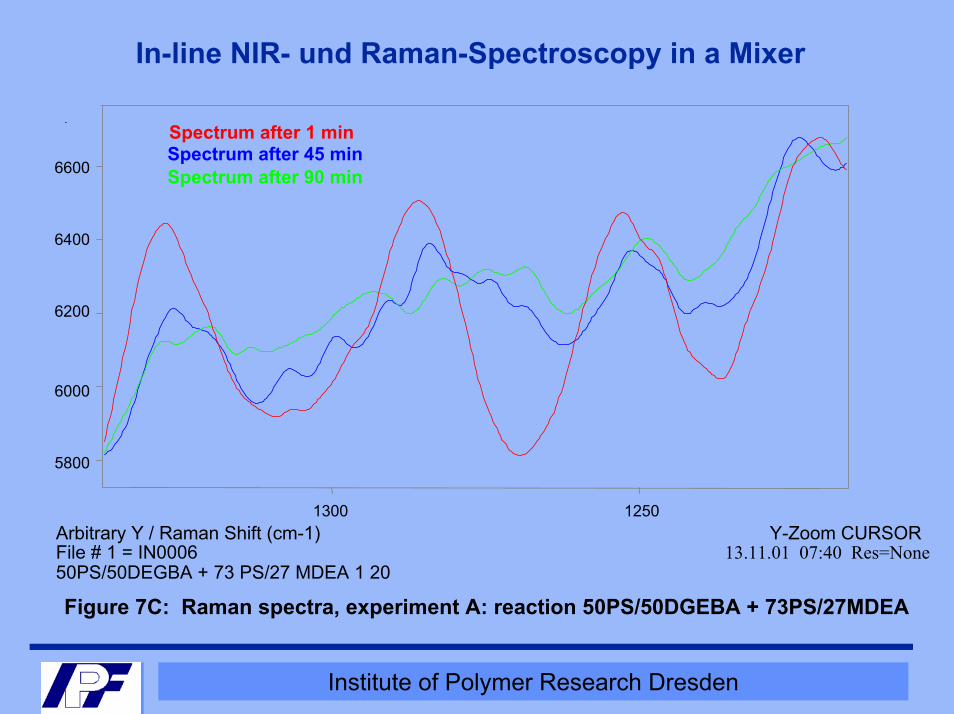
Spectrum after 1 minSpectrum after 45 minSpectrum after 90 min
.
6600
6400
6200
6000
5800
1300 1250Arbitrary Y / Raman Shift (cm-1)File # 1 = IN0006 50PS/50DEGBA + 73 PS/27 MDEA 1 20
Y-Zoom CURSOR13.11.01 07:40 Res=None
Figure 7C: Raman spectra, experiment A: reaction 50PS/50DGEBA + 73PS/27MDEA

Institute of Polymer Research Dresden
In-line NIR- und Raman-Spectroscopy in a Mixer
.
Figure 9: Experiment A: reaction 50PS/50DGEBA + 73PS/27MDEA,
Predicted conversion [%] calculated with calibration model (PLS)
0
20
40
60
80
100
0 10 20 30 40 50 60 70 80
time in min
pred
icte
d co
nver
sion
[%]
predicted conversionvalues, determined by INSA

Institute of Polymer Research Dresden
Summary - NIR spectroscopy for in-line process analysis
Advantages- transmission and reflectance measurements (for opaque melts)
- In-line determination in real time of the components of the melt
- Adaptation of robust high pressure and high temperature probes
by fibers up to 1000 m between probe and spectrometer
Disadvantages - calibration with a precise reference method necessary - chemometric method for quantitative evaluation necessary- limit of detection is dependent from the investigated polymer system (0.02 - 0.5%)

Institute of Polymer Research Dresden
Summary - NIR spectroscopy for in-line process analysisdiscussion of important points
Calibration and Validation data sets versus Cross Validation
Background-Spectrum: Spectralon-Standard; time between two backgrounds
Diffuse Reflectance:* the investigated systems should be homogenous * all calibration mixtures should have the same stray properties like the investigated
real system in the process (transfer of calibrations from the lab to the process is problematic)
Temperature and pressure have to be checked at the position of the probe
Optimisation of the connection probe - fiber – fiber interface in the spectrometer is very important
Use of fiber bundles or single fibers

Institute of Polymer Research Dresden
Summary - Message
Near infrared (and RAMAN) spectroscopy are powerful tools for process analysis, especially for monitoring polymers melts in extrusion processes.
In all investigations, emphasis should be given on the securing of the calibration during modifications of the spectrometer and the optimization of the fiber link between spectrometer and the probe.
The quantitative analysis carried out with multivariate methods can determine the composition of multicomponent mixtures.