ndt sami mahmood
DESCRIPTION
NDT-Sami MahmoodTRANSCRIPT

7/18/2019 NDT Sami Mahmood
http://slidepdf.com/reader/full/ndt-sami-mahmood 1/69
Materials characterization is concerned with
investigating the properties of materials.
Some of the techniques designed for such
purposes, however, are invasive, resulting in
changing the nature of the examined object,
or its permanent loss in some cases. When
this is not acceptable, methods for non-destructive testing are highly demanded.
This text is devoted to the discussion of the
principles and applications of some of these
methods.
NonDistructive
Testing
Sami Mahmood, The University of Jordan

7/18/2019 NDT Sami Mahmood
http://slidepdf.com/reader/full/ndt-sami-mahmood 2/69
Chapter 1
Introduction to Non Destructive Testing

7/18/2019 NDT Sami Mahmood
http://slidepdf.com/reader/full/ndt-sami-mahmood 3/69
Introduction
Materials characterization involve techniques concerned with investigating the various physical,
chemical, structural or morphological properties of an object or a sample of interest. The
techniques are commonly based on measuring quantities, analyzing the measured quantities interms of appropriate scientific principles, and correlating the results of analysis with specific
material properties. Some of the techniques designed for such purposes are invasive, and may
result in changing the nature of the examined object, destroying its structure, or lead to its
permanent loss in some case. This is not acceptable when we need to preserve the investigated
object, or minimize its damage. When we examine the constituents of an archaeological artifact,
an irreplaceable coin, or a valuable stone, it is important to keep the examined object unaffected;
when we examine the performance of a device, or the parts of a spaceship or wind mill, we do not
want to induce damage by the measuring technique; when we examine the quality of water in an
aquifer, we do not want a method which results in polluting the water; and when we examine
healthy tissues or organ in a human body, we do not accept a technique which kills the examine
tissue or organ. Accordingly, great efforts were spent to design non-destructive testing methods,
and apply them for testing and evaluation a broad spectrum of applications.
Accurate information pertaining to the properties, performance, or condition of a material or object
is often needed in many fields. Examples of required material evaluation are: In food science, thequality of foods and drinks manufactured for human consumption; in civil engineering , the
strength and serviceability of construction materials for homes, roads and arches; in mechanical
engineering and industry, the durability of components used for building machines such as cars,
aircrafts, ships, and power plants; in medicine, diagnosis of defects and disorders in bones, tissues,
and organs; in science, the performance of components and devices used in scientific
instrumentation, the composition and structure of materials, and the properties of materials; and in
archeology, the composition and dating of historical structures, materials and artifacts.
Accordingly, and for obvious reasons, the testing and evaluation technique should not destroy the
object under investigation, or change its potential for future use. Conventional chemical methods
for identifying historical objects, for example, involved dissolving the object in an acid, which
entails permanent loss of the object. Consequently, the field of Nondestructive testing (NDT)
evolved with the recent advances in science and technology as an essential branch of science
7/18/2019 NDT Sami Mahmood
http://slidepdf.com/reader/full/ndt-sami-mahmood 4/69
concerned with performing measurements of materials in ways that do not impair their future
usefulness and functionality, in order to detect, locate, and evaluate discontinuities, defects and
imperfection; to make an assessment of the integrity properties and composition; and to measure
geometrical characteristics.
The definition of NDT could be misleading. The above definition could imply non-destructive
measurements of an object, without inducing a damaging effect by the interactions of the probe
(such as mechanical vibrations, radiation, or temperature) with the object material. Such
techniques involve in-field evaluation of the strength or performance of parts in large
constructions (such as a bridge or a building), or in machines such as the wings of an aircraft, or
the blades of a wind mill. In another example of a NDT using in-field non-contact technique, the
radiation used by a radar system to measure the speed of a car does not induce any damage. Also,
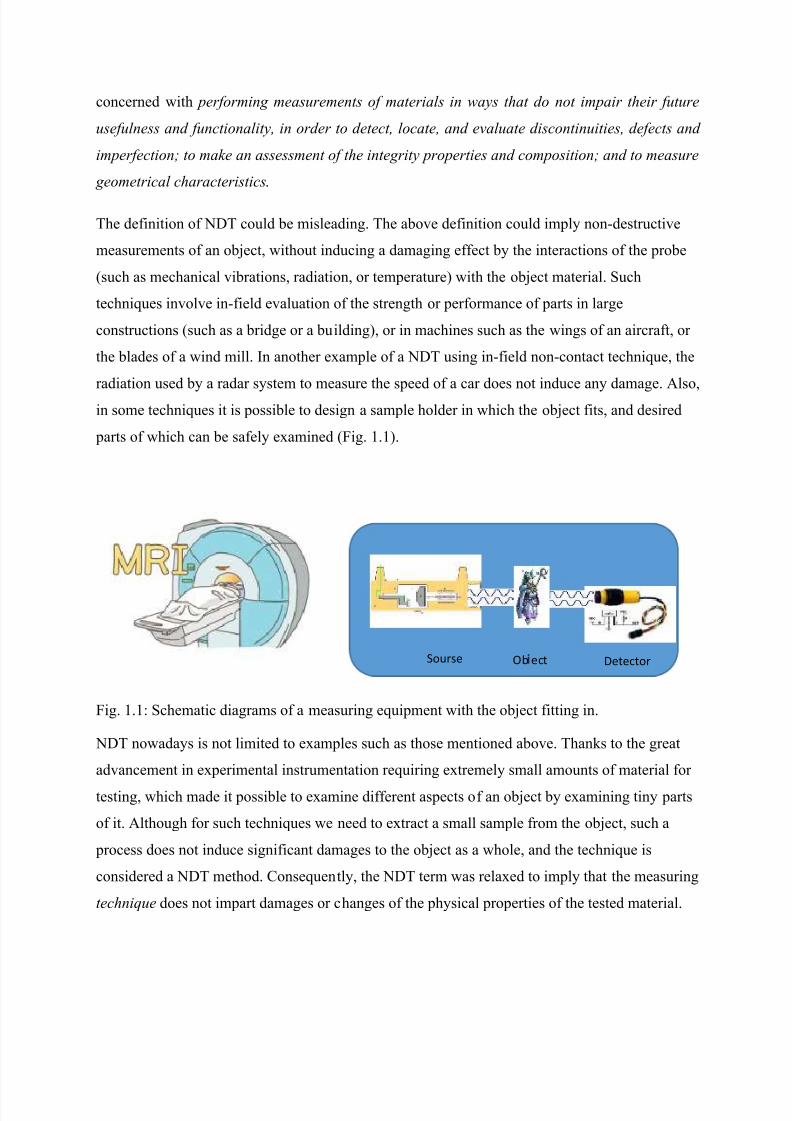
in some techniques it is possible to design a sample holder in which the object fits, and desired
parts of which can be safely examined (Fig. 1.1).
Fig. 1.1: Schematic diagrams of a measuring equipment with the object fitting in.
NDT nowadays is not limited to examples such as those mentioned above. Thanks to the great
advancement in experimental instrumentation requiring extremely small amounts of material for
testing, which made it possible to examine different aspects of an object by examining tiny parts
of it. Although for such techniques we need to extract a small sample from the object, such a
process does not induce significant damages to the object as a whole, and the technique is
considered a NDT method. Consequently, the NDT term was relaxed to imply that the measuring
technique does not impart damages or changes of the physical properties of the tested material.
DetectorOb ectSourse

7/18/2019 NDT Sami Mahmood
http://slidepdf.com/reader/full/ndt-sami-mahmood 5/69
An experimental setup designed to examine a given physical property usually includes a source
and a detector. In an experiment designed to investigate the structural characteristics of a sample
using x-ray diffraction experiment, the source produces an x-ray beam which is aimed at the
sample, and the detector measures the intensity of x-rays diffracted in different directions (Fig. 2).
For specific heat measurement, the source produces heat supplied to the sample, and the detector
is a thermometer which measures changes in the temperature of the sample as fixed amounts of
heat energy are supplied. In a simple experiment for measuring the electric resistance of a metallic
wire, the source produces an electric field which is applied across the wire, and a sensitive ammeter
is used to detect and measure the current. Thus, the x-ray beam, heat, and current in the above
examples are used to probe specific properties of the sample by measuring the response of the
material to interactions with these probes. In the example of x-ray diffraction, the interaction of
the material with the x-ray beam results in variations of the x-ray intensity scattered from the
sample in different directions, which are measured by the detector. In the case of specific heat
measurement, the heat raises the mean atomic or molecular velocity in the sample, and
consequently its temperature, which is measured by the thermometer. Finally, in measuring the
electrical resistance, electrons in the sample interact with the applied electric field and are driven
across the wire. The moving electrons scatter from crystal imperfections and impurities in the
sample (which is a source of electrical resistance), but in the presence of an applied field, the mean
drift velocity along the direction of the field is not zero, resulting in a current propagating along
the wire, which can be measured by an ammeter. In NDT, the interactions of the sample with the
probe should not result in changes in the properties or internal structure of the sample. So, x-rays
used should not, for example, destroy the crystallographic or molecular structure of the sample,
heat should not result in chemical reactions in the sample, and the applied field should not burn
the sample.
7/18/2019 NDT Sami Mahmood
http://slidepdf.com/reader/full/ndt-sami-mahmood 6/69
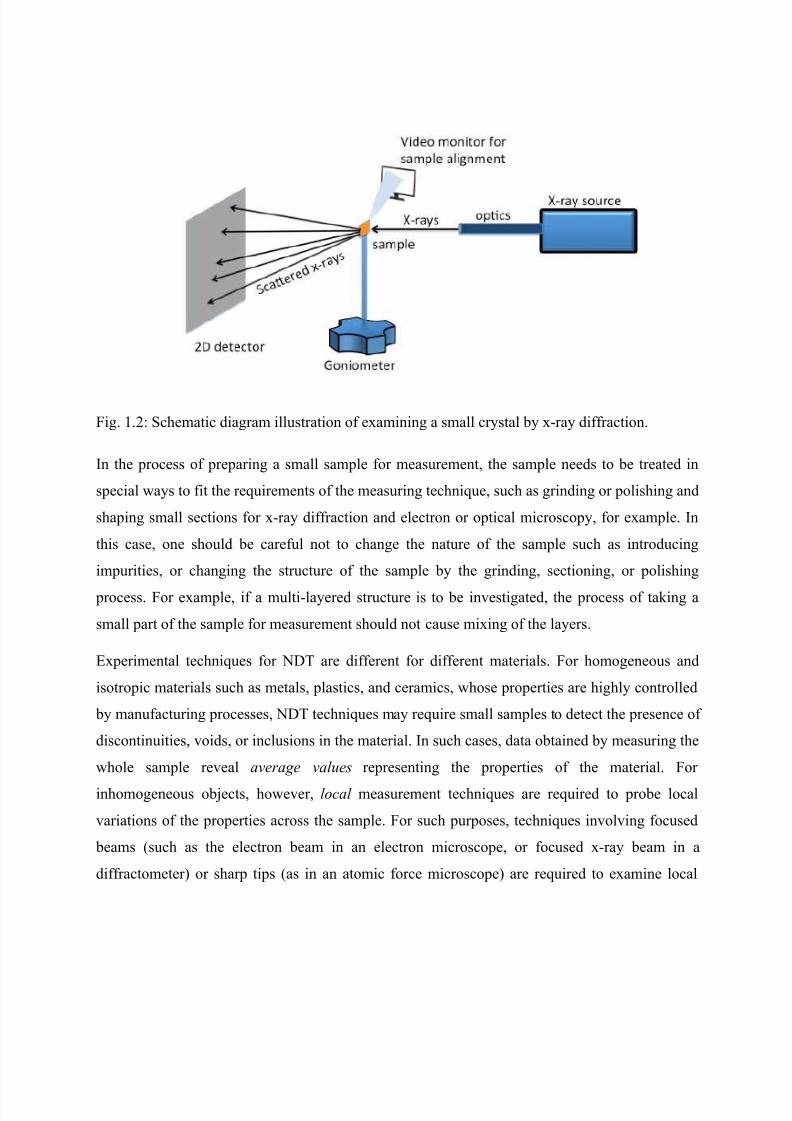
Fig. 1.2: Schematic diagram illustration of examining a small crystal by x-ray diffraction.
In the process of preparing a small sample for measurement, the sample needs to be treated in
special ways to fit the requirements of the measuring technique, such as grinding or polishing and
shaping small sections for x-ray diffraction and electron or optical microscopy, for example. In
this case, one should be careful not to change the nature of the sample such as introducing
impurities, or changing the structure of the sample by the grinding, sectioning, or polishing
process. For example, if a multi-layered structure is to be investigated, the process of taking a
small part of the sample for measurement should not cause mixing of the layers.
Experimental techniques for NDT are different for different materials. For homogeneous and
isotropic materials such as metals, plastics, and ceramics, whose properties are highly controlled
by manufacturing processes, NDT techniques may require small samples to detect the presence of
discontinuities, voids, or inclusions in the material. In such cases, data obtained by measuring the
whole sample reveal average values representing the properties of the material. For
inhomogeneous objects, however, local measurement techniques are required to probe local
variations of the properties across the sample. For such purposes, techniques involving focused
beams (such as the electron beam in an electron microscope, or focused x-ray beam in a
diffractometer) or sharp tips (as in an atomic force microscope) are required to examine local
7/18/2019 NDT Sami Mahmood
http://slidepdf.com/reader/full/ndt-sami-mahmood 7/69
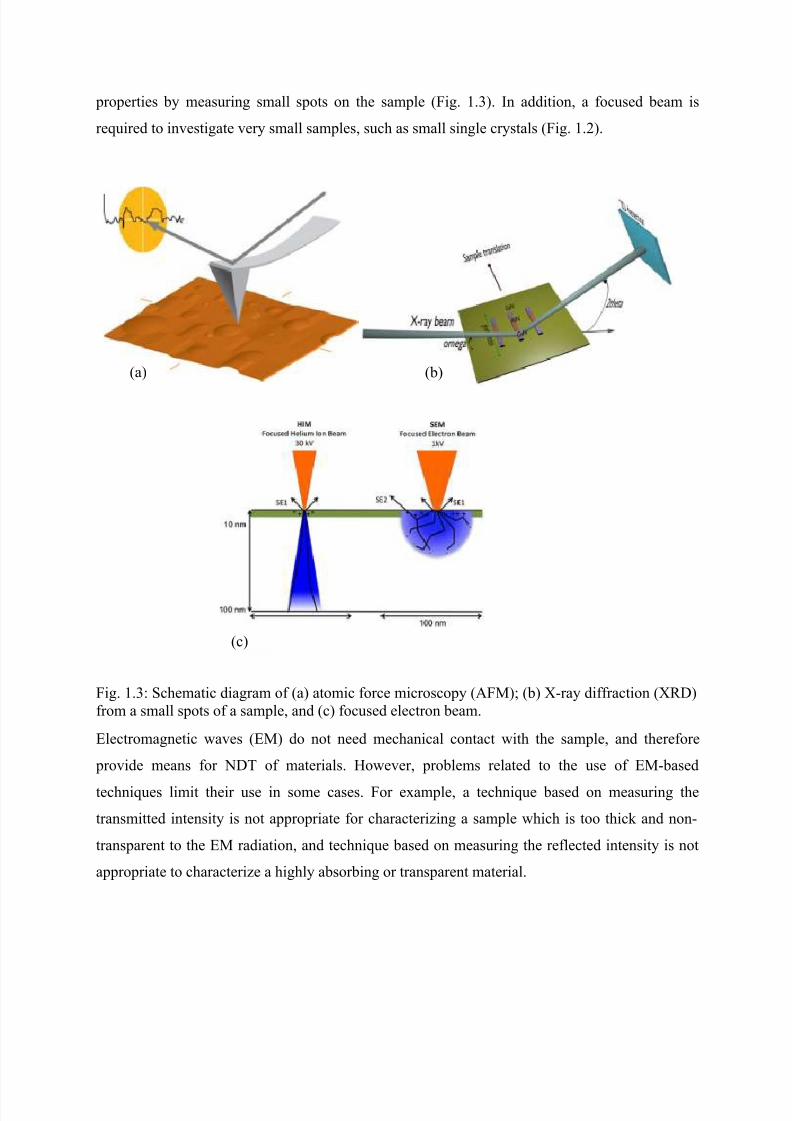
properties by measuring small spots on the sample (Fig. 1.3). In addition, a focused beam is
required to investigate very small samples, such as small single crystals (Fig. 1.2).
Fig. 1.3: Schematic diagram of (a) atomic force microscopy (AFM); (b) X-ray diffraction (XRD)from a small spots of a sample, and (c) focused electron beam.
Electromagnetic waves (EM) do not need mechanical contact with the sample, and therefore
provide means for NDT of materials. However, problems related to the use of EM-based
techniques limit their use in some cases. For example, a technique based on measuring the
transmitted intensity is not appropriate for characterizing a sample which is too thick and non-
transparent to the EM radiation, and technique based on measuring the reflected intensity is not
appropriate to characterize a highly absorbing or transparent material.
(a) (b)
(c)
7/18/2019 NDT Sami Mahmood
http://slidepdf.com/reader/full/ndt-sami-mahmood 8/69
Different NDT techniques for materials characterization were developed on the basis of the
different aspects of interactions of waves and particles, and their attenuation in the material,
reflection from surfaces, and induced emission of particles and radiation from the material.
Examples of the basis of such technique are:
1. Probing signals emanating from samples: spectroscopic techniques for materials
characterization were designed on the basis of detection of radiation (such as gamma-rays) emitted
from the sample.
2. Interaction of particles or radiation with the material: Techniques for materials characterization
based on detecting induced emission were developed. These include x-ray fluorescence (XRF),
and energy dispersive x-ray spectroscopy (EDS) for elemental analyses, absorption and reflection
of radiation for optical properties of solids and medical diagnosis, electron, neutron, and x-ray
reflection for structural studies.
3. Propagation of ultrasonic waves for materials characterization and medical applications.
4. Attenuation of x-ray in the material for x-ray tomography applications in materials and
medical sciences.
5. Interaction with electromagnetic fields and temperature gradients for transport, magnetic,
magneto-electric and magneto-optical properties.

7/18/2019 NDT Sami Mahmood
http://slidepdf.com/reader/full/ndt-sami-mahmood 9/69
Chapter 2
X-ray Imaging

7/18/2019 NDT Sami Mahmood
http://slidepdf.com/reader/full/ndt-sami-mahmood 10/69
2.1.
Materials Characterization by X-rays
X-rays are widely used for materials characterization in many disciplines, such as medical
sciences, materials science, geosciences and mineralogy, biology, and archaeology. Different
techniques of x-ray characterization based on different scientific principles were developedaccording to need. Thus, techniques based on measuring the attenuation (absorption) of x-rays in
materials were developed to observe variations, inhomogeneity, and defects in the material, and to
inspect the morphology and microstructure of objects. One of the widely used techniques for such
purposes is x-ray radiology (imaging). Other techniques based on measuring the reflected intensity
from the atomic planes in a material, and from aggregates of atoms in large molecular structures
were developed to investigate the crystalline structure and the atomic distributions, and to identify
the various phases existing in the material and determine their abundances in the measured sample.
In this context, x-ray diffraction (XRD) is widely used for structural and microstructural
characterization of materials in several fields, including and not limited to, physics and materials
science, chemistry and pharmacology, structural molecular biology, mineralogy, engineering, and
archaeology. Also, determination of the elemental composition of materials, and the chemical
stoichiometry of a sample is sometimes required. For such purposed, NDT techniques for
quantitative elemental analysis of samples were developed. XRD quantitative analysis can be
employed to determine the fractional masses of different phases existing in a multi-component
sample. However, dedicated techniques for elemental analysis based on the spectral characteristics
of radiation emitted by the different elements in the sample were developed. These include, and
are not limited to, x-ray fluorescence (XRF) spectroscopy using electromagnetic radiation for
atomic excitations, and energy dispersive x-ray spectroscopy (EDS) using electron beam excitation
in electron microscopes. Other techniques are available for materials characterization, but they are
not within the scope of this course, and our subsequent discussion of NDT techniques will be
limited to few examples, mainly relevant to materials science.
2.2.
X-ray Sources
X-rays are produced by different methods. Conventional x-ray tubes are used to produce x-rays by
bombarding a metallic target by an accelerated beam of electrons (Fig. 2.1). The x-rays produced
in such a way are characterized by a wide distribution of wavelengths (or energies) resulting from

7/18/2019 NDT Sami Mahmood
http://slidepdf.com/reader/full/ndt-sami-mahmood 11/69
the deceleration of electrons in the metal ( Bremsstrahlung ), and essentially monochromatic x-rays
resulting from the atomic transitions within the metal atoms (characteristic atomic spectra).
Fig.2.2. shows the spectrum generated by the tube. The thick-lined continuous spectrum is the
Bremsstrahlung, while the thin-lined, sharp peaks result from atomic transitions. Since in many
applications the polychromatic spectrum yields measurements which are difficult to analyze and
interpret, monochromatic x-ray beams are required. This is obtained by filtering the spectrum,
leaving the wavelength of interest. The intense atomic x-ray line ( K α line) produced by a
conventional x-ray tube is often used for real applications. This line has a characteristic wavelength
depending on the material of the metal target, and does not depend on the experimental conditions
of producing the spectrum. The most commonly used x-ray tubes in small laboratory equipment is
Cu-tube which produces x-ray beam with a mean wavelength of λ = 1.5418 Å. This line, in fact,
consists of two closely separated lines, namely, Cu- K α1 and Cu- K α2 lines. The above mentioned
wavelength is the average value for these two lines, which is used in experiments where distinction
between the two lines is difficult. Disadvantage of this technique of producing x-rays is that the
intensity of the beam is weak (partially due to the filtering process), but for many applications, the
obtained intensity is useful for characterization purposes. Advantages of this technique is its low
cost and availability within reach.
Fig. 2.1: schematic diagram of a conventional x-ray tube.

7/18/2019 NDT Sami Mahmood
http://slidepdf.com/reader/full/ndt-sami-mahmood 12/69
Fig. 2.2: x-ray spectrum generated by a conventional x-ray tube.
Sometimes higher intensities than can be provided by a conventional x-ray tube are required toobserve small variations of the properties of a sample, or to measure an extremely small sample
which gives a weak signal when using a conventional x-ray source. In such cases, intense x-ray
beams produced by large electron accelerators such as synchrotron light sources become very
valuable for materials characterization. In such a facility, electrons circulating in the storage ring
with very high speed emit radiation with high intensity as a consequence of their acceleration. The
radiation is passed through beam-lines equipped with dedicated beam optics to provide the beam
energy required for different applications (for example infrared spectroscopy, soft or hard x-ray
spectroscopy, structural studies). Although synchrotron radiation has an obvious advantage over
the conventional x-ray sources in the sense that it can provide intense beam over a wide range of
wavelengths, it has disadvantages in the sense that operating a synchrotron facility is relatively
much more expensive, and requires higher level of technical skills compared with conventional
Kα
K
Wavelen th λ
I n t e n s i t
7/18/2019 NDT Sami Mahmood
http://slidepdf.com/reader/full/ndt-sami-mahmood 13/69
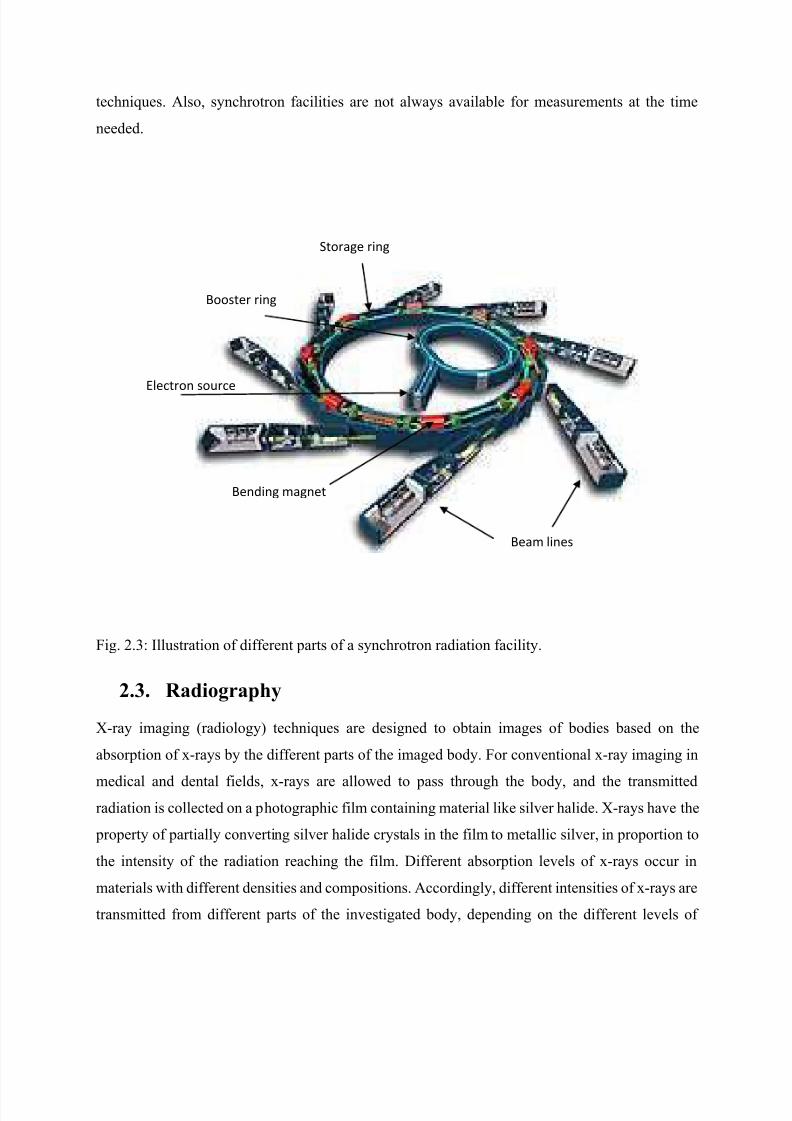
techniques. Also, synchrotron facilities are not always available for measurements at the time
needed.
Fig. 2.3: Illustration of different parts of a synchrotron radiation facility.
2.3.
Radiography
X-ray imaging (radiology) techniques are designed to obtain images of bodies based on the
absorption of x-rays by the different parts of the imaged body. For conventional x-ray imaging in
medical and dental fields, x-rays are allowed to pass through the body, and the transmittedradiation is collected on a photographic film containing material like silver halide. X-rays have the
property of partially converting silver halide crystals in the film to metallic silver, in proportion to
the intensity of the radiation reaching the film. Different absorption levels of x-rays occur in
materials with different densities and compositions. Accordingly, different intensities of x-rays are
transmitted from different parts of the investigated body, depending on the different levels of
Beam lines
Storage ring
Bending magnet
Booster ring
Electron source

7/18/2019 NDT Sami Mahmood
http://slidepdf.com/reader/full/ndt-sami-mahmood 14/69
absorption in the materials along the path of the beam, forming spots with different shades of grey,
and therefore forming the image. This can be developed and fixed in a similar way to normal
photographic film. The resolution of the technique is about 0.5 mm.
Fig. 2.4 shows an X-ray image obtained according to the discussed procedure. Notice that the
highly absorbing material (bones in this case) appeared as a light image on the dark background
produced by the high intensity x-ray falling on the film. Less dense material (such as at the joints)
appeared grey. A disadvantage of this technique is that the absorption is monitored along the beam
through the whole thickness of the body, and if different structures are penetrated by the beam,
their absorption effects overlap and their images become difficult to resolve.
Fig. 2.4: X-ray photograph from a conventional medical imaging method.
In industry, this technique can be used for the inspection of internal defects in materials. The object
to be tested is placed between the source of radiation and the film. As the beam passes through
voids, its attenuation is less than beam passing through homogeneous regions with no voids.
Accordingly, beams transmitted through regions with voids make darkened areas on the film, on
a clear background (see Fig. 2.5 [1]).

7/18/2019 NDT Sami Mahmood
http://slidepdf.com/reader/full/ndt-sami-mahmood 15/69
Fig. 2.5: Illustration of the imaging of voids in a sample using radiology.
Advantages of Radiography [1]
Information on sample characteristics is easily obtained as it is presented pictorially. A permanent record of the information is provided, which may be viewed at a time and
place distant from the test.
Useful for thin sections.
Sensitivity declared on each film.
Suitable for any material.
Disadvantages of Radiography
Generally an inability to cope with thick sections. Possible health hazard due to exposure to radiation.
Need to direct the beam accurately for two-dimensional defects.
Film processing and viewing facilities are necessary.
Not suitable for surface defects, since it is a technique based on probing the material
along the path of the beam.
7/18/2019 NDT Sami Mahmood
http://slidepdf.com/reader/full/ndt-sami-mahmood 16/69
The technique does not provide information related to the depth of a defect below the
surface of the sample
X-ray tomography
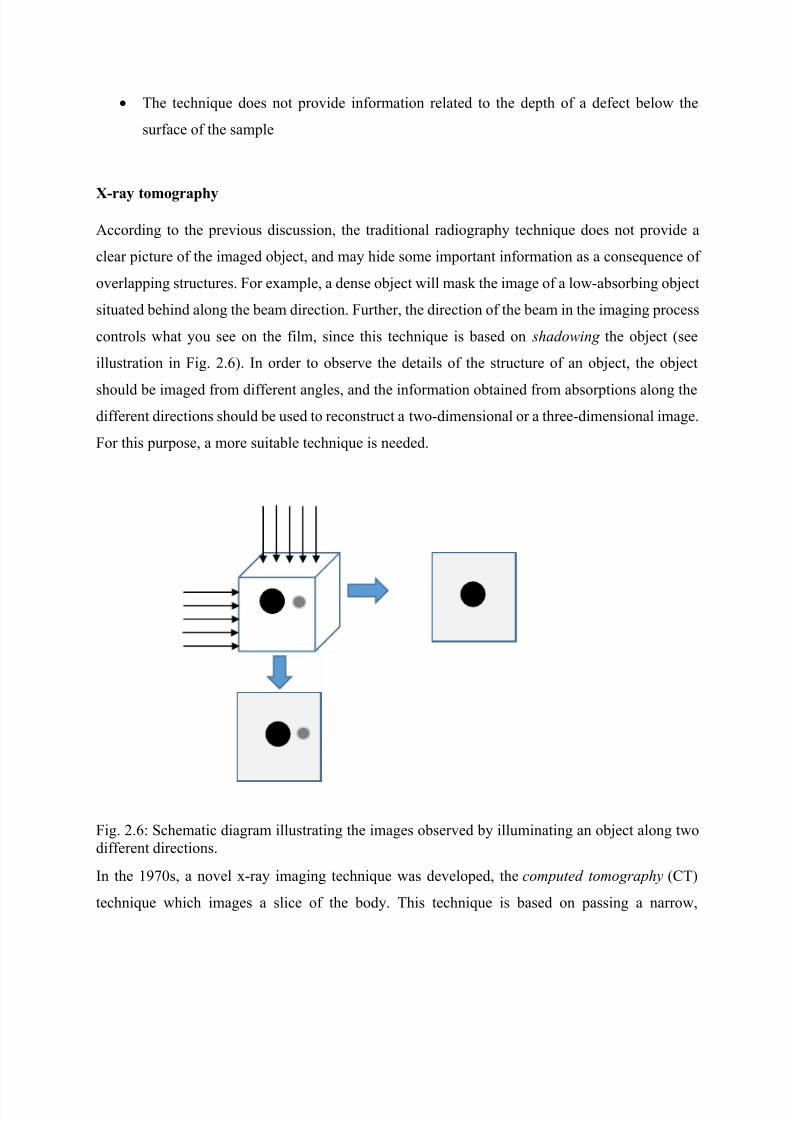
According to the previous discussion, the traditional radiography technique does not provide a
clear picture of the imaged object, and may hide some important information as a consequence of
overlapping structures. For example, a dense object will mask the image of a low-absorbing object
situated behind along the beam direction. Further, the direction of the beam in the imaging process
controls what you see on the film, since this technique is based on shadowing the object (see
illustration in Fig. 2.6). In order to observe the details of the structure of an object, the object
should be imaged from different angles, and the information obtained from absorptions along thedifferent directions should be used to reconstruct a two-dimensional or a three-dimensional image.
For this purpose, a more suitable technique is needed.
Fig. 2.6: Schematic diagram illustrating the images observed by illuminating an object along twodifferent directions.
In the 1970s, a novel x-ray imaging technique was developed, the computed tomography (CT)
technique which images a slice of the body. This technique is based on passing a narrow,
7/18/2019 NDT Sami Mahmood
http://slidepdf.com/reader/full/ndt-sami-mahmood 17/69
collimated x-ray beam through the body, and detecting the transmitted intensity. Measurements
are carried out at as many spots of the imaged body as demanded by the desired resolution of the
technique; this is done by moving the beam across the body (scanning the body). In this manner,
the scanned slice can be viewed as being divided into the desired number of elements ( pixels). The
body is then rotated about the body axis perpendicular to the imaged slice (or the beam is rotated
about the body axis) by a small angle (like 1°), and the scan is repeated. The transmitted intensity
is subtracted from the incident intensity to obtain the total absorption (called a projection) along
the path of the beam. This absorption is caused by all the elements through which the beam passes,
and these elements cannot be distinguished by the measured projection. However, by analyzing all
projections obtained by scanning at different angles, the absorption by each element can be
estimated rather accurately, depending on the number of measurements made. The absorption by
each element is characterized by a number, which refers to the amount of the radiation absorbed
by the element. The image is reconstructed from these values by assigning a gray level to each
number.
The number of pixels in a given image determines the resolution of the image. Better resolution is
obtained by increasing the number of pixels as sown by Fig. 2.7 and 2.8. But to determine the gray
level of N pixels, we need at least N projections. For example, in reconstructing a 100×100 image
(using 10,000 pixels) a 100 projections measured at a 100 different angles give the necessary
number to estimate the absorption (gray level) by each pixel. Analysis of these projections,
however, yields an estimate of the gray levels of the pixels which is close, but not exactly equal to
the true absorption values. Measurements at more angles would refine the result and yield better
estimates, and thus a better quality of the image. In the following example, we consider a simple
2×2 image.

7/18/2019 NDT Sami Mahmood
http://slidepdf.com/reader/full/ndt-sami-mahmood 18/69
Fig. 2.7: Illustration of the improved resolution of an image with the increase in the number of pixels.
Fig. 2.8: Image of a triangle constructed by different numbers of pixels: 4 in the upper panels(2×2 image), 16 in the middle panels (4×4 image), and 64 in the lower panels (8×8 image). Notice how the image improves by increasing the number of pixels. A very large number of pixels is required for a high resolution image.
7/18/2019 NDT Sami Mahmood
http://slidepdf.com/reader/full/ndt-sami-mahmood 19/69
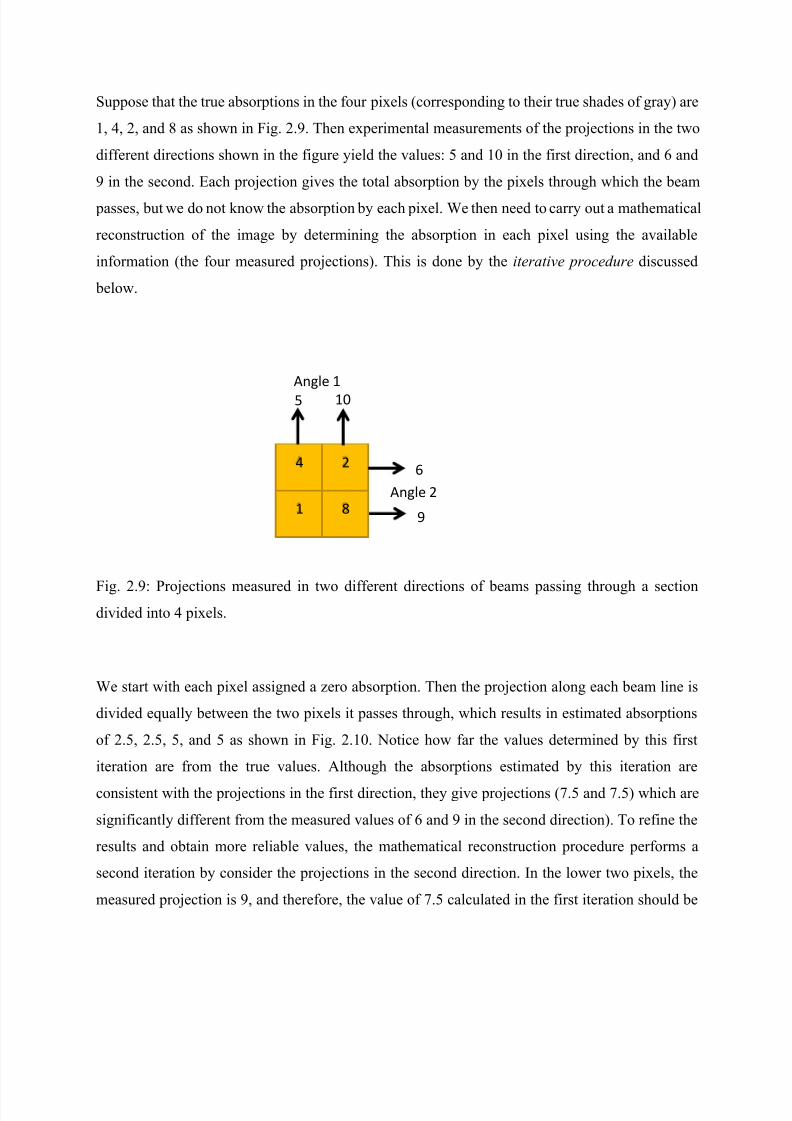
Suppose that the true absorptions in the four pixels (corresponding to their true shades of gray) are
1, 4, 2, and 8 as shown in Fig. 2.9. Then experimental measurements of the projections in the two
different directions shown in the figure yield the values: 5 and 10 in the first direction, and 6 and
9 in the second. Each projection gives the total absorption by the pixels through which the beam
passes, but we do not know the absorption by each pixel. We then need to carry out a mathematical
reconstruction of the image by determining the absorption in each pixel using the available
information (the four measured projections). This is done by the iterative procedure discussed
below.
Fig. 2.9: Projections measured in two different directions of beams passing through a sectiondivided into 4 pixels.
We start with each pixel assigned a zero absorption. Then the projection along each beam line is
divided equally between the two pixels it passes through, which results in estimated absorptions
of 2.5, 2.5, 5, and 5 as shown in Fig. 2.10. Notice how far the values determined by this first
iteration are from the true values. Although the absorptions estimated by this iteration are
consistent with the projections in the first direction, they give projections (7.5 and 7.5) which are
significantly different from the measured values of 6 and 9 in the second direction). To refine the
results and obtain more reliable values, the mathematical reconstruction procedure performs a
second iteration by consider the projections in the second direction. In the lower two pixels, the
measured projection is 9, and therefore, the value of 7.5 calculated in the first iteration should be
1 8
24
5 10
6
9
Angle 1
Angle 2

7/18/2019 NDT Sami Mahmood
http://slidepdf.com/reader/full/ndt-sami-mahmood 20/69
increased by 1.5 to obtain the correct measured value. Thus, 0.75 should be added to the absorption
calculated in the first iteration for each of these two pixels, resulting in 3.25 in the lower left pixel,
and 5.75 in the lower right pixel. Similarly, the absorption by each of the upper two pixels should
be reduced by 0.75 in order to give the measured projection of 6, resulting in 1.75 in the upper left
pixel and 4.25 in the upper right pixel. Notice that the calculated absorptions in the second iteration
give the right measured projections along the two direction, and can be considered as estimates of
the gray levels of the four pixels. However, the calculated absorptions are still significantly
different from the true values, and the obtained image from this mathematical reconstruction is not
reliable.
Fig. 2.10: First iteration of the mathematical reconstruction of the 2×2 image.
To improve the mathematical construction of the image, further refinements of the calculated
image can be done by making additional measurements of the projections along other directions.
The measured projections in the directions of angle 3 and angle 4 are 12 and 3, respectively (Fig.
2.11), which are significantly different from the calculated projection of 7.5 in in each of these
directions. Therefore, additional iteration of the calculations can be performed by considering the
projections along these directions. By comparing the measured and calculated projections we
conclude that a value of 2.25 should be added to the absorption of each of the upper left and lowerright pixels, giving values of 4 and 8, respectively. Similarly, the absorption of each of the upper
right and lower left pixels should be reduced by 2.25 in order to obtain the measured projection of
3 in the direction of angle 4. This results in absorptions of 2 and 1 in these pixels, respectively.
The final values in Fig. 2.11 are the true absorption values, and are consistent with the measured
2.5 5
52.5
5 10
Angle 1
3.25 5.75
4.251.756
9
Angle 2

7/18/2019 NDT Sami Mahmood
http://slidepdf.com/reader/full/ndt-sami-mahmood 21/69
projections in all directions. Thus, the iterative calculation led to the true values of gray levels in
this simple case.
Fig. 2.11: Second iteration to improve the mathematical reconstruction of the 2×2 image.
In real applications, a large number of pixels is required to construct an accurate image Fig. 2.12).
However, the exact shades of gray may not be attainable by the iterative calculation process in the
case of high number of pixels. In this case, we compare the calculated and measured projections,
and look for convergence of the results. The calculation is considered sufficiently precise and
iteration is terminated when the difference between calculated and measured projections is smaller
than an acceptable value (5% for example). Notice that higher precisions require more iterations,
and more time, and a compromise between the image quality and time minimization should be
made.
Fig. 2.12: CT scan with canvas size 241×285 (left) and 630×630 (right).
1 8
24
3 12
Angle 3
Angle 4

7/18/2019 NDT Sami Mahmood
http://slidepdf.com/reader/full/ndt-sami-mahmood 22/69
Two-dimensional (2-D) computed tomography (CT) imaging in digital radiography is a powerful
technique in industry for non-destructive testing of internal features of an object to identify
defects and part geometry. The earliest and simplest CT digital radiography scanner for medical
applications consisted of a single source and detector, both of which rotate about the object (a
human head) to produce a 2-D image. A three-dimensional image can be constructed by
performing multiple CT scans from successive slices separated by very small distances (as
deemed by the resolution) along the axis of rotation. Such 3-D scans can be used for a variety of
purposes such as viewing the shape of defects and the internal structure of an object (Fig. 2.13
[2]).
Fig. 2.13: Schematic diagram illustrating the multiple CT scans to produce a 3-D image.
This technique is time consuming, and a more advanced tomographic scanner was designed on
the basis of using a fan beam and multiple detectors (Fig. 2.14 [3]). In this method, all spots of
the scanned slice are examined simultaneously in a given beam direction, and an accurate image
of the slice is constructed from the data collected by rotating both source and detectors about the
object axis. In digital industrial radiography scanner, the object positioned on a turntable can be
both translated and rotated.
Radiography
X-ray beam

7/18/2019 NDT Sami Mahmood
http://slidepdf.com/reader/full/ndt-sami-mahmood 23/69
Fig. 2.14: 2D – CT system for reconstruction of one object layer by one fan beam x-ray scan. The
attenuated X-ray data are collected at short time intervals, and the X-ray measurements are then
digitized and the image is reconstructed and displayed as a 2-D image on the computer screen.
Another scanner was designed to reconstruct a 3D-CT image of an object using a cone beam as
illustrated in Fig. 2.15. The object is irradiated, and data on the attenuation of x-rays are obtained
as the object rotates in the X-ray cone. The set of projections obtained in this way is used to
reconstruct the 3D structure of the object.
Fig. 2.15: 3-D imaging of an object by a cone beam.

7/18/2019 NDT Sami Mahmood
http://slidepdf.com/reader/full/ndt-sami-mahmood 24/69
Radiography is used in industry for metal casting inspection. Digital radiography applied to
evaluate the quality of metal casting and detect flows in the product can save time and cost of
inspection. Further, digital imaging provide the opportunity to process the images and obtain
necessary information. Fig. 2.16 shows a photograph of an aluminum casting, and a slice of the
cone beam CT scan which reveals the presence of flaws in the casting [3].
Fig. 2.16: A photograph of an aluminum casting (left) and a slice of the CT scan (right) (Taken
from Ref. [3]).
Radiography was also proposed as a nondestructive technique for evaluating the performance of
solid oxide fuel cells (SOFC). The electrode material in the SOFC contains pores, and
electrochemical reactions occur at the triple phase boundaries between the ionic, electronic, and
pore phases [4]. Therefore, understanding the microstructure of the anode material using non-
destructive techniques is essential for the evaluation of the SOFC performance. The development
and implementation of X-ray optics has improved the resolution of X-ray computed tomography
(CT) in both lab and synchrotron environments, leading to the development and employment of
X-ray nano- tomography in materials characterization.
Radiation is attenuated in matter by different processes such as Compton scattering, elastic
scattering, and photoelectric effect. The absorption coefficient of the material is the sum of the
contributions of all processes, which are energy dependent. The total absorption coefficient

7/18/2019 NDT Sami Mahmood
http://slidepdf.com/reader/full/ndt-sami-mahmood 25/69
decreases with increasing the energy of the incident radiation until the energy becomes equal to a
characteristic atomic transition energy of the absorbing element. At that energy, the absorption
coefficient increase suddenly, demonstrating an absorption edge as illustrated in Fig. 2.17.
Fig. 2.17: Mass absorption coefficient of a material showing the contributions of the different
processes, and the absorption edge in the total absorption coefficient.
If an x-ray with energy just above the absorption edge is used in CT, this beam will suffer more
absorption by the material than that with energy just below the absorption edge. Accordingly,
comparison CT scans of the material obtained by using x-rays with energy above and below the
absorption edge allows the identification of the distribution of the absorbing element in the
imaged section. This methodology can be used in industrial NDT of materials. Fig. 2.18 shows
two scans of electrode material for SOFC which is composed of Ni-Yttria Stabilized Zerconia
(Ni-YSZ). The upper scan was obtained with x-ray energy (8.317 keV) below the absorption
edge of Ni, whereas the lower scan was obtained with x-ray energy (8.357 keV) just above the
absorption edge. Notice the increased opacity of some grains in the scan with x-ray energy above
the absorption edge; these grains are identified as Ni grains. Notice that image (b) demonstrates
the phase contrast that allows separation of the different phases using absorption edge
tomography.

7/18/2019 NDT Sami Mahmood
http://slidepdf.com/reader/full/ndt-sami-mahmood 26/69
Fig. 2.18. a) CT scan of the sample with x-ray energy below the Ni edge, and b) CT scan of thesample with x-ray energy above the Ni edge. Example of a Ni grain which demonstrated greatdifference in opacity is shown within the square box.

7/18/2019 NDT Sami Mahmood
http://slidepdf.com/reader/full/ndt-sami-mahmood 27/69
In automotive industry, CT was used to inspect the quality of automotive parts. Fig. 2.19 shows a
mini-CT system designed to inspect samples of interest. Figure 2.20 shows different views of the
of the nozzles of a Diesel injector reconstructed with the Mini-CT system [5].
Fig. 2.19: Mini-CT System with part of the housing removed for visibility of the components.Left: X-ray source, center: manipulator with sample (fuel injector), right: detector. Footprint55×18 cm2.
Fig. 2.20: 3D picture and c) projection of a slice of an injector obtained from CT. Diameter ofthe cross section is approximately 2 mm.

7/18/2019 NDT Sami Mahmood
http://slidepdf.com/reader/full/ndt-sami-mahmood 28/69
As a further application of CT, the technique is used in cable industry to evaluate the quality of
wire connections in household appliances, automotive industry, among other industries.
Electrical wiring often uses crimped contacts where the conducting wire strands are squeezed in
the crimp barrel, and the insulated part of the wire is crimped at the insulation grip (Fig. 2.21)
[6]. A good electrical contact requires that the metal strands are tightly squeezed in the crimp
barrel, which provides the required contact quality, and reduces the oxidation effects between
wire strands which could be detrimental in electrical connections.
Fig. 2.21: crimped contact with conductor (wire) composed of wire strands (from ref. [6]).
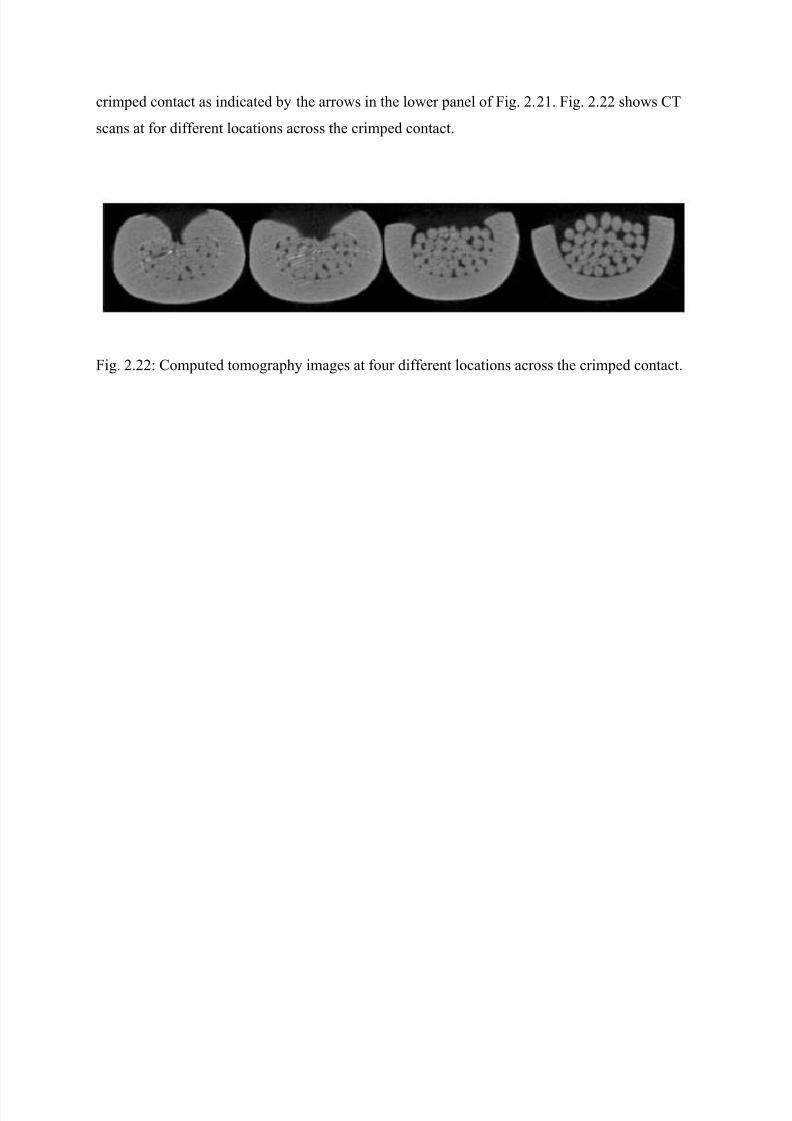
The number and distribution of wire strands, as well as the quality of electrical contact and
deformation of the wire strands can be evaluated by CT scans at different positions in the
Crimp barrel
Insulation grip Stripping
length
Conductor strands
Insulated Conductor
7/18/2019 NDT Sami Mahmood
http://slidepdf.com/reader/full/ndt-sami-mahmood 29/69
crimped contact as indicated by the arrows in the lower panel of Fig. 2.21. Fig. 2.22 shows CT
scans at for different locations across the crimped contact.
Fig. 2.22: Computed tomography images at four different locations across the crimped contact.

7/18/2019 NDT Sami Mahmood
http://slidepdf.com/reader/full/ndt-sami-mahmood 30/69
Chapter 3
Principles and Applications of X-Ray
Diffraction
7/18/2019 NDT Sami Mahmood
http://slidepdf.com/reader/full/ndt-sami-mahmood 31/69
3.1. Introduction
Solid materials are composed of atoms or molecules bonded together rigidly, so that except for the
vibrational motions of atoms or ions about their equilibrium positions in the solid, these
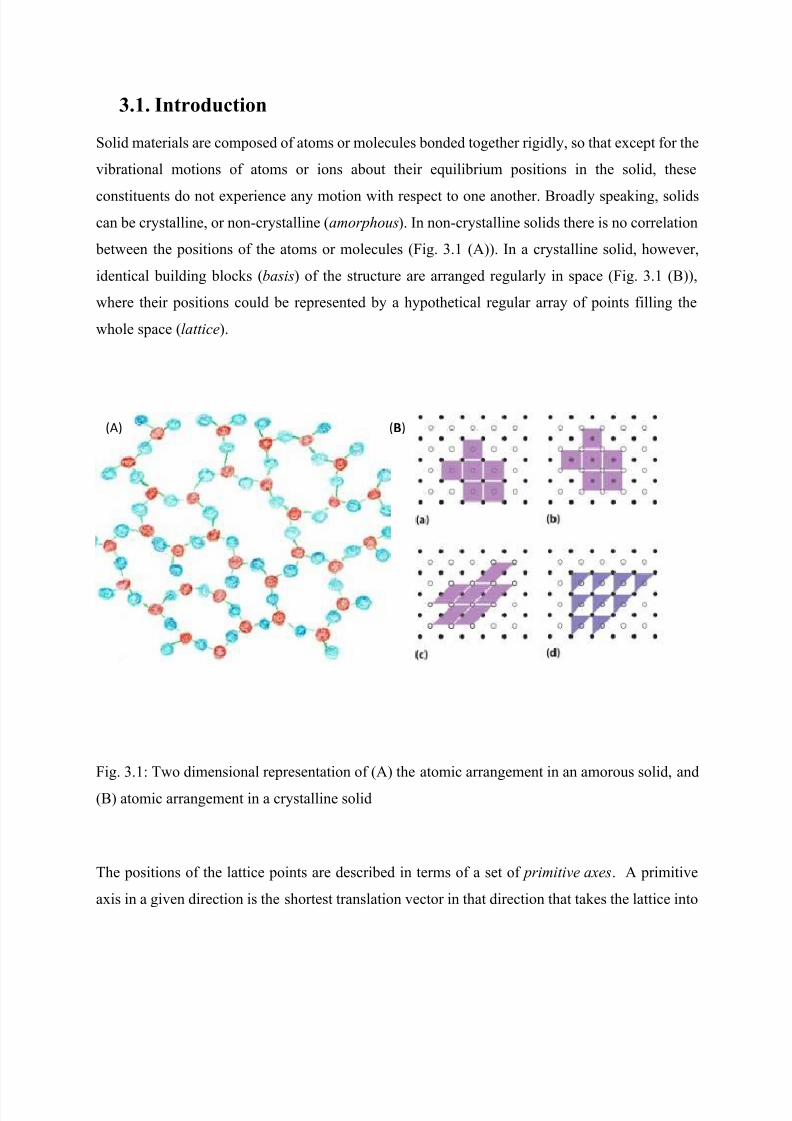
constituents do not experience any motion with respect to one another. Broadly speaking, solidscan be crystalline, or non-crystalline (amorphous). In non-crystalline solids there is no correlation
between the positions of the atoms or molecules (Fig. 3.1 (A)). In a crystalline solid, however,
identical building blocks (basis) of the structure are arranged regularly in space (Fig. 3.1 (B)),
where their positions could be represented by a hypothetical regular array of points filling the
whole space (lattice).
Fig. 3.1: Two dimensional representation of (A) the atomic arrangement in an amorous solid, and
(B) atomic arrangement in a crystalline solid
The positions of the lattice points are described in terms of a set of primitive axes. A primitive
axis in a given direction is the shortest translation vector in that direction that takes the lattice into
(A) (B)

7/18/2019 NDT Sami Mahmood
http://slidepdf.com/reader/full/ndt-sami-mahmood 32/69
itself (translational symmetry). The primitive cell or unit cell is the smallest parallelogram (in two
dimensions) or parallelepiped (in three dimensions) constructed by the primitive axes, and contains
only one basis set. For example, in metals such as Fe or Cu, the basis is one metallic atom, and the
primitive cell contains only one Fe or Cu atom, respectively. In NaCl crystal, the basis is one NaCl
molecule, and the primitive cell therefore contains one Na+ and one Cl – ions. Figures (a), (b) and
(c) above show different choices of primitive axes, and the resulting primitive cell in each case.
Although the primitive cells may look different, they all have the same volume and contain the
same number of atoms. Notice that we can fill the whole space with the crystal structure by
performing all possible translations of the primitive cell along the primitive axes. In terms of the
primitive axes , ,, the lattice (which fills the whole space) is constructed by the translation
vector:
= + + 3.1
Here n1, n2, n3 are integers.
In the crystal structure, a basis is distributed identically around each lattice point. The crystal
structure is then defined by the lattice plus the basis. Fig. 3.2 shows the three different types ofcubic crystals: the simple cubic (sc), the body-centered cubic (bcc), and the face centered cubic
(fcc). Notice that all atoms in each cubic cell are identical, and thus the position of each atom can
be regarded as a lattice point.
Fig. 3.2: The three lattices of the cubic system.
sc bcc fcc
Question: Does the shaded triangular cell in Fig. 3.1 (d) above represent a primitive cell? Why?
7/18/2019 NDT Sami Mahmood
http://slidepdf.com/reader/full/ndt-sami-mahmood 33/69
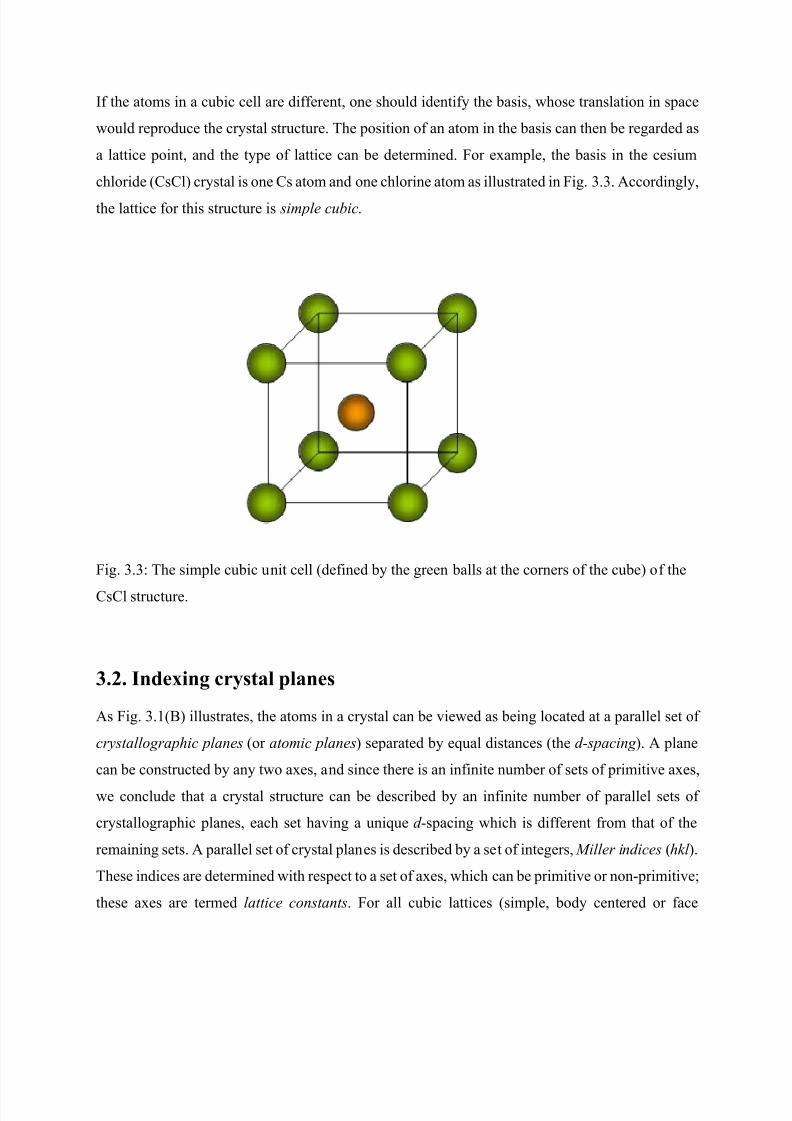
If the atoms in a cubic cell are different, one should identify the basis, whose translation in space
would reproduce the crystal structure. The position of an atom in the basis can then be regarded as
a lattice point, and the type of lattice can be determined. For example, the basis in the cesium
chloride (CsCl) crystal is one Cs atom and one chlorine atom as illustrated in Fig. 3.3. Accordingly,
the lattice for this structure is simple cubic.
Fig. 3.3: The simple cubic unit cell (defined by the green balls at the corners of the cube) of the
CsCl structure.
3.2. Indexing crystal planes
As Fig. 3.1(B) illustrates, the atoms in a crystal can be viewed as being located at a parallel set of
crystallographic planes (or atomic planes) separated by equal distances (the d-spacing ). A plane
can be constructed by any two axes, and since there is an infinite number of sets of primitive axes,
we conclude that a crystal structure can be described by an infinite number of parallel sets of
crystallographic planes, each set having a unique d -spacing which is different from that of the
remaining sets. A parallel set of crystal planes is described by a set of integers, Miller indices (hkl ).
These indices are determined with respect to a set of axes, which can be primitive or non-primitive;
these axes are termed lattice constants. For all cubic lattices (simple, body centered or face

7/18/2019 NDT Sami Mahmood
http://slidepdf.com/reader/full/ndt-sami-mahmood 34/69
centered), Miller indices are usually evaluated with respect to the axes of the conventional cubic
cell, in which case there is only one lattice constant (a). Also, for the hexagonal system, Miller
indices are determined with respect to the axes of the conventional hexagonal cell, which is non-
primitive. In this case there are two lattice constants (a = b; c). Miller indices for a set of parallel
crystal planes are determined as follows:
1. Find the intercepts of three points on the plane with the axes , , in terms of the lattice
constants as in Fig. 3.4.
2. Take the reciprocals of these intercepts, and multiply by the smallest integer that converts
these reciprocals into a set of integers. This set of integers represented as (hkl ) is the Miller
indices of the plane.
Fig. 3.4: Indexing a crystal plane.
Examples of important planes in a cubic crystal
It is customary to draw crystal planes within the conventional cubic cell as shown in Fig. 3.5. In
some cases, however, the plane in the chosen cell has a zero intercept on one or more of the axes,
which is not acceptable for indexing the set of planes. In this case, we choose another member of
the set in a neighboring cell. In Fig. 3.6 we show a plane in a chosen cell with zero intercept on
the a-axis. We therefore take the plane in the back-cell with intercepts of – 1, 1, ∞, and the Miller

7/18/2019 NDT Sami Mahmood
http://slidepdf.com/reader/full/ndt-sami-mahmood 35/69
indices for the plane are 1 10. The bar on top of the first integer indicates that the intercept on
the a-axis in negative.
Fig. 3.5: Some crystal planes in a cubic crystal.
Fig. 3.6: The 1 10 plane in a cubic crystal.
3.3. Structure determination
The crystal structure is usually determined by the diffraction of electrons, neutrons, or x-rays. In a
θ – 2θ x-ray diffraction experiment, a parallel beam of monochromatic x-rays is incident at an angle
(1 10)
(1 10)
(111) (200)(100)

7/18/2019 NDT Sami Mahmood
http://slidepdf.com/reader/full/ndt-sami-mahmood 36/69
θ on the surface of the sample, and the diffracted intensity in a direction making an angle 2θ with
the incident beam is measured (Fig. 3.7). The rays reflected from successive crystal planes
separated by d interfere constructively when the optical path difference between these rays is an
integer multiple of the wave length λ of the radiation, resulting in a maximum intensity. According
to Bragg’s law, a peak in the diffracted intensity is observed at an angular position 2θ with respect
to the direction of incidence (see Fig. 3.7) provided that:
2 sin = 3.2
Fig. 3.7: Derivation of Bragg’s law.
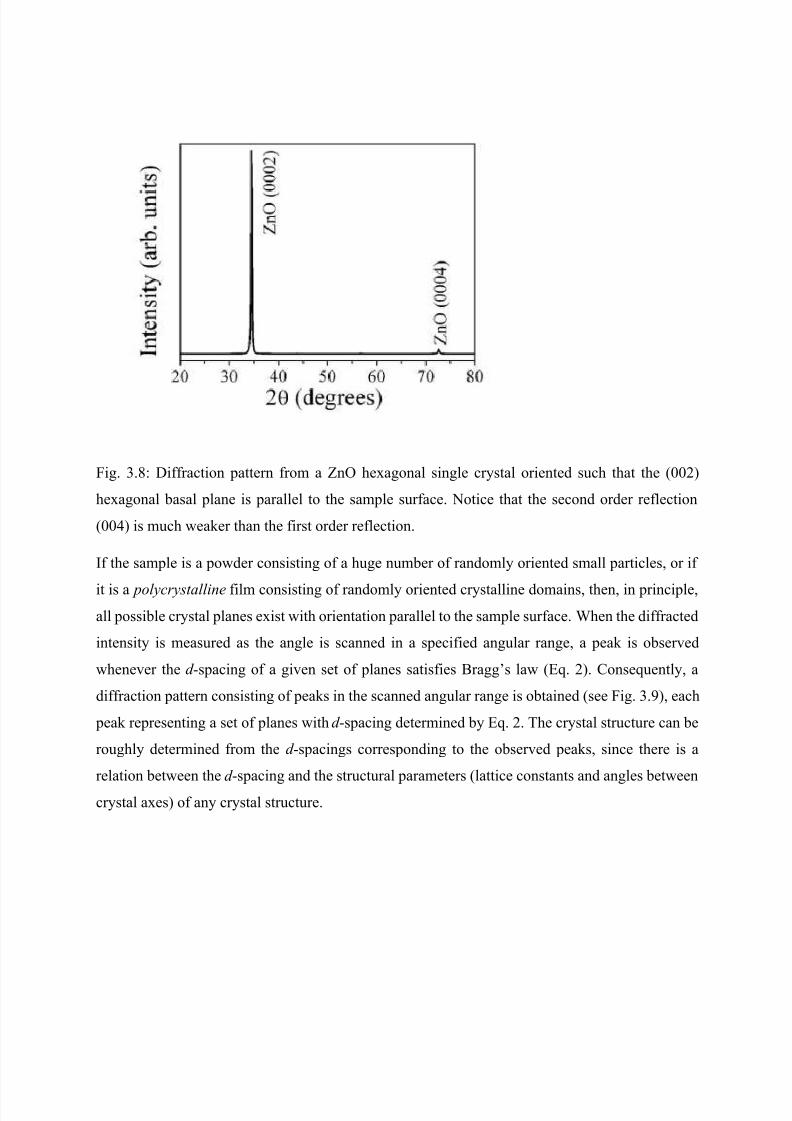
If the sample is a single crystal , constructive interference from one set atomic planes parallel to
the sample surface results in a peak representing reflection from that set of planes as shown in Fig.
3.8. The first order reflection (n = 1) in very strong with respect to higher order reflection (n ≥ 2)
as the figure illustrates.
7/18/2019 NDT Sami Mahmood
http://slidepdf.com/reader/full/ndt-sami-mahmood 37/69
Fig. 3.8: Diffraction pattern from a ZnO hexagonal single crystal oriented such that the (002)
hexagonal basal plane is parallel to the sample surface. Notice that the second order reflection
(004) is much weaker than the first order reflection.
If the sample is a powder consisting of a huge number of randomly oriented small particles, or if
it is a polycrystalline film consisting of randomly oriented crystalline domains, then, in principle,all possible crystal planes exist with orientation parallel to the sample surface. When the diffracted
intensity is measured as the angle is scanned in a specified angular range, a peak is observed
whenever the d -spacing of a given set of planes satisfies Bragg’s law (Eq. 2). Consequently, a
diffraction pattern consisting of peaks in the scanned angular range is obtained (see Fig. 3.9), each
peak representing a set of planes with d -spacing determined by Eq. 2. The crystal structure can be
roughly determined from the d -spacings corresponding to the observed peaks, since there is a
relation between the d -spacing and the structural parameters (lattice constants and angles between
crystal axes) of any crystal structure.

7/18/2019 NDT Sami Mahmood
http://slidepdf.com/reader/full/ndt-sami-mahmood 38/69
Fig. 3.9: Powder diffraction pattern of a fcc crystal. Notice that the second order reflection (004)
is much weaker than the first order reflection.
Notice that the observed peaks in a diffraction pattern do not represent all crystal planes. For
example, there is no peak corresponding to (100) or (110) reflection in the pattern shown in Fig.
3.9. We refer to this fact as: some reflections are not allowed . Each crystal structure (sc, bcc, fcc,
or hexagonal, for example) is characterized by a specified set of reflections, from which we can
determine the structure. The conditions for allowed reflections in cubic crystals are:
1. All reflections are allowed by a sc structure.
2. Only reflections with h + k + l = even number are allowed by a bcc structure.
3. Only reflections with h, k , l , all even or all odd numbers are allowed by a fcc structure.
Accordingly, the crystal structure in Fig. 12 is fcc.
For indexing the peaks in the pattern of a cubic structure, we first recognize that the relation
between the d -spacing an the lattice constant (a) is given by:
= √ ℎ + + 3.3
Accordingly, Bragg’s law leads to the relation:

7/18/2019 NDT Sami Mahmood
http://slidepdf.com/reader/full/ndt-sami-mahmood 39/69
sin =
4 ℎ + + 3.4
Notice that h2 + k 2 + l 2 is an integer. Accordingly, if sin2θ for each peak in the pattern is divided
by sin2θ for the first peak, and the resulting fractions are multiplied by the smallest number that
makes them integers, then these integers are equal to h2 + k 2 + l 2 for the different peaks. From
these, h, k , and l for each peak is determined by inspecting the possible values of the indices which
give the obtained sum of their squares as illustrated in Tables 1 and 2 for fcc and bcc structures,
respectively.
Table 1: Indexing the diffraction peaks of a fcc structure
sin2θ/sin2θ1 3×( sin2θ/sin2θ1) (hkl )
1.000 3 (111)
1.333 4 (200)
2.667 8 (220)
3.667 11 (311)
4.000 12 (220)
5.333 16 (400)
8.000 24 (422)
9.000 27 (511)
10.667 32 (440)
We notice from the last column that h, k , and l are all even or all odd, from which we conclude
that the structure is fcc. We can then determine the lattice constant from the d-spacing and the
indices for any reflection. For example, if the first (111) reflection in Fig. 12 occurs at 2θ = 19°,
and we use x-rays with wavelength λ = 1.5418 Å (Cu-K α radiation), then:
= 2sin = 1.5418
2×sin9.5 = 4.6708 Å
= × 1 + 1 + 1 =4.6708× √ 3 = 8.0900 Å

7/18/2019 NDT Sami Mahmood
http://slidepdf.com/reader/full/ndt-sami-mahmood 40/69
Table 2: Indexing the diffraction peaks of a bcc structure
sin2θ/sin2θ1 2×( sin2θ/sin2θ1) (hkl )
1.000 2 (110)
2.000 4 (200)3.000 6 (211)
4.000 8 (220)
5.000 10 (310)
6.000 12 (222)
7.000 14 (321)
8.000 16 (400)
9.000 18 (411), (330)
The ratios in the first column are all integers, which may lead us to conclude that the structure is
sc. However, it is not possible to find a set of h, k , l integers such that h2 + k 2 + l 2 = 7, we multiply
the ratios by 2 and inspect the resulting integers. We notice that the resulting integers are all
possible in the sense that we can always find a set of indices whose sum of squares would give the
obtained integer as illustrated in Table 2. We also notice that h + k + l is always even, which
indicates that the structure is bcc.
Metallic iron has a bcc structure. The first peak in the diffraction pattern of iron using Cu-K α
radiation was found to be at 2θ = 44.65°. Accordingly:
= 1.54182sin22.325 =2.0294 Å
= × √ 2 = 2.87 Å
If the peaks in a diffraction pattern cannot all be indexed according to the above procedure (seeFig. 3.10), then the sample could have more than one structural phase. In this case, the peaks
corresponding to one of the phases are identified by the indexing procedure discussed above. The
remaining peaks can then be separated and indexed to identify the corresponding phase. Thus,
XRD is a technique which can be used to determine the structural characteristics of a given
crystalline phase. This provides means for investigating structural transformations, and structural

7/18/2019 NDT Sami Mahmood
http://slidepdf.com/reader/full/ndt-sami-mahmood 41/69
defects in materials. Also, the technique allows the detection of different structural phases in a
sample, which allows identification of the different minerals in a sample (see Fig. 3.11 for
example). In addition, the technique allows the evaluation of impurity phases and their abundance
in a synthesized or naturally occurring mineral.
Fig. 3.10: XRD pattern of a sample with a majority fcc phase (indexed peaks) and a secondary
impurity phase (starred peaks).

7/18/2019 NDT Sami Mahmood
http://slidepdf.com/reader/full/ndt-sami-mahmood 42/69
Fig. 3.11: XRD pattern of a sample containing different phases.
3.4.
Industrial applications of XRD
Analysis of the XRD pattern provides information on the phases existing in a sample, and the
structural characteristics of these phases. In addition, quantitative analysis of the patterns can
give a fairly accurate assessment of the weight fractions of these phases. Traditionally, such
analysis was based on single peak analysis where the concentration of the phase is proportional
to the peak intensity (area or height). This method is not accurate enough in many cases, due to
the overlap of the peak of a given phase with other peaks. Fitting routines and structural
refinement computer codes, such as Rietveld refinement method, were built for more accurate
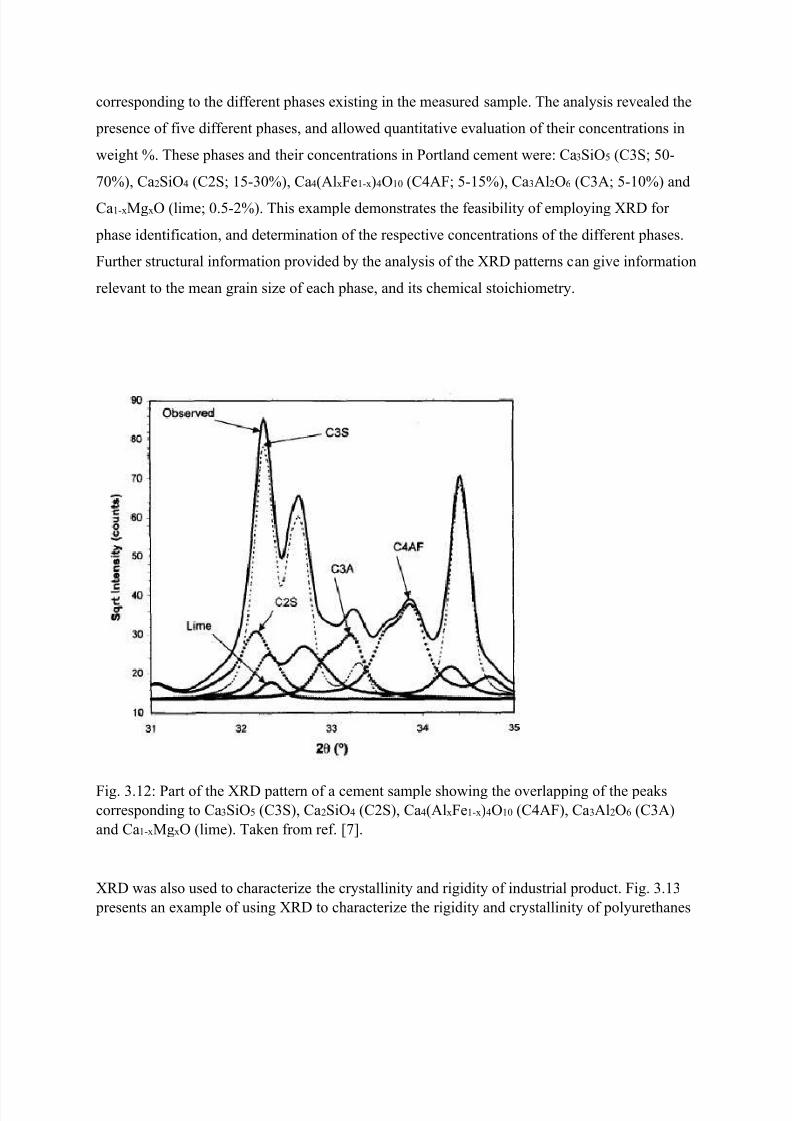
assessment of the material characteristics. Fig. 3.12 shows the diffraction peaks of Portland
cement in the angular range between 31° and 35° [7]. Rietveld analysis of the pattern is
performed by fitting the experimental pattern with the correct ratios of the patterns
7/18/2019 NDT Sami Mahmood
http://slidepdf.com/reader/full/ndt-sami-mahmood 43/69
corresponding to the different phases existing in the measured sample. The analysis revealed the
presence of five different phases, and allowed quantitative evaluation of their concentrations in
weight %. These phases and their concentrations in Portland cement were: Ca3SiO5 (C3S; 50-
70%), Ca2SiO4 (C2S; 15-30%), Ca4(AlxFe1-x)4O10 (C4AF; 5-15%), Ca3Al2O6 (C3A; 5-10%) and
Ca1-xMgxO (lime; 0.5-2%). This example demonstrates the feasibility of employing XRD for
phase identification, and determination of the respective concentrations of the different phases.
Further structural information provided by the analysis of the XRD patterns can give information
relevant to the mean grain size of each phase, and its chemical stoichiometry.
Fig. 3.12: Part of the XRD pattern of a cement sample showing the overlapping of the peakscorresponding to Ca3SiO5 (C3S), Ca2SiO4 (C2S), Ca4(AlxFe1-x)4O10 (C4AF), Ca3Al2O6 (C3A)and Ca1-xMgxO (lime). Taken from ref. [7].
XRD was also used to characterize the crystallinity and rigidity of industrial product. Fig. 3.13 presents an example of using XRD to characterize the rigidity and crystallinity of polyurethanes

7/18/2019 NDT Sami Mahmood
http://slidepdf.com/reader/full/ndt-sami-mahmood 44/69
(PU) as a function of experimental conditions adopted in preparing the PU products. The figureclearly shows the (006) reflection in the rigid PU, indicating relatively good crystallization,whereas this peak disappears completely in the soft PU sample, indicating poor crystallization[8].
Fig. 3.13: XRD patterns of rigid (a), semi rigid (b), and soft (c) Pus. Deconvolution of the peaksin the angular range of 5 – 40°. Taken from ref. [8]

7/18/2019 NDT Sami Mahmood
http://slidepdf.com/reader/full/ndt-sami-mahmood 45/69
XRD analysis was also used in sugar industry to analyze the ashes resulting from burning sugar
cane bagasse (the dry pulp remaining from sugar cane after juice extraction). These ashes are of
potential importance for the manufacture of cementing material. Fig. 3.14 shows XRD patterns
of three different samples of the bagasse ashes, where the different mineral phases were
identified [9].
Fig. 3.14: XRD patterns of bagasse ashes obtained in laboratory (LBA), Filter bagasse ashesobtained from combustion fumes (FBA), and bottom bagasse ashes (BBA).
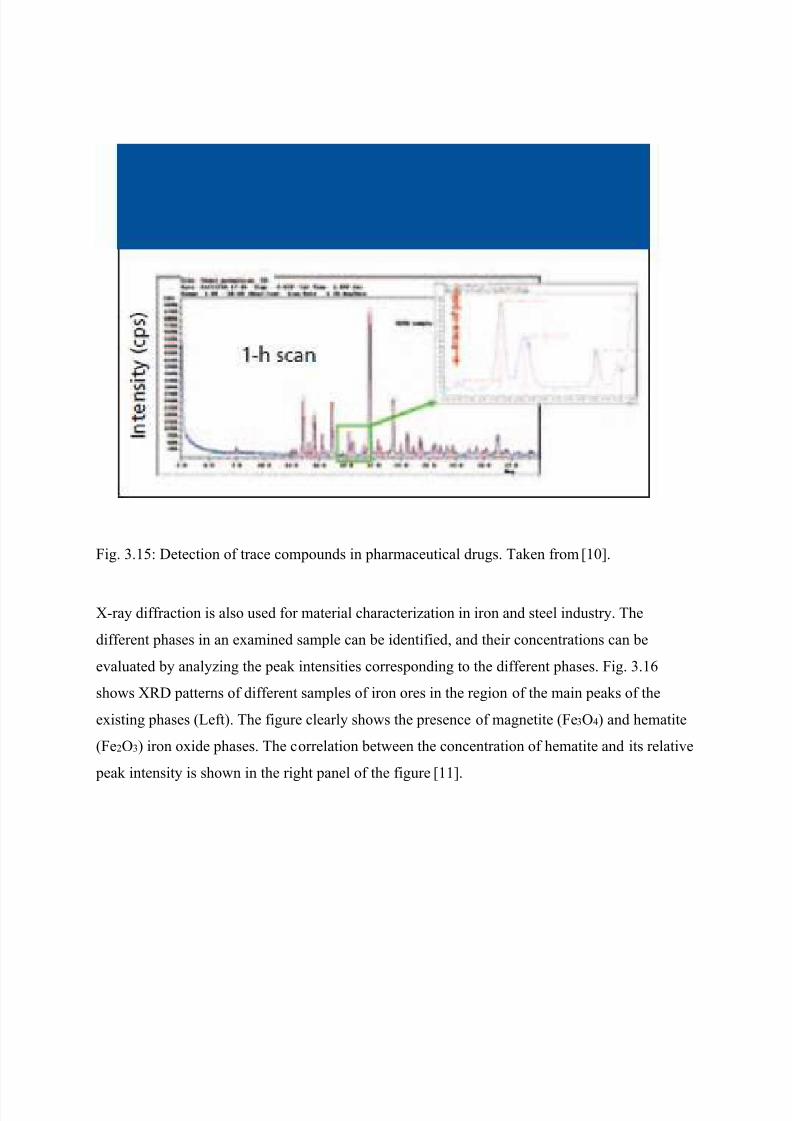
A further application, is the use of XRD as a characterization tool in pharmaceutical industry.
This technique is used for the identification and quantification of the different phases in drugs.
Fig. 3.15 demonstrates the power of XRD in analyzing trace compounds with very low
concentrations in drugs [10].
7/18/2019 NDT Sami Mahmood
http://slidepdf.com/reader/full/ndt-sami-mahmood 46/69
Fig. 3.15: Detection of trace compounds in pharmaceutical drugs. Taken from [10].
X-ray diffraction is also used for material characterization in iron and steel industry. The
different phases in an examined sample can be identified, and their concentrations can be
evaluated by analyzing the peak intensities corresponding to the different phases. Fig. 3.16
shows XRD patterns of different samples of iron ores in the region of the main peaks of the
existing phases (Left). The figure clearly shows the presence of magnetite (Fe3O4) and hematite
(Fe2O3) iron oxide phases. The correlation between the concentration of hematite and its relative
peak intensity is shown in the right panel of the figure [11].

7/18/2019 NDT Sami Mahmood
http://slidepdf.com/reader/full/ndt-sami-mahmood 47/69
Fig. 3.16: XRD patterns of iron ore samples (left), and the calibration curve showing the relation between the relative peak intensity and the concentration of hematite.
In mining industry, workers are exposed to health hazards due to the presence of crystalline silica
(alpha-quartz) in airborne dust, which causes silicosis, a debilitating lung disease. Accordingly,
necessary measures should be taken to prevent the exposure of workers to this hazard, which require
accurate quantitative analysis of the amount of crystalline silica in the airborne dust in mines. The
conventional method used in mining industry to determine the concentration of respirable silica-containing dust is through the use of a sampling pump with a size-selective sampler and filter media.
The dust particles in the sampled dust are smaller than ten micron. Dust samples are collected onto a
filter, and consequently sent to laboratory for measuring the concentration of crystalline silica in the
dust using XRD technique [12].
The above mentioned applications of XRD demonstrate the importance of XRD as a method for
materials characterization in different industries. A wide range of applications of this technique
in the industry is available in the literature.

7/18/2019 NDT Sami Mahmood
http://slidepdf.com/reader/full/ndt-sami-mahmood 48/69
Chapter 4
Elemental Analysis

7/18/2019 NDT Sami Mahmood
http://slidepdf.com/reader/full/ndt-sami-mahmood 49/69
4 1 Introduction
While XRD technique is used for the identification of minerals, and the determination of the
concentrations of these minerals in examined samples, x-ray fluorescence (XRF) spectroscopy is
used for elemental analysis of a sample. This involves the identification of the different elementsand their concentrations in the sample, without reference to the crystallographic (mineralogical)
phase in which the element exists. The principles of the two techniques are different. XRD is based
on the detection of the intensity of x-rays reflected from crystallographic planes, demonstrating
peaks at angles satisfying the conditions for constructive interference between these rays.
However, XRF is based on detecting the energy dependence of the intensity of radiation emitted
by a sample.
Radiation passing through material interacts with the constituents of the material through different processes, leading to observed changes in the transmitted or scattered radiation. These changes can
be used to deduce information about the properties of the material.
Electrons in atoms are arranged in electronic shells with principal quantum numbers n = 1, 2, 3, 4,
… (historically called K , L, M , N , … shells, Fig. 4.1). An incident beam of radiation interacts
with the atomic electrons in the material through different elastic and inelastic processes. These
processes lead to the attenuation of radiation as it passes through the material. The absorption of
radiation depends on the energy of radiation, the absorbing material, and the type of interactioninvolved. If the detected beam at a given direction with respect to the direction of incidence has
the same energy as the incident beam, then the scattering is elastic. Radiation with different energy
detected in some directions is evidence of inelastic processes (Fig. 4.2).
Fig. 4.1: Atomic electrons in shells

7/18/2019 NDT Sami Mahmood
http://slidepdf.com/reader/full/ndt-sami-mahmood 50/69
Fig. 4.2: Schematic diagram of the scattering processes
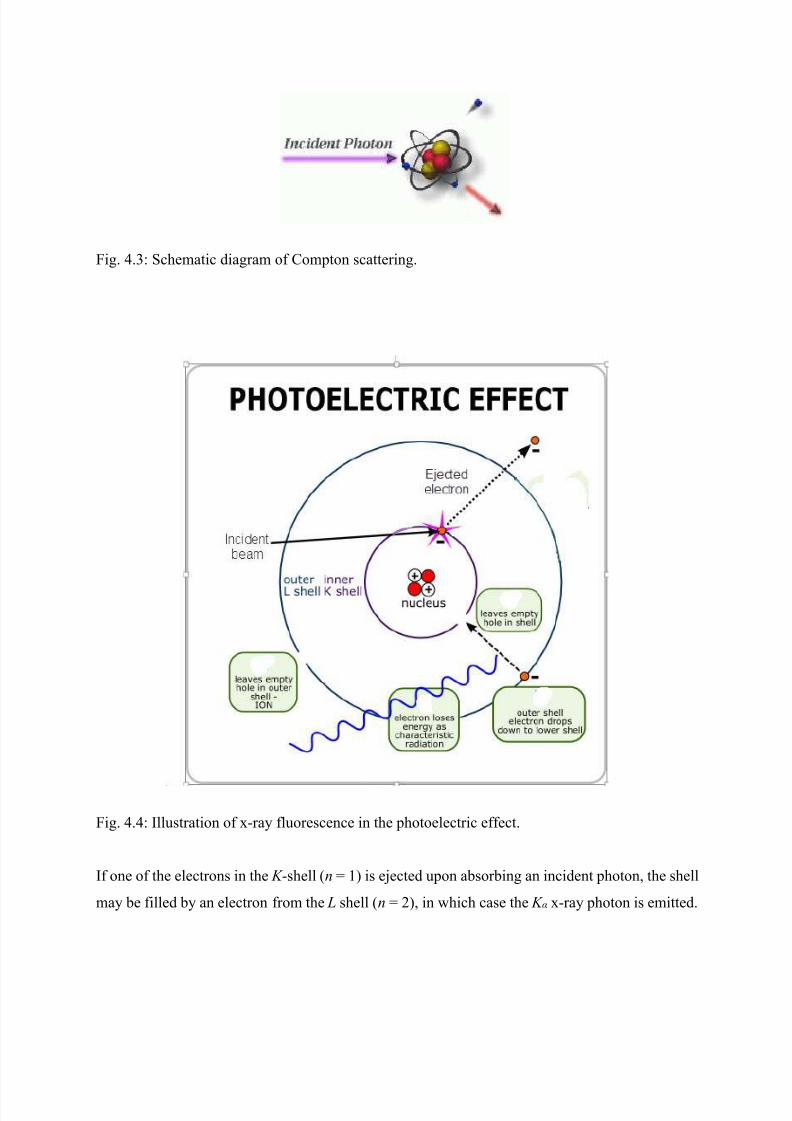
It is worth mentioning at this point that inelastic processes involve complete absorption of a photon
and emission of another photon with a different energy, such as in the case of Compton scattering
(Fig. 4.3). The scattered photon in Fig. 4.3 is red-shifted indicating that its energy is lower than
that of the incident photon. Also, an important type of interaction of radiation with matter is the
photoelectric effect (Fig. 4.4). In this process, an incident photon with energy above the binding
energy of an electron in a shell is absorbed by the electron, which is consequently knocked out of
its shell leaving a hole in that shell. The excited atom then relaxes to a lower energy state by an
electron transfer from a shell farther from the nucleus to fill the vacancy. The difference in electron
energy in this transition is released in the form of an x-ray photon (for elements with atomicnumber Z > 13). This phenomenon is used for the experimental design of x-ray fluorescence (XRF)
spectrometry.
Transmission,
E0
Incidentbeam, E0
Elastic
scattering, E0
Inelastic
scattering, E
7/18/2019 NDT Sami Mahmood
http://slidepdf.com/reader/full/ndt-sami-mahmood 51/69
Fig. 4.3: Schematic diagram of Compton scattering.
Fig. 4.4: Illustration of x-ray fluorescence in the photoelectric effect.
If one of the electrons in the K -shell (n = 1) is ejected upon absorbing an incident photon, the shell
may be filled by an electron from the L shell (n = 2), in which case the K α x-ray photon is emitted.

7/18/2019 NDT Sami Mahmood
http://slidepdf.com/reader/full/ndt-sami-mahmood 52/69
If the K shell is filled by an electron from the M shell (n = 3), it emits the K β photon (Fig. 4.1) and
so on. This is the series of K lines. Similarly, series of L-lines and M -lines are emitted if the hole
is in the L-shell or M -shell, respectively. Due to the selection rules for atomic transitions, and the
splitting of the electron orbits in a given shell, the K α line is normally split into K α1 and K α2 lines.
Fig. 4.5 shows the characteristic transitions in Cu. Notice that due to the small splitting of the p-
levels in the M shell, splitting of the K β emission line was not observed by this particular
experiment. The energy of the K α lines of Cu is slightly above 8 keV, and the average wavelength
for the two lines is 1.5418 Å as mentioned in the XRD section. The energy of the two K α lines is
separated by only about 20 eV, which requires a relatively high energy resolution to observe the
splitting of the two lines.
Fig. 4.5:
Illustration of the energy diagram and K α and K β emission lines from a Cu target.
7/18/2019 NDT Sami Mahmood
http://slidepdf.com/reader/full/ndt-sami-mahmood 53/69
X-ray fluorescence is a powerful tool for nondestructive elemental analysis in environmental,
industrial, pharmaceutical, forensic, and scientific research applications. It is used to identify
elements and determine their concentrations in the sample of interest. In an XRF experiment,
fluoresce can be induced by energetic electrons, ions, or photons, and X-rays emitted by the various
elements in the sample are measured and analyzed. Two types of XRF systems are available,
namely, wavelength dispersive (WDXRF) spectrometers, and energy dispersive (EDXRF)
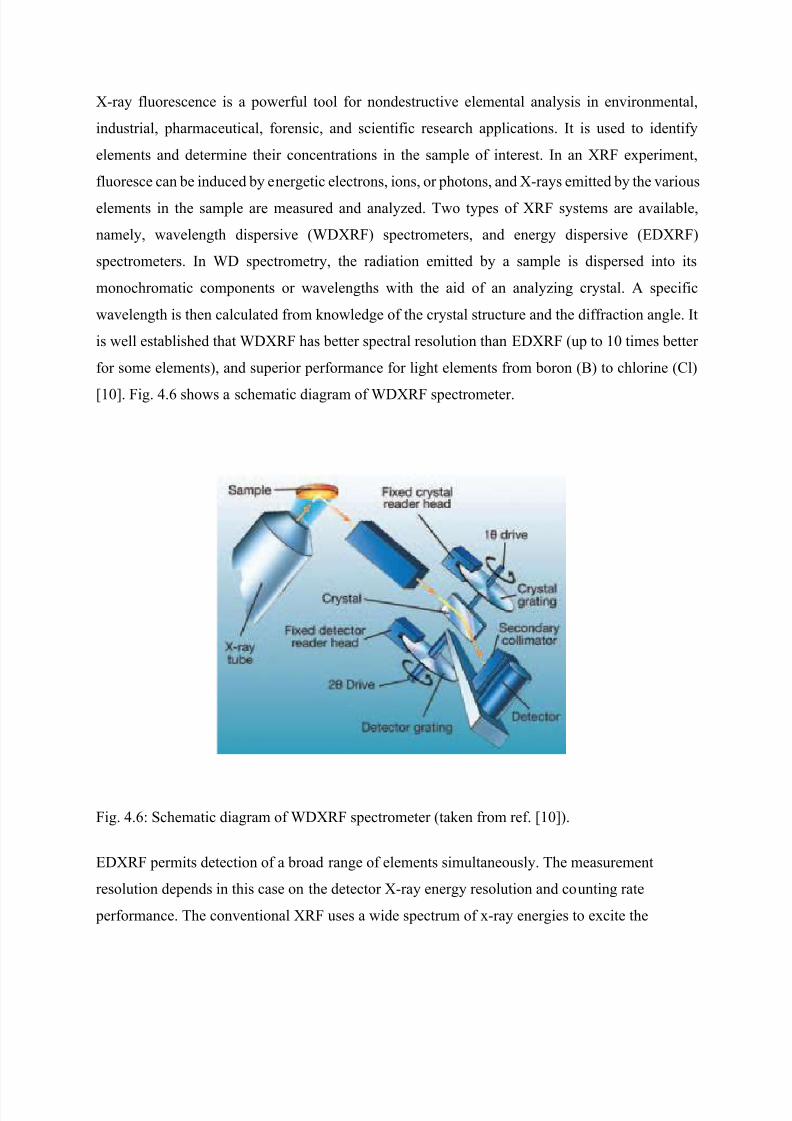
spectrometers. In WD spectrometry, the radiation emitted by a sample is dispersed into its
monochromatic components or wavelengths with the aid of an analyzing crystal. A specific
wavelength is then calculated from knowledge of the crystal structure and the diffraction angle. It
is well established that WDXRF has better spectral resolution than EDXRF (up to 10 times better
for some elements), and superior performance for light elements from boron (B) to chlorine (Cl)
[10]. Fig. 4.6 shows a schematic diagram of WDXRF spectrometer.
Fig. 4.6: Schematic diagram of WDXRF spectrometer (taken from ref. [10]).
EDXRF permits detection of a broad range of elements simultaneously. The measurement
resolution depends in this case on the detector X-ray energy resolution and counting rate
performance. The conventional XRF uses a wide spectrum of x-ray energies to excite the

7/18/2019 NDT Sami Mahmood
http://slidepdf.com/reader/full/ndt-sami-mahmood 54/69
elements in the sample. When an x-ray tube is used as a source of x-rays, the Bremsstrahlung
contribution in the spectrum scatters in the sample without producing atomic excitations, thus
resulting in an increase in the intensity of the background of the spectrum, and a poor resolution.
This can be avoided by selecting a narrow characteristic X-ray line from the source spectrum to
be used for exciting atomic transitions and x-ray fluorescent X-rays in the sample. This
procedure leads to a great loss in intensity of the primary beam. Although this technique is used
in commercial XRF systems, it has a disadvantage of requiring a very high primary X-ray source
intensity to compensate for the large decrease in the X-ray intensity on the sample. However, the
development of the monochromatic micro-focus XRF system greatly improved signal-to-noise
ratio and provided a powerful technique for the measurement of trace element concentrations and
distributions for a large variety of important medical, environmental, and industrial applications.
Fig. 4.7 demonstrates the improved quality of the spectrum by using a monochromatic micro-focus system [13].
Fig. 4.7: XRF spectra obtained by using polychromatic conventional spectrometry (red, upperspectrum) and monochromatic micro-focus system (black, lower spectrum).

7/18/2019 NDT Sami Mahmood
http://slidepdf.com/reader/full/ndt-sami-mahmood 55/69
To eliminate the Bremsstrahlung background and improve resolution, other techniques were
developed to carry out XRF measurements. These include the particle-induced x-ray emission
(PIXE) based on using an energetic ion beam to excite fluorescence in the sample of interest.
Also, intense monochromatic beams from large accelerator facilities, such as synchrotron light
sources, were used for this purpose. Another experimental setup for XRF uses naturally
radioactive radiation sources. Radiation from 241Am isotopic was used as a source of radiation
for elemental analysis on the famous Explorer Mars Lander and other planetary and lunar probes.
Even though XRF systems employing radioactive sources have been used for environmental,
industrial, and mineralogical applications, the need to keep the amount of radioactive material
low for safety considerations leads to a reduced sensitivity and the need for long measuring time
and sampling area. In addition, naturally radioactive sources get weaker with time, where the
source should be replaced to obtain reasonable measuring sensitivity. These considerationslimited the widespread use of XRF systems based on radioactive sources.
4.2. Moseley’s Law
The energy of the fluoresced x-ray depends on the quantum numbers of the shells involved in the
electronic transitions, and on the atomic number of the fluorescing element in accordance with
Mosely’s law:
= ( 1 1
) 4.1
where E R is Rydberg energy (13.6 eV), and s is a screening factor, which is theoretically 1 for the
K lines. If this empirical relation is applied to Cu K -lines, then the energy of K α line is:
=13.6× 28 × ( 11 1
2) =7997 eV 4.2
The acceptable value of about 8055 eV indicates that the effective screening factor is s = 0.9 rather
than 1.
4.3. XRF spectrometry
Since the transition energy is characteristic of an element where it depends on its atomic number,
different elements emit radiations with different energies. This fact can be utilized to identify the

7/18/2019 NDT Sami Mahmood
http://slidepdf.com/reader/full/ndt-sami-mahmood 56/69
different elements in a sample by means of XRF spectroscopy. In this technique, a sample is
irradiated by a beam of x-rays generated by an x-ray source, which could be an x-ray tube or a
synchrotron light source. The synchrotron light source generates an x-ray beam by the accelerated
electrons in a storage ring (Fig. 4.8). This source has a great advantage over the conventional x-
ray tubes since it provides a very intense beam, allowing the investigation and analysis of very
weak signals. The target in the x-ray tube, and the accelerating voltage and current are chosen to
provide the required intensity. In both cases, a wide spectrum of x-rays is generated, and the
required x-ray monochromatic beam is obtained by passing the beam through an x-ray optics
assembly (Fig. 4.9). This process leads to significant loss in the intensity of x-ray beam used for
analysis. The selected energy of the x-ray beam by the beam optics should be higher than the
transition energies of metals to be analyzed. This is necessary in order to have enough energy to
induce the excitations required for analysis.
Fig. 4.8: Diagram of a synchrotron light source illustrating the generation of x-rays by the
revolving electron beam in the storage ring (outer ring).

7/18/2019 NDT Sami Mahmood
http://slidepdf.com/reader/full/ndt-sami-mahmood 57/69
Fig. 4.9: Setup for XRF experiment with focused beam [14].
The x-rays emitted by the sample are collected by a multichannel analyzer over a number of
channels (512, 1024, 2048, etc.). In general, higher the number of channels provides better
resolution. A spectrum such as that shown in Fig. 4.10 is observed on the screen of the computer
connected to the equipment for analysis. The figure shows energy dispersive XRF spectrum of a
standard sample containing Mn, Fe, Ni and Cu. The energy scale is calibrated for an XRF
experiment by plotting the known energies of the K α and K β lines for the different elements in the
standard sample against the channel number as shown in Fig. 4.11. In this particular experiment,
the calibration constant was found to be about 14 eV/channel [15].
Fig. 4.10: XRF spectrum of a standard sample containing Mn, Fe, Ni, and Cu [15].

7/18/2019 NDT Sami Mahmood
http://slidepdf.com/reader/full/ndt-sami-mahmood 58/69
Fig. 4.11: Calibration curve for XRF experiment using K α lines of Mn, Fe, Ni, and Cu, and K β line of Cu [15].
According to Moseley’s law (Eq. 4.1):
= 0.75× × 0.75× × 4.3
= 0.89× × 0.89× × 4.4
A plot of the square root of the energy against the atomic number of known elements in a standard
sample should give a straight line from the slope of which the value of Rydberg energy is
evaluated. Further, the screening factor can be determined from the calculated Rydberg energy and
the intercept of the straight line with one of the axes. Fig. 4.12 shows a plot of the square root of
the energy of K α and K β lines of the XRF spectrum of a standard sample containing Ca, Ti, Cr, Fe,
Ni, Zn and Br, as a function of atomic number. [15]. The Rydberg constant from the slope of the
straight line corresponding to K α lines was found to be 13.90 ± 0.2 eV, while that determined from
the straight line corresponding to K β lines was 13.53 ± 0.1 eV. These values are in good agreement
with the acceptable value of 13.6 eV. Further, the screening factor determined from K α and K β
lines was found to be s = 1.23 ± 0.1 and 1.78 ± 0.1, respectively. These values are significantly
different from the theoretical value of 1, which could be due to the fact that the outer shells (n = 2

7/18/2019 NDT Sami Mahmood
http://slidepdf.com/reader/full/ndt-sami-mahmood 59/69
and 3) are screened more than the K shell, resulting in an effective screening parameter higher than
1.
Fig. 4.12: Plot of the square root of the energy of K α and K β lines of the XRF spectrum of thestandard sample containing Ca, Ti, Cr, Fe, Ni, Zn and Br, as a function of atomic number.
The plot in Fig. 4.12 can be used to identify unknown elements in the sample. For example, if a
K α line with energy of 4.0 keV was detected in the XRF spectrum, Fig. 4.12 indicates that this line
corresponds to Z = 21 for Sc metal.
4.4. Lambert – Beer law
The intensity of x-rays after being transmitted through a material is attenuated (reduced) due to
interactions leading to absorption of the radiation by the material. The absorption of radiation
Question: use a modified version of equation 4.1 to determine the energy of Cu- K α line bycrudely assuming the theoretical screening parameter of 1 for the shell with n = 1, and adoptthe screening parameter of 1.23 for the shell with n = 2. Verify that the result is very close tothe standard energy of Cu- K α.

7/18/2019 NDT Sami Mahmood
http://slidepdf.com/reader/full/ndt-sami-mahmood 60/69
depends on absorbing material with a characteristic absorption coefficient μ (E), as well as on its
thickness of the absorber which is commonly expressed in terms of the surface density σ (in g/cm2).
The relation between the transmitted intensity from the absorber and the absorber thickness
(surface density) is described by the well-known Lambert – Beer law:
= −. ⇒ (
) = . 4.5
where I 0 is the incident intensity and I the intensity transmitted from the absorber. The absorption
coefficient (measured in units of cm2/g) is energy dependent. In an experiment, the fluorescence
radiation from a multi-element standard sample was allowed to pass through a set of aluminum
foils with the desired thickness (Fig. 4.13), and the transmitted intensity of the different lines was
determined. The intensity is normally determined by the area under the spectral peak.
Fig. 4.13: (a) an overview of the XRF setup for the x-ray experiments. (b) A schematic diagram
for an absorption experiment with the detector placed at a 90◦ angle. A collimator was used in
order to control the beam size, while Al foils were used to attenuate the intensity of the x-ray beam.The white arrow on the case of the x-ray source (a) indicates the path of the x-ray beam.
Fig. 4.14 shows the variation of the relative intensity with absorber thickness for four specific K α
emission lines from a standard sample containing Fe, Ni, Zn and Br with characteristic K α energies
at 6.4, 7.5, 8.6 and 11.92 keV, respectively. The slope of the best straight line fit to the experimental
data was used to determine the absorption coefficient of Al at different energies. Fig. 4.15 shows
good agreement between the experimental and theoretical values of the absorption coefficient of

7/18/2019 NDT Sami Mahmood
http://slidepdf.com/reader/full/ndt-sami-mahmood 61/69
Al. The higher experimental values could be due to underestimation of the absorber thickness, or
the presence of impurities with higher absorption coefficients in the Al foils.
Figure 4.14: Plot of the relative absorption of four characteristic K α energies of the standardobtained with Al foils of various surface densities.
6 7 8 9 10 11 120
20
40
60
80
100
120
( c m
2 / g
)
E (keV)
experimental
Theoretical
Fig. 4.15: Experimental and theoretical absorption coefficient of Al as a function of energy.
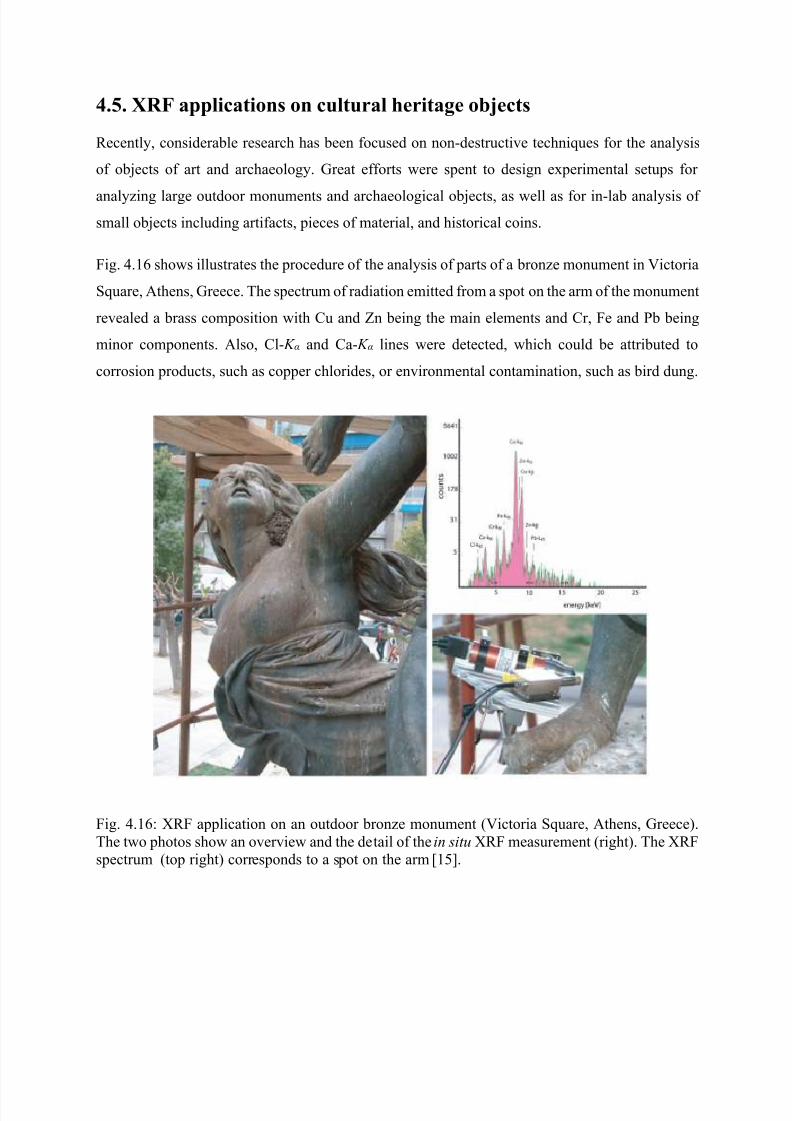
7/18/2019 NDT Sami Mahmood
http://slidepdf.com/reader/full/ndt-sami-mahmood 62/69
4.5. XRF applications on cultural heritage objects
Recently, considerable research has been focused on non-destructive techniques for the analysis
of objects of art and archaeology. Great efforts were spent to design experimental setups for
analyzing large outdoor monuments and archaeological objects, as well as for in-lab analysis ofsmall objects including artifacts, pieces of material, and historical coins.
Fig. 4.16 shows illustrates the procedure of the analysis of parts of a bronze monument in Victoria
Square, Athens, Greece. The spectrum of radiation emitted from a spot on the arm of the monument
revealed a brass composition with Cu and Zn being the main elements and Cr, Fe and Pb being
minor components. Also, Cl- K α and Ca- K α lines were detected, which could be attributed to
corrosion products, such as copper chlorides, or environmental contamination, such as bird dung.
Fig. 4.16: XRF application on an outdoor bronze monument (Victoria Square, Athens, Greece).The two photos show an overview and the detail of the in situ XRF measurement (right). The XRFspectrum (top right) corresponds to a spot on the arm [15].
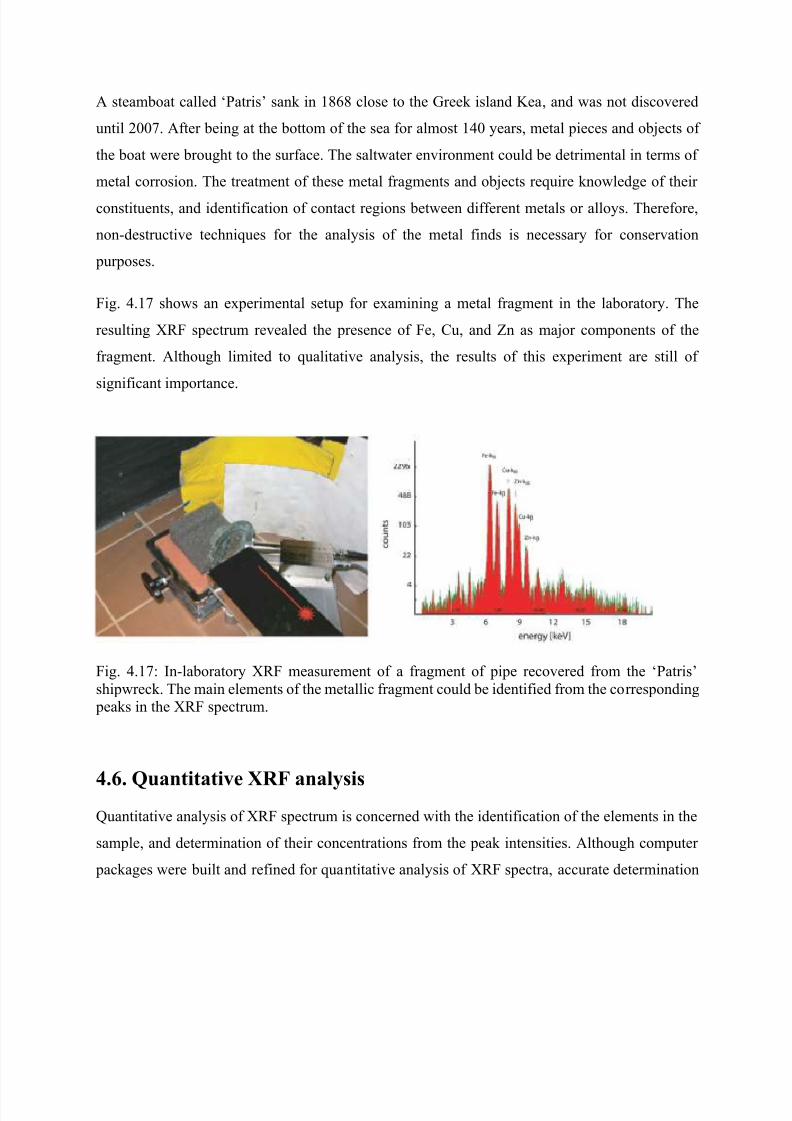
7/18/2019 NDT Sami Mahmood
http://slidepdf.com/reader/full/ndt-sami-mahmood 63/69
A steamboat called ‘Patris’ sank in 1868 close to the Greek island Kea , and was not discovered
until 2007. After being at the bottom of the sea for almost 140 years, metal pieces and objects of
the boat were brought to the surface. The saltwater environment could be detrimental in terms of
metal corrosion. The treatment of these metal fragments and objects require knowledge of their
constituents, and identification of contact regions between different metals or alloys. Therefore,
non-destructive techniques for the analysis of the metal finds is necessary for conservation
purposes.
Fig. 4.17 shows an experimental setup for examining a metal fragment in the laboratory. The
resulting XRF spectrum revealed the presence of Fe, Cu, and Zn as major components of the
fragment. Although limited to qualitative analysis, the results of this experiment are still of
significant importance.
Fig. 4.17: In-laboratory XRF measurement of a fragment of pipe recovered from the ‘Patris’shipwreck. The main elements of the metallic fragment could be identified from the corresponding peaks in the XRF spectrum.
4.6. Quantitative XRF analysisQuantitative analysis of XRF spectrum is concerned with the identification of the elements in the
sample, and determination of their concentrations from the peak intensities. Although computer
packages were built and refined for quantitative analysis of XRF spectra, accurate determination

7/18/2019 NDT Sami Mahmood
http://slidepdf.com/reader/full/ndt-sami-mahmood 64/69
of the concentrations of the different elements in a sample is not an easy task due to several factors
including, and not limited to:
1. Accurate determination of the peak intensity (area) requires accurate knowledge of the
functional form of the background signal which can be complicated. Also, low signal to
noise ratio, and overlapping of peaks corresponding to different elements makes it difficult
to determine a peak intensity with sufficient accuracy (Fig. 4.18).
2.
The relative detection efficiency of the different spectral lines of a multi-element sample
could be significantly different, and detailed knowledge of such effect is needed.
3. When comparing the concentrations of two elements in a sample, knowledge of their
relative excitation probabilities is required for quantitative analysis.
4. The intensity of a spectral line of an element (say element i) does not depend only on the
concentration of that element in the sample, but also on the concentration of the otherelements (say elements j). This is due to the fact that some of the radiation emitted by
element i can be absorbed by interactions with elements j, or the radiation by element i
could be enhanced by emission lines of elements j. Detailed knowledge of these
interactions and accurate determination of their contributions to the quantitative analysis
of the concentration of element i is certainly not straight forward.
5. Fluorescence of atoms takes place at positions located at different depths under the sample
surface. The radiation then travels inside the material of the sample, and leaves the surface
toward the detector. While traveling inside the material, the radiation encounters
interactions and attenuations which depend on the energy, as well as on the distance
traveled in matter. These considerations should also be addressed in the process of
quantitative analysis.

7/18/2019 NDT Sami Mahmood
http://slidepdf.com/reader/full/ndt-sami-mahmood 65/69
Fig. 4.18: XRF spectrum (black line) from a 16th-century painting fragment measured with agermanium detector. The fitted spectrum is shown in red, and the contributions of the differentelements are shown in different colors.
Based on knowledge of the contributions of all factors to the generation and attenuation of a given
radiation from an element, computer codes can in principle be written to determine the
concentration of that element in the sample.
The concentrations of the various elements in a sample can also be determined with the aid of
reference samples prepared for that purpose. The reference sample should contain known
concentrations of the elements in the unknown sample. The concentration of an element can then
be determined by comparing the relative intensity of its radiation in the sample and in the reference.
4.7. Industrial and Environmental Applications of XRF
XRF is a well-established technique for materials characterization relevant to product control in
industry. Its applicability in elemental analysis of both conducting and non-conducting solids, its
accuracy and excellent precision for the analysis of a wide range of elements in a wide range of
concentrations (from ppm to 100%) made XRF an important technique for the testing and
evaluation of materials required for process and quality control. The technique is used for

7/18/2019 NDT Sami Mahmood
http://slidepdf.com/reader/full/ndt-sami-mahmood 66/69
elemental analysis of raw materials (such as mineral ores), intermediate products (such as sintered
calcined products) and final products (such as cement, mining, pure metals and alloys) [11].
The presence of heavy metals in soil can affect the quality of food, groundwater, micro-organisms
activity, plant growth etc. Heavy metals in the environment are produced by mining, smelting,
steel and iron industry, chemical industry, traffic, agriculture as well as domestic activities [16].
Perhaps chemical and metallurgical industries are the most important sources of heavy metals in
soils. Assessment of the concentrations of heavy metals in environments surrounding industrial
plants is therefore essential for environmental protection purposes, and health reasons. Several
non-destructive techniques were designed for this purpose. For the elemental analysis related to
the environment, XRF has the advantage of being a fast and inexpensive, with a simple sample
preparation.Beneficial utilization of industrial or agricultural wastes is of great importance for economic
reasons (they can be used as raw materials in industry), as well as environmental pollution control.
Metal matrix composites (MMCs) are superior to unreinforced alloys in terms of stability, and
better elastic and mechanical properties. Accordingly, there has been an increasing interest in
composites containing low density and low cost reinforcements.
Coconut is considered an important agricultural product in tropical countries, which can be used
as a new source of bio-fuel. Coconut shell is an agricultural waste that is available in very large
quantities throughout the producing countries around the world, and was burnt as a means of solid
waste disposal. This process resulting in significant contribution to CO2 and methane emissions,
and the production of ash as a byproduct. In light of the dramatic increase in the cost of fuel oil
and natural gas, coconut shell became an important source of fuel. The economic and
environmental aspects of coconut shell solid waste had consequently driven significant interest in
the characterization of coconut ash, where XRF technique was used for elemental analysis.
XRF analysis of coconut shell ash revealed the presence of hard minerals such as SiO2, Al2O3,
MgO and Fe2O3 as major constituents of the ash. The presence of such hard phases suggested that
the potential use of coconut shell ash as particulate reinforcement in various metal composites
[17].

7/18/2019 NDT Sami Mahmood
http://slidepdf.com/reader/full/ndt-sami-mahmood 67/69
Zinc oxide (ZnO) is a material with great importance in medical and industrial applications.
Specifically, the oxide is widely used in industries including, and not limited to, ceramics, rubber
fabrics, catalysis, fire-resistant materials and paint industry. Usually Pb and S exist in ZnO material
as secondary elements, which have a negative effect on the performance of the material. XRF
elemental analysis is a useful technique for evaluating the qulity of ZnO, and determining the
amounts of Pb and S in the oxide prior to use in a specific industry [18].

7/18/2019 NDT Sami Mahmood
http://slidepdf.com/reader/full/ndt-sami-mahmood 68/69
Chapter 5
Principles and Applications of Ultrasound
Testing
7/18/2019 NDT Sami Mahmood
http://slidepdf.com/reader/full/ndt-sami-mahmood 69/69
[1] M. Willcox, G. Downes, A brief description of NDT techniques, Toronto: NDT Equipment Limited
(2003).
[2] C. Goidescu, H. Welemane, C. Garnier, M. Fazzini, R. Brault, E. Péronnet, S. Mistou, Damage
investigation in CFRP composites using full-field measurement techniques: combination of digital image
stereo-correlation, infrared thermography and X-ray tomography, Composites Part B: Engineering 48(2013) 95-105.
[3] W. Harara, Digital radiography in industry, in: 17 th World Conference on Non-Destructive Testing,
2008, pp. 25-28.
[4] P. Shearing, J. Gelb, J. Yi, W.-K. Lee, M. Drakopolous, N. Brandon, Analysis of triple phase contact in Ni –
YSZ microstructures using non-destructive X-ray tomography with synchrotron radiation,
Electrochemistry Communications 12 (8) (2010) 1021-1024.
[5] R.B. Bergmann, F.T. Bessler, W. Bauer, Non-Destructive Testing in the Automotive Supply Industry,
Research and Advance Engineering (2007).
[6] M. FINC, J. GRUM, NDT wire connection investigation in household appliances industry, Czech Society
for Nondestructive Testing, NDE for Safety/Defektoskopie, Plzen (2010).
[7] N.V. Scarlett, I.C. Madsen, C. Manias, D. Retallack, On-line X-ray diffraction for quantitative phaseanalysis: Application in the Portland cement industry, Powder Diffraction 16 (02) (2001) 71-80.
[8] G. Trovati, E.A. Sanches, S.C. Neto, Y.P. Mascarenhas, G.O. Chierice, Characterization of polyurethane
resins by FTIR, TGA, and XRD, Journal of Applied Polymer Science 115 (1) (2010) 263-268.
[9] M. Frías, E. Villar, H. Savastano, Brazilian sugar cane bagasse ashes from the cogeneration industry as
active pozzolans for cement manufacture, Cement and concrete composites 33 (4) (2011) 490-496.
[10] R. Yellepeddi, R. Thomas, New developments in wavelength-dispersive XRF and XRD for the analysis
of foodstuffs and pharmaceutical materials, SPECTROSCOPY-SPRINGFIELD THEN EUGENE THEN DULUTH-
21 (9) (2006) 36.
[11] D. Bonvin, R. Yellepeddi, A. Buman, Applications and perspectives of a new innovative XRF-XRD
Spectrometer in industrial process control, JCPDS—International Centre for Diffraction Data 2000,
Advances in X-ray Analysis 42 (2000) 126-136.
[12] C. Pretorius, The effect of size-selective samplers (cyclones) on XRD response, (2011).
[13] G. Walter M, H. Huapeng, High definition x-ray fluorescence: principles and techniques, X-Ray Optics
and Instrumentation 2008 (2008).
[14] C.J. Fahrni, Biological applications of X-ray fluorescence microscopy: exploring the subcellular
topography and speciation of transition metals, Current opinion in chemical biology 11 (2) (2007) 121-
127.
[15] I. Sianoudis, E. Drakaki, A. Hein, Educational x-ray experiments and XRF measurements with a
portable setup adapted for the characterization of cultural heritage objects, European Journal of Physics
31 (3) (2010) 419.
[16] A. Ene, A. Bosneaga, L. Georgescu, Determination of heavy metals in soils using XRF technique, Rom.
Journ. Phys 55 (7-8) (2010) 815.
[17] P. Madakson, D. Yawas, A. Apasi, Characterization of coconut shell ash for potential utilization inmetal matrix composites for automotive applications International journal of engineering science and