nderstanding echo chambers and filter bubbles the i …
TRANSCRIPT

RESEARCH ARTICLE
UNDERSTANDING ECHO CHAMBERS AND FILTER BUBBLES: THE IMPACT OF SOCIAL MEDIA ON DIVERSIFICATION AND
PARTISAN SHIFTS IN NEWS CONSUMPTION1
Brent Kitchens, Steven L. Johnson, and Peter GrayUniversity of Virginia McIntire School of Commerce,
P.O. Box 400173, Charlottesville, VA 22904 U.S.A.
{[email protected]} {[email protected]} {[email protected]}
Echo chambers and filter bubbles are potent metaphors that encapsulate widespread public fear that the useof social media may limit the information that users encounter or consume online. Specifically, the concernis that social media algorithms combined with tendencies to interact with like-minded others both limits users’exposure to diverse viewpoints and encourages the adoption of more extreme ideological positions. Yet empi-rical evidence about how social media shapes information consumption is inconclusive. We articulate howcharacteristics of platform algorithms and users’ online social networks may combine to shape user behavior. We bring greater conceptual clarity to this phenomenon by expanding beyond discussion of a binary presenceor absence of echo chambers and filter bubbles to a richer set of outcomes incorporating changes in bothdiversity and slant of users’ information sources. Using a data set with over four years of web browsinghistory for a representative panel of nearly 200,000 U.S. adults, we analyzed how individuals’ social mediausage was associated with changes in the information sources they chose to consume. We find differentiatedimpacts on news consumption by platform. Increased use of Facebook was associated with increased informa-tion source diversity and a shift toward more partisan sites in news consumption; increased use of Reddit withincreased diversity and a shift toward more moderate sites; and increased use of Twitter with little to nochange in either. Our results demonstrate the value of adopting a nuanced multidimensional view of howsocial media use may shape information consumption.
Keywords: Echo chamber, filter bubble, diversity, polarization, slant, news, personalization
Introduction1
Echo chambers and filter bubbles are potent metaphors thatencapsulate widespread public fear that the use of socialmedia may limit the information that users encounter or con-sume online, thus failing to promote a shared experience offree-flowing information. Specifically, the concern is thatsocial media algorithms combine with tendencies to interactwith like-minded others to create an environment that pre-dominantly exposes users to congenial, opinion-reinforcing
content to the exclusion of more diverse, opinion-challengingcontent. This intuitive understanding of echo chambers andfilter bubbles is well-accepted. Yet empirical evidence abouthow social media and other digital platforms shape informa-tion consumption is inconclusive. Despite decades of interestin this phenomenon, researchers’ ability to analyze the preva-lence or formation of echo chambers and filter bubbles isstymied by a lack of consensus regarding their conceptuali-zation and measurement.
There is growing concern that social media and other infor-mation discovery platforms promote information-limitingenvironments by shielding users from opinion-challenginginformation, thereby encouraging users to adopt more extreme
1Shaila Miranda was the accepting senior editor for this paper. Ofir Turelserved as the associate editor.
DOI: 10.25300/MISQ/2020/16371 MIS Quarterly Vol. 44 No. 4 pp. 1619-1649/December 2020 1619

Kitchens et al./Echo Chambers and Filter Bubbles
ideological positions. Indeed, there are aspects of popularsocial media platforms that may foster information-limitingenvironments. For instance, as with offline relationships,people in online social networks interact most frequently withlike-minded others. In a study of 10.1 million U.S. Facebookusers with self-reported ideological affiliation, Bakshy et al.(2015) found that more than 80% of these Facebook friend-ships shared the same party affiliation. Accordingly, the newsand information sources that individuals discover throughtheir social relationships may also reflect a lack of ideologicaldiversity. Further, even within this already constrained choiceset, selective exposure theory predicts that individuals preferto consume opinion-reinforcing news sources over opinion-challenging ones (Frey 1986). Garrett (2009) found supportfor this tendency in a field experiment with 727 online newsreaders: individuals expressed interest in reading online newsstories they perceived to be supportive of their existingopinion and expressed disinterest in consuming opinion-challenging stories. Finally, researchers have long expressedconcern about the potential for algorithmic filtering to reducethe diversity of information sources that individuals areexposed to, engage with, or consume (Van Alstyne and Bryn-jolfsson 1996, 2005). Personalization technology is sensitiveto personal preferences; once a user engages with opinion-reinforcing content, algorithmic filtering may constrain furtherexposure to a narrower, more closely aligned range of content(Pariser 2011; Stroud 2010). This, in turn, may foster theadoption of more extreme opinions (Festinger 1964; Hart etal. 2009).
Thus, there is a clear potential for the use of social media tobe associated with a narrowing of information diversity and apartisan shift in the slant of news consumed by their users. For example, Lawrence et al. (2010) found readers of politicalblogs to be more ideologically segregated and more ideologi-cally extreme than nonreaders. Likewise, Wojcieszak andMutz (2009) found that participants in online politics-relatedgroups were less likely to be exposed to political informationthey disagree with (and more likely to be exposed to infor-mation they agree with) than participants in many othercategories of online groups (e.g., hobby or leisure related). Nonetheless, the prevalence and magnitude of information-limiting environments may be overstated. Other studies haveshown social media platforms to be information-expanding.Social media helps users discover new information sources,thereby potentially expanding the diversity of viewpoints,opinions, and information to which users are exposed. Forexample, Flaxman et al. (2016) “uncover evidence for bothsides of the debate, while also finding that the magnitude ofthe effects [are] relatively modest” (p. 298). Gentzkow andShapiro (2011) performed a large-scale analysis of webbrowsing habits of U.S. adults, concluding that “ideologicalsegregation on the Internet is low in absolute terms” and that
the Internet exposes individuals to a broader range of view-points than “face-to-face interactions with neighbors, co-workers, or family members” (p. 1799). In summary, despitea great deal of interest in the idea of echo chambers and filterbubbles, empirical evidence to date is inconclusive as towhether social media is information-limiting or information-expanding.
We identify six key reasons contributing to why researchershave reached conflicting conclusions about the existence ofecho chambers and filter bubbles, as well as the processes thatmay lead to their formation. First, a fundamental issue in thisbody of research is the lack of conceptual clarity, with vagueand conflicting definitions of constructs, processes, andoutcomes. Second, imprecise conceptualization has onlycompounded issues of inconsistent measurement andincommensurate research designs in prior studies, precludingthe systematic integration of findings. Most importantly, avariety of online platforms have been studied either indepen-dently or lumped together in aggregate, making it difficult toascertain the relationship between social factors, technologyfeatures, and information-limiting environments. Third, empi-rical results are also difficult to compare when they measuredisparate, nonequivalent outcomes, often measuring contentexposure, sharing, or generation, while consumption may bemore directly salient to the concerns surrounding information-limiting environments. Fourth, as Shore et al. (2018) note,one “likely reason for the conflicted nature of the literature isthat earlier work has generally focused too narrowly onunrepresentative or incomplete data sets,” such as “focusingon highly active users” (p. 850). Fifth, inferring the impact ofindividuals’ technology use from analysis of population-leveldistributions may suffer from either an ecological fallacy or anaggregation bias (Freedman 1999). Finally, social media plat-forms frequently adjust their algorithmic filters and rarelydisclose when those changes occur. The dynamic nature ofthe phenomenon combined with a lack of transparency byplatform providers may limit the generalizability of empiricalresults over time.
To further understand this much-debated phenomenon, wepropose the concept of information-limiting environments asencapsulating the primary concerns regarding echo chambersand filter bubbles—namely, that social network homophilyand algorithmic filtering constrain the information sourcesthat individuals choose to consume, shielding them fromopinion-challenging information and encouraging them toadopt more extreme viewpoints. By identifying diversity andpartisan slant as distinct characteristics of information con-sumption, we articulate how social media can shape informa-tion consumption in ways that move beyond the simplepresence or absence of echo chambers and filter bubbles. Weuse broadly representative data to investigate how three
1620 MIS Quarterly Vol. 44 No. 4/December 2020
Kitchens et al./Echo Chambers and Filter Bubbles
popular social media platforms vary in their impact on contentconsumption by individual users, and thereby may or may notcontribute to underlying outcomes associated withinformation-limiting environments. Through an analysis ofover four years of web browsing history for a representativepanel of nearly 200,000 U.S. adults, we demonstrate differ-entiated impacts by platform and discuss these differences interms of the variation in platform features at the time. Increased use of Facebook was associated with increasedinformation source diversity and a partisan shift in news sitevisits. Increased use of Reddit was also associated withincreased diversity, but a moderating shift. Increased use ofTwitter had little to no association with changes in eitherdiversity or slant. Our results demonstrate the value ofadopting a more nuanced and multidimensional conceptua-lization of how social media shapes information consumption.
Understanding Echo Chambersand Filter Bubbles
Given the extensive range of approaches to conceptualizing,measuring, and identifying echo chambers and filter bubbles,they can be difficult to apply as precisely definable constructsfor academic research. To better understand these two terms,it is useful to consider the genesis of each. The concerns arti-culated by Cass Sunstein, a primary voice warning of echochambers (Sunstein 2001, 2017), originate from earlierfindings that group polarization—the individual and collectiveadoption of more extreme views—occurs in intensive deliber-ations by small groups of homogenous individuals on topicsof high relevance and concern (Sunstein 2002). He noted that“widespread error and social fragmentation are likely to resultwhen like-minded people, insulated from others, move inextreme directions simply because of limited argument poolsand parochial influences” (Sunstein 2002, p. 186). Extrapo-lating from findings regarding small group dynamics, Sunstein(2001) predicted that algorithmic filtering would also lead togroup polarization on a larger scale. Likewise, Eli Pariser’sinfluential book The Filter Bubble (2011) predicted thatindividualized personalization by algorithmic filtering wouldlead to intellectual isolation and social fragmentation. Histhesis is succinctly captured in the book’s subtitle: What theInternet Is Hiding from You. Both authors drew caution froma scenario that Negroponte (1996) positively presented as the“daily me”: information carefully selected to match individ-ual preferences. But in contrast to Negroponte, both Sunsteinand Pariser made equally dire predictions that the use ofinformation discovery platforms would lead to information-limiting environments with negative individual and societalimpacts.
Although both Sunstein and Pariser were concerned thatsocial media and other information discovery platforms wouldshape what information individuals choose to consume—and,ultimately, an individual’s viewpoints and opinions—theydiffered on how this might happen. Pariser identified person-alization technology as the primary mechanism, voicingconcern that it strengthens individual preferences for seekingout opinion-reinforcing information to the exclusion ofopinion-challenging information (Frey 1986; Garrett 2009). Pariser stressed the negative impacts of individual isolation increating epistemic bubbles where personal viewpoints persist,unchallenged and untested. Sunstein stressed the potential oftechnology to reinforce fragmentation at a larger scale, onewhere people are not individually isolated, but instead formgroups in which individuals with similar ideological predilec-tions interact exclusively with each other. Sunstein arguedthat online interactions can reinforce ideological segregationand thereby facilitate limited information pools that strengthenpreexisting biases, promote groupthink, and encourage adop-tion of even more extreme viewpoints. In this way, Sunsteinwas concerned with interactions among homogenous groupsthat share a common social identity. Alternatively, Pariserwas concerned with individual isolation and a lack of sharedinformation in opinion formation. From Pariser’s perspective,an individual isolated in their own personalized informationbubble still may suffer from the negative impacts of limitedinformation, even if this isolation makes them immune fromthe social pressures that reinforce group solidarity andengender polarizing groupthink. Despite these differences inperspectives, both Pariser and Sunstein argued that theremedy for information-limiting environments is individualconsumption of ideologically diverse content that encom-passes opinion-challenging viewpoints.
These conceptualizations of echo chambers and filter bubblesare reactionary, in that they portray not the creation of anobservable outcome, but rather the absence of an idealizedone. This ideal is not well defined, however, other than thegeneral normative assertion that individuals should beexposed to and consume opinion-challenging information. The quantity of opinion-challenging information that anindividual should consume and the degree to which it shouldchallenge their opinions is left ambiguous, rendering it all butimpossible to determine if someone is actually within an echochamber or filter bubble. Further, it is doubtful whether thisideal of a well-informed public with rigorously examinedopinions has ever existed. For example, before the creationof Internet-enabled personalization technology, news andinformation was disseminated largely via newspapers, maga-zines, radio, and TV broadcasts that catered to ideologicallydiverse audiences. Even then, “a number of studies …indicate[d] that persuasive mass communication functions farmore frequently as an agent of reinforcement than as an agent
MIS Quarterly Vol. 44 No. 4/December 2020 1621

Kitchens et al./Echo Chambers and Filter Bubbles
of change” (Klapper 1960, p. 15). With commonly vague andreactionary conceptualizations, echo chambers and filterbubbles are certainly powerful metaphors, but are ill-definedfor use as rigorous academic constructs.
Echo chambers and filter bubbles are also often depicted assomething that an individual (or group) either is in, or is not—a simplistic binary that is unnecessarily reductionist. Focusing solely on whether or not individuals consumeopinion-challenging information sources neglects morenuanced ways in which technology use may shape the con-sumption of information sources. For example, even thoughother impacts are quite plausible, Bakshy et al. (2015)considered only the consumption of ideologically discordantcontent (e.g., a liberal consuming conservative news or viceversa) in concluding that algorithmic ranking has limitedimpact on news consumption.
Furthermore, this emphasis on consumption of opinion-challenging and ideologically discordant information may bemisplaced. Groupthink, extreme viewpoints, and intellectualisolation can persist even when opinion-challenging informa-tion is readily available. Individuals and groups frequentlyadopt extreme opinions despite being confronted with chal-lenges to their viewpoints. For example, studies have foundthat exposure to divergent viewpoints may fail to have amoderating effect and can even catalyze a polarizing backlashthat hardens existing ideological positions (Bail et al. 2018;Stroud 2010). Further, some individuals—particularly highlypolitically-engaged ones—may purposely seek out ideolo-gically discordant information sources to gain awareness ofopposing viewpoints while remaining highly antagonistic tothem (Shore et al. 2018), a condition referred to as affectivepolarization (see Iyengar et al. 2019).
In summary, discourse regarding echo chambers and filterbubbles has often been both reactionary and reductionist. Consumption of ideologically discordant content that includesopinion-challenging viewpoints is neither a necessary nor asufficient remedy for the fundamental ills associated withecho chambers and filter bubbles. Thus, we conclude thatalthough Sunstein and Pariser identified key mechanisms thatmay contribute to information-limiting environments, a richerconceptualization of potential outcomes is needed to under-stand how social media platforms can impact the content thatusers choose to consume.
Constituent Characteristics of EchoChambers and Filter Bubbles
Although there is no consensus definition for echo chambersor filter bubbles, in considering the range of descriptions we
identify two constituent characteristics that stand out. Thefirst is a lack of information diversity due to restriction ofinformation sources. In echo chambers, “individuals areexposed only to information from like-minded individuals”(Bakshy et al. 2015, p. 1130), that “confirms their previously-held opinions” (Shore et al. 2018, p. 850), and “is devoid ofother viewpoints” (Garrett 2009, p. 279). Filter bubbles area “unique universe of information for each of us” (Pariser2011, p. 9), “devoid of attitude-challenging content” (Bakshyet al. 2015, p. 1130), where “individuals only see posts thatthey agree with” (Lazer 2015, p. 1090). Reduced informationdiversity exaggerates confirmation bias—the individual andcollective tendency to seek out information that supportspreexisting beliefs (Nickerson 1998). It also facilitates ideo-logical groupthink—a collective manifestation of closed-mindedness and an overestimation of the value of collectivebeliefs that are reinforced by pressure towards uniformity(Janis 1982). Narrowing of information sources is prob-lematic, as “exposure to differing political views increasespeople’s knowledge of rationales for political perspectivesother than their own and also fosters political tolerance”(Mutz and Martin 2001, p. 140).
Second, both echo chambers and filter bubbles are commonlycharacterized by ideological segregation (the tendency ofindividuals to associate with others who share their view-points) and by partisan polarization (the adoption of moreextreme views). Echo chambers are associated with “frag-mentation of users into ideologically narrow groups” (Shoreet al. 2018, p. 850), with “political fragmentation and socialpolarization” (Garrett 2009, p. 278), and with “segregation byinterest or opinion [that] will … increase political polari-zation” (Dubois and Blank 2018, pp. 1-2) and “foster socialextremism” (Barberá 2015, p. 86). Similarly, filter bubblesare a “centrifugal force pulling us apart” (Pariser 2011, p. 10),“in which algorithms inadvertently amplify ideological segre-gation” (Flaxman et al. 2016, p. 299). In this way, theincreasing ability to interact online is viewed not as a unifyingforce but, rather, one that may tear apart the fabric of societyas individuals adopt more extreme views.
In summary, we argue that while echo chambers and filterbubbles are potent, flexible metaphors that have broadlycaptured the public’s imagination and serve as a distillation ofwidespread fears, their vague and disparate conceptualizationsmake them difficult to study. To make these attractive meta-phors concrete, we propose that research into information-limiting environments requires a more nuanced focus on theseparate characteristics of information source diversity andinformation source slant. Information source diversityreflects separation, variety, and disparity among informationsources an individual consumes (see Harrison and Klein2007). A change in the consumption of information sources
1622 MIS Quarterly Vol. 44 No. 4/December 2020

Kitchens et al./Echo Chambers and Filter Bubbles
may lead to a broadening increase or a narrowing decrease ininformation source diversity. Information source slantreflects the dominant ideological perspective provided byinformation sources an individual consumes. A change inconsumption of information sources may lead to a partisanshift towards more extreme information sources or a moder-ating shift toward more centrist ones. Our objective is toexamine how social media use may be associated withchanges in the diversity and slant of the information sourcesan individual chooses to consume.
Categorizing Changes inInformation Consumption
Information Source Diversity
Information source diversity is an area of interest across aca-demic disciplines, including management, communications,and political science. Receiving information from diversesources can help individuals better understand the worldaround them, develop more robust opinions, and make betterdecisions (Jehn et al. 1999; Mutz and Martin 2001; VanAlstyne and Brynjolfsson 1996). Information source diversitycaptures the idea that the value of information sources derivesfrom providing nonredundant information and alternativeviewpoints. There are many ways to conceptualize and mea-sure diversity (see Harrison and Klein 2007; Page 2010). Most approaches involve summarizing how elements ofinterest, such as unique information sources, are allocatedalong a continuum or across a set of categories (McDonaldand Dimmick 2003). We identify constructs related to thediversity of information sources an individual chooses to con-sume, following Harrison and Klein’s (2007) dimensions ofseparation, variety, and disparity. Together, these constructsprovide a holistic view of information source diversity (seeTable 1 for a summary). We also consider a precursor tothese measures: information source quantity (the number ofunique information sources an individual consumes). Al-though this construct does not reflect how information sourcesmay vary in the kinds of information they provide, as thequantity of information sources increases, so does the poten-tial for nonredundant information.
Separation describes the degree of diversity along a singlelateral dimension (Harrison and Klein 2007)—such as thedimension of political ideology. Differentiation by ideolo-gical slant is particularly evident in the contemporary U.S.media landscape (Jurkowitz et al. 2020) where there isincreasing separation of information sources by dominantideological perspective (Flaxman et al. 2016). This speciali-zation allows reliable categorization of information sourcesbased on the predominant viewpoint of typical content
(Gentzkow and Shapiro 2011; Shore et al. 2018). Informationsource dispersion reflects ideological separation among a setof information sources an individual chooses to consume(Shore et al. 2018). When an individual consumes informa-tion sources from a narrow ideological range, they are lesslikely to be exposed to a diversity of viewpoints and opinionsthan when they read sites encompassing a broader range.
However, dominant ideological perspectives may be insuf-ficient for understanding differences among informationsources. For example, some news and information sources arenot overtly ideological, and even among those with similarideological slant, there are other bases for differentiation. Drawing on the concept of interorganizational competitionand niche overlap theory (Burt 1992; Sohn 2001), we con-ceptualize information source variety as reflecting how likelya set of information sources is to provide nonredundantinformation along an assortment of dimensions. Similar to theidea of brokerage across structural holes in a communicationnetwork (Burt 1992), when an individual consumes multipleinformation sources with minimally overlapping audiences,they are likely to be exposed to more nonredundant infor-mation and divergent viewpoints than if they consumedmultiple information sources with substantial audience over-lap. Thus, increased information source variety reflects theconsumption of a broader range of knowledge, expertise, andunique information.
Finally, disparity complements separation and variety as anadditional form of diversity. Disparity is frequently used toassess income inequality, but may also be applied to the distri-bution of attention (e.g., Li et al. 2019). In consideringconsumption of multiple information sources, an increasingdisparity of the time spent per source reflects a concentrationof attention that effectively reduces diversity. For example,if an individual regularly visits five information sources butspends the preponderance of their time with only two of them,they are less likely to consume nonredundant information thanwhen they give all five equal attention. Thus, informationsource parity reflects equality of attention given to differentinformation sources.
Information Source Slant
In addition to considering changes in information sourcediversity, we focus on the complementary, yet distinct, con-cept of changes in information source slant—where slantrepresents the dominant ideological perspective of the infor-mation sources an individual consumes. This concept relatesto the conclusion that interaction among like-mindedindividuals can lead to more extreme (less centrist) opinions(Sunstein 2009). Such individual-level change is a form of
MIS Quarterly Vol. 44 No. 4/December 2020 1623

Kitchens et al./Echo Chambers and Filter Bubbles
Table 1. Dimensions of Information Consumption
Dimension Construct Description Categorization
Diversity
Information sourcequantity
Quantity of unique information sourcesconsumed
None
Information sourcedispersion
Separation of information sources along asingle ideological dimension
Slant (continuous)
Information sourcevariety
Variety of information among informationsources
Information source audienceoverlaps (continuous)
Information source parityEquality of time spent consuminginformation sources
Time (continuous)
Slant Information source slantDominant ideological perspective amonginformation sources
Slant (continuous)
Diversityand slant
Cross-cutting contentconsumption
Proportion of information sources withopposing viewpoints
Slant (discrete categories)
polarization that reflects a process of shifting or strengthening“one’s original position” (Stroud 2010, p. 557) “further in thedirection of … original views” (Mutz 2006, p. 227). Yet, apartisan shift is but one possibility; the slant of news sourcesconsumed could also shift in a centrist direction. We definea shift in slant in terms of differences in an individual’sconsumption choices between points in time. In comparingthe information sources consumed at various times, a changein the dominant ideological position towards a more centristperspective represents a moderating shift and a changetowards the extreme represents a partisan shift.
The concept of polarization (and its less frequently articulatedconverse, moderation) is multifaceted. We identify threealternative conceptualizations of polarization that encompassantecedents or consequences of individual information sourceconsumption. First, social polarization is reflected in par-ticular patterns of interactions and affiliations. For example,the preference of individuals to maintain social relationshipswith like-minded others manifests as modularity in socialnetworks (Baldassarri and Bearman 2007). This homophiloustendency, which has been observed in Facebook friendships(Bakshy et al. 2015) and in interactions among Twitter users(Bright 2018), may impact individuals’ consumptionbehaviors. Second, attitudinal polarization represents seg-mentation of beliefs and attitudes (Baldassarri and Bearman2007; Boxell et al. 2017). For example, individuals are moretrusting of and more likely to consume information sourcesthat align with their ideological views (Adamic and Glance2005; Jurkowitz et al. 2020). At the group or populationlevel, this may be observed as audience fragmentation ininformation sources that individuals engage with and consume(Jacobson et al. 2016; Lawrence et al. 2010). Third, affectivepolarization is a phenomenon of animosity betweenindividuals in opposing political parties that stems from parti-sanship as a social identity (Iyengar et al. 2019). Individuals
with high affective polarization may frequently engage withor consume opinion-challenging content, but remain un-changed in or even strengthen their views as a result. This isconsistent with users who “read at least some informationfrom both sides of the political spectrum, but only tweet outinformation consistent with their own side” (Shore et al. 2018,p. 852).
In summary, polarization is an individual-, group-, andpopulation-level phenomenon encompassing static states anddynamic processes (Mutz 2006). In the discussion of echochambers and filter bubbles, polarization is a frequently raisedtheme, yet often without precise conceptualization or distinc-tion among its many forms. Social, attitudinal, and affectivepolarization are all potential antecedents or consequences ofthe content a user is exposed to, engages with, and consumes. To better understand how social media platforms may influ-ence information consumption, we focus on the individual-level behavioral outcome of partisan or moderating shifts inslant of information a user consumes across periods of variedplatform use.
Cross-Cutting Content Consumption
Cross-cutting content consumption measures the extent towhich an individual consumes information sources thatprovide ideologically discordant information (Bakshy et al.2015). Assuming that an individual’s attitudes and behaviorsare grounded in and reflect a dominant ideological viewpoint,an information source is considered cross-cutting when thereis sufficient ideological difference between the slant of theinformation source and the individual’s dominant viewpoint(Lawrence et al. 2010). When cross-cutting consumption ishigh, an individual is regularly consuming informationsources that are opinion-challenging. A low amount of cross-
1624 MIS Quarterly Vol. 44 No. 4/December 2020

Kitchens et al./Echo Chambers and Filter Bubbles
Change inInformation
SourceDiversity
Change in Information Source Slant
Moderating Shift
H2B: more centrist No Change
Partisan Shift
H2A: more extreme
Narrowing
H1A: less
diverse
No change
Broadening
H2B: more
diverse
In each scenario, the gray bubble represents the original mean slant (left-right position) and diversity (size) of news consumed by an example
user. This user’s original consumption is liberal, as it is left of the center as denoted by the vertical hash along the axis. The white bubble
represents the changed consumption of the end user under a treatment condition (e.g., in a period of higher social media use).
Figure 1. Categorizing Changes in Information Consumption
cutting consumption is consistent with being in aninformation-limiting environment. However, a focus oncross-cutting content can distract researchers from under-standing more modest shifts in consumption, such as a highlyconservative user reading more moderately conservativenews.
Decreasing consumption of cross-cutting information sourcesresults in both narrowed information diversity and a partisanshift. Alternatively, increasing cross-cutting content con-sumption concurrently results in both a broadening of infor-mation diversity as well as a moderating shift in informationsource slant. Because the cross-cutting consumption constructconflates both diversity and slant of information sources, weargue that it is a poor measure of either and that it fails tocapture the nuance provided by their separate measurement.
Categorizing Information Source Consumption
Considering changes in the diversity and slant of informationsources as two separate dimensions provides a richer cate-
gorization of the potential impacts of social media platformson information source consumption. As depicted in Figure 1,three possible changes in information source diversity(narrowing, no change, broadening) can combine with threepossible changes in information source slant (moderatingshift, no change, partisan shift) for nine potential scenarios(see Figure 1).
Explicitly considering changes in both dimensions is essentialfor moving beyond a simplistic conclusion that information-limiting environments either do or do not exist and leads to amore nuanced understanding of how social media use couldbe associated with a wide range of outcomes. Of the scen-arios shown in Figure 1, any of those involving a narrowingdecrease in information source diversity (the top row), as wellas those involving a partisan shift (the right-hand column),could be considered as information-limiting environments; yeteach has unique characteristics and implications. Researchinto how technology shapes information consumption would,therefore, be enhanced by independently considering changesin both information source diversity and slant when devel-oping theory, designing studies, and selecting measures.
MIS Quarterly Vol. 44 No. 4/December 2020 1625

Kitchens et al./Echo Chambers and Filter Bubbles
Information Source Consumption
To frame our investigation of how social media platformsshape the information sources an individual chooses to con-sume, we provide a general model of how social networkhomophily, algorithmic filtering, and individual behavioralresponses can lead to variation in information source con-sumption. We then detail how this model relates to threepopular social media platforms. Finally, we hypothesize how,based on these factors, social media use may be associatedwith changes in information diversity and slant in informationsource consumption.
As depicted in Figure 2, social network homophily (path A)and algorithmic filtering (path B) are two key determinants ofthe information sources a social media to which a user isexposed. Individuals’ social networks vary widely in size, thedensity of shared ties, and the frequency of interactions. Likewise, social media users vary in their social networks,including who they are connected with on a platform. Thepreponderance of information sources shared on social mediais generated by platform users. Yet, there is wide variabilityamong platforms in how user-generated content is organized,the extent to which algorithmic filtering is used in prioritizingwhich content is displayed, and the factors considered in thatprioritization. Once a platform presents a user with a previewof potential information sources, the user has the opportunity(path C) to engage on that platform and/or to “click-through”to the external source itself. Additionally, an individual’sresponse to content exposure can serve as an input for subse-quent algorithmic filtering (path E) and influence who thatuser affiliates with in the future (path D).
Next, we build on Figure 2 to discuss how social media plat-forms vary in the prioritization of information sources thatusers are exposed to. As noted in Table 2, Facebook is anexample of a platform with high levels of social networkhomophily and extensive algorithmic filtering. Facebookdetermines what content to show users based on an estimatedlikelihood of engagement (Bakshy et al. 2015; Vaidhyanathan2018). In deciding what to present, Facebook chooses fromamong recent posts made by others in a user’s social network(e.g., by Facebook “friends”). Facebook considers an indi-vidual’s past engagement history as well as the overallpopularity of content. Thus, algorithmic filtering on Face-book is highly personalized: even if two users have anidentical set of Facebook friends, what each user sees mayvary considerably based on their prior engagement withsimilar content.
Twitter also has a high level of social network homophily. Twitter users build their online social network by identifyingother Twitter accounts to “follow.” For the first 10 years of
its existence (from 2006 to mid-2016), Twitter presented aprimary timeline of Tweets posted by others in a user’s socialnetwork (those whom they “follow”) in reverse chronologicalorder. During this period, algorithmic filtering was minimal: two users who followed the same Twitter accounts would seethe same content, in the same order. Recently, Twitter hasimplemented more extensive algorithmic filtering (similar toFacebook). However, the data analyzed in this study was col-lected prior to this implementation, and therefore provides acontrast to Facebook.
Finally, Reddit is an example of a platform that is primarilyinterest-based, with content shared by users through a hier-archy of topic-based communities (a.k.a. subreddits). Usersself-identify their interests by joining these communities. Usersmay directly communicate with one another, but theseconnections are not used to filter content. Indeed, Redditperforms minimal algorithmic filtering, merely prioritizingcontent based on popularity determined by up- and down-votes. A Reddit user can choose to sort and filter contentbased on recency or popularity, but members of the samecommunities see the same content by default (Jürgens andStark 2017).
In summary, because social media platforms embody a widevariety of features and uses, it is not reasonable to makeblanket statements regarding how their use may produceinformation-limiting environments. It is more useful to discusshow—through the interplay of social networks, algorithmicfiltering, and individual choices—the mechanisms in Figure 2may be associated with changes in diversity and slant in theinformation sources an individual chooses to consume. Because of conflicting theoretical claims and mixed empiricalevidence to date, we divide studies into rival camps andarticulate competing hypotheses (e.g., Gray and Cooper 2010). While only one of each pair of hypotheses can survive a givenempirical test, the reality that there are likely many differentboundary conditions—such as differentiated effects bytechnology platform—suggests the need for a systematicprogram of research over time to identify the conditions underwhich each effect may dominate (Burton-Jones et al. 2017).
Narrowing Diversity
The argument that social media use is associated with nar-rowing diversity in information source consumption beginswith the observation that social networks frequently exhibitideological homophily (e.g., Bakshy et al. 2015; Himelboim etal. 2013). Individuals are more likely to affiliate with otherswho share similar experiences, perspectives, and opinions. Tothe extent that individuals are part of ideologically segregatedsocial networks, the content posted by others
1626 MIS Quarterly Vol. 44 No. 4/December 2020

Kitchens et al./Echo Chambers and Filter Bubbles
Figure 2. Social Media Use and Information Source Consumption
Table 2. Determinants of Prioritization of Information Sources by Social Media Platform
Facebook Twitter Reddit
Social Network Homophily Platform social graph High High Low
Algorithmic Filtering
Engagement history High Low† Low
Content popularity High Low High
Topic-based Low Low High
†Low for chronological Twitter feed before mid-2016, high for curated feed initiated in mid-2016.
with whom they interact on social media may also be ideolo-gically constrained (path A in Figure 2). For example, a studyof news links in partisan Facebook pages showed that com-menters in both liberal- and conservative-oriented groupsposted links to a small number of information sources, withlittle overlap between the two groups (Jacobson et al. 2016).
To the extent that a social media platform algorithmicallyfilters or prioritizes content based on users’ prior engagement(path B), users may also be presented with a narrower rangeof content (Bozdag and van den Hoven 2015; Pariser 2011). When this constrains information sources available to engagewith (path C) it can also create a feedback loop (path D, E)that further constrains variation in subsequent exposure(Prawesh and Padmanabhan 2011). Algorithmic filtering andprioritization based on general popularity can also lead to anarrowing of information sources in a rich-get-richer dynamic(Welch et al. 2011). Further, among information sources towhich users are exposed, individuals’ preference to engagewith opinion-confirming sources rather than opinion-challenging ones—referred to as selective exposure theory(e.g., Garrett 2009)—may reduce engagement with and con-sumption of diverse information sources (paths C). Indeed,Schmidt et al. (2017) found “that the more active a user is, themore the user tends to focus on a small number of news
sources” (p. 4). Bakshy et al. (2015) concluded that restrictedinformation diversity occurs in part due to algorithmic filtereffects on exposure (path B), but more so because of indi-vidual choices in engagement and consumption (paths C, D,E). Thus, we propose:
H1a: Social media use is associated with a nar-rowing in the diversity of informationsource consumption.
Broadening Diversity
A contrasting argument holds that the social media use may beassociated with a broadening of information diversity in infor-mation source consumption. Although the argument followssimilar logic and pathways as the narrowing effect (H1a), itarises from different assumptions about ideological segrega-tion in online social networks, associated content exposure,and individual preferences in content engagement andconsumption.
There is some evidence that ideological segregation may beless prevalent in online relationships than it is in offline ones. As such, online social networks may even broaden the ideo-
MIS Quarterly Vol. 44 No. 4/December 2020 1627

Kitchens et al./Echo Chambers and Filter Bubbles
logical range of social interactions (path A). For example,Goel et al. (2010) found that people’s ties on Facebook oftenincluded others who held different ideological views—forexample, through familial, professional, and hobby-relatedassociations. These diverse social interactions can increaseindividuals’ incidental exposure to ideologically diverse infor-mation sources (path A) (Fletcher and Nielsen 2016).
Platforms that filter and curate information sources relative totopics of interest (path B) must cater to a variety of users. Heterogeneity of user interests provides incentives for thesealgorithms to increase the diversity of information sources. This works against the rich-get-richer popularity bias men-tioned previously and leads to increased variety (Fortunato etal. 2006). This rationale applies to generic filtering algo-rithms, but not necessarily to personalized filtering (path G,D). Personalized filtering algorithms are essentially sophisti-cated recommender systems, a domain in which the novelty-accuracy tradeoff has long been a well-known and researchedissue—intuitively, “it would be almost always correct, butuseless, to recommend bananas, bread, milk, and eggs” togrocery shoppers (Herlocker et al. 2004, p. 14). Under-standing the value of novel information, recommendersystems are commonly designed with diversity, serendipity,coverage, and related objectives in mind, all of which wouldincrease the breadth of information sources to which users areexposed (Kaminskas and Bridge 2016).
Finally, as a platform for information discovery, a funda-mental purpose of social media is to provide access toinformation sources otherwise unknown to users. Becauseindividuals have a limited capacity for search and exploration,it has long been recognized that intermediate tools are neededin order to overcome the difficulty of finding information(Bakos 1997). Although there are a variety of use cases forsocial media, the value of these platforms is broadly derivedfrom their ability to connect users with content that is infor-mative, engaging, or entertaining. It stands to reason, there-fore, that platform usage may be associated with discovery ofnovel information sources that enhance an individual’sinformation source diversity. This assertion is supported bythe finding that news site visits from social media platformswere more diverse than direct visits (Flaxman et al. 2016). Insummary, we propose:
H1b: Social media use is associated with abroadening in the diversity of informationsource consumption.
Partisan Shift
The argument that social media use is associated with apartisan shift in information source consumption is difficult to
disentangle from the argument for the narrowing of infor-mation diversity (H1a above). It is therefore unsurprising thatthe consumption of cross-cutting content, which shifts bothinformation diversity and slant, is viewed as an antidote toinformation-limiting environments. Indeed, researchers oftendiscuss a narrowing of diversity and a partisan shift in infor-mation sources as occurring together. For example, the large-scale study of Facebook usage by Schmidt et al. (2017) con-cluded that “users [tend] to limit their exposure to a few sites”and “there is major segregation and growing polarization inonline news consumption” (p. 4). Moreover, an importantargument for a partisan shift follows a logic similar to that fornarrowing of diversity: exposure to opinion-reinforcinginformation is high due to ideological segregation (path A),individuals prefer opinion-conforming information (path C),and algorithms reinforce these preferences (paths B, E). Bakshy et al. (2015, p. 2) found the “factor decrease in thelikelihood that an individual clicks on a cross-cutting articlerelative to the proportion available in News Feed to be 17%for conservatives and 6% for liberals” (path C). This reduc-tion in cross-cutting content consumption contributes to botha narrowing of information diversity as well as a partisanshift.
We identify three distinct arguments for how partisan shiftsmay occur independently of narrowing. First, individuals whoprimarily interact with like-minded others online (path A) arelikely to experience the same group solidarity and in-groupidentification that occur offline, with a polarizing effect onideological beliefs (e.g., Schkade et al. 2007; Sunstein 2009). Second, a Twitter experiment by Bail et al. (2018) demon-strated that exposure to opposing viewpoints resulted in apartisan shift in engagement (path C), albeit only for conser-vatives. However, Bail et al.’s experimental conditions wereextreme and may not represent either typical use of socialmedia or typical patterns of ideological content exposure. Third, social media platforms may include partisan contentcreated and promoted by zealots or malicious actors at-tempting to convince others or actively sow discord throughFacebook groups, Twitter hashtags, and Reddit subreddits(e.g., Allcott and Gentzkow 2017; Lazer et al. 2018). Insummary, we propose:
H2a: Social media use is associated with apartisan shift in the slant of informationsource consumption.
Moderating Shift
However, other research suggests the opposite effect. Just asnarrowing of information diversity and a partisan shift areoften complementary, so too is the opposite combination of
1628 MIS Quarterly Vol. 44 No. 4/December 2020

Kitchens et al./Echo Chambers and Filter Bubbles
broadening diversity and a moderating shift. The studies insupport of broadening of information diversity (in H1b above)often assume that broadening occurs through exposure toopinion-challenging, cross-cutting content.
To the extent that individuals’ online social networks arediverse, users may experience increased exposure to moder-ating news sources (path A). Based on experimental manipu-lation of social endorsements and online news consumptionchoices, Messing and Westwood (2014) concluded that “themere presence of social endorsements reduced partisanselectivity to levels indistinguishable from chance” (p. 1056). Thus, when an individual observes others in their social net-work engaging with content—a form of social endorsement—they are more likely to engage with it themselves, regardlessof perceived slant. Selective exposure to opinion-confirmingcontent appears to be even lower when mediated by onlineplatforms than through more direct interaction with others,causing users to encounter information with dissimilar poli-tical views (Mutz and Martin 2001, p. 98).
Filtering and prioritization algorithms (path B) may also showusers more mainstream, moderate content because it is typi-cally more popular and commercially viable (Cooper 2003). Particularly if a platform is ad-supported, there may be incen-tive to avoid polarizing content in order to appease advertisers(Gabszewicz et al. 2002). For similar reasons, platforms mayalso choose to present a balance of ideological perspectives(Fletcher and Neilsen 2018b).
There is also direct empirical evidence consistent with amoderating effect of social media use. For example, apopulation-level analysis of technology use found that thedemographic groups most likely to use social media were alsothe least likely to be ideologically segregated (Boxell et al.2017). Shore et al. (2018) offer empirical evidence of apotential moderating effect of platform usage, finding thatTwitter users typically share news links that are more centristthan the news links to which they are exposed (therebycreating more opportunity for others to encounter centristnews through). Thus, we propose:
H2b: Social media use is associated with amoderating shift in the slant of informationsource consumption.
Data and Methods
Research Setting
To investigate how social media use is associated with infor-mation source consumption, we obtained data from Comscore,
a leading provider of digital audience measurement services. They recruit and compensate a demographically represen-tative sample of active U.S. Internet users who install anapparatus that automatically records and reports granularInternet usage. This apparatus enables Comscore to gatheraccurate data about the timing and duration of all web pagesvisited by each panelist, including use of social media andvisits to news sites. Companies widely trust this data to accu-rately reflect the reach and effectiveness of marketing efforts,similar to Neilsen ratings for television. Although theyusually report audience data in aggregate format, we obtainedde-identified user-level clickstream browsing data for over 3million U.S. adults who were panelists between January 2012and June 2016.
Panel membership rotates, with existing users leaving and newusers joining the panel at variable intervals. To understandwithin-person behavioral trends over time, we limited ouranalysis to users who remained on the panel for at least 365consecutive days. Although social desirability bias could bea concern as users are aware of the monitoring they agreed to,we empirically established that panel users continued tobrowse all manner of sites and conclude that it is unlikely thatusers systematically altered their browsing behaviors.
A limitation of our data set is that it only includes browsingbehavior originating from desktop and laptop computers(PCs); the data set does not include mobile device usage. While it would be optimal to have a view of online usage thatencompasses mobile devices, this data set can still providerobust insights into the association between social media useand news site visits. An analysis of similar Comscore data byMitchell and Jurkowitz (2014) found that online news con-sumption patterns were similar for PCs and mobile devices. Also, we conducted an additional survey to better understandmobile and PC device visits to social media and news sites. We randomly surveyed 426 individuals through Qualtrics(results available upon request), asking respondents how oftenthey read news and access social media on desktops or laptops(PC), as well as smartphones or tablets (mobile). The numberof users who access news on various devices is almost iden-tical, with 82% of users reading news on a PC at least weekly,compared to 83% reading news on mobile devices at leastweekly. The difference is only slightly more pronounced foraccessing social media, with 88% doing so on mobile at leastweekly, compared to 73% by PC. Further, we found no evi-dence of significant substitution of one device type for theother. It is important to note that this survey was conductedin February 2020, whereas our data encompasses panelists’web site visits from 2012 through mid-2016. Mobile deviceusage has increased significantly from the years 2012–2016,while PC usage has largely remained stable, particularly fornews consumption (Walker 2019). In summary, it is reason-
MIS Quarterly Vol. 44 No. 4/December 2020 1629

Kitchens et al./Echo Chambers and Filter Bubbles
Table 3. Independent Variables
Measure Description
Facebook referralsNumber of visits to news sites attributable as referrals from each platform; that is, web pages inthe domains facebook.com, reddit.com, and twitter.com (count)
Reddit referrals
Twitter referrals
Time on Facebook Duration of all visits to each platform (hours)Note: In all models, this is Log2 transformed such that the coefficient represents the impact onthe odds ratio of a doubling of time spent.
Time on Twitter
Time on Reddit
Direct visits Number of direct visits to news sites (count)
Total time online Total duration of all website visits (hours). Transformed Log2 in all models.
Table 4: Outcome Measures for an Individual’s Within-Period News Site Visits
Dimension Construct Measure Description Minimum Maximum
Diversity
Informationsourcequantity
Distinct newssites
Number of unique newssites visited (count)
No news site visitsVisit all 177 newssites in the sample
Informationsourcedispersion
Slantdispersion
The time-weighted standarddeviation of political slant ofnews sites visited
All visited news siteshave the samepolitical slant
50% of visits to themost liberal newssite, 50% to themost conservative
Informationsource parity
Reverse GiniIndex
(1 - Gini Index)*100calculated based on timespent on each visited newssite (0 to 100 range)
One news sitepredominates withminimal time onothers
An equal amountof time spent atmultiple news sites
Informationsource variety
Audiencevariety
Time-weighted mean varietyof news site visits based onthe frequency of overlappingsite visitors (0 to 100 range)
Visit a small set ofnews sites that havethe same readership
Visit multiple siteswith minimalaudience overlap
SlantInformationsource slant
Mean slant
Time-weighted average ofpolitical slant for visits toany of 177 news sites (-100to 100 range; lower valuesmore liberal, higher valuesmore conservative)
Either all visits tosingle most-centristsite or visits to aperfectly balancedset of sites
All visits to eitherthe most liberalnews site or themost conservativenews site
Diversityand slant
Cross-cuttingcontentconsumption
Cross-cuttingproportion
Time-weighted percentageof news sites visited withpolitical slant scoresopposite to a user’s baseideology (0 to 100 range)
All news sites visitsin the same categoryof political slant
A user spends asignificant amountof time at newssites opposingtheir base ideology
able to conclude that the data represents a meaningful portionof users’ news browsing and social media activity (possiblyeven a significant majority given the period of data collec-tion).
Measures and Analysis
To test our hypotheses, we estimated fixed effects within-person models over a panel comprised of 4-week periods. For
each individual in our sample, we calculated measures pernonoverlapping four-week period of their tenure (see Tables3 and 4 for a summary of measures). To better understandinformation source consumption, we focused on informationdiversity and slant of news consumption among active users. Limiting our analyses to user-periods containing at least onenews site visit resulted in an unbalanced panel of 185,548individuals with a total of 1,096,480 user-period observationsfor an average of 5.9 observations per individual in oursample. Summary statistics and correlations are reported in
1630 MIS Quarterly Vol. 44 No. 4/December 2020

Kitchens et al./Echo Chambers and Filter Bubbles
the Appendix. In such a within-person model, the results maybe interpreted as estimated differences for an individual,comparing periods when they use social media platforms moreto those periods in which that same individual uses them less. This design avoids the potentially problematic comparison oflight and heavy platforms users to each other and helps toisolate the impacts of changes in an individual’s platform usefrom other characteristics of the user.
The independent variables relate to the use of three socialmedia platforms (Facebook, Twitter, and Reddit) that providelinks to news sites. We measured the number of visits to newssites occurring via referrals from each platform to assess theeffect of these referrals on diversity and slant. Also, we mea-sured the number of visits made directly to the home page ofa news site (for instance, by typing the URL of the news sitedirectly into the browser navigation bar). Because thesedirect visits are made independent of exposure to platform-prioritized information sources, they provide a baselineagainst which to assess the impact of diversity and slant ofnews site visits referred by social media platforms. Beyondthe primary effect of news site referrals, we also expected thatgeneral usage of these platforms may influence news con-sumption, and therefore also measured the time individualsspent on each platform, as well as their total time online. Finally, as a control for use of other popular informationdiscovery platforms, we include time and count variables forindividuals’ use of email and search.
Information Diversity
We adopted four distinct but complementary measures thattogether provide a holistic view of information source diver-sity of news site visits, as described in Table 4. First, thenumber of distinct sites visited by each user during each aperiod measures information source quantity. Next, wemeasure slant dispersion as separation on the horizontaldimension of partisan slant by calculating the time-weightedstandard deviation of the slant of news sites visited by a userduring a period (measurement of slant itself is detailed in thenext section). Intuitively, this represents the spread of a user’snews consumption along the ideological continuum. Third,we measure information source parity as the vertical distribu-tion of news source consumption, calculated as the reverse-coded Gini index of time spent by a user on each distinct newssite within a period.2 If a user visits 10 diverse sites, butspends 99% of their time on one of these, the level of diversity is still effectively low, which will be captured by thismeasure.
Information source variety represents diversity across anynumber of dimensions or categories. From the perspective ofnews, this could be by a topic (politics, sports, celebrity),presentation mode (short-form prose, long-form prose, info-graphic, video), exposition (fact reporting, opinion, editorial),etc. Instead of attempting to identify all possible underlyingfactors of variety, we used the site visit history of all 3 millionpanel members to estimate these latent factors that drive usersto visit different sites. The intuition behind this measure isthat sets of news sites with higher levels of audience variety—that is, a lower overlap of actual audiences—are more likelyto provide diverse information. To calculate this measure, wefirst defined a co-visitation network of all users to all newssites. For each pair of news sites p and q, we calculated vpq,the number of users who visited both sites, and defined anintermediate measure of the audience overlap of these sites,vpq / min(vp, vq); note 0 # vpq / min(vp, vq) # 1.3 Time-weightedaudience variety is then calculated across all pairs of newssites visited by user i in period t:4
Partisan Shift
Hypotheses 2a and 2b concern the relationship between socialmedia use and change in the slant of information sourcesconsumed. For outcomes related to slant, we based themeasurement on slant scores for 177 commonly visited onlinenews sites published in Shore et al. (2018), as detailed in theAppendix. We calculated the time-weighted average slant ofonline news sites visited by a user during a given period. Ourscores are scaled from their range of ±3.602 to a range of±100 for ease of exposition. Because a change in partisanslant is relative to a referent base ideological position for eachuser, we also categorized individuals as being in conservative,centrist, or liberal terciles of our sample by calculating a time-weighted average slant score per individual based on all oftheir news sites visits while on the panel. We used a categori-cal, rather than continuous, measure following prior researchthat has shown qualitative differences between liberals andconservatives (e.g., Bakshy et al. 2015; Bail et al. 2018).
2The Gini index is a measure of concentration, so it must be reverse codedto reflect increasing diversity.
3The choice of min(vp, vq) prevents relatedness scores from being biased
downward when comparing sites with large discrepancy in visitation rates.We also used the maximum and average of vp and vq with similar results.
4We are fortunate to be able to calculate this measure due to the rich natureof our data. Harrison and Klein (2007) suggest the Blau index as a moregeneric measure of variety, which we also tested with results consistent withthe measures presented.
MIS Quarterly Vol. 44 No. 4/December 2020 1631

Kitchens et al./Echo Chambers and Filter Bubbles
Figure 3. Alternative Measures of Cross-Cutting Content (Illustrated for Liberal Users)
We acknowledge that assigning a single score to describe thepolitical slant of all content on a given news site is a simplifi-cation. Any given article on a news site may express apolitical ideology that is well-aligned or misaligned with theperceived or actual ideology typical for that site. However,we build on prior work showing that slant scores provideinsight into general user behaviors (Gentzkow and Shapiro2011; Shore et al. 2018). Indeed, a survey conducted by PewResearch Center of 12,043 adults concludes that “deeppartisan divisions exist in the news sources Americans trust,distrust and rely on” (Jurkowitz et al. 2020, p. 4). Thus, whenusers choose to consume information sources, the dominantideological position of the information source (in this case, anews site) is a salient factor in their decision.
To further confirm the external validity of assigning slantscores to online news sites, we surveyed 426 individualsregarding their political affiliation and likelihood to read newsfrom a set of websites. Analysis of these survey responsesdemonstrates a clear relationship between an individual’spolitical affiliation and their likelihood to visit various newssites. The correlation between the slant scores of news sitesand the coefficients of simple linear regressions of politicalaffiliation on the likelihood to visit them is 0.73. Theseresults (available upon request) suggest that individuals per-ceive the site that hosts a news article as a strong signal ofpotential alignment with their political affiliation.
Cross-Cutting Content Consumption
Finally, we calculated the percentage of cross-cutting contentconsumed by each user. As discussed earlier, changes in thismeasure reflect a change in both diversity and slant. Becausethere is no generally accepted approach for identifying cross-cutting content, we calculated the proportion of content inthree distinct ways as illustrated in Figure 3. These alterna-tive measurements incorporate different thresholds for howdifferent an information source’s slant needs to be from auser’s baseline position in order to be considered cross-
cutting. First, for users in conservative or liberal terciles, wecalculated the proportion of content they consumed that is inthe opposite tercile (i). Second, we calculated the proportionof content users in these terciles consume that was at leastacross the median (ii). Third, we calculated the proportion ofcontent users in these terciles consumed in the opposite orcentrist tercile (iii).
Results
Information Diversity
To test H1, we used fixed effects within-person models toestimate the association between the use of popular socialmedia platforms and four measures of information diversity(results shown in Tables 5 and 6). All models control fordirect news site visits and total time spent online, as well as alltime-invariant user characteristics removed via the fixed effectwithin transformation. Because of the relatively large samplesize, as suggested by Lin et al. (2013) we report coefficientconfidence intervals for each of our models across a range ofsubsample sizes in Appendix Figure A1. Additionally, wepresent an intuitive analysis of effect sizes in the discussionsection.
For the first measure of information diversity, the number ofdistinct news sites visited within a period (Table 5, Panel A),we found that each referral from a social media platform to anews site was associated with an increase in the number ofdistinct news sites visited by an individual within the same 4-week time period. By comparison, the estimated associationbetween the number of direct visits and total distinct news sitevisits was very low. This result is consistent with the intuitiveunderstanding that, whereas direct site visits are more likelyto be return visits to a previous site, individuals are exposedto additional information sources through their use of socialmedia. Nonetheless, we found significant variation amongplatforms in the strength of the association between referrals
1632 MIS Quarterly Vol. 44 No. 4/December 2020

Kitchens et al./Echo Chambers and Filter Bubbles
Table 5: Association of Platform Use and Information Source Diversity: Quantity and Separation
Panel A: DV = Distinct News Sites Panel B: DV = Slant Dispersion
I II III IV I II III IV
Facebook referrals 0.268*** 0.261*** 0.299*** 0.260***
(0.0012) (0.0012) (0.0052) (0.0053)
Reddit referrals 0.884*** 0.767*** 0.354*** 0.196***
(0.0051) (0.0055) (0.0215) (0.0235)
Twitter referrals 0.506*** 0.476*** 0.014 -0.014
(0.0077) (0.0078) (0.0328) (0.0332)
Search referrals 0.418*** 0.407*** 0.377*** 0.343***
(0.0009) (0.0009) (0.0039) (0.0039)
Email referrals 0.086*** 0.085*** 0.039*** 0.035**
(0.0025) (0.0025) (0.0106) (0.0106)
Direct visits0.018*** 0.012*** 0.018*** 0.012*** 0.001 -0.005*** 0.001 -0.004***
(0.0001) (0.0001) (0.0001) (0.0001) (0.0004) (0.0004) (0.0004) (0.0004)
Time on Facebook(Log2 of hours)
0.197*** 0.062*** 0.562*** 0.432***
(0.0033) (0.0029) (0.0123) (0.0124)
Time on Reddit(Log2 of hours)
1.803*** 0.804*** 1.418*** 1.090***
(0.0164) (0.0156) (0.0611) (0.0665)
Time on Twitter(Log2 of hours)
0.425*** 0.186*** 0.229*** 0.116**
(0.0110) (0.0097) (0.0410) (0.0414)
Time on search(Log2 of hours)
0.572*** 0.240*** 0.988*** 0.707***
(0.0047) (0.0042) (0.0177) (0.0178)
Time on email(Log2 of hours)
-0.135*** -0.062*** -0.209*** -0.143***
(0.0046) (0.0040) (0.0171) (0.0171)
Total time online (Log2 of hours)
0.614*** 0.418*** 0.289*** 0.297*** 1.301*** 1.126*** 0.680*** 0.688***
(0.0024) (0.0021) (0.0032) (0.0028) (0.0089) (0.0089) (0.0119) (0.0119)
Intercept-0.019 0.318*** 0.373*** 0.459*** 0.325*** 0.620*** 1.062*** 1.130***
(0.0118) (0.0101) (0.0119) (0.0103) (0.0432) (0.0429) (0.0443) (0.0440)
Observations 1,096,480 1,096,480 1,096,480 1,096,480 1,096,480 1,096,480 1,096,480 1,096,480
Individuals 185,548 185,548 185,548 185,548 185,548 185,548 185,548 185,548
R-squared 0.0920 0.3349 0.1273 0.3404 0.0231 0.0384 0.0306 0.0423
Standard errors shown in parenthesis below estimated coefficients.
*p < 0.05, **p < 0.01, ***p < 0.001
and distinct news sites. For example, for every 10 Redditreferrals there are almost 8 distinct news sites visited duringthe period, whereas 10 Facebook referrals relates to less than3 new distinct news sites visited.
We also found that time spent on each platform was signi-ficantly and positively associated with the number of distinctnews sites visited, with relative estimated effect sizes amongplatforms substantially similar to that of referrals. The soleexception was time spent on email, which was associated witha slight reduction in the number of distinct news sites visited. Because time variables are base-2 logged, their coefficients
represent the effect of a doubling of time spent on eachplatform. A user doubling their typical amount of time spentusing Reddit visited 0.8 additional distinct sites in a period,while a user doubling time on Facebook visited only 0.06additional distinct sites.
We report the results for slant dispersion in Panel B of Table5. Among social media platforms, we found that the use ofReddit was associated with the most substantial magnitudeincreases in slant dispersion, particularly for time spent oneach platform. Facebook referrals and time on Facebookboth had moderate positive associations with slant dispersion.
MIS Quarterly Vol. 44 No. 4/December 2020 1633

Kitchens et al./Echo Chambers and Filter Bubbles
Table 6. Association of Platform Use and Information Source Diversity: Variety and Parity
Panel C: DV = Audience Variety Panel D: DV = Reverse Gini Idex
I II III IV I II III IV
Facebook referrals0.700*** 0.557*** 0.887*** 0.823***
(0.0200) (0.0203) (0.0104) (0.0105)
Reddit referrals0.699*** 0.098 0.824*** 0.425***
(0.0822) (0.0897) (0.0426) (0.0465)
Twitter referrals-0.231 -0.368** 0.373*** 0.259***
(0.1251) (0.1266) (0.0648) (0.0656)
Search referrals1.758*** 1.591*** 1.432*** 1.355***
(0.0148) (0.0150) (0.0077) (0.0078)
Email referrals0.144*** 0.138*** 0.518*** 0.513***
(0.0405) (0.0405) (0.0209) (0.0210)
Direct visits0.016*** -0.005** 0.015*** -0.003 0.059*** 0.039*** 0.058*** 0.040***
(0.0017) (0.0017) (0.0017) (0.0017) (0.0009) (0.0009) (0.0009) (0.0009)
Time on Facebook
(Log2 of hours)
1.861*** 1.524*** 1.093*** 0.664***
(0.0469) (0.0473) (0.0247) (0.0245)
Time on Reddit
(Log2 of hours)
4.572*** 4.108*** 3.587*** 2.730***
(0.2334) (0.2538) (0.1228) (0.1315)
Time on Twitter
(Log2 of hours)
1.055*** 0.643*** 1.160*** 0.654***
(0.1566) (0.1579) (0.0824) (0.0818)
Time on search
(Log2 of hours)
5.021*** 3.758*** 2.813*** 1.716***
(0.0675) (0.0680) (0.0355) (0.0352)
Time on email
(Log2 of hours)
-1.438*** -1.110*** -0.693*** -0.474***
(0.0654) (0.0653) (0.0344) (0.0338)
Total time online
(Log2 of hours)
7.761*** 7.072*** 5.152*** 5.161*** 4.781*** 4.145*** 3.233*** 3.256***
(0.0340) (0.0342) (0.0456) (0.0453) (0.0179) (0.0177) (0.0240) (0.0235)
Intercept5.869*** 6.981*** 8.859*** 9.119*** -3.339*** -2.273*** -1.519*** -1.260***
(0.1650) (0.1639) (0.1691) (0.1680) (0.0869) (0.0848) (0.0890) (0.0870)
Observations 1,096,480 1,096,480 1,096,480 1,096,480 1,096,480 1,096,480 1,096,480 1,096,480
Individuals 185,548 185,548 185,548 185,548 185,548 185,548 185,548 185,548
R-squared 0.0549 0.0718 0.0640 0.0769 0.0797 0.1264 0.0909 0.1304
Standard errors shown in parenthesis below estimated coefficients.
*p < 0.05, **p < 0.01, ***p < 0.001
Finally, Twitter use was associated with minimal change inslant dispersion. In comparing the analyses for distinct sitevisits (Panel A) and slant dispersion (Panel B), the R2 for thelatter is lower than the former. Nonetheless, there is nearly adoubling in R2 from Panel B Model I including only directvisits and total time online to Panel B Model IV alsoincluding social media usage. In all, we conclude that therelationships between slant dispersion and the use of Redditand Facebook are modest but nontrivial.
Panels C and D in Table 6 provide results for the informationsource diversity measures of audience variety and reverseGini index, respectively. Among the social media platforms,we found again that the use of Reddit was associated with themost substantial magnitude increase in both measures, fol-lowed by Facebook. Similarly, Twitter was associated withminimal changes. In summary, in considering all four diver-sity measures, we conclude that for Facebook and Redditthere is consistent support of hypothesis H1b, predicting a
1634 MIS Quarterly Vol. 44 No. 4/December 2020

Kitchens et al./Echo Chambers and Filter Bubbles
broadening association between platform use and informationsource consumption. For these platforms, there is no supportof the alternative H1a. With inconsistent sign and signifi-cance as well as lower magnitude of observed effectsassociated with Twitter usage, we find weak, mixed supportfor either H1a (narrowing) and for H1b (broadening).
Partisan Shift
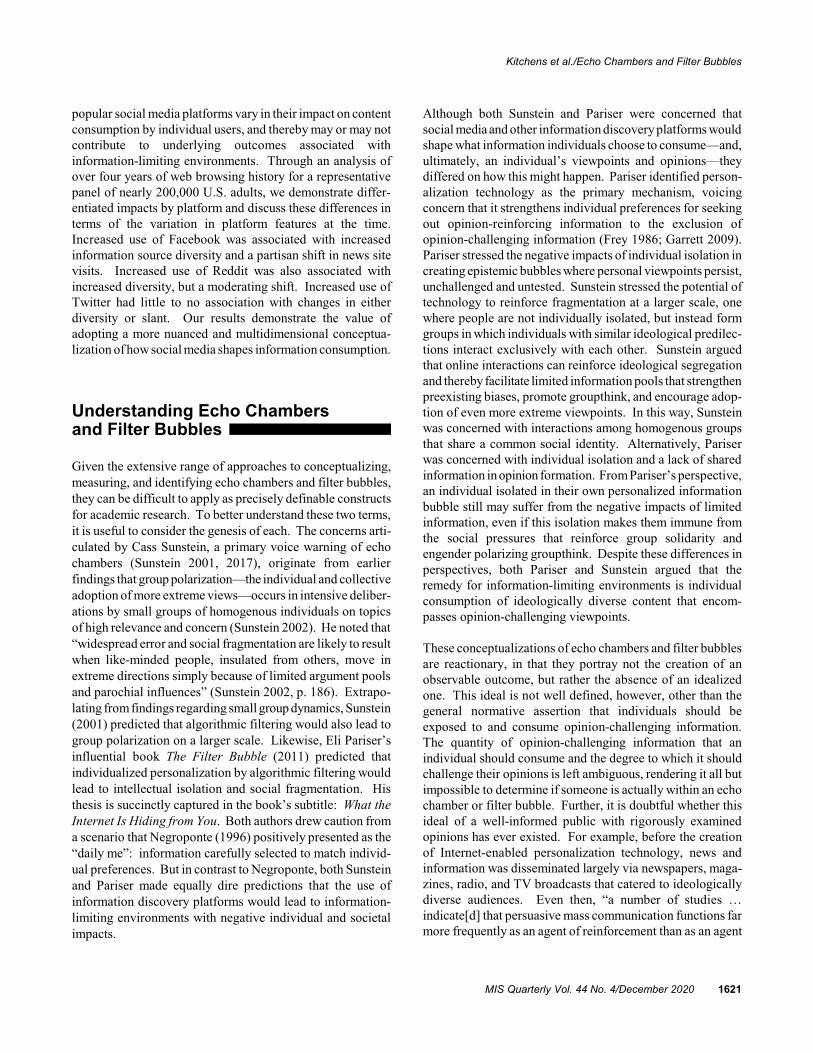
To measure shifts in the slant of news consumed, we dividedusers into conservative, centrist, and liberal terciles and useda fixed effects within-person model to estimate the relativemean slant of news consumed by these users during periods ofhigher or lower usage of each social media platform.5 Eachvariable is interacted with a tercile indicator variable, with themain effect of the tercile indicator subsumed by the fixedeffect. This effectively allows separate models for eachtercile to be estimated simultaneously within one model. Withslant scores ranging from negative (indicating liberal) topositive (indicating conservative), a positive coefficient forusers in the conservative tercile indicates a partisan shift (i.e.,a shift from conservative to more conservative), whereas anegative coefficient indicates a moderating shift. The oppo-site signs apply for the liberal tercile.
As shown in Table 7, an increase in referrals from and timespent using Facebook were associated with a partisan shift inthe slant of news consumed. In periods when conservativeindividuals used Facebook more, their news site visits weremore conservative. The same applies to liberal users, but withlower magnitude. For Reddit, increased referrals were asso-ciated with a moderating shift for conservative users, yet therewas no association found for liberal users. Twitter usage hadno significant association with changes in slant. Overall,these results support H2a for Facebook, where greater use wasassociated with a partisan shift in information source con-sumption. The results support H2b for Reddit, with greateruse associated with a moderating shift, albeit for conservativeusers only. However, R2 values are very low, meaning thatthe vast majority of variance in the mean slant of informationsources consumed by users remains unexplained by theirsocial media usage.
Cross-Cutting
As a final analysis, we estimated the relationship betweensocial media use and the percentage of cross-cutting content
consumption using three classifications for cross-cuttingcontent. The three panels in Table 8 (F, G, and H) correspondwith the classifications of cross-cutting illustrated in Figure 3as alternatives (i), (ii), and (iii), respectively. The results arelargely consistent for all three measurement approaches.6 Inall three cases, Facebook referrals were associated with adecrease in the percentage of cross-cutting content consumedby users. However, as highlighted by a shaded band inTable 8, for time spent on Facebook, results vary dependingupon what threshold is applied to define cross-cutting. Results ranged from significantly positive for the most strin-gent categorization (i.e., cross-cutting news is only news fromthe opposite side) to significantly negative for the least strin-gent categorization (i.e., cross-cutting news also includes alarge segment of centrist content). We find little to no evi-dence for an association of Reddit or Twitter with cross-cutting.
It is also interesting to note that, although cross-cutting con-sumption conflates both diversity and slant, the estimatedeffects for cross-cutting were more closely aligned with esti-mated effects for shifts in slant, particularly for Facebook andthe reference platforms of search and email. The R2 valueswere also very low, which more closely resembles those forshifts in slant. This stands in contrast to prior research thatconsiders cross-cutting consumption as a measure of diversity(e.g., Bakshy et al. 2015). Our findings support the conclu-sion that a holistic view encompassing separate dimensions ofinformation source diversity and slant provides a more com-plete and nuanced understanding of information consumptionthan considering cross-cutting content consumption alone.
Discussion
Summary of Findings
In summary, we found that the use of different social mediaplatforms had varying associations with changes in infor-mation consumption. Tables 9 and 10 summarize estimatedreferral and time coefficients across platforms for eachdependent variable. These coefficients were drawn from thefully specified Model IV of each panel and are shaded bymagnitude. For comparison we also included the results forsearch and email. Use of Facebook and Reddit were eachassociated with increases in information source diversityacross all measures, with the estimated effects of Redditsignificantly larger than those of Facebook. Use of Twitter
5We tested a variety of divisions, including median split, quartiles, quintiles,sextiles, and deciles, with varying sizes for the centrist component, findingresults consistent across a wide range of measurement choices.
6We also calculated these measures with alternatives that varied both the sizeof the partisan groups as well as the categorization of cross-cutting content.Those results are consistent with variations reported here.
MIS Quarterly Vol. 44 No. 4/December 2020 1635
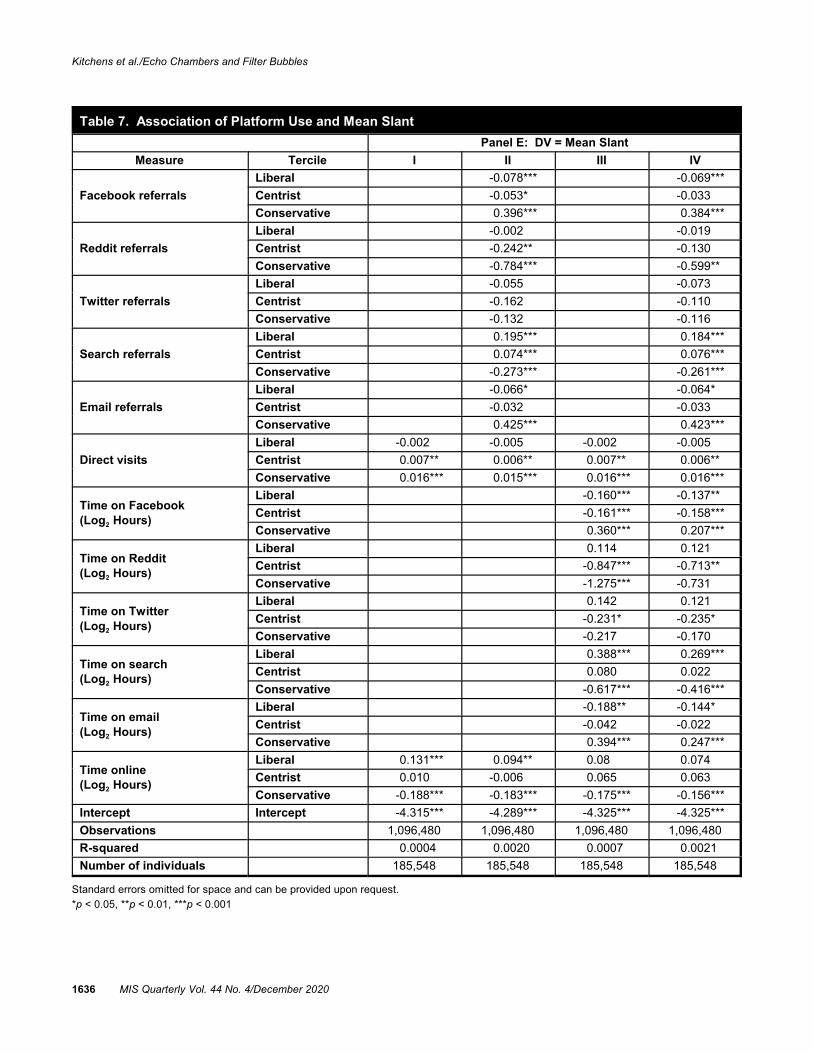
Kitchens et al./Echo Chambers and Filter Bubbles
Table 7. Association of Platform Use and Mean Slant
Panel E: DV = Mean Slant
Measure Tercile I II III IV
Facebook referrals
Liberal -0.078*** -0.069***
Centrist -0.053* -0.033
Conservative 0.396*** 0.384***
Reddit referrals
Liberal -0.002 -0.019
Centrist -0.242** -0.130
Conservative -0.784*** -0.599**
Twitter referrals
Liberal -0.055 -0.073
Centrist -0.162 -0.110
Conservative -0.132 -0.116
Search referrals
Liberal 0.195*** 0.184***
Centrist 0.074*** 0.076***
Conservative -0.273*** -0.261***
Email referrals
Liberal -0.066* -0.064*
Centrist -0.032 -0.033
Conservative 0.425*** 0.423***
Direct visits
Liberal -0.002 -0.005 -0.002 -0.005
Centrist 0.007** 0.006** 0.007** 0.006**
Conservative 0.016*** 0.015*** 0.016*** 0.016***
Time on Facebook(Log2 Hours)
Liberal -0.160*** -0.137**
Centrist -0.161*** -0.158***
Conservative 0.360*** 0.207***
Time on Reddit(Log2 Hours)
Liberal 0.114 0.121
Centrist -0.847*** -0.713**
Conservative -1.275*** -0.731
Time on Twitter(Log2 Hours)
Liberal 0.142 0.121
Centrist -0.231* -0.235*
Conservative -0.217 -0.170
Time on search(Log2 Hours)
Liberal 0.388*** 0.269***
Centrist 0.080 0.022
Conservative -0.617*** -0.416***
Time on email(Log2 Hours)
Liberal -0.188** -0.144*
Centrist -0.042 -0.022
Conservative 0.394*** 0.247***
Time online(Log2 Hours)
Liberal 0.131*** 0.094** 0.08 0.074
Centrist 0.010 -0.006 0.065 0.063
Conservative -0.188*** -0.183*** -0.175*** -0.156***
Intercept Intercept -4.315*** -4.289*** -4.325*** -4.325***
Observations 1,096,480 1,096,480 1,096,480 1,096,480
R-squared 0.0004 0.0020 0.0007 0.0021
Number of individuals 185,548 185,548 185,548 185,548
Standard errors omitted for space and can be provided upon request.
*p < 0.05, **p < 0.01, ***p < 0.001
1636 MIS Quarterly Vol. 44 No. 4/December 2020

Kitchens et al./Echo Chambers and Filter Bubbles
Table 8. Association of Platform Use and Consumption of Cross-Cutting News
Panel F: DV = Cross-Cutting (user tercile
to opposite news site tercile)
Panel G: DV = Cross-Cutting (user tercile
to opposite news site half)
Panel H: DV = Cross-Cutting (user tercile
to centrist or opposite news site tercile)
I II III IV I II III IV I II III IV
referrals
-0.083*** -0.099*** -0.203*** -0.205*** -0.362*** -0.339***
(0.0121) (0.0123) (0.0161) (0.0163) (0.0170) (0.0173)
referrals
0.036 0.012 0.062 0.047 0.144* 0.092
(0.0497) (0.0544) (0.0659) (0.0722) (0.0699) (0.0765)
referrals
-0.049 -0.037 -0.010 -0.001 0.009 -0.008
(0.0756) (0.0767) (0.1003) (0.1018) (0.1064) (0.1080)
Search
referrals
0.104*** 0.096*** 0.177*** 0.167*** 0.251*** 0.240***
(0.0090) (0.0091) (0.0119) (0.0121) (0.0126) (0.0128)
referrals
-0.119*** -0.115*** -0.139*** -0.134*** -0.180*** -0.179***
(0.0245) (0.0246) (0.0324) (0.0326) (0.0344) (0.0345)
Direct visits-0.012*** -0.013*** -0.012*** -0.013*** -0.015*** -0.016*** -0.015*** -0.016*** -0.017*** -0.017*** -0.017*** -0.017***
(0.0010) (0.0010) (0.0010) (0.0010) (0.0013) (0.0014) (0.0013) (0.0014) (0.0014) (0.0014) (0.0014) (0.0014)
Time on
0.166*** 0.199*** -0.064 0.008 -0.453*** -0.331***
(0.0283) (0.0288) (0.0376) (0.0381) (0.0398) (0.0405)
Time on
0.178 0.168 0.141 0.098 0.424* 0.342
(0.1406) (0.1539) (0.1865) (0.2042) (0.1979) (0.2166)
Time on
-0.098 -0.109 -0.041 -0.072 0.170 0.129
(0.0944) (0.0959) (0.1252) (0.1272) (0.1329) (0.1349)
Time on
search
0.253*** 0.184*** 0.390*** 0.272*** 0.531*** 0.364***
(0.0407) (0.0413) (0.0540) (0.0548) (0.0573) (0.0581)
Time on
-0.150*** -0.111** -0.257*** -0.196*** -0.295*** -0.208***
(0.0394) (0.0396) (0.0523) (0.0526) (0.0555) (0.0558)
Time online 0.369*** 0.353*** 0.239*** 0.234*** 0.201*** 0.182*** 0.134*** 0.124*** -0.076** -0.093** -0.050 -0.066
(0.0204) (0.0207) (0.0275) (0.0275) (0.0271) (0.0275) (0.0365) (0.0365) (0.0287) (0.0291) (0.0387) (0.0387)
Intercept6.873*** 6.886*** 7.010*** 7.014*** 15.750*** 15.758*** 15.787*** 15.794*** 29.713*** 29.704*** 29.623*** 29.631***
(0.0992) (0.0994) (0.1022) (0.1022) (0.1316) (0.1318) (0.1355) (0.1355) (0.1396) (0.1398) (0.1438) (0.1437)
Observations 1,092,010 1,092,010 1,092,010 1,092,010 1,092,010 1,092,010 1,092,010 1,092,010 1,092,010 1,092,010 1,092,010 1,092,010
Number of
Individuals185,282 185,282 185,282 185,282 185,282 185,282 185,282 185,282 185,282 185,282 185,282 185,282
R-squared 0.0005 0.0007 0.0006 0.0008 0.0002 0.0006 0.0003 0.0006 0.0002 0.0011 0.0004 0.0012
Standard errors shown in parenthesis below estimated coefficients.
*p < 0.05, **p < 0.01, ***p < 0.001
MIS Quarterly Vol. 44 No. 4/December 2020 1637

Kitchens et al./Echo Chambers and Filter Bubbles
Table 9. Summary of Estimated Coefficients for Changes in Information Source Diversity
Distinct News Sites Slant Dispersion Audience Variety Gini Index Hyp. SupportReferrals Time Referrals Time Referrals Time Referrals Time
Facebook 0.261 0.062 0.260 0.432 0.557 1.524 0.823 0.664 H1a
Reddit 0.767 0.804 0.196 1.090 4.108 0.425 2.73 H1a
Twitter 0.476 0.186 0.116 -0.368 0.643 0.259 0.654 Mixed/low
Search 0.407 0.240 0.343 0.707 1.591 3.758 1.355 1.716
Email 0.085 -0.062 0.035 -0.143 0.138 -1.110 0.513 -0.474
Darker shading represents increasing absolute magnitude of coefficients within DV (coefficients with p > 0.05 omitted).
Green cells with black text are positive estimated coefficients, and orange cells with white text negative.
Table 10. Summary of Estimated Coefficients for Changes in Information Source Slant
Liberal Tercile Centrist Tercile Conservative Tercile Hyp. SupportReferrals Time Referrals Time Referrals Time
Facebook -0.069 -0.137 -0.158 0.384 0.207 H2a
Reddit -0.713 -0.599 H2b (cons)
Twitter -0.235 None
Search 0.184 0.269 0.076 -0.261 -0.416
Email -0.064 -0.144 0.423 0.247
Darker shading represents increasing absolute magnitude of coefficients (coefficients with p > 0.05 omitted).
Blue cells with white text are negative estimated coefficients (more liberal), red cells with black text are positive (more conservative).
had mixed associations with diversity with low magnitudes. Use of Facebook was associated with partisan shifts in slant,notably larger for conservatives than for liberals. Conversely,use of Reddit was associated with moderating shifts in slantfor conservatives.
The R2 values for partisan shift and cross-cutting models (allless than 1%) were much lower than those for diversity(ranging from 4% to 34%). Thus, while social mediaplatforms are associated with changes in each of thesemeasures, there is much less unexplained variation in diversityafter accounting for platform use. This further underscoresthe need to isolate and separately study the underlyingdimensions of information-limiting environments.
To demonstrate the magnitude of effects, we calculatedexample estimated effects by platform for a concurrentincrease in both referrals and time. These measures of usewere jointly estimated, and it is intuitive to imagine thatincreased referral activity from a platform corresponded withincreased time on the platform, and vice versa. Figure 4demonstrates the marginal change in information diversity andslant associated with a user who clicked on an additional sixreferrals to news sites from a platform and had a four-foldincrease in time spent on the platform (e.g., an increase from1 hour to 4 hours). Our measures are calculated per
individual by month, so this may be interpreted as a com-parison of a month when a user had significant use of aplatform to a month when that user had limited use of thatplatform. In a period when an average user has this type ofincrease on Facebook (6 more referrals and 4times more timespent), their standard deviation of slant would be 37% higher,moving from 6.5 to 9.0. If conservative, their mean slantwould have increased by 2.7; if liberal, it would havedecreased by 0.7.
To illustrate these effects in combination, we provide anexample in Figure 5 for a representative conservative userwith monthly news site visits that have a mean slant of 10 andstandard deviation of 6.5. For this user, a ±2 standard devia-tion range of online news consumption (e.g., -3 to 23) encom-passes both USA Today (-0.4) and the New York Post (21.5). In a month with 6 additional news referrals from and 4 timesmore time spent on Facebook than average, their consumptionwould shift to a more conservative mean, but also broaden. Their estimated range of ±2 standard deviations (-4.6 to 31.2)would increase by encompassing some additional newssources to the left, but even more to the right (almostincluding Fox News). If not for the rightward, partisan shiftin mean, the increase in diversity alone would have resultedin a range of -7.9 to 27.9 (thereby including CNN to the left). A similar example is also shown in Figure 5 for the combina-
1638 MIS Quarterly Vol. 44 No. 4/December 2020
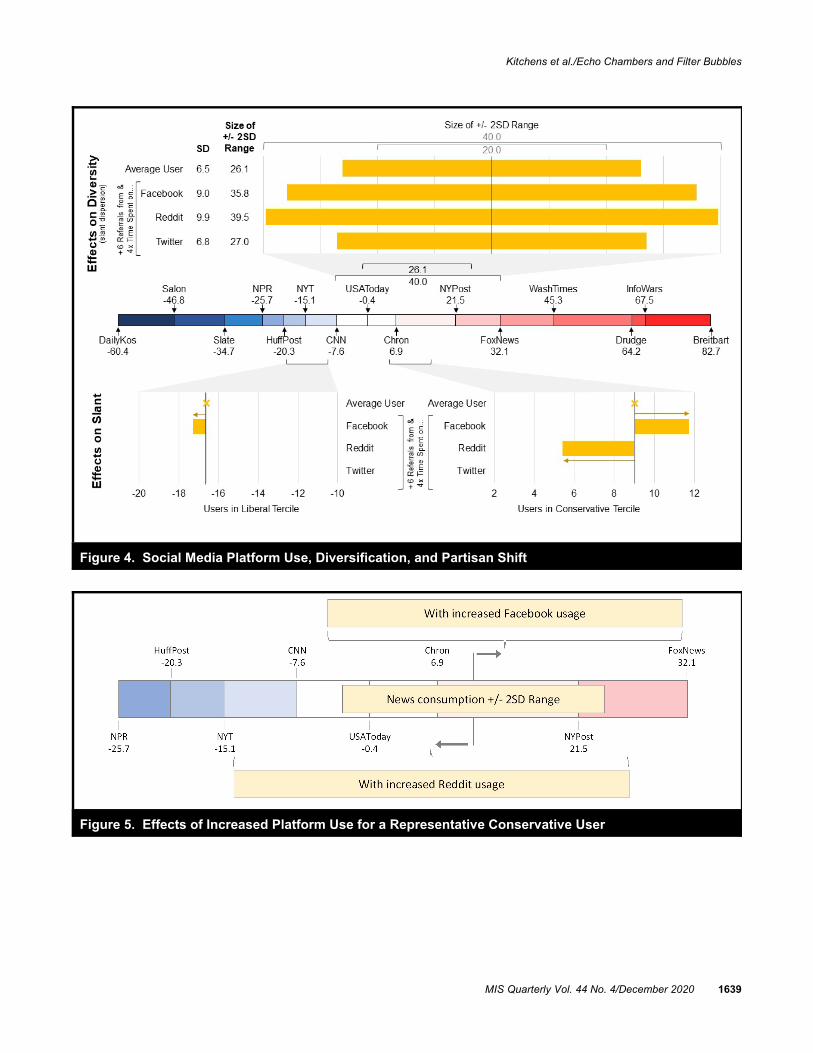
Kitchens et al./Echo Chambers and Filter Bubbles
Figure 4. Social Media Platform Use, Diversification, and Partisan Shift
Figure 5. Effects of Increased Platform Use for a Representative Conservative User
MIS Quarterly Vol. 44 No. 4/December 2020 1639

Kitchens et al./Echo Chambers and Filter Bubbles
tion of broadening diversity with a moderating shift associatedwith an increased use of Reddit. These stylized examplesdemonstrate that associations with diversity and slant differ inimportant ways by platform.
Implications for Conceptualizing EchoChambers and Filter Bubbles
We identify five contributions that this study makes to theconceptualization of echo chambers and filter bubbles. First,we adopt a generative framing of information-limiting envi-ronments as reflecting concerns raised in discussion of thesecaptivating, yet elusive, phenomena. By considering morenuanced ways that social media usage may shape informationconsumption, we highlight both the hopes and fears for onlinetechnology. On one hand, there is a widespread fear thathomophily and algorithmic filtering will amplify personalpreference for congenial, ideologically congruent content andfoster information-limiting environments that excludeopinion-challenging information (Pariser 2011; Sunstein2017). On the other, there is the hopeful potential for socialmedia and other information discovery platforms to expandindividuals’ information consumption by connecting themwith a broad range of relevant information sources. To ap-propriately address this tension, we move beyond a limiting,muddled question of whether information-limiting environ-ments exist to a more generative framing of how platformsinfluence information source consumption.
Second, by examining in detail the constituent elements ofdiversity and slant of information consumption we provide adeeper understanding of the phenomenon. There is a long-standing interest in understanding preferences for opinion-challenging versus opinion-confirming information (see Hartet al. 2009). This interest has often informed the under-standing of filter bubbles and echo chambers as beingmanifest in a binary outcome: the presence or absence ofcross-cutting content consumption (Bakshy et al. 2015; Mutzand Martin 2001). The joint consideration of diversity andslant provides a richer depiction of the variety of ways thatplatforms may help shape exposure, engagement, and con-sumption of information sources. Indeed, empirically we finda range of outcomes across both dimensions.
Third, we demonstrate the value of conceptualizing therelationship between platform use and information sourceconsumption at an individual-level, using panel data toidentify within-user effects. Prior research has often focusedon ideological segregation at a population-level by comparingthe distribution of information source consumption amongcategories of users (Gentzkow and Shapiro 2011). Forexample, conservative and liberal platform users prefer dif-
ferent online news sources (Flaxman et al. 2016; Jacobson etal. 2016). However, a cross-sectional observation of aggre-gated user preferences is insufficient to fully address howplatform usage shapes consumption. Relationships observedat a group level do not necessarily hold for individuals withinthe same groups (Freedman 1999); thus, individual-leveleffects are best understood by analyzing individual-level data. Our inquiry complements studies that focused on individual-level outcomes associated with usage of Facebook (Bakshy etal. 2015) and Twitter (Shore et al. 2018). We extend thisprior work further by concurrently analyzing individual-levelusage across multiple social media platforms. By consideringvariation in platform use and information source consumptionfor the same individual, we provide a more nuanced expli-cation of the differential effects of various platforms.
Fourth, incorporating a multifaceted view of diversity(Harrison and Klein 2007) provides additional insights intoinformation source consumption. Social media platforms areimportant pathways for individuals to discover new sources ofinformation, and ideological differences are just one form ofdifferentiation among information sources. In defining infor-mation source diversity in terms of separation, variety, anddisparity among information sources, we extend prior workthat focused on dominant ideological stance of an informationsource as a source of information diversity (Shore et al. 2018). The consistency of our results suggests there are additionalways to reliably conceptualize and measure informationsource diversity beyond political ideology, which may beparticularly useful for studying contexts where dominantideology of an information source is not evident or relevant.
Finally, our conceptual model illustrates the importance ofconsidering how the underlying characteristics of platformsmay each uniquely shape information consumption. Ourdifferentiation of usage by platform expands on prior workthat considered multiple platforms together, such as the com-bination of email plus multiple social media platforms as asingle technology category by Flaxman et al. (2016). We findwide variation in outcomes among the platforms that Flaxmanet al. aggregated together, thereby demonstrating the value ofconsidering them individually. By analyzing patterns ofresults across different platforms, we can make inferencesabout the impacts of individual features and mechanisms. Next, we present possibilities following this line of thought.
Implications of Mechanisms forDetermining Information Sources
The variation of results by platform provides some suggestiveevidence about the most salient factors shaping informationsource consumption. In comparing observed outcomes by
1640 MIS Quarterly Vol. 44 No. 4/December 2020

Kitchens et al./Echo Chambers and Filter Bubbles
Compared to
Direct Visits
Moderating
Shift
No
Change
Partisan
Shift
Narrowing
Diversity
No Change in
Diversity Twitter
Broadening
Diversity Search Reddit
Figure 6. Platform Use, Diversification, and Partisan Shift
platform (summarized in Figure 6) with how these platformsprioritize the content provided to users (identified in Figure 2and Table 2), we draw four broad inferences on the relativeimportance of social network homophily and variousapproaches to algorithmic filtering.
First, our findings provide insight about the potential role ofsocial influence in partisan shifts. On Facebook, as well asthe reference platform of email, the information sources a useris exposed to are strongly influenced by other individuals withwhom the user has a strong sense of social identification andaffiliation (e.g., friends, family, and coworkers). In contrast,social affiliation is somewhat less salient on Twitter (whereusers form nonreciprocal relationships) and Reddit (wherecontent is largely organized in topic-based communities). From this lens, a partisan shift is consistent with concerns thatplatforms may reinforce social influence within heterogenoussocial groups, and, thereby cause a hardening of partisanbeliefs (Sunstein 2002, 2009). In addition, Facebook andemail also both utilize some form of engagement-basedcuration—Facebook’s curated news feed and email’s prior-itized inbox—that could also contribute to a partisan shift(Pariser 2011).7
Second, for Reddit, as well as the reference platform ofsearch, algorithmic filtering is more heavily influenced by anindividual’s topics of interest than by their social network orprior engagement with content. A broadening effect here isconsistent with prior work arguing that, in the course of inter-actions on other topics, individuals experience an incidentalexposure to additional sources of news and information(Fletcher and Nielsen 2018a; Weeks et al. 2017).
Third, our results highlight trade-offs inherent in the study ofinformation source consumption. By isolating within-personvariation over time in both platform use and news site con-sumption, we are able to quantify variation among multiplesocial media platforms and draw inferences about the impactof platform characteristics in relation to consumptionbehaviors. Yet, our ability to draw inferences about indi-vidual characteristics and attitudes is limited. For example,we are unable to assess the impact of selective exposure dueto individual preference for opinion-confirming content(Festinger 1964; Hart et al. 2009). Further, the relativelysmall amount of variation in partisan shifts explained byplatform usage in our analyses suggests there are significantunobserved factors that shape consumption. Because nosingle study can capture all of the factors that influence con-sumption decisions, particularly when considering multipleplatform use by heterogeneous individuals, it is important tofurther develop the conceptualization of information-limitingenvironments in ways that can drive future empirical research,as well as help integrate and reconcile findings.
Finally, the variation in our results across platforms impliesthat rather than making broad-brush assertions about how theymay be information-limiting or information-expanding, morefocused attention should be paid to the range of individualfactors that determine how and to what extent platforms mayshape users’ choices. Further, our findings represent averageeffects for a typical platform user, not a universal outcome forall users. Platforms themselves are not monolithic; there maybe wide variation in how people use each platform as well aschanges in platform implementations over time. For example,the impact of using interest-oriented features such as Face-book pages (Jacobson et al. 2016; Skjerdal and Gebru 2020)may differ from using only the primary Facebook news feed. Thus, future research should take into account not only dif-ferences across platforms but also differences among users inhow they use those platforms.
7As noted, Twitter only implemented engagement-based feed curation in2016, after our data collection.
MIS Quarterly Vol. 44 No. 4/December 2020 1641

Kitchens et al./Echo Chambers and Filter Bubbles
Practical Implications
Our findings have implications for a practical understandingof information consumption. We find no support for aprevalence of the popular, intuitive understanding of echochambers and filter bubbles. Specifically, we find no evi-dence that the use of social media is limiting the informationsources that users choose to consume—instead, with respectto information diversity we find a range of outcomes fromeffectively neutral (no change) to positive (broadeningdiversity). Nonetheless, we do find important variationbetween platforms whose use was associated with moderatingshifts (Reddit) or partisan shifts (Facebook).
Of the platforms we consider, Facebook represents the mostcomplete embodiment of features that may impact users’ newsconsumption choices. It hosts user-generated content, sug-gests additions to users’ social networks, and provides severalcontent engagement options that influence the algorithmiccuration of information. Given the high level of personali-zation that Facebook deploys in determining what content toexpose users to, we reiterate calls for further study ofFacebook’s algorithmic filtering (Sunstein 2017; Vaidhyana-than 2018). Likewise, more research is needed to understandthe impacts of Twitter’s recent implementation of morecomprehensive algorithmic filtering. Yet, the study of thesefeatures is stymied by a lack of transparency of platformoperations. As platform providers are unlikely to unilaterallyprovide outside researchers with sufficient data on the imple-mentation and effects of algorithmic filtering, there is animportant role for public policy oversight of these influentialplatforms.
Limitations and Future Research
We acknowledge that our study has multiple limitationsrelated to the scope of the conceptual model, the scope of theempirical test, and the research method. First, our conceptualmodel focuses on individual and platform characteristics thatexplain variation between platforms. There are additionalcharacteristics, including level of interest in politics (Duboisand Blank 2018; Lawrence et al. 2010), reaction to contenttopics (Baldassarri and Bearman 2007), and intensity ofplatform use (Shore et al. 2018), that may help explain varia-tion among individual users of the same platform. Also, ourscope is limited with regard to platform characteristics. Tech-nology providers frequently update algorithms to determinethe most engaging and relevant information sources andcontent to present to users; more research is needed toencompass the full range of characteristics that influence thispresentation (Johnson et al. 2019). Likewise, our hypothesesare focused on information source consumption. More
research is also needed to understand the antecedents andconsequences of exposure, engagement, and consumption. For example, there is considerable research on opinionformation that could be expanded upon to examine how usageof social media relates to changes in opinions.
Second, the scope of empirical tests of our model is con-strained by available data. The majority of the pathways inour conceptual model are only observable at scale by platformproviders. For example, we could not observe the informationsources an individual was exposed to or engaged with on aplatform, nor other characteristics of those informationsources and their presentation. More research is needed tobetter understand how exposure and engagement relate to theinformation sources an individual chooses to consume.Likewise, we were unable to observe how individuals variedin their social networks and topic interests. Although thewithin-person research design strengthens the robustness ofour results, these individual characteristics may change overtime and may even be shaped by platform usage. For thesereasons and others, it is impossible to establish causalitywithin our research design. The associations we identify areinformative of the variation among platforms and illustrativeof the importance of nuance in measurement. But moreresearch is required to establish causal effects and establishthe mechanisms that influence these outcomes.
Third, there are numerous limitations related to our datasource and measurements. Our sample only included adultsresiding in the United States and may not be representative ofother populations. Another data limitation is that we onlyobserved desktop use of information discovery platforms andonline news sites. As discussed, we believe this still repre-sents an important portion of user activity, but particularly asmobile usage continues to replaces desktop use, additionalresearch is needed regarding how behavior on mobile devicesmay differ. Another key operationalization in our studyinvolved attributing a slant score to all content on a singlenews site domain. While we established that the news domainprovides a meaningful signal to the user, this is ultimately asimplification of the potential information value of that con-tent. Further, our measures of ideological diversity and newssource slant are most relevant in high media choice environ-ments with a dominant liberal, centrist, and conservativeideological configuration of public opinion; they may notgeneralize to other settings.
Conclusion
The question of how social media platforms shape the con-sumption of information and may foster the creation of
1642 MIS Quarterly Vol. 44 No. 4/December 2020

Kitchens et al./Echo Chambers and Filter Bubbles
information-limiting environments is crucial to society. Ourstudy provides a deeper conceptualization of this phenom-enon, supported by insights obtained through observation ofuser behaviors across various platforms in a natural environ-ment, interacting with their naturally occurring social network,without artificial intervention by researchers. As implied bythe complex variety in social media platforms, we foundconsiderable variation in observed impacts among them,which helps explain prior conflicting conclusions, but alsoleads to new unanswered questions. Based on our concep-tualization and findings, we see a strong need for futureresearch to focus on the nuance of how the details of platformimplementations and individual choices combine to influencea variety of outcomes that underlie the concerns that havebeen raised in the discussion of echo chambers and filterbubbles.
Acknowledgments
The authors would like to thank the McIntire School of CommerceFoundation and the McIntire School of Commerce’s Center forBusiness Analytics for their support as well as participants of theVirginia Research Seminar Series and the UMD Center for theAdvanced Study of Communities and Information for their valuablefeedback. The authors would also like to thank the senior editor,associate editor, and reviewers for their extremely helpful commentsand suggestions that greatly improved the quality of this work.
References
Adamic, L. A., and Glance, N. 2005. “The Political Blogosphereand the 2004 U.S. Election: Divided They Blog,” in Proceedingsof the 3rd International Workshop on Link Discovery, New York:ACM, pp. 36-43.
Allcott, H., and Gentzkow, M. 2017. “Social Media and Fake Newsin the 2016 Election,” Journal of Economic Perspectives (31:2),pp. 211-236.
Bail, C. A., Argyle, L. P., Brown, T. W., Bumpus, J. P., Chen, H.,Hunzaker, M. F., Lee, J., Mann, M., Merhout, F., andVolfovsky, A. 2018. “Exposure to Opposing Views on SocialMedia Can Increase Political Polarization,” Proceedings of theNational Academy of Sciences (115:37), pp. 9216-9221.
Bakos, J. Y. 1997. “Reducing Buyer Search Costs: Implicationsfor Electronic Marketplaces,” Management Science (43:12), pp.1676-1692.
Bakshy, E., Messing, S., and Adamic, L. A. 2015. “Exposure toIdeologically Diverse News and Opinion on Facebook,” Science(348:6239), pp. 1130-1132.
Baldassarri, D., and Bearman, P. 2007. “Dynamics of PoliticalPolarization,” American Sociological Review (72:5), pp.784-811.
Barberá, P. 2015. “Birds of the Same Feather Tweet Together: Bayesian Ideal Point Estimation Using Twitter Data,” PoliticalAnalysis (23:1), pp. 76-91.
Boxell, L., Gentzkow, M., and Shapiro, J. M. 2017. “GreaterInternet Use Is Not Associated with Faster Growth in Political
Polarization among US Demographic Groups,” Proceedings ofthe National Academy of Sciences (114:40), pp. 10612-10617.
Bozdag, E., and van den Hoven, J. 2015. “Breaking the FilterBubble: Democracy and Design,” Ethics and Information
Technology (17:4), pp. 249-265. Bright, J. 2018. “Explaining the Emergence of Political Frag-
mentation on Social Media: The Role of Ideology andExtremism,” Journal of Computer-Mediated Communication
(23:1), pp. 17-33.Burt, R. S. 1992. Structural Holes: The Social Structure of
Competition, Boston: Harvard University Press.Burton-Jones, A., Recker, J., Indulska, M., Green, P. F., and
Weber, R. 2017. “Assessing Representation Theory with aFramework for Pursuing Success and Failure,” MIS Quarterly
(41:4), pp. 1307-1333.Cooper, M. 2003. Media Ownership and Democracy in the Digital
Information Age, Center for Internet & Society, Stanford LawSchool.
Dubois, E., and Blank, G. 2018. “The Echo Chamber Is Over-stated: The Moderating Effect of Political Interest and Diverse
Media,” Information, Communication & Society (21:5), pp.729-745.
Festinger, L. 1964. Conflict, Decision, and Dissonance (Vol. 3),Stanford, CA: Stanford University Press.
Flaxman, S., Goel, S., and Rao, J. M. 2016. “Filter Bubbles, EchoChambers, and Online News Consumption,” Public Opinion
Quarterly (80:S1), pp. 298-320.Fletcher, R., and Nielsen, R. K. 2016. “Is Social Media Use
Associated with More or Less Diverse News Use?,” November25 (https://rasmuskleisnielsen.net/2016/11/25/is-social-media-
use-associated-with-more-or-less-diverse-news-use/; accessedMay 27, 2018).
Fletcher, R., and Nielsen, R. K. 2018a. “Are People IncidentallyExposed to News on Social Media? A Comparative Analysis,”
New Media & Society (20:7), pp. 2450-2468.Fletcher, R., and Nielsen, R. K. 2018b. “Automated Serendipity,”
Digital Journalism (6:8), pp. 976-989. Fortunato, S., Flammini, A., Menczer, F., and Vespignani, A. 2006.
“Topical Interests and the Mitigation of Search Engine Bias,”Proceedings of the National Academy of Sciences (103:34), pp.
12684-12689.Freedman, D. A. 1999. “Ecological Inference and the Ecological
Fallacy,” International Encyclopedia of the Social & BehavioralSciences (6), pp. 4027-4030.
Frey, D. 1986. “Recent Research on Selective Exposure to Infor-mation,” in Advances in Experimental Social Psychology (Vol.
19), L. Berkowitz (ed.), Cambridge, MA: Academic Press, pp.41-80.
Gabszewicz, J. J., Laussel, D., and Sonnac, N. 2002. “Press Adver-tising and the Political Differentiation of Newspapers,” Journal
of Public Economic Theory (4:3), pp. 317-334.Garrett, R. K. 2009. “Echo Chambers Online? Politically Moti-
vated Selective Exposure among Internet News Users,” Journalof Computer-Mediated Communication (14:2), pp. 265-285.
MIS Quarterly Vol. 44 No. 4/December 2020 1643

Kitchens et al./Echo Chambers and Filter Bubbles
Gentzkow, M., and Shapiro, J. M. 2011. “Ideological SegregationOnline and Offline,” The Quarterly Journal of Economics(126:4), pp. 1799-1839.
Goel, S., Mason, W., and Watts, D. J. 2010. “Real and PerceivedAttitude Agreement in Social Networks,” Journal of Personalityand Social Psychology (99:4), pp. 611-621.
Gray, P. H., and Cooper, W. H. 2010. “Pursuing Failure,” Organi-zational Research Methods (13:4), pp. 620-643.
Harrison, D. A., and Klein, K. J. 2007. “What’s the Difference?Diversity Constructs as Separation, Variety, or Disparity inOrganizations,” Academy of Management Review (32:4), pp.1199-1228.
Hart, W., Albarracín, D., Eagly, A. H., Brechan, I., Lindberg, M. J.,and Merrill, L. 2009. “Feeling Validated Versus Being Correct: A Meta-Analysis of Selective Exposure to Information,”Psychological Bulletin (135:4), pp. 555-588.
Herlocker, J. L., Konstan, J. A., Terveen, L. G., and Riedl, J. T. 2004. “Evaluating Collaborative Filtering RecommenderSystems,” ACM Transactions on Information Systems (22:1), pp.5-53.
Himelboim, I., McCreery, S., and Smith, M. 2013. “Birds of aFeather Tweet Together: Integrating Network and ContentAnalyses to Examine Cross-Ideology Exposure on Twitter,”Journal of Computer-Mediated Communication (18:2), pp.154-174.
Iyengar, S., Lelkes, Y., Levendusky, M., Malhotra, N., andWestwood, S. J. 2019. “The Origins and Consequences ofAffective Polarization in the United States,” Annual Review ofPolitical Science (22), pp. 129-146.
Jacobson, S., Myung, E., and Johnson, S. L. 2016. “Open Media orEcho Chamber: The Use of Links in Audience Discussions onthe Facebook Pages of Partisan News Organizations,” Infor-mation, Communication & Society (19:7), pp. 875-891.
Janis, I. L. 1982. Groupthink: Psychological Studies of PolicyDecisions and Fiascoes (Vol. 349), Boston: Houghton MifflinCompany.
Jehn, K. A., Northcraft, G. B., and Neale, M. A. 1999. “WhyDifferences Make a Difference: A Field Study of Diversity,Conflict and Performance in Workgroups,” AdministrativeScience Quarterly (44:4), pp. 741-763.
Johnson, S. L., Gray, P., and Sarker, S. 2019. “Revisiting ISResearch Practice in the Era of Big Data,” Information andOrganization (29:1), pp. 41-56.
Jürgens, P., and Stark, B. 2017. “The Power of Default on Reddit: A General Model to Measure the Influence of InformationIntermediaries: The Influence of Information Intermediaries,”Policy & Internet (9:4), pp. 395-419.
Jurkowitz, M., Mitchell, A., Shearer, E., and Walker, M. 2020. “U.S. Media Polarization and the 2020 Election: A NationDivided,” , January 24 (https://www.journalism.org/2020/01/24/u-s-media-polarization-and-the-2020-election-a-nation-divided/).
Kaminskas, M., and Bridge, D. 2016. “Diversity, Serendipity,Novelty, and Coverage: A Survey and Empirical Analysis ofBeyond-Accuracy Objectives in Recommender Systems,” ACMTransactions on Interactive Intelligent Systems (7:1), pp. 1-42.
Klapper, J. T. 1960. The Effects of Mass Communication, Glencoe,IL: Free Press.
Lawrence, E., Sides, J., and Farrell, H. 2010. “Self-Segregation orDeliberation? Blog Readership, Participation, and Polarizationin American Politics,” Perspectives on Politics (8:1), pp.141-157.
Lazer, D. 2015. “The Rise of the Social Algorithm,” Science(348:6239), pp. 1090-1091.
Lazer, D. M. J., Baum, M. A., Benkler, Y., Berinsky, A. J.,Greenhill, K. M., Menczer, F., Metzger, M. J., Nyhan, B.,Pennycook, G., Rothschild, D., Schudson, M., Sloman, S. A.,Sunstein, C. R., Thorson, E. A., Watts, D. J., and Zittrain, J. L. 2018. “The Science of Fake News,” Science (359:6380), pp.1094-1096.
Li, K. G., Mithas, S., Zhang, Z., and Tam, K. Y. 2019. “How DoesAlgorithmic Filtering Influence Attention Inequality on SocialMedia?,” in Proceedings of the 40th International Conference onInformation Systems, Munich.
Lin, M., Lucas Jr., H. C., and Shmueli, G. 2013. “ResearchCommentary—Too Big to Fail: Large Samples and the p-ValueProblem,” Information Systems Research (24:4), pp. 906-917.
McDonald, D., and Dimmick, J. 2003. “The Conceptualization andMeasurement of Diversity,” Communication Research (30:1), pp.60-79.
Messing, S., and Westwood, S. J. 2014. “Selective Exposure in theAge of Social Media: Endorsements Trump Partisan SourceAffiliation When Selecting News Online,” CommunicationResearch (41:8), pp. 1042-1063.
Mitchell, A., and Jurkowitz, D. 2014. “Social, Search & Direct: Pathways to Digital News,” Pew Research Center (https://www.journalism.org/2014/03/13/social-search-direct/).
Mutz, D. C. 2006. “How the Mass Media Divide Us,” in Red andBlue Nation? Characteristics and Causes of America’sPolarized Politics (Vol. 1), P. S. Nivola and D. W. Brady (eds.),Washington, DC: Brookings Institution Press.
Mutz, D. C., and Martin, P. S. 2001. “Facilitating Communicationacross Lines of Political Difference: The Role of Mass Media,”American Political Science Review (95:1), pp. 97-114.
Negroponte, N. 1996. Being Digital, New York: Vintage Books.Nickerson, R. S. 1998. “Confirmation Bias: A Ubiquitous
Phenomenon in Many Guises,” Review of General Psychology(2:2), pp. 175-220.
Page, S. E. 2010. Diversity and Complexity (Vol. 2), Princeton, NJ: Princeton University Press.
Pariser, E. 2011. The Filter Bubble: What the Internet Is Hidingfrom You, New York: Penguin Press.
Prawesh, S., and Padmanabhan, B. 2011. “The ‘Top N’ NewsRecommender: Count Distortion and Manipulation Resistance,”in Proceedings of the 5th ACM Conference on RecommenderSystems, New York: ACM, pp. 237-244.
Schkade, D., Sunstein, C. R., and Hastie, R. 2007. “What Hap-pened on Deliberation Day,” California Law Review (95), pp. 915-940.
Schmidt, A. L., Zollo, F., Vicario, M. D., Bessi, A., Scala, A.,Caldarelli, G., Stanley, H. E., and Quattrociocchi, W. 2017. “Anatomy of News Consumption on Facebook,” Proceedings ofthe National Academy of Sciences (114:12), pp. 3035-3039.
Shore, J., Baek, J., and Dellarocas, C. 2018. “Network Structureand Patterns of Information Diversity on Twitter,” MIS Quarterly(42:3), pp. 849-872.
1644 MIS Quarterly Vol. 44 No. 4/December 2020

Kitchens et al./Echo Chambers and Filter Bubbles
Skjerdal, T., and Gebru, S. 2020. “Not Quite an Echo Chamber:
Ethnic Debate on Ethiopian Facebook Pages during Times of
Unrest,” Media, Culture & Society (42:3), pp. 365-379.
Sohn, M.-W. 2001. “Distance and Cosine Measures of Niche
Overlap,” Social Networks (23:2), pp. 141-165.
Stroud, N. J. 2010. “Polarization and Partisan Selective Exposure,”
Journal of Communication (60:3), pp. 556-576.
Sunstein, C. R. 2001. Republic.com, Princeton, NJ: Princeton
University Press.
Sunstein, C. R. 2002. “The Law of Group Polarization,” Journal
of Political Philosophy (10:2), pp. 175-195.
Sunstein, C. R. 2009. Going to Extremes: How Like Minds Unite
and Divide, New York: Oxford University Press.
Sunstein, C. R. 2017. # Republic: Divided Democracy in the Age
of Social Media, Princeton, NJ: Princeton University Press.
Vaidhyanathan, S. 2018. Antisocial Media: How Facebook Dis-
connects Us and Undermines Democracy, New York: Oxford
University Press.
Van Alstyne, M., and Brynjolfsson, E. 1996. “Could the Internet
Balkanize Science?,” Science (274:5292), pp. 1479-1480.
Van Alstyne, M., and Brynjolfsson, E. 2005. “Global Village or
Cyber-Balkans? Modeling and Measuring the Integration of
Electronic Communities,” Management Science (51:6), pp.
851-868.
Walker, M. 2019. “Americans Favor Mobile Devices over Desk-
tops and Laptops for Getting News,” Pew Research Center,
November 19 (https://www.pewresearch.org/fact-tank/2019/
11/19/americans-favor-mobile-devices-over-desktops-and-
laptops-for-getting-news/).
Weeks, B. E., Lane, D. S., Kim, D. H., Lee, S. S., and Kwak, N.
2017. “Incidental Exposure, Selective Exposure, and Political
Information Sharing: Integrating Online Exposure Patterns and
Expression on Social Media,” Journal of Computer-Mediated
Communication (22:6), pp. 363-379.
Welch, M. J., Cho, J., and Olston, C. 2011. “Search Result Diver-
sity for Informational Queries,” in Proceedings of the 20th
International Conference on World Wide Web, pp. 237-246.
Wojcieszak, M. E., and Mutz, D. C. 2009. “Online Groups andPolitical Discourse: Do Online Discussion Spaces FacilitateExposure to Political Disagreement?,” Journal of Communication(59:1), pp. 40-56.
About the Authors
Brent Kitchens is an assistant professor at the University ofVirginia McIntire School of Commerce. He received his Ph.D. fromthe University of Florida Warrington College of BusinessAdministration. His research interests include analytics of onlineinteractions, with a focus on applications for societal good andpublic health. His research has been published at a variety ofoutlets, including MIS Quarterly, Information Systems Research,Journal of Management Information Systems, and IEEE Trans-actions on Knowledge and Data Engineering.
Steven L. Johnson is an associate professor at the McIntire Schoolof Commerce, University of Virginia. He received his Ph.D. fromthe Robert H. Smith School of Business, University of Maryland. His research interests include online communities and other socialmedia that support open innovation with an emphasis on networkanalysis. His research has appeared in outlets such as MISQuarterly, Organization Science, and Information SystemsResearch.
Peter Gray is a professor at the University of Virginia’s McIntireSchool of Commerce, where he teaches courses that connect ideasabout innovation, information technology, and strategic manage-ment. His research focuses on the collaborative impacts of socialmedia, organizational networks, virtual teams, and online com-munities. His research has been published in a range of leadingjournals, including MIS Quarterly, Information Systems Research,Management Science, Sloan Management Review, OrganizationalResearch Methods, California Management Review, the Journal ofManagement Information Systems, Information & Organization, theJournal of Strategic Information Systems, Information Technology& People, and others.
MIS Quarterly Vol. 44 No. 4/December 2020 1645

Kitchens et al./Echo Chambers and Filter Bubbles
Appendix
Shore et al. (2018) identified the slant of 186 news URLs, which we used as the basis for multiple measures in this paper. Unless otherwisenoted, we used the scores they identify as is. However, because their unit of analysis was a URL associated with a Twitter account, there werecertain necessary exceptions or deviations from their list as described in Table A1. First, a small number of the URLs they identified containedboth a domain and a path or page (e.g., buzzfeed.com/news). In order to cleanly identify direct versus other visits, for these sites we eitherremoved the path and used only the domain, or removed the entry from the list if the domain was already included on the list with a differentslant score. Another small subset of sites either functioned as more than just a news site (aol.com, reddit.com) or were simply a sub-site of aportal or social media outlet (facebook.com/cnsnewscom, news.yahoo.com). Again, in order to avoid bias and conflation in our measures, thesesites were omitted. All URLs not listed in Table A1 were included as is.
Table A1. Changes in URL Inclusion Compared to Shore et al. (2018)
URL Issue/Resolution
cnn.com/politics
Includes path. This entry omitted. Separate no-path entry retained.
huffingtonpost.com/black-voices/
huffingtonpost.com/politics
rollingstone.com/politics
wsj.com/opinion
buzzfeed.com/news
Includes path. This entry used with path removed.
cbc.ca/news/
nature.com/news
pbs.org/newshour
pewresearch.org/fact-tank
pjmedia.com/instapundit/
membership.politifact.com Includes nonrelevant subdomain. Entry used without subdomain.
aol.com General site containing more than news. Removed.
facebook.com/cnsnewscom Facebook page, not news site. Removed.
finance.yahoo.com
news.msn.com Subdomain of search/portal site. Removed.
news.yahoo.com
reddit.com Social media site. Removed from news site list
1646 MIS Quarterly Vol. 44 No. 4/December 2020

Kitchens et al./Echo Chambers and Filter Bubbles
Table A2. Correlations (1,092,480 User-Periods over 185,548 Users)
Dis
tin
ct
Ne
ws
Sit
es
Sla
nt
Dis
pe
rsio
n
Au
die
nc
e V
ari
ety
Re
ve
rse
Gin
i
Sla
nt
Cro
ss
-Cu
ttin
g
Dir
ec
t N
ew
s V
isit
s
Se
arc
h R
efe
rra
ls
Em
ail
Re
ferr
als
Fa
ce
bo
ok
Re
ferr
als
Re
dd
it R
efe
rra
ls
Tw
itte
r R
efe
rra
ls
Tim
e o
n S
ea
rch
Tim
e o
n E
ma
il
Tim
e o
n F
ac
eb
oo
k
Tim
e o
n R
ed
dit
Tim
e o
n T
wit
ter
Slant Dispersion 0.49
Audience Variety 0.50 0.62
Reverse Gini 0.64 0.46 0.78
Slant 0.07 0.29 0.05 0.06
Cross-Cutting 0.04 0.16 0.07 0.01 -0.06
Direct News Visits 0.30 0.07 0.09 0.21 0.09 -0.02
Search Referrals 0.52 0.19 0.24 0.33 0.00 0.01 0.15
Email Referrals 0.17 0.06 0.07 0.14 0.02 0.00 0.11 0.12
Facebook Referrals 0.36 0.18 0.15 0.24 0.04 0.01 0.10 0.15 0.13
Reddit Referrals 0.21 0.05 0.06 0.07 -0.02 -0.01 0.01 0.04 0.00 0.04
Twitter Referrals 0.17 0.04 0.04 0.08 0.00 0.00 0.06 0.09 0.07 0.11 0.02
Time on Search 0.18 0.11 0.14 0.15 0.01 0.02 0.04 0.18 0.10 0.06 0.00 0.02
Time on Email 0.12 0.09 0.11 0.12 0.02 0.02 0.04 0.08 0.17 0.05 0.00 0.01 0.60
Time on Facebook 0.13 0.14 0.13 0.12 0.02 0.05 0.00 0.05 0.01 0.25 0.01 0.02 0.08 0.06
Time on Reddit 0.14 0.05 0.06 0.06 -0.02 -0.01 0.00 0.02 0.00 0.02 0.54 0.01 0.00 -0.01 0.01
Time on Twitter 0.06 0.02 0.04 0.04 -0.01 0.00 0.00 0.04 0.00 0.02 0.01 0.20 0.02 0.00 0.06 0.02
Time Online 0.26 0.17 0.22 0.26 0.01 0.04 0.10 0.16 0.09 0.13 0.04 0.04 0.44 0.39 0.35 0.05 0.09
MIS Quarterly Vol. 44 No. 4/December 2020 1647

Kitchens et al./Echo Chambers and Filter Bubbles
Table A3. Summary Statistics for Users on Panel for at Least 365 Days Across all 4-Week User-PeriodsIncluding > 0 News Visits (1,092,480 User-Periods over 185,548 Users)
All Users
Liberal Tercile
(Users with all-time mean
slant < -10.45)
Centrist Tercile
(Users with all-time mean
slant b/w -10.45 and -3.16)
Conservative Tercile
(Users with all time mean
slant > -3.16)
Median Mean SD Median Mean SD Median Mean SD Median Mean SD
Distinct news sites 2 2.97 3.80 2 2.94 3.81 2 2.90 3.28 2 3.09 4.35
Diversity - Slant dispersion 1.02 6.53 10.46 0.79 5.07 7.93 1.30 5.55 8.75 0.98 9.24 13.66
Diversity - Audience variety 63.09 42.95 40.62 60.84 41.73 40.56 65.10 43.96 39.92 62.64 42.95 41.50
Diversity - Reverse Gini 6.30 19.66 23.35 3.48 19.59 23.65 10.00 19.78 22.56 3.67 19.59 23.98
Slant -7.58 -4.35 20.75 -16.03 -15.36 11.16 -7.58 -7.03 11.70 -0.44 10.12 27.59
Cross-cutting 0.00 8.59 23.78 0.00 3.87 14.32 N/A 0.00 23.97 35.76
Direct news visits 0 3.26 29.28 0 2.26 20.09 0 2.26 17.34 0 5.51 44.68
Search referrals 0 1.08 3.10 0 0.97 2.74 0 1.20 2.99 0 1.03 3.55
Email referrals 0 0.11 1.18 0 0.15 1.40 0 0.08 1.01 0 0.12 1.14
Facebook referrals 0 0.45 2.40 0 0.58 2.67 0 0.31 1.50 0 0.50 2.94
Reddit referrals 0 0.03 0.55 0 0.07 0.84 0 0.03 0.45 0 0.01 0.20
Twitter referrals 0 0.02 0.33 0 0.02 0.38 0 0.01 0.23 0 0.01 0.38
Time on search 1.56 4.19 10.36 1.36 3.61 9.48 1.81 4.59 10.87 1.49 4.29 10.56
Time on email 0.40 2.61 7.89 0.38 2.39 7.31 0.45 2.68 8.09 0.36 2.74 8.19
Time on Facebook 0.57 4.74 10.78 0.66 4.60 10.22 0.52 4.52 10.41 0.54 5.15 11.74
Time on Reddit 0.00 0.09 1.25 0.00 0.19 1.91 0.00 0.07 0.97 0.00 0.02 0.44
Time on Twitter 0.00 0.13 1.39 0.00 0.14 1.22 0.00 0.16 1.53 0.00 0.09 1.38
Time online 28.91 46.44 57.30 27.18 44.18 54.38 30.80 48.15 57.66 28.38 46.62 59.60
Measures per user
Age 33 36.94 15.35 32 35.69 15.08 33 36.16 14.84 37 38.98 15.91
Gender 51.55% male 47.39% male 53.60% male 53.65% male
1648 MIS Quarterly Vol. 44 No. 4/December 2020

Kitchens et al./Echo Chambers and Filter Bubbles
Figure A1. 95% CI Plots for Coefficients Estimated Using Random Subsamples
MIS Quarterly Vol. 44 No. 4/December 2020 1649

1650 MIS Quarterly Vol. 44 No. 4/December 2020