nd quarter 2019 earnings - s1.q4cdn.com · 8 2q revenue $772 $546 $226 (2.6)% good quarter for...
TRANSCRIPT

Co
pyri
gh
t ©
20
19
Th
e N
iels
en
Com
pa
ny (
US
), L
LC
. C
on
fid
en
tia
l a
nd
pro
pri
eta
ry. D
o n
ot d
istr
ibu
te.
NYSE: NLSN
2ND QUARTER 2019 EARNINGS Wednesday, July 31, 2019 | 8:00 am ET
Cop
yri
gh
t ©
20
19
Th
e N
iels
en
Com
pa
ny.
Co
nfid
en
tia
l a
nd
pro
pri
eta
ry.
2
FORWARD-LOOKING STATEMENTS
The following discussion contains forward-looking statements, including those about Nielsen’s outlook
and prospects, as such term is defined in the Private Securities Litigation Reform Act of 1995. Forward-
looking statements are those which are not historical facts. These and other statements that relate to
future results and events are based on Nielsen’s current expectations as of the date of this presentation.
Our actual results in future periods may differ materially from those currently expected because of a
number of risks and uncertainties. The risks and uncertainties that we believe are material include,
without limitation, those relating to the expected completion of our strategic review, general economic
conditions, conditions in the markets Nielsen is engaged in, behavior of customers, suppliers and
competitors, technological developments, as well as legal and regulatory rules affecting Nielsen’s
business and other specific risk factors that are outlined in our disclosure filings and materials, which you
can find on http://www.nielsen.com/investors, such as our most recent 10-K, 10-Q and 8-K reports that
have been filed with the Securities and Exchange Commission. Please consult these documents for a
more complete understanding of these risks and uncertainties. We disclaim any intention or obligation to
update or revise any forward-looking statements, whether as a result of new information, future events or
otherwise, except as may be required by law. Our outlook is provided for the purpose of providing
information about current expectations and targets. This information may not be appropriate for other
purposes.

Cop
yri
gh
t ©
20
19
Th
e N
iels
en
Com
pa
ny.
Co
nfid
en
tia
l a
nd
pro
pri
eta
ry.
3
DAVID KENNY CHIEF EXECUTIVE OFFICER

Cop
yri
gh
t ©
20
19
Th
e N
iels
en
Com
pa
ny.
Co
nfid
en
tia
l a
nd
pro
pri
eta
ry.
4
DAVE ANDERSON CHIEF FINANCIAL OFFICER
Cop
yri
gh
t ©
20
19
Th
e N
iels
en
Com
pa
ny.
Co
nfid
en
tia
l a
nd
pro
pri
eta
ry.
5
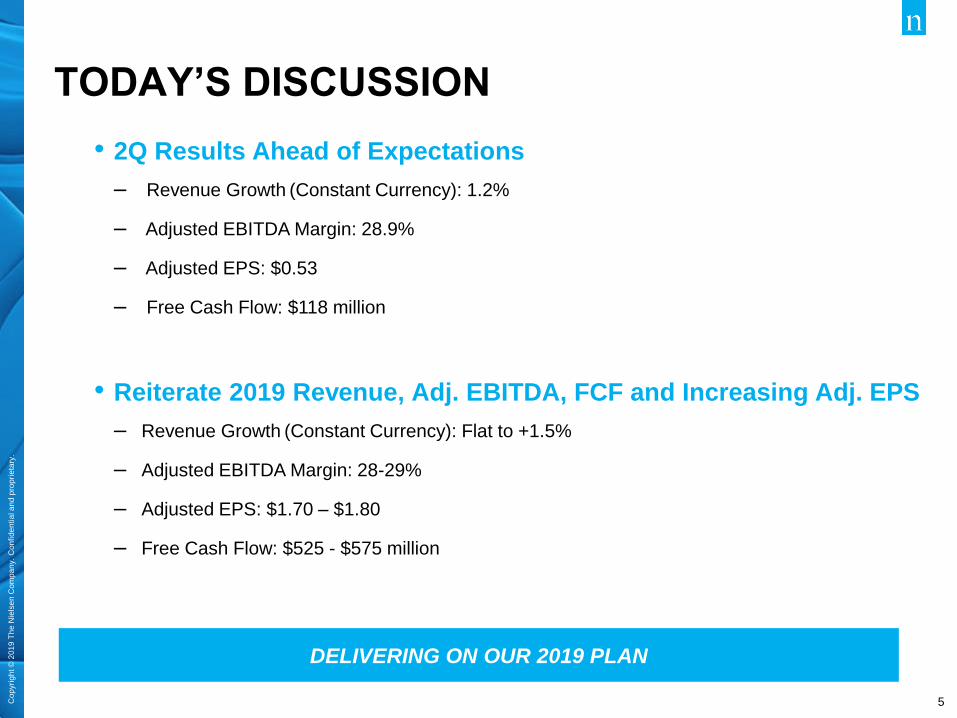
• 2Q Results Ahead of Expectations
– Revenue Growth (Constant Currency): 1.2%
– Adjusted EBITDA Margin: 28.9%
– Adjusted EPS: $0.53
– Free Cash Flow: $118 million
• Reiterate 2019 Revenue, Adj. EBITDA, FCF and Increasing Adj. EPS
– Revenue Growth (Constant Currency): Flat to +1.5%
– Adjusted EBITDA Margin: 28-29%
– Adjusted EPS: $1.70 – $1.80
– Free Cash Flow: $525 - $575 million
DELIVERING ON OUR 2019 PLAN
TODAY’S DISCUSSION
Cop
yri
gh
t ©
20
19
Th
e N
iels
en
Com
pa
ny.
Co
nfid
en
tia
l a
nd
pro
pri
eta
ry.
6
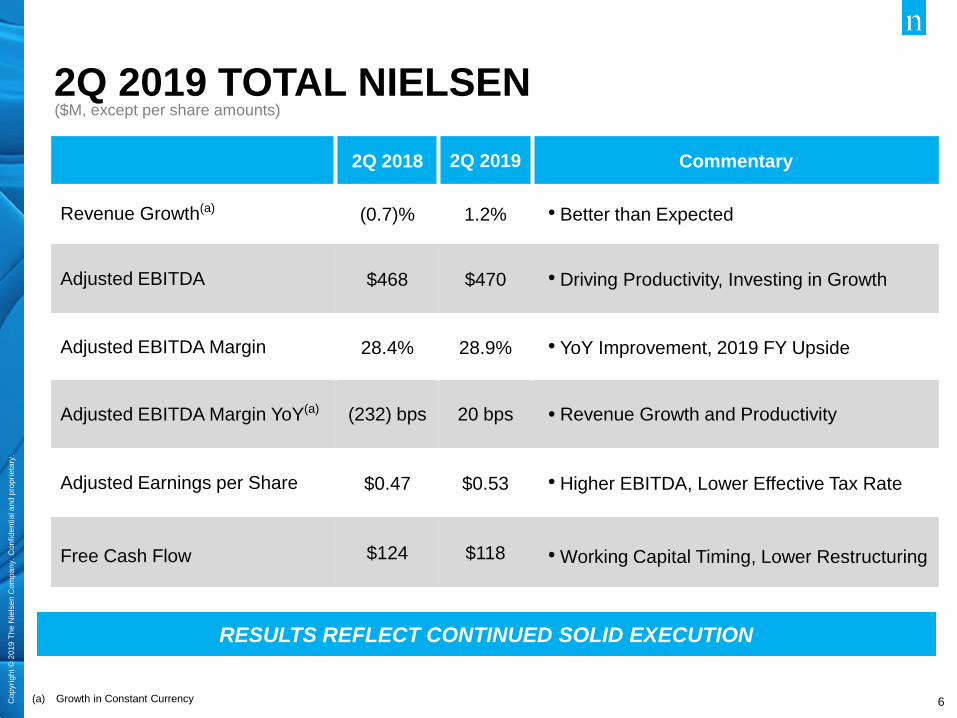
RESULTS REFLECT CONTINUED SOLID EXECUTION
2Q 2018 2Q 2019 Commentary
Revenue Growth(a) (0.7)% 1.2% • Better than Expected
Adjusted EBITDA $468 $470 • Driving Productivity, Investing in Growth
Adjusted EBITDA Margin 28.4% 28.9% • YoY Improvement, 2019 FY Upside
Adjusted EBITDA Margin YoY(a) (232) bps 20 bps • Revenue Growth and Productivity
Adjusted Earnings per Share $0.47 $0.53 • Higher EBITDA, Lower Effective Tax Rate
Free Cash Flow
$124 $118
• Working Capital Timing, Lower Restructuring
($M, except per share amounts)
2Q 2019 TOTAL NIELSEN
(a) Growth in Constant Currency
Cop
yri
gh
t ©
20
19
Th
e N
iels
en
Com
pa
ny.
Co
nfid
en
tia
l a
nd
pro
pri
eta
ry.
7
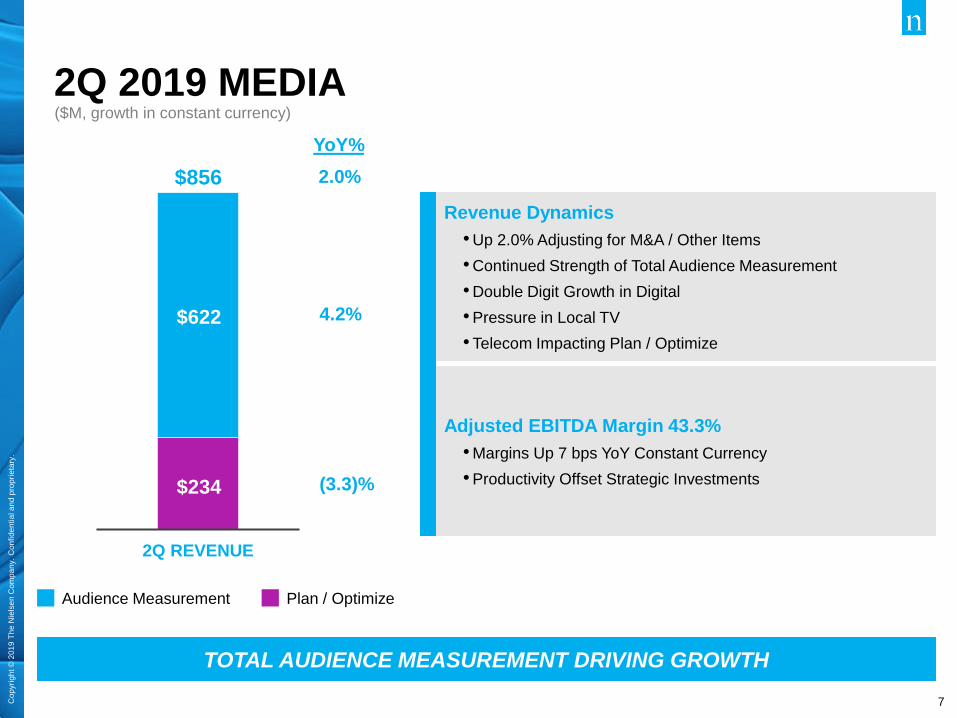
Revenue Dynamics
• Up 2.0% Adjusting for M&A / Other Items
• Continued Strength of Total Audience Measurement
• Double Digit Growth in Digital
• Pressure in Local TV
• Telecom Impacting Plan / Optimize
Adjusted EBITDA Margin 43.3%
• Margins Up 7 bps YoY Constant Currency
• Productivity Offset Strategic Investments
2Q REVENUE
$856
$234
$622
Audience Measurement Plan / Optimize
TOTAL AUDIENCE MEASUREMENT DRIVING GROWTH
(3.3)%
4.2%
YoY%
2.0%
($M, growth in constant currency)
2Q 2019 MEDIA
Cop
yri
gh
t ©
20
19
Th
e N
iels
en
Com
pa
ny.
Co
nfid
en
tia
l a
nd
pro
pri
eta
ry.
8
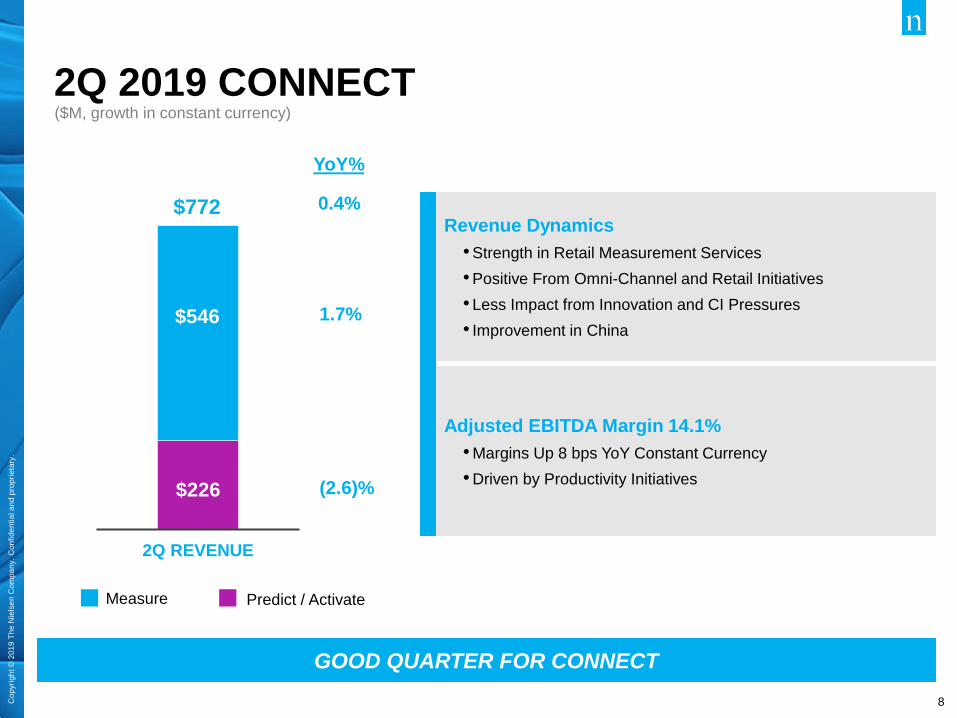
2Q REVENUE
$772
$546
$226
GOOD QUARTER FOR CONNECT
Predict / Activate Measure
Revenue Dynamics
• Strength in Retail Measurement Services
• Positive From Omni-Channel and Retail Initiatives
• Less Impact from Innovation and CI Pressures
• Improvement in China
Adjusted EBITDA Margin 14.1%
• Margins Up 8 bps YoY Constant Currency
• Driven by Productivity Initiatives (2.6)%
1.7%
YoY%
0.4%
2Q 2019 CONNECT ($M, growth in constant currency)
Cop
yri
gh
t ©
20
19
Th
e N
iels
en
Com
pa
ny.
Co
nfid
en
tia
l a
nd
pro
pri
eta
ry.
9
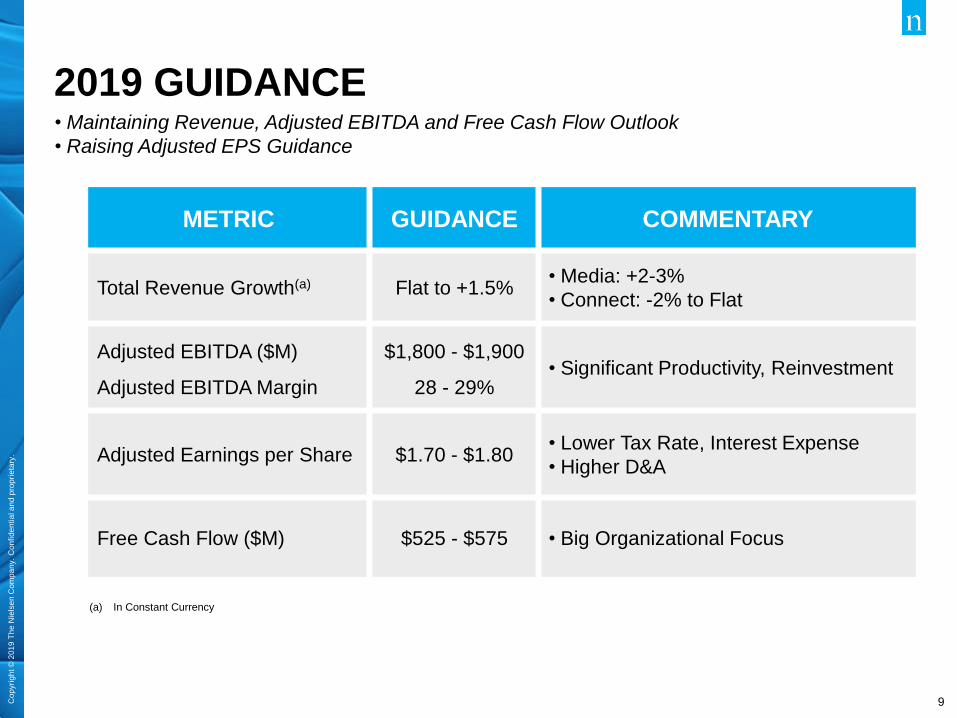
METRIC GUIDANCE COMMENTARY
Total Revenue Growth(a) Flat to +1.5% • Media: +2-3%
• Connect: -2% to Flat
Adjusted EBITDA ($M)
Adjusted EBITDA Margin
$1,800 - $1,900
28 - 29% • Significant Productivity, Reinvestment
Adjusted Earnings per Share $1.70 - $1.80 • Lower Tax Rate, Interest Expense
• Higher D&A
Free Cash Flow ($M) $525 - $575 • Big Organizational Focus
(a) In Constant Currency
2019 GUIDANCE • Maintaining Revenue, Adjusted EBITDA and Free Cash Flow Outlook
• Raising Adjusted EPS Guidance
Cop
yri
gh
t ©
20
19
Th
e N
iels
en
Com
pa
ny.
Co
nfid
en
tia
l a
nd
pro
pri
eta
ry.
10
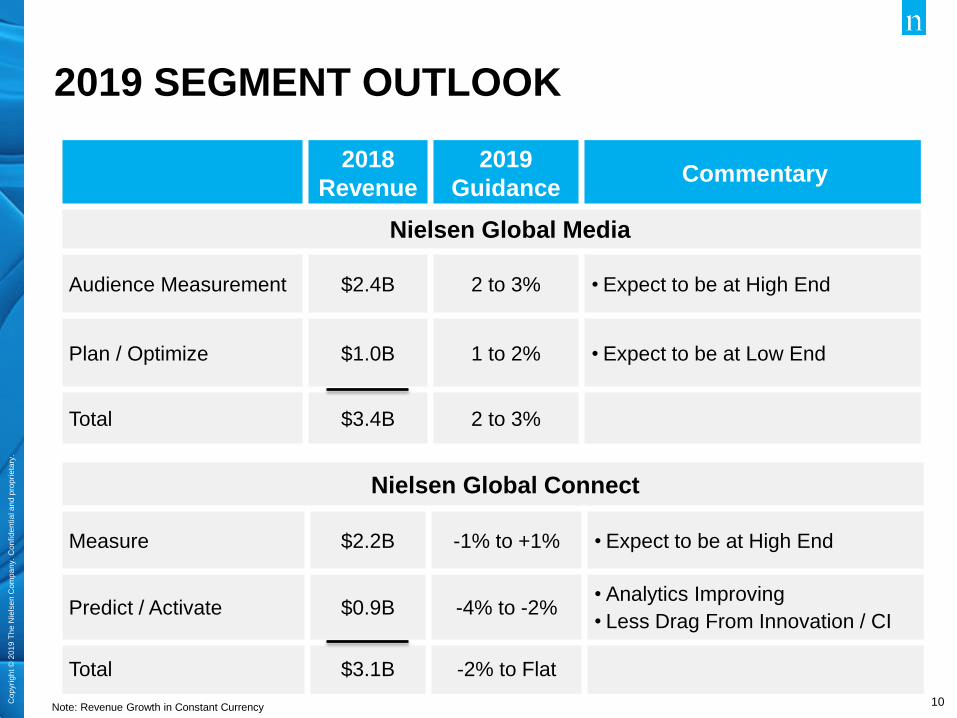
2018
Revenue
2019
Guidance Commentary
Nielsen Global Media
Audience Measurement $2.4B 2 to 3% • Expect to be at High End
Plan / Optimize $1.0B 1 to 2% • Expect to be at Low End
Total $3.4B 2 to 3%
Nielsen Global Connect
Measure $2.2B -1% to +1% • Expect to be at High End
Predict / Activate $0.9B -4% to -2% • Analytics Improving
• Less Drag From Innovation / CI
Total $3.1B -2% to Flat
2019 SEGMENT OUTLOOK
Note: Revenue Growth in Constant Currency
Cop
yri
gh
t ©
20
19
Th
e N
iels
en
Com
pa
ny.
Co
nfid
en
tia
l a
nd
pro
pri
eta
ry.
11
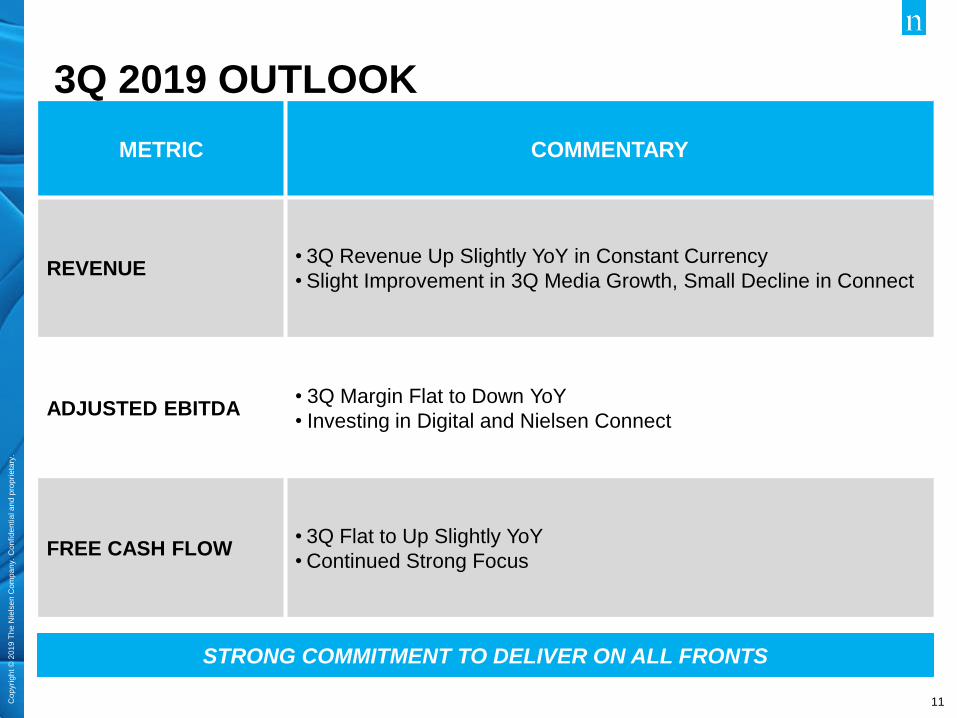
STRONG COMMITMENT TO DELIVER ON ALL FRONTS
METRIC COMMENTARY
REVENUE • 3Q Revenue Up Slightly YoY in Constant Currency
• Slight Improvement in 3Q Media Growth, Small Decline in Connect
ADJUSTED EBITDA • 3Q Margin Flat to Down YoY
• Investing in Digital and Nielsen Connect
FREE CASH FLOW • 3Q Flat to Up Slightly YoY
• Continued Strong Focus
3Q 2019 OUTLOOK

Cop
yri
gh
t ©
20
19
Th
e N
iels
en
Com
pa
ny.
Co
nfid
en
tia
l a
nd
pro
pri
eta
ry.
12
DAVID KENNY CHIEF EXECUTIVE OFFICER
Cop
yri
gh
t ©
20
19
Th
e N
iels
en
Com
pa
ny.
Co
nfid
en
tia
l a
nd
pro
pri
eta
ry.
13
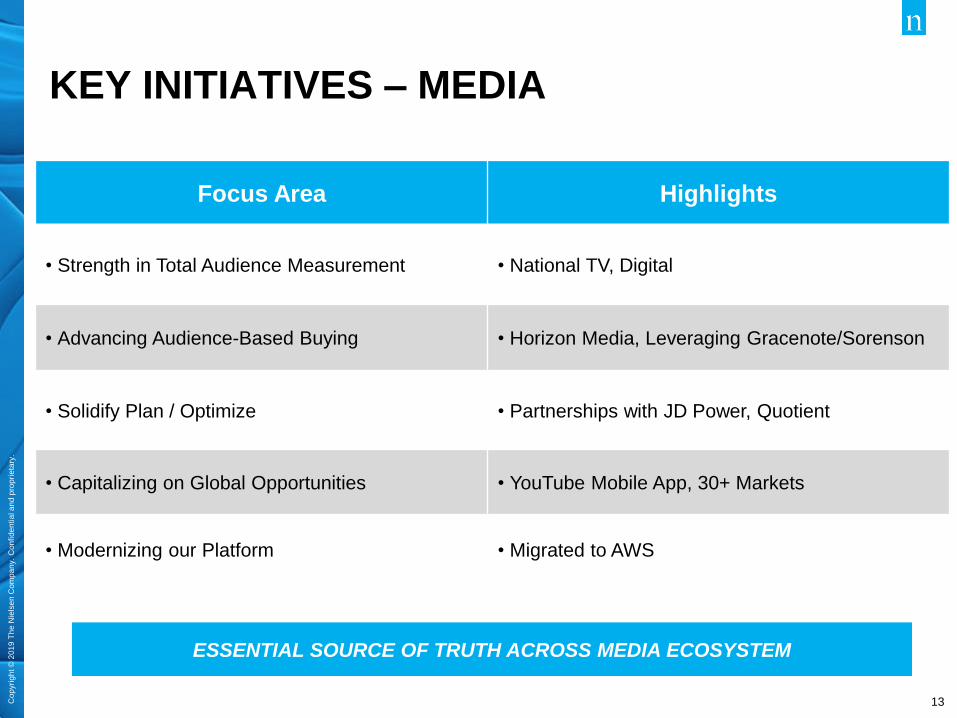
KEY INITIATIVES – MEDIA
Focus Area Highlights
• Strength in Total Audience Measurement
• National TV, Digital
• Advancing Audience-Based Buying • Horizon Media, Leveraging Gracenote/Sorenson
• Solidify Plan / Optimize
• Partnerships with JD Power, Quotient
• Capitalizing on Global Opportunities • YouTube Mobile App, 30+ Markets
• Modernizing our Platform
• Migrated to AWS
ESSENTIAL SOURCE OF TRUTH ACROSS MEDIA ECOSYSTEM
Cop
yri
gh
t ©
20
19
Th
e N
iels
en
Com
pa
ny.
Co
nfid
en
tia
l a
nd
pro
pri
eta
ry.
14
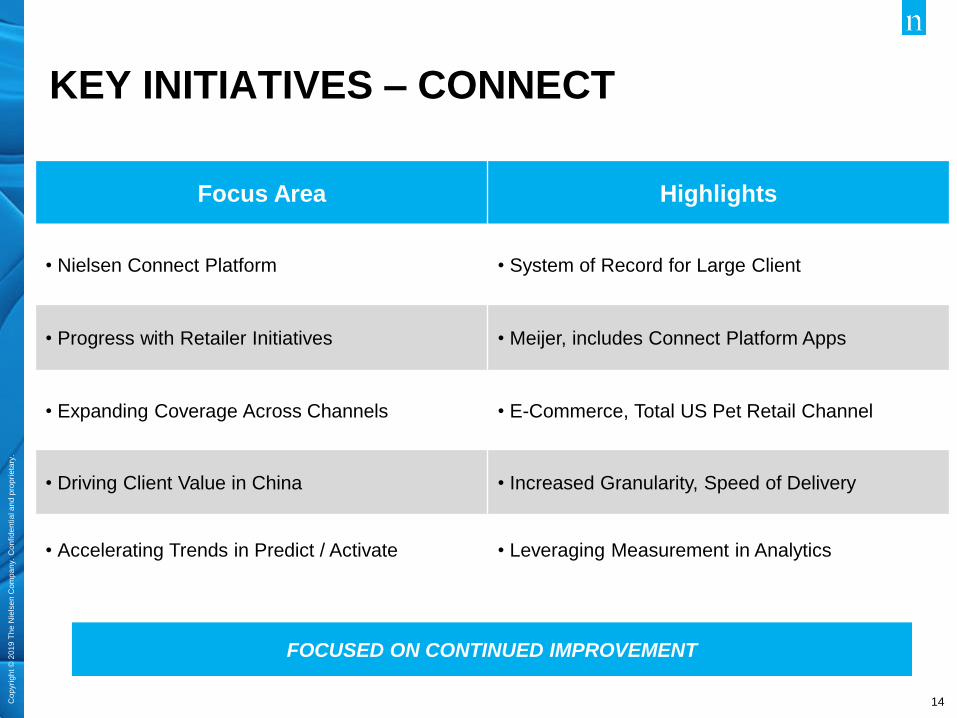
KEY INITIATIVES – CONNECT
Focus Area Highlights
• Nielsen Connect Platform
• System of Record for Large Client
• Progress with Retailer Initiatives • Meijer, includes Connect Platform Apps
• Expanding Coverage Across Channels
• E-Commerce, Total US Pet Retail Channel
• Driving Client Value in China • Increased Granularity, Speed of Delivery
• Accelerating Trends in Predict / Activate
• Leveraging Measurement in Analytics
FOCUSED ON CONTINUED IMPROVEMENT

Cop
yri
gh
t ©
20
19
Th
e N
iels
en
Com
pa
ny.
Co
nfid
en
tia
l a
nd
pro
pri
eta
ry.
15
Q&A
Cop
yri
gh
t ©
20
19
Th
e N
iels
en
Com
pa
ny.
Co
nfid
en
tia
l a
nd
pro
pri
eta
ry.
16
APPENDIX
Cop
yri
gh
t ©
20
19
Th
e N
iels
en
Com
pa
ny.
Co
nfid
en
tia
l a
nd
pro
pri
eta
ry.
17
CERTAIN NON-GAAP MEASURES Overview of Non-GAAP Presentations
The Company uses the non-GAAP financial measures discussed below to evaluate its results of operations, financial condition,
liquidity and indebtedness. The Company believes that the presentation of these non-GAAP measures provides useful
information to investors regarding financial and business trends related to our results of operations, cash flows and indebtedness
and that when this non-GAAP financial information is viewed with our GAAP financial information, investors are provided with
valuable supplemental information regarding our results of operations, thereby facilitating period-to-period comparisons of our
business performance. These non-GAAP measures are also consistent with how management evaluates the Company’s
operating performance and liquidity. In addition, these non-GAAP measures address questions the Company routinely receives
from analysts and investors and, in order to assure that all investors have access to similar data, the Company has determined
that it is appropriate to make this data available to all investors. None of the non-GAAP measures presented should be
considered as an alternative to net income or loss, operating income or loss, cash flows from operating activities, total
indebtedness or any other measures of operating performance and financial condition, liquidity or indebtedness derived in
accordance with GAAP. These non-GAAP measures have important limitations as analytical tools and should not be considered
in isolation or as substitutes for an analysis of our results as reported under GAAP. Our use of these terms may vary from the use
of similarly-titled measures by others in our industry due to the potential inconsistencies in the method of calculation and
differences due to items subject to interpretation.
Constant Currency Presentation
The Company evaluates its results of operations on both an as reported and a constant currency basis. The constant currency
presentation, which is a non-GAAP measure, excludes the impact of fluctuations in foreign currency exchange rates. The
Company believes providing constant currency information provides valuable supplemental information regarding our results of
operations, thereby facilitating period-to-period comparisons of our business performance and is consistent with how
management evaluates the Company’s performance. We calculate constant currency percentages by converting our prior-period
local currency financial results using the current period exchange rates and comparing these adjusted amounts to our current
period reported results. No adjustment has been made to foreign currency exchange transaction gains or losses in the
calculation of constant currency net income.
Organic Constant Currency Presentation
The Company defines organic constant currency revenue as constant currency revenue excluding the net effect of business
acquisitions and divestitures over the past twelve months. Refer to the Constant Currency Presentation section above for the
definition of constant currency. The Company believes that this measure is useful to investors and management in understanding
our ongoing operations and in analysis of ongoing operating trends.
Cop
yri
gh
t ©
20
19
Th
e N
iels
en
Com
pa
ny.
Co
nfid
en
tia
l a
nd
pro
pri
eta
ry.
18
CERTAIN NON-GAAP MEASURES
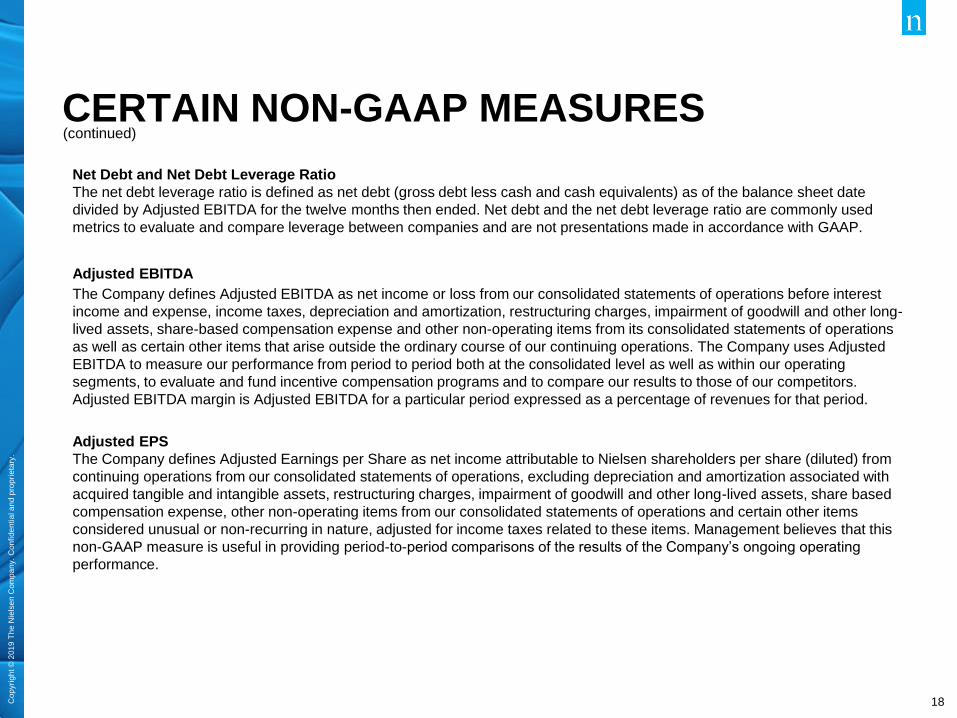
Net Debt and Net Debt Leverage Ratio
The net debt leverage ratio is defined as net debt (gross debt less cash and cash equivalents) as of the balance sheet date
divided by Adjusted EBITDA for the twelve months then ended. Net debt and the net debt leverage ratio are commonly used
metrics to evaluate and compare leverage between companies and are not presentations made in accordance with GAAP.
Adjusted EBITDA
The Company defines Adjusted EBITDA as net income or loss from our consolidated statements of operations before interest
income and expense, income taxes, depreciation and amortization, restructuring charges, impairment of goodwill and other long-
lived assets, share-based compensation expense and other non-operating items from its consolidated statements of operations
as well as certain other items that arise outside the ordinary course of our continuing operations. The Company uses Adjusted
EBITDA to measure our performance from period to period both at the consolidated level as well as within our operating
segments, to evaluate and fund incentive compensation programs and to compare our results to those of our competitors.
Adjusted EBITDA margin is Adjusted EBITDA for a particular period expressed as a percentage of revenues for that period.
Adjusted EPS
The Company defines Adjusted Earnings per Share as net income attributable to Nielsen shareholders per share (diluted) from
continuing operations from our consolidated statements of operations, excluding depreciation and amortization associated with
acquired tangible and intangible assets, restructuring charges, impairment of goodwill and other long-lived assets, share based
compensation expense, other non-operating items from our consolidated statements of operations and certain other items
considered unusual or non-recurring in nature, adjusted for income taxes related to these items. Management believes that this
non-GAAP measure is useful in providing period-to-period comparisons of the results of the Company’s ongoing operating
performance.
(continued)
Cop
yri
gh
t ©
20
19
Th
e N
iels
en
Com
pa
ny.
Co
nfid
en
tia
l a
nd
pro
pri
eta
ry.
19
CERTAIN NON-GAAP MEASURES
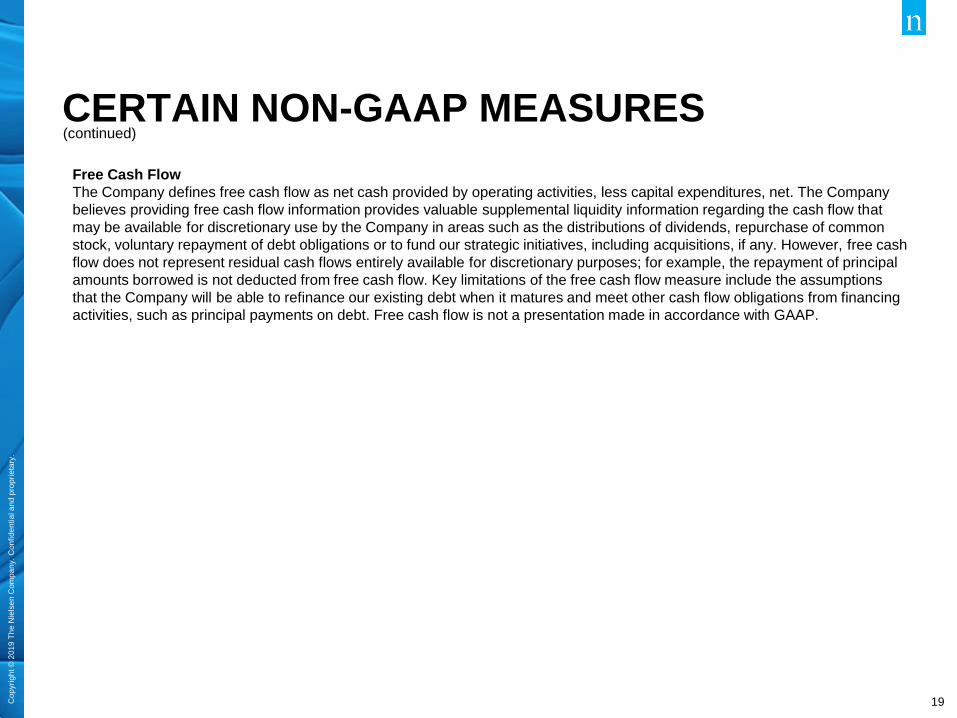
Free Cash Flow
The Company defines free cash flow as net cash provided by operating activities, less capital expenditures, net. The Company
believes providing free cash flow information provides valuable supplemental liquidity information regarding the cash flow that
may be available for discretionary use by the Company in areas such as the distributions of dividends, repurchase of common
stock, voluntary repayment of debt obligations or to fund our strategic initiatives, including acquisitions, if any. However, free cash
flow does not represent residual cash flows entirely available for discretionary purposes; for example, the repayment of principal
amounts borrowed is not deducted from free cash flow. Key limitations of the free cash flow measure include the assumptions
that the Company will be able to refinance our existing debt when it matures and meet other cash flow obligations from financing
activities, such as principal payments on debt. Free cash flow is not a presentation made in accordance with GAAP.
(continued)
Cop
yri
gh
t ©
20
19
Th
e N
iels
en
Com
pa
ny.
Co
nfid
en
tia
l a
nd
pro
pri
eta
ry.
20
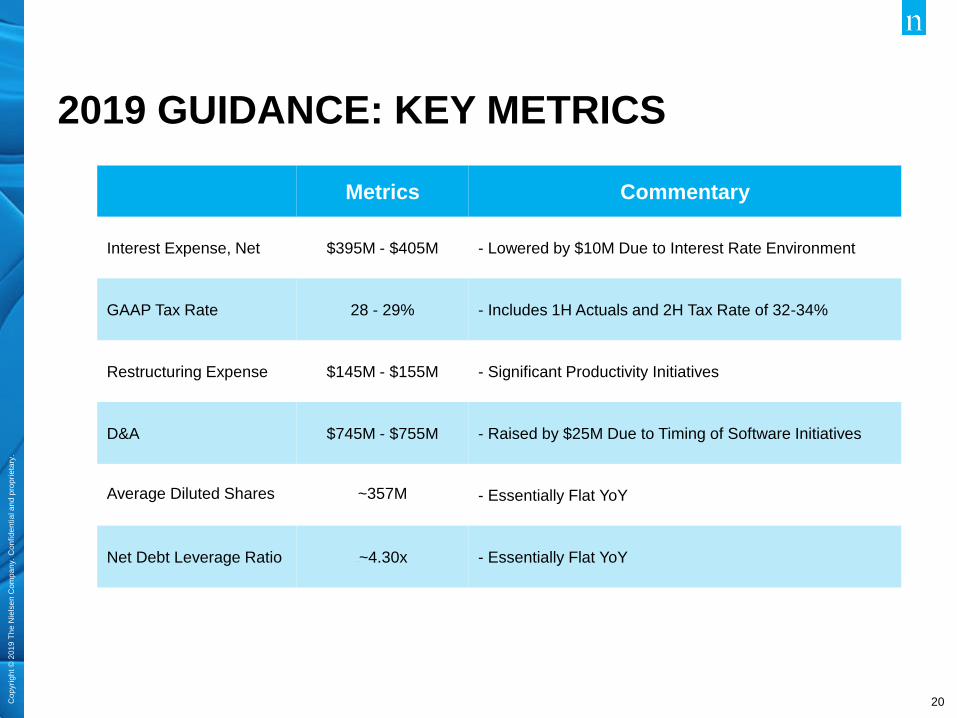
2019 GUIDANCE: KEY METRICS
Metrics Commentary
Interest Expense, Net $395M - $405M - Lowered by $10M Due to Interest Rate Environment
GAAP Tax Rate 28 - 29% - Includes 1H Actuals and 2H Tax Rate of 32-34%
Restructuring Expense $145M - $155M - Significant Productivity Initiatives
D&A $745M - $755M - Raised by $25M Due to Timing of Software Initiatives
Average Diluted Shares ~357M - Essentially Flat YoY
Net Debt Leverage Ratio -~4.30x - Essentially Flat YoY

Cop
yri
gh
t ©
20
19
Th
e N
iels
en
Com
pa
ny.
Co
nfid
en
tia
l a
nd
pro
pri
eta
ry.
21
-330
-240
-60
30
-150
-240
-160
-20
90
-80
1Q19 2Q19 3Q19E 4Q19E FY19E
Rev (bps) EBITDA (bps)
FOREIGN CURRENCY IMPACT
(a) Projected impact assumes rates in effect at 07/23/19 remain in effect for the balance of 2019.
Note: We report on a constant currency basis to reflect operating performance
58%
11%
3% 3% 3%
22%
USD EUR CAD GBP CNY Other
CURRENCY PROFILE - REVENUE PROJECTED FX IMPACT(a):
REPORTED VS CONSTANT CURRENCY
Cop
yri
gh
t ©
20
19
Th
e N
iels
en
Com
pa
ny.
Co
nfid
en
tia
l a
nd
pro
pri
eta
ry.
22
ADJUSTED EBITDA RECONCILIATION
Quarter Ended June 30
2018 2019
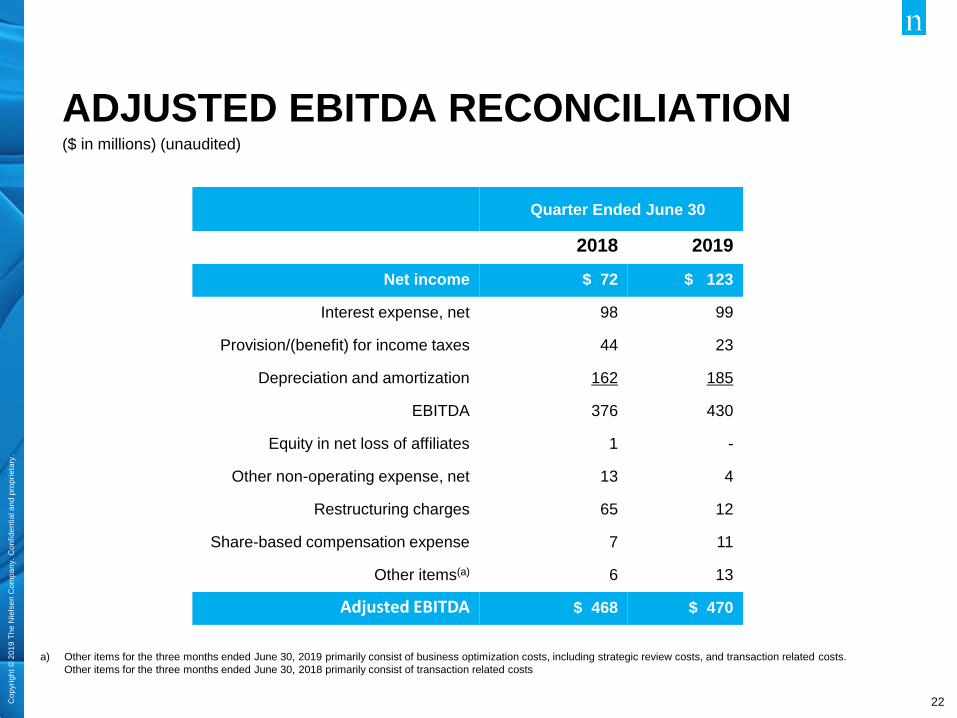
Net income $ 72 $ 123
Interest expense, net 98 99
Provision/(benefit) for income taxes 44 23
Depreciation and amortization 162 185
EBITDA 376 430
Equity in net loss of affiliates 1 -
Other non-operating expense, net 13 4
Restructuring charges 65 12
Share-based compensation expense 7 11
Other items(a) 6 13
Adjusted EBITDA $ 468 $ 470
($ in millions) (unaudited)
a) Other items for the three months ended June 30, 2019 primarily consist of business optimization costs, including strategic review costs, and transaction related costs.
Other items for the three months ended June 30, 2018 primarily consist of transaction related costs
Cop
yri
gh
t ©
20
19
Th
e N
iels
en
Com
pa
ny.
Co
nfid
en
tia
l a
nd
pro
pri
eta
ry.
23
Operating
Income
Restructuring
Charges
Depreciation
and
Amortization
Share-Based
Compensation
Expense
Other
Items(a)
Adjusted
EBITDA
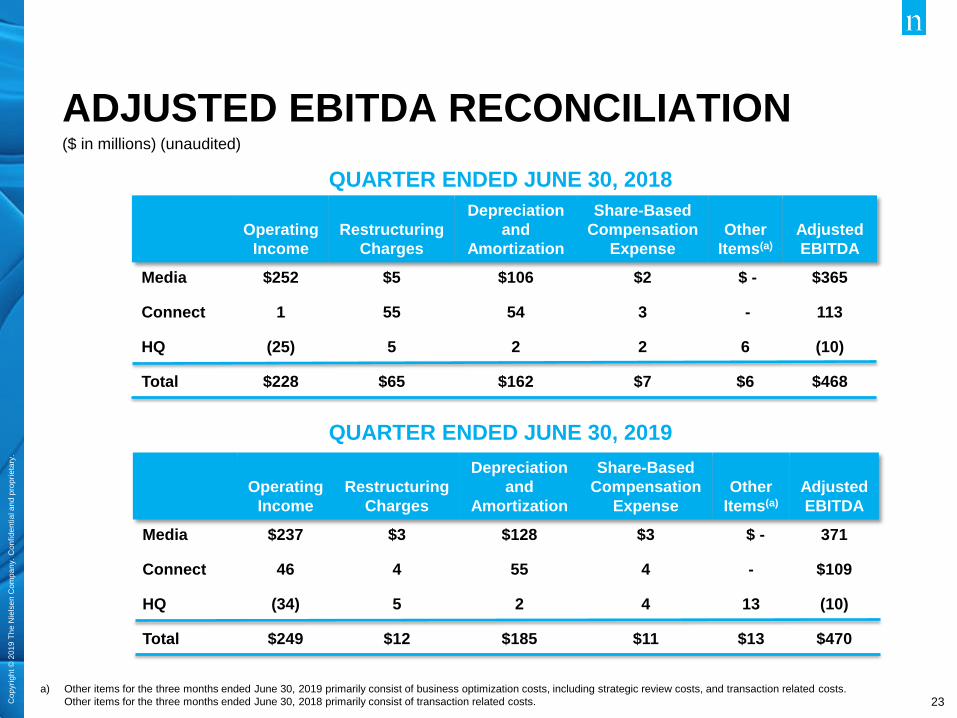
Media $237 $3 $128 $3 $ - 371
Connect 46 4 55 4 - $109
HQ (34) 5 2 4 13 (10)
Total $249 $12 $185 $11 $13 $470
Operating
Income
Restructuring
Charges
Depreciation
and
Amortization
Share-Based
Compensation
Expense
Other
Items(a)
Adjusted
EBITDA
Media $252 $5 $106 $2 $ - $365
Connect 1 55 54 3 - 113
HQ (25) 5 2 2 6 (10)
Total $228 $65 $162 $7 $6 $468
ADJUSTED EBITDA RECONCILIATION ($ in millions) (unaudited)
QUARTER ENDED JUNE 30, 2018
QUARTER ENDED JUNE 30, 2019
a) Other items for the three months ended June 30, 2019 primarily consist of business optimization costs, including strategic review costs, and transaction related costs.
Other items for the three months ended June 30, 2018 primarily consist of transaction related costs.
Cop
yri
gh
t ©
20
19
Th
e N
iels
en
Com
pa
ny.
Co
nfid
en
tia
l a
nd
pro
pri
eta
ry.
24
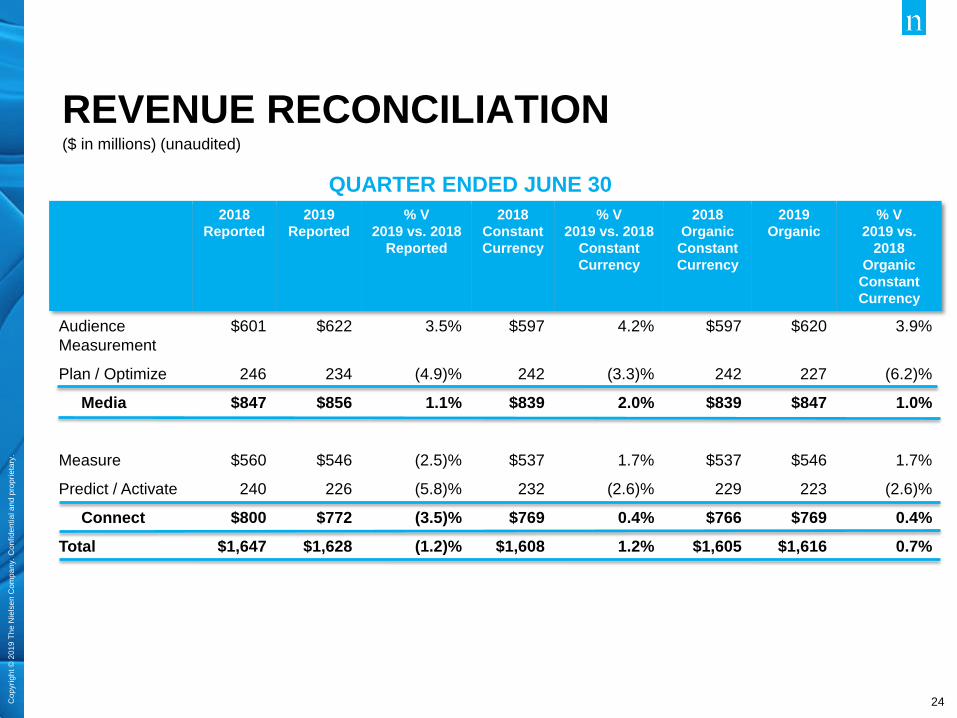
REVENUE RECONCILIATION ($ in millions) (unaudited)
2018
Reported
2019
Reported
% V
2019 vs. 2018
Reported
2018
Constant
Currency
% V
2019 vs. 2018
Constant
Currency
2018
Organic
Constant
Currency
2019
Organic
% V
2019 vs.
2018
Organic
Constant
Currency
Audience
Measurement
$601 $622 3.5% $597 4.2% $597 $620 3.9%
Plan / Optimize 246 234 (4.9)% 242 (3.3)% 242 227 (6.2)%
Media $847 $856 1.1% $839 2.0% $839 $847 1.0%
Measure $560 $546 (2.5)% $537 1.7% $537 $546 1.7%
Predict / Activate 240 226 (5.8)% 232 (2.6)% 229 223 (2.6)%
Connect $800 $772 (3.5)% $769 0.4% $766 $769 0.4%
Total $1,647 $1,628 (1.2)% $1,608 1.2% $1,605 $1,616 0.7%
QUARTER ENDED JUNE 30
Cop
yri
gh
t ©
20
19
Th
e N
iels
en
Com
pa
ny.
Co
nfid
en
tia
l a
nd
pro
pri
eta
ry.
25
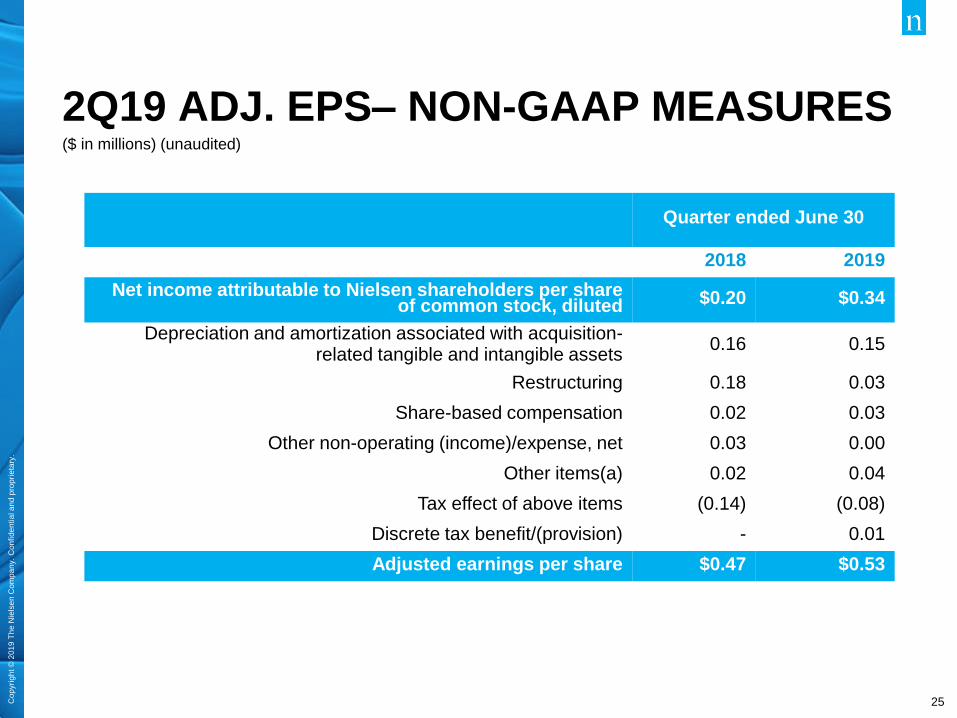
2Q19 ADJ. EPS– NON-GAAP MEASURES ($ in millions) (unaudited)
Quarter ended June 30
2018 2019
Net income attributable to Nielsen shareholders per share of common stock, diluted $0.20 $0.34
Depreciation and amortization associated with acquisition- related tangible and intangible assets
0.16 0.15
Restructuring 0.18 0.03
Share-based compensation 0.02 0.03
Other non-operating (income)/expense, net 0.03 0.00
Other items(a) 0.02 0.04
Tax effect of above items (0.14) (0.08)
Discrete tax benefit/(provision) - 0.01
Adjusted earnings per share $0.47 $0.53
Cop
yri
gh
t ©
20
19
Th
e N
iels
en
Com
pa
ny.
Co
nfid
en
tia
l a
nd
pro
pri
eta
ry.
26
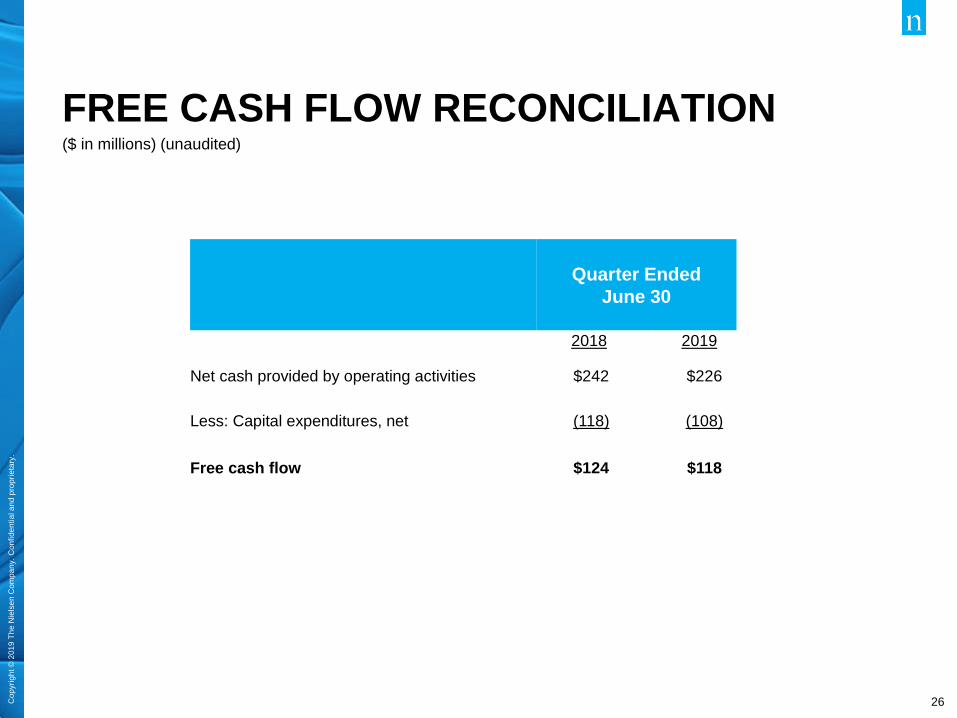
FREE CASH FLOW RECONCILIATION ($ in millions) (unaudited)
Quarter Ended
June 30
2018 2019
Net cash provided by operating activities $242 $226
Less: Capital expenditures, net
(118) (108)
Free cash flow $124 $118
Cop
yri
gh
t ©
20
19
Th
e N
iels
en
Com
pa
ny.
Co
nfid
en
tia
l a
nd
pro
pri
eta
ry.
27
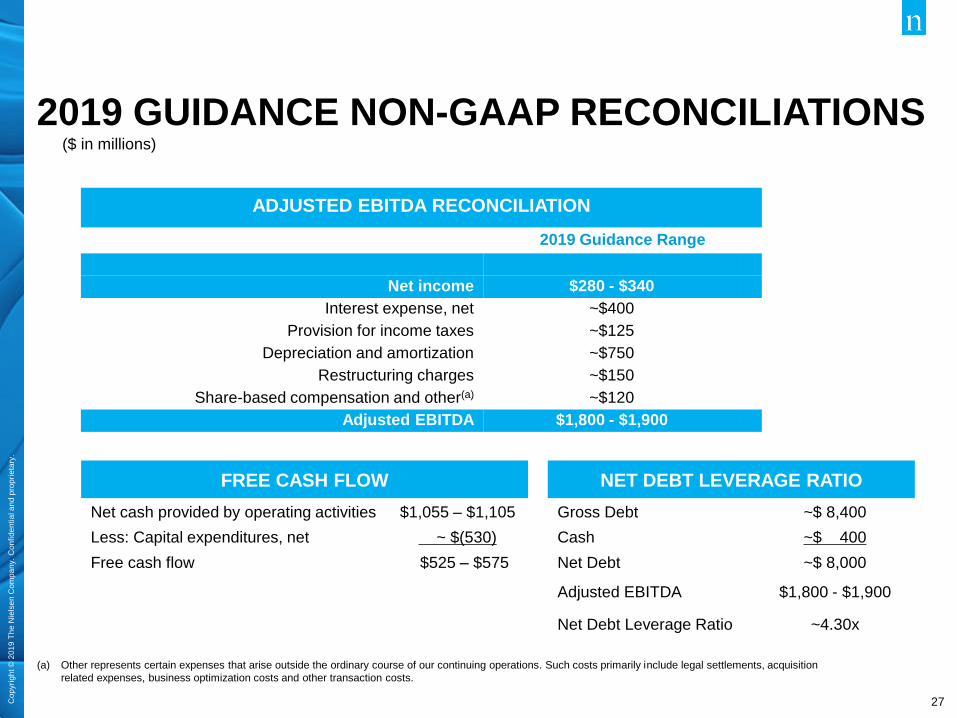
($ in millions)
ADJUSTED EBITDA RECONCILIATION
2019 Guidance Range
Net income $280 - $340
Interest expense, net ~$400
Provision for income taxes ~$125
Depreciation and amortization ~$750
Restructuring charges ~$150
Share-based compensation and other(a) ~$120
Adjusted EBITDA $1,800 - $1,900
FREE CASH FLOW
Net cash provided by operating activities $1,055 – $1,105
Less: Capital expenditures, net ~ $(530)
Free cash flow $525 – $575
NET DEBT LEVERAGE RATIO
Gross Debt ~$ 8,400
Cash ~$ 400
Net Debt ~$ 8,000
Adjusted EBITDA $1,800 - $1,900
Net Debt Leverage Ratio ~4.30x
(a) Other represents certain expenses that arise outside the ordinary course of our continuing operations. Such costs primarily include legal settlements, acquisition
related expenses, business optimization costs and other transaction costs.
2019 GUIDANCE NON-GAAP RECONCILIATIONS
Cop
yri
gh
t ©
20
19
Th
e N
iels
en
Com
pa
ny.
Co
nfid
en
tia
l a
nd
pro
pri
eta
ry.
28
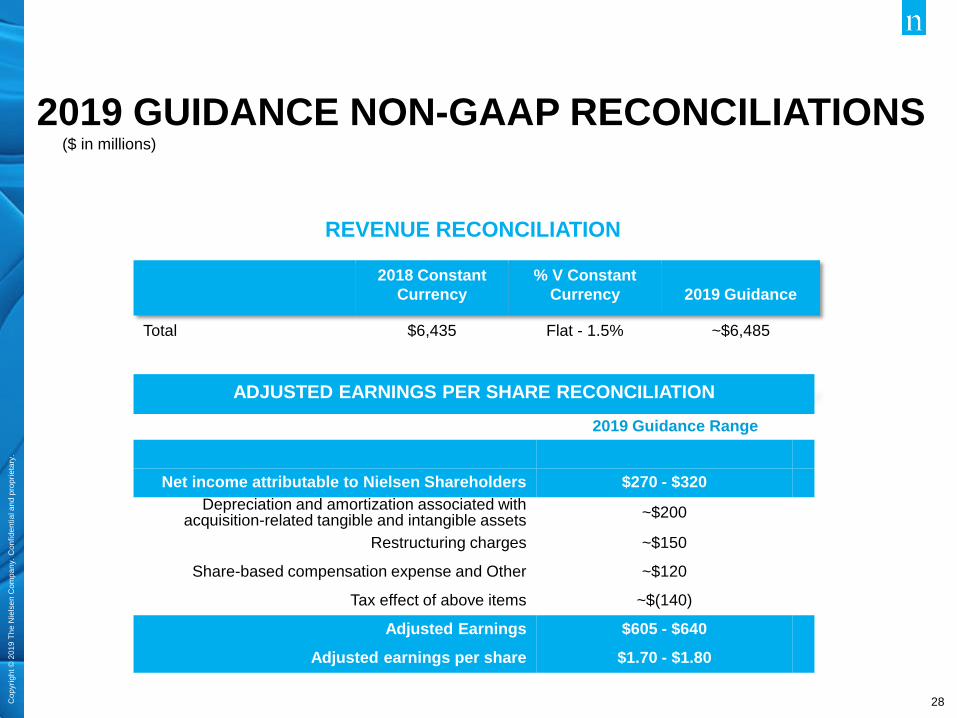
($ in millions)
2018 Constant
Currency
% V Constant
Currency
2019 Guidance
Total $6,435 Flat - 1.5% ~$6,485
REVENUE RECONCILIATION
ADJUSTED EARNINGS PER SHARE RECONCILIATION
2019 Guidance Range
Net income attributable to Nielsen Shareholders $270 - $320
Depreciation and amortization associated with acquisition-related tangible and intangible assets
~$200
Restructuring charges ~$150
Share-based compensation expense and Other ~$120
Tax effect of above items ~$(140)
Adjusted Earnings $605 - $640
Adjusted earnings per share $1.70 - $1.80
2019 GUIDANCE NON-GAAP RECONCILIATIONS
Cop
yri
gh
t ©
20
19
Th
e N
iels
en
Com
pa
ny.
Co
nfid
en
tia
l a
nd
pro
pri
eta
ry.
29
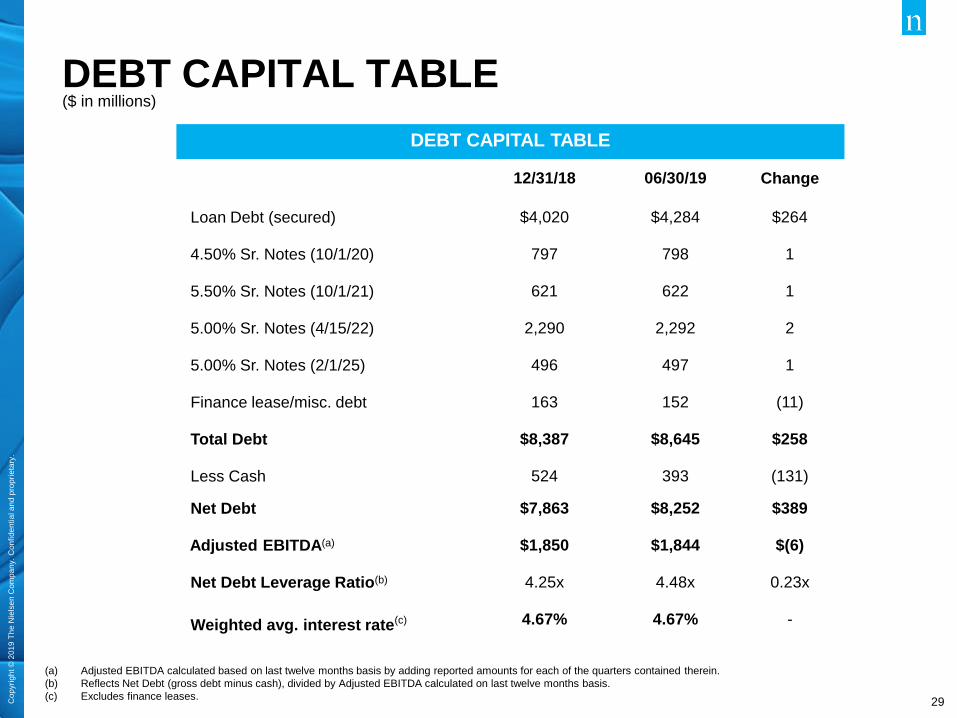
DEBT CAPITAL TABLE ($ in millions)
DEBT CAPITAL TABLE
12/31/18 06/30/19 Change
Loan Debt (secured) $4,020 $4,284 $264
4.50% Sr. Notes (10/1/20) 797 798 1
5.50% Sr. Notes (10/1/21) 621 622 1
5.00% Sr. Notes (4/15/22) 2,290 2,292 2
5.00% Sr. Notes (2/1/25) 496 497 1
Finance lease/misc. debt 163 152 (11)
Total Debt $8,387 $8,645 $258
Less Cash 524 393 (131)
Net Debt $7,863 $8,252 $389
Adjusted EBITDA(a) $1,850 $1,844 $(6)
Net Debt Leverage Ratio(b) 4.25x 4.48x 0.23x
Weighted avg. interest rate(c) 4.67% 4.67% -
(a) Adjusted EBITDA calculated based on last twelve months basis by adding reported amounts for each of the quarters contained therein.
(b) Reflects Net Debt (gross debt minus cash), divided by Adjusted EBITDA calculated on last twelve months basis.
(c) Excludes finance leases.
Cop
yri
gh
t ©
20
19
Th
e N
iels
en
Com
pa
ny.
Co
nfid
en
tia
l a
nd
pro
pri
eta
ry.
30
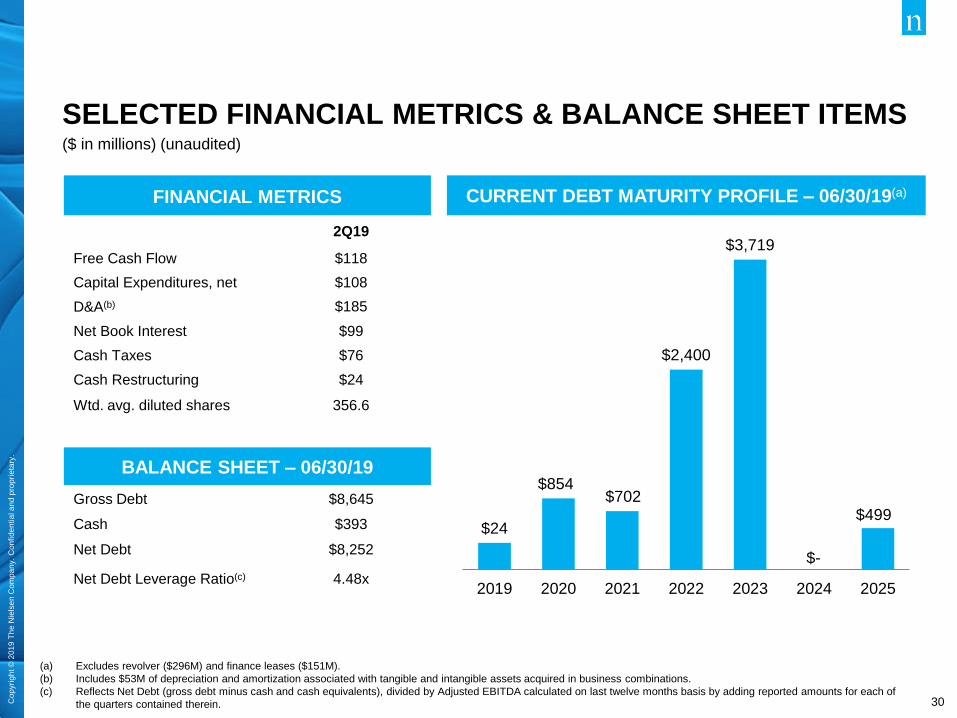
SELECTED FINANCIAL METRICS & BALANCE SHEET ITEMS ($ in millions) (unaudited)
FINANCIAL METRICS
2Q19
Free Cash Flow $118
Capital Expenditures, net $108
D&A(b) $185
Net Book Interest $99
Cash Taxes $76
Cash Restructuring $24
Wtd. avg. diluted shares 356.6
BALANCE SHEET – 06/30/19
Gross Debt $8,645
Cash $393
Net Debt $8,252
Net Debt Leverage Ratio(c) 4.48x
$24
$854 $702
$2,400
$3,719
2019 2020 2021 2022 2023 2024 2025
$499
CURRENT DEBT MATURITY PROFILE – 06/30/19(a)
(a) Excludes revolver ($296M) and finance leases ($151M).
(b) Includes $53M of depreciation and amortization associated with tangible and intangible assets acquired in business combinations.
(c) Reflects Net Debt (gross debt minus cash and cash equivalents), divided by Adjusted EBITDA calculated on last twelve months basis by adding reported amounts for each of
the quarters contained therein.
$-

Co
pyri
gh
t ©
20
19
Th
e N
iels
en
Com
pa
ny (
US
), L
LC
. C
on
fid
en
tia
l a
nd
pro
pri
eta
ry. D
o n
ot d
istr
ibu
te.
NIELSEN INVESTOR RELATIONS
+1.646.654.8153
http://www.nielsen.com/investors
Follow @Nielsen

This artwork was created using Nielsen data.
Copyright © 2018 The Nielsen Company (US), LLC. Confidential and proprietary. Do not distribute.