nd-m7s62 chzcaoo rt goner ls jul n98114-?7-c … · nd-m7s62 (u) chzcaoo uniy il jones fraick inst...
TRANSCRIPT

ND-M7S62 (U) CHzCaOO UNIY IL JONES FRAICK INST Rt GONERLS JUL 86 N98114-?7-C-801B
UNCLSSIFIED F/d 7/4 ML

- 12
S2 L.
II I,,j l-
MICROCOPY RESOLUTION TEST CHARTNATONAL TURfALJ If 14A NUIf 1',b-
*l
,it
-' . .- *I.*%~. *~ *.' % .S-' ~ % w r % X . .~i
:"7
*SECURITY CLASSIFICATION OF TIS PAGE
'IN REPORT DOCUMENTATION PAGEiii REPORT SECURITY CLASSIFICATION 1b. RESTRICTIVE MARKINGS
unclassified2. SEC.,RITY' CLASSIFICATION AUTHORITY 3. DISTRIBUTION/AVAILASiLITY OF REPORT
.0* 2b. OECLASSIFICATION,DOWNGRAOING SCHEDULE unlimited
4 PERFORMING ORGANIZATION REPORT NUMBERISI S. MONITORING ORGANIZATION REPORT NUMBE-RiSI
ja NAME OF PERFORMING ORGANIZATION 6b. OFFICE SYMBOL 7a. NAME OF MONITORING ORGANIZATION
The University of Chicago (it applicable) NChcgThe James Franck Institute N-ico
IC. ADDRESS iCity. State and ZIP Code) 7b. ADDRESS (City. State and ZIP Code)
5801 South Ellis Avenue 536 South Clark StreetChicago, IL 60637 Chicago, IL 60605
8&. NAME OF FUNDING/SPONSORING Bb. OFFICE SYMBOL 9. PROCUREMENT INSTRUMENT IDENTIFICATION NUMBERORGANIZATION Office of Naval (ifapplicable)
Reerh/hs Sri ONR N00014-77-C-0018
S1 c. ADDRESS (City. State and ZIP Code) 10. SOURCE OF FUNDING NOS.
PROGRAM PROJECT TASK WORK UNIT800 North Quincy Street ELEMENT NO, NO. NO. NO
* Arlington, VA 22217 6153 N1t. TITLE iInclude Security CjaeeiIicallonl 7-C-00/ RRO 11-02-03Annual Summary ONR Contract N00014-1f--Q-- NR392-022
12. PERSONAL AUTHOR(SI
A Robert Gomer13. TYPE OF REPORT 13b. TIME COVERED 14. DATE OF REPORT (Yr. No., Davi jig. PAGE COUNT
Technical FROMZLU 1/1/8 T1/7/8 1986 July 10 I 12* 16. SUPPL.EMENTARY NOTATION
17 COSATI CODES 1S. SUBJIECT TERMS 0COntIsnu On reverse it neceary and identify by block number)
* FIELD GROUP suB. GR.
chemisorption, thermal desorption
19. ABSTRACT lCon linue on reverse if neeeary and Woencity by block number,
* This annual summary report describes work function, sticking coefficient, isothermaland temperature programmed desorption, Leed, and equilibrium measurements for CO adsorptionon W(110)/Cu nsurfaces, with emphasis on n I and to a lesser extent n = 6.
r~I C
* FIg LL COD k~X20. DISTRIBUTION/AVAILABILITY OF ABSTRACT 21. ABSTRACT SECURITY CLASSIFICAtON
* UNCLASSIFIED/UNLIMITED [ SAME AS RPT D3 TIC USERS C3 unclassified
22s. NAME OF RESPONSIBLE INDIVIDUAL 22b TELEPHONE NUMBER 22c OFFICE SYMBOL
00 FORM 1473,83 APR EDITION OF 1 JAN 73 IS OBSOLETE._____________
8 6 7 28 16 2 SECURITY CLASSIFICATION OF THIS PAGE

* .o . -.- . .- - - -_- . - - -- ,r . i - --' 4. . r - -r W. W .r r * r -' , = - , - - . ." F'- .--- " - r" ' -' - ' " " ; " -- "
77- - oo/ 7ANNUAL SUMMARY REPORT ON ONR CONTRACT N0014-*-
December 1, 1985 - July 1, 1986
Work carried out during this period has consisted of a detailed study
of the adsorption, desorption and thermodynamics properties of CO on W(ll0)
covered with one or more Cu monolayers. The most detailed measurements were
made for W(1l0)/Cu 1 Preliminary equilibrium measurements were also made for
W(llO)/Cu61. Some work function measurements for CO adsorption were also6
carried out on intermediate layer thicknesses. The principal tools in this
phase of the work were thermal desorption, using a quadrupole mass spectro-
meter as detector for isothermal and temperature ramped measurements, and
work function measurements using the newly constructed and higly accurate,
reproducible (< 1 meV) and fast (< 0.1 sec response time) Kelvin probe for
1work function measurements . The latter were used to determine sticking
coefficients, coverage vs. temperature rise (i.e. ramped desorption giving
not the rate but the remaining coverage) and adsorption isobars, i.e. cover-
age as function of surface temperature for a series of constant CO pressures.,
CO ADSORPTION ON W.ll)0/Cu
(M. Chelvayohan and R. Gomer)
Work Function Changes for CO Adsorption
For one Cu layer A0 rises monotonically and almost linearly to %400 meV
with CO coverage. For 2 or more Cu layers work function at first decreases
and then increases; this has also been seen on bulk Cu surfaces '3 and is
probably associated with changes in 7* orbital filling. Significant differences
were found for annealed (800 K) and unannealed Cu multilayers. For annealed
layers AO becomes positive at saturation coverage, while remaining negative
for unannealed ones.

3
Sticking Coefficients and Absolute Coverage
Sticking coefficients for W(ll0)/Cu I were determined by comparing 1* vs.
exposure time curves with the crystal at 25 K (where s is unity to very high
coverage) with similar curves at higher crystal temperature, T . For T % 220 K ss s
is initially > 0.75 and shows the plateau associated with precursor models 4; forhigher Ts s is lower initially and decreases almost linearly with coverage.
Absolute coverages could be determined by calibrating against clean IV(ll0 for
5which maximum coverage is known from previous work in this laboratory For
W(ll0)/Cu I this turned out to be CO/Cu = 0.72, at 25 K. Long exposure at
T > 80 K increases the uptake (with very low sticking coefficient) to 0.75.
At 25 K incorporation of this last increment apparently cannot take place; CO
in excess of 10 i s molecules/cm 2 is simply held as physisorbed CO in a second
layer. A similar phenomenon was seen for W(IIO)/Cu6'
Thermal Desorption
Temperature programmed desorption results confirmed those carried out
earlier by Hamadeh and the writer6 ; there are 3 peaks for W(II0)/Cu1 /CO at
192, 226 and 261 K (depending slightly on heating rate) and a small peak near
383 K corresponding to tungsten-like adsorption, probably in defect sites or
where Cu has been pushed aside at Cu domain boundaries. Isothermal desorption
experiments were also carried out and show that desorption obeys no simple rate
." law except at very low coverage where good first order kinetics were seen,-. 14 -1I
corresponding to V , 10 sec and Edes = 18 Kcal/mole. The reason for the
complicated desorption behavior can be found in terms of the thermodynamic
properties of the layer, which will be described later.
LEED Results
Three structures were seen. For CO/Cu < 0.24 no new order was seen but the
Cu p(lxl) structure seen for W(110)/Cu1 remained intact. For 0.24 < CO/Cu < 0.5
4. . : ;L* . *** * ** * . * *~a
4
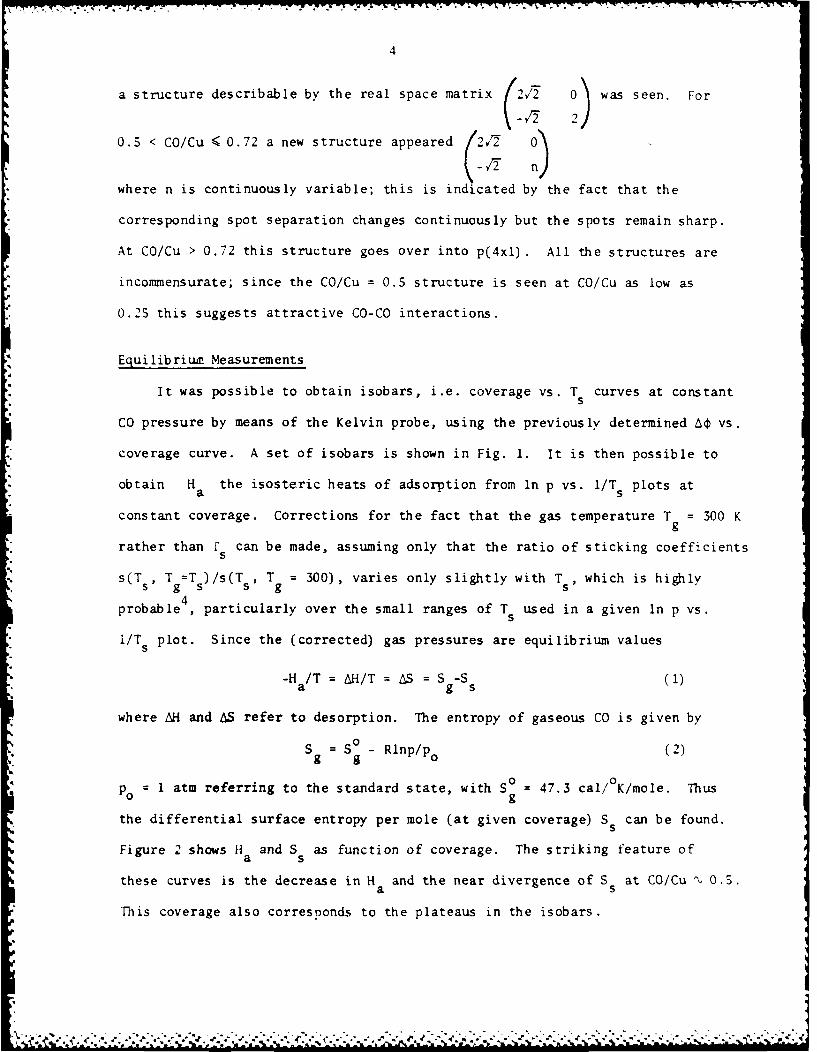
a structure describable by the real space matrix (2v7 0) was seen. For
0.5 < CO/Cu < 0.72 a new structure appeared 242-
where n is continuously variable; this is indicated by the fact that the
corresponding spot separation changes continuously but the spots remain sharp.
At CO/Cu > 0.72 this structure goes over into p(4xl). All the structures are
, incommensurate; since the CO/Cu = 0.5 structure is seen at CO/Cu as low as
*0.25 this suggests attractive CO-CO interactions.
Equilibrium MeasurementsIt was possible to obtain isobars, i.e. coverage vs. T curves at constant
5
CO pressure by means of the Kelvin probe, using the previously determined AO vs.
coverage curve. A set of isobars is shown in Fig. 1. It is then possible to
obtain Ha the isosteric heats of adsorption from In p vs. l/T s plots at
constant coverage. Corrections for the fact that the gas temperature T = 300 Kg
rather than f can be made, assuming only that the ratio of sticking coefficientss
s(T s , Tg=T s)/s(Ts , Tg = 300), varies only slightly with Ts, which is highly
probable 4 , particularly over the small ranges of Ts used in a given In p vs.
l/T s plot. Since the (corrected) gas pressures are equilibrium values
-H a/T = AH/T = AS = S -S )a ~g s()
where AH and AS refer to desorption. The entropy of gaseous CO is given by
S = S ° - Rlnp/p (2)Sg g- 0
00Po = 1 atm referring to the standard state, with S = 47.3 cal/°K/mole. Thusg
the differential surface entropy per mole (at given coverage) Ss can be found.
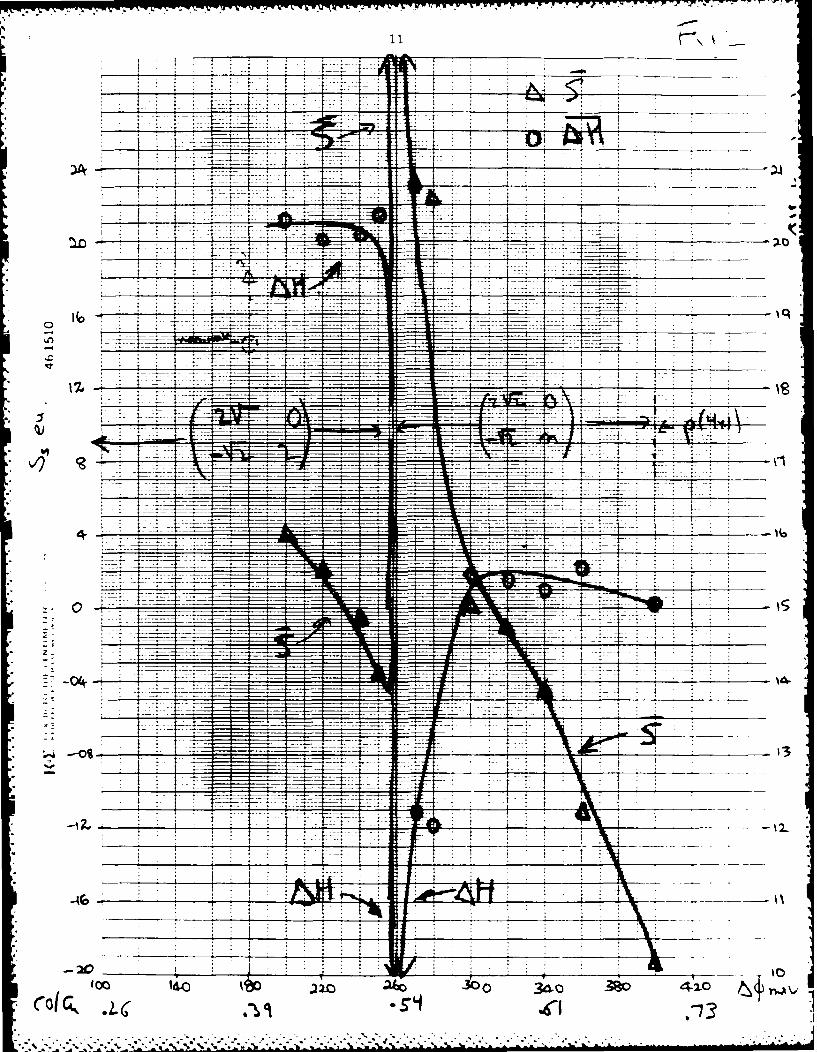
Figure 2 shows H and S as function of coverage. The striking feature ofa s
these curves is the decrease in H and the near divergence of S at CO/Cu % 0.5.a s
This coverage also corresponds to the plateaus in the isobars.

To the best of our knowledge such plateaus and divergences have not previously
been seen. The meaning of the plateaus and the divergence is fairly clear:
The system has completed an adsorption state at CO/Cu 't 0.5 and further uptake
can occur (at least at the moderate pressures available here, p max'Q10 torr) onlywhen Ts is lowered. Thus Ha approaches zero and the differential surface
entropy becomes very high, corresponding roughly to the fact that at very low
e (for the new state)
S = R in (1-6)/e (3)
* which diverges as e - 0. Here 6 is relative coverage. This explanation is
also supported by the Leed results, since there is a change in structures at
CO/Cu = 0.5 i.e. after the surface is fully covered by the (2/r 0) structure.
It is not all clear, however, why such divergences do not occur at the other
phase transition near saturation coverage. It is equally unclear why such
divergences have not been seen previously in other systems. Possibly they
have simply not been looked for since very few equilibrium measurements on
chemisorption systems seem to have been carried out.
The entropy values seen on the low coverage side of the divergence seem
reasonable for low frequency vibrational degrees of freedom and some configura-
tional entropy. At the conditions of the lowest measurable values there is
still some order, as indicated by Leed results so that CO cannot be regarded
0as a 2 dimensional gas, which would increase S to 12-14 cal/mole/ K. Perhaps5
more surprising are the large negative values at high coverage. They suggest
participation of Cu in adsorption, most likely by reconstruction which decreases
the entropy per Cu atom. Similar, if not as dramatic effects have been seen by
7 8Estrup and coworkers for H adsorption on W(I10) and more recently on W(100)
The present results also indicate that the heat of adsorption essentially
* has two values, 15 Kcal/mole for CO/Cu > 0.5 and 20 Kcal/mole for Cu/CO < 0.5 and

6
drops to very low values, as already explained at CO/Cu = 0.5.
Relation of H a and S to Desorption Kineticsa s
Even if the detailed reasons why surface entropy behaves as it does are
not fully understood its variation with coverage helps to explain why
desorption kinetics are complex and why a three peak TPD spectrum is observed.
The basis of these considerations, which have also been used by other workers
is that the rate of desorption at equilibrium equals that of adsorption and
that the absence of ambient gas does not affect desorption in first approximation.
Thus we can write (even at zero ambient pressure)
-n = s p/(2TrmkT) (4)
where p is the equilibrium CO pressure and -n the rate of desorption in molecules-2 -l
cm sec . It follows from standard thermodynamics that -n can be written
= spo -H°/RT (S-S )/R-n - - e e g (5)
(2rnkT)
It is now easy to see that desorption cannot obey first order kinetics unless
Ss contains a term -Rln n. This condition is met for a lattice gas (see Eq. 3)
and for a 2-d translational gas, but clearly not for W(ll0)/Cu /CO (except
possibly at very low e where CO may be mobile enough to be a 2-d gas), as
indicated by Fig. 2.
If AH is constant and S decreases linearly with coverage n for instances
S s/R = S (n = O)/R - yn (6)
it is clear from Eq. 5 that
n(t) = n s(n)e nL t) (7)
where n means the rate at n = 0 i.e. when S = S (n = 0). Since n decreasesa o g s
~as desorption proceeds, it is obvious even from Eq. 7 why the rate of desorption
_,.,," -... .- """ ,, . . ., . . . . .; - € . . .-. . ,- . < . -.,, :' ' .,,.,. - -. . . r .,.. . -, ,.'.
. :.-. ,

slows below the values appropriate for first order kinetics after a very
short time. If the sticking coefficients s(n) could be taken as constant,
Eq. 7 would lead to a rate law
-n(t) = LIt + y (8)sno eyn(t=0 (8
- which bears little resemblance to
-n(t) = -n(O) [n(t)/n(O)] (9)
which is the first order rate law, -n = k n written in analogous fashion to
Eq. 8.
The variation of s with coverage makes Eq. 8 invalid, but there is a
way of showing the general validity of the present approach: It is possible
to determine experimentally AO vs. T by measuring AO with the Kelvin probe
as temperature is ramped linearly. When such a plot is superimposed on the
isobars its intersection with a given isobar corresponds to the equilibrium pressure
p(T) at that particular coverage and temperature and is thus by Eq. 5 proportional
to the rate of desorption. If the variation in sticking coefficient is neglected
it is then possible to construct a simulated TPD spectrum. The latter correctly
gives the 3 peaks observed experimentally in the right positions but does not
give their correct relative intensities. The reason for this is the neglect of
the variation of s with T and n. To date we have not determined s over a suf-
ficient range of coverages and temperatures to include this effect. Further
measurements of s are planned in order to include its effect.
Work on W(l10)/Cu6/CO
Heats of adsorption and surface entropies have been determined for this
system. There are no plateaus in the isobars and H decreases monotonicallya
from 14.3 Kcal at low to 9 Kcal at high coverage. S shows no divergences but5
8
is extremely high, 25 cal/mole/ K at low coverage %11 cal/mole/ K at high
coverage. There is some evidence from work function measurements that CO
adsorption leads to some surface roughening and it is possible that this
accounts for the high entropy values. Comparable entropy values can be
2calculated by analyzing Tracy's data for CO on Cu(lOu)
The work reported here is nearing completion and will be written up for
publication after some additional sticking coefficient measurements and
probably some Leed experiments for W(II0)/Cu 6/CO have been carried out.
References
[E] M. Chelvayohan and R. Gomer, Surf. Sci., in nress.
[2) J. Tracy, J. Chem. Phys. 56, 2748 (1972).
[3] J. Kessler and F. Thieme, Surf. Sci. 6.7, 405 (1977)
[4] C. Wang and R. Gomer, Surf. Sci. 84, 329 C1979).
[S] C. Wang and R. Gomer, Surf. Sci, 74, 389 (1978).
[6J I. Hamadeh and R. Gomer, Surf. Sci. 154, 168 (1985).
[7] A. Horlacher Smith, R. A. Barker and P. J. Estrup, Surf. Sci. 136, 327 (1984).
[8] J. A. Prybila, P. J. Estrup and Y. J. Chabal, to be published.
Title of ReportAnnual Summary ONR Contract N00014-77-C-O018Per Dr. Bobby R. Junker, ONR/Code 1112
4 )
-.-.- .-. . .. .--." ' .. ..-'.-."..- '. . ." -'.- .- . .-.--'-- --'. . .- •--.- • . ..-.-.-- i -. '.-".-- -. • i

9
Figure Captions
1. Isobars (A vs.T at constant pressures) for IV(1O)/Cu /CO. Also shown
are coverages in units of CO/Cu. CO/Cu = 1 corresponds to 1.4 x 101
2molecules/cm . A temperature programmed work function vs. T (TPCP for
temperature programmed contact potential) plot is superimposed on the
isobars and a calculated temperature programmed desorption spectrum (TPD)
obtained from this superposition as discussed in the text is also shown.
The calculated TPD ignores the changes in sticking coefficient with T
and coverage. In this set of runs temperatures were not taken high enough
to show the third peak in the spectrum because of irreversibilities. A
previous set of measurements which went to high enough T does show the third
peak. Note in particular the plateaus in the isobars, which are discussed
in the text.
2. Plots of differential surface entropy S and heat of adsorption H vs.
5
work function increment and (also coverage in units of CO/Cu). Also
shown are Leed structures corresponding to the various coverage regimes.
Note the sharp increase in S and the concomitant sharp decrease in R near5
CO/Cu = 0.3, corresponding to the change in Leed patterns and also to the
plateaus in the isobars shown in Fig. 1.
J
. . . .. . . . . . . . . . . . . . . . . . . . . . .

01
I -
I X~
- -- ----- ---
-1
-
-0.
_=_
__77
7_
_ _ I .3 0
U%-7

12
77-e-oo/&STATUS REPORT ON ONR CONTRACT N00014-0 4-
December 1, 1985 - July 1, 1986
1) Personnel: J. C. Lin, graduate student
M. Chelvayohan, research associate
2) Other Government Sponsored Research
The research of the Principal Investigator is also supported by
the National Science Foundation at an annual rate of $110,000 by
grant CHE83-16647 and its successor grant CHE86-03230. He also
benefits from the Materials Research Laboratory of the National Science
Foundation at the University of Chicago.
3) Current Status on Contract Funds
It is expected that there will be unexpended funds in the current
contract at its expiration, November 30, 1986.
4) No permanent equipment was purchased during the current contract period.

-UJ