ncep status use of satellite data and other topics stephen j. lord (ncep/emc) 17 th north...
TRANSCRIPT
NCEP StatusUse of Satellite Data
and Other Topics
Stephen J. Lord (NCEP/EMC)
17th North America-Europe Data Exchange Meeting
May 26-28, 2004, CMC Montreal Canada
Overview• JCSDA Summary
– Community RT model and data assimilation development– Observing system impact experiments– Applied Research Areas
• WSR & NATREC Results (preliminary)• New NCEP Climate Forecast System• Verification of Wave Guidance during Isabel with
altimeter data• North American Ensemble Forecast System
development

JCSDA Summary FY03-04
John LeMarshall - JCSDA Director
Stephen J. Lord (NCEP/EMC)
Fuzhong Weng (NESDIS/ORA)
L.P. Riishojgaard (NASA/GMAO)
Pat Phoebus (NRL Monterey)
17th North America-Europe Data Exchange Meeting
May 26-28, 2004, CMC Montreal Canada
Establishing community models• JCSDA RT models
– Community support established • Han, vanDelst, Yan
– Strong demand and anticipated participation by JCSDA grantees and internal investigators
– WRF data assimilation
• Unified (global, regional) analysis system at NCEP– Single analysis (Gridpoint Statistical Interpolation, GSI)– JCSDA satellite RT codes– Collaboration with NASA/GSFC– Opens way for flow-dependent background errors and
unified NCEP analysis across global and regional applications
– Advanced SST retrievals and analysis– 2004 implementation
Data Assimilation Impacts in the NCEP GDAS
Stephen LordNCEP Environmental Modeling Center
Tom Zapotocny and James JungCIMSS/ Univ. of [email protected]
Sponsored by JCSDA and NPOESS IPO
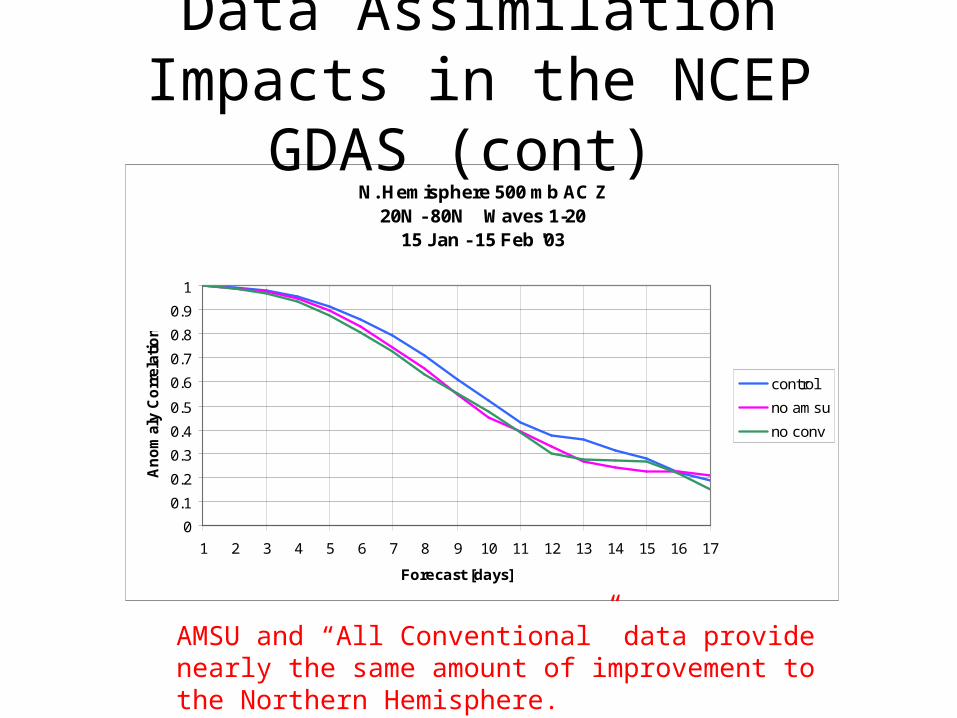
N. Hemisphere 500 mb AC Z 20N - 80N Waves 1-20
15 Jan - 15 Feb '03
0
0.1
0.2
0.3
0.4
0.5
0.6
0.7
0.8
0.9
1
1 2 3 4 5 6 7 8 9 10 11 12 13 14 15 16 17
Forecast [days]
An
om
aly
Co
rrela
tio
n '
control
no amsu
no conv
Data Assimilation Impacts in the NCEP GDAS (cont)
AMSU and “All Conventional” data provide nearly the same amount of improvement to the Northern Hemisphere.
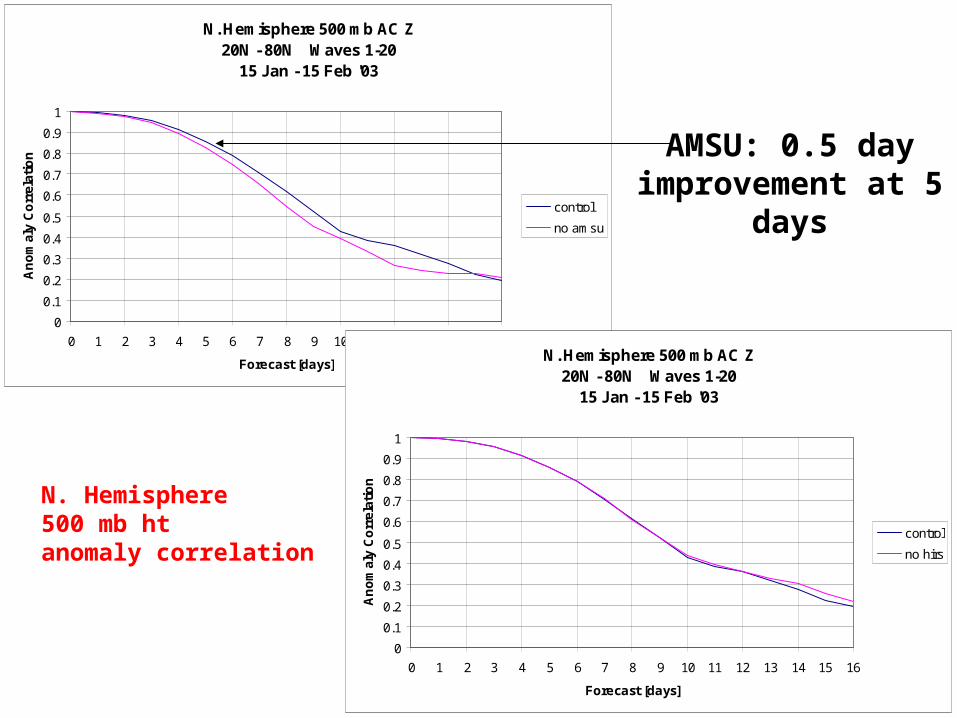
N. Hemisphere500 mb htanomaly correlation
N. Hemisphere 500 mb AC Z 20N - 80N Waves 1-20
15 Jan - 15 Feb '03
0
0.1
0.2
0.3
0.4
0.5
0.6
0.7
0.8
0.9
1
0 1 2 3 4 5 6 7 8 9 10 11 12 13 14 15 16
Forecast [days]
An
om
aly
Co
rrel
atio
n '
control
no amsu
N. Hemisphere 500 mb AC Z 20N - 80N Waves 1-20
15 Jan - 15 Feb '03
0
0.1
0.2
0.3
0.4
0.5
0.6
0.7
0.8
0.9
1
0 1 2 3 4 5 6 7 8 9 10 11 12 13 14 15 16
Forecast [days]
An
om
aly
Co
rrel
atio
n '
control
no hirs
AMSU: 0.5 day improvement at 5 days
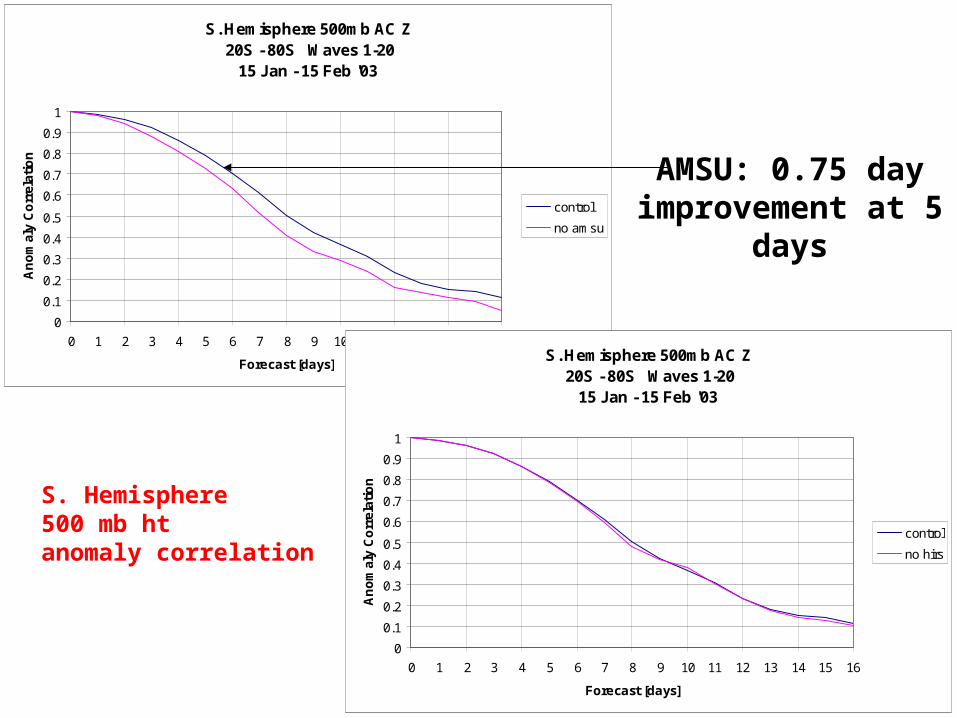
S. Hemisphere 500 mb htanomaly correlation
S. Hemisphere 500mb AC Z 20S - 80S Waves 1-20
15 Jan - 15 Feb '03
0
0.1
0.2
0.3
0.4
0.5
0.6
0.7
0.8
0.9
1
0 1 2 3 4 5 6 7 8 9 10 11 12 13 14 15 16
Forecast [days]
An
om
aly
Co
rrel
atio
n '
control
no amsu
S. Hemisphere 500mb AC Z 20S - 80S Waves 1-20
15 Jan - 15 Feb '03
0
0.1
0.2
0.3
0.4
0.5
0.6
0.7
0.8
0.9
1
0 1 2 3 4 5 6 7 8 9 10 11 12 13 14 15 16
Forecast [days]
An
om
aly
Co
rrel
atio
n '
control
no hirs
AMSU: 0.75 day improvement at 5 days
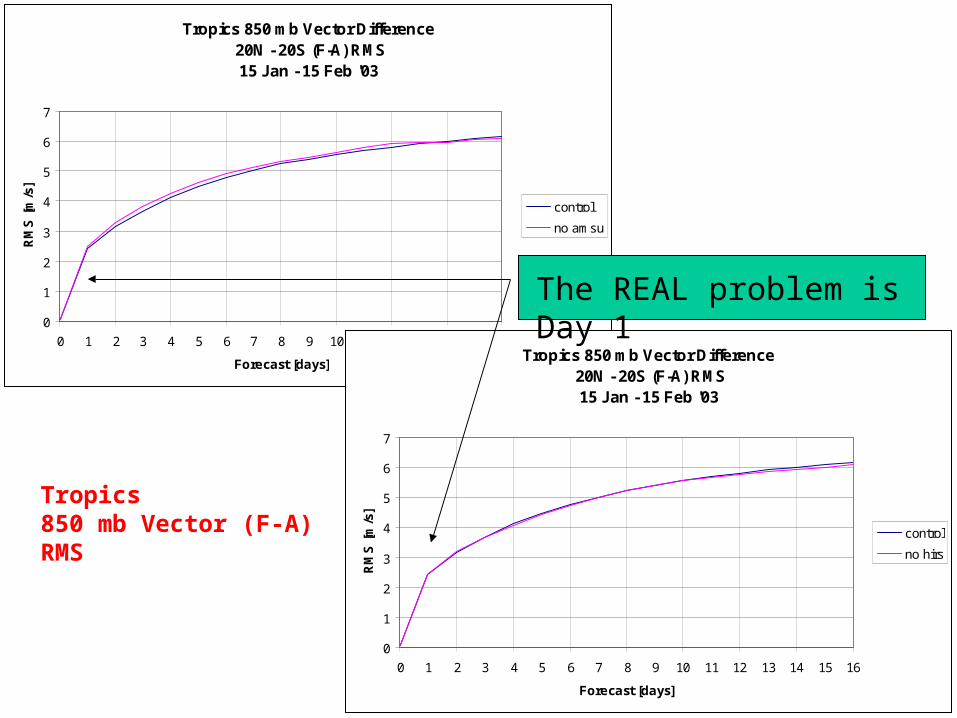
Tropics 850 mb Vector Difference 20N - 20S (F-A) RMS 15 Jan - 15 Feb '03
0
1
2
3
4
5
6
7
0 1 2 3 4 5 6 7 8 9 10 11 12 13 14 15 16
Forecast [days]
RM
S [
m/s
] '
control
no amsu
Tropics 850 mb Vector Difference 20N - 20S (F-A) RMS 15 Jan - 15 Feb '03
0
1
2
3
4
5
6
7
0 1 2 3 4 5 6 7 8 9 10 11 12 13 14 15 16
Forecast [days]
RM
S [
m/s
] '
control
no hirs
Tropics850 mb Vector (F-A)RMS
The REAL problem is Day 1
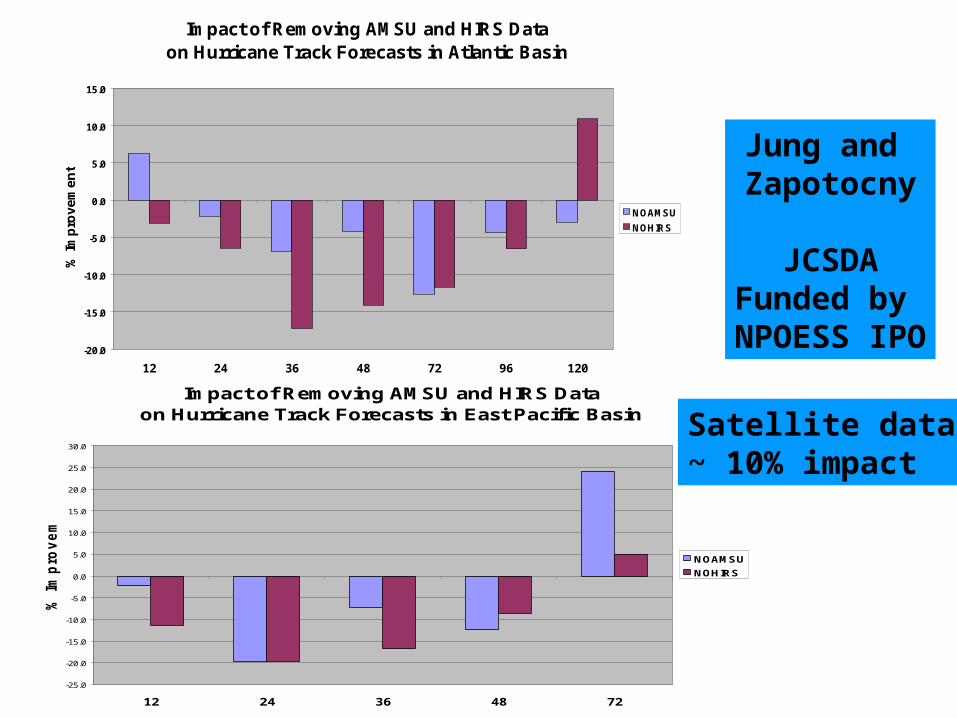
Impact of Removing AMSU and HIRS Data on Hurricane Track Forecasts in East Pacific Basin
-25.0
-20.0
-15.0
-10.0
-5.0
0.0
5.0
10.0
15.0
20.0
25.0
30.0
12 24 36 48 72
% I
mp
rov
em
en
t
NOAMSU
NOHIRS
Impact of Removing AMSU and HIRS Dataon Hurricane Track Forecasts in Atlantic Basin
-20.0
-15.0
-10.0
-5.0
0.0
5.0
10.0
15.0
12 24 36 48 72 96 120
% I
mp
rov
em
en
t
NOAMSU
NOHIRS
Satellite data ~ 10% impact
Jung and Zapotocny
JCSDAFunded by
NPOESS IPO

Summary: Impacts of Current Instruments
• MW has largest impact on forecast scores• IR useful in cloud free areas and for cloud top
determinations• Impact assessments lead to
– Improved data sampling algorithms– Focused direction for future applied research– Improved knowledge of entire observing system and
how to extract more information from all observations to improve forecasts
• Experiments ongoing with computing sponsored by NPOESS Program
Overview of JCSDA Applied Research Areas
• Advanced radiative transfer
• Improve sea surface temperature data and use of altimeter data
• Enhance land surface data sets (surface emissivity model)
• Observing System Simulation Experiments (OSSEs)
• Instrument specific development
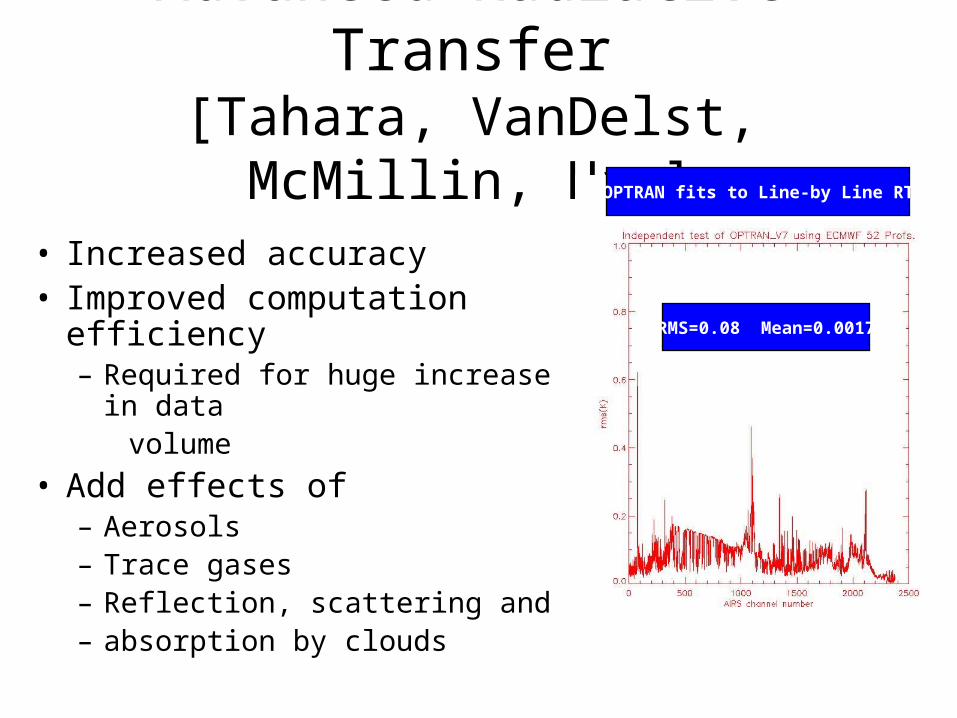
Advanced Radiative Transfer[Tahara, VanDelst, McMillin, Han]
• Increased accuracy• Improved computation efficiency
– Required for huge increase in data volume
• Add effects of– Aerosols– Trace gases– Reflection, scattering and – absorption by clouds
RMS=0.08 Mean=0.0017
OPTRAN fits to Line-by Line RT
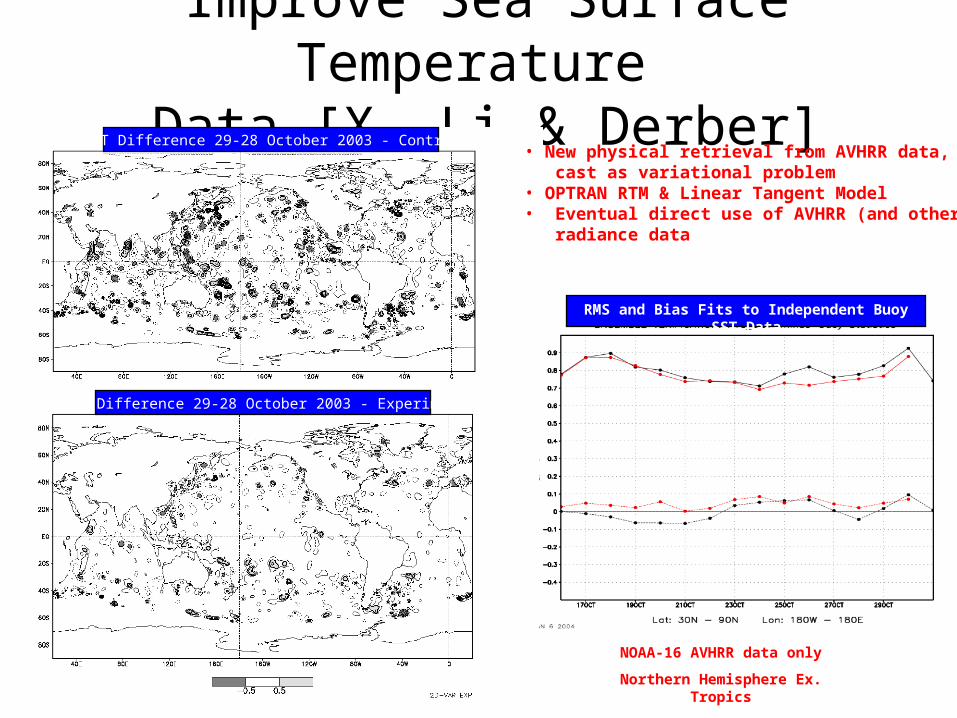
Improve Sea Surface Temperature Data [X. Li & Derber]
SST Difference 29-28 October 2003 - Experiment
SST Difference 29-28 October 2003 - Control• New physical retrieval from AVHRR data, cast as variational problem• OPTRAN RTM & Linear Tangent Model• Eventual direct use of AVHRR (and other) radiance data
RMS and Bias Fits to Independent Buoy SST Data
NOAA-16 AVHRR data only
Northern Hemisphere Ex. Tropics
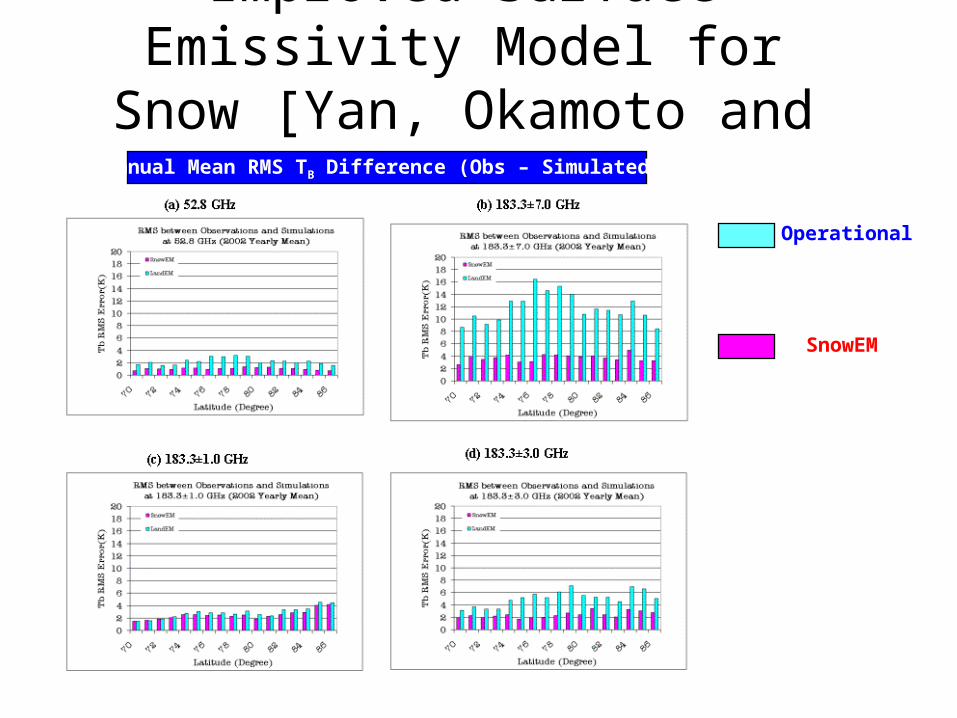
Improved Surface Emissivity Model for Snow [Yan, Okamoto and Weng)
Annual Mean RMS TB Difference (Obs – Simulated)
SnowEM
Operational
Observing System Simulation Experiments (OSSEs)
• Prepare for advanced data– Formatting
– Understanding and formulation of observational errors
– Initial quality control algorithms
• Understanding and formulation of observational errors
• Assists requirements definition, instrument design and potential instrument impact
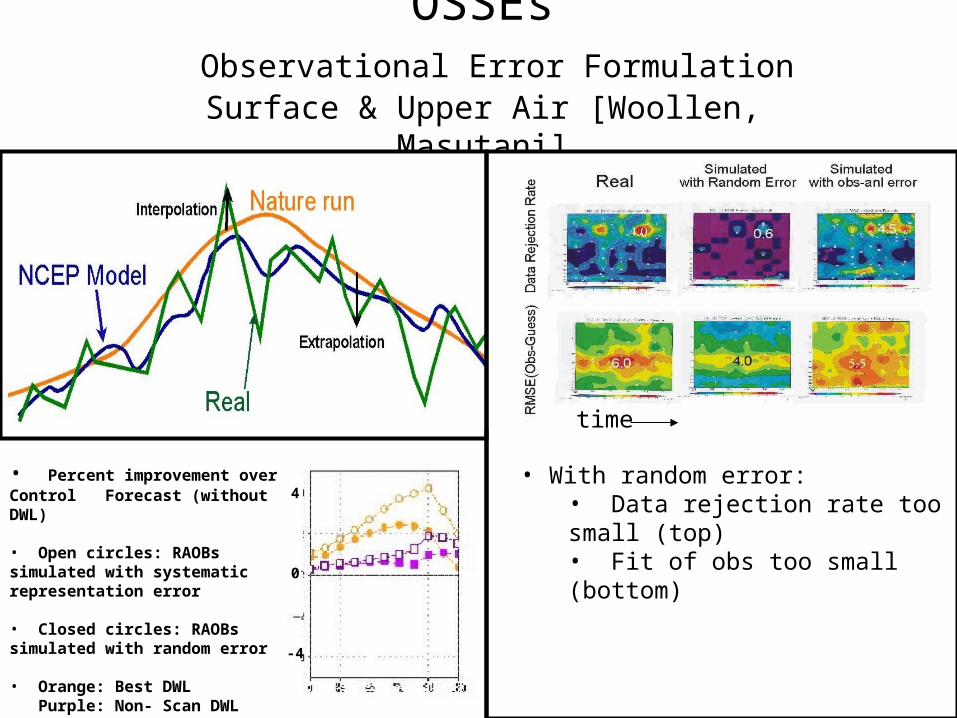
OSSEs Observational Error Formulation
Surface & Upper Air [Woollen, Masutani]
time
• With random error:• Data rejection rate too small (top)• Fit of obs too small (bottom)
• Percent improvement over Control Forecast (without DWL)
• Open circles: RAOBs simulated with systematic representation error
• Closed circles: RAOBs simulated with random error
• Orange: Best DWL Purple: Non- Scan DWL
4
0
-4
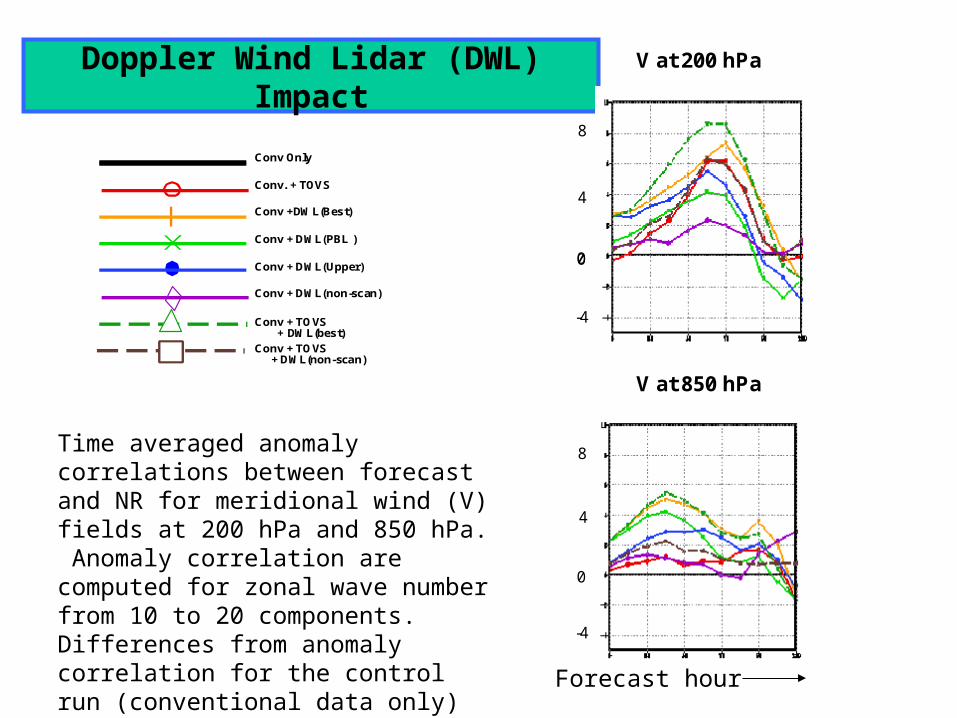
Doppler Wind Lidar (DWL) Impact
Conv Only
Conv. + TOVS
Conv + TOVS + DWL(best)
Conv + DWL(non-scan)
Conv + DWL(PBL )
Conv + TOVS + DWL(non-scan)
Conv +DWL(Best)
Conv + DWL(Upper)
V at 200 hPa
V at 850 hPa
4
-4
4
-4
8
8
00
0
Time averaged anomaly correlations between forecast and NR for meridional wind (V) fields at 200 hPa and 850 hPa. Anomaly correlation are computed for zonal wave number from 10 to 20 components. Differences from anomaly correlation for the control run (conventional data only) are plotted.
Forecast hour
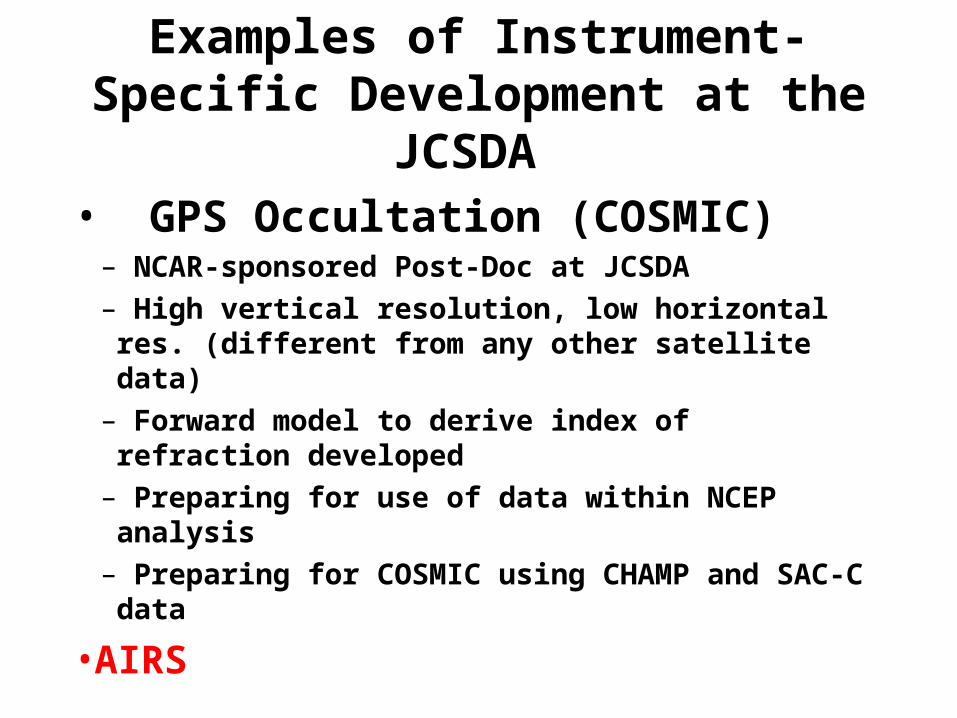
Examples of Instrument-Specific Development at the JCSDA
• GPS Occultation (COSMIC)– NCAR-sponsored Post-Doc at JCSDA
– High vertical resolution, low horizontal res. (different from any other satellite data)
– Forward model to derive index of refraction developed
– Preparing for use of data within NCEP analysis
– Preparing for COSMIC using CHAMP and SAC-C data
•AIRS

AIRS Testing at NCEP [Derber, Treadon]
Red: controlBlack: AIRS
Solid: cntlDotted: AIRSBlack: 12 h Red: 36 h
Small Positive Impact
• T254/L64 Parallel testing has begun
• 254 out of 281 channels
• Initial results show small positive/neutral impact
• Testing will continue and additional improvements and uses (such as for SST and cloud analysis) will be developed
• Full data assimilation implementation scheduled for 1st Quarter FY05
Neutral Impact
Results from the Winter Storm Reconnaissance (WSR) program
2004Lacey Holland SAIC at EMC/NCEP
Zoltan Toth EMC/NCEP/NWS
Jon Moskaitis MIT
Sharan Majumdar Univ. of Miami
Craig H. Bishop NRL
Roy Smith NCO/NCEP/NWS
Acknowledgements•NWS field offices, HPC/NCEP and SDMs•NOAA G-IV and the USAFR C-130 flight crews•CARCAH (John Pavone)
•Jack Woollen - EMC•Russ Treadon - EMC•Mark Iredell - EMC•Istvan Szunyogh – Univ. of Maryland
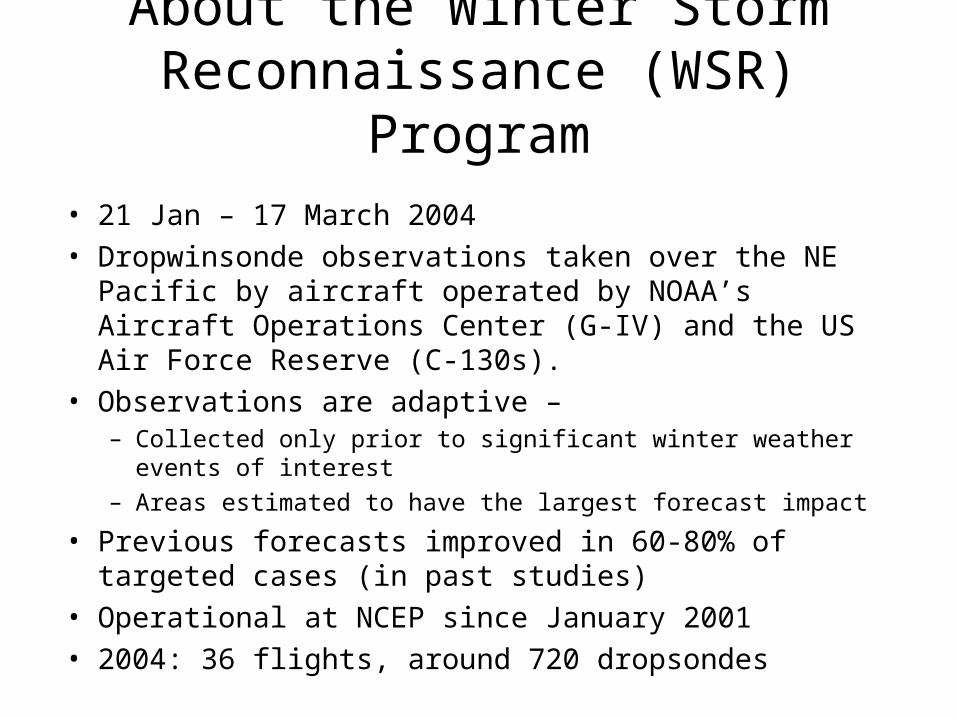
About the Winter Storm Reconnaissance (WSR) Program
• 21 Jan – 17 March 2004
• Dropwinsonde observations taken over the NE Pacific by aircraft operated by NOAA’s Aircraft Operations Center (G-IV) and the US Air Force Reserve (C-130s).
• Observations are adaptive – – Collected only prior to significant winter weather events of interest
– Areas estimated to have the largest forecast impact
• Previous forecasts improved in 60-80% of targeted cases (in past studies)
• Operational at NCEP since January 2001
• 2004: 36 flights, around 720 dropsondes
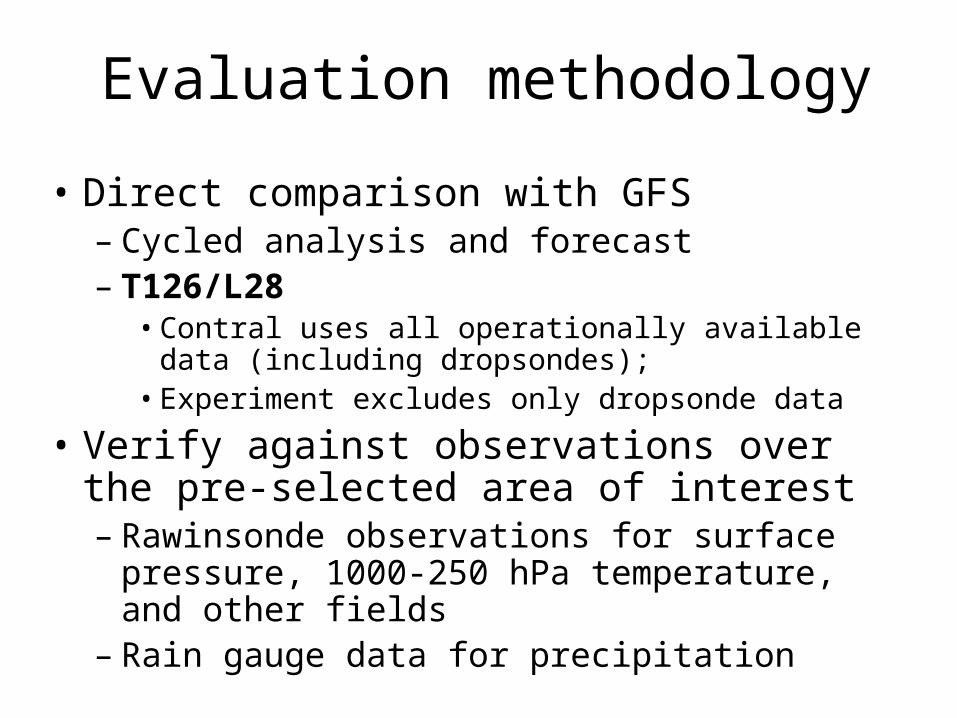
Evaluation methodology
• Direct comparison with GFS– Cycled analysis and forecast– T126/L28
• Contral uses all operationally available data (including dropsondes);
• Experiment excludes only dropsonde data
• Verify against observations over the pre-selected area of interest– Rawinsonde observations for surface pressure,
1000-250 hPa temperature, and other fields– Rain gauge data for precipitation
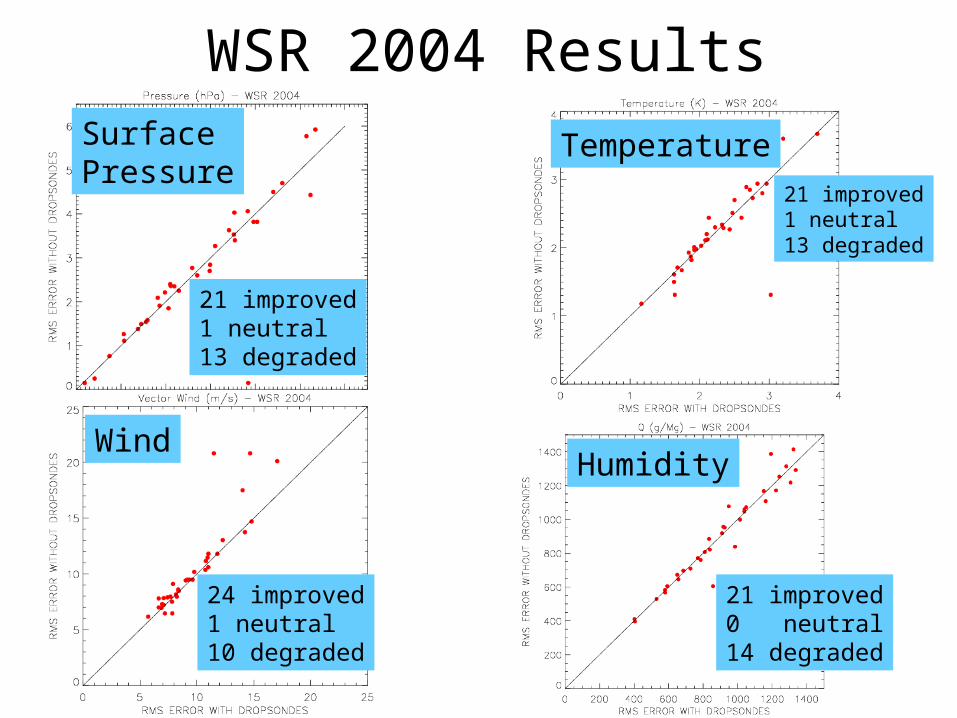
WSR 2004 ResultsSurfacePressure
Temperature
21 improved1 neutral13 degraded
21 improved1 neutral13 degraded
Wind
24 improved1 neutral10 degraded
Humidity
21 improved0 neutral14 degraded
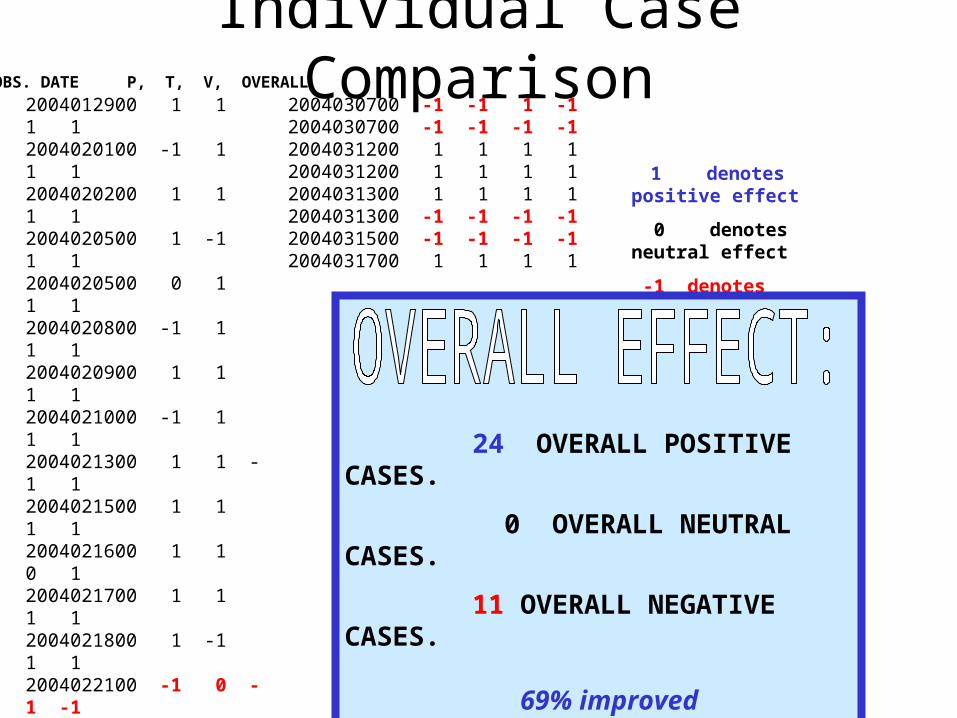
Individual Case Comparison
1 denotes positive effect
0 denotes neutral effect
-1 denotes negative effect
2004012900 1 1 1 12004020100 -1 1 1 12004020200 1 1 1 12004020500 1 -1 1 12004020500 0 1 1 12004020800 -1 1 1 12004020900 1 1 1 12004021000 -1 1 1 12004021300 1 1 -1 12004021500 1 1 1 12004021600 1 1 0 12004021700 1 1 1 12004021800 1 -1 1 12004022100 -1 0 -1 -12004022200 1 1 1 12004022300 1 -1 -1 -12004022400 1 1 1 12004022500 1 -1 1 12004022600 1 1 1 12004022600 -1 -1 1 -12004022600 1 1 -1 12004022700 1 1 1 12004022800 -1 -1 1 -12004030200 1 1 1 12004030600 -1 -1 -1 -12004030600 -1 -1 -1 -12004030600 -1 -1 -1 -1
2004030700 -1 -1 1 -12004030700 -1 -1 -1 -12004031200 1 1 1 12004031200 1 1 1 12004031300 1 1 1 12004031300 -1 -1 -1 -12004031500 -1 -1 -1 -12004031700 1 1 1 1
OBS. DATE P, T, V, OVERALL
24 OVERALL POSITIVE CASES.
0 OVERALL NEUTRAL CASES.
11 OVERALL NEGATIVE CASES.
69% improved 31% degraded
Future Work
• Examine the effect of dropsondes on precipitation• Examine negative cases in detail• Improve targeting method by reducing spurious or
misleading guidance due to statistical sampling problems
• Investigate possibility of future NCEP Atlantic Winter Storm experiment
ATReC Prelim. Results
• Methodology similar to WSR

ATReC Results
35 improved 2 neutral10 degraded
SurfacePressure
Temperature
42 improved 0 neutral 5 degraded
Wind
37 improved 0 neutral10 degraded
Humidity
43 improved 0 neutral 4 degraded

Individual Case ComparisonCASE P, T, V, Q, OVERALL
1 1 1 1 1 1 2 -1 1 -1 -1 -1 3 1 1 1 1 1 4 1 1 -1 1 1 5 1 1 1 1 1 6 -1 1 1 1 1 7 1 1 1 1 1 8 -1 1 1 1 1 9 1 1 1 1 1 10 1 1 1 1 1 11 1 1 1 1 1 12 1 1 1 1 1 13 1 1 1 1 1 14 1 1 1 1 1 15 1 1 -1 1 1 16 1 1 1 1 1 17 1 -1 1 1 1 18 -1 -1 -1 1 -1 19 1 1 1 1 1 20 1 1 1 1 1 21 1 -1 -1 1 0 22 1 1 1 1 1 23 1 1 1 1 1 24 0 1 1 -1 1
25 1 1 1 1 1 26 -1 1 1 1 1 27 1 1 1 1 1 28 1 1 1 1 1 29 1 1 1 1 1 30 1 1 1 1 1 31 1 -1 1 1 1 32 1 -1 1 -1 0 33 1 1 1 1 1 34 1 1 1 1 1 35 -1 1 -1 1 0 36 -1 1 1 1 1 37 -1 1 -1 1 0 38 1 1 1 1 1 39 0 1 -1 1 1 40 1 1 -1 1 1 41 -1 1 1 -1 0 42 1 1 1 1 1 43 1 1 1 1 1 44 -1 1 -1 1 0 45 1 1 1 1 1 46 1 1 1 1 1 47 1 1 1 1 1
1 denotes positive effect
0 denotes neutral effect
-1 denotes negative effect
39 OVERALL POSITIVE CASES.
6 OVERALL NEUTRAL CASES.
2 OVERALL NEGATIVE CASES.83% improved39% neutral4% degraded
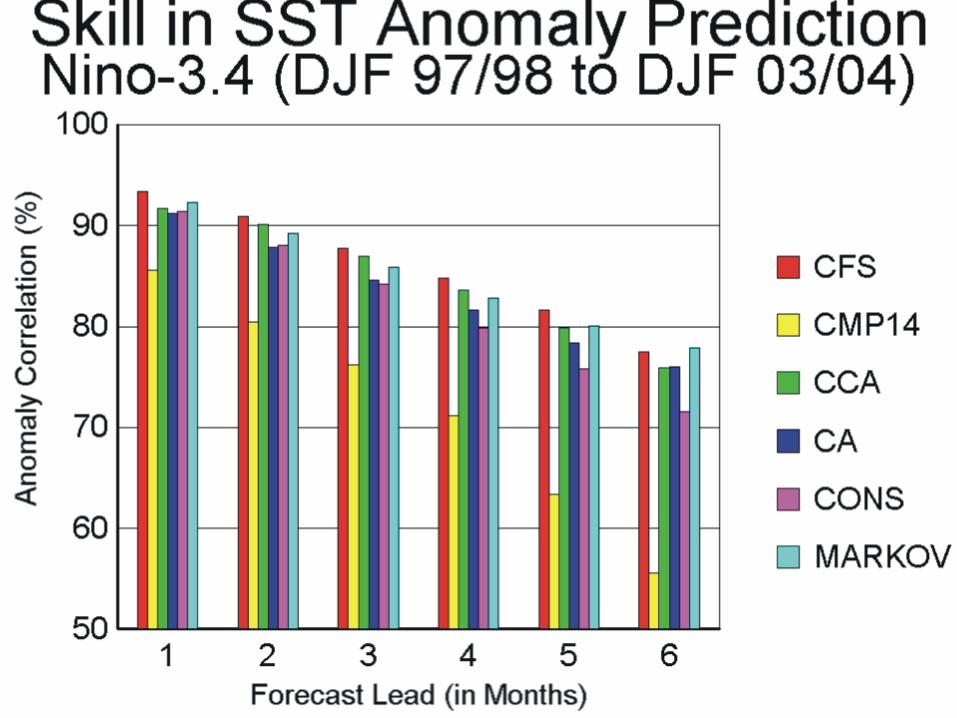
Simulation of the Coupled Atmosphere-Ocean-Land Surface System and Hindcast Skill in SST Prediction
with the New Coupled NCEP Ocean-Atmosphere Model
Suranjana Saha*, Wanqiu Wang*,
Hua-Lu Pan* and Huug van den Dool**
*Environmental Modeling Center
**Climate Prediction Center
NCEP, NWS, NOAA
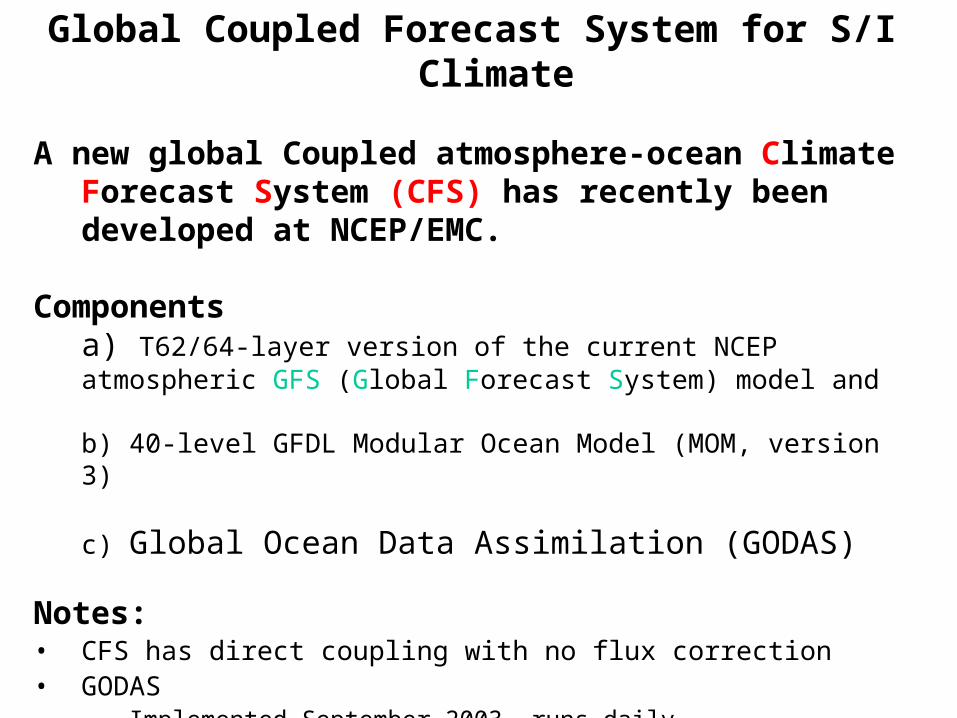
Global Coupled Forecast System for S/I Climate
A new global Coupled atmosphere-ocean Climate Forecast System (CFS) has recently been developed at NCEP/EMC.
Componentsa) T62/64-layer version of the current NCEP atmospheric GFS (Global Forecast System) model and
b) 40-level GFDL Modular Ocean Model (MOM, version 3)
c) Global Ocean Data Assimilation (GODAS)
Notes:• CFS has direct coupling with no flux correction• GODAS
– Implemented September 2003, runs daily– Salinity analysis, improved use of altimeter data– Real time global ocean data base in WMO standard format– Ready for GODAE
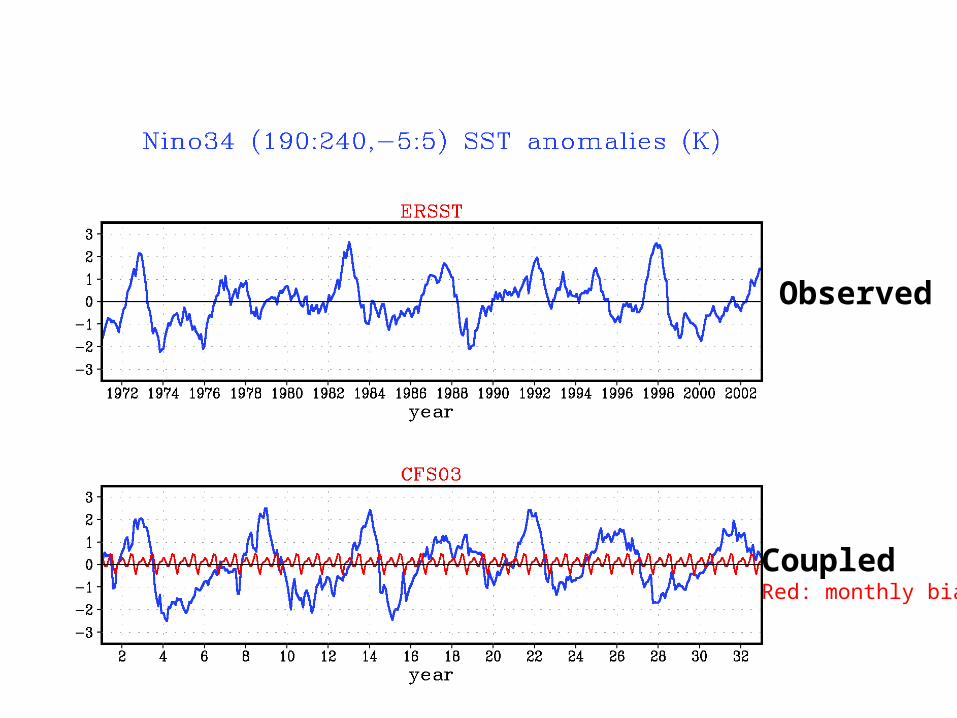
CoupledRed: monthly bias
Observed
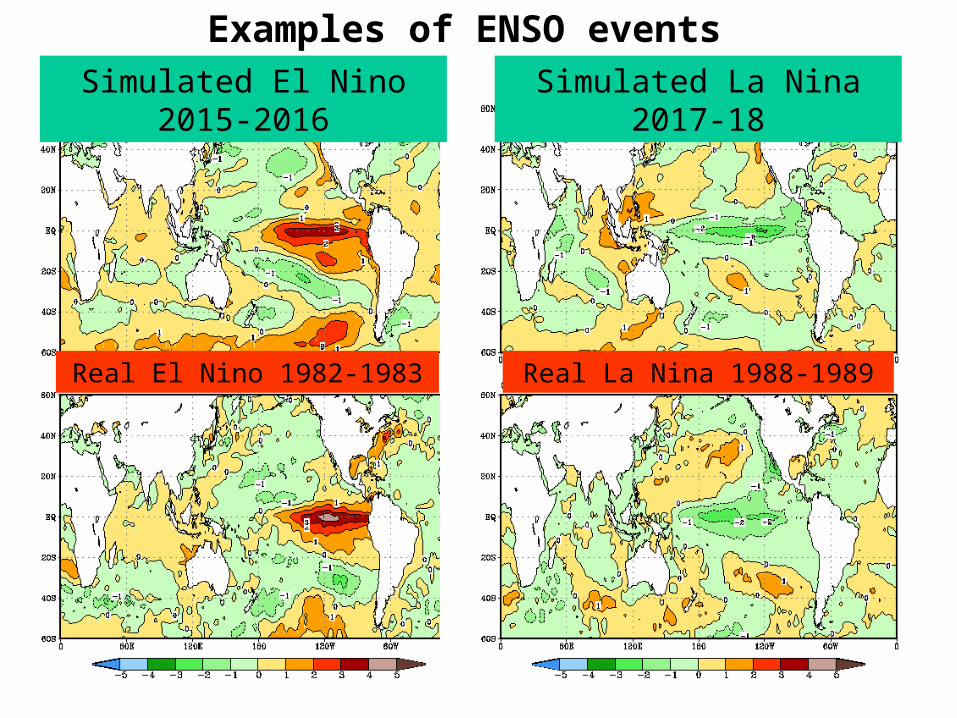
Examples of ENSO eventsSimulated El Nino 2015-2016 Simulated La Nina 2017-18
Real El Nino 1982-1983 Real La Nina 1988-1989
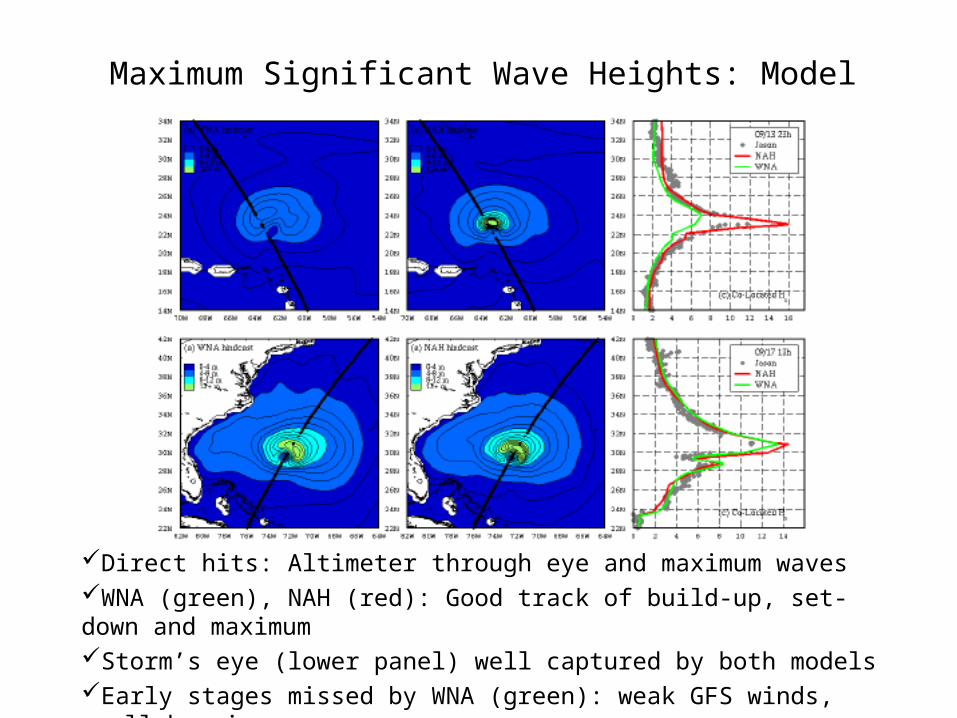
Maximum Significant Wave Heights: Model vs. JASON
Direct hits: Altimeter through eye and maximum wavesWNA (green), NAH (red): Good track of build-up, set-down and maximumStorm’s eye (lower panel) well captured by both modelsEarly stages missed by WNA (green): weak GFS winds, small hurricanes

North American Ensemble Forecast System Project
• Joint Canadian-US project• Goals
– Accelerate improvements in operational weather forecasting through Canadian-US collaboration
– Seamless (across boundary and in time) suite of ensemble products
• Planned activities– Ensemble data exchange (June 2004)– R&D (2003-2007)
• Statistical postprocessing• New product development• Verification and evaluation
– Operational implementation (2004-2008)
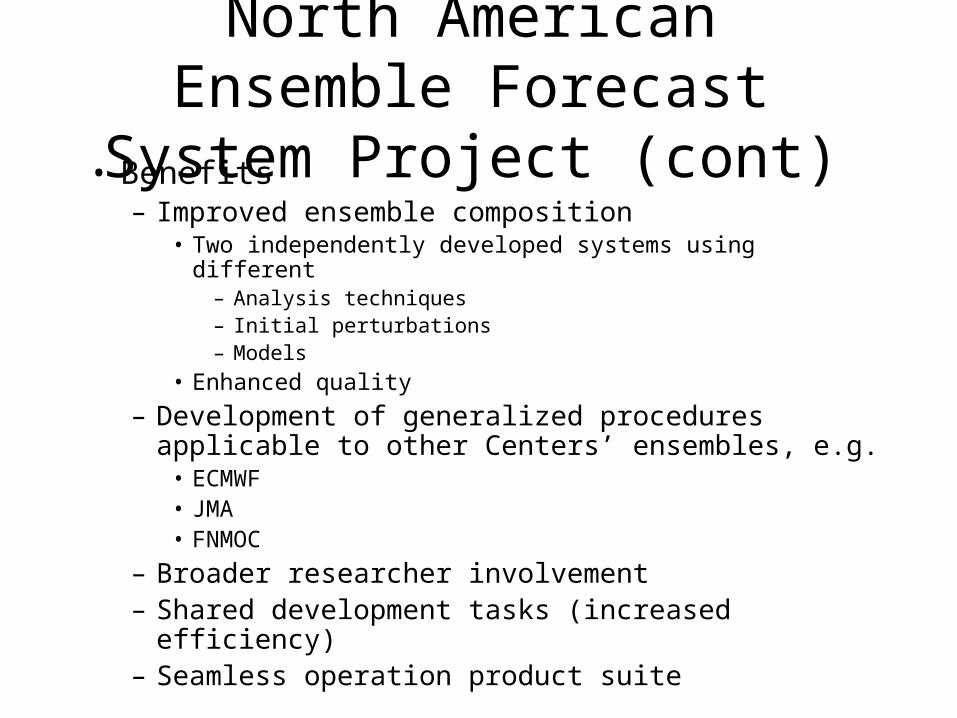
North American Ensemble Forecast System Project (cont)
• Benefits– Improved ensemble composition
• Two independently developed systems using different– Analysis techniques– Initial perturbations– Models
• Enhanced quality
– Development of generalized procedures applicable to other Centers’ ensembles, e.g.
• ECMWF• JMA• FNMOC
– Broader researcher involvement– Shared development tasks (increased efficiency)– Seamless operation product suite
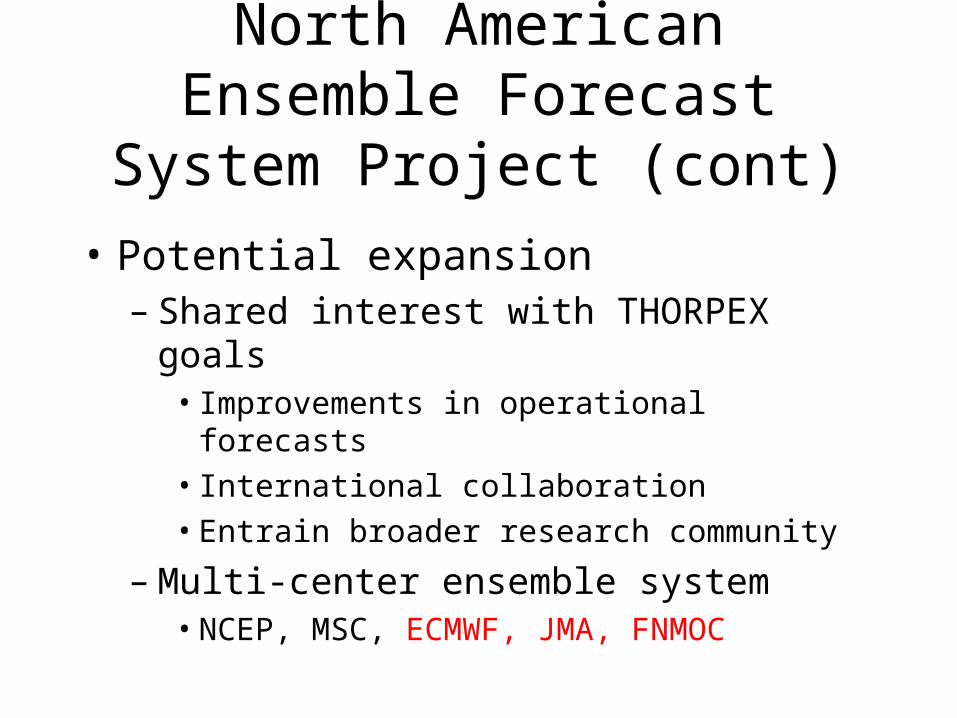
North American Ensemble Forecast System Project (cont)
• Potential expansion– Shared interest with THORPEX goals
• Improvements in operational forecasts
• International collaboration
• Entrain broader research community
– Multi-center ensemble system• NCEP, MSC, ECMWF, JMA, FNMOC