ncds risk factors in cambodia, 2010 · prevalence of non-communicable disease risk factors in...
TRANSCRIPT

University of Health Sciences Ministry of Health
PREVALENCE OF
NON-COMMUNICABLE DISEASE
RISK FACTORS IN CAMBODIA
STEPS Survey
Country Report, September 2010

This survey was jointly prepared by
the University of Health Sciences and the Preventive Medicine Department of the Ministry
of Health, Kingdom of Cambodia, with support from
the World Health Organization.
The views expressed in this report are the views of the authors and do not necessarily reflect
the views or policies of the World Health Organization.
All photos used in this report are copyright of the University of Health Sciences and the
Preventive Medicine Department.

PREVALENCE OF NON-COMMUNICABLE DISEASE
RISK FACTORS IN CAMBODIA
STEPS Survey, Country Report, September 2010
Report prepared by:
OUM Sophal1
PRAK Piseth Raingsey2
KHUON Eng Mony²
MEY Vannareth¹
AIM Sothea¹
BOUNCHAN Youttiroung¹
CIN Sovannara¹
PEN Linda¹
LOUN Sathia¹
1 University of Health Sciences, 73 Monivong Blvd., Phnom Penh, Cambodia
(E-mail: [email protected])
2 Preventive Medicine Department, Ministry of Health, 151-153 Kampuchea Krom
Blvd., Phnom Penh, Cambodia (E-mail: [email protected])


i
TABLE OF CONTENTS
TABLE OF CONTENTS ................................................................................................................. i
LIST OF TABLES .......................................................................................................................iii
LIST OF FIGURES ...................................................................................................................... vi
ABBREVIATIONS ..................................................................................................................... vii
FOREWORD .......................................................................................................................... ix
ACKNOWLEDGEMENTS ............................................................................................................. x
SUMMARY OF FINDINGS .......................................................................................................... xi
CHAPTER I: INTRODUCTION .................................................................................................. 1
1.1 Statement of the problem ............................................................................................. 2
1.2 Previous surveys on NCDs .......................................................................................... 2
1.3 Aim and Objectives of the Survey ............................................................................... 3
CHAPTER II: SURVEY METHODOLOGY ................................................................................... 5
2.1 Survey design/scope .................................................................................................... 6
2.2 Survey population and sampling ................................................................................. 7
2.3 Training ....................................................................................................................... 8
2.4 Data collection ........................................................................................................... 10
2.5 Summary of combined risk factors for developing NCDs ........................................ 15
2.6 Data entry and cleaning ............................................................................................. 15
2.7 Weighting of data ...................................................................................................... 15
2.8 Data analysis .............................................................................................................. 15
CHAPTER III: SURVEY RESULTS ............................................................................................ 17
3.1 Description of the sample .......................................................................................... 18
3.2 Tobacco use ............................................................................................................... 26
3.3 Alcohol Consumption ................................................................................................ 34
3.4 Eating pattern ............................................................................................................. 43
3.5 Physical Activity ....................................................................................................... 47
3.6 Blood Pressure and Diabetes History ........................................................................ 51
3.7 Physical Measurements ............................................................................................. 58

ii
3.8 BIOCHEMICAL MEASUREMENTS ................................................................................. 70
3.9 Summary of Combined Risk Factors ........................................................................ 75
Chapter IV: Discussion ....................................................................................................... 77
4.1 NCD risk factors ........................................................................................................ 78
4.2 Strengths and limitations ........................................................................................... 80
4.3 Conclusion ................................................................................................................. 81
4.4 Recommendations ..................................................................................................... 81
References…………………………………………………………………………………..82
APPENDICES ......................................................................................................................... 83
Appendix 1: Sample Size Calculation ................................................................................... 84
Appendix 2: Selection of clusters .......................................................................................... 85
Appendix 3: List of selected clusters ..................................................................................... 86
Appendix 4: Questionnaires .................................................................................................. 94
Appendix 5: Show cards ...................................................................................................... 108
Appendix 6: Participant Feedback Form (Step 2) ............................................................... 110
Appendix 7: Participant Feedback Form (Step 3) ............................................................... 111
Appendix 8: BMI Classification Chart ................................................................................ 112
Appendix 9: Weighting of data ........................................................................................... 113
Appendix10: Team members .............................................................................................. 115
Appendix 11: Data Book for Cambodia (whole country) ................................................... 117
Appendix 12: Fact Sheet ..................................................................................................... 167

iii
LIST OF TABLES
Table 1: Percentage of responses by background characteristic and STEPS level ............... 20
Table 2: Demographic indicators .......................................................................................... 21
Table 3: Marital status of respondents ................................................................................... 22
Table 4: Highest level of education achieved by the survey respondents ............................. 24
Table 5: Household income ................................................................................................... 24
Table 6: Proportion of respondents in paid employment and those who are unpaid in the past
year ................................................................................................................................ 25
Table 7: Proportion of respondents in unpaid work over the past year ................................. 25
Table 8: Percent distribution of the smoking status of all respondents ................................. 26
Table 9: Prevalence of daily smokers among current smokers and mean age of initiation of
smoking, in years, among daily smokers ....................................................................... 27
Table 10: Prevalence and mean amount of smoking by types of tobacco among daily
smokers .......................................................................................................................... 28
Table 11: Percentage of ex-daily smokers among all respondents and the mean duration, in
years, since ex-daily smokers quit smoking daily ......................................................... 29
Table 12: Percentage of current users of smokeless tobacco among all respondents ........... 30
Table 13: Mean times per day of smokeless tobacco used by smokeless tobacco users ....... 31
Table 14: Percentage of daily and current (daily plus non-daily) tobacco users, includes
smoking and smokeless, among all respondents ........................................................... 32
Table 15: Percentage of respondents exposed to ETS in home and in the workplace on one
or more days in the past 7 days ..................................................................................... 33
Table 16: Alcohol consumption status of all respondents ..................................................... 35
Table 17: Drinking categories of all respondents .................................................................. 36
Table 18: Drinking categories of current (past 30 days) drinkers ......................................... 37
Table 19: Frequency of alcohol consumption of respondents in the past 12 months ............ 38
Table 20: Mean number of drinking occasions in the past 30 days, and number of standard
drinks per drinking occasion among current drinkers ................................................... 39
Table 21: Heavy drinking among the total respondents and current drinkers ....................... 40
Table 22: Frequency and quantity of drinks consumed in the past 7 days among current
drinkers .......................................................................................................................... 41

iv
Table 23: Percent distribution of current (past 30 days) drinkers who usually, sometimes,
rarely or never drink alcohol with meals ....................................................................... 42
Table 24: Mean number of days of fruit and vegetable consumption in a typical week ....... 43
Table 25: Mean number of fruit and vegetable servings per day .......................................... 44
Table 26: Frequency of fruit and/or vegetables consumption per day .................................. 45
Table 27: Type of oil or fat most often used for meal preparation in household .................. 46
Table 28: Percentage of respondents classified into three categories of total physical activity
....................................................................................................................................... 47
Table 29: Minutes of total physical activity on average per day ........................................... 48
Table 30: Percentage of respondents classified as doing no physical activity ...................... 49
Table 31: Percentage of activities contributing to total physical activity ............................. 50
Table 32 Minutes spent in sedentary activities on a typical day ........................................... 50
Table 33: Percentage of blood pressure measurement and diagnosis among all respondents
....................................................................................................................................... 52
Table 34: Raised blood pressure treatment results among those previously diagnosed with
raised blood pressure ..................................................................................................... 53
Table 35: Percentage of respondents who have sought advice or received treatment from
traditional healers for raised blood pressure among those previously diagnosed with
raised blood pressure ..................................................................................................... 54
Table 36: Blood sugar measurement and diagnosis among all respondents ......................... 55
Table 37: Diabetes treatment results among those previously diagnosed with raised blood
sugar or diabetes ............................................................................................................ 56
Table 38: Percentage of respondents who have sought advice or treatment from traditional
healers for diabetes among those previously diagnosed ................................................ 57
Table 39: Percentage of respondents (excluding pregnant women) in each BMI category .. 59
Table 40: Mean waist and hip circumference measurement (cm) and waist to hip ratio
(pregnant women excluded) .......................................................................................... 61
Table 41: Category of waist circumference of respondents (pregnant women excluded) by
urban and rural residence ............................................................................................... 63
Table 42: Mean blood pressure and heart rate ...................................................................... 65
Table 43: Percentage of respondents with raised blood pressure including those currently on
medication for raised blood pressure ............................................................................. 67
Table 44: Percentage of respondents with raised blood pressure excluding those on
medication for raised blood pressure ............................................................................. 67
v
Table 45: Percentage of respondents with treated and/or controlled raised blood pressure
among those with raised blood pressure or currently on medication for raised blood
pressure .......................................................................................................................... 69
Table 46: Mean fasting blood glucose results including those currently on medication for
diabetes (non-fasting recipients excluded) .................................................................... 70
Table 47: Proportion of respondents with impaired, raised blood glucose or currently on
medication for diabetes (non-fasting recipients excluded) ............................................ 72
Table 48: Mean total cholesterol among all respondents including those currently on
medication for raised cholesterol ................................................................................... 73
Table 49: Proportion of respondents with raised cholesterol or currently on medication for
raised cholesterol ........................................................................................................... 74
Table 50: Summary of Combined Risk Factors for NCDs .................................................... 75
vi
LIST OF FIGURES
Figure 1: Map of Cambodia with location of survey clusters ................................................. 8
Figure 2: Training of data collectors, UHS-C Jan. 2010 ......................................................... 9
Figure 3: Diagram illustrating different stages in data collection ......................................... 19
Figure 4: Mean number of years of education among all respondents .................................. 23
Figure 5: Percent of alcohol drinking for at least 4 days in the past 7 days .......................... 41
Figure 6: Average numbers of meals per week eaten outside home ..................................... 46
Figure 7: Mean weight (kg) and height (cm) of respondents by residence and gender ........ 58
Figure 8: Percentage of BMI≥ 25 kg/m2
by age groups, gender and residence .................... 60
Figure 9: Percentage of respondents with high WHR by age groups, residence and gender 62
Figure 10: Percentage of respondents with waist circumference out of the normal range, by
residence, gender, and age groups (pregnant women excluded) ................................... 64

vii
ABBREVIATIONS
BMI Body Mass Index
CI Confidence Interval
CVD Cardiovascular Disease
DBP Diastolic Blood Pressure
ETS Environmental Tobacco Smoke
EU Elementary Unit
i.e. That is
IFG Impaired Fasting Glucose
IGT Impaired Glucose Tolerance
HC Hip Circumference
HT Hypertension
KAP Knowledge, Attitude and Practice
MET Metabolic Equivalent Test
n Number of respondents
NA Not Available
NCD Non-Communicable Disease(s)
PA Physical Activity
PDA Personal Digital Assistant
PSU Primary Sampling Unit
SSU Secondary Sampling Unit
SBP Systolic Blood Pressure
STEPS WHO STEPwise approach to Surveillance
TSU Tertiary Sampling Unit
WC Waist Circumference
WHO World Health Organization
WHR Waist to Hip Ratio

ix
FOREWORD
This report of the first ever countrywide survey to assess risk factors of non-communicable
diseases in Cambodia provides valuable information that will assist the Ministry of Health
to refine its strategies to better prevent and control of these diseases in the country.
Although the prevalence of diabetes and hypertension are found to be relatively low in
comparison with many countries in the region, the survey revealed that major risk factors
for non-communicable diseases are relatively high including tobacco smoking, alcohol
consumption, and overweight.
The Ministry of Health urges relevant ministries, development partners, and the community
to join hands in scaling up interventions to prevent and control non-communicable diseases,
especially through promoting behavior changes among the high risk population towards
healthier lifestyle.
I wish to take this opportunity to express my sincere thanks to the World Health
Organization for providing financial and technical support to this survey.
Finally, I wish to extend my appreciation to Prof. OUM Sophal and Dr PRAK Piseth
Rainsey for successfully leading the research teams from the University of Health Sciences
and the Preventive Medicine Department in conducting the first nationwide representative
survey using the WHO standardized protocol to report the prevalence and risk factors of
non-communicable diseases in Cambodia.

x
ACKNOWLEDGEMENTS
We would like first and foremost to thanks the World Health Organization (WHO) both
from the Headquarter and Regional Office in Manila for financing this survey and for
providing technical assistance throughout the different stages of the survey.
To Dr. Regina Guthold, WHO Geneva, who has provided the training of our data collectors
and filed supervisors, and Ms. Melanie Cowan who has provided advices and guidance for
the data analysis.
To Dr. Cherian Varghese, Technical Officer for Non Communicable Diseases (NCD),
Western Pacific Regional Office (WPRO) in Manila, who has provided technical advice and
additional financial assistance from WPRO to this study,
To WHO Office in Cambodia, particularly its Representative, Dr Pieter Van Maaren who
has given continuous attention and support to NCD programme in Cambodia and the
outcomes of this NCD survey. Thanks are also extended to the WHO-Cambodia NCD Team
that has provided administrative and technical assistance to this work.
The authors would like to thank all Provincial Health Departments and local authorities for
their support through the facilitation of the data collection in their respective catchment
area.
We also commend dedication of field supervisors from the Preventive Medicine Department
and from the University of Health Sciences-Cambodia and the hard work of the survey
Team who undertook data collection throughout the country. Their dedication, meticulous
attention to detail and strict adherence to the survey instruction had insured the quality of
the data presented in this report.

xi
SUMMARY OF FINDINGS
The survey on the prevalence of non-communicable disease risk factors in Cambodia is a
nationwide cross–sectional survey that was carried out in the whole country from February
to April 2010 by using the WHO STEPwise approach to chronic disease risk factor
Surveillance methodology. The goal of the survey was to determine the prevalence of risk
factors of non-communicable diseases and to establish the baseline information for the
prevention and control of these diseases in the country.
In accordance with multi-stage cluster sampling for non-communicable disease
surveillance, a total 5,643 participants were randomly selected in order to provide an
equivalent distribution of the participants in regards to age groups (10-year age groups) and
gender taking into consideration a non-response rate of 20%. Survey data were obtained
from 5,433 adult participants aged 25-64 years, with a response rate of 96.3%.
Out of the total respondents (n=5433), 29.4% and 37.0% were reportedly current (daily and
non-daily) tobacco smokers and users (smoking and smokeless) respectively, whereas
55.2% were exposed to passive smoking at home and/or workplace in the past 7 days prior
to the survey. In addition, 26.4% and 33.7% of the total respondents were daily tobacco
smokers and users respectively. Finally, men were more likely than women to smoke and
use tobacco daily; whereas rural respondents were more likely than urban respondents to
smoke and use tobacco on a daily basis.
Regarding alcohol consumption, 1 in every 4 respondents (26.5%) was lifetime alcohol
abstainers whereas 1 in every 10 respondents (10.0%) was past 12 months abstainers. On
the contrary, 1 in every 2 respondents (53.5%) was past 30 days current drinkers, and this
proportion was similar between the urban and rural areas, but 2.4 times higher in men than
in women. Finally, men were around 10 times more likely than women to be engaged in
heavy episodic drinking in the past 30 days, both in the urban and rural areas.
Fruit and vegetable consumption was in general low, with 84.3% of the total respondents
were reportedly eating less than five servings of fruit and/or vegetables per day and are
therefore considered at increased risk of developing NCDs. This proportion of respondents
eating low fruit and vegetables was similar between men and women and across age groups,
xii
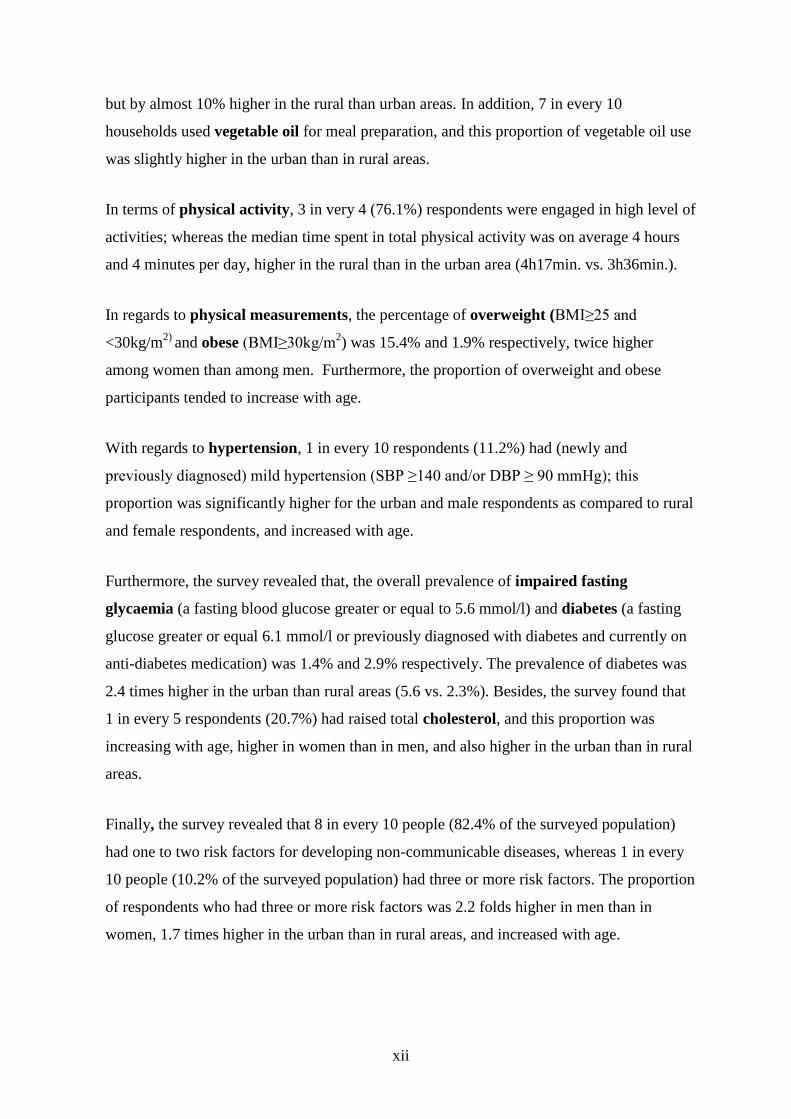
but by almost 10% higher in the rural than urban areas. In addition, 7 in every 10
households used vegetable oil for meal preparation, and this proportion of vegetable oil use
was slightly higher in the urban than in rural areas.
In terms of physical activity, 3 in very 4 (76.1%) respondents were engaged in high level of
activities; whereas the median time spent in total physical activity was on average 4 hours
and 4 minutes per day, higher in the rural than in the urban area (4h17min. vs. 3h36min.).
In regards to physical measurements, the percentage of overweight (BMI≥25 and
<30kg/m2)
and obese (BMI≥30kg/m2) was 15.4% and 1.9% respectively, twice higher
among women than among men. Furthermore, the proportion of overweight and obese
participants tended to increase with age.
With regards to hypertension, 1 in every 10 respondents (11.2%) had (newly and
previously diagnosed) mild hypertension (SBP ≥140 and/or DBP ≥ 90 mmHg); this
proportion was significantly higher for the urban and male respondents as compared to rural
and female respondents, and increased with age.
Furthermore, the survey revealed that, the overall prevalence of impaired fasting
glycaemia (a fasting blood glucose greater or equal to 5.6 mmol/l) and diabetes (a fasting
glucose greater or equal 6.1 mmol/l or previously diagnosed with diabetes and currently on
anti-diabetes medication) was 1.4% and 2.9% respectively. The prevalence of diabetes was
2.4 times higher in the urban than rural areas (5.6 vs. 2.3%). Besides, the survey found that
1 in every 5 respondents (20.7%) had raised total cholesterol, and this proportion was
increasing with age, higher in women than in men, and also higher in the urban than in rural
areas.
Finally, the survey revealed that 8 in every 10 people (82.4% of the surveyed population)
had one to two risk factors for developing non-communicable diseases, whereas 1 in every
10 people (10.2% of the surveyed population) had three or more risk factors. The proportion
of respondents who had three or more risk factors was 2.2 folds higher in men than in
women, 1.7 times higher in the urban than in rural areas, and increased with age.
CHAPTER I:
INTRODUCTION
“A mounting problem for Cambodian health services is the growing
likelihood of population morbidity and mortality from non-
communicable disease before a parallel decrease in communicable
disease takes place – i.e. the emergence of a classic double burden of
disease scenario” (National Strategy for the Prevention and Control of
Non Communicable Diseases in Cambodia 2007-2010)
Chapter I-Introduction Page 2
Cambodia is a developing country with a population of around 14 million inhabitants, of
which 85% live in rural areas. The country is located in Southeast Asia, bordered with
Thailand to the west, Laos PDR and Thailand to the north and Vietnam to the east. It has an
area of 181,035 square kilometers and is comprised of 23 provinces/municipalities and the
capital. Districts (Srok in the rural area and Khan in the urban area) are the second-level
administrative divisions whereas communes (Khum in the rural area and Sangkat in the
urban area) are the third-level administrative divisions of the country. Villages (Phum) are
the lowest-level administrative divisions.
Cambodia's per capita income is rapidly increasing, but is lower compared with many other
countries in the region. Most rural households depend on agriculture and its related sub-
sectors.
1.1 Statement of the problem
Cambodia like many developing countries are presently facing the threat of emerging
obesity and non-communicable diseases (NCDs) while they are still struggling with
malnutrition, endemic and infectious diseases epidemic (1). The country has therefore to
deal with this 'double burden' of diseases in a most cost-effective manner.
1.2 Previous surveys on NCDs
Epidemiological surveys conducted in 2004 showed that in two villages of Siem Reap
province representing rural area 5% of adults had diabetes and 12% high blood pressure,
whereas in 2 villages of Kompong Cham province representing semi-urban area 10% of
adults had diabetes and 25% high blood pressure (2).
In regards to tobacco use, a nation-wide survey in 2005-2006 reported a high prevalence of
Environmental Tobacco Smoke (ETS) exposure among adult Cambodians, with one third of
nonsmoking respondents exposed to ETS and male urban respondents more likely to be
exposed to ETS in workplace (3). The survey also found that 48% of men and 3.6% of

Chapter I-Introduction Page 3
women smoked cigarettes, while 17% of women and 1% of men chewed tobacco; about half
of all older women chewed tobacco, especially midwives and traditional healers, and up to
two-third of ethnic population smoked cigarette and pipe tobacco (3, 4) .
1.3 Aim and Objectives of the Survey
1.3.1 Survey aim
The overall goal of the survey was to estimate the prevalence of NCD risk factors in order
to establish the baseline information for the prevention and control of NCDs in Cambodia.
1.3.2 Survey objectives
To determine the prevalence of NCD risk factors including tobacco, alcohol, fruit
and vegetable consumption, overweight and physical activity of the surveyed
population;
To estimate the prevalence of hypertension, diabetes and raised blood cholesterol
among adult male and female population; and
To compare NCD risk factor prevalence between urban and rural population, men
and women, and across age groups.
1.3.3 Survey rationale
Data on NCDs, on one hand, were not captured by the formal Health Information
System (HIS) of the Ministry of Health (MoH). Even if these data were reported by
hospitals and other public health facilities, they would not represent the country‟s
situation, as many cases were treated at home, or did not come to public health
facilities.
Data from previous surveys, on the other hand, were either limited in terms of
representativeness or scope, or did not reflect the current situation of NCDs in
Cambodia. There is a need for comprehensive, updated and representative
Chapter I-Introduction Page 4
information on the prevalence and risk factors of NCDs in order to develop
appropriate policy and interventions to effectively prevent and control NCDs before
they overwhelm the country‟s health services and scarce resources.
Surveys using the WHO STEPwise approach to chronic disease risk factor
Surveillance (STEPS) methodology have so far provided reliable and valid
information on NCD risk factor prevalence in many countries worldwide. The WHO
STEPS survey could provide the main epidemiological surveillance system and the
main tool for monitoring progress in the control of NCDs in Cambodia.
Finally, the survey responded to the National Strategy for the Prevention and
Control of NCDs of the Cambodian MoH in developing “a sustainable effective
surveillance system based on WHO STEPs framework and in due course
strengthening of the existing health information system” (5).
CHAPTER II:
SURVEY METHODOLOGY

Chapter II-Survey Methodology Page 6
2.1 Survey design/scope
The Cambodian survey on the prevalence of NCD risk factors was designed to establish
baseline information on the major risk factors of NCDs for the action plan implemented
within the framework of the National Strategy for the Prevention and Control of NCDs
2007-2010.
The survey was conducted through three subsequent steps after developing survey
instruments in line with the concept of the WHO STEPwise approach to Surveillance taking
into account local needs and resources.
Step 1: Face-to-face interview – demographic information, information on tobacco use,
alcohol consumption, fruit and vegetable intake, oil and fat consumption, physical activity,
previously diagnosed hypertension and diabetes, were collected by using appropriate
questionnaires.
Step 2: Physical measurements- body weight and height, waist and hip circumferences, and
blood pressure were identified by using specific tests/devices relevant to these
measurements.
Step 3: Biochemical measurements – capillary blood to determine glucose and total
cholesterol at the data collection sites using dry chemical methods.
The WHO STEPwise questionnaire was used in this survey after translation into the Khmer
language by taking into consideration specific country characteristics and similar translated
questions used by previous health surveys in Cambodia (See Appendix 4 for the
Questionnaire).

Chapter II-Survey Methodology Page 7
2.2 Survey population and sampling
The initial planned sample size was designed to involve 5,760 persons in accordance with
the NCD multi-stage cluster survey method (1.5 design effect, 95% confidence interval, 5%
margin of error, and 50% baseline levels of the indicators) in order to provide an equivalent
distribution of the participants in regards to age groups and gender after taking into
consideration that the estimated potential rate for non-response in each age group and
refusals in the next stages would equal to 20%. Estimates were obtained for each of the
following eight age/sex groups: men aged 25-34 yeas, 35-44 years, 45-54 years, and 55-64
years; and women aged 25-34 years, 35-44 years, 45-54 years, and 55-64 years (See
Appendix 1 for the calculation of sample size).
The survey was designed to cover all geographical areas of Cambodia and a 3-stage
sampling process as part of the multi-stage cluster sampling was carried out to randomly
select the target population: random selection of communes (Khum in rural areas and its
equivalent Sangkat in urban area) as primary sampling unit (PSU), followed by villages
(Phum) for the secondary sampling unit (SSU), and by households for the elementary unit
(EU). Finally all members of the randomly chosen households aged 25-64 years were
invited to participate in this survey.
The selection process was performed identically for urban and rural areas in order to get a
self-weighted estimate for the whole population of the country.
A total of 180 clusters with 34 clusters from the urban area and 146 clusters from the rural
area were randomly selected (Figure 1). Method for cluster selection is shown on Appendix
2, and the list of selected clusters is shown on Appendix 3.

Chapter II-Survey Methodology Page 8
Figure 1: Map of Cambodia with location of survey clusters
2.3 Training
Field investigators were recruited from newly graduated midwives, nurses, and laboratory
technicians. Field supervisors were selected from staff of the Preventive Medicine
Department of the Ministry of Health (PMD/MoH) and the Research Unit of the University
of Health Sciences-Cambodia (UHS-C). Staff of the UHS-C also took care of data
management and analysis. The list of survey team members is shown in Appendix 10.
Two training workshops were held at the UHS-C. The first workshop was conducted from
24-26 September 2009, with the participation of key staff from PMD/MoH and UHS-C
including field supervisors, data managers, laboratory technicians and epidemiologists. The
workshop was facilitated by Dr. Regina GUTHOLD, Technical Officer, Chronic Diseases
Chapter II-Survey Methodology Page 9
and Health Promotion, WHO Geneva, and Dr. PRAK Piseth Raingsey, Director of the
PMD/MoH. In the 3-day workshop, the WHO STEPwise approach to Surveillance, the
STEPS manual and other survey tools were presented and discussed. In addition,
participants were explained about planning, role and responsibility of the survey team
members, sampling method, the KISH method for the selection of an individual within
selected households, data collection procedures, data entry processes and management, and
data analysis and reporting.
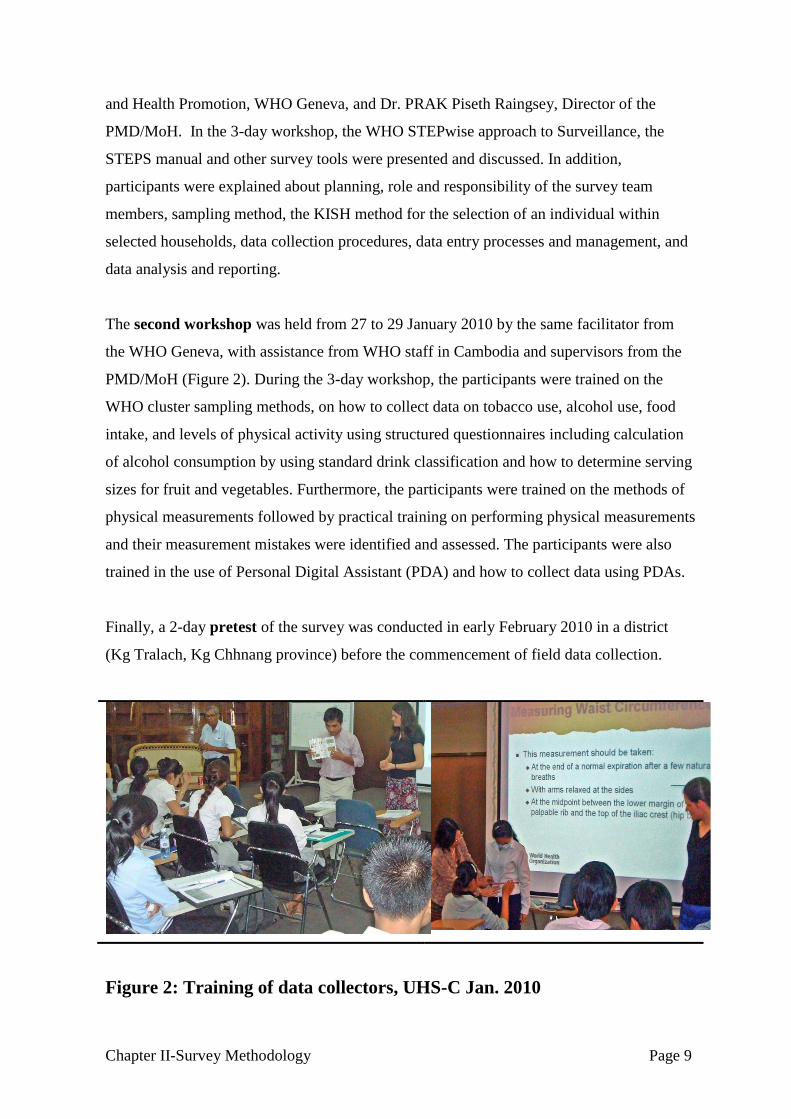
The second workshop was held from 27 to 29 January 2010 by the same facilitator from
the WHO Geneva, with assistance from WHO staff in Cambodia and supervisors from the
PMD/MoH (Figure 2). During the 3-day workshop, the participants were trained on the
WHO cluster sampling methods, on how to collect data on tobacco use, alcohol use, food
intake, and levels of physical activity using structured questionnaires including calculation
of alcohol consumption by using standard drink classification and how to determine serving
sizes for fruit and vegetables. Furthermore, the participants were trained on the methods of
physical measurements followed by practical training on performing physical measurements
and their measurement mistakes were identified and assessed. The participants were also
trained in the use of Personal Digital Assistant (PDA) and how to collect data using PDAs.
Finally, a 2-day pretest of the survey was conducted in early February 2010 in a district
(Kg Tralach, Kg Chhnang province) before the commencement of field data collection.
Figure 2: Training of data collectors, UHS-C Jan. 2010

Chapter II-Survey Methodology Page 10
2.4 Data collection
The data collection was carried from 24 February to 30 April 2010 by a total of 8 teams,
divided into 2 groups. The first group was responsible for collecting data for Step 1, and the
second group was responsible for the collection of data for Step 2 (physical measurement)
and 3 (biochemical measurement). In Group One, each team comprised 5 persons including
a field supervisor and 4 interviewers. In Group Two, each team was composed of 3 persons
including one field supervisor, one midwife and one laboratory technician.
Local administrative and health authorities were informed about the survey two weeks prior
to the commencement of the data collection.
A day before data collection, village leaders were approached and briefed about the survey
goal and objectives. They were also asked to inform the population to remain in the village
the next day, and were requested to provide the list of households in the village. The list of
households from each village was then used by field supervisors to select households by
systemic random sampling.
The day of data collection, each team from Group One interviewed eligible participants in
one village per day. The Team arrived in the selected village in the early morning, and each
team member went looking for selected households with assistance from village volunteers.
Consent forms were distributed to the members of selected households, and individuals
were explained about the goal and objectives of the survey.
The selection of an individual in each household was done using the WHO KISH method,
in which eligible household members names were entered into the PDA by descending
order of age, and men to women. An individual in each household was randomly selected
by the PDA for participation in the survey. Participants were interviewed only after giving
their written consent.
Chapter II-Survey Methodology Page 11
2.4.1 Step 1
Data on behavioral risk factors were collected using a structured questionnaire (See
Appendix 4). An interview lasted on average 30 minutes. Data were collected by an
interviewer with the assistance of a PDA-based questionnaire. The participants were then
enrolled in the next stages (Step 2 and 3) only after giving their consent.
Methods to assess alcohol consumption
Alcohol consumption is recognized as one of the risk factors for NCDs. The terminology
„standard drink‟ was used in the survey in order to give a comparative assessment on
alcohol consumption across different alcoholic beverages. This also provided an easy way
to quantify ethanol intake. In this survey, the volume of one standard drink representing
10g pure alcohol approximated 1 bottle/can/pot (330 ml) of beer or fermented palm juice
alcohol with 4-5% of ethanol, 1 glass (120 ml) of wine/liquor with 12% of ethanol, 1 glass
of 30 ml of rice alcohol or other spirits. Show cards illustrating these quantities were used
for the assessment (See Appendix 5). The definition of heavy episodic drinking for this
survey was the consumption of 5 or more standard drinks for males and 4 or more standard
drinks for females on any day on the past 30 days.
Methods to assess eating habits
Questions on the number of days per week participants ate fruit and vegetables, and
questions on the types of oils used for cooking, were administered to determine eating
habits of the surveyed population.
The mean intake of fruit and vegetables was assessed on the number of „serving size(s)‟ and
the respondents were asked about the average number of serving sizes for fruit and
vegetables consumed per usual day by using show cards (See Appendix 5).
In order to assess fruit and vegetable intake in this survey, one serving size equivalent for 80
grams of fruit and vegetables was considered as equal to one middle-sized piece of fresh
fruit, a glass of fruit juice, 3 to 5 pieces of small-sized fruit, a half cup of dried fruit, a slice
of water melon, a cup of raw vegetables, and a half cup of steamed vegetables.
Chapter II-Survey Methodology Page 12
Methods to measure physical activity
Physical activity was determined by using a set questions directed to measure activity and
frequency of different types of physical activity performed at work (work setting/home),
during transport (go walking, biking and use of different types of active transport) and at
recreation (resting time/recreation settings). Data on the number of days, hours and minutes
of physical activity performed at work, transport and recreation settings for at least 10
minutes per day were collected. This complex set of questions allowed to quantify physical
activity and its intensity levels on an individual through measuring hours and minutes spent
a day. The mean time of total physical activity per day spent for work, transport and
recreational activities was measured by using the standard metabolic equivalent time, or
MET.
The classification of physical activity was defined by high, moderate and low levels of
physical activity and given as follows (6) :
• High levels of physical activity:
Vigorous-intensity activity on at least 3 days achieving a minimum total physical
activity of at least 1500 MET-minutes/week; or
Seven or more days of any combination of walking, moderate intensity or
vigorous intensity activities achieving a minimum total physical activity of at
least 3,000 MET – minutes/week spent as part of work, during transport or at
leisure taken together.
• Moderate levels of physical activity:
Three or more days of vigorous activity of at least 20 minutes per day; or
Five or more days of moderate-intensity activity or/and walking of at least 30
minutes per day; or
Five or more days of any combination of walking, moderate intensity or
vigorous intensity activities achieving a minimum total physical activity of at
least 600 MET minutes/week
• Low levels of physical activity
Those individuals who do not meet criteria for moderate or high are considered having low
levels of physical activity.

Chapter II-Survey Methodology Page 13
2.4.2 Step 2
Step 2 was performed by teams from Group Two the day after the interview was conducted
by Teams from Group One. At this stage, physiological measurements on blood pressure,
body weight, height, waist and hip circumferences were obtained.
Body weight and height
Linkgold Electronic Body Scale, HCS-200-RT model, made by Shanghai Medical
Instrument Co. Ltd (http://www.linkgolddent.com/product-291.html) was used to measure
the weight and height of participants in the survey. The scale, operated by rechargeable
batteries, was able to weight from up to 200 kg with a precision of 100 grams, and able to
measure height from up to 210 cm with a precision of 0.5 centimeter difference.
Body mass index (BMI)
BMI, calculated by dividing weight (kg) to height (m) squared, is one of the indicators used
in adults for the assessment of nutritional and health status. BMI and waist circumference
measurements are used for the assessment of body fat (See Appendix 8).
Waist circumference (WC)
A rubber non-stretchy tape with mm(s) precision made from linoleum was used to measure
waist circumference. Pregnant women were excluded from the measurement. Waist
circumference is essential for defining body fat and its location around the abdomen.
Depending on the amount and location of body fat, obesity is classified into central and
peripheral. Central obesity is defined by accumulation of body fat around abdomen while
peripheral obesity is defined by fat accumulation around hip area.
Hip circumference (HC)
Hip circumference is measured in order to calculate waist to hip ratio (WHR) which is
another indicator to define central obesity [(WHR = WC (cm)/ HC (cm)].
BMI, WC and WHR are used as indicators for the assessment of body fat in terms of its
amount and location.

Chapter II-Survey Methodology Page 14
Blood pressure
Blood pressure and heart rate were measured 3 times on the left arm in the sitting position
using NISSEI Digital Blood Pressure Monitor (Model DS-500) automatic digital blood
pressure equipment. The mean from the last 2 measurements were taken for analysis of the
systolic and diastolic blood pressure. Only the 3rd
measurement was feedback to the
participant (See Appendix 6).
2.4.3 Step 3
Step 3 was also performed by teams from Group Two the day after the interview was
conducted by Teams from Group One. At this stage, biochemical risk factors for NCDs
including fasting blood glucose and total cholesterol were measured.
A portable instrument, Accutrend Plus, was used to measure capillary glucose and total
cholesterol on a basis of dry chemical methods. Blood glucose was tested on fasting
participants, whereas blood cholesterol was tested for any participants, fasting or not.
Laboratory technicians were recruited for biochemical measurement. They were trained on
how to use the Accutrend Plus instrument and how to collect blood in terms of regulations
and guidelines for safety and the survey methods on biochemical. This was followed by
practical and practice to take measurements on these biochemical factors.
The work flow of Step 3 was that after initiating the equipment for measurement a capillary
drop of blood from the participant‟s finger was taken to cover the yellow test pads of the
appropriate test strips for glucose and cholesterol and then the results were documented on
paper. Accutrend control glucose and cholesterol solutions were tested on each instrument
twice a week or more often when any instrument gave 3 consecutive low measurements (i.e.
fasting blood glucose below 50 mg/dl).
All participants were informed of the results of their blood tests whereas those with
abnormal test results were given appropriate counseling and/or referral to the nearest health
facilities (See Appendix 7).
Chapter II-Survey Methodology Page 15
2.5 Summary of combined risk factors for developing NCDs
Judgment for having a high risk for NCDs was made if the survey participants have at least
3 of 5 risk factors presented including current daily smokers, less than 5 servings of fruit
and vegetables per day, low level of physical activity, overweight or obese and raised blood
pressure. In contrast if 1-2 of the risk factors were presented then the participants were
considered as at moderate risk people.
2.6 Data entry and cleaning
In the field, data obtained from all stages of the survey were immediately entered into the
PDA, by using EpiData 3.1 created database.
At the end of the field work, data from each and every PDAs were copied into a micro-
computer, then converted to MS EXCEL and merged into one data file. Data were first
cleaned for age-range and sex consistency, identification number concordance, and outliers.
The data file was subsequently converted into MS ACCESS then converted into EpiInfo 3.5
for second cleaning (valid age and sex) by the pre-defined WHO EpiInfo program. Finally
data were analyzed by using the WHO STEPS EpiInfo analysis program 2.1.
2.7 Weighting of data
In this survey estimates were derived from data by using WHO STEPS weighting formulas
described in the Appendix 9, taking into account sample weight, non-response weight, and
population weight.
2.8 Data analysis
Data analysis was performed by the team of the UHS-C with technical assistance from
Ms Melanie COWAN, Technical Officer, Surveillance Department of Chronic and Health
Promotion, WHO Geneva, and by using the WHO STEPS templates to fill in the data book.

Chapter II-Survey Methodology Page 16
Data analysis was performed by using the Windows based EpiInfo version 3.5. Frequency
distributions with 95% confidence intervals (CI) were calculated using sample frequencies
for all categorical variables. Descriptive statistics including sample means with 95% CI
were calculated for all numeric variables. Detailed statistics of sample means were
calculated in relation to age groups, gender, and residence. Data analysis on physical
activity was performed by generating GPAQ formulas in accordance with WHO guidance
on physical activity using EpiInfo 3.5.
Finally, the survey methods were discussed and agreed upon between the survey team and
WHO consultants prior to the survey implementation. The survey proposal was approved
by the Ethics Committee of Cambodian Ministry of Health and the survey findings were
communicated to the WHO Geneva for further verification.
CHAPTER III:
SURVEY RESULTS
Data cleaning and analysis by UHS-C Team

Chapter III-Survey Results Page 18
Findings of the Cambodian survey on the prevalence of NCD risk factors have been
grouped by topic, starting from the description of the sample, to the description of
behavioral risks and physical and biochemical measurement, and ending with combined risk
factors for NCDs.
3.1 Description of the sample
3.1.1 Sampling and response proportions
The total sample size calculated for the survey prior to the data collection was 5,760. During
the period of data collection, 117 (2.0%) households were missing, being away for farming
or other purposes (Figure 3).
Among the remaining 5,643 households available for the survey, 5,433 individuals were
interviewed, 5,316 had anthropometric and blood pressure measured, and 5,233 had blood
tested. Overall response rates ranged from 96.3% in Step 1, to 94.2% in Step 2, and to 92.7
in Step 3.
Response rates for each and every Steps of the survey were higher in the rural than in
urban areas, higher in women than in men, and lower in the youngest age group (25-34
years) than in the other groups (Table 1).

Chapter III-Survey Results Page 19
Cambodia(13,129,534 people)*
24 Provinces/Municipalities
185 Districts/Khans
184 Urban Communes(2,117, 281 people)
1437 Rural Communes(11, 012,253 people)
17 Selected Urban Communes(516,699 people)
73 SelectedRural Communes(694,643 people)
34 Urban Selected Villages(249,361 people)
146 Rural Selected Villages(180, 654 people)
32 Selected Households in Each Village
(1,088 HH)
32 Selected Households in Each Village
(4,672 HH)
1 Selected Eligible ParticipantIn Each Household
1 Selected Eligible ParticipantIn Each Household
Individual25-64 years
Male/Female
Individual25-64 years
Male/Female
PSU(PPS/ Steps
Sampling.xls)
TSU(Systematic
Random Sampling)
Kish Method
SSU(PPS/ Steps
Sampling.xls)
* Source: National Institute of Statistics (NIS), Ministry of Planning, Cambodia. Cambodia Census Frame 2007 Final.xls
43 HH (missing) 74 HH (missing)
Total : 5,643 Participants
Figure 3: Diagram illustrating different stages in data collection

Chapter III-Survey Results Page 20
Table 1: Percentage of responses by background characteristic and Steps level
Respondents
Characteristic Eligible
Step 1 Step 2 Step 3
Responded Percent Responded Percent Responded Percent
Gender
Male 2,064 989 90.9 1,884 91.3 1,851 89.7
Female 3,579 4,444 96.7 3,432 95.9 3,382 94.5
Residence
Urban 1,088 1,937 93.8 937 89.7 920 84.6
Rural 4,598 3,496 97.7 4,379 95.2 4,313 93.8
Age group
25-34 1,532 1,454 94.9 1,410 92.0 1,370 89.4
35-44 1,549 1,501 96.9 1,475 95.2 1,456 94.0
45-54 1,505 1,454 96.6 1,424 94.6 1,412 93.8
55-64 1,057 1,024 96.9 1,007 95.3 995 94.1
Total 5,643 5,433 96.3 5,316 94.2 5,233 92.7
There were similarities and differences between the survey sample and the survey frame
in terms of the distribution of the population by residence, gender, ethnicity, and age groups
(Table 2).
In the Step 1 survey sample, respondents from the urban and rural areas represented 18%
and 82% of the total respondents respectively, not significantly different from the
distribution of the population in the survey frame where the urban and rural population
represented 19% and 81% respectively.
However, the proportion of female respondents was by about 20% higher than male
respondents (64.3 vs. 35.7%) and about 10% higher than the proportion of women in the
survey frame where women and men represented 46.4% and 53.6% respectively. Also, in
the survey sample, the proportion of respondents reported to be Khmer was slightly higher
than that in the survey frame (98.8 vs. 96.3%).
Furthermore, the proportion of the youngest age group of respondents (25-34 years) in the
survey sample was by almost 10% lower than that of the survey frame (26.8 vs. 36.1%).
Inversely, the proportion of eldest age groups of respondents (45-54 and 55-64 years) in the
survey sample was higher than that of the sample frame. In other words, respondents in the
survey sample were older that those of the survey frame.

Chapter III-Survey Results Page 21
Anyways, differences in gender and age groups between the survey sample and sample
frame, as well as non-responses were corrected in the data analysis through the weighting
process described in Appendix 9.
Table 2 shows that respondents from the urban and rural areas represented 18% and 82% of
the total respondents respectively, corresponding to the distribution of the population in the
survey frame. The proportion of female respondents was by 20% higher than that of male
respondents (64.3 vs. 35.7%) and by 10% higher than the proportion of women in the
survey frame. Over 98% of the total respondents were reportedly Khmer, whereas the
remaining respondents were Chinese, Vietnamese, Cham and minority ethnic groups in the
northeast provinces. The distribution of respondents was around 26% for each of the first
three age groups (i.e. 25-34, 35-44 and 45-54 years) but only 18% for the last age group
(i.e. 55-64 years).
Table 2: Demographic indicators
Respondents
Characteristic Survey sample (Step 1) Survey frame*
n Proportion
(unweighted)
n Proportion
Residence
Urban 989 18.2 979,633 18.7
Rural 4,444 81.8 4,259,050 81.3
Gender
Male 1,937 35.7 2,428,963 46.4
Female 3,496 64.3 2,809,720 53.6
Ethnicity*
Khmer 5,366 98.8 5,045,376 96.3
Vietnam 13 0.2 26,193 0.5
Chinese 5 0.1 2,619 0.05
Cham 5 0.1 78,580 1.5
Minority** 44 0.8 68,103 1.3
Age group
25-34 1,454 26.8 1,890,653 36.1
35-44 1,501 27.6 1,562,414 29.8
45-54 1,454 26.8 1,129,140 21.6
55-64 1,024 18.8 656,476 12.5
Total 5,433 100.0 5,238,683 100.0
* National census 2008
**44 participants of Minority group (Mondulkiri and Rattanakiri provinces)

Chapter III-Survey Results Page 22
3.1.2 Marital status
Four in every 5 respondents both in the rural and urban areas were currently married.
However, the proportion of current marriage respondents was higher for men than for
women (90.3 vs. 66.4%).
Furthermore, the remaining respondents were overall single (5%), separated (5.6%),
divorced (2.1%) and widowed (12.3%). The proportion of widows was 6 times higher in
women than in men, and tended to increase with age (Table 3).
Table 3: Marital status of respondents
Respondents
Characteristic
Marital status
n Never
married
Currently
married
Separated Divorced Widowed
Residence
Urban 989 6.8 74.3 5.9 1.7 11.3
Rural 4,443 4.6 75.1 5.6 2.1 12.5
Gender
Male 1,937 3.9 90.3 2.5 0.5 2.8
Female 3,495 5.6 66.4 7.4 2.9 17.6
Age group
25-34 1,454 10.5 78.3 6.7 1.8 2.7
35-44 1,501 3.8 79.1 7.0 2.1 8.0
45-54 1,453 2.8 74.7 5.0 2.5 14.9
55-64 1,024 2.2 64.5 2.9 1.7 28.7
Total 5,432 5.0 75.0 5.6 2.1 12.3
3.1.3 Level of education
The overall number of years that respondents spent in school (pre-school excluded) was on
average 4.0 years with schooling years longer in men than in women, and also longer in
urban than in rural areas (Figure 4).
Chapter III-Survey Results Page 23
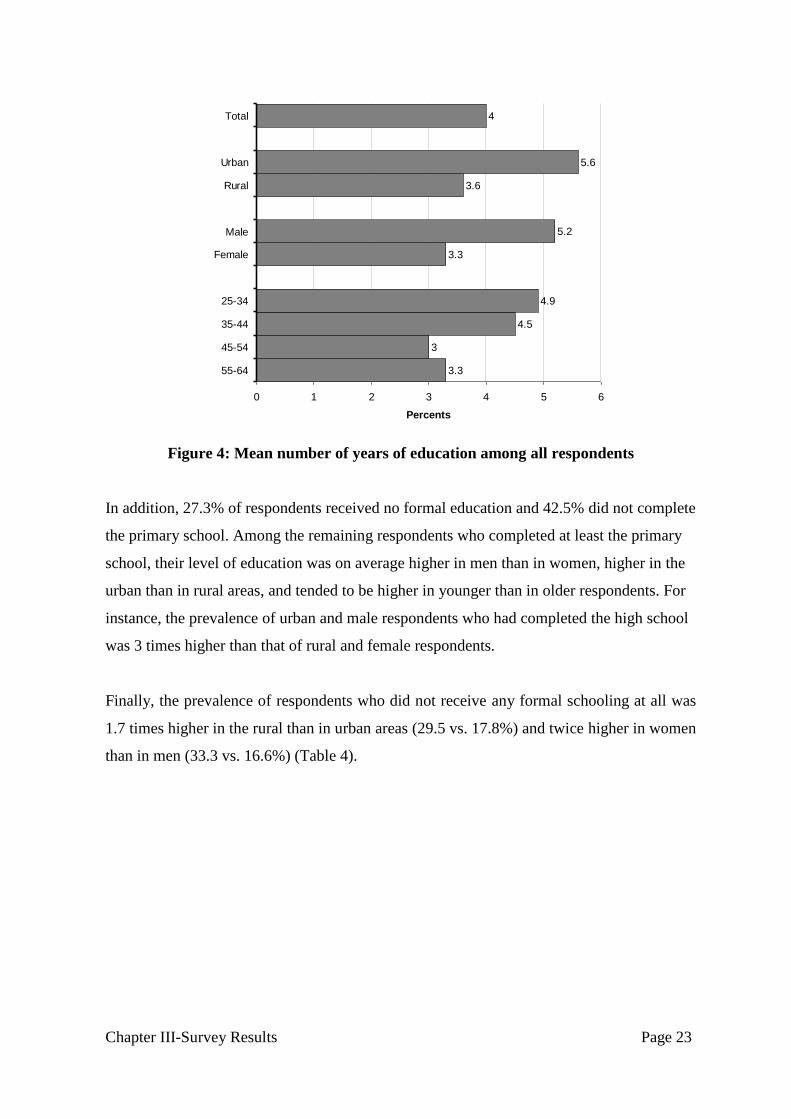
Figure 4: Mean number of years of education among all respondents
In addition, 27.3% of respondents received no formal education and 42.5% did not complete
the primary school. Among the remaining respondents who completed at least the primary
school, their level of education was on average higher in men than in women, higher in the
urban than in rural areas, and tended to be higher in younger than in older respondents. For
instance, the prevalence of urban and male respondents who had completed the high school
was 3 times higher than that of rural and female respondents.
Finally, the prevalence of respondents who did not receive any formal schooling at all was
1.7 times higher in the rural than in urban areas (29.5 vs. 17.8%) and twice higher in women
than in men (33.3 vs. 16.6%) (Table 4).
3.3
3
4.5
4.9
3.3
5.2
3.6
5.6
4
0 1 2 3 4 5 6
55-64
45-54
35-44
25-34
Female
Male
Rural
Urban
Total
Percents
Chapter III-Survey Results Page 24
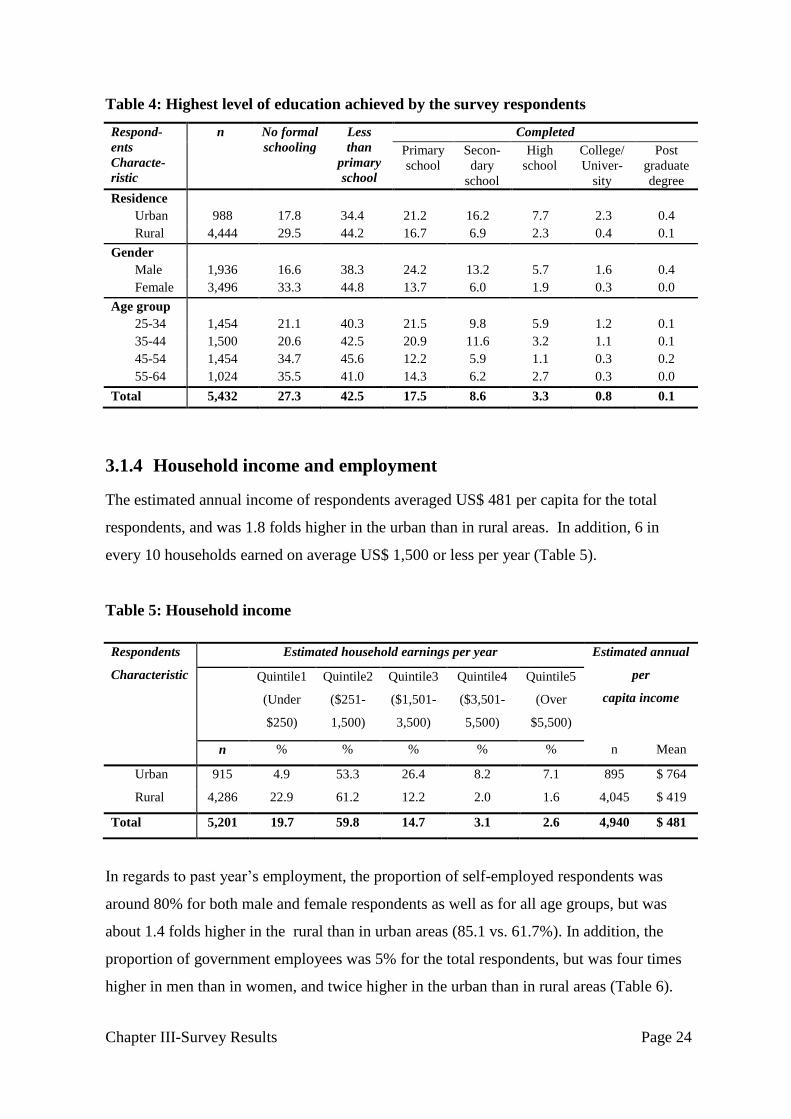
Table 4: Highest level of education achieved by the survey respondents
Respond-
ents
Characte-
ristic
n No formal
schooling
Less
than
primary
school
Completed
Primary
school
Secon-
dary
school
High
school
College/
Univer-
sity
Post
graduate
degree
Residence
Urban 988 17.8 34.4 21.2 16.2 7.7 2.3 0.4
Rural 4,444 29.5 44.2 16.7 6.9 2.3 0.4 0.1
Gender
Male 1,936 16.6 38.3 24.2 13.2 5.7 1.6 0.4
Female 3,496 33.3 44.8 13.7 6.0 1.9 0.3 0.0
Age group
25-34 1,454 21.1 40.3 21.5 9.8 5.9 1.2 0.1
35-44 1,500 20.6 42.5 20.9 11.6 3.2 1.1 0.1
45-54 1,454 34.7 45.6 12.2 5.9 1.1 0.3 0.2
55-64 1,024 35.5 41.0 14.3 6.2 2.7 0.3 0.0
Total 5,432 27.3 42.5 17.5 8.6 3.3 0.8 0.1
3.1.4 Household income and employment
The estimated annual income of respondents averaged US$ 481 per capita for the total
respondents, and was 1.8 folds higher in the urban than in rural areas. In addition, 6 in
every 10 households earned on average US$ 1,500 or less per year (Table 5).
Table 5: Household income
Respondents
Characteristic
Estimated household earnings per year Estimated annual
per
capita income
Quintile1
(Under
$250)
Quintile2
($251-
1,500)
Quintile3
($1,501-
3,500)
Quintile4
($3,501-
5,500)
Quintile5
(Over
$5,500)
n % % % % % n Mean
Urban 915 4.9 53.3 26.4 8.2 7.1 895 $ 764
Rural 4,286 22.9 61.2 12.2 2.0 1.6 4,045 $ 419
Total 5,201 19.7 59.8 14.7 3.1 2.6 4,940 $ 481
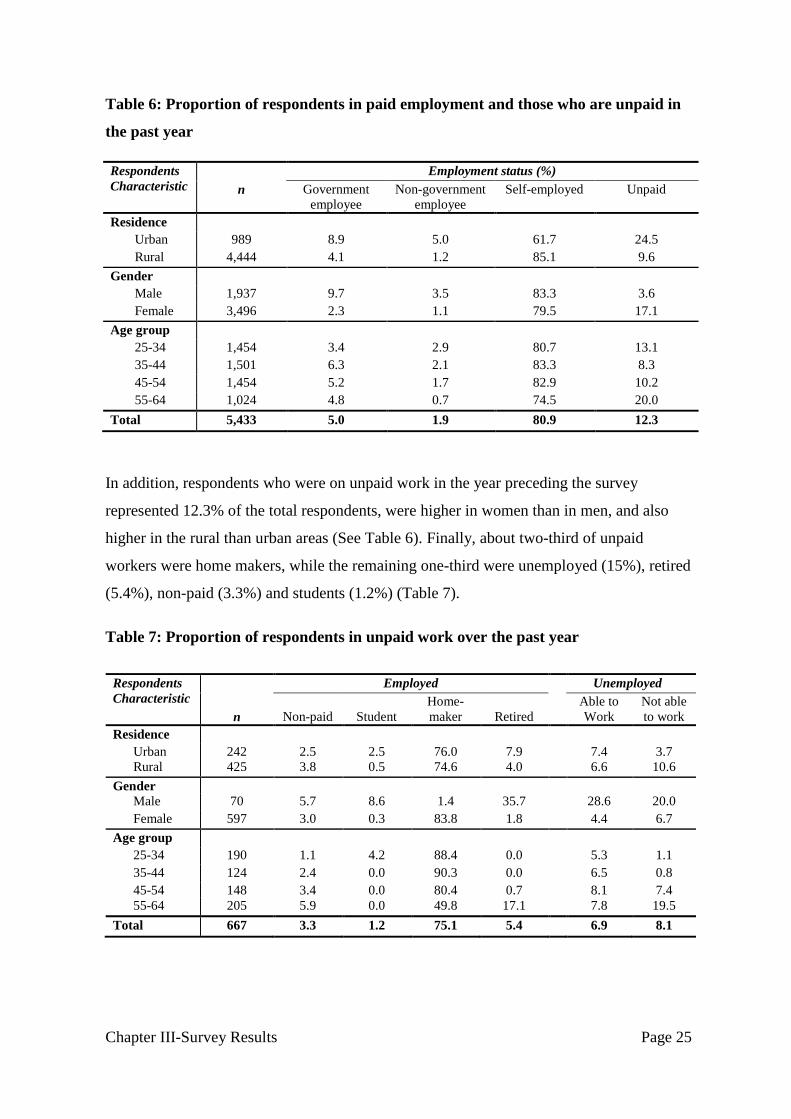
In regards to past year‟s employment, the proportion of self-employed respondents was
around 80% for both male and female respondents as well as for all age groups, but was
about 1.4 folds higher in the rural than in urban areas (85.1 vs. 61.7%). In addition, the
proportion of government employees was 5% for the total respondents, but was four times
higher in men than in women, and twice higher in the urban than in rural areas (Table 6).
Chapter III-Survey Results Page 25
Table 6: Proportion of respondents in paid employment and those who are unpaid in
the past year
Respondents
Characteristic Employment status (%)
n Government
employee
Non-government
employee
Self-employed Unpaid
Residence
Urban 989 8.9 5.0 61.7 24.5
Rural 4,444 4.1 1.2 85.1 9.6
Gender
Male 1,937 9.7 3.5 83.3 3.6
Female 3,496 2.3 1.1 79.5 17.1
Age group
25-34 1,454 3.4 2.9 80.7 13.1
35-44 1,501 6.3 2.1 83.3 8.3
45-54 1,454 5.2 1.7 82.9 10.2
55-64 1,024 4.8 0.7 74.5 20.0
Total 5,433 5.0 1.9 80.9 12.3
In addition, respondents who were on unpaid work in the year preceding the survey
represented 12.3% of the total respondents, were higher in women than in men, and also
higher in the rural than urban areas (See Table 6). Finally, about two-third of unpaid
workers were home makers, while the remaining one-third were unemployed (15%), retired
(5.4%), non-paid (3.3%) and students (1.2%) (Table 7).
Table 7: Proportion of respondents in unpaid work over the past year
Respondents
Characteristic
n
Employed Unemployed
Non-paid Student
Home-
maker Retired
Able to
Work
Not able
to work
Residence
Urban 242 2.5 2.5 76.0 7.9 7.4 3.7
Rural 425 3.8 0.5 74.6 4.0 6.6 10.6
Gender
Male 70 5.7 8.6 1.4 35.7 28.6 20.0
Female 597 3.0 0.3 83.8 1.8 4.4 6.7
Age group
25-34 190 1.1 4.2 88.4 0.0 5.3 1.1
35-44 124 2.4 0.0 90.3 0.0 6.5 0.8
45-54 148 3.4 0.0 80.4 0.7 8.1 7.4
55-64 205 5.9 0.0 49.8 17.1 7.8 19.5
Total 667 3.3 1.2 75.1 5.4 6.9 8.1
Chapter III-Survey Results Page 26
3.2 Tobacco use
In this survey the participants were asked about tobacco smoking, smokeless tobacco use,
tobacco use (smoking and smokeless) and passive smoking, with the objectives to assess the
smoking status as one of the risk factors for developing NCDs among population.
3.2.1 Tobacco smoking
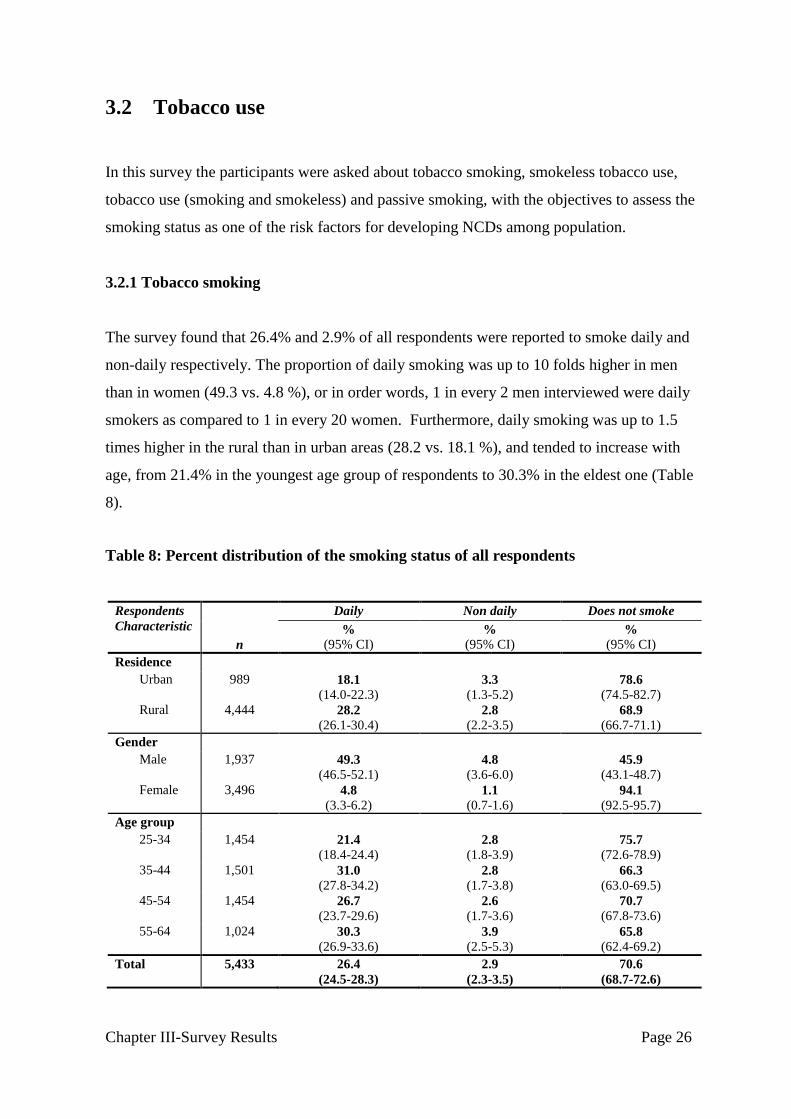
The survey found that 26.4% and 2.9% of all respondents were reported to smoke daily and
non-daily respectively. The proportion of daily smoking was up to 10 folds higher in men
than in women (49.3 vs. 4.8 %), or in order words, 1 in every 2 men interviewed were daily
smokers as compared to 1 in every 20 women. Furthermore, daily smoking was up to 1.5
times higher in the rural than in urban areas (28.2 vs. 18.1 %), and tended to increase with
age, from 21.4% in the youngest age group of respondents to 30.3% in the eldest one (Table
8).
Table 8: Percent distribution of the smoking status of all respondents
Respondents
Characteristic
n
Daily Non daily Does not smoke
%
(95% CI) %
(95% CI) %
(95% CI)
Residence
Urban 989 18.1
(14.0-22.3) 3.3
(1.3-5.2) 78.6
(74.5-82.7)
Rural 4,444 28.2
(26.1-30.4) 2.8
(2.2-3.5) 68.9
(66.7-71.1)
Gender
Male 1,937 49.3
(46.5-52.1) 4.8
(3.6-6.0) 45.9
(43.1-48.7)
Female 3,496 4.8
(3.3-6.2) 1.1
(0.7-1.6) 94.1
(92.5-95.7)
Age group
25-34 1,454 21.4
(18.4-24.4) 2.8
(1.8-3.9) 75.7
(72.6-78.9)
35-44 1,501 31.0
(27.8-34.2) 2.8
(1.7-3.8) 66.3
(63.0-69.5)
45-54 1,454 26.7
(23.7-29.6) 2.6
(1.7-3.6) 70.7
(67.8-73.6)
55-64 1,024 30.3
(26.9-33.6) 3.9
(2.5-5.3) 65.8
(62.4-69.2)
Total 5,433 26.4
(24.5-28.3)
2.9
(2.3-3.5)
70.6
(68.7-72.6)
Chapter III-Survey Results Page 27
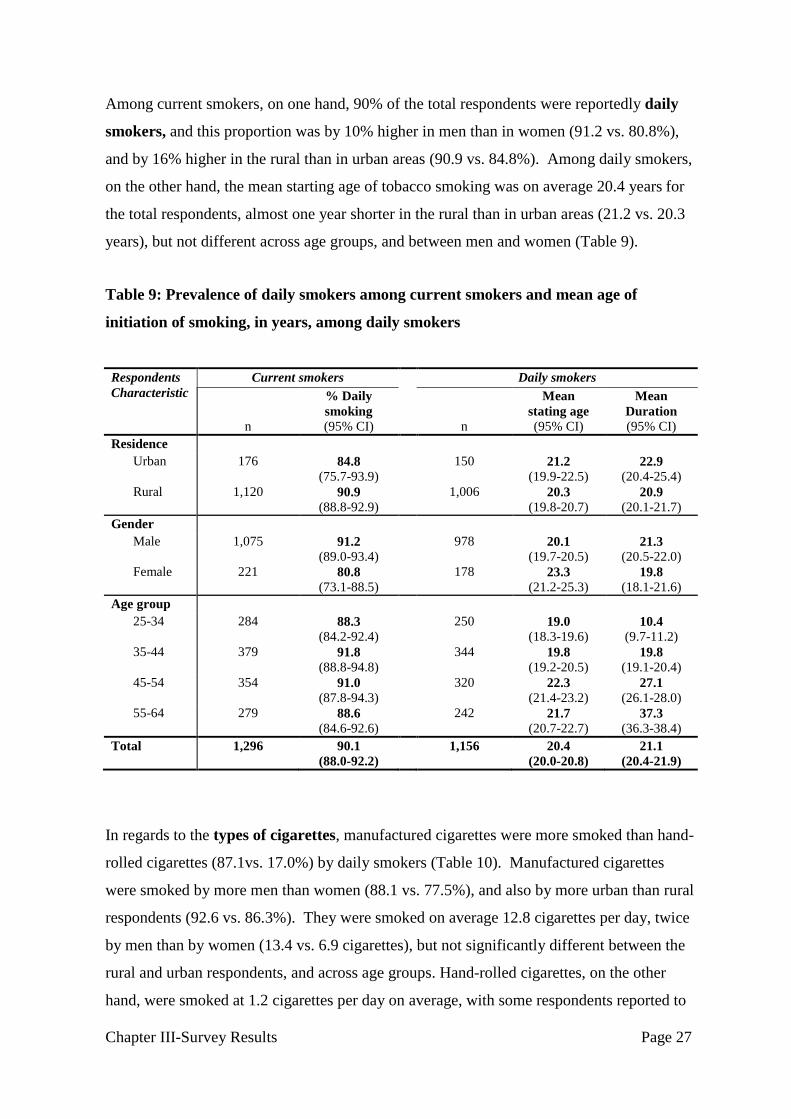
Among current smokers, on one hand, 90% of the total respondents were reportedly daily
smokers, and this proportion was by 10% higher in men than in women (91.2 vs. 80.8%),
and by 16% higher in the rural than in urban areas (90.9 vs. 84.8%). Among daily smokers,
on the other hand, the mean starting age of tobacco smoking was on average 20.4 years for
the total respondents, almost one year shorter in the rural than in urban areas (21.2 vs. 20.3
years), but not different across age groups, and between men and women (Table 9).
Table 9: Prevalence of daily smokers among current smokers and mean age of
initiation of smoking, in years, among daily smokers
Respondents
Characteristic
Current smokers Daily smokers
n
% Daily
smoking
(95% CI)
n
Mean
stating age
(95% CI)
Mean
Duration
(95% CI)
Residence
Urban 176 84.8
(75.7-93.9)
150 21.2
(19.9-22.5) 22.9
(20.4-25.4)
Rural 1,120 90.9
(88.8-92.9)
1,006 20.3
(19.8-20.7) 20.9
(20.1-21.7)
Gender
Male 1,075 91.2
(89.0-93.4)
978 20.1
(19.7-20.5) 21.3
(20.5-22.0)
Female 221 80.8
(73.1-88.5)
178 23.3
(21.2-25.3) 19.8
(18.1-21.6)
Age group
25-34 284 88.3
(84.2-92.4)
250 19.0
(18.3-19.6) 10.4
(9.7-11.2)
35-44 379 91.8
(88.8-94.8)
344 19.8
(19.2-20.5) 19.8
(19.1-20.4)
45-54 354 91.0
(87.8-94.3)
320 22.3
(21.4-23.2) 27.1
(26.1-28.0)
55-64 279 88.6
(84.6-92.6)
242 21.7
(20.7-22.7) 37.3
(36.3-38.4)
Total 1,296 90.1
(88.0-92.2)
1,156 20.4
(20.0-20.8)
21.1
(20.4-21.9)
In regards to the types of cigarettes, manufactured cigarettes were more smoked than hand-
rolled cigarettes (87.1vs. 17.0%) by daily smokers (Table 10). Manufactured cigarettes
were smoked by more men than women (88.1 vs. 77.5%), and also by more urban than rural
respondents (92.6 vs. 86.3%). They were smoked on average 12.8 cigarettes per day, twice
by men than by women (13.4 vs. 6.9 cigarettes), but not significantly different between the
rural and urban respondents, and across age groups. Hand-rolled cigarettes, on the other
hand, were smoked at 1.2 cigarettes per day on average, with some respondents reported to
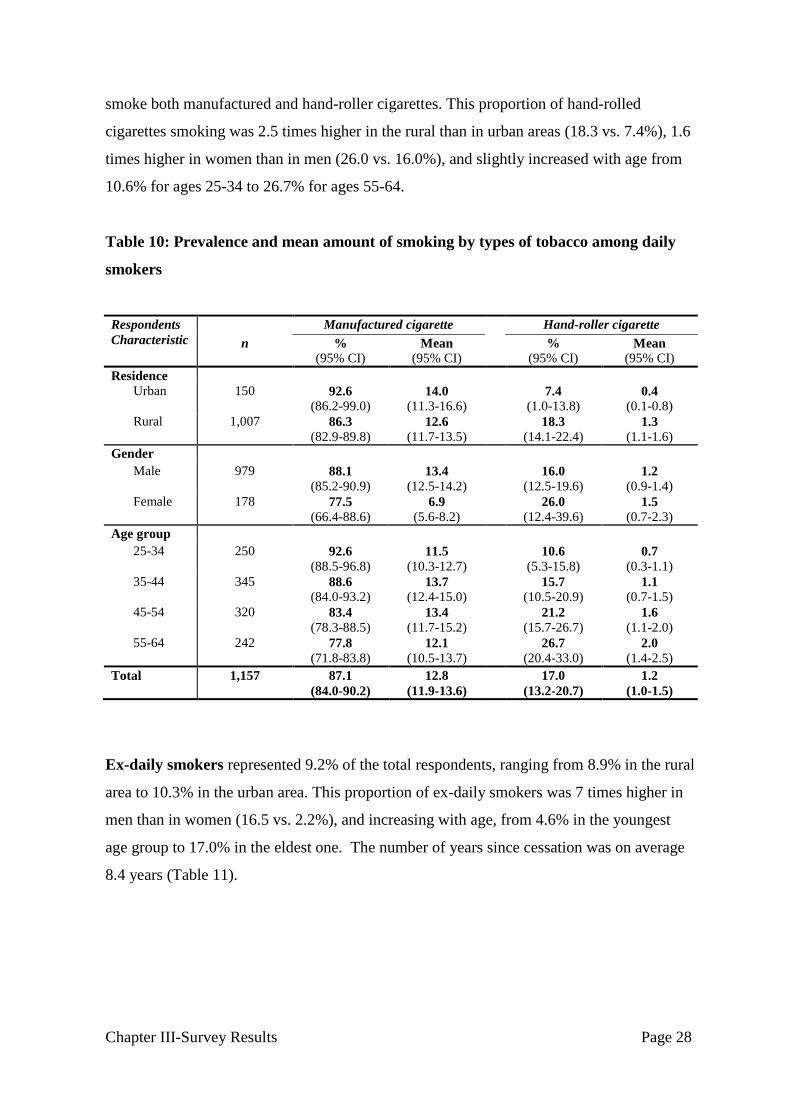
Chapter III-Survey Results Page 28
smoke both manufactured and hand-roller cigarettes. This proportion of hand-rolled
cigarettes smoking was 2.5 times higher in the rural than in urban areas (18.3 vs. 7.4%), 1.6
times higher in women than in men (26.0 vs. 16.0%), and slightly increased with age from
10.6% for ages 25-34 to 26.7% for ages 55-64.
Table 10: Prevalence and mean amount of smoking by types of tobacco among daily
smokers
Respondents
Characteristic Manufactured cigarette Hand-roller cigarette
n %
(95% CI) Mean
(95% CI) %
(95% CI) Mean
(95% CI)
Residence
Urban 150 92.6
(86.2-99.0) 14.0
(11.3-16.6) 7.4
(1.0-13.8) 0.4
(0.1-0.8)
Rural 1,007 86.3
(82.9-89.8) 12.6
(11.7-13.5) 18.3
(14.1-22.4) 1.3
(1.1-1.6)
Gender
Male 979 88.1
(85.2-90.9) 13.4
(12.5-14.2) 16.0
(12.5-19.6) 1.2
(0.9-1.4)
Female 178 77.5
(66.4-88.6) 6.9
(5.6-8.2) 26.0
(12.4-39.6) 1.5
(0.7-2.3)
Age group
25-34 250 92.6
(88.5-96.8) 11.5
(10.3-12.7) 10.6
(5.3-15.8) 0.7
(0.3-1.1)
35-44 345 88.6
(84.0-93.2) 13.7
(12.4-15.0) 15.7
(10.5-20.9) 1.1
(0.7-1.5)
45-54 320 83.4
(78.3-88.5) 13.4
(11.7-15.2) 21.2
(15.7-26.7) 1.6
(1.1-2.0)
55-64 242 77.8
(71.8-83.8) 12.1
(10.5-13.7) 26.7
(20.4-33.0) 2.0
(1.4-2.5)
Total 1,157 87.1
(84.0-90.2)
12.8
(11.9-13.6)
17.0
(13.2-20.7)
1.2
(1.0-1.5)
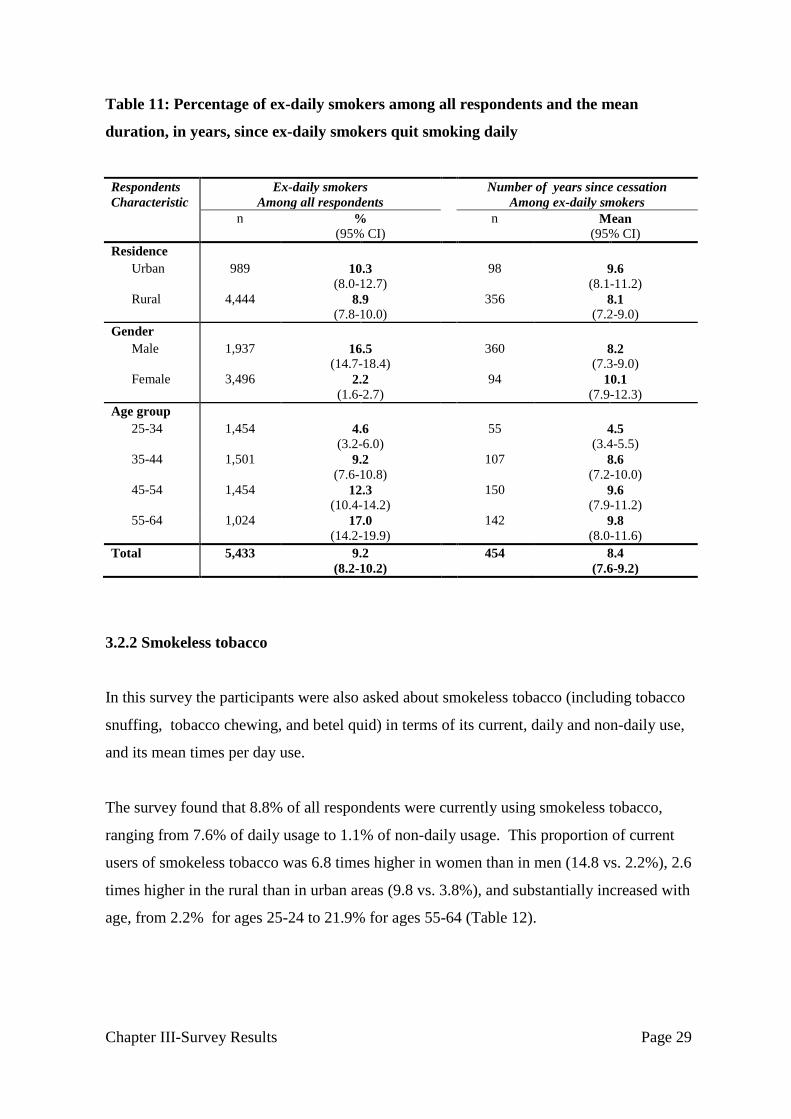
Ex-daily smokers represented 9.2% of the total respondents, ranging from 8.9% in the rural
area to 10.3% in the urban area. This proportion of ex-daily smokers was 7 times higher in
men than in women (16.5 vs. 2.2%), and increasing with age, from 4.6% in the youngest
age group to 17.0% in the eldest one. The number of years since cessation was on average
8.4 years (Table 11).
Chapter III-Survey Results Page 29
Table 11: Percentage of ex-daily smokers among all respondents and the mean
duration, in years, since ex-daily smokers quit smoking daily
Respondents
Characteristic
Ex-daily smokers
Among all respondents
Number of years since cessation
Among ex-daily smokers
n %
(95% CI)
n Mean
(95% CI)
Residence
Urban 989 10.3
(8.0-12.7)
98 9.6
(8.1-11.2)
Rural 4,444 8.9
(7.8-10.0)
356 8.1
(7.2-9.0)
Gender
Male 1,937 16.5
(14.7-18.4)
360 8.2
(7.3-9.0)
Female 3,496 2.2
(1.6-2.7)
94 10.1
(7.9-12.3)
Age group
25-34 1,454 4.6
(3.2-6.0)
55 4.5
(3.4-5.5)
35-44 1,501 9.2
(7.6-10.8)
107 8.6
(7.2-10.0)
45-54 1,454 12.3
(10.4-14.2)
150 9.6
(7.9-11.2)
55-64 1,024 17.0
(14.2-19.9)
142 9.8
(8.0-11.6)
Total 5,433 9.2
(8.2-10.2)
454 8.4
(7.6-9.2)
3.2.2 Smokeless tobacco
In this survey the participants were also asked about smokeless tobacco (including tobacco
snuffing, tobacco chewing, and betel quid) in terms of its current, daily and non-daily use,
and its mean times per day use.
The survey found that 8.8% of all respondents were currently using smokeless tobacco,
ranging from 7.6% of daily usage to 1.1% of non-daily usage. This proportion of current
users of smokeless tobacco was 6.8 times higher in women than in men (14.8 vs. 2.2%), 2.6
times higher in the rural than in urban areas (9.8 vs. 3.8%), and substantially increased with
age, from 2.2% for ages 25-24 to 21.9% for ages 55-64 (Table 12).

Chapter III-Survey Results Page 30
Table 12: Percentage of current users of smokeless tobacco among all respondents
Respondents
Characteristic Smokeless tobacco
Current users Daily users Non
daily users
Non users
n %
(95% CI) %
(95% CI) %
(95% CI) %
(95% CI)
Residence
Urban 989 3.8
(2.5-5.0) 2.8
(1.6-4.0) 1.0
(0.3-1.6) 96.2
(95.0-97.5)
Rural 4,444 9.8
(8.4-11.2) 8.7
(7.4-10.0) 1.1
(0.8-1.5) 90.2
(88.8-91.6)
Gender
Male 1,937 2.2
(1.4-3.0) 1.3
(0.7-1.9) 0.9
(0.4-1.4) 97.8
(97.0-98.6)
Female 3,496 14.9
(13.0-16.9) 13.7
(11.8-15.5) 1.3
(0.9-1.7) 85.1
(83.1-87.0)
Age group
25-34 1,454 2.2
(1.4-2.9) 1.7
(1.0-2.4) 0.5
(0.2-0.8) 97.8
(97.1-98.6)
35-44 1,501 7.7
(5.7-9.6) 6.3
(4.6-7.9) 1.4
(0.7-2.1) 92.3
(90.4-94.3)
45-54 1,454 13.7
(11.3-16.1) 12.2
(9.9-14.5) 1.5
(0.7-2.3) 86.3
(83.9-88.7)
55-64 1,024 21.9
(19.0-24.7) 20.2
(17.5-23.0) 1.6
(0.8-2.4) 78.1
(75.3-81.0)
Total 5,433 8.8
(7.6-9.9)
7.6
(6.6-8.7)
1.1
(0.8-1.5)
91.2
(90.1-92.4)
Furthermore, the frequency of smokeless tobacco use ranged in total from 0.2 times per
day for tobacco snuffing, to 0.6 times for tobacco chewing, and to 3.4 times for betel quid.
Betel quid was on average used more frequently by women than by men (3.5 vs. 2.3 times
per day), but this usage was neither significantly different across age groups nor between
the urban and rural areas (Table 13).

Chapter III-Survey Results Page 31
Table 13: Mean times per day of smokeless tobacco used by smokeless tobacco users
Respondents
Characteristic
Snuff by mouth Snuff by nose Chew Betel quid
n Mean
(95% CI)
Mean
(95% CI) Mean
(95% CI) Mean
(95% CI)
Residence
Urban 42 0.2
(0.0-0.7) 0.1
(0.0-0.2) 0.5
(0.1-0.9) 3.4
(2.5-4.3)
Rural 581 0.2
(0.0-0.3) 0.0
(0.0-0.1) 0.6
(0.5-0.8) 3.4
(3.1-3.7)
Gender
Male 31 0.6
(0.0-1.8) 0.2
(0.0-0.7) 0.1
(0.0-0.3) 2.3
(1.4-3.2)
Female 592 0.1
(0.0-0.2) 0.0
(0.0-0.0) 0.7
(0.5-0.9) 3.5
(3.2-3.8)
Age Groups
25-34 32 0.1
(0.0-0.4) 0.0
(0.0-0.0) 1.0
(0.5-1.5) 2.5
(1.7-3.4)
35-44 120 0.1
(0.0-0.3) 0.0
(0.0-0.0) 0.4
(0.1-0.6) 3.2
(2.7-3.7)
45-54 215 0.2
(0.0-0.5) 0.0
(0.0-0.0) 0.5
(0.3-0.7) 3.8
(3.3-4.4)
55-64 256 0.1 (0.0-0.2)
0.1
(0.0-0.2) 0.9
(0.6-1.2) 3.3
(2.9-3.6)
Total 623 0.2
(0.0-0.3)
0.0
(0.0-0.1)
0.6
(0.5-0.8)
3.4
(3.1-3.7)
3.2.3 Smoking and smokeless tobacco use
All types of tobacco use, including smoking and smokeless, current (daily or not) and daily
tobacco users, accounted for 37.0% and 33.7% of all respondents respectively.
The prevalence of all types of current tobacco users was 2.8 times higher for men than for
women (55.1 vs. 19.8%), and was 1.6 times higher in the rural than in urban areas (39.6 vs.
24.8%). This tobacco usage prevalence was increasing with age, with the prevalence of
current tobacco users twice higher in the eldest age group than in the youngest one (53.3 vs.
26.1%) (Table 14).
Chapter III-Survey Results Page 32
Table 14: Percentage of daily and current (daily plus non-daily) tobacco users,
includes smoking and smokeless, among all respondents
Respondents
Characteristic
Current tobacco users Daily tobacco users
n
%
(95% CI) %
(95% CI)
Residence
Urban 989 24.8
(20.3-29.4) 20.8
(16.2-25.5)
Rural 4,444 39.6
(37.1-42.0) 36.4
(34.0-38.80
Gender
Male 1,937 55.1
(52.3-57.9) 50.2
(47.4-53.0)
Female 3,496 19.8
(17.4-22.10 18.0
(15.7-20.3)
Age group
25-34 1,454 26.1
(22.8-29.3) 23.0
(19.9-26.1)
35-44 1,501 40.4
(36.9-43.9) 37.0
(33.4-40.6)
45-54 1,454 41.3
(37.9-44.8) 38.2
(34.6-41.7)
55-64 1,024 53.3
(49.4-57.2) 49.2
(45.3-53.2)
Total 5,433 37.0
(34.8-39.1)
33.7
(31.5-35.8)
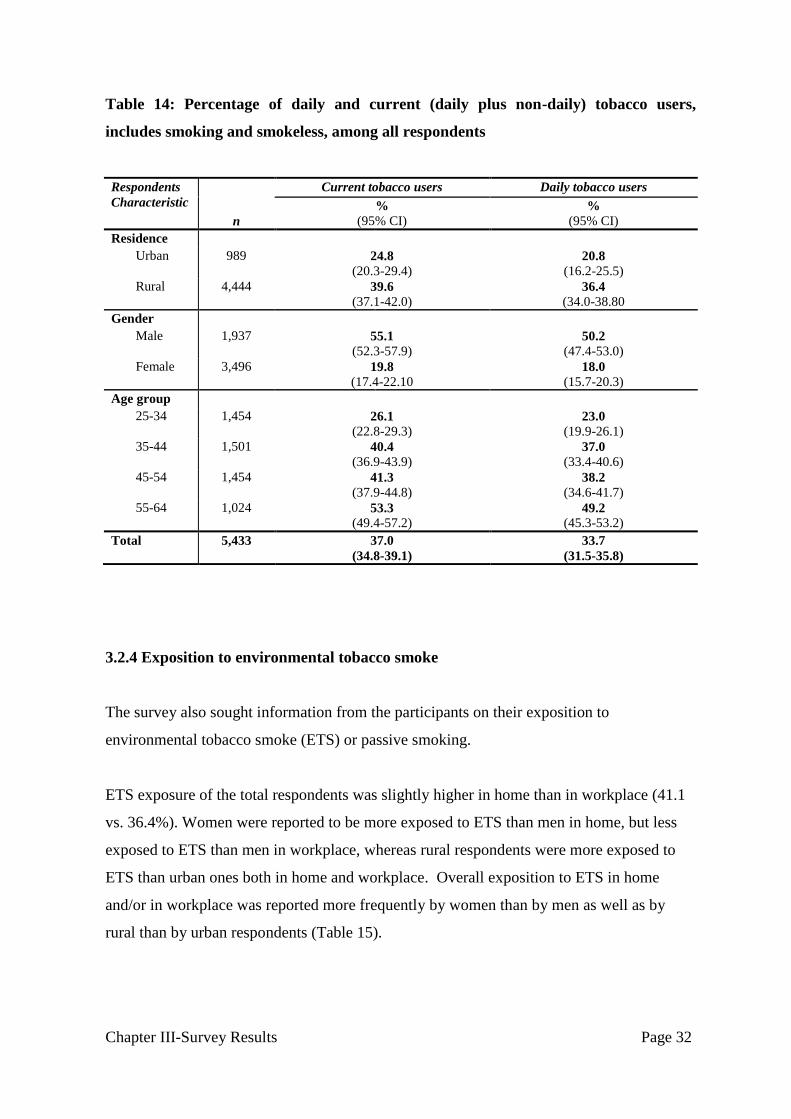
3.2.4 Exposition to environmental tobacco smoke
The survey also sought information from the participants on their exposition to
environmental tobacco smoke (ETS) or passive smoking.
ETS exposure of the total respondents was slightly higher in home than in workplace (41.1
vs. 36.4%). Women were reported to be more exposed to ETS than men in home, but less
exposed to ETS than men in workplace, whereas rural respondents were more exposed to
ETS than urban ones both in home and workplace. Overall exposition to ETS in home
and/or in workplace was reported more frequently by women than by men as well as by
rural than by urban respondents (Table 15).

Chapter III-Survey Results Page 33
Table 15: Percentage of respondents exposed to ETS in home and in the workplace on
one or more days in the past 7 days
Respondents
Characteristic
Exposed to environmental tobacco smoke in
Home Workplace Home and/
or workplace
n %
(95% CI) %
(95% CI) %
(95% CI)
Residence
Urban 989 33.3
(28.4-38.2) 32.7
(26.1-39.4) 50.7
(45.1-56.2)
Rural 4,444 42.8
(40.4-45.2) 37.2
(33.4-40.9) 56.2
(53.6-58.8)
Gender
Male 1,937 33.3
(29.8-36.8) 44.9
(40.6-49.3) 54.4
(50.6-58.3)
Female 3,496 48.5
(46.2-50.9) 28.3
(25.5-31.2) 56.0
(53.8-58.1)
Age group
25-34 1,454 41.5
(38.2-44.8) 35.7
(31.7-39.6) 56.6
(53.3-59.8)
35-44 1,501 40.6
(37.3-43.9) 40.1
(35.7-44.6) 56.1
(52.5-59.8)
45-54 1,454 42.1
(39.1-45.2) 35.7
(31.6-39.7) 54.7
(51.5-57.9)
55-64 1,024 39.5
(35.7-43.4) 31.3
(27.1-35.4) 50.1
(46.4-53.8)
Total 5,433 41.1
(39.0-43.3)
36.4
(33.1-39.7)
55.2
(52.9-57.6)
In summary, out of the total respondents (n=5433), 29.4% and 37.0% were reportedly
current (daily and non-daily) tobacco smokers and users (smoking and smokeless)
respectively, whereas 55.2% were exposed to ETS at home and/or workplace in the past 7
days prior to the survey. In addition, 26.4% and 33.7% of the total respondents were daily
tobacco smokers and users respectively. Finally, men were more likely than women to
smoke and use tobacco daily; whereas rural respondents were more likely than urban
respondents to smoke and use tobacco on a daily basis.

Chapter III-Survey Results Page 34
3.3 Alcohol Consumption
In this survey the participants were asked about the frequency and quantity of alcohol
consumption in the past week, month, and year prior to the survey, with the objectives to
identify and assess their drinking status as one of the risk factors for developing NCDs
among the surveyed population.
3.3.1 Alcohol drinking status
The survey found that almost two-thirds of the total respondents (63.5%) were alcohol
drinkers and the remaining (36.5%) alcohol abstainers.
In regards to alcohol drinkers, over half (53.5%) of the total respondents were reportedly
current drinkers in the past 30 days, whereas one-tenth (10.0%) were past 12 months
drinkers but not current. Men were reported to be 2.4 times current drinkers than women
(76.3 vs. 31.9%), but women were reportedly 1.5 times past 12 months drinkers than men
(12.0 vs. 7.9%). In addition, urban respondents were 1.4 times past 12 months drinkers than
rural respondents (13.3 vs. 9.3%). Finally the proportions of current and past 12 months
drinkers among the eldest age group of respondents (55-64 years) were reportedly lower
than those of the three younger age groups (35.2 vs. 51.1-58.0% for current drinkers and 6.1
vs. 10.3-10.8% for past 12 months drinkers).
With regards to alcohol abstainers, about one-fourth of the total respondents (26.5%) were
lifetime abstainers whereas one-tenth of respondents (10.0%) were past 12 months
abstainers. The proportion of lifetime abstainers, on one hand, was 4.7 times higher in
women than in men (43.0 vs. 9.1%), and highest in the eldest age group. The proportion of
past 12 month alcohol abstainers, on the other hand, was twice higher in women than in
men (12.0 vs. 6.7%) and was increasing with age (Table 16).

Chapter III-Survey Results Page 35
Table 16: Alcohol consumption status of all respondents
Respondents
Characteristic
Current
Drinker
Past 12 months
drinker, not
current
Past 12 months
abstainer
Lifetime
abstainer
n %
(95% CI) %
(95% CI) %
(95% CI) %
(95% CI)
Residence
Urban 989 49.0
(44.5-53.5) 13.3
(10.6-16.0) 9.3
(7.2-11.4) 28.4
(24.2-32.6)
Rural 4,444 54.5
(52.1-56.8) 9.3
(8.3-10.3) 10.2
(9.0-11.3) 26.1
(24.2-27.9)
Gender
Male 1,937 76.3
(73.9-78.7) 7.9
(6.7-9.2) 6.7
(5.4-8.0) 9.1
(7.5-10.6)
Female 3,496 31.9
(29.6-34.2) 12.0
(10.6-13.4) 13.2
(11.8-14.6) 43.0
(40.5-45.4)
Age group
25-34 1,454 58.0
(54.7-61.4) 10.8
(9.2-12.5) 6.9
(5.5-8.3) 24.2
(21.4-27.0)
35-44 1,501 57.5
(54.7-60.3) 10.3
(8.7-12.0) 8.6
(7.0-10.1) 23.6
(21.5-25.7)
45-54 1,454 51.1
(47.9-54.4) 10.5
(8.8-12.1) 11.5
(9.7-13.2) 26.9
(24.3-29.6)
55-64 1,024 35.2
(31.6-38.8) 6.1
(4.4-7.8) 19.9
(16.6-23.3) 38.8
(35.0-42.6)
Total 5,433 53.5
(51.4-55.6)
10.0
(9.1-10.9)
10.0
(9.0-11.1)
26.5
(24.8-28.2)
3.3.2 Alcohol drinking categories
In this survey, alcohol consumption was classified in 3 drinking categories, as follows:
• Drinking category III was defined as drinking ≥60g of pure alcohol on average per day
for men and ≥40 g for women;
• Drinking category II was defined as drinking 40-59.9g of pure alcohol on average per
day for men and 20-39.9g for women; and
• Drinking category I was defined as drinking <40g of pure alcohol on average per day
for men and <20 for women.
The survey revealed that, among all respondents, few were classified in the category III
(3.4%) and II (3.4%) whereas the majority (46.6%) in the category I (Table 17). However,
among current (past 30 days) drinkers, the majority (87.3%) were in Category I and the
remaining 6.3% and 6.4 % in Category II and III respectively.
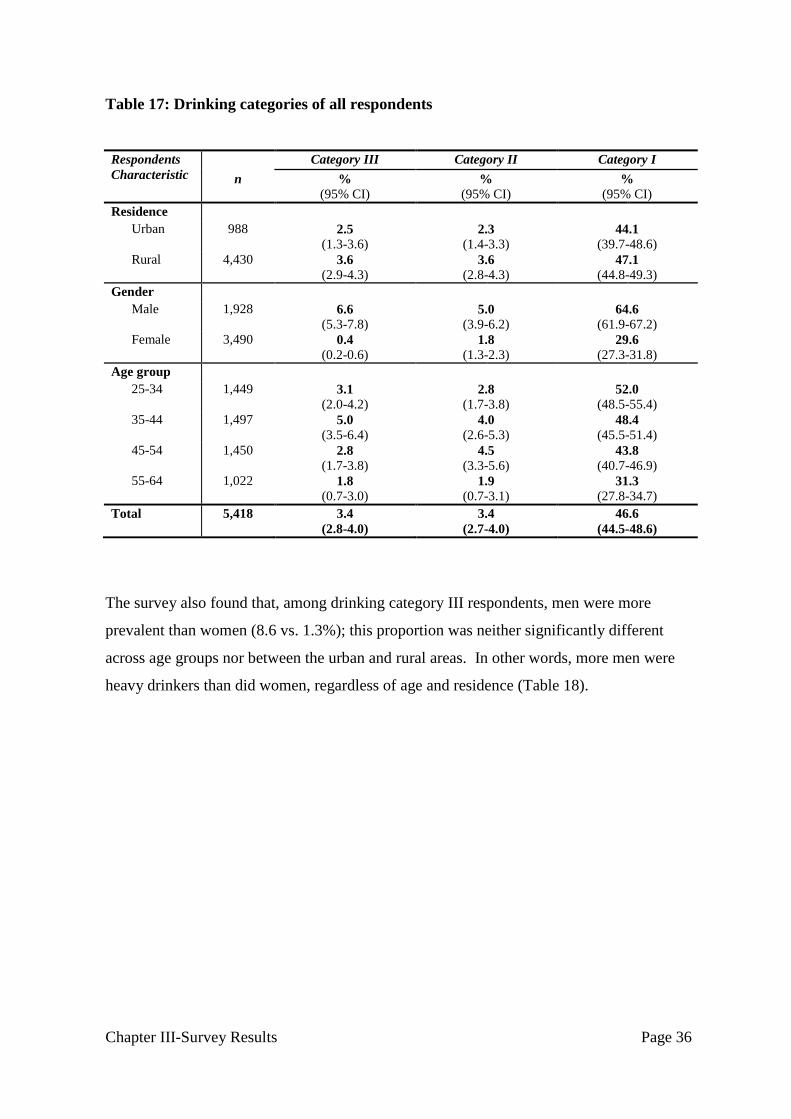
Chapter III-Survey Results Page 36
Table 17: Drinking categories of all respondents
Respondents
Characteristic Category III Category II Category I
n %
(95% CI) %
(95% CI) %
(95% CI)
Residence
Urban 988 2.5
(1.3-3.6) 2.3
(1.4-3.3) 44.1
(39.7-48.6)
Rural 4,430 3.6
(2.9-4.3) 3.6
(2.8-4.3) 47.1
(44.8-49.3)
Gender
Male 1,928 6.6
(5.3-7.8) 5.0
(3.9-6.2) 64.6
(61.9-67.2)
Female 3,490 0.4
(0.2-0.6) 1.8
(1.3-2.3) 29.6
(27.3-31.8)
Age group
25-34 1,449 3.1
(2.0-4.2) 2.8
(1.7-3.8) 52.0
(48.5-55.4)
35-44 1,497 5.0
(3.5-6.4) 4.0
(2.6-5.3) 48.4
(45.5-51.4)
45-54 1,450 2.8
(1.7-3.8) 4.5
(3.3-5.6) 43.8
(40.7-46.9)
55-64 1,022 1.8
(0.7-3.0) 1.9
(0.7-3.1) 31.3
(27.8-34.7)
Total 5,418 3.4
(2.8-4.0)
3.4
(2.7-4.0)
46.6
(44.5-48.6)
The survey also found that, among drinking category III respondents, men were more
prevalent than women (8.6 vs. 1.3%); this proportion was neither significantly different
across age groups nor between the urban and rural areas. In other words, more men were
heavy drinkers than did women, regardless of age and residence (Table 18).

Chapter III-Survey Results Page 37
Table 18: Drinking categories of current (past 30 days) drinkers
Respondents
Characteristic Drinking category among current drinkers
Category III Category II Category I
n %
(95% CI) %
(95% CI) %
(95% CI)
Residence
Urban 430 5.0
(2.7-7.3) 4.8
(2.8-6.8) 90.2
(86.9-93.6)
Rural 2,051 6.6
(5.3-8.0) 6.6
(5.3-8.0) 86.7
(84.9-88.6)
Gender
Male 1,412 8.6
(7.0-10.2) 6.6
(5.1-8.1) 84.8
(82.5-87.0)
Female 1,069 1.3
(0.6-2.0) 5.6
(4.0-7.3) 93.1
(91.3-94.9)
Age group
25-34 745 5.3
(3.5-7.2) 4.8
(3.0-6.6) 89.9
(87.5-92.3)
35-44 755 8.7
(6.2-11.2) 6.9
(4.6-9.2) 84.4
(81.1-87.8)
45-54 669 5.4
(3.4-7.4) 8.7
(6.6-10.9) 85.9
(83.0-88.7)
55-64 312 5.3
(2.0-8.6) 5.4
(2.2-8.7) 89.3
(84.6-94.0)
Total 2,481 6.4
(5.2-7.5)
6.3
(5.1-7.5)
87.3
(85.6-89.0)
3.3.2 Alcohol consumption in the past 12 months
Among drinkers in the past 12 months, including current (30 days) drinkers, the proportion
of those who reportedly consumed alcohol on a daily basis was on average 13.4%. This
proportion of daily drinkers was significantly higher in men than in women (15.5 vs. 9.6%),
and was increasing with age, from 9.3% for ages 25-34 to 21.8% for ages 55-64.
When taking into account 4.3 % and 19.0% of respondents who did consume alcohol 5-6
days and 1-4 days a week respectively, the proportion of alcohol consumption for at least
once a week went up to over one-third of all respondents who had ever drank in the past 12
months prior to the survey. The remaining respondents who consumed alcohol in the past
12 months did so occasionally (i.e. up to 3 days a month: 31.1%) and rarely (i.e. less than
once a month: 32.2%) (Table 19).

Chapter III-Survey Results Page 38
Table 19: Frequency of alcohol consumption of respondents in the past 12 months
Respondents
Characteristic Alcohol consumption in past 12 months
Daily
5-6 days/
week
1-4 days/
week
1-3 days/
month
< once/
month
n %
(95% CI) %
(95% CI) %
(95% CI) %
(95% CI) %
(95% CI)
Residence
Urban 553 10.8
(7.5-14.1) 5.0
(2.4-7.6) 13.9
(9.1-18.8) 28.5
(22.0-34.9) 41.8
(36.0-47.5)
Rural 2,498 14.0
(12.1-15.9)
4.1
(3.1-5.2)
20.0
(18.1-22.0)
31.7
(29.1-34.2)
30.2
(27.6-32.8)
Gender
Male 1,583 15.5
(13.3-17.7) 6.2
(4.7-7.6) 24.3
(21.9-26.7) 31.8
(29.0-34.6) 22.3
(19.6-25.0)
Female 1,468 9.6
(7.7-11.6) 0.8
(0.4-1.3) 9.3
(7.6-11.1) 29.9
(26.4-33.3) 50.3
(46.8-53.8)
Age group
25-34 924 9.3
(7.0-11.5) 3.2
(1.7-4.6) 19.4
(16.4-22.3) 35.0
(31.3-38.8) 33.2
(29.3-37.0)
35-44 925 14.3
(11.3-17.4) 5.6
(3.8-7.3) 19.4
(16.4-22.4) 30.4
(26.6-34.2) 30.3
(27.0-33.5)
45-54 824 16.7
(13.8-19.5) 5.1
(3.6-6.7) 17.6
(14.1-21.1)
27.7
(23.8-31.6) 32.9
(29.0-36.7)
55-64 378 21.8
(16.7-27.0)
2.6
(0.7-4.4) 19.1
(14.8-23.4) 23.4
(18.6-28.2) 33.1
(27.6-38.6)
Total 3,051 13.4
(11.8-15.1)
4.3
(3.3-5.2)
19.0
(17.2-20.8)
31.1
(28.7-33.5)
32.2
(29.8-34.6)
3.3.3 Alcohol consumption in the past 30 days
Among current (past 30 days) drinkers, which accounted for 53.5% of all respondents (See
Table 16), the overall mean of drinking occasions was on average 9.1 occasions. This mean
of drinking occasions was significantly lower in women than in men (7.1 vs. 10.0%), and
also lower in the youngest age group of respondents than in the rest (7.6 vs. 9.8-11.1%).
Furthermore, the mean number of standard drinks per drinking occasion among current
drinkers was overall 4.5, and this mean number of standard drinks was almost 3 folds higher
in men than in women (5.6 vs. 1.9%).
In addition, the maximum number of drinks per drinking occasion was on average 6.0
drinks for the total respondents and this average maximum number of drinks was 3.3 times
higher in men than in women (7.6 vs. 2.3 drinks), but did neither differ between men and
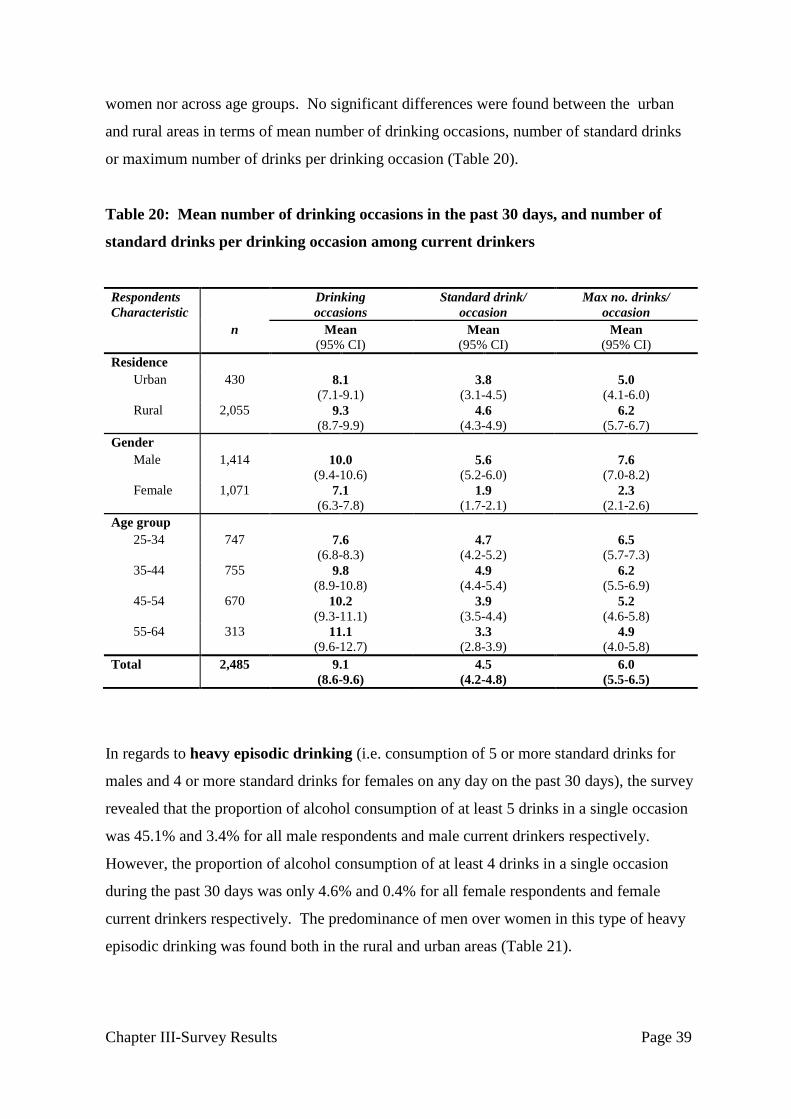
Chapter III-Survey Results Page 39
women nor across age groups. No significant differences were found between the urban
and rural areas in terms of mean number of drinking occasions, number of standard drinks
or maximum number of drinks per drinking occasion (Table 20).
Table 20: Mean number of drinking occasions in the past 30 days, and number of
standard drinks per drinking occasion among current drinkers
Respondents
Characteristic
Drinking
occasions
Standard drink/
occasion
Max no. drinks/
occasion
n Mean
(95% CI) Mean
(95% CI) Mean
(95% CI)
Residence
Urban 430 8.1
(7.1-9.1) 3.8
(3.1-4.5) 5.0
(4.1-6.0)
Rural 2,055 9.3
(8.7-9.9) 4.6
(4.3-4.9) 6.2
(5.7-6.7)
Gender
Male 1,414 10.0
(9.4-10.6) 5.6
(5.2-6.0) 7.6
(7.0-8.2)
Female 1,071 7.1
(6.3-7.8) 1.9
(1.7-2.1) 2.3
(2.1-2.6)
Age group
25-34 747 7.6
(6.8-8.3) 4.7
(4.2-5.2) 6.5
(5.7-7.3)
35-44 755 9.8
(8.9-10.8) 4.9
(4.4-5.4) 6.2
(5.5-6.9)
45-54 670 10.2
(9.3-11.1) 3.9
(3.5-4.4) 5.2
(4.6-5.8)
55-64 313 11.1
(9.6-12.7) 3.3
(2.8-3.9) 4.9
(4.0-5.8)
Total 2,485 9.1
(8.6-9.6)
4.5
(4.2-4.8)
6.0
(5.5-6.5)
In regards to heavy episodic drinking (i.e. consumption of 5 or more standard drinks for
males and 4 or more standard drinks for females on any day on the past 30 days), the survey
revealed that the proportion of alcohol consumption of at least 5 drinks in a single occasion
was 45.1% and 3.4% for all male respondents and male current drinkers respectively.
However, the proportion of alcohol consumption of at least 4 drinks in a single occasion
during the past 30 days was only 4.6% and 0.4% for all female respondents and female
current drinkers respectively. The predominance of men over women in this type of heavy
episodic drinking was found both in the rural and urban areas (Table 21).

Chapter III-Survey Results Page 40
Table 21: Heavy drinking among the total respondents and current drinkers
Respondents
Characteristic
5/4 or more drinks during a single occasion in the past 30 days among
Total population Current drinkers
n %
(95% CI)
n %
(95% CI)
Urban
Male 341 39.5
(30.7-48.4)
228 3.5
(2.3-4.6)
Female 648 3.5
(1.3-5.7)
193 0.2
(0.0-0.4)
Rural
Male 1,596 46.2
(42.8-49.6)
1,173 3.4
(3.0-3.8)
Female 2,848 4.8
(3.6-6.0)
874 0.5
(0.3-0.6)
Urban and Rural
Male 1,937 45.1
(41.9-48.3)
1,401 3.4
(3.0-3.8)
Female 3,496 4.6
(3.5-5.6)
1,067 0.4
(0.3-0.6)
3.3.4 Alcohol consumption in the past 7 days
Table 22 shows that, among current drinkers, men were overall 1.6 times more prevalent
than women in consuming alcohol at least 4 days in the past 7 days (30.9 vs. 18.9%). Also
among current drinkers, men were almost 7 times more prevalent than women in taking at
least 5 drinks on any day in the past 7 days (34.3 vs. 5.0%), and in taking at least 20 drinks
in the past 7 days (18.8 vs. 2.7%).
Figure 5 shows that the proportion of respondents who did drink at least 4 days in the past 7
days was overall 26.6%; and ranged from 20.6% for ages 25-34 to 29.7-3.5% for ages 35-
64.

Chapter III-Survey Results Page 41
Table 22: Frequency and quantity of drinks consumed in the past 7 days among
current drinkers
Respondents
Characteristic
4+ days drinking 5+ drinks on
any day
20+ drinks in
7 days
n %
(95% CI) %
(95% CI %
(95% CI
Urban
Male 222 28.9
(21.7-36.2) 32.6
(24.2-41.1) 17.3
(11.0-23.7)
Female 192 12.7
(6.4-19.0) 4.1
(0.9-7.4) 1.5
(0.1-3.0)
Rural
Male 1,133 30.2
(27.3-33.2) 34.6
(30.4-38.8) 19.0
(16.2-21.9)
Female 851 20.4
(16.6-24.1) 5.1
(3.3-7.0) 2.9
(1.8-4.0)
Urban and Rural
Male 1,355 30.0
(27.3-32.7) 34.3
(30.6-38.1) 18.8
(16.2-21.4)
Female 1,043 18.9
(15.7-22.2) 5.0
(3.4-6.5) 2.7
(1.7-3.6)
Figure 5: Percent of alcohol drinking for at least 4 days in the past 7 days
20.6
30.3 29.7
33.5
26.6
25-34 35-44 45-54 55-64 25-64
Age group (years)

Chapter III-Survey Results Page 42
3.3.5 Alcohol consumption with meals
Table 23 shows that 2 in every 10 current drinkers (21.2%) reportedly never consumed
alcohol with meals whereas almost half of them (45.3%) did drink alcohol with meals. The
proportion of respondents who reported to usually drink alcohol with meals was similar
between men and women, the urban and rural respondents, and across age groups.
Table 23: Percent distribution of current (past 30 days) drinkers who usually,
sometimes, rarely or never drink alcohol with meals
Respondents
Characteristic
Drinking alcohol with meals among current drinkers
Usually Sometimes Rarely Never
n %
(95% CI) %
(95% CI) %
(95% CI) %
(95% CI)
Residence
Urban 431 43.2
(32.2-54.1) 23.2
(15.2-31.2) 5.6
(2.5-8.8) 28.0
(17.2-38.7)
Rural 2,065 45.7
(41.0-50.4) 24.0
(21.1-27.0) 10.3
(8.3-12.4) 20.0
(16.6-23.3)
Gender
Male 1,421 44.0 (39.5-48.5)
26.4
(22.9-29.8) 9.8
(7.6-12.0) 19.8
(16.3-23.3)
Female 1,075 48.1
(42.7-53.5) 18.3
(15.2-21.3) 9.0
(6.5-11.5) 24.6
(20.3-28.9)
Age group
25-34 750 43.6
(38.2-49.0) 22.7
(18.3-27.0) 10.4
(7.6-13.2) 23.4
(19.2-27.6)
35-44 759 44.0
(38.4-49.7) 25.0
(20.7-29.2) 10.1
(7.5-12.7) 20.9
(16.7-25.1)
45-54 673 47.3
(41.3-53.3) 25.5
(21.3-29.6) 7.5
(5.3-9.7) 19.7
(15.6-23.7)
55-64 314 53.0
(45.3-60.8) 21.9
(16.2-27.6) 8.9
(5.4-12.4) 16.2
(11.2-21.2)
Total 2,496 45.3
(41.0-49.6)
23.9
(21.1-26.7)
9.6
(7.8-11.4)
21.2
(17.9-24.5)
In summary, 1 in every 4 respondents (26.5%) was lifetime alcohol abstainers whereas 1 in
every 10 respondents (10.0%) was past 12 months abstainers. On the contrary, 1 in every 2
respondents (53.5%) was past 30 days current drinkers, and this proportion was similar
between the urban and rural areas, but 2.4 times higher in men than in women. Finally, men
were around 10 times more likely than women to be engaged in heavy episodic drinking in
the past 30 days, both in the urban and rural areas.
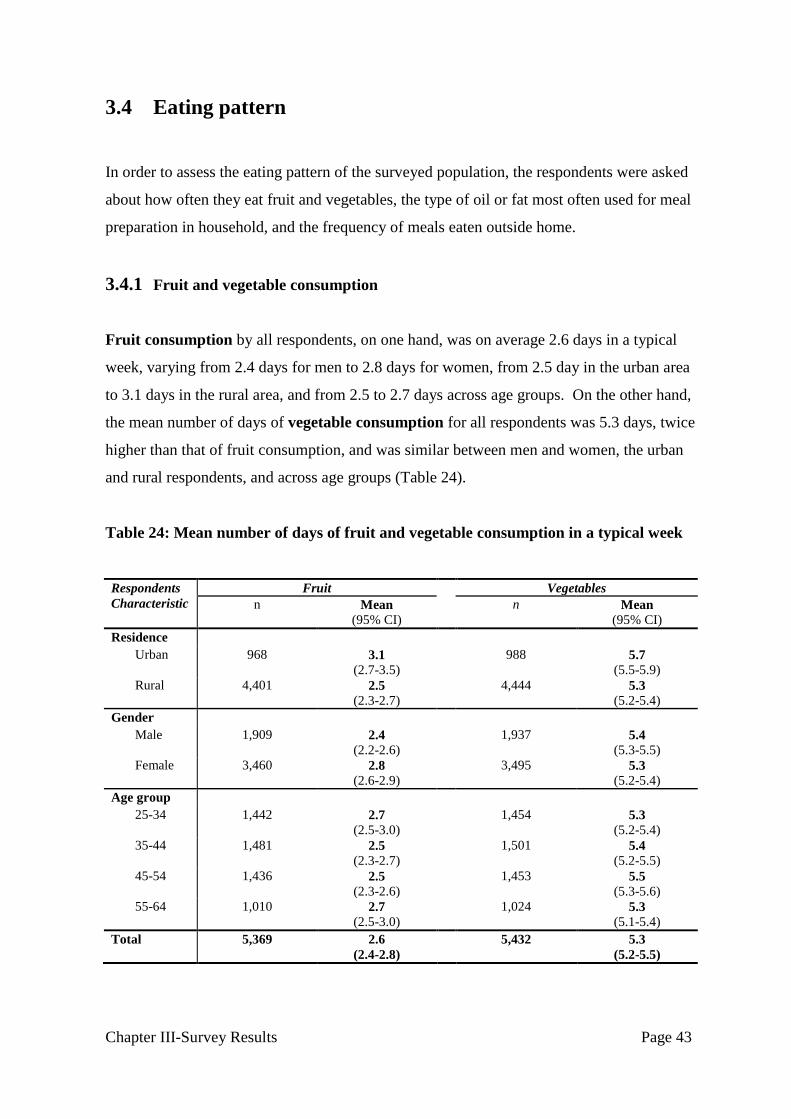
Chapter III-Survey Results Page 43
3.4 Eating pattern
In order to assess the eating pattern of the surveyed population, the respondents were asked
about how often they eat fruit and vegetables, the type of oil or fat most often used for meal
preparation in household, and the frequency of meals eaten outside home.
3.4.1 Fruit and vegetable consumption
Fruit consumption by all respondents, on one hand, was on average 2.6 days in a typical
week, varying from 2.4 days for men to 2.8 days for women, from 2.5 day in the urban area
to 3.1 days in the rural area, and from 2.5 to 2.7 days across age groups. On the other hand,
the mean number of days of vegetable consumption for all respondents was 5.3 days, twice
higher than that of fruit consumption, and was similar between men and women, the urban
and rural respondents, and across age groups (Table 24).
Table 24: Mean number of days of fruit and vegetable consumption in a typical week
Respondents
Characteristic
Fruit Vegetables
n Mean
(95% CI)
n Mean
(95% CI)
Residence
Urban 968 3.1
(2.7-3.5)
988 5.7
(5.5-5.9)
Rural 4,401 2.5
(2.3-2.7)
4,444 5.3
(5.2-5.4)
Gender
Male 1,909 2.4
(2.2-2.6)
1,937 5.4
(5.3-5.5)
Female 3,460 2.8
(2.6-2.9)
3,495 5.3
(5.2-5.4)
Age group
25-34 1,442 2.7
(2.5-3.0)
1,454 5.3
(5.2-5.4)
35-44 1,481 2.5
(2.3-2.7)
1,501 5.4
(5.2-5.5)
45-54 1,436 2.5
(2.3-2.6)
1,453 5.5
(5.3-5.6)
55-64 1,010 2.7
(2.5-3.0)
1,024 5.3
(5.1-5.4)
Total 5,369 2.6
(2.4-2.8)
5,432 5.3
(5.2-5.5)

Chapter III-Survey Results Page 44
The reported amount of fruit consumption among all respondents was on average 1.0
serving per day, and this amount was not significantly different between men and women,
the urban and rural respondents, and across age groups. Besides, the amount of vegetable
consumption was on average 2.0 servings per day, and this amount was also similarly
distributed between men and women, the urban and rural respondents, and across age
groups (Table 25).
Table 25: Mean number of fruit and vegetable servings per day
Respondents
Characteristic
Fruit Vegetables
n Mean
(95% CI)
n Mean
(95% CI)
Residence
Urban 968 1.2
(1.0-1.4)
988 2.3
(2.0-2.6)
Rural 4,400 1.0
(0.9-1.1)
4,444 1.9
(1.8-2.0)
Gender
Male 1,908 1.0
(0.9-1.1)
1,937 2.1
(1.9-2.2)
Female 3,460 1.1
(1.0-1.1)
3,495 1.9
(1.8-2.0)
Age group
25-34 1,441 1.1
(1.0-1.2)
1,454 2.0
(1.8-2.1)
35-44 1,481 1.0
(0.9-1.1)
1,501 2.0
(1.8-2.1)
45-54 1,436 0.9
(0.8-1.0)
1,453 2.0
(1.9-2.1)
55-64 1,010 1.1
(0.9-1.2)
1,024 1.9
(1.8-2.1)
Total 5,368 1.0
(0.9-1.1)
5,432 2.0
(1.8-2.1)
In terms of the frequency of daily fruit and/or vegetable consumption, 84.3% of the total
respondents were reportedly eating less than five servings of fruit and/or vegetables per day
and are therefore considered at increased risk of developing NCDs. This proportion of
respondents eating low fruit and vegetables was similar between men and women and
across age groups, but by almost 10% higher in the rural than urban areas (86.0 vs. 76.5%)
(Table 26).

Chapter III-Survey Results Page 45
Table 26: Frequency of fruit and/or vegetable consumption per day
Respondents
Characteristic
Number of servings of fruit and/or
vegetable consumption per day
n None
%
(95% CI)
1-2
%
(95% CI)
3-4
%
(95% CI)
5+
%
(95% CI)
< 5
%
(95% CI)
Residence
Urban 988 7.2
(4.6-9.9) 43.4
(36.6-50.2) 25.9
(21.5-30.3) 23.5
(16.8-30.2) 76.5
(69.8-83.2)
Rural 4,444 12.2
(10.5-13.9) 48.9
(46.4-51.5) 24.9
(22.9-26.9) 14.0
(11.7-16.3) 86.0
(83.7-88.3)
Gender
Male 1,937 10.9
(9.1-12.7) 46.5
(43.3-49.7) 25.9
(23.4-28.5) 16.7
(13.8-19.5) 83.3
(80.5-86.2)
Female 3,495 11.7
(9.9-13.5) 49.3
(46.8-51.9) 24.2
(22.4-26.1) 14.7
(12.5-16.9) 85.3
(83.1-87.5)
Age group
25-34 1,454 11.5
(9.2-13.7) 46.3
(43.1-49.5) 25.2
(21.6-30.3) 17.0
(14.0-19.9) 83.0
(80.1-86.0)
35-44 1,501 11.6
(9.6-13.6) 48.3
(45.2-51.5) 26.4
(23.6-29.2) 13.7
(11.1-16.3) 86.3
(83.7-88.9)
45-54 1,453 10.7
(8.8-12.7) 49.8
(46.4-53.2) 24.2
(21.4-27.0) 15.2
(12.4-18.1) 84.8
(81.9-87.6)
55-64 1,024 11.2
(8.7-13.7) 48.7
(44.6-52.9) 23.0
(19.8-26.2) 17.1
(13.5-20.6) 82.9
(79.4-86.5)
Total 5,432 11.3
(9.8-12.8)
48.0
(45.6-50.3)
25.1
(23.2-26.9)
15.7
(13.4-17.9)
84.3
(82.1-86.6)
3.4.2 Types of oil or fat used for meal preparation
As shown in Table 27, vegetable oil was used by the majority (71.9%) of households, with
the proportion of urban households using vegetable oils by 14% higher than that of rural
households (83.2 vs. 69.5%).
Lard, on the contrary, was used by few (14.0%) households, with the proportion of rural
households using lard double that of urban households (15.5 vs. 6.7%).
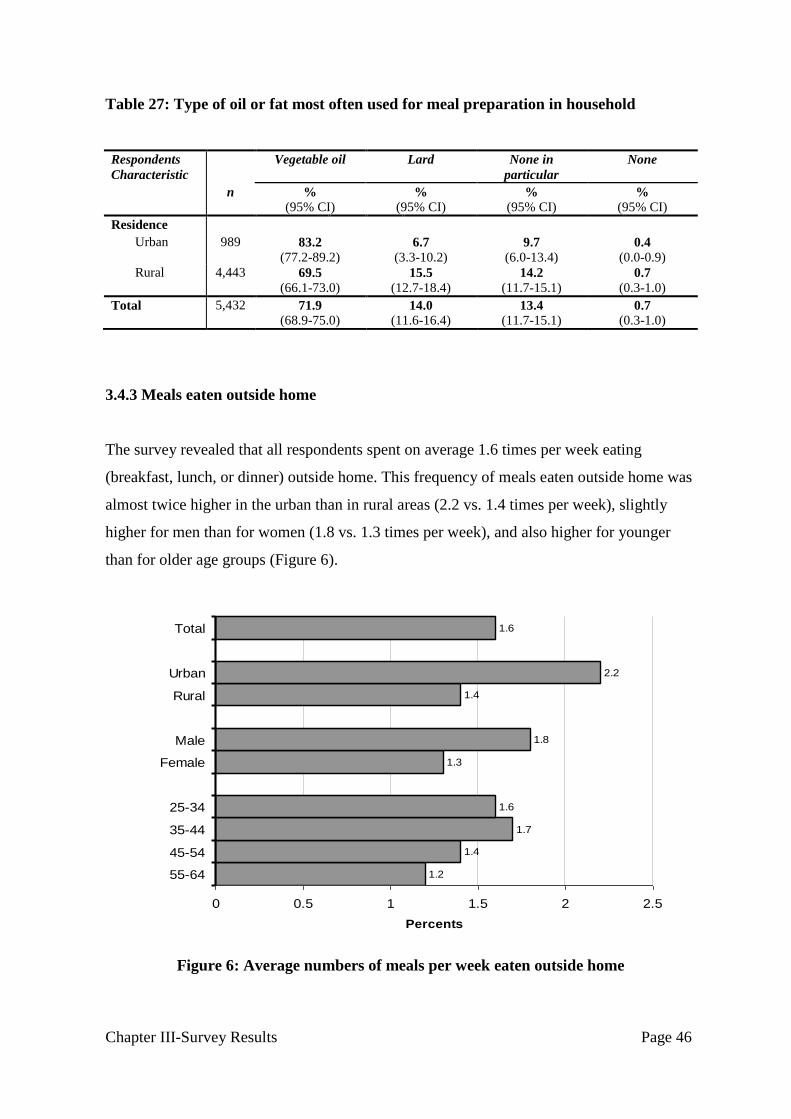
Chapter III-Survey Results Page 46
Table 27: Type of oil or fat most often used for meal preparation in household
Respondents
Characteristic Vegetable oil Lard None in
particular
None
n %
(95% CI) %
(95% CI) %
(95% CI) %
(95% CI)
Residence
Urban 989 83.2
(77.2-89.2) 6.7
(3.3-10.2) 9.7
(6.0-13.4) 0.4
(0.0-0.9)
Rural 4,443 69.5
(66.1-73.0) 15.5
(12.7-18.4) 14.2
(11.7-15.1) 0.7
(0.3-1.0)
Total 5,432 71.9
(68.9-75.0) 14.0
(11.6-16.4) 13.4
(11.7-15.1) 0.7
(0.3-1.0)
3.4.3 Meals eaten outside home
The survey revealed that all respondents spent on average 1.6 times per week eating
(breakfast, lunch, or dinner) outside home. This frequency of meals eaten outside home was
almost twice higher in the urban than in rural areas (2.2 vs. 1.4 times per week), slightly
higher for men than for women (1.8 vs. 1.3 times per week), and also higher for younger
than for older age groups (Figure 6).
Figure 6: Average numbers of meals per week eaten outside home
1.2
1.4
1.7
1.6
1.3
1.8
1.4
2.2
1.6
0 0.5 1 1.5 2 2.5
55-64
45-54
35-44
25-34
Female
Male
Rural
Urban
Total
Percents

Chapter III-Survey Results Page 47
3.5 Physical Activity
The survey sought to estimate the prevalence of respondents by category of high, moderate,
and low physical activity, and to quantify the amount and frequency of physical activity
among all respondents and by gender, residence, and age groups.
3.5.1 Category of physical activity
In total, 3 in every 4 respondents (76.1 %) were reported as having high physical activity,
whereas the remaining were reported as having moderate (13.3%) and low (10.6%) physical
activity. When broken down by gender, residence, and age groups, women had moderate
physical activity higher than men (15.6 vs. 10.9%); urban and older respondents had lower
physical activity than rural (14.8 vs. 9.7%) and younger respondents respectively (Table
28).
Table 28: Percentage of respondents classified into three categories of total physical
activity
Respondents
Characteristic Low
physical activity
Moderate
physical activity
High
physical activity
n %
(95% CI) %
(95% CI) %
(95% CI)
Residence
Urban 989 14.8
(10.8-18.7) 15.4
(11.7-19.1) 69.8
(63.9-75.8)
Rural 4,441 9.7
(8.3-11.0) 12.9
(11.2-14.5) 77.5
(75.2-79.8)
Gender
Male 1,936 10.9
(9.1-12.7) 10.9
(9.1-12.7) 78.2
(75.5-80.9)
Female 3,494 10.3
(8.8-11.7) 15.6
(13.8-17.5) 74.1
(71.8-76.5)
Age group
25-34 1,454 10.1
(8.2-12.1) 12.2
(10.2-14.1) 77.7
(74.9-80.5)
35-44 1,499 9.4
(7.5-11.2) 12.8
(10.6-14.9) 77.9
(74.9-80.8)
45-54 1,453 11.1
(9.1-13.1) 13.5
(11.2-15.8) 75.4
(72.2-78.5)
55-64 1,024 13.6
(11.1-16.2) 17.7
(14.6-20.7) 68.7
(64.5-72.9)
Total 5,430 10.6
(9.3-11.8)
13.3
(11.8-14.8)
76.1
(74.0-78.3)

Chapter III-Survey Results Page 48
3.5.2 Amount and frequency of physical activities
Overall, the median time spent in physical activity was on average 4 hours and 4 minutes
per day. Broken down by residence, gender and age groups, the median time spent in
physical activity was on average higher for the rural than for urban respondents (4h17min.
vs. 3h36min.), higher for men than for women (5h vs. 3h34min.), and decreasing with
increased age (Table 29).
Table 29: Minutes of total physical activity on average per day
Respondents
Characteristic
Physical activity
Total Work-Related Transport- related Recreational-
related
n Mean Median Mean Median Mean Median Mean Median
Residence
Urban 989 239.5 205.7 215.2 180.0 12.8 0.0 11.5 0.0
Rural 4,441 280.9 257.1 251.0 240.0 24.8 0.0 5.2 0.0
Gender
Male 1,936 304.2 300.0 271.0 257.1 23.4 0.0 9.8 0.0
Female 3,494 244.7 214.3 219.7 180.0 22.0 0.0 3.0 0.0
Age group
25-34 1,454 286.7 270.0 255.0 240.0 22.7 0.0 9.0 0.0
35-44 1,499 289.9 270.0 260.2 240.0 25.0 0.0 4.7 0.0
45-54 1,453 260.1 240.0 233.7 210.0 22.0 0.0 4.4 0.0
55-64 1,024 222.0 180.0 198.1 162.9 18.5 0.0 5.4 0.0
Total 5,430 273.7 244.3 244.7 240.0 22.7 0.0 6.3 0.0
Absence of related physical activity
In total, 9.6%, 54.4%, and 86.1% of the total respondents were reported of having no work-,
transport- or recreational- related physical activity respectively (Table 30).
In addition, respondents reported as doing no vigorous physical activity was overall 63.0%.
The proportion of respondents doing no vigorous physical activity was 1.8 times higher for
women than for men (79.7 vs. 45.3%), and higher for urban respondents as compared to
rural respondents (70.2 vs. 61.4%).
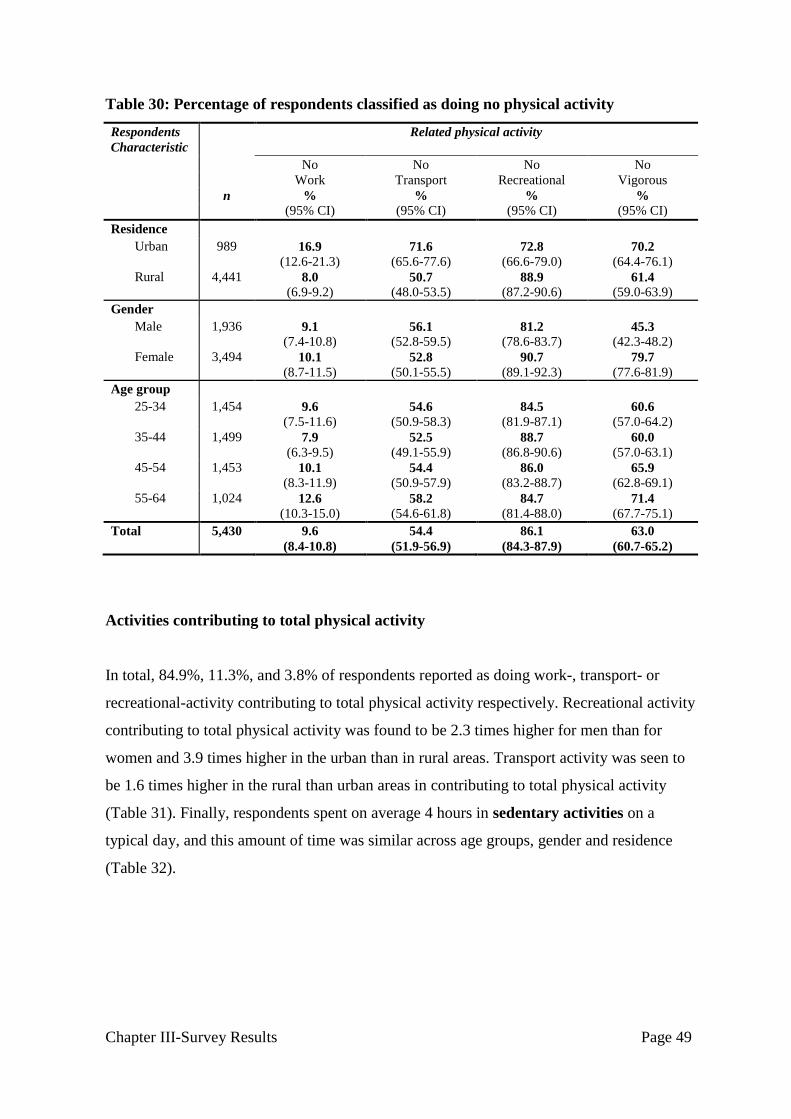
Chapter III-Survey Results Page 49
Table 30: Percentage of respondents classified as doing no physical activity
Respondents
Characteristic
Related physical activity
No
Work
%
(95% CI)
No
Transport
%
(95% CI)
No
Recreational
%
(95% CI)
No
Vigorous
%
(95% CI)
n
Residence
Urban 989 16.9
(12.6-21.3) 71.6
(65.6-77.6) 72.8
(66.6-79.0) 70.2
(64.4-76.1)
Rural 4,441 8.0
(6.9-9.2) 50.7
(48.0-53.5) 88.9
(87.2-90.6) 61.4
(59.0-63.9)
Gender
Male 1,936 9.1
(7.4-10.8) 56.1
(52.8-59.5) 81.2
(78.6-83.7) 45.3
(42.3-48.2)
Female 3,494 10.1
(8.7-11.5) 52.8
(50.1-55.5) 90.7
(89.1-92.3) 79.7
(77.6-81.9)
Age group
25-34 1,454 9.6
(7.5-11.6) 54.6
(50.9-58.3) 84.5
(81.9-87.1) 60.6
(57.0-64.2)
35-44 1,499 7.9
(6.3-9.5) 52.5
(49.1-55.9) 88.7
(86.8-90.6) 60.0
(57.0-63.1)
45-54 1,453 10.1 (8.3-11.9)
54.4
(50.9-57.9) 86.0
(83.2-88.7) 65.9
(62.8-69.1)
55-64 1,024 12.6
(10.3-15.0) 58.2
(54.6-61.8) 84.7
(81.4-88.0) 71.4
(67.7-75.1)
Total 5,430 9.6
(8.4-10.8)
54.4
(51.9-56.9)
86.1
(84.3-87.9)
63.0
(60.7-65.2)
Activities contributing to total physical activity
In total, 84.9%, 11.3%, and 3.8% of respondents reported as doing work-, transport- or
recreational-activity contributing to total physical activity respectively. Recreational activity
contributing to total physical activity was found to be 2.3 times higher for men than for
women and 3.9 times higher in the urban than in rural areas. Transport activity was seen to
be 1.6 times higher in the rural than urban areas in contributing to total physical activity
(Table 31). Finally, respondents spent on average 4 hours in sedentary activities on a
typical day, and this amount of time was similar across age groups, gender and residence
(Table 32).

Chapter III-Survey Results Page 50
Table 31: Percentage of activities contributing to total physical activity
Respondents
Characteristic Activities contributing to total physical activity
N Work
% (95% CI)
Transport
% (95% CI)
Recreational
% (95% CI)
Residence
Urban 896 82.2
(78.2-86.3) 7.6
(5.8-9.5) 10.1
(6.7-13.6)
Rural 4,217 85.4
(84.0-86.7) 12.0
(10.8-13.3) 2.6
(2.0-3.2)
Gender
Male 1,837 84.2
(82.5-86.0) 10.4
(9.0-11.8) 5.4
(4.2-6.5)
Female 3,276 85.4
(84.1-86.7) 12.2
(11.0-13.4) 2.4
(1.7-3.0)
Age group
25-34 1,373 84.4
(83.6-86.2) 11.1
(9.6-12.5) 4.5
(3.2-5.8)
35-44 1,424 86.2
(84.6-87.7) 11.2
(9.9-12.6) 2.6
(1.8-3.4)
45-54 1,369 85.0
(83.2-86.9) 11.2
(9.8-12.6) 3.8
(2.7-4.9)
55-64 947 82.8
(80.7-84.9) 12.3
(10.7-13.9) 4.9
(3.5-6.4)
Total 5,113 84.9
(83.6-86.2)
11.3
(10.2-12.4)
3.8
(3.1-4.6)
Table 32 Minutes spent in sedentary activities on a typical day
Respondents
Characteristic Minutes spent in sedentary activities on a typical day
n Mean (95% CI) Median (95% CI)
Residence
Urban 989 257.7
(239.6-275.8) 240.0
(180.0-360.0)
Rural 4,444 242.4
(233.8-251.0) 240.0
(180.0-300.0)
Gender
Male 1,937 232.2
(223.9-240.4) 240.0
(180.0-300.0)
Female 3,496 257.3
(248.6-266.0) 240.0
(180.0-330.0)
Age group
25-34 1,454 243.2
(233.6-252.8) 240.0
(150.0-300.0)
35-44 1,501 242.4
(233.2-251.6) 240.0
(180.0-300.0)
45-54 1,454 238.0
(228.3-247.8) 240.0
(150.0-300.0)
55-64 1,024 268.7
(256.5-280.9) 240.0
(180.0-300.0)
Total 5,433 245.1
(237.3-252.8)
240.0
(180.0-300.0)
Chapter III-Survey Results Page 51
3.6 Blood Pressure and Diabetes History
Raised blood pressure and raised blood glucose are known risk factors of NCDs. Data on
these risk factors were obtained first through the interview of the survey participants on
blood pressure and blood glucose history (Step 1), and then through measurement of blood
pressure (Step 2) and of blood glucose (Step 3).
3.6.1 Blood pressure measurement and diagnosis history
In the Step 1 of the survey, participants were asked whether they had any blood pressure
measurement in the past 12 months prior to the survey, and whether they were on treatment
for high blood pressure. Data obtained included details on whether or not respondents had
previously been told by a health worker that they had high blood pressure, and on whether
or not they were currently receiving medication for high blood pressure.
Table 33 shows that in the past 12 months prior to the survey, 51.0% of all respondents
replied they never had their blood pressure measured, 40.8% reported they did have their
blood pressure measured but not diagnosed, whereas the remaining 5.1% and 3.1% had their
blood pressure diagnosed within and not within the past 12 months respectively.
In addition, the proportion of respondents who had their blood pressure never measured was
1.5 times higher for men than for women (62.1 vs. 40.4%), and also 1.5 times higher in the
rural than urban areas (53.9 vs. 37.2%).
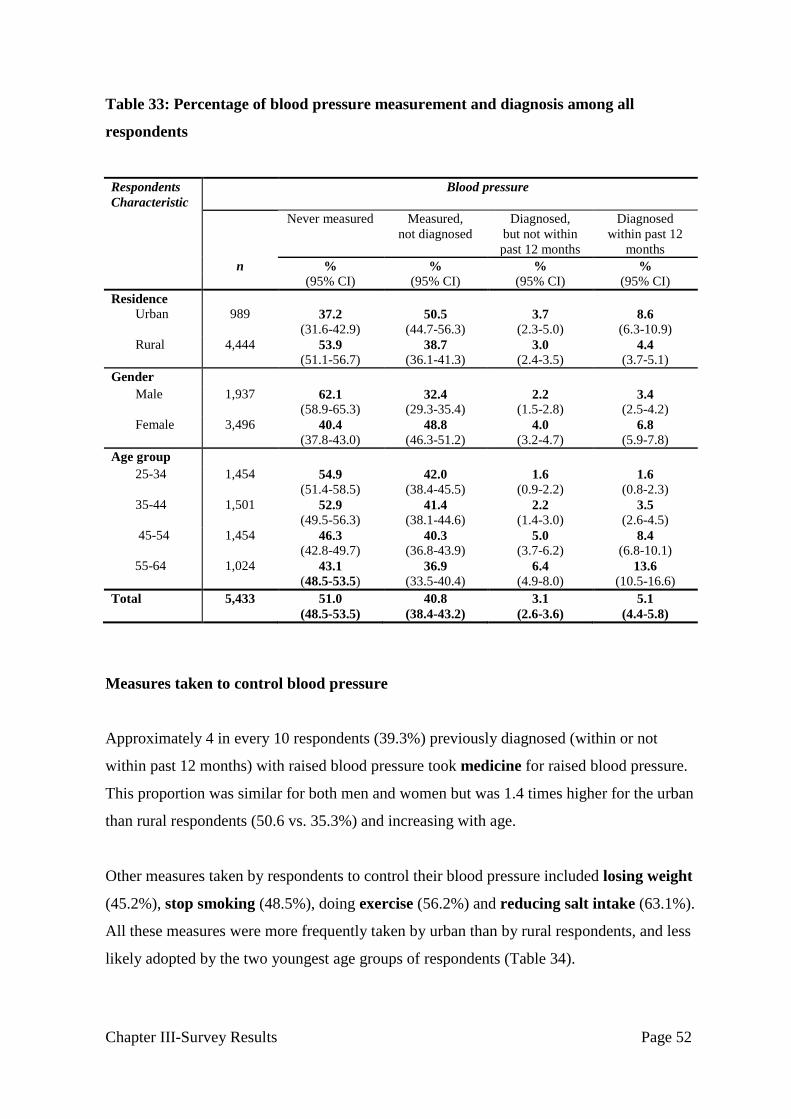
Chapter III-Survey Results Page 52
Table 33: Percentage of blood pressure measurement and diagnosis among all
respondents
Respondents
Characteristic
Blood pressure
Never measured Measured,
not diagnosed
Diagnosed,
but not within
past 12 months
Diagnosed
within past 12
months
n % % % %
(95% CI) (95% CI) (95% CI) (95% CI)
Residence
Urban 989 37.2
(31.6-42.9) 50.5
(44.7-56.3) 3.7
(2.3-5.0) 8.6
(6.3-10.9)
Rural 4,444 53.9
(51.1-56.7) 38.7
(36.1-41.3) 3.0
(2.4-3.5) 4.4
(3.7-5.1)
Gender
Male 1,937 62.1
(58.9-65.3) 32.4
(29.3-35.4) 2.2
(1.5-2.8) 3.4
(2.5-4.2)
Female 3,496 40.4
(37.8-43.0) 48.8
(46.3-51.2) 4.0
(3.2-4.7) 6.8
(5.9-7.8)
Age group
25-34 1,454 54.9
(51.4-58.5) 42.0
(38.4-45.5) 1.6
(0.9-2.2) 1.6
(0.8-2.3)
35-44 1,501 52.9
(49.5-56.3) 41.4
(38.1-44.6) 2.2
(1.4-3.0) 3.5
(2.6-4.5)
45-54 1,454 46.3
(42.8-49.7) 40.3
(36.8-43.9) 5.0
(3.7-6.2) 8.4
(6.8-10.1)
55-64 1,024 43.1
(48.5-53.5) 36.9
(33.5-40.4) 6.4
(4.9-8.0) 13.6
(10.5-16.6)
Total 5,433 51.0
(48.5-53.5)
40.8
(38.4-43.2)
3.1
(2.6-3.6)
5.1
(4.4-5.8)
Measures taken to control blood pressure
Approximately 4 in every 10 respondents (39.3%) previously diagnosed (within or not
within past 12 months) with raised blood pressure took medicine for raised blood pressure.
This proportion was similar for both men and women but was 1.4 times higher for the urban
than rural respondents (50.6 vs. 35.3%) and increasing with age.
Other measures taken by respondents to control their blood pressure included losing weight
(45.2%), stop smoking (48.5%), doing exercise (56.2%) and reducing salt intake (63.1%).
All these measures were more frequently taken by urban than by rural respondents, and less
likely adopted by the two youngest age groups of respondents (Table 34).
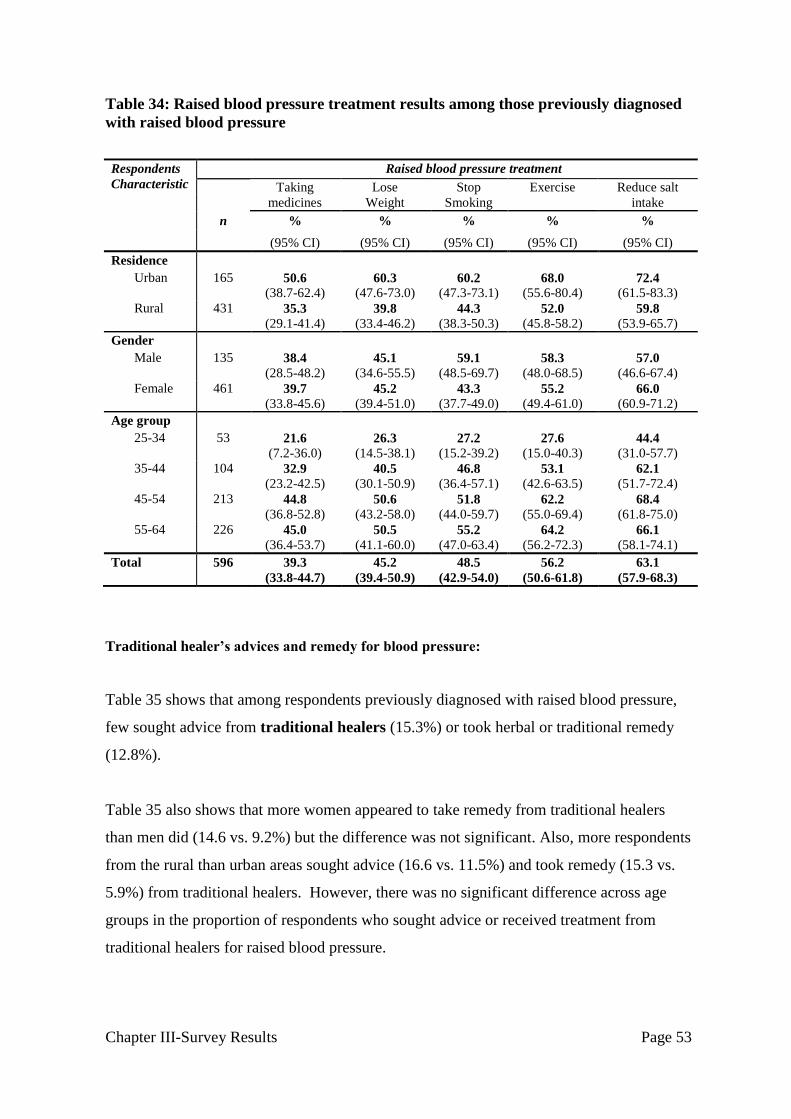
Chapter III-Survey Results Page 53
Table 34: Raised blood pressure treatment results among those previously diagnosed
with raised blood pressure
Respondents
Characteristic Raised blood pressure treatment
Taking
medicines
Lose
Weight
Stop
Smoking
Exercise Reduce salt
intake
n % % % % %
(95% CI) (95% CI) (95% CI) (95% CI) (95% CI)
Residence
Urban 165 50.6
(38.7-62.4) 60.3
(47.6-73.0) 60.2
(47.3-73.1) 68.0
(55.6-80.4) 72.4
(61.5-83.3)
Rural 431 35.3
(29.1-41.4) 39.8
(33.4-46.2) 44.3
(38.3-50.3) 52.0
(45.8-58.2) 59.8
(53.9-65.7)
Gender
Male 135 38.4
(28.5-48.2) 45.1
(34.6-55.5) 59.1
(48.5-69.7) 58.3
(48.0-68.5) 57.0
(46.6-67.4)
Female 461 39.7
(33.8-45.6) 45.2
(39.4-51.0) 43.3
(37.7-49.0) 55.2
(49.4-61.0) 66.0
(60.9-71.2)
Age group
25-34 53 21.6
(7.2-36.0) 26.3
(14.5-38.1) 27.2
(15.2-39.2) 27.6
(15.0-40.3) 44.4
(31.0-57.7)
35-44 104 32.9
(23.2-42.5) 40.5
(30.1-50.9) 46.8
(36.4-57.1) 53.1
(42.6-63.5) 62.1
(51.7-72.4)
45-54 213 44.8
(36.8-52.8) 50.6
(43.2-58.0) 51.8
(44.0-59.7) 62.2
(55.0-69.4) 68.4
(61.8-75.0)
55-64 226 45.0
(36.4-53.7) 50.5
(41.1-60.0) 55.2
(47.0-63.4) 64.2
(56.2-72.3) 66.1
(58.1-74.1)
Total 596 39.3
(33.8-44.7)
45.2
(39.4-50.9)
48.5
(42.9-54.0)
56.2
(50.6-61.8)
63.1
(57.9-68.3)
Traditional healer’s advices and remedy for blood pressure:
Table 35 shows that among respondents previously diagnosed with raised blood pressure,
few sought advice from traditional healers (15.3%) or took herbal or traditional remedy
(12.8%).
Table 35 also shows that more women appeared to take remedy from traditional healers
than men did (14.6 vs. 9.2%) but the difference was not significant. Also, more respondents
from the rural than urban areas sought advice (16.6 vs. 11.5%) and took remedy (15.3 vs.
5.9%) from traditional healers. However, there was no significant difference across age
groups in the proportion of respondents who sought advice or received treatment from
traditional healers for raised blood pressure.

Chapter III-Survey Results Page 54
Table 35: Percentage of respondents who have sought advice or received treatment
from traditional healers for raised blood pressure among those previously diagnosed
with raised blood pressure
Respondents
Characteristic Respondents with raised blood pressure who had
Seen traditional healer Taken herbal or traditional remedy
n %
(95% CI) %
(95% CI)
Residence
Urban 165 11.5
(5.4-17.6) 5.9
(1.8-10.0)
Rural 431 16.6
(3.0-20.3) 15.3
(11.6-19.0)
Gender
Male 135 13.3
(7.1-19.5) 9.2
(4.1-14.3
Female 461 16.3
(12.6-19.9) 14.6
(10.8-18.4)
Age group
25-34 53 14.1
(4.1-24.0) 8.7
(0.5-17.0)
35-44 104 13.8
(6.9-20.7) 12.9
(6.0-19.9)
45-54 213 15.6
(9.9-21.2) 13.2
(8.0-18.5)
55-64 226 16.5
(11.1-21.9) 14.2
(9.1-19.2)
Total 596 15.3
(12.2-18.4)
12.8
(9.9-15.8)
3.6.2 Blood sugar and diabetes history
Blood sugar measurement in the past 12 months
In total, the majority (84.9%) of respondents reported they never had their blood sugar
measured in the past 12 months prior to the survey; a small proportion of respondents
(13.4%) reportedly had their blood sugar measured but not diagnosed, and few had their
blood sugar diagnosed within (1.3%) and not within (0.4%) the past 12 months.
Respondents who never had their blood pressure measured in the past 12 months were
significantly lower in the urban than rural areas (71.2 vs. 87.9%), similar between women
and men (83.2 vs. 86.7%), and tended to be decreasing with age (Table 36).

Chapter III-Survey Results Page 55
Table 36: Blood sugar measurement and diagnosis among all respondents
Respondents
Characteristic
Blood sugar
Never measured
Measured, but
not diagnosed
Diagnosed,
but not within
past 12 months
Diabetes
diagnosed within
past 12 months n %
(95% CI) %
(95% CI) %
(95% CI)
%
(95% CI)
Residence
Urban 989 71.2
(65.5-77.0) 24.5
(19.4-29.6) 0.8
(0.3-1.2) 3.5
1.8-5.3 ()
Rural 4,444 87.9
(86.2-89.5) 11.0
(9.4-12.6) 0.3
(0.1-0.5) 0.9
(0.6-1.2)
Gender
Male 1,937 86.7
(84.7-88.7) 12.2
(10.3-14.0) 0.3
(0.1-0.5) 0.8
(0.4-1.2)
Female 3,496 83.2
(81.1-85.3) 14.5
(12.5-16.4) 0.4
(0.2-0.7) 1.9
(1.3-2.4)
Age group
25-34 1,454 87.4
(85.1-89.6) 12.2
(10.0-14.4) 0.3
(0.0-0.5)
0.2
(0.0-0.3)
35-44 1,501 86.0
(83.6-88.4) 13.3
(10.9-15.7) 0.1
(0.0-0.2)
0.6
(0.2-1.0)
45-54 1,454 81.9
(79.2-84.7) 14.3
(11.9-16.8) 0.8
(0.3-1.3)
2.9
(1.8-4.1)
55-64 1,024 80.6
(77.4-83.8) 15.1
(12.4-17.8) 0.5
(0.1-1.0)
3.7
(2.3-5.2)
Total 5,433 84.9
(83.2-86.6)
13.4
(11.8-14.9)
0.4
(0.2-0.5)
1.3
(1.0-1.7)
Treatment of diabetes
Insulin was used by few (14.5%) respondents previously (within or not within past 12
months) diagnosed with diabetes. This proportion of insulin treatment was not significantly
different across residence, gender, or age groups.
Other measures taken by respondents to control their raised blood sugar included taking
medicines orally (58.2%), quitting smoking (67.9%), losing weight (71.7%), diet (80.3%)
and exercise (80.3%). In terms of residence, urban respondents were significantly more
frequent than rural respondents in taking oral medicines (71.7 vs. 47.5%) and losing weight
(86.4 vs. 60.0%) to control their diabetes. With regards to gender, men were significantly
more frequent than women (86.1 vs. 59.7%) in adopting stop smoking as a measure to
control their blood pressure (Table 37).

Chapter III-Survey Results Page 56
Table 37: Diabetes treatment results among respondents previously diagnosed with
raised blood sugar or diabetes
Respondents
Characteristic Diabetes treatment results
Taking
insulin
Oral drug Stop
smoking
Lose
weight
Prescribed
diet
Do exercise
n % (95% CI)
% (95% CI)
% (95% CI)
% (95% CI)
% (95% CI)
% (95% CI)
Residence
Urban 58 15.9 (4.5-27.4)
71.7 (61.1-82.4)
78.0 (65.1-90.9)
86.4 (76.9-95.9)
89.4 (83.2-95.6)
90.0 (82.6-97.4)
Rural 64 13.3 (4.8-21.8)
47.5 (36.6-58.3)
59.9 (47.1-72.6)
60.0 (46.7-73.3)
73.1 (62.3-83.9)
72.5 (59.8-85.3)
Gender
Male 32 11.1 (0.0-23.4)
68.2 (51.1-85.2)
86.1 (74.1-98.0)
74.7 (60.2-89.2)
87.0 (75.5-98.5)
80.2 (65.3-95.0)
Female 90 16.0 (7.5-24.5)
53.7 (43.4-64.0)
59.7 (48.2-71.2)
70.3 (61.0-79.6)
77.3 (69.1-85.5)
80.3 (71.9-88.7)
Total 122 14.5 (7.6-21.3)
58.2 (50.3-66.1)
67.9 (58.4-77.3)
71.7 (63.0-80.3)
80.3 (73.5-87.1)
80.3 (72.0-88.5)
Traditional healers and diabetes
Approximately 1 in every 4 respondents previously diagnosed with raised blood sugar
sought advice from traditional healers (26.7%) or took traditional medication (23.3%).
There was no gender difference in the consultation of traditional healers for raised blood
sugar, but women were 3 times more prevalent than men in taken traditional medication for
diabetes (29.5 vs. 9.6%). Similarly, there was no residence difference in taking advice
from traditional healers for raised blood sugar, but rural respondents were 3 times more
likely than urban respondents (33.9 vs. 10.0%) in taking traditional medication for diabetes.
Finally, no difference across age groups was found in regards to taking advices or
medication from traditional healers for diabetes (Table 38).

Chapter III-Survey Results Page 57
Table 38: Percentage of respondents who had sought advice or treatment from
traditional healers for diabetes among those previously diagnosed
Respondents
Characteristic
n
Diabetic respondents who had
seen traditional healer
Diabetic respondents who had
taken traditional remedy
%
(95% CI) %
(95% CI)
Residence
Urban 58 23.5
(11.6-35.5) 10.0
(0.9-19.0)
Rural 64 29.3
(16.7-41.8) 33.9
(20.7-47.0)
Gender
Male 32 26.5
(8.0-45.1) 9.6
(0.0-21.2)
Female 90 26.8
(16.9-36.7) 29.5
(18.8-40.2)
Age group
25-34 7 18.3
(0.0-50.9) 14.6
(0.0-41.6)
35-44 13 16.0
(0.0-37.3) 32.7
(4.4-61.0)
45-54 55 32.4
(17.8-47.0) 16.6
(6.2-27.0)
55-64 47 24.7
(9.2-40.2) 32.2
(15.2-49.2)
Total 122 26.7
(18.0-35.5)
23.3
(14.5-32.1)
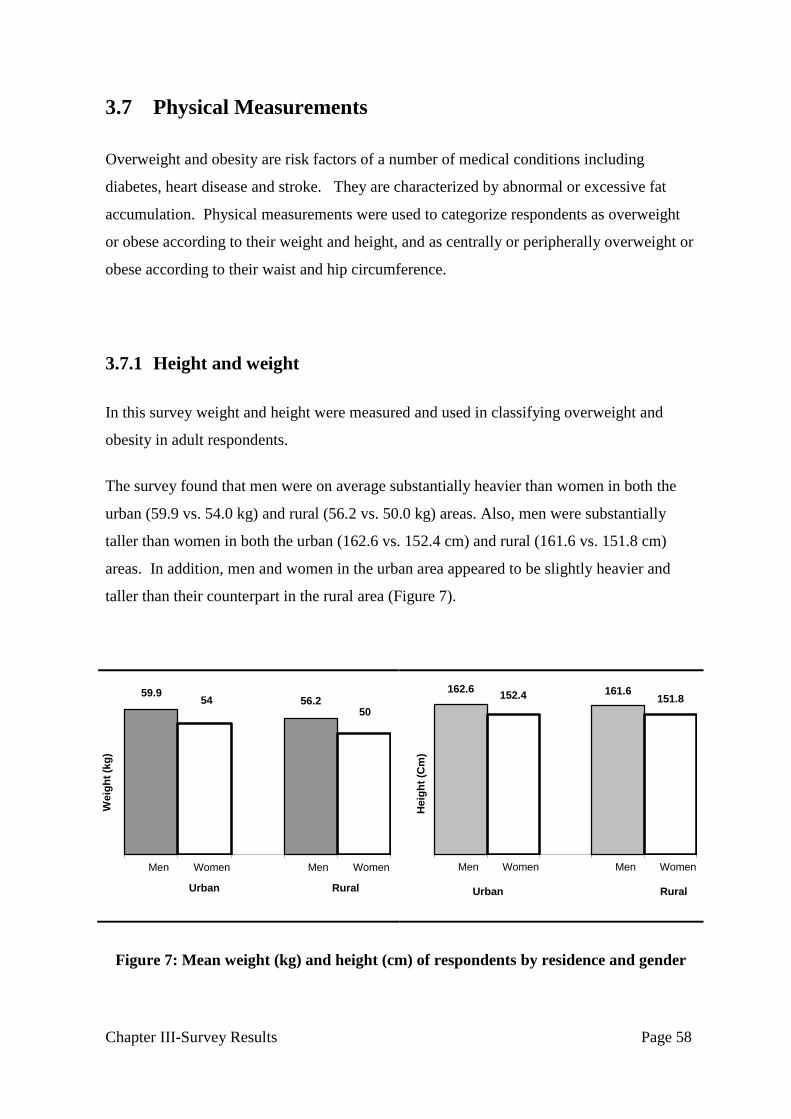
Chapter III-Survey Results Page 58
59.9 54 56.2
50
Men Women Men Women
Weig
ht
(kg
)
Urban Rural
162.6 152.4 161.6
151.8
Men Women Men Women
Heig
ht
(Cm
)
Urban Rural
3.7 Physical Measurements
Overweight and obesity are risk factors of a number of medical conditions including
diabetes, heart disease and stroke. They are characterized by abnormal or excessive fat
accumulation. Physical measurements were used to categorize respondents as overweight
or obese according to their weight and height, and as centrally or peripherally overweight or
obese according to their waist and hip circumference.
3.7.1 Height and weight
In this survey weight and height were measured and used in classifying overweight and
obesity in adult respondents.
The survey found that men were on average substantially heavier than women in both the
urban (59.9 vs. 54.0 kg) and rural (56.2 vs. 50.0 kg) areas. Also, men were substantially
taller than women in both the urban (162.6 vs. 152.4 cm) and rural (161.6 vs. 151.8 cm)
areas. In addition, men and women in the urban area appeared to be slightly heavier and
taller than their counterpart in the rural area (Figure 7).
Figure 7: Mean weight (kg) and height (cm) of respondents by residence and gender

Chapter III-Survey Results Page 59
3.7.2 BMI category
Overweight is defined as having a BMI greater than or equal to 25 kg/m2
and below 30
kg/m2
whereas obesity is defined as having a BMI greater than or equal to 30 kg/m2.
The proportion of respondents classified as overweight and obese by their BMI was 13.5%
and 1.9% respectively. The proportion of overweight and obese population was twice in the
urban area as compared to the rural area (26.7 vs. 13.0%), and was 1.6 times higher in
women than in men (19.0 vs. 11.6%). The youngest age group of respondents (that is 25-
34) was found to have the least prevalent for overweight and obesity as compared to other
age groups (Table 39).
Table 39: Percentage of respondents (excluding pregnant women) in each BMI
category
Respondents
Characteristic
Underweight
< 18.5
Normal
18.5-24.9
Overweight
25-29.9
Obese
≥ 30
n %
(95% CI) %
(95% CI) %
(95% CI) %
(95% CI)
Residence
Urban 926 10.0
(5.8-14.3) 63.2
(57.5-68.9) 23.1
(19.3-26.9) 3.6
(2.2-5.0
Rural 4,286 12.7
(11.5-14.0) 74.2
(72.7-75.8) 11.5
(10.2-12.8) 1.5
(1.1-2.0)
Gender
Male 1,878 9.7
(8.1-11.2) 78.7
(76.6-80.8) 10.5
(9.0-12.1) 1.1
(0.6-1.5)
Female 3,334 14.9
(13.3-16.4) 66.1
(64.1-68.2) 16.3
(14.7-18.0) 2.7
(2.0-3.3)
Age group
25-34 1,353 11.8
(9.6-14.1) 78.4
(75.4-81.4) 8.9
(7.0-10.8) 0.9
(0.4-1.3)
35-44 1,443 10.3
(8.5-12.0) 72.2
(69.4-75.0) 15.2
(13.0-17.3) 2.4
(1.5-3.3)
45-54 1,420 12.2
(10.2-14.2) 67.9
(65.0-70.8) 17.5
(15.0-20.0) 2.4
(1.5-3.3)
55-64 9,96 18.3
(15.6-21.0) 63.3
(60.0-66.5) 15.7
(13.2-18.2) 2.7
(1.6-3.8)
Total 5,212 12.3
(11.1-13.5)
72.4
(70.8-74.0)
13.5
(12.2-14.7)
1.9
(1.4-2.3)

Chapter III-Survey Results Page 60
In addition, the proportion of the respondents in the youngest age group classifying as
overweight and/or obese (BMI≥ 25 kg/m2) was found to be consistently lower than the
older age groups in both the urban and rural areas, regardless of gender (Figure 8).
Figure 8: Percentage of BMI≥ 25 kg/m2
by age groups, gender and residence
3.7.3 Waist and Hip Circumference
The survey found that, in total, the average waist circumference of men was 76.0 cm, lower
in the two youngest age groups than the eldest ones, and the mean waist circumference of
women was 75.5 cm, also lower in the two youngest age groups than the others.
With respect to gender, the survey found that the mean hip circumference of the total
respondents was 88.5 cm for men and 89.4 cm for women, and not significantly different
across age groups.
In regards to residence, respondents in the urban area had on average higher waist
circumference (79.4 vs. 74.7-75.3 cm) and hip circumference (90.6 -92.5 vs. 88.1- 88.7cm)
than those in the rural area (Table 40).
79
11.313.1
11.9
34.9
28.2
30.8
10.6
2220.6
16.517.9
28.1
37.235.5
25-
34
35-
44
45-
54
55-
64
25-
34
35-
44
45-
54
55-
64
25-
34
35-
44
45-
54
55-
64
25-
34
35-
44
45-
54
55-
64
Rural Urban Rural Urban
Men Women

Chapter III-Survey Results Page 61
Waist to hip ratio
Waist and hip circumferences were measured to calculate the waist to hip ratio (WHR) in
order to define central obesity. Waist to hip ratio is an indicator of a risk factor in
developing cardiovascular disease. People with more weight around their waist are at
greater risk of lifestyle related diseases such as heart disease and diabetes than those with
weight around their hips.
In this survey, WHR of respondents in the rural area was on average 0.9 for men and 0.8 for
women, but was 0.9 for both men and women in the urban area (Table 40).
The proportion of respondents with high WHR (defined as WHR≥1.0 for men and
WHR≥0.85 for women) was by far higher in women than in men and increased with age in
both the urban and rural areas (Figure 9).
Table 40: Mean waist and hip circumference measurement (cm) and waist to hip ratio
(pregnant women excluded)
Respondents
Characteristic
Men Women
n
Waist
(cm) (95% CI)
Hip
(cm) (95% CI)
Waist/
Hip
Ratio (95% CI) n
Waist
(cm) (95% CI)
Hip
(cm) (95% CI)
Waist/
Hip
Ratio (95% CI)
Residence
Urban 322 79.4 (77.6-81.2)
90.6 (89.4-91.9)
0.9 (0.9-0.9)
606 79.4 (77.9-80.8)
92.5 (91.4-93.5)
0.9 (0.8-0.9)
Rural 1,561 75.3 (74.8-75.9)
88.1 (87.7-88.5)
0.9 (0.9-0.9)
2,737 74.7 (74.1-75.3)
88.7 (88.3-89.2)
0.8 (0.8-0.8)
Age group
25-34 526 74.1 (73.4-74.7)
88.2 (87.7-88.7)
0.8 (0.8-0.8)
827 72.6 (71.9-73.3)
88.5 (87.9-89.0)
0.8 (0.8-0.8)
35-44 518 76.5 (75.6-77.4)
89.1 (88.4-89.7)
0.9 (0.9-0.9)
925 76.5 (75.7-77.3)
90.3 (89.6-91.0)
0.8 (0.8-0.9)
45-54 483 77.8 (76.9-78.7)
88.5 (87.9-89.2)
0.9 (0.9-0.9)
941 77.8 (76.9-78.6)
90.2 (89.6-90.8)
0.9 (0.9-0.9)
55-64 356 77.5 (76.5-78.5)
88.0 (87.2-88.8)
0.9 (0.9-0.9)
650 77.4 (76.2-78.5)
88.8 (87.9-89.6)
0.9 (0.9-0.9)
Total 1,883 76.0 (75.5-76.5)
88.5 (88.1-88.9)
0.9 (0.9-0.9)
3,343 75.5 (75.0-76.1)
89.4 (89.0-89.8)
0.8 (0.8-0.8)

Chapter III-Survey Results Page 62
Figure 9: Percentage of respondents with high WHR by age groups, residence and
gender
Waist circumference and risk in developing NCDs
Waist circumference alone had been used to indicate risk of developing NCDs. In
Cambodia, people with a waist circumference from 85 to 94 cm for men and from 81 to 88
cm for women are classified as having moderate risk for NCDs, whereas those with a waist
circumference beyond 94 cm for men and over 88 cm for women are classified as having
severe risk for NCDs.
According to the above classification, 11.8% and 3.1% of all male respondents in this
survey were classified as having moderate and high risk for NCDs respectively. However,
urban male respondents with moderate and high risk for NCDs were 2.5 and 4.3 folds more
prevalent than rural respondents. In addition, the youngest age group of respondents was at
lower risk for NCDs than the other age groups. For women, 16.9% and 10.5% were
classified according to their waist circumference as having moderate and high risk
0.2 0.5 2.2 2 0 1.3 3
6.5
26
41.7
50.6 50.8
34.2
44.9
66.8
71.5
25-3435-4445-5455-64 25-3435-4445-5455-64 25-3435-4445-5455-64 25-3435-4445-5455-64
Rural Urban Rural Urban
Men Women

Chapter III-Survey Results Page 63
prevalence for NCDs respectively. However, women with moderate and high risk for NCDs
were 1.5 and 2.3 folds more prevalent in the urban area than those in the rural area (Table
41).
In regards to age, the waist circumference of the youngest age group (25-34 years) of
respondents classified as out of the normal range (≥85 cm for men; ≥81 cm for women) was
consistently lower than the older age groups across residence and gender (Table 41 and
Figure 10).
Table 41: Category of waist circumference of respondents (pregnant women excluded)
by urban and rural residence
Respondents
Characteristic
Waist circumference category
Men Women
<85cm 85-94cm >94cm
<81cm 81-88cm >88cm
n (%) (%) (%) n (%) (%) (%)
Residence
Urban 322 67.3 23.8 9.0 606 57.6 23.1 19.3
Rural 1561 88.3 9.6 2.1 2737 76.0 15.5 8.4
Age group
25-34 526 91.2 7.9 1.0 827 84.9 11.9 3.1
35-44 518 84 11.7 4.4 925 68.9 18.9 12.2
45-54 483 79.1 17.3 3.7 941 63.4 20.7 15.9
55-64 356 78.8 15.5 5.8 650 64.3 19.3 16.4
Total 1883 85.0 11.8 3.1 3343 72.6 16.9 10.5
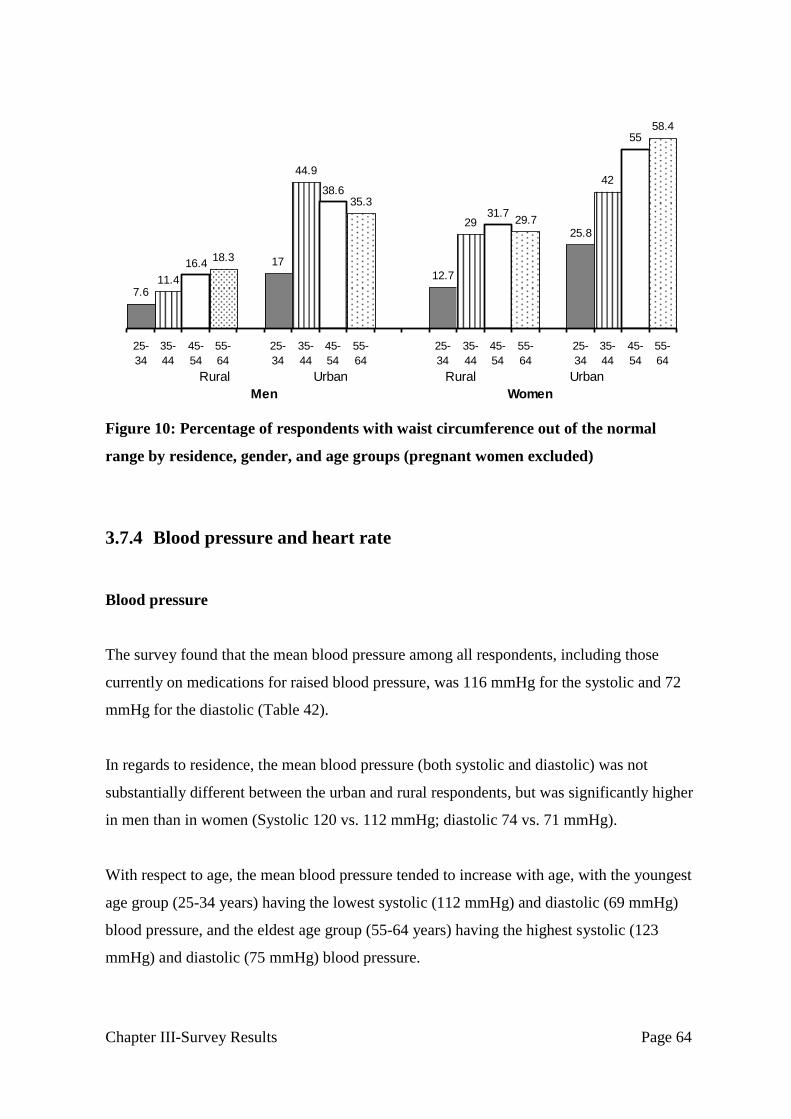
Chapter III-Survey Results Page 64
Figure 10: Percentage of respondents with waist circumference out of the normal
range by residence, gender, and age groups (pregnant women excluded)
3.7.4 Blood pressure and heart rate
Blood pressure
The survey found that the mean blood pressure among all respondents, including those
currently on medications for raised blood pressure, was 116 mmHg for the systolic and 72
mmHg for the diastolic (Table 42).
In regards to residence, the mean blood pressure (both systolic and diastolic) was not
substantially different between the urban and rural respondents, but was significantly higher
in men than in women (Systolic 120 vs. 112 mmHg; diastolic 74 vs. 71 mmHg).
With respect to age, the mean blood pressure tended to increase with age, with the youngest
age group (25-34 years) having the lowest systolic (112 mmHg) and diastolic (69 mmHg)
blood pressure, and the eldest age group (55-64 years) having the highest systolic (123
mmHg) and diastolic (75 mmHg) blood pressure.
7.611.4
16.418.3 17
44.9
38.635.3
12.7
2931.7
29.725.8
42
5558.4
25-
34
35-
44
45-
54
55-
64
25-
34
35-
44
45-
54
55-
64
25-
34
35-
44
45-
54
55-
64
25-
34
35-
44
45-
54
55-
64
Rural Urban Rural Urban
Men Women

Chapter III-Survey Results Page 65
Heart rate
The survey revealed that the mean heart rate was 80 beats per minute for the total
respondents; and this rate was similar for both the urban and rural respondents, but
significantly faster in women than in men (83 vs. 76 beats per minute). In addition, the
mean heart rate tended to decreased with decreased age, from 81beats per minutes in the 25-
34 years age group to 78 beats per minutes in the 55-74 years age group (Table 42).
Table 42: Mean blood pressure and heart rate
Respondents
Characteristic
Systolic
blood pressure
Diastolic
blood pressure
Heart rate
(Beats/ min.)
n
Mean
(95% CI) Mean
(95% CI Mean
95% CI
Residence
Urban 937 118
(116-120) 74
(72-76) 79
(78-81)
Rural 4,379 116
(115-116) 72.0
(71-73) 80
(79-80)
Gender
Male 1,884 120
(119-121) 74
(73-75) 76
(75-77)
Female 3,432 112
(112-113) 71
(70-71) 83
(82-83)
Age group
25-34 1,410 112
(111-113) 69
(69-70) 81
(80-82)
35-44 1,475 116
(115-117) 73
(72-74) 80
(79-80)
45-54 1,424 119
(118-121) 75
(74-76) 79
(78-79)
55-64 1,007 123
(121-125) 75
(74-76) 78
(77-79)
Total 5,316 116
(115-117)
72
(72-73) 80
(79-80)
3.7.5 Raised blood pressure or hypertension
In this survey, respondents‟ blood pressure was classified as “normal” when they had a
mean systolic pressure < 140 mmHg AND a mean diastolic pressure < 90 mmHg, without
currently taking any medication for high blood pressure.
Chapter III-Survey Results Page 66
A person was considered being mildly hypertensive if the systolic value (SBP) ≥ 140
mmHg and/or the diastolic value (DBP) ≥ 90 mmHg. Moderate hypertension had been
defined as SBP≥ 160 mmHg and/or DBP ≥ 100 mmHg.
Finally respondents who had previously been told by a health worker that they had high
blood pressure and were currently receiving anti-hypertensive medication, whether or not
their blood pressure was currently normal were also classified as having “raised blood
pressure or hypertension”.
Prevalence of hypertension
In total, respondents with mild hypertension (SBP ≥140 and/or DBP ≥ 90 mmHg) and
moderate hypertension (SBP ≥160 and/or DBP ≥ 100 mmHg) including those currently on
medication for hypertension, were on average 11.2% and 4.6% respectively (Table 43).
By gender, men were found to have mild hypertension 1.3 times more prevalent than
women (12.8 vs. 9.6%), but were not more frequent than women in having moderate
hypertension (4.8 vs. 4.5%).
By residence, the urban respondents were 1.7 and 2.5 times more frequent than rural
respondents in having mild (16.9 vs. 10.0%) and moderate hypertension (9.1 vs. 3.7%)
respectively.
By age groups, blood pressure was found to increase substantially with age, with the
proportion of mild hypertension in the eldest age group 6 times higher than that of the
youngest one (24.2 vs. 4.2%), and the prevalence of moderate hypertension 10 times higher
in the eldest age group as compared to the youngest one (12.9 vs. 1.3%).
In summary, 1 in every 10 respondents (11.2%) had (newly and previously diagnosed) mild
hypertension (SBP ≥140 and/or DBP ≥ 90 mmHg); this proportion was significantly higher
for the urban and male respondents as compared to rural and female respondents, and
increased with age. In addition, 1 in every 20 respondents (4.6%) had moderate
hypertension (SBP ≥160 and/or DBP ≥ 100 mmHg); this proportion was higher for the
urban and aging respondents than for rural and young respondents.

Chapter III-Survey Results Page 67
Table 43: Percentage of respondents with raised blood pressure including those
currently on medication for raised blood pressure
Respondents
Characteristic
Raised blood pressure including those currently on medication for raised
blood pressure
SBP ≥140 and/or
DBP ≥ 90 mmHg
SBP ≥160 and/or
DBP ≥ 100 mmHg
n %
(95% CI) %
(95% CI)
Residence
Urban 937 16.9
(14.1-19.6) 9.1
(6.7-11.4)
Rural 4,379 10.0
(8.9-11.2) 3.7
(3.0-4.5)
Gender
Male 1,884 12.8
(11.1-14.5) 4.8
(3.7-6.0)
Female 3,432 9.6
(8.5-10.8) 4.5
(3.7-5.30
Age group
25-34 1,410 4.2
(2.8-5.6) 1.3
(0.5-2.2)
35-44 1,475 10.1
(8.3-11.9) 3.1
(2.1-4.0)
45-54 1,424 16.9
(14.4-19.4) 7.5
(5.9-9.2)
55-64 1,007 24.2
(20.7-27.7) 12.9
(10.2-15.7)
Total 5,316 11.2
(10.1-12.3)
4.6
(3.9-5.4)
Newly diagnosed raised blood pressure
Excluding respondents on medication for raised blood pressure, the proportion of
respondents with mild to severe and with severe raised blood pressure (newly diagnosed by
the survey) was 9.4% and 2.7% respectively.
The prevalence of mild to severe raised blood pressure newly diagnosed was 1.6 times
higher in men than in women (11.7 vs. 7.2%), and 1.5 times higher in the urban than in rural
areas (12.8 vs. 8.7%). In addition, the proportion of mild to severe and severe raised blood
pressure were found to be increasing with age, with the eldest age group having mild to
severe and severe raised blood pressure 5 and 6 times higher than the youngest age group
respectively (Table 44).
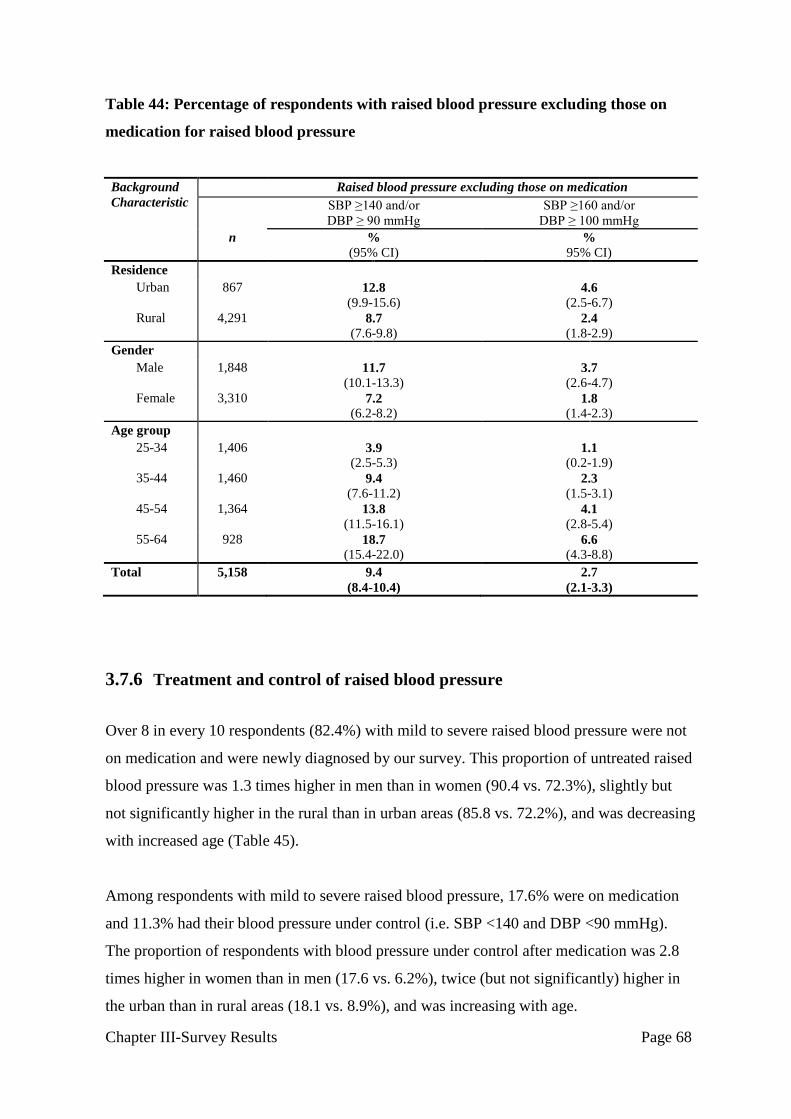
Chapter III-Survey Results Page 68
Table 44: Percentage of respondents with raised blood pressure excluding those on
medication for raised blood pressure
Background
Characteristic
Raised blood pressure excluding those on medication
SBP ≥140 and/or
DBP ≥ 90 mmHg
SBP ≥160 and/or
DBP ≥ 100 mmHg
n %
(95% CI) %
95% CI)
Residence
Urban 867 12.8
(9.9-15.6) 4.6
(2.5-6.7)
Rural 4,291 8.7
(7.6-9.8) 2.4
(1.8-2.9)
Gender
Male 1,848 11.7
(10.1-13.3) 3.7
(2.6-4.7)
Female 3,310 7.2
(6.2-8.2) 1.8
(1.4-2.3)
Age group
25-34 1,406 3.9
(2.5-5.3) 1.1
(0.2-1.9)
35-44 1,460 9.4
(7.6-11.2) 2.3
(1.5-3.1)
45-54 1,364 13.8
(11.5-16.1) 4.1
(2.8-5.4)
55-64 928 18.7
(15.4-22.0) 6.6
(4.3-8.8)
Total 5,158 9.4
(8.4-10.4)
2.7
(2.1-3.3)
3.7.6 Treatment and control of raised blood pressure
Over 8 in every 10 respondents (82.4%) with mild to severe raised blood pressure were not
on medication and were newly diagnosed by our survey. This proportion of untreated raised
blood pressure was 1.3 times higher in men than in women (90.4 vs. 72.3%), slightly but
not significantly higher in the rural than in urban areas (85.8 vs. 72.2%), and was decreasing
with increased age (Table 45).
Among respondents with mild to severe raised blood pressure, 17.6% were on medication
and 11.3% had their blood pressure under control (i.e. SBP <140 and DBP <90 mmHg).
The proportion of respondents with blood pressure under control after medication was 2.8
times higher in women than in men (17.6 vs. 6.2%), twice (but not significantly) higher in
the urban than in rural areas (18.1 vs. 8.9%), and was increasing with age.

Chapter III-Survey Results Page 69
Table 45: Percentage of respondents with treated and/or controlled raised blood
pressure among those with raised blood pressure or currently on medication for raised
blood pressure
Respondents
Characteristic
On medication
and
SBP<140 and DBP<9 0
On medication
and SBP≥140
and/or DBP≥90
Not on medication
and SBP≥140
and/or DBP≥90
n %
95% CI) %
95% CI) %
95% CI)
Residence
Urban 179 18.1
(10.5-25.7) 9.7
(4.4-14.9) 72.2
(61.4-83.1)
Rural 492 8.9
(6.1-11.8) 5.2
(2.9-7.5) 85.8
(82.0-89.7)
Gender
Male 273 6.2
(3.2-9.2) 3.4
(1.4-5.5) 90.4
(86.8-94.0)
Female 398 17.6
(13.1-22.1) 10.1
(6.3-13.8) 72.3
(66.4-78.3)
Age group
25-34 47 6.5
(0.0-13.7) 0.0
(0.0-0.0) 93.5
(86.3-100.0)
35-44 142 3.7
(0.5-6.8) 4.0
(1.3-6.8) 92.3
(88.0-96.6)
45-54 239 14.8
(10.2-19.4) 6.7
(3.0-10.4) 78.5
(72.4-84.6)
55-64 243 16.7
(11.2-22.2) 11.4
(6.9-15.9) 71.9
(64.3-79.5)
Total 671 11.3
(8.5-14.1)
6.4
(4.2-8.5)
82.4
(78.4-86.3)
In summary, 11.2% and 4.6% of the total respondents had mild to moderate hypertension
respectively; this prevalence was higher in men than in women, higher in the urban than in
rural areas, and increasing with age. In addition, 82.4% of respondents with hypertension
were newly diagnosed by the survey, and this proportion of newly diagnosed hypertension
was higher for the rural, male and younger population than for the urban, female and older
population.

Chapter III-Survey Results Page 70
3.8 BIOCHEMICAL MEASUREMENTS
Out of 5,433 respondents in the Step 1 survey, 5,210 had their blood cholesterol tested
whereas 5,123 had their fasting blood glucose measured.
3.8.1 Fasting blood glucose
Mean fasting glucose
Table 46 shows that, among 5123 respondents who had their blood glucose measured, the
mean fasting glucose was 4.0 mmol/L. This mean fasting blood glucose was lower in the
rural than in urban areas (3.9 vs. 4.3 mmol/L), and lowest in the youngest age group of
respondents, but did not significantly differ between men and women (4.0 vs. 3.9 mmol/L).
Table 46: Mean fasting blood glucose results including those currently on medication
for diabetes (non-fasting recipients excluded)
Respondents
Characteristic
Fasting blood glucose
mmol/L mg/dl
n Mean
(95% CI Mean
95% CI
Residence
Urban 899 4.3
(4.1-4.4) 76.8
(74.1-79.5)
Rural ,4224 3.9
(3.8-4.0) 70.4
(69.2-71.6)
Gender
Male 1,795 4.0
(3.9-4.1) 72.1
(70.8-73.3)
Female 3,328 3.9
(3.9-4.0) 70.9
(69.6-72.3)
Age group
25-34 1,332 3.8
(3.7-3.9) 68.7
(67.5-70.0)
35-44 1,430 3.9
(3.8-4.0) 70.1
(68.8-71.4)
45-54 1,385 4.2
(4.1-4.3) 75.8
(73.8-77.8)
55-64 976 4.2
(4.0-4.3) 75.2
(72.8-77.5)
Total 5,123 4.0
(3.9-4.0)
71.5
(70.4-72.6)
Chapter III-Survey Results Page 71
Fasting blood glucose categories
In this survey, participants were classified into blood glucose categories as follows:
• Impaired fasting glucose: a fasting blood glucose greater or equal to 5.6 mmol/l, unless
previously diagnosed with diabetes and on medical treatment;
• Diabetes: a fasting glucose greater or equal 6.1 mmol/l or previously diagnosed with
diabetes and currently on anti-diabetes medication; and
• Currently on medication for diabetes: Participants previously diagnosed with diabetes
and currently on anti-diabetes medication.
Table 47 shows that 1.4% of the total respondents had impaired blood glucose and 2.9% had
raised blood glucose or diabetes including 1.3% currently on medication for diabetes.
Table 47 also shows that there was no difference between men and women in their
prevalence of impaired fasting blood glucose, diabetes, and current medication for diabetes.
However, the prevalence of diabetes was 2.4 times higher in the urban than in rural areas
(5.6 vs. 2.3%). Also, urban respondents who were on medication for diabetes were more
prevalent than rural respondents (3.6 vs. 0.8%). Finally, the overall prevalence of diabetes
increased with age, from 1.1% for ages 25-34 to 6.0% for ages 55-64.

Chapter III-Survey Results Page 72
Table 47: Proportion of respondents with impaired, raised blood glucose or currently
on medication for diabetes (non-fasting recipients excluded)
Respondents
Characteristic
Impaired
fasting
glycaemia
Raised blood
Glucose or
on medication
Currently
on medication
for diabetes
n %
(95% CI) %
(95% CI %
(95% CI
Residence
Urban 899 1.7
(0.6-2.8) 5.6
(4.0-7.20 3.6
(2.0-5.3)
Rural 4,224 1.4
(0.9-1.8) 2.3
(1.7-2.9) 0.8
(0.5-1.1)
Gender
Male 1,795 1.8
(1.2-2.5) 2.5
(1.7-3.3) 1.1
(0.5-1.7)
Female 3,328 1.0
(0.6-1.4) 3.3
(2.5-4.0) 1.5
(1.0-1.9)
Age group
25-34 1,332 1.5
(0.7-2.3) 1.1
(0.4-1.8) 0.5
(0.0-1.0)
35-44 1,430 0.9
(0.3-1.5) 2.2
(1.4-3.0) 0.5
(0.1-0.8)
45-54 1,385 1.5
(0.9-2.2) 4.8
(3.5-6.1) 2.4
(1.3-3.4)
55-64 976 2.1
(1.0-3.2) 6.0
(4.4-7.7) 3.5
(2.2-4.8)
Total 5,123 1.4
(1.0-1.8)
2.9
(2.3-3.4)
1.3
(0.9-1.7)
3.8.2 Total cholesterol
Mean total cholesterol
The mean total cholesterol among all respondents including those currently on medication
for raised cholesterol was 4.5 mmol/L, higher in women than in men (4.6 vs. 4.4 mmol/L),
higher in the urban than in rural areas (4.7 vs. 4.4 mmol/L), and highest in the age group 45-
64 years (Table 48).

Chapter III-Survey Results Page 73
Table 48: Mean total cholesterol among all respondents including those currently on
medication for raised cholesterol
Respondents
Characteristic
Total blood cholesterol
in mmol/L
Total blood cholesterol
in mg/dl
N Mean
(95% CI) Mean
(95% CI)
Residence
Urban 918 4.7
(4.6-4.8) 182.6
(178.4-186.8)
Rural 4,292 4.4
(4.4-4.5) 171.3
(170.0-172.6)
Gender
Male 1,844 4.4
(4.4-4.4) 169.9
(168.4-171.4)
Female 3,366 4.6
(4.5-4.6) 176.4
(175.0-177.9)
Age group
25-34 1,362 4.4
(4.3-4.4) 168.6
(167.3-170.0)
35-44 1,449 4.4
(4.4-4.5) 171.6
(169.9-173.3)
45-54 1,405 4.6
(4.6-4.7) 178.7
(176.7-180.7)
55-64 994 4.7
(4.6-4.7) 180.9
(178.4-183.4)
Total 5,210 4.5
(4.4-4.5)
173.2
(172.0-174.5)
Raised total cholesterol
Table 49 shows that the proportion of respondents with a total cholesterol ≥ 5.0 mmol/L or
currently on medication for raised cholesterol, on one hand, was overall 20.7%. This
proportion was 1.4 folds higher in women than in men (24.2 vs. 17.0%), 1.8 times higher in
the urban than in rural areas (32.5 vs. 18.3%), and increasing with age.
Table 49 also shows that the proportion of respondents with a total cholesterol ≥ 6.2
mmol/L or currently on medication for raised cholesterol, on the other hand, was overall
3.2%. This proportion was 1.6 folds higher in women than in men (3.9 vs. 2.5%), 2.8 times
higher in the urban than in rural areas (7.0 vs. 2.5%), and increasing with age.

Chapter III-Survey Results Page 74
Table 49: Proportion of respondents with raised cholesterol or currently on
medication for raised cholesterol
Respondents
Characteristic
n
Total cholesterol ≥ 5.0 mmol/L or ≥
190 mg/dl or currently on medication
for raised cholesterol
Total cholesterol ≥ 6.2 mmol/L or ≥
240 mg/dl or currently on medication
for raised cholesterol
%
(95% CI) %
(95% CI)
Residence
Urban 918 32.5
(27.0-38.0) 7.0
(4.4-9.7)
Rural 4,292 18.3
(16.5-20.2) 2.5
(1.8-3.1)
Gender
Male 1,844 17.0
(14.8-19.2) 2.5
(1.6-3.4)
Female 3,366 24.2
(22.2-26.3) 3.9
(3.2-4.7)
Age group
25-34 1,362 14.5
(12.4-16.7) 1.0
(0.5-1.6)
35-44 1,449 19.2
(16.5-21.9) 2.6
(1.6-3.6)
45-54 1,405 27.7
(24.7-30.6) 5.4
(4.0-6.7)
55-64 994 30.2
(26.9-33.6) 7.4
(5.2-9.7)
Total 5,210 20.7
(19.0-22.5)
3.2
(2.6-3.9)
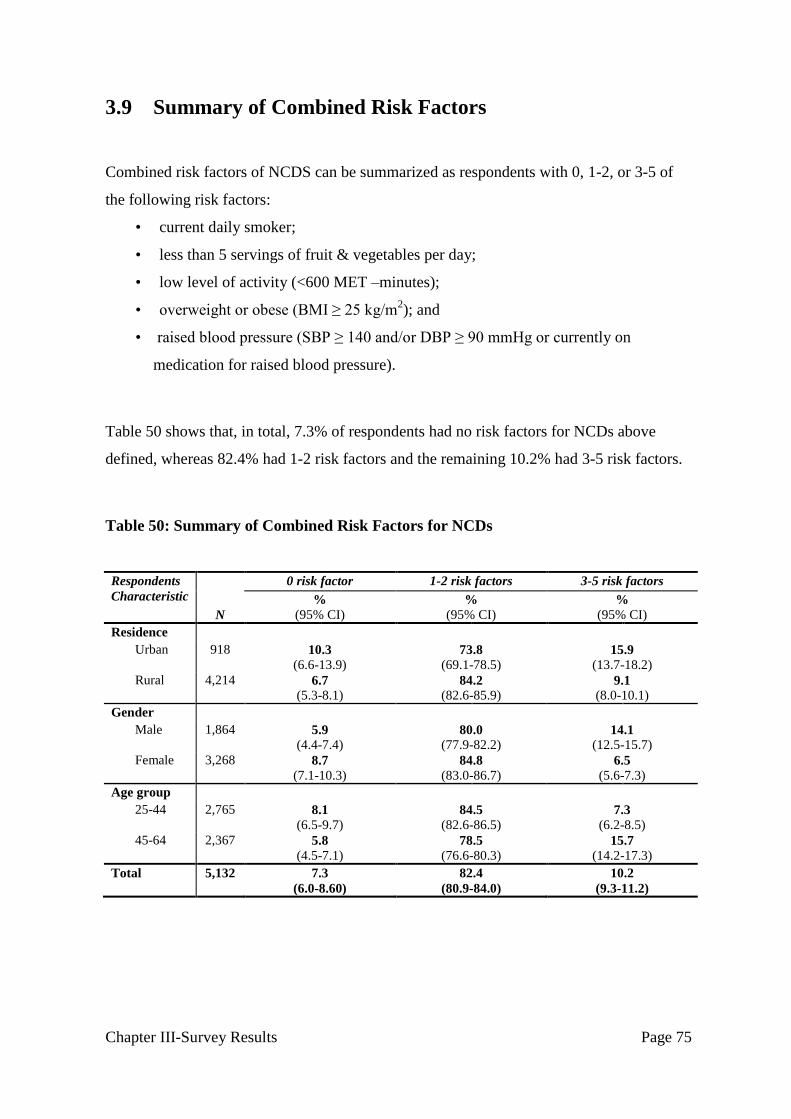
Chapter III-Survey Results Page 75
3.9 Summary of Combined Risk Factors
Combined risk factors of NCDS can be summarized as respondents with 0, 1-2, or 3-5 of
the following risk factors:
• current daily smoker;
• less than 5 servings of fruit & vegetables per day;
• low level of activity (<600 MET –minutes);
• overweight or obese (BMI ≥ 25 kg/m2); and
• raised blood pressure (SBP ≥ 140 and/or DBP ≥ 90 mmHg or currently on
medication for raised blood pressure).
Table 50 shows that, in total, 7.3% of respondents had no risk factors for NCDs above
defined, whereas 82.4% had 1-2 risk factors and the remaining 10.2% had 3-5 risk factors.
Table 50: Summary of Combined Risk Factors for NCDs
Respondents
Characteristic
N
0 risk factor 1-2 risk factors 3-5 risk factors
%
(95% CI) %
(95% CI) %
(95% CI)
Residence
Urban 918 10.3
(6.6-13.9) 73.8
(69.1-78.5) 15.9
(13.7-18.2)
Rural 4,214 6.7
(5.3-8.1) 84.2
(82.6-85.9) 9.1
(8.0-10.1)
Gender
Male 1,864 5.9
(4.4-7.4) 80.0
(77.9-82.2) 14.1
(12.5-15.7)
Female 3,268 8.7
(7.1-10.3) 84.8
(83.0-86.7) 6.5
(5.6-7.3)
Age group
25-44 2,765 8.1
(6.5-9.7) 84.5
(82.6-86.5) 7.3
(6.2-8.5)
45-64 2,367 5.8
(4.5-7.1) 78.5
(76.6-80.3) 15.7
(14.2-17.3)
Total 5,132 7.3
(6.0-8.60)
82.4
(80.9-84.0)
10.2
(9.3-11.2)
Chapter III-Survey Results Page 76
Table 50 also shows that, in terms of gender, men were less prevalent than women in having
1-2 risk factors (80.0 vs. 84.8%) but more prevalent than women in having 3-5 risk factors
(14.1vs. 6.5%).
With respect to residence, the urban respondents were less prevalent than rural respondents
in having 1-2 risk factors (73.8 vs. 84.2%) but more prevalent in having 3-5 risk factors
(15.9 vs. 9.1%).
In regards to age, respondents aged 25-44 were more prevalent than those aged 45-64 in
having 1-2 risk factors (84.5 vs. 78.5%) but less prevalent in having 3-5 risk factors (7.3 vs.
15.7%).
In summary, 9 in every 10 surveyed populations had one or more risk factors for NCDs. In
addition, male, urban, and aged respondents were more likely to have 3 or more risk factors
for NCDs than female, rural, and younger respondents respectively.

Chapter IV:
Discussion

Chapter IV-Discussion Page 78
This is the first nationwide representative survey using the WHO standardized protocol to
report the prevalence of NCD risk factors in Cambodia.
4.1 NCD Risk Factors
Diabetes and hypertension
The current survey found that the prevalence of raised fasting blood glucose or diabetes
was 2.9% for the total respondents, not significantly different between men and women (2.5
vs. 3.3%), twice higher in the urban than in rural areas (5.6 vs. 2.3%), and increased with
age. This prevalence of diabetes is by half lower than that found by a survey in 2004 in a
semi-urban (5.6 vs. 11.4%) and rural (2.3 vs. 4.8%) province of Cambodia (2). This
difference might be mainly due to the fact that, on one hand, the 2004 survey had the
sample population from 25 to 65 years and above, the prevalence of diabetes based on non-
fasting blood glucose, and only 4 villages were selected to represent rural and semi-urban
areas,. In the present survey, on the other hand, the sample population were limited to 25-64
years of age, blood samples were tested in the early morning by trained laboratory
technicians using Accutrend Plus instruments and solutions purchased by the WHO Geneva
in order to accurately measuring fasting blood glucose, 180 surveyed villages were stratified
and randomly selected from the recent sampling frame to represent the urban and rural areas
of the country, and data were properly weighted and analyzed by using the WHO STEPS
EpiInfo program.
In regards to blood pressure, the present survey found that 11.2% of the total population
had mild hypertension (SBP≥140 and/or DBP≥90mmHg), and this prevalence of
hypertension was higher in men than in women (12.8 vs. 9.6%), higher in the urban than in
rural areas (16.9 vs. 10.0%), and increasing with age. This prevalence hypertension is lower
than that reported 5 years ago by a survey in a semi-urban and rural province of Cambodia
where up to 25% and 11.7% of the surveyed population had raised blood pressure
respectively (2).

Chapter IV-Discussion Page 79
Behavioral risk factors for NCDs
The survey found that current (daily and non-daily) tobacco smoking was overall reported
by 3 in every10 respondents (29.4%); and this prevalence was almost 10 times higher in
men than in women (54.1 vs. 5.9%), 1.5 times higher in the rural area than in urban areas
(31.1 vs. 21.4%), and increased with age. The prevalence of tobacco smoking in the current
survey was higher than that in a country-wide survey in 2005-2006 where only 48% of men
and 3.6% of women smoked cigarettes (5-6).
Other behavioral risk factors of NCDs found in this survey included the high prevalence of
raised total blood cholesterol (1 in every 5 respondents), the low prevalence of fruit and
vegetable consumption (8 in every 10 respondents ate less than five servings of fruit and/or
vegetables on average per day); and the high prevalence of alcohol consumption (1 in
every 2 respondents were current drinkers, with men drink more often and much more than
women). These results have not been previously published in Cambodia. The high
prevalence of alcohol drinking found by the current survey might be partly resulted from
aggressive advertisements of beer and other alcohol products throughout the country in
recent decades.
Non-behavioral risk factors for NCDs
The proportion of the total respondents classified as overweight (BMI greater than or equal
to 25 kg/m2
and below 30 kg/m2) and obese (BMI greater than or equal to 30 kg/m
2) was
13.5% and 1.9% respectively. The proportion of overweight and/or obese population (BMI
greater than or equal to 25 kg/m2
) was twice in the urban area as compared to the rural area
(26.7 vs. 13.0%), and was 1.6 times higher in women than in men (19.0 vs. 11.6%).
The overall prevalence of overweight and/or obese in urban and rural Cambodia found in
the current survey is similar with that reported by a survey 6 years ago (2).

Chapter IV-Discussion Page 80
Combined risk factors for NCDs
Finally, the survey revealed that over 9 in every 10 surveyed populations had one or more
risk factors for NCDs and 1 in every 10 respondents had 3 -5 risk factors. The prevalence
of respondents with 3 or more risk factors for NCDs was twice higher in men than in
women (14.1 vs. 6.5%), also twice higher for ages 45-64 than for ages 25-44 (15.7 vs.
7.3%), and significantly higher in the urban area than in rural areas (15.9 vs. 9.1%). There
were no data available on these combined risk factors for NCDs from previous surveys in
Cambodia (2).
4.2 Strengths and Limitations
Some findings of this survey were subject to limitations seen in any interview surveys,
including recall bias, under-reporting and unwillingness to report; non-respondents; and
interviewers‟ bias (7). For instance, questions on alcohol and cigarette consumption were
likely to induce under reporting from some respondents, whereas the estimation of the
amount of physical activity, and of fruit and vegetable consumption might be over
reporting. In addition, the fact that the proportion of men enrolled in the survey was lower
than that of the parent population suggested that interviewers came across more eligible
women than men. However, the overall estimates had been appropriately adjusted with the
weighting that had been undertaken.
On the other hand, the use of the WHO STEPS standardized survey protocol, thorough
training of data collectors by the WHO consultant, the close supervision of the survey team
members during data collection, and the use of WHO STEPS programs for data analysis
taking into account the complex survey design, were all undertaken in order to minimize
biases and enhance the survey output quality. Furthermore, this survey used a sampling
design that allowed deriving representative estimates for the whole country as well as for
the urban and rural areas. Finally, the use of PDAs to enter responses ensured that
questionnaire skip patterns were followed correctly and that responses were entered and
edited for consistency at the time of the interview.

Chapter IV-Discussion Page 81
4.3 Conclusion
The Cambodian STEPS survey results provide valuable baseline information on the
prevalence of major NCD risk factors at the national level as well as at the urban and rural
levels of Cambodia. The survey reveals that the prevalence of diabetes and hypertension in
Cambodia are lower than that reported in previous surveys in Cambodia. Even though,
major risk factors for NCDs have been found to be alarmingly prevalent, including alcohol
consumption and tobacco use (especially among urban and male population), and
overweight among women and aging population.
4.4 Recommendations
1. Based on the survey findings, the MoH and relevant ministries should reinforced
existing measures and devise innovative policy and interventions to more effectively
tackle NCDs and their risk factors in the country, especially drinking and smoking
behavioral changes targeted on male and urban population.
2. The information from this survey shall be largely disseminated to all stakeholders
and the public through all channels of mass media in order to raise awareness on the
threat of NCDs and to promote healthy lifestyle.
3. The Cambodian STEPS survey should be repeated every 3-5 years in order to
provide valid and representative information for the MoH and development partners
to assess and enhance strategies and interventions aiming at preventing and
controlling NCDs in Cambodia.
4. Finally, it is also advisable that rooted causes of NCD risk behaviors be further
explored in order to address NCD issues most effectively.

Page 82
REFERENCES
1. Prentice AM. The emerging epidemic of obesity in developing countries. Int J
Epidemiol. 2006 Feb;35(1):93-9.
2. King H, Keuky L, Seng S, Khun T, Roglic G, Pinget M. Diabetes and associated
disorders in Cambodia: two epidemiological surveys. Lancet. 2005 Nov
5;366(9497):1633-9.
3. Rudatsikira EM, Knutsen SF, Job JS, Singh PN, Yel D, Montgomery SB, et al.
Exposure to environmental tobacco smoke in the nonsmoking population of
Cambodia. Am J Prev Med. 2008 Jan;34(1):69-73.
4. Singh PN, Yel D, Sin S, Khieng S, Lopez J, Job J, et al. Tobacco use among adults
in Cambodia: evidence for a tobacco epidemic among women. Bull World Health
Organ. 2009 Dec;87(12):905-12.
5. MoH. National Strategy for the Prevention and Control of Non-Communicable
Diseases. In: Department PM, editor.2007.
6. WHO. Reducing Risks,Promoting Healthy Life.The World Health Report2002 [cited
2010 July]: Available from: http://www.who.int/whr/2002/en/whr02_en.pdf.
7. United Nations. Household Sample Surveys in Developing and Transition
Countries. Studies in Methods. New York2005 [cited 2010 January 07]; Available
from: http://unstats.un.org/unsd/hhsurveys/pdf/Household_surveys.pdf.

APPENDICES
Data Collection Team
(Photo taken in front of the UHS-C before field data collection)
1. Sample size calculation
2. Selection of clusters
3. List of selected clusters
4. Questionnaires
5. Show cards
6. Participant Feedback Form (Step 2)
7. Participant Feedback Form (Step 3)
8. BMI Classification Chart
9. Weighting of data
10. Survey team
11. Data book
12. Fact Sheets
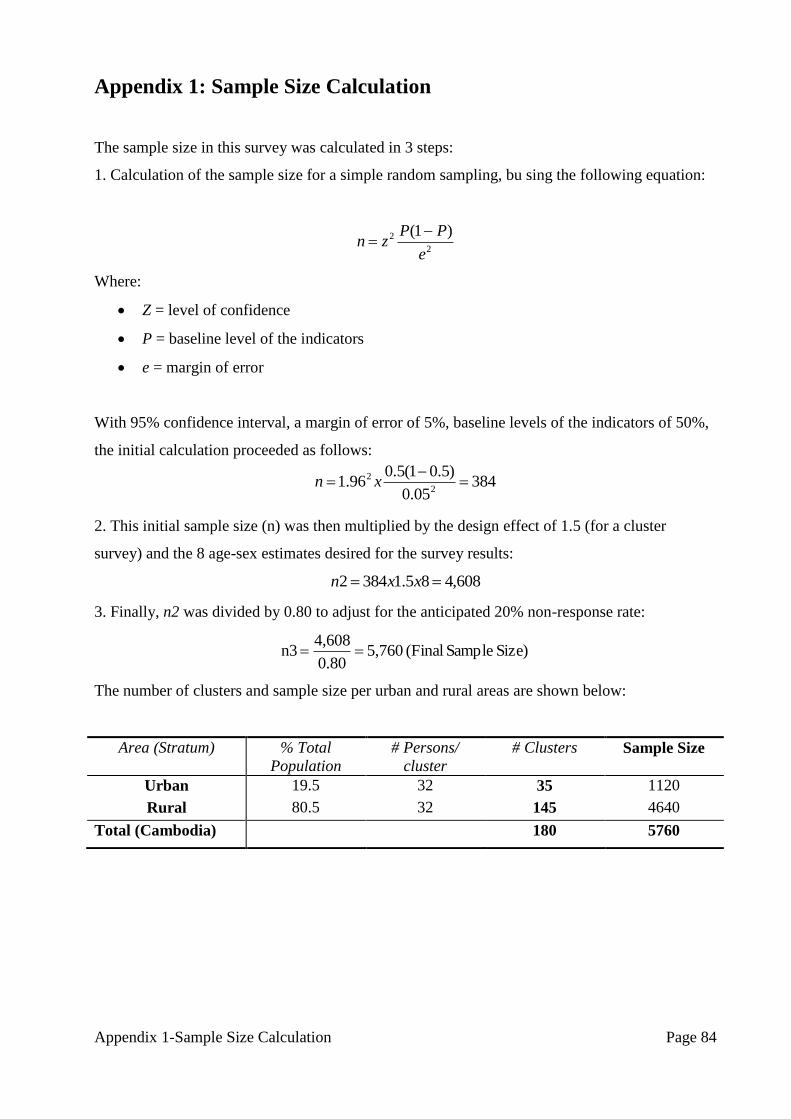
Appendix 1-Sample Size Calculation Page 84
Appendix 1: Sample Size Calculation
The sample size in this survey was calculated in 3 steps:
1. Calculation of the sample size for a simple random sampling, bu sing the following equation:
2
2 )1(
e
PPzn
Where:
Z = level of confidence
P = baseline level of the indicators
e = margin of error
With 95% confidence interval, a margin of error of 5%, baseline levels of the indicators of 50%,
the initial calculation proceeded as follows:
38405.0
)5.01(5.096.1
2
2
xn
2. This initial sample size (n) was then multiplied by the design effect of 1.5 (for a cluster
survey) and the 8 age-sex estimates desired for the survey results:
608,485.13842 xxn
3. Finally, n2 was divided by 0.80 to adjust for the anticipated 20% non-response rate:
Size) Sample (Final 5,7600.80
4,608n3
The number of clusters and sample size per urban and rural areas are shown below:
Area (Stratum) % Total
Population
# Persons/
cluster
# Clusters Sample Size
Urban 19.5 32 35 1120
Rural 80.5 32 145 4640
Total (Cambodia) 180 5760

Appendix 2-Selection of Clusters Page 85
Appendix 2: Selection of clusters
Multistage cluster sampling
The following steps were taken to select participants for the survey:
1- Primary Sampling Unit (PSU): Communes were the first selected clusters (PSU). These
PSU were numeration areas (EAs) from Cambodia Census Frame 2007 Final. The whole
population was divided in to 2 categories proportionate to their population size: rural
(81.3%) and urban (18.3%). The total selected communes were 90 out of 1621 (73
rural communes and 17 urban communes).
2- Secondary Sampling Unit (SSU): Villages were the second selected clusters. In each
selected commune (PSU) 2 villages were randomly selected by probability proportionate
to size. The total selected villages were 180 (146 rural villages and 34 urban villages).
Note: PSU and SSU were selected by using STEPS sampling.xls program provided by
WHO which helped automate the sampling process and provides weights for the dataset.
3- Tertiary Sampling Unit (TSU) or Elementary Unit (EU): Households were the third
selected clusters, separately within each selected SSU. 32 Households were selected in
each selected village by using Systematic Random Sampling.
4- The last stage was the selection of Participants. Only one participant of eligible persons
was selected within each household.
Note: A participant was selected within each household by using WHO Kish Method, a
method that allows the data collection team to randomly select participants from the
household (regardless of sampling method used) and provides proper documentation so
the sample can be weighted during data analysis.

Appendix 3–List of Selected Clusters Page 86
Appendix 3: List of selected clusters
Cluster
Number
Cluster Name STRATUM Commune
Name
District Name Province Name
001 Kbal Spean Urban Paoy Paet Ou Chrov Banteay
Meanchey
002 Ou Neang Urban Paoy Paet Ou Chrov Banteay
Meanchey
003 Banteay Neang Rural Banteay Neang Mongkol Borei Banteay
Meanchey
004 Ou Snguot Rural Banteay Neang Mongkol Borei Banteay
Meanchey
005 Kouk Kraol Rural Srah Chik Phnum Srok Banteay
Meanchey
006 Srah Chhuk
Khang Kaeut Rural Srah Chik Phnum Srok
Banteay
Meanchey
007 Soeng Tboung Rural Soengh Ou Chrov Banteay
Meanchey
008 Run Rural Soengh Ou Chrov Banteay
Meanchey
009 Ou Sampoar
Muoy Rural Ou Sampoar Malai
Banteay
Meanchey
010 Kbal Tumnob Rural Ou Sampoar Malai Banteay
Meanchey
011 Kaksekam Urban Ta Pung Thma Koul Battambang
012 Ang Tboung Urban Ta Pung Thma Koul Battambang
013 Preaek Moha
Tep Urban Svay Pao Bat Dambang Battambang
014 Mphey
Osakphea Urban Svay Pao Bat Dambang Battambang
015 Sla Slak Rural Anlong Run Thma Koul Battambang
016 Kruos Rural Anlong Run Thma Koul Battambang
017 Samraong Snao Rural Samraong
Knong Aek Phnum Battambang
018 Samraong Ta
Kok Rural
Samraong
Knong Aek Phnum Battambang

Appendix 3–List of Selected Clusters Page 87
Cluster
Number
Cluster Name STRATUM Commune
Name
District Name Province Name
019 Thmei Rural Prey Touch Moung Ruessei Battambang
020 Prey Damrei Rural Prey Touch Moung Ruessei Battambang
021 Kampong
Chlang Rural Vaot Ta Moem Sangkae Battambang
022 Sla Kram Rural Vaot Ta Moem Sangkae Battambang
023 Ou Anlok Rural Ta Saen Kamrieng Battambang
024 Ou Tuek Thla
(Trachakchetr) Rural Ta Saen Kamrieng Battambang
025 Slaboratory
Kdaong Urban Chob Tboung Khmum Kampong Cham
026 Phum Sounbuon
Sounpram Urban Chob Tboung Khmum Kampong Cham
027 Saray Rural Bos Khnaor Chamkar Leu Kampong Cham
028 Chranaom Rural Bos Khnaor Chamkar Leu Kampong Cham
029 Trapeang Sla Rural Sampong Chey Cheung Prey Kampong Cham
030 Sampong Chey Rural Sampong Chey Cheung Prey Kampong Cham
031 Kaoh Paen Kho Rural Kaoh Mitt Kampong Siem Kampong Cham
032 Kaoh Chas Rural Kaoh Mitt Kampong Siem Kampong Cham
033 Tuol Bei Rural Reay Pay Kang Meas Kampong Cham
034 Kok Krabei Rural Reay Pay Kang Meas Kampong Cham
035 Daeum Chrey Rural Krouch Chhmar Krouch Chhmar Kampong Cham
036 Khsach
Prachheh Leu Rural Krouch Chhmar Krouch Chhmar Kampong Cham
037 Masin Rural Rung Memot Kampong Cham
038 Chambak Rural Rung Memot Kampong Cham
039 Pouthi Proeks
Lech Rural Dountei Ponhea Kraek Kampong Cham
040 Kouk Neavea Rural Dountei Ponhea Kraek Kampong Cham
041 Trapeang Thum Rural Boeng Nay Prey Chhor Kampong Cham

Appendix 3–List of Selected Clusters Page 88
Cluster
Number
Cluster Name STRATUM Commune
Name
District Name Province Name
042 Chonloat Dai Rural Boeng Nay Prey Chhor Kampong Cham
043 Pram Yam Rural Pram Yam Srei Santhor Kampong Cham
044 Cheung Doek Rural Pram Yam Srei Santhor Kampong Cham
045 Boeng Daeng Rural Preak Kak Stueng Trang Kampong Cham
046 Andoung Svay Rural Preak Kak Stueng Trang Kampong Cham
047 Khlaong Rural Sralaboratory Tboung Khmum Kampong Cham
048 Andoung Pok Rural Sralaboratory Tboung Khmum Kampong Cham
049 Pralay
Measurement Rural Pralay Meas
Kampong
Leaeng
Kampong
Chhnang
050 Anlong
Kanhchoh Rural Pralay Meas
Kampong
Leaeng
Kampong
Chhnang
051 Srangam Ter Rural Prasneb Rolea B'ier Kampong
Chhnang
052 Chor Rural Prasneb Rolea B'ier Kampong
Chhnang
053 Trapeang Mlu Rural Krang Skear Tuek Phos Kampong
Chhnang
054 Krang Skear
Tboung Rural Krang Skear Tuek Phos
Kampong
Chhnang
055 Thlok Chheu
Teal Urban Sopoar Tep Chbar Mon Kampong Speu
056 Snao Ti Pir Urban Sopoar Tep Chbar Mon Kampong Speu
057 Lvea Rural Angk Popel Kong Pisei Kampong Speu
058 Kamnab Rural Angk Popel Kong Pisei Kampong Speu
059 Sdok Taol
Thmei Rural Chant Saen Odongk Kampong Speu
060 Chanteak Saen Rural Chant Saen Odongk Kampong Speu
061 Ou Lvea Rural Ou Phnum Sruoch Kampong Speu
062 Prey Sraong Rural Ou Phnum Sruoch Kampong Speu
063 Prey Kantrong Rural Thummoda Ar Samraong Tong Kampong Speu
064 Prey Kampok Rural Thummoda Ar Samraong Tong Kampong Speu
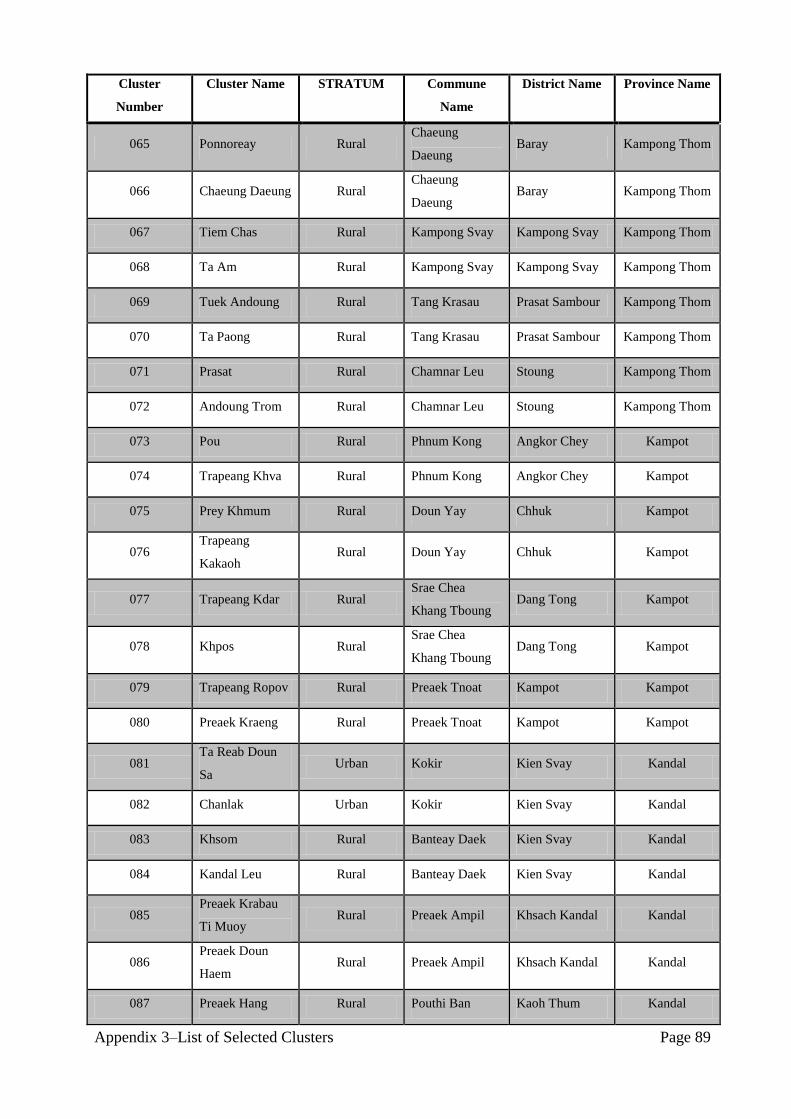
Appendix 3–List of Selected Clusters Page 89
Cluster
Number
Cluster Name STRATUM Commune
Name
District Name Province Name
065 Ponnoreay Rural Chaeung
Daeung Baray Kampong Thom
066 Chaeung Daeung Rural Chaeung
Daeung Baray Kampong Thom
067 Tiem Chas Rural Kampong Svay Kampong Svay Kampong Thom
068 Ta Am Rural Kampong Svay Kampong Svay Kampong Thom
069 Tuek Andoung Rural Tang Krasau Prasat Sambour Kampong Thom
070 Ta Paong Rural Tang Krasau Prasat Sambour Kampong Thom
071 Prasat Rural Chamnar Leu Stoung Kampong Thom
072 Andoung Trom Rural Chamnar Leu Stoung Kampong Thom
073 Pou Rural Phnum Kong Angkor Chey Kampot
074 Trapeang Khva Rural Phnum Kong Angkor Chey Kampot
075 Prey Khmum Rural Doun Yay Chhuk Kampot
076 Trapeang
Kakaoh Rural Doun Yay Chhuk Kampot
077 Trapeang Kdar Rural Srae Chea
Khang Tboung Dang Tong Kampot
078 Khpos Rural Srae Chea
Khang Tboung Dang Tong Kampot
079 Trapeang Ropov Rural Preaek Tnoat Kampot Kampot
080 Preaek Kraeng Rural Preaek Tnoat Kampot Kampot
081 Ta Reab Doun
Sa Urban Kokir Kien Svay Kandal
082 Chanlak Urban Kokir Kien Svay Kandal
083 Khsom Rural Banteay Daek Kien Svay Kandal
084 Kandal Leu Rural Banteay Daek Kien Svay Kandal
085 Preaek Krabau
Ti Muoy Rural Preaek Ampil Khsach Kandal Kandal
086 Preaek Doun
Haem Rural Preaek Ampil Khsach Kandal Kandal
087 Preaek Hang Rural Pouthi Ban Kaoh Thum Kandal

Appendix 3–List of Selected Clusters Page 90
Cluster
Number
Cluster Name STRATUM Commune
Name
District Name Province Name
088 Preaek Ta Doh Rural Pouthi Ban Kaoh Thum Kandal
089 Khnaor Kar Rural Barong Lvea Aem Kandal
090 Barong Rural Barong Lvea Aem Kandal
091 Doun Kok Rural Boeng Thum Angk Snuol Kandal
092 Prey Ta Kae Rural Boeng Thum Angk Snuol Kandal
093 Thommeak Trai Rural Phsar Daek Popnhea Lueu Kandal
094 Tuol Angkunh Rural Phsar Daek Popnhea Lueu Kandal
095 Setbou Rural Setbou S'ang Kandal
096 Kampong Pring Rural Setbou S'ang Kandal
097 Phum Ti Muoy Urban Smach Mean
Chey
Smach Mean
Chey Koh Kong
098 Phum Ti Bei Urban Smach Mean
Chey
Smach Mean
Chey Koh Kong
099 Chi Phat Rural Chi Phat Thma Bang Koh Kong
100 Kamlot Rural Chi Phat Thma Bang Koh Kong
101 Dei Doh Leu Rural Preaek Prasab Preaek Prasab Kratie
102 Preaek Prasab
Kraom Rural Preaek Prasab Preaek Prasab Kratie
103 Ou Buon Leu Rural Ou Buon Leu Kaoh Nheaek Mondul Kiri
104 Antreh Rural Ou Buon Leu Kaoh Nheaek Mondul Kiri
105 Phum 4 Urban Tuol Svay Prey
Ti Muoy Chamkar Mon Phnom Penh
106 Phum 7 Urban Tuol Svay Prey
Ti Muoy Chamkar Mon Phnom Penh
107 Phum 5 Urban Srah Chak Doun Penh Phnom Penh
108 Phum 13 Urban Srah Chak Doun Penh Phnom Penh
109 Phum 7 Urban Tuek L'ak Ti Pir Tuol Kouk Phnom Penh
110 Phum 13 Urban Tuek L'ak Ti Pir Tuol Kouk Phnom Penh
111 Phum Chrey Urban Chaom Chau Dangkao Phnom Penh
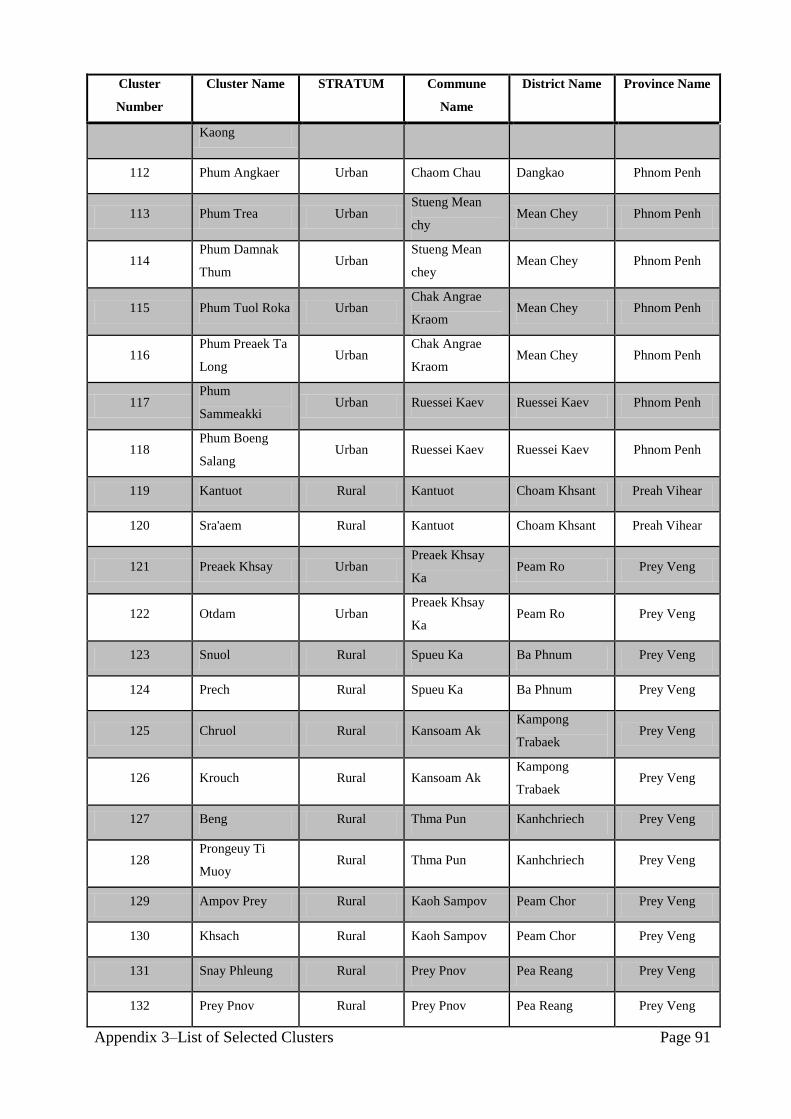
Appendix 3–List of Selected Clusters Page 91
Cluster
Number
Cluster Name STRATUM Commune
Name
District Name Province Name
Kaong
112 Phum Angkaer Urban Chaom Chau Dangkao Phnom Penh
113 Phum Trea Urban Stueng Mean
chy Mean Chey Phnom Penh
114 Phum Damnak
Thum Urban
Stueng Mean
chey Mean Chey Phnom Penh
115 Phum Tuol Roka Urban Chak Angrae
Kraom Mean Chey Phnom Penh
116 Phum Preaek Ta
Long Urban
Chak Angrae
Kraom Mean Chey Phnom Penh
117 Phum
Sammeakki Urban Ruessei Kaev Ruessei Kaev Phnom Penh
118 Phum Boeng
Salang Urban Ruessei Kaev Ruessei Kaev Phnom Penh
119 Kantuot Rural Kantuot Choam Khsant Preah Vihear
120 Sra'aem Rural Kantuot Choam Khsant Preah Vihear
121 Preaek Khsay Urban Preaek Khsay
Ka Peam Ro Prey Veng
122 Otdam Urban Preaek Khsay
Ka Peam Ro Prey Veng
123 Snuol Rural Spueu Ka Ba Phnum Prey Veng
124 Prech Rural Spueu Ka Ba Phnum Prey Veng
125 Chruol Rural Kansoam Ak Kampong
Trabaek Prey Veng
126 Krouch Rural Kansoam Ak Kampong
Trabaek Prey Veng
127 Beng Rural Thma Pun Kanhchriech Prey Veng
128 Prongeuy Ti
Muoy Rural Thma Pun Kanhchriech Prey Veng
129 Ampov Prey Rural Kaoh Sampov Peam Chor Prey Veng
130 Khsach Rural Kaoh Sampov Peam Chor Prey Veng
131 Snay Phleung Rural Prey Pnov Pea Reang Prey Veng
132 Prey Pnov Rural Prey Pnov Pea Reang Prey Veng

Appendix 3–List of Selected Clusters Page 92
Cluster
Number
Cluster Name STRATUM Commune
Name
District Name Province Name
133 Phot Rural Preah Sdach Preah Sdach Prey Veng
134 Ta Ket Rural Preah Sdach Preah Sdach Prey Veng
135 Baray Kaeut Rural Baray Kampong Leav Prey Veng
136 Baray Lech Rural Baray Kampong Leav Prey Veng
137 Cha Yov Rural Me Tuek Bakan Pursat
138 Kaoh Khsach Rural Me Tuek Bakan Pursat
139 Phsar Rural Anlong Tnot Krakor Pursat
140 Papet Rural Anlong Tnot Krakor Pursat
141 Dang Rung Rural Kaoh Chum Sampov Meas Pursat
142 Phteah Pring Rural Kaoh Chum Sampov Meas Pursat
143 Phnum Kok Lav Rural Phnum Kok Veun Sai Ratanak Kiri
144 Kalai Sapun Rural Phnum Kok Veun Sai Ratanak Kiri
145 Kantrak Urban Svay Dankum Siem Reab Siemreap
146 Vihear Chen Urban Svay Dankum Siem Reab Siemreap
147 Slaeng Rural Kampong Kdei Chi Kraeng Siemreap
148 Kampong Kdei
Pir Rural Kampong Kdei Chi Kraeng Siemreap
149 Kouk Kandal Rural Sasar Sdam Puok Siemreap
150 Damnak Slanh Rural Sasar Sdam Puok Siemreap
151 Kantreang Rural Kantreang Prasat Bakong Siemreap
152 Trapeang Thnal Rural Kantreang Prasat Bakong Siemreap
153 Boeng Ngat Rural Ta Yaek Soutr Nikom Siemreap
154 Paoy Smach Rural Ta Yaek Soutr Nikom Siemreap
155 Boeng Reang Rural Sameakki Prey Nob Sihanoukville
156 Preaek Kranh Rural Sameakki Prey Nob Sihanoukville
157 Preaek Urban Stueng Traeng Stueng Traeng Stung Treng
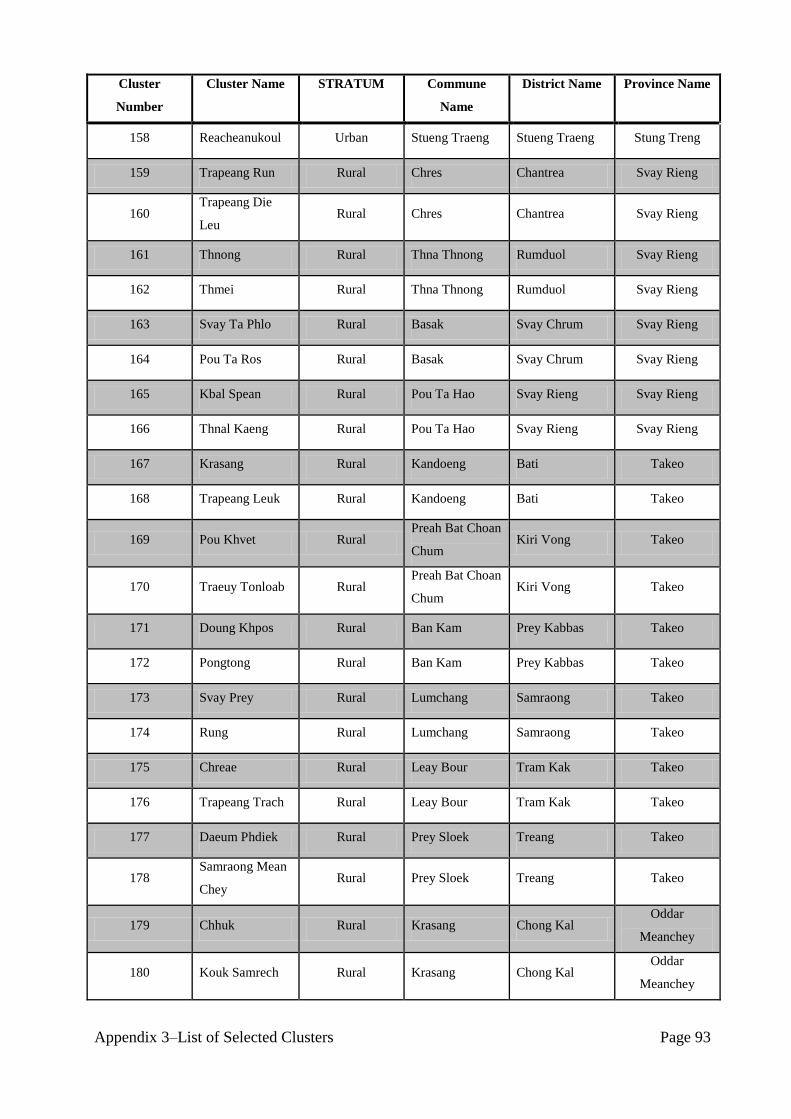
Appendix 3–List of Selected Clusters Page 93
Cluster
Number
Cluster Name STRATUM Commune
Name
District Name Province Name
158 Reacheanukoul Urban Stueng Traeng Stueng Traeng Stung Treng
159 Trapeang Run Rural Chres Chantrea Svay Rieng
160 Trapeang Die
Leu Rural Chres Chantrea Svay Rieng
161 Thnong Rural Thna Thnong Rumduol Svay Rieng
162 Thmei Rural Thna Thnong Rumduol Svay Rieng
163 Svay Ta Phlo Rural Basak Svay Chrum Svay Rieng
164 Pou Ta Ros Rural Basak Svay Chrum Svay Rieng
165 Kbal Spean Rural Pou Ta Hao Svay Rieng Svay Rieng
166 Thnal Kaeng Rural Pou Ta Hao Svay Rieng Svay Rieng
167 Krasang Rural Kandoeng Bati Takeo
168 Trapeang Leuk Rural Kandoeng Bati Takeo
169 Pou Khvet Rural Preah Bat Choan
Chum Kiri Vong Takeo
170 Traeuy Tonloab Rural Preah Bat Choan
Chum Kiri Vong Takeo
171 Doung Khpos Rural Ban Kam Prey Kabbas Takeo
172 Pongtong Rural Ban Kam Prey Kabbas Takeo
173 Svay Prey Rural Lumchang Samraong Takeo
174 Rung Rural Lumchang Samraong Takeo
175 Chreae Rural Leay Bour Tram Kak Takeo
176 Trapeang Trach Rural Leay Bour Tram Kak Takeo
177 Daeum Phdiek Rural Prey Sloek Treang Takeo
178 Samraong Mean
Chey Rural Prey Sloek Treang Takeo
179 Chhuk Rural Krasang Chong Kal Oddar
Meanchey
180 Kouk Samrech Rural Krasang Chong Kal Oddar
Meanchey
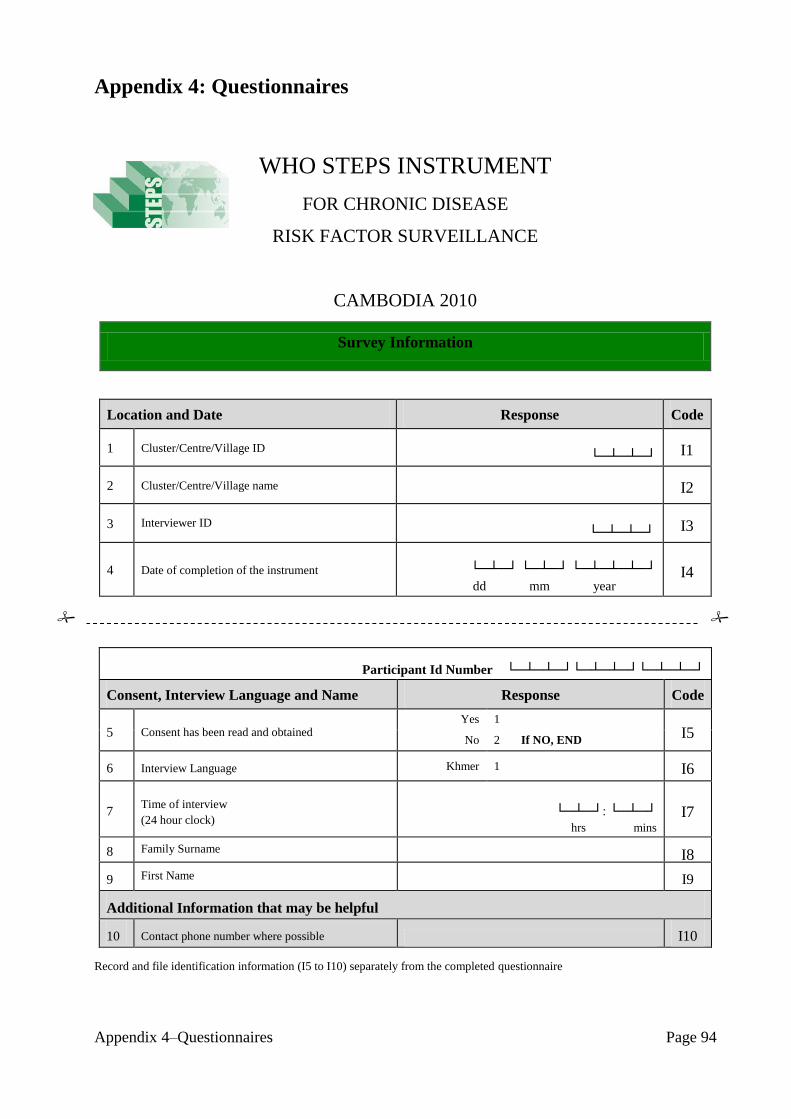
Appendix 4–Questionnaires Page 94
Appendix 4: Questionnaires
WHO STEPS INSTRUMENT
FOR CHRONIC DISEASE
RISK FACTOR SURVEILLANCE
CAMBODIA 2010
Survey Information
Location and Date Response Code
1 Cluster/Centre/Village ID
└─┴─┴─┘ I1
2 Cluster/Centre/Village name
I2
3 Interviewer ID
└─┴─┴─┘ I3
4 Date of completion of the instrument
└─┴─┘ └─┴─┘ └─┴─┴─┴─┘
dd mm year I4
Participant Id Number └─┴─┴─┘└─┴─┴─┘└─┴─┴─┘
Consent, Interview Language and Name Response Code
5 Consent has been read and obtained Yes 1
I5 No 2 If NO, END
6 Interview Language Khmer 1 I6
7 Time of interview
(24 hour clock)
└─┴─┘: └─┴─┘
hrs mins
I7
8 Family Surname I8
9 First Name I9
Additional Information that may be helpful
10 Contact phone number where possible I10
Record and file identification information (I5 to I10) separately from the completed questionnaire
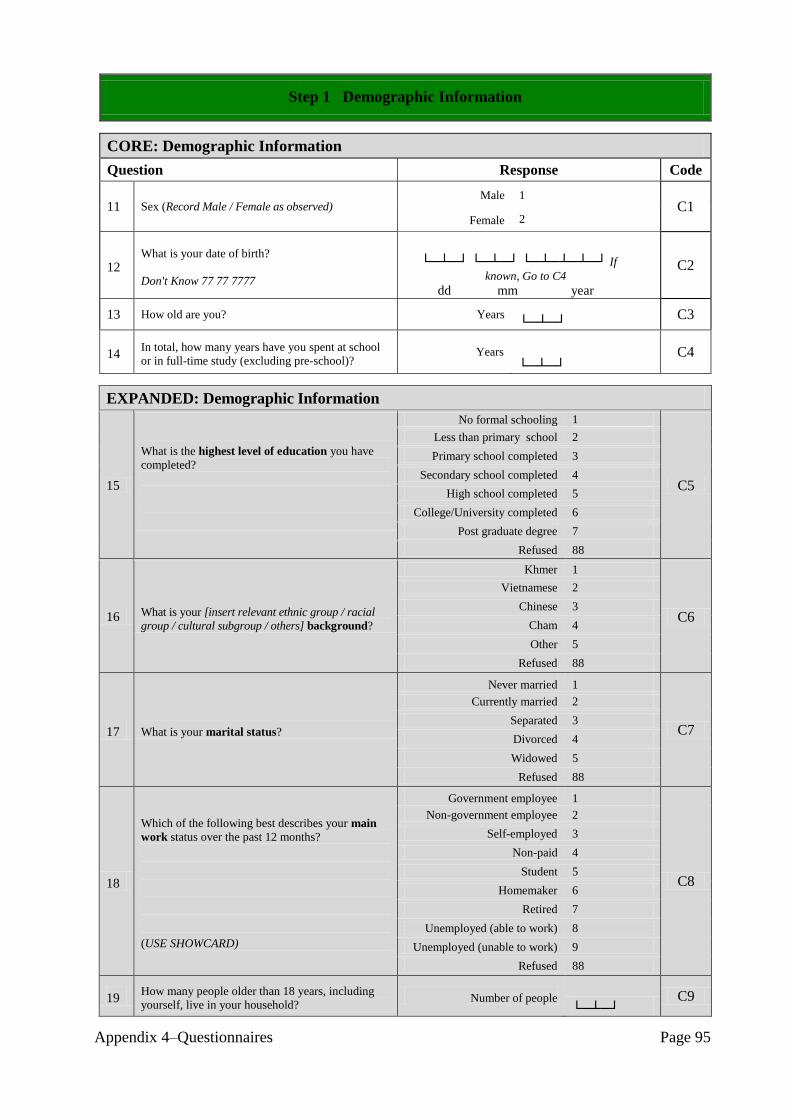
Appendix 4–Questionnaires Page 95
Step 1 Demographic Information
CORE: Demographic Information
Question Response Code
11 Sex (Record Male / Female as observed) Male 1
C1 Female 2
12 What is your date of birth?
Don't Know 77 77 7777
└─┴─┘ └─┴─┘ └─┴─┴─┴─┘ If
known, Go to C4 dd mm year
C2
13 How old are you? Years
└─┴─┘ C3
14 In total, how many years have you spent at school
or in full-time study (excluding pre-school)? Years
└─┴─┘ C4
EXPANDED: Demographic Information
15
What is the highest level of education you have
completed?
No formal schooling 1
C5
Less than primary school 2
Primary school completed 3
Secondary school completed 4
High school completed 5
College/University completed 6
Post graduate degree 7
Refused 88
16 What is your [insert relevant ethnic group / racial
group / cultural subgroup / others] background?
Khmer 1
C6
Vietnamese 2
Chinese 3
Cham 4
Other 5
Refused 88
17 What is your marital status?
Never married 1
C7
Currently married 2
Separated 3
Divorced 4
Widowed 5
Refused 88
18
Which of the following best describes your main
work status over the past 12 months?
(USE SHOWCARD)
Government employee 1
C8
Non-government employee 2
Self-employed 3
Non-paid 4
Student 5
Homemaker 6
Retired 7
Unemployed (able to work) 8
Unemployed (unable to work) 9
Refused 88
19 How many people older than 18 years, including
yourself, live in your household? Number of people
└─┴─┘ C9
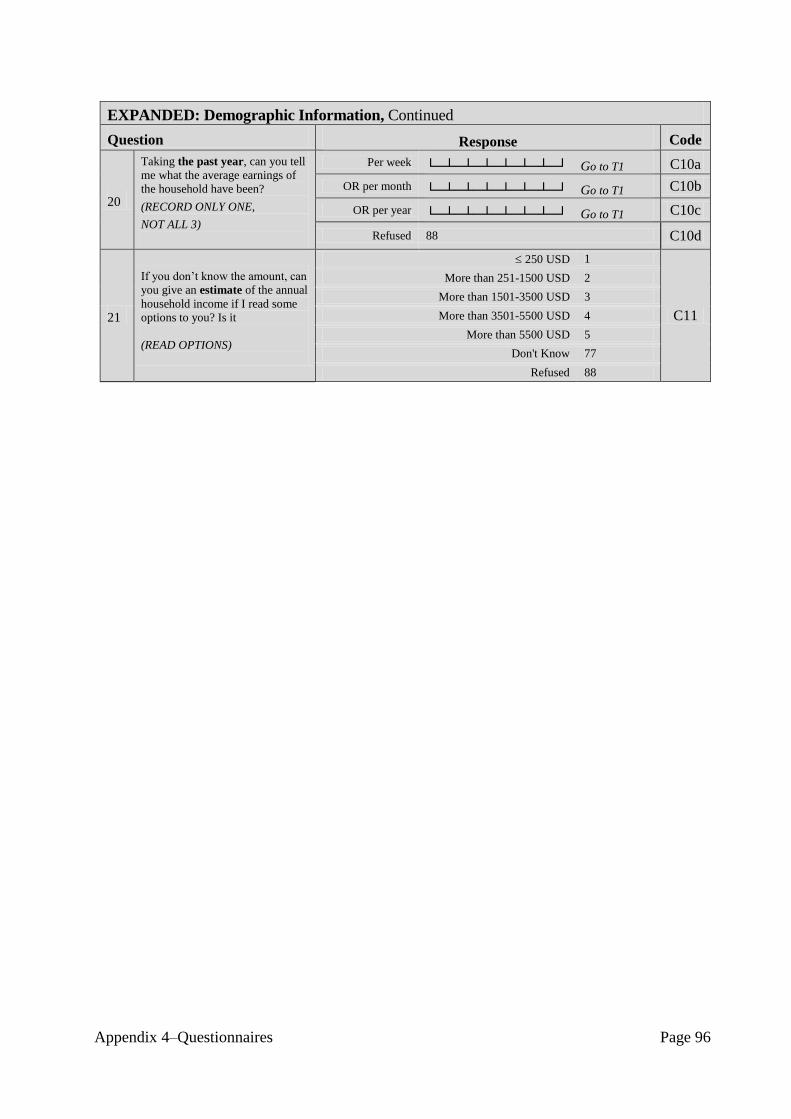
Appendix 4–Questionnaires Page 96
EXPANDED: Demographic Information, Continued
Question Response Code
20
Taking the past year, can you tell
me what the average earnings of
the household have been?
(RECORD ONLY ONE,
NOT ALL 3)
Per week └─┴─┴─┴─┴─┴─┴─┘ Go to T1 C10a
OR per month └─┴─┴─┴─┴─┴─┴─┘ Go to T1 C10b
OR per year └─┴─┴─┴─┴─┴─┴─┘ Go to T1 C10c
Refused 88 C10d
21
If you don‟t know the amount, can
you give an estimate of the annual
household income if I read some
options to you? Is it
(READ OPTIONS)
250 USD 1
C11
More than 251-1500 USD 2
More than 1501-3500 USD 3
More than 3501-5500 USD 4
More than 5500 USD 5
Don't Know 77
Refused 88

Appendix 4–Questionnaires Page 97
Step 1 Behavioural Measurements
CORE: Tobacco Use
Now I am going to ask you some questions about various health behaviours. This includes things like smoking,
drinking alcohol, eating fruit and vegetables and physical activity. Let's start with tobacco.
Question Response Code
22
Do you currently smoke any tobacco
products, such as cigarettes, cigars or
pipes? (USE SHOWCARD)
Yes 1
T1
No 2 If No, go to T6
23 Do you currently smoke tobacco products
daily?
Yes 1 T2
No 2 If No, go to T6
24 How old were you when you first started
smoking daily?
Age (years) └─┴─┘ If Known, go to
T5a
T3 Don‟t know 77
25
Do you remember how long ago it was?
(RECORD ONLY 1, NOT ALL 3)
Don’t know 77
In Years └─┴─┘ If Known, go to
T5a
T4a
OR in Months └─┴─┘ If Known, go to
T5a
T4b
OR in Weeks └─┴─┘ T4c
26
On average, how many of the following
do you smoke each day?
(RECORD FOR EACH TYPE, USE
SHOWCARD)
Don’t Know 77
Manufactured cigarettes └─┴─┘
T5a
Hand-rolled cigarettes └─┴─┘
T5b
Pipes full of tobacco └─┴─┘
T5c
Cigars, cheroots, cigarillos └─┴─┘
T5d
Other
If Other, go to
T5other,
└─┴─┘ else go to T9
T5e
Other (please specify): └─┴─┴─┴─┴─┴─┘
Go to T9
T5other

Appendix 4–Questionnaires Page 98
EXPANDED: Tobacco Use
Question Response Code
27 In the past, did you ever smoke daily? Yes 1
T6 No 2 If No, go to T9
28 How old were you when you stopped
smoking daily?
Age (years) └─┴─┘ If Known, go to
T9
T7
Don‟t Know 77
29
How long ago did you stop smoking
daily?
(RECORD ONLY 1, NOT ALL 3)
Don’t Know 77
Years ago └─┴─┘ If Known, go to
T9
T8a
OR Months ago └─┴─┘ If Known, go to
T9
T8b
OR Weeks ago └─┴─┘
T8c
30 Do you currently use any smokeless
tobacco such as [snuff, chewing tobacco,
betel]? (USE SHOWCARD)
Yes 1
T9 No 2 If No, go to T12
31 Do you currently use smokeless tobacco
products daily?
Yes 1 T10
No 2 If No, go to T12
32
On average, how many times a day do
you use ….
(RECORD FOR EACH TYPE, USE
SHOWCARD)
Don't Know 77
Snuff, by mouth └─┴─┘ T11a
Snuff, by nose └─┴─┘
T11b
Chewing tobacco └─┴─┘
T11c
Betel, quid └─┴─┘
T11d
Other
If Other, go to
T11other,
└─┴─┘ else go to T13
T11e
Other (specify) └─┴─┴─┴─┴─┴─┴─┘ Go
to T13
T11
other
33
In the past, did you ever use smokeless
tobacco such as [snuff, chewing tobacco,
or betel] daily?
Yes 1 T12
No 2
34
During the past 7 days, on how many days
did someone in your home smoke when
you were present?
Number of days
└─┴─┘ T13
Don't know 77
35
During the past 7 days, on how many days
did someone smoke in closed areas in
your workplace (in the building, in a
work area or a specific office) when you
were present?
Number of days
└─┴─┘
T14 Don't know or don't
work in a closed area 77

Appendix 4–Questionnaires Page 99
CORE: Alcohol Consumption
The next questions ask about the consumption of alcohol.
Question Response Code
36
Have you ever consumed an alcoholic
drink such as beer, wine, spirits, fermented
cider or [add other local examples]?
(USE SHOWCARD OR SHOW
EXAMPLES)
Yes 1
A1a
No 2 If No, go to D1
37 Have you consumed an alcoholic drink
within the past 12 months?
Yes 1 A1b
No 2 If No, go to D1
38
During the past 12 months, how
frequently have you had at least one
alcoholic drink?
(READ RESPONSES, USE SHOWCARD)
Daily 1
A2
5-6 days per week 2
1-4 days per week 3
1-3 days per month 4
Less than once a month 5
39 Have you consumed an alcoholic drink
within the past 30 days?
Yes 1 A3
No 2 If No, go to D1
40
During the past 30 days, on how many
occasions did you have at least one
alcoholic drink?
Number
Don't know 77 └─┴─┘
A4
41
During the past 30 days, when you drank
alcohol, on average, how many standard
alcoholic drinks did you have during one
drinking occasion?
(USE SHOWCARD)
Number
Don't know 77
└─┴─┘
A5
42
During the past 30 days, what was the
largest number of standard alcoholic
drinks you had on a single occasion,
counting all types of alcoholic drinks
together?
Largest number
Don't Know 77
└─┴─┘
A6
43
During the past 30 days, how many times
did you have
for men: five or more
for women: four or more
standard alcoholic drinks in a single
drinking occasion?
Number of times
Don't Know 77
└─┴─┘
A7
EXPANDED: Alcohol Consumption
44
During the past 30 days, when you
consumed an alcoholic drink, how often
was it with meals? Please do not count
snacks.
Usually with meals 1
A8 Sometimes with meals 2
Rarely with meals 3
Never with meals 4
45 During each of the past 7 days, how many Monday └─┴─┘ A9a

Appendix 4–Questionnaires Page 100
standard alcoholic drinks did you have
each day?
(USE SHOWCARD)
Don't Know 77
Tuesday └─┴─┘
A9b
Wednesday └─┴─┘
A9c
Thursday └─┴─┘
A9d
Friday └─┴─┘
A9e
Saturday └─┴─┘
A9f
Sunday └─┴─┘
A9g
CORE: Diet
The next questions ask about the fruit and vegetables that you usually eat. I have a nutrition card here that
shows you some examples of local fruit and vegetables. Each picture represents the size of a serving. As you
answer these questions please think of a typical week in the last year.
Question Response Code
46
In a typical week, on how many days do
you eat fruit?
(USE SHOWCARD)
Number of days
Don't Know 77
└─┴─┘ If Zero days, go
to D3
D1
47 How many servings of fruit do you eat on
one of those days? (USE SHOWCARD)
Number of servings
Don't Know 77 └─┴─┘ D2
48 In a typical week, on how many days do
you eat vegetables? (USE
SHOWCARD)
Number of days
Don't Know 77
└─┴─┘ If Zero days, go
to D5
D3
49 How many servings of vegetables do you
eat on one of those days? (USE
SHOWCARD)
Number of servings
Don‟t know 77 └─┴─┘ D4
50
What type of oil or fat is most often used
for meal preparation in your household?
(USE SHOWCARD)
(SELECT ONLY ONE)
Vegetable oil 1
D5
Lard or suet 2
Butter or ghee 3
Margarine 4
Other 5 If Other, go to D5 other
None in particular 6
None used 7
Don‟t know 77
Other
└─┴─┴─┴─┴─┴─┴─┘
D5
other
51
On average, how many meals per week do
you eat that were not prepared at a home?
By meal, I mean breakfast, lunch and
dinner.
Number
Don‟t know 77 └─┴─┘
D6

Appendix 4–Questionnaires Page 101
CORE: Physical Activity
Next I am going to ask you about the time you spend doing different types of physical activity in a typical
week. Please answer these questions even if you do not consider yourself to be a physically active person.
Think first about the time you spend doing work. Think of work as the things that you have to do such as paid
or unpaid work, study/training, household chores, harvesting food/crops, fishing or hunting for food, seeking
employment. [Insert other examples if needed]. In answering the following questions 'vigorous-intensity
activities' are activities that require hard physical effort and cause large increases in breathing or heart rate,
'moderate-intensity activities' are activities that require moderate physical effort and cause small increases in
breathing or heart rate.
Question Response Code
Work
52
Does your work involve vigorous-intensity
activity that causes large increases in
breathing or heart rate like [carrying or
lifting heavy loads, digging or construction
work] for at least 10 minutes
continuously?
[INSERT EXAMPLES] (USE
SHOWCARD)
Yes 1
P1
No 2 If No, go to P 4
53
In a typical week, on how many days do
you do vigorous-intensity activities as part
of your work?
Number of days
└─┘
P2
54
How much time do you spend doing
vigorous-intensity activities at work on a
typical day?
Hours : minutes └─┴─┘: └─┴─┘
hrs mins
P3
(a-b)
55
Does your work involve moderate-
intensity activity, that causes small
increases in breathing or heart rate such as
brisk walking [or carrying light loads] for
at least 10 minutes continuously?
(USE SHOWCARD)
Yes 1
P4
No 2 If No, go to P 7
56 In a typical week, on how many days do
you do moderate-intensity activities as part
of your work?
Number of days
└─┘
P5
57
How much time do you spend doing
moderate-intensity activities at work on a
typical day?
Hours : minutes └─┴─┘: └─┴─┘
hrs mins
P6
(a-b)
Travel to and from places
The next questions exclude the physical activities at work that you have already mentioned.
Now I would like to ask you about the usual way you travel to and from places. For example to work, for
shopping, to market, to place of worship. [Insert other examples if needed]
58
Do you walk or use a bicycle (pedal cycle)
for at least 10 minutes continuously to get
to and from places?
Yes 1
P7 No 2 If No, go to P 10

Appendix 4–Questionnaires Page 102
59 In a typical week, on how many days do
you walk or bicycle for at least 10 minutes
continuously to get to and from places?
Number of days └─┘
P8
60 How much time do you spend walking or
bicycling for travel on a typical day? Hours : minutes
└─┴─┘: └─┴─┘
hrs mins
P9
(a-b)
Recreational activities
The next questions exclude the work and transport activities that you have already mentioned.
Now I would like to ask you about sports, fitness and recreational activities (leisure), [Insert relevant terms].
61
Do you do any vigorous-intensity sports,
fitness or recreational (leisure) activities
that cause large increases in breathing or
heart rate like [running or football] for at
least 10 minutes continuously?
(USE SHOWCARD)
Yes 1
P10
No 2 If No, go to P 13
62
In a typical week, on how many days do
you do vigorous-intensity sports, fitness or
recreational (leisure) activities?
Number of days
└─┘
P11
63
How much time do you spend doing
vigorous-intensity sports, fitness or
recreational activities on a typical day?
Hours : minutes └─┴─┘: └─┴─┘
hrs mins
P12
(a-b)
64
Do you do any moderate-intensity sports,
fitness or recreational (leisure) activities
that cause a small increase in breathing or
heart rate such as brisk walking, [cycling,
swimming, volleyball] for at least 10
minutes continuously?
(USE SHOWCARD)
Yes 1
P13
No 2 If No, go to P16
65
In a typical week, on how many days do
you do moderate-intensity sports, fitness or
recreational (leisure) activities?
Number of days
└─┘
P14
66
How much time do you spend doing
moderate-intensity sports, fitness or
recreational (leisure) activities on a typical
day?
Hours : minutes
└─┴─┘: └─┴─┘
hrs mins
P15
(a-b)
EXPANDED: Physical Activity
Sedentary behavior
The following question is about sitting or reclining at work, at home, getting to and from places, or with friends
including time spent sitting at a desk, sitting with friends, traveling in car, bus, train, reading, playing cards or
watching television, but do not include time spent sleeping.
[INSERT EXAMPLES] (USE SHOWCARD)
67 How much time do you usually spend
sitting or reclining on a typical day? Hours : minutes
└─┴─┘: └─┴─┘
hrs mins
P16
(a-b)

Appendix 4–Questionnaires Page 103
CORE: History of Raised Blood Pressure
Question Response Code
68 Have you ever had your blood pressure
measured by a doctor or other health
worker?
Yes 1 H1
No 2 If No, go to H6
69 Have you ever been told by a doctor or
other health worker that you have raised
blood pressure or hypertension?
Yes 1 H2a
No 2 If No, go to H6
70 Have you been told in the past 12 months? Yes 1
H2b No 2
EXPANDED: History of Raised Blood Pressure
71
Are you currently receiving any of the following treatments/advice for high blood pressure prescribed by a doctor or
other health worker?
Drugs (medication) that you have taken in
the past two weeks
Yes 1 H3a
No 2
Advice to reduce salt intake Yes 1
H3b No 2
Advice or treatment to lose weight Yes 1
H3c No 2
Advice or treatment to stop smoking Yes 1
H3d No 2
Advice to start or do more exercise Yes 1
H3e No 2
72 Have you ever seen a traditional healer for
raised blood pressure or hypertension?
Yes 1 H4
No 2
73
Are you currently taking any herbal or
traditional remedy for your raised blood
pressure?
Yes 1
H5 No 2
CORE: History of Diabetes
Question Response Code
74 Have you ever had your blood sugar
measured by a doctor or other health
worker?
Yes 1 H6
No 2 If No, go to M1
75 Have you ever been told by a doctor or
other health worker that you have raised
blood sugar or diabetes?
Yes 1 H7a
No 2 If No, go to M1
76 Have you been told in the past 12 months? Yes 1
H7b No 2

Appendix 4–Questionnaires Page 104
EXPANDED: History of Diabetes
77
Are you currently receiving any of the following treatments/advice for diabetes prescribed by a doctor or other health
worker?
Insulin Yes 1
H8a No 2
Drugs (medication) that you have taken in
the past two weeks
Yes 1 H8b
No 2
Special prescribed diet Yes 1
H8c No 2
Advice or treatment to lose weight Yes 1
H8d No 2
Advice or treatment to stop smoking Yes 1
H8e No 2
Advice to start or do more exercise Yes 1
H8f No 2
78 Have you ever seen a traditional healer for
diabetes or raised blood sugar?
Yes 1 H9
No 2
79 Are you currently taking any herbal or
traditional remedy for your diabetes?
Yes 1 H10
No 2

Appendix 4–Questionnaires Page 105
Step 2 Physical Measurements
CORE: Height and Weight
Question Response Code
80 Interviewer ID └─┴─┴─┘ M1
81 Device IDs for height and weight
Height └─┴─┘ M2a
Weight └─┴─┘ M2b
82 Height in Centimetres (cm) └─┴─┴─┘. └─┘
M3
83 Weight
If too large for scale 666.6 in Kilograms (kg)
└─┴─┴─┘.└─┘ M4
84 For women: Are you pregnant? Yes 1 If Yes, go to M 8
M5 No 2
CORE: Waist
85 Device ID for waist
└─┴─┘ M6
86 Waist circumference in Centimetres (cm) └─┴─┴─┘.└─┘
M7
CORE: Blood Pressure
87 Interviewer ID └─┴─┴─┘ M8
88 Device ID for blood pressure
└─┴─┘ M9
89 Cuff size used
Small 1
M10 Medium 2
Large 3
90 Reading 1
Systolic ( mmHg) └─┴─┴─┘ M11a
Diastolic (mmHg) └─┴─┴─┘ M11b
91 Reading 2
Systolic ( mmHg) └─┴─┴─┘ M12a
Diastolic (mmHg) └─┴─┴─┘ M12b
92 Reading 3
Systolic ( mmHg) └─┴─┴─┘ M13a
Diastolic (mmHg) └─┴─┴─┘ M13b
93
During the past two weeks, have you been
treated for raised blood pressure with
drugs (medication) prescribed by a doctor
or other health worker?
Yes 1
M14 No 2
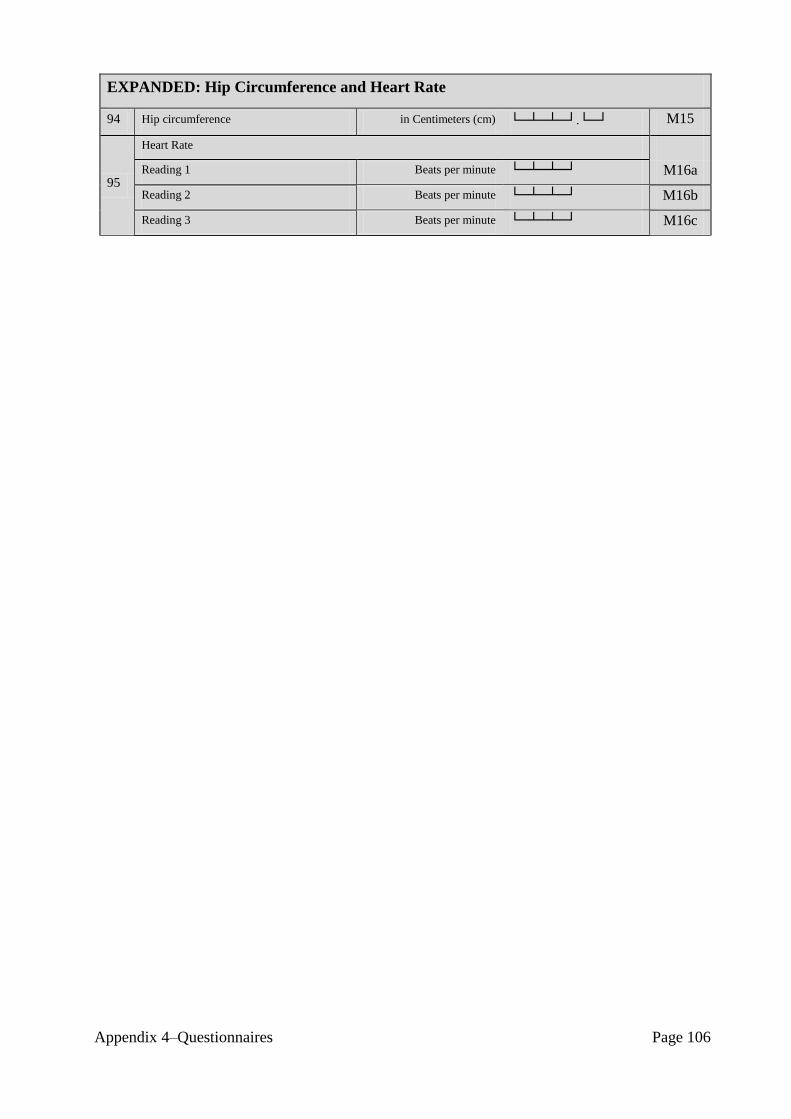
Appendix 4–Questionnaires Page 106
EXPANDED: Hip Circumference and Heart Rate
94 Hip circumference in Centimeters (cm) └─┴─┴─┘.└─┘ M15
95
Heart Rate
Reading 1 Beats per minute └─┴─┴─┘ M16a
Reading 2 Beats per minute └─┴─┴─┘ M16b
Reading 3 Beats per minute └─┴─┴─┘ M16c

Appendix 4–Questionnaires Page 107
Step 3 Biochemical Measurements
CORE: Blood Glucose
Question Response Code
96 During the past 12 hours have you had
anything to eat or drink, other than water?
Yes 1 B1
No 2
97 Technician ID └─┴─┴─┘ B2
98 Device ID └─┴─┘
B3
99 Time of day blood specimen taken (24
hour clock) Hours : minutes └─┴─┘: └─┴─┘
hrs mins
B4
100 Fasting blood glucose
Choose accordingly: mmol/l or mg/dl mg/dl └─┴─┴─┘.└─┘ B5
101
Today, have you taken insulin or other
drugs (medication) that have been
prescribed by a doctor or other health
worker for raised blood glucose?
Yes 1
B6 No 2
CORE: Blood Lipids
102 Device ID
└─┴─┘ B7
103 Total cholesterol
Choose accordingly: mmol/l or mg/dl mg/dl └─┴─┴─┘.└─┘ B8
104
During the past two weeks, have you been
treated for raised cholesterol with drugs
(medication) prescribed by a doctor or
other health worker?
Yes 1
B9 No 2
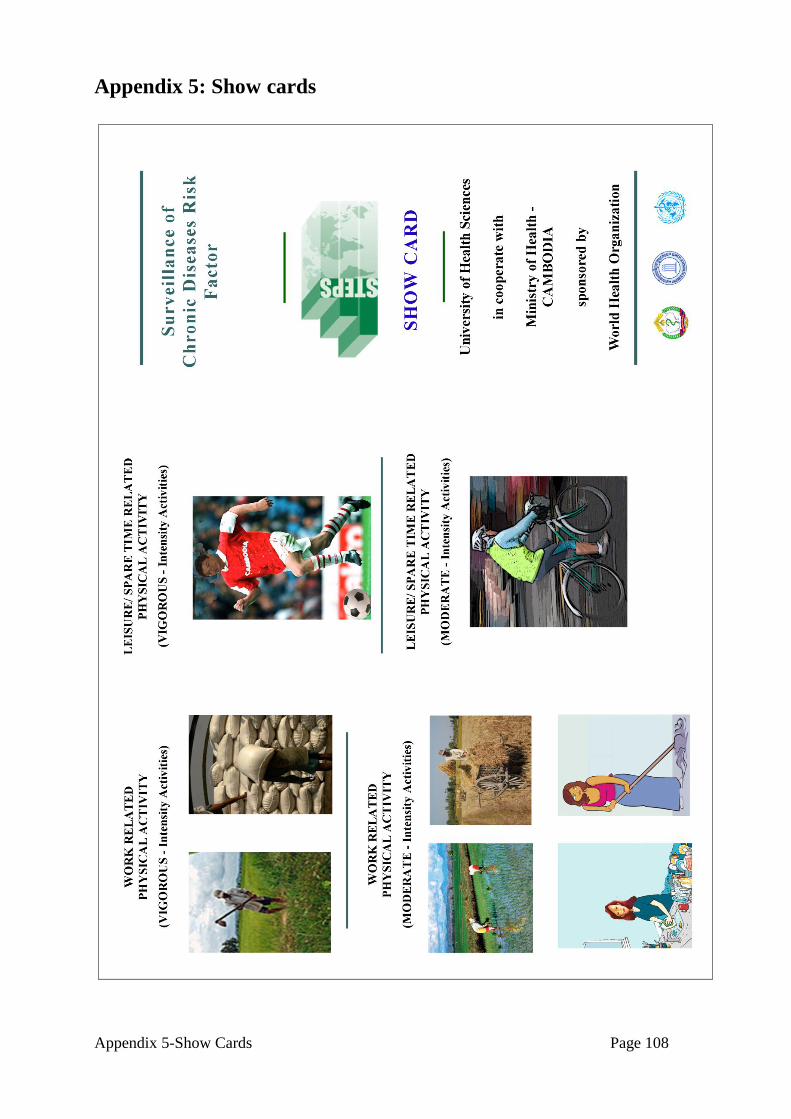
Appendix 5-Show Cards Page 108
Appendix 5: Show cards

Appendix 5-Show Cards Page 109
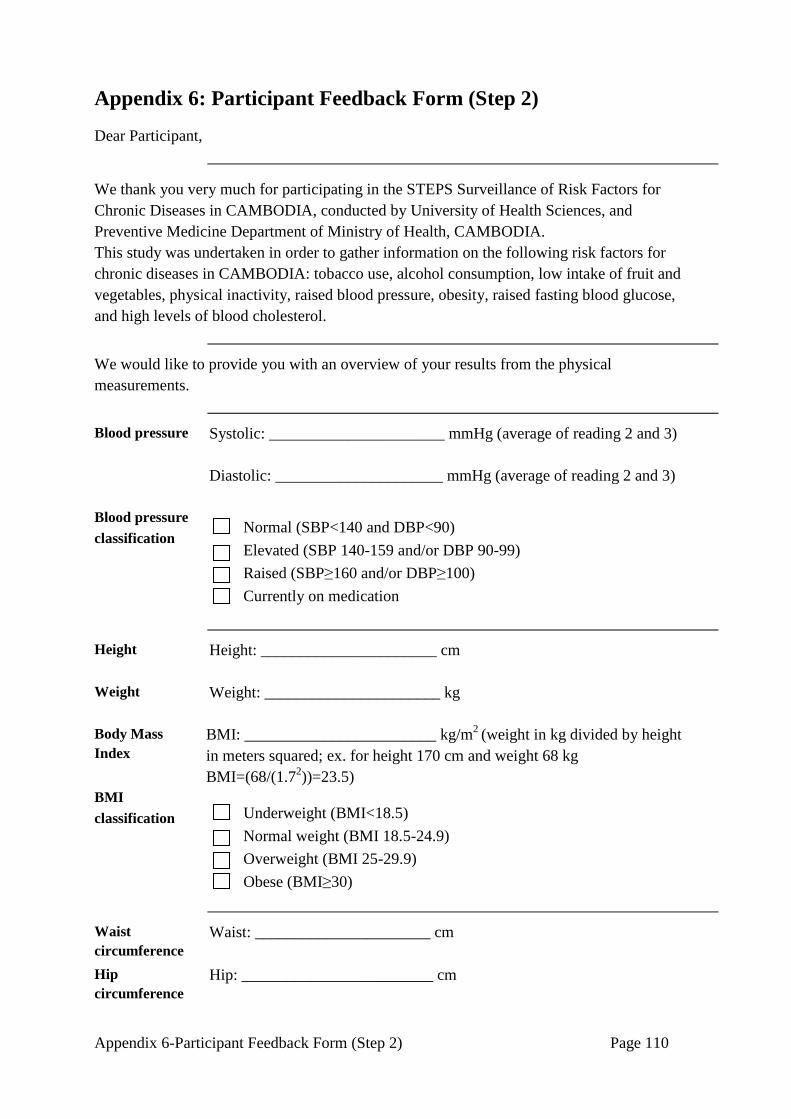
Appendix 6-Participant Feedback Form (Step 2) Page 110
Appendix 6: Participant Feedback Form (Step 2)
Dear Participant,
We thank you very much for participating in the STEPS Surveillance of Risk Factors for
Chronic Diseases in CAMBODIA, conducted by University of Health Sciences, and
Preventive Medicine Department of Ministry of Health, CAMBODIA.
This study was undertaken in order to gather information on the following risk factors for
chronic diseases in CAMBODIA: tobacco use, alcohol consumption, low intake of fruit and
vegetables, physical inactivity, raised blood pressure, obesity, raised fasting blood glucose,
and high levels of blood cholesterol.
We would like to provide you with an overview of your results from the physical
measurements.
Blood pressure
Systolic: ______________________ mmHg (average of reading 2 and 3)
Diastolic: _____________________ mmHg (average of reading 2 and 3)
Blood pressure
classification
Normal (SBP<140 and DBP<90)
Elevated (SBP 140-159 and/or DBP 90-99)
Raised (SBP≥160 and/or DBP≥100)
Currently on medication
Height Height: ______________________ cm
Weight Weight: ______________________ kg
Body Mass
Index
BMI: ________________________ kg/m2
(weight in kg divided by height
in meters squared; ex. for height 170 cm and weight 68 kg
BMI=(68/(1.72))=23.5)
BMI
classification
Underweight (BMI<18.5)
Normal weight (BMI 18.5-24.9)
Overweight (BMI 25-29.9)
Obese (BMI≥30)
Waist
circumference
Waist: ______________________ cm
Hip
circumference
Hip: ________________________ cm
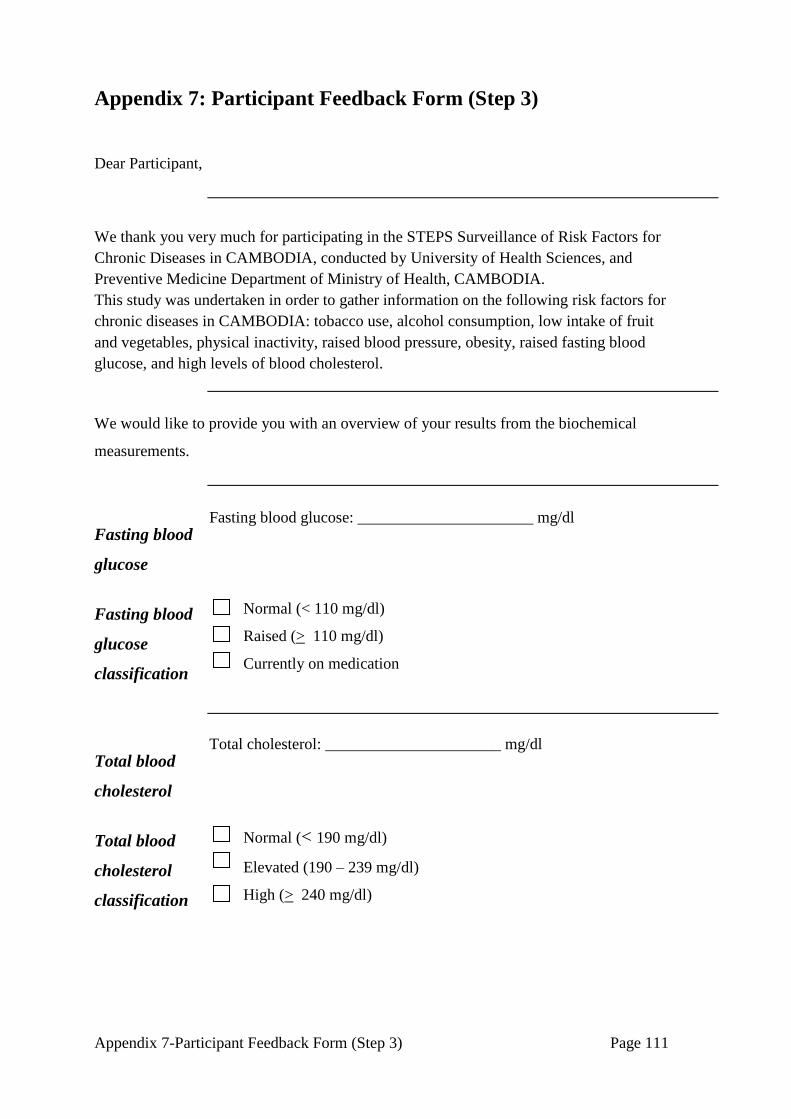
Appendix 7-Participant Feedback Form (Step 3) Page 111
Appendix 7: Participant Feedback Form (Step 3)
Dear Participant,
We thank you very much for participating in the STEPS Surveillance of Risk Factors for
Chronic Diseases in CAMBODIA, conducted by University of Health Sciences, and
Preventive Medicine Department of Ministry of Health, CAMBODIA.
This study was undertaken in order to gather information on the following risk factors for
chronic diseases in CAMBODIA: tobacco use, alcohol consumption, low intake of fruit
and vegetables, physical inactivity, raised blood pressure, obesity, raised fasting blood
glucose, and high levels of blood cholesterol.
We would like to provide you with an overview of your results from the biochemical
measurements.
Fasting blood
glucose
Fasting blood glucose: ______________________ mg/dl
Fasting blood
glucose
classification
Normal (< 110 mg/dl)
Raised (> 110 mg/dl)
Currently on medication
Total blood
cholesterol
Total cholesterol: ______________________ mg/dl
Total blood
cholesterol
classification
Normal (< 190 mg/dl)
Elevated (190 – 239 mg/dl)
High (> 240 mg/dl)

Appendix 8-BMI Classification Chart Page 112
Appendix 8: BMI Classification Chart
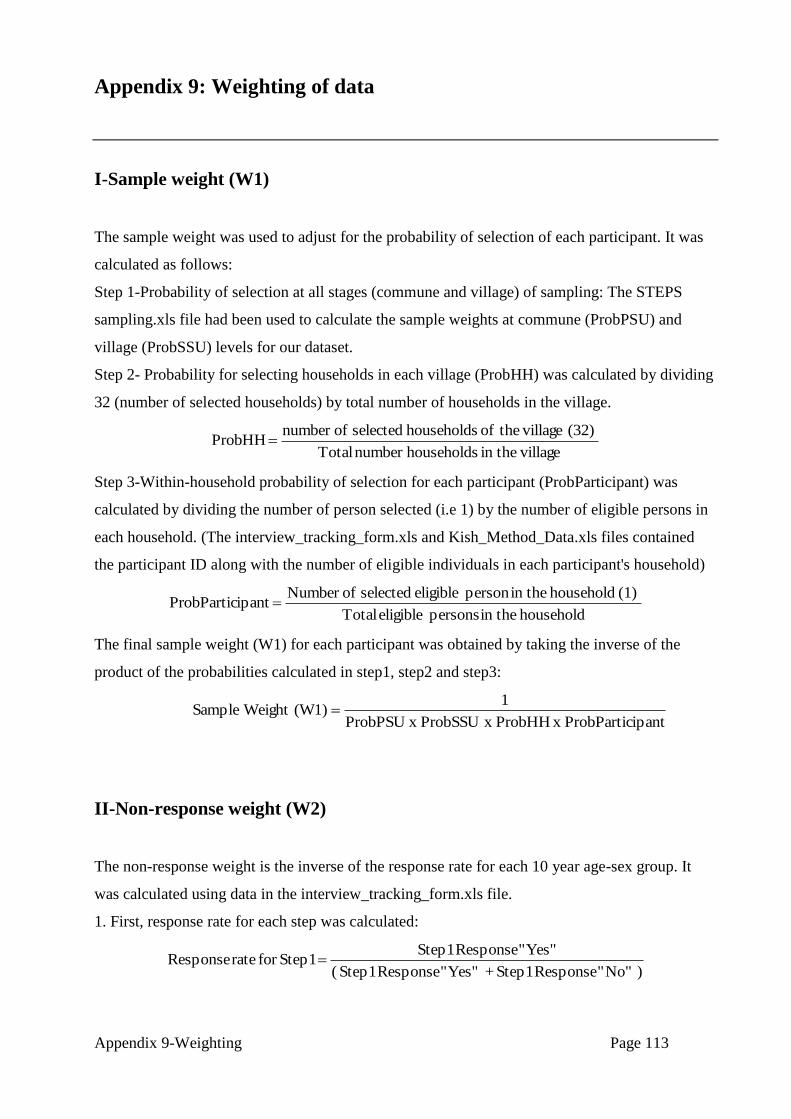
Appendix 9-Weighting Page 113
Appendix 9: Weighting of data
I-Sample weight (W1)
The sample weight was used to adjust for the probability of selection of each participant. It was
calculated as follows:
Step 1-Probability of selection at all stages (commune and village) of sampling: The STEPS
sampling.xls file had been used to calculate the sample weights at commune (ProbPSU) and
village (ProbSSU) levels for our dataset.
Step 2- Probability for selecting households in each village (ProbHH) was calculated by dividing
32 (number of selected households) by total number of households in the village.
villagein the householdsnumber Total
(32) village theof households selected ofnumber ProbHH
Step 3-Within-household probability of selection for each participant (ProbParticipant) was
calculated by dividing the number of person selected (i.e 1) by the number of eligible persons in
each household. (The interview_tracking_form.xls and Kish_Method_Data.xls files contained
the participant ID along with the number of eligible individuals in each participant's household)
household in the persons eligible Total
(1) household in theperson eligible selected ofNumber ipantProbPartic
The final sample weight (W1) for each participant was obtained by taking the inverse of the
product of the probabilities calculated in step1, step2 and step3:
ipantProbPartic x ProbHH x ProbSSU x ProbPSU
1(W1) Weight Sample
II-Non-response weight (W2)
The non-response weight is the inverse of the response rate for each 10 year age-sex group. It
was calculated using data in the interview_tracking_form.xls file.
1. First, response rate for each step was calculated:
) No"" Response Step1 + Yes"" Response Step1 (
Yes"" Response Step1Step1for rate Response

Appendix 9-Weighting Page 114
) No"" Response Step2 + Yes"" nseStep2Respo (
Yes"" nseStep2RespoStep2for rate Response
) No"" Response Step3 + Yes"" nseStep3Respo (
Yes"" nseStep3RespoStep3for rate Response
2. Then, the inverse response rate above to obtain W2s1, W2s2, and W2s3 was taken in order to
obtain the non-response weight for Step 1, 2, and 3, respectively.
III- Population weight (W3)
The population weight was used to correct for differences between the age-sex structure of our
sample and the age-sex structure of our target population. It was calculated as follows:
1-The proportion of the sample (SamProportion) comprised of each 10-year age-sex group was
calculated by dividing the total number of individuals in each 10-year age-sex group by the total
number of individuals in the sample;
2- The proportion of the target population (PopProportion) comprised of each 10-year age-sex
group was obtained by dividing the total number of individuals in each 10-year age-sex group by
the total number of individuals in target population; and
3- The final Population Weight (W3) was calculated by dividing the population and sample
proportion:
ionSamProport
ionPopProport) Weight(W3Population
IV- Overall weights
The overall weight for each Step of the survey (WStep1, WStep2 and WStep3) was obtained by
multiplying together the sample, non-response, and population weights:
WStep1=W1 x W2s1 x W3
WStep2=W1 x W2s2 x W3
WStep3=W1 x W2s2 x W3

Appendix 10-Team Members Page 115
Appendix 10: Team members
Technical Advisor
OUM Sophal, MD DrPH
Site Coordinator
PRAK Piseth Raingsey, MD MPH
Technical Team
KHUON Eng Mony, MD MPH MEY Vannareth, MD
THACH Vareun, MD AIM Sothea, MD
CHUN Loun, MD BOUNCHAN Yuttirong, MD
SOK Kong, MD MPH HOK Syrany, MD MPH
Data Collection Supervisors
THACH Vareun, MD MEY Vannareth, MD
CHUN Loun, MD BOUNCHAN Yuttirong, MD
SOK Kong, MD MPH AIM Sothea, MD
HOK Syrany, MD MPH LOUN Sathia, BITS, MBA
CIN Sovannara, BBA PEN Linda
Step 1: Interviewers (nurses and midwives)
CHEA Chamrong REN Chetra
CHON Sokra SENG Chenda
KHAN Titya PENH Setha
KHIN Sok San TEP Neary Neath
KIM Setha THAO Oudom
LONG Vongkot Borey THOL Sovannary
MAO Thyda UON Pholla
NGETH Raksmey VONG SreyRoth

Appendix 10-Team Members Page 116
Step 2 and 3:
Laboratory Technicians Midwives
EAN Rattanak TY Kim Houy
HEM Chan Vatanak SOK Chenda
KRY Makara MAK Dila
LORN Meng Eang SAM Sovuthy
Data Management
MEY Vannareth, MD BOUNCHAN Yuttirong, MD
AIM Sothea, MD LOUN Sathia, BITS MBA
CIN Sovnnara, BBA PEN Linda
Administrative staff
KHIEV Moly, MD MAN Manith, BMIS MsIT
Appendix 11-Data Book Page 117
Appendix 11: Data Book for Cambodia (whole country)
Table of Contents
Sampling and Response Proportions ............................................................................... 118
Demographic Information Results .................................................................................. 118
Tobacco Use .................................................................................................................... 123
Alcohol Consumption ..................................................................................................... 131
Fruit and Vegetable Consumption ................................................................................... 139
Physical Activity ............................................................................................................. 143
Blood Pressure and Diabetes History .............................................................................. 150
Physical Measurements ................................................................................................... 157
Biochemical Measurements ............................................................................................ 163
Summary of Combined Risk Factors .............................................................................. 166

Appendix 11-Data Book Page 118
Sampling and Response Proportions
Response proportions
Description: Summary results for overall response proportions.
Response proportions
Age Group
(years)
Men Women Both Sexes
Eligible Responded Eligible Responded Eligible Responded
n n % n n % n n %
25-34 591 544 92.0 941 910 96.7 1532 1454 94.9
35-44 566 535 94.5 983 966 98.3 1549 1501 96.9
45-54 529 496 93.8 976 958 98.2 1505 1454 96.6
55-64 378 362 95.8 679 662 97.5 1057 1024 96.9
25-64 2064 1937 93.8 3579 3496 97.7 5643 5433 96.3
Step 3 response proportions
Description: Summary results for the response proportions for Step 3 for countries that have done Step 3 with a sub-
set of the sample.
Response proportions for Step 3
Age Group
(years)
Men Women Both Sexes
Eligible Responded Eligible Responded Eligible Responded
n n % n n %
n n %
25-34 591 510 86.3 941 860 91.4 1532 1370 89.4
35-44 566 509 89.9 983 947 96.3 1549 1456 94.0
45-54 529 478 90.4 976 934 95.7 1505 1412 93.8
55-64 378 354 93.7 679 641 94.4 1057 995 94.1
25-64 2064 1851 89.7 3579 3382 94.5 5643 5,233 92.7
Demographic Information Results
Age group by sex
Description: Summary information by age group and sex of the respondents.
Instrument question: What is your date of birth?
Age group and sex of respondents
Age Group
(years)
Men Women Both Sexes
n % n % n %
25-34 544 28.1 910 26.0 1454 26.8
35-44 535 27.6 966 27.6 1501 27.6
45-54 496 25.6 958 27.4 1454 26.8
55-64 362 18.7 662 18.9 1024 18.8
25-64 1937 100.0 3496 100.0 5433 100.0

Appendix 11-Data Book Page 119
Education
Description: Mean number of years of education among respondents.
Instrument question: In total, how many years have you spent at school or in full-time study (excluding pre-school)?
Mean number of years of education
Age Group
(years)
Men Women Both Sexes
n Mean n Mean n Mean
25-34 544 5.9 910 4.3 1454 4.9
35-44 534 5.8 966 3.9 1500 4.5
45-54 496 4.2 958 2.4 1454 3.0
55-64 362 4.8 660 2.4 1022 3.3
25-64 1936 5.2 3494 3.3 5430 4.0
Highest level of education
Age
Group
(years)
Men
n
% No
formal
schooling
% Less
than
primary
school
% Primary
school
completed
%
Secondary
school
completed
% High
school
completed
% College/
University
completed
% Post
graduate
degree
completed
25-34 544 15.1 34.6 24.8 14.5 8.5 2.2 0.4
35-44 534 14.4 32.8 27.2 16.1 6.7 2.4 0.4
45-54 496 20.4 45.6 20.4 10.5 2.0 0.6 0.6
55-64 362 17.1 42.0 24.3 10.8 5.0 0.8 0.0
25-64 1936 16.6 38.3 24.2 13.2 5.7 1.6 0.4
Highest level of education
Age
Group
(years)
Women
n
% No
formal
schooling
% Less
than
primary
school
% Primary
school
completed
%
Secondary
school
completed
% High
school
completed
% College/
University
completed
% Post
graduate
degree
completed
25-34 910 24.7 43.7 19.6 7.0 4.4 0.5 0.0
35-44 966 24.0 47.8 17.4 9.1 1.2 0.4 0.0
45-54 958 42.2 45.6 7.9 3.5 0.6 0.1 0.0
55-64 662 45.6 40.5 8.8 3.6 1.5 0.0 0.0
25-64 3496 33.3 44.8 13.7 6.0 1.9 0.3 0.0
Highest level of education
Age
Group
(years)
Both Sexes
n
% No
formal
schooling
% Less
than
primary
school
% Primary
school
completed
%
Secondary
school
completed
% High
school
completed
% College/
University
completed
% Post
graduate
degree
completed
25-34 1454 21.1 40.3 21.5 9.8 5.9 1.2 0.1
35-44 1500 20.6 42.5 20.9 11.6 3.2 1.1 0.1
45-54 1454 34.7 45.6 12.2 5.9 1.1 0.3 0.2
55-64 1024 35.5 41.0 14.3 6.2 2.7 0.3 0.0
25-64 5432 27.3 42.5 17.5 8.6 3.3 0.8 0.1
Highest level of education
Description: Highest level of education achieved by the survey respondents.
Instrument question: What is the highest level of education you have completed?

Appendix 11-Data Book Page 120
Ethnicity
Description: Summary results for the ethnicity of the respondents.
Instrument question: What is your ethnic group?
Ethnic group of respondents
Age Group
(years)
Both Sexes
n %
Khmer
%
Vietnamese
%
Chinese
%
Charm
%
Other
25-34 1454 98.0 0.3 0.0 0.1 1.7
35-44 1501 99.1 0.1 0.0 0.1 0.8
45-54 1454 99.2 0.3 0.1 0.0 0.3
55-64 1024 98.8 0.3 0.3 0.3 0.3
25-64 5433 98.8 0.2 0.1 0.1 0.8
Marital status
Description: Marital status of survey respondents.
Instrument question: What is your marital status?
Marital status
Age
Group
(years)
Men
n % Never
married
% Currently
married % Separated % Divorced % Widowed
25-34 544 12.1 83.3 3.5 0.6 0.6
35-44 535 0.9 95.3 1.1 0.4 2.2
45-54 496 1.0 92.1 3.2 0.6 3.0
55-64 362 0.0 91.2 1.9 0.3 6.6
25-64 1937 3.9 90.3 2.5 0.5 2.8
Marital status
Age
Group
(years)
Women
n % Never
married
% Currently
married % Separated % Divorced % Widowed
25-34 910 9.5 75.4 8.7 2.5 4.0
35-44 966 5.4 70.1 10.2 3.1 11.2
45-54 958 3.8 65.7 5.9 3.5 21.0
55-64 662 3.5 49.8 3.5 2.4 40.8
25-64 3495 5.6 66.4 7.4 2.9 17.6
Marital status
Age
Group
(years)
Both Sexes
n % Never
married
% Currently
married % Separated % Divorced % Widowed
25-34 1454 10.5 78.3 6.7 1.8 2.7
35-44 1501 3.8 79.1 7.0 2.1 8.0
45-54 1454 2.8 74.7 5.0 2.5 14.9
55-64 1024 2.2 64.5 2.9 1.7 28.7
25-64 5432 5.0 75.0 5.6 2.1 12.3

Appendix 11-Data Book Page 121
Employment status
Description: Proportion of respondents in paid employment and those who are unpaid.
Instrument question: Which of the following best describes your main work status over the past 12 months?
Employment status
Age Group
(years)
Men
n
%
Government
employee
% Non-
government
employee
% Self-
employed % Unpaid
25-34 544 5.1 5.1 87.5 2.2
35-44 535 11.2 3.2 84.7 0.9
45-54 496 11.7 3.4 81.7 3.2
55-64 362 11.3 1.4 77.1 10.2
25-64 1937 9.7 3.5 83.3 3.6
Employment status
Age Group
(years)
Women
n
%
Government
employee
% Non-
government
employee
% Self-
employed % Unpaid
25-34 910 2.3 1.5 76.6 19.6
35-44 966 3.6 1.4 82.6 12.3
45-54 958 1.9 0.7 83.6 13.8
55-64 662 1.2 0.3 73.1 25.4
25-64 3496 2.3 1.1 79.5 17.1
Employment status
Age Group
(years)
Both Sexes
n
%
Government
employee
% Non-
government
employee
% Self-
employed % Unpaid
25-34 1454 3.4 2.9 80.7 13.1
35-44 1501 6.3 2.1 83.3 8.3
45-54 1454 5.2 1.7 82.9 10.2
55-64 1024 4.8 0.7 74.5 20.0
25-64 5433 5.0 1.9 80.9 12.3
Unpaid work and unemployed
Description: Proportion of respondents in unpaid work.
Instrument question: Which of the following best describes your main work status over the past 12 months?
Unpaid work and unemployed
Age
Group
(years)
Men
n % Non-paid % Student % Home-
maker % Retired
Unemployed
% Able to
work
% Not able to
work
25-34 12 0.0 50.0 0.0 0.0 41.7 8.3
35-44 5 20.0 0.0 0.0 0.0 60.0 20.0
45-54 16 12.5 0.0 6.3 6.3 43.8 31.3
55-64 37 2.7 0.0 0.0 64.9 13.5 18.9
25-64 70 5.7 8.6 1.4 35.7 28.6 20.0
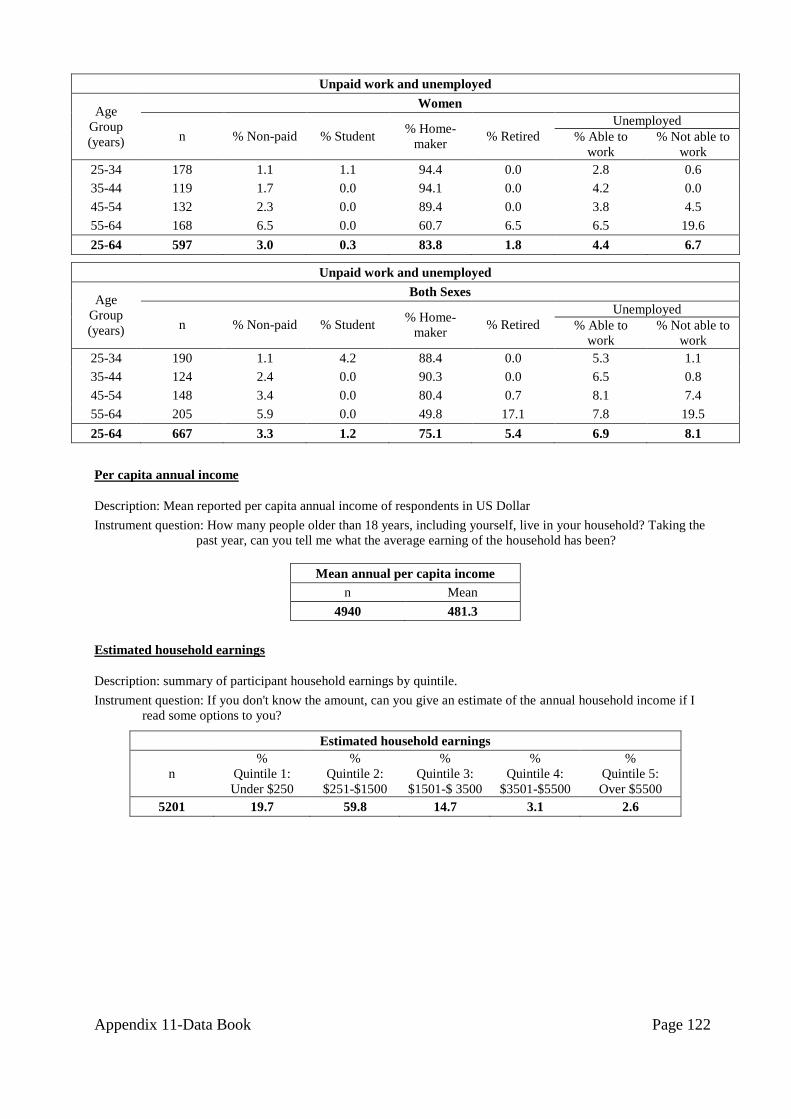
Appendix 11-Data Book Page 122
Unpaid work and unemployed
Age
Group
(years)
Women
n % Non-paid % Student % Home-
maker % Retired
Unemployed
% Able to
work
% Not able to
work
25-34 178 1.1 1.1 94.4 0.0 2.8 0.6
35-44 119 1.7 0.0 94.1 0.0 4.2 0.0
45-54 132 2.3 0.0 89.4 0.0 3.8 4.5
55-64 168 6.5 0.0 60.7 6.5 6.5 19.6
25-64 597 3.0 0.3 83.8 1.8 4.4 6.7
Unpaid work and unemployed
Age
Group
(years)
Both Sexes
n % Non-paid % Student % Home-
maker % Retired
Unemployed
% Able to
work
% Not able to
work
25-34 190 1.1 4.2 88.4 0.0 5.3 1.1
35-44 124 2.4 0.0 90.3 0.0 6.5 0.8
45-54 148 3.4 0.0 80.4 0.7 8.1 7.4
55-64 205 5.9 0.0 49.8 17.1 7.8 19.5
25-64 667 3.3 1.2 75.1 5.4 6.9 8.1
Per capita annual income
Description: Mean reported per capita annual income of respondents in US Dollar
Instrument question: How many people older than 18 years, including yourself, live in your household? Taking the
past year, can you tell me what the average earning of the household has been?
Mean annual per capita income
n Mean
4940 481.3
Estimated household earnings
n
%
Quintile 1:
Under $250
%
Quintile 2:
$251-$1500
%
Quintile 3:
$1501-$ 3500
%
Quintile 4:
$3501-$5500
%
Quintile 5:
Over $5500
5201 19.7 59.8 14.7 3.1 2.6
Estimated household earnings
Description: summary of participant household earnings by quintile.
Instrument question: If you don't know the amount, can you give an estimate of the annual household income if I
read some options to you?
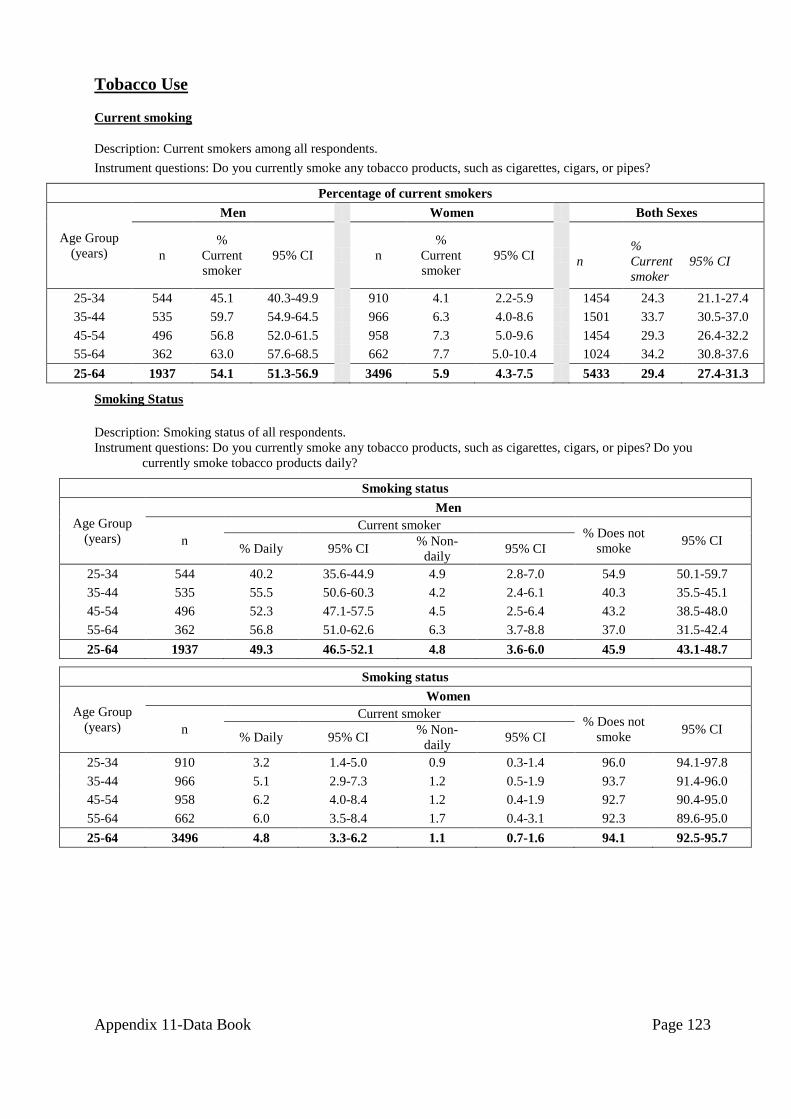
Appendix 11-Data Book Page 123
Tobacco Use
Current smoking
Description: Current smokers among all respondents.
Instrument questions: Do you currently smoke any tobacco products, such as cigarettes, cigars, or pipes?
Percentage of current smokers
Age Group
(years)
Men Women Both Sexes
n
%
Current
smoker
95% CI n
%
Current
smoker
95% CI n
%
Current
smoker
95% CI
25-34 544 45.1 40.3-49.9 910 4.1 2.2-5.9 1454 24.3 21.1-27.4
35-44 535 59.7 54.9-64.5 966 6.3 4.0-8.6 1501 33.7 30.5-37.0
45-54 496 56.8 52.0-61.5 958 7.3 5.0-9.6 1454 29.3 26.4-32.2
55-64 362 63.0 57.6-68.5 662 7.7 5.0-10.4 1024 34.2 30.8-37.6
25-64 1937 54.1 51.3-56.9 3496 5.9 4.3-7.5 5433 29.4 27.4-31.3
Smoking Status
Description: Smoking status of all respondents.
Instrument questions: Do you currently smoke any tobacco products, such as cigarettes, cigars, or pipes? Do you
currently smoke tobacco products daily?
Smoking status
Age Group
(years)
Men
n
Current smoker % Does not
smoke 95% CI
% Daily 95% CI % Non-
daily 95% CI
25-34 544 40.2 35.6-44.9 4.9 2.8-7.0 54.9 50.1-59.7
35-44 535 55.5 50.6-60.3 4.2 2.4-6.1 40.3 35.5-45.1
45-54 496 52.3 47.1-57.5 4.5 2.5-6.4 43.2 38.5-48.0
55-64 362 56.8 51.0-62.6 6.3 3.7-8.8 37.0 31.5-42.4
25-64 1937 49.3 46.5-52.1 4.8 3.6-6.0 45.9 43.1-48.7
Smoking status
Age Group
(years)
Women
n
Current smoker % Does not
smoke 95% CI
% Daily 95% CI % Non-
daily 95% CI
25-34 910 3.2 1.4-5.0 0.9 0.3-1.4 96.0 94.1-97.8
35-44 966 5.1 2.9-7.3 1.2 0.5-1.9 93.7 91.4-96.0
45-54 958 6.2 4.0-8.4 1.2 0.4-1.9 92.7 90.4-95.0
55-64 662 6.0 3.5-8.4 1.7 0.4-3.1 92.3 89.6-95.0
25-64 3496 4.8 3.3-6.2 1.1 0.7-1.6 94.1 92.5-95.7

Appendix 11-Data Book Page 124
Smoking status
Age Group
(years)
Both Sexes
n
Current smoker % Does not
smoke 95% CI
% Daily 95% CI % Non-
daily 95% CI
25-34 1454 21.4 18.4-24.4 2.8 1.8-3.9 75.7 72.6-78.9
35-44 1501 31.0 27.8-34.2 2.8 1.7-3.8 66.3 63.0-69.5
45-54 1454 26.7 23.7-29.6 2.6 1.7-3.6 70.7 67.8-73.6
55-64 1024 30.3 26.9-33.6 3.9 2.5-5.3 65.8 62.4-69.2
25-64 5433 26.4 24.5-28.3 2.9 2.3-3.5 70.6 68.7-72.6
Frequency of smoking
Description: Percentage of current daily smokers among smokers.
Instrument question: Do you currently smoke tobacco products such as cigarettes, cigars, or pipes daily?
Current daily smokers among smokers
Age Group
(years)
Men Women Both Sexes
n % Daily
smokers 95% CI n
% Daily
smokers 95% CI
n % Daily
smokers 95% CI
25-34 246 89.2 84.7-93.6 38 78.9 64.2-93.5 284 88.3 84.2-92.4
35-44 319 92.9 89.8-96.0 60 81.0 69.2-92.7 379 91.8 88.8-94.8
45-54 282 92.1 88.6-95.6 72 84.3 74.3-94.3 354 91.0 87.8-94.3
55-64 228 90.1 86.0-94.1 51 77.3 61.6-93.0 279 88.6 84.6-92.6
25-64 1075 91.2 89.0-93.4 221 80.8 73.1-88.5 1296 90.1 88.0-92.2
Initiation of smoking
Description: Mean age of initiation and mean duration of smoking, in years, among daily smokers (no total age group
for mean duration of smoking as age influences these values).
Instrument questions: How old were you when you first started smoking daily? Do you remember how long ago it was?
Mean age started smoking
Age Group
(years)
Men Women Both Sexes
n Mean
age 95% CI n Mean age 95% CI n
Mean
age 95% CI
25-34 220 19.0 18.4-19.7 30 18.4 16.1-20.7 250 19.0 18.3-19.6
35-44 295 19.7 19.0-20.3 49 21.6 18.5-24.7 344 19.8 19.2-20.5
45-54 261 21.5 20.6-22.4 59 27.6 25.1-30.2 320 22.3 21.4-23.2
55-64 202 21.3 20.3-22.3 40 25.4 22.1-28.6 242 21.7 20.7-22.7
25-64 978 20.1 19.7-20.5 178 23.3 21.2-25.3 1156 20.4 20.0-20.8
Mean duration of smoking
Age Group
(years)
Men Women Both Sexes
n Mean
duration 95% CI n
Mean
duration 95% CI n
Mean
duration 95% CI
25-34 220 10.3 9.6-11.1 30 11.6 8.8-14.5 250 10.4 9.7-11.2
35-44 295 20.0 19.4-20.7 49 17.0 13.8-20.2 344 19.8 19.1-20.4
45-54 261 27.8 26.9-28.7 59 21.8 19.3-24.4 320 27.1 26.1-28.0
55-64 202 37.8 36.7-38.8 40 33.7 30.3-37.0 242 37.3 36.3-38.4
25-64 978 21.3 20.5-22.0 178 19.8 18.1-21.6 1156 21.1 20.4-21.9

Appendix 11-Data Book Page 125
Manufactured cigarette smokers
Description: Percentage of smokers who use manufactured cigarettes among daily smokers.
Instrument question: On average, how many of the following do you smoke each day?
Manufactured cigarette smokers among daily smokers
Age Group
(years)
Men Women Both Sexes
n
% Manu-
factured
cigarette
smoker
95% CI n
% Manu-
factured
cigarette
smoker
95% CI n
% Manu-
factured
cigarette
smoker
95% CI
25-34 220 93.0 89.0-97.0 30 88.0 75.9-100.0 250 92.6 88.5-96.8
35-44 296 89.6 85.1-94.1 49 77.6 58.6-96.5 345 88.6 84.0-93.2
45-54 261 84.4 79.2-89.6 59 77.0 63.0-91.0 320 83.4 78.3-88.5
55-64 202 79.5 73.2-85.9 40 62.5 44.1-80.8 242 77.8 71.8-83.8
25-64 979 88.1 85.2-90.9 178 77.5 66.4-88.6 1157 87.1 84.0-90.2
Hand-rolled cigarette smokers among daily smokers
Age Group
(years)
Men Women Both Sexes
n
% Hand-
rolled
cigarette
smoker
95% CI n
% Hand-
rolled
cigarette
smoker
95% CI n
% Hand-
rolled
cigarette
smoker
95% CI
25-34 220 9.6 4.7-14.5 30 22.5 0.0-48.0 250 10.6 5.3-15.8
35-44 296 15.0 9.9-20.1 49 23.8 3.7-43.9 345 15.7 10.5-20.9
45-54 261 20.6 14.9-26.3 59 24.9 10.8-38.9 320 21.2 15.7-26.7
55-64 202 25.5 18.7-32.2 40 37.5 19.2-55.9 242 26.7 20.4-33.0
25-64 979 16.0 12.5-19.6 178 26.0 12.4-39.6 1157 17.0 13.2-20.7
Amount of tobacco used among smokers by type
Description: Mean amount of tobacco used by daily smokers per day, by type.
Instrument question: On average, how many of the following do you smoke each day?
Mean amount of tobacco used by daily smokers by type
Age
Group
(years)
Men
n
Mean #
of manu-
factured
cig.
95% CI n
Mean #of
hand-
rolled cig.
95%
CI n
Mean # of
pipes of
tobacco
95%
CI n
Mean #
of Other
95%
CI
25-34 220 12.0 10.7-13.3 220 0.6 0.3-1.0 220 0.0 ---- 220 0.0 ----
35-44 296 14.2 12.9-15.6 296 1.1 0.7-1.6 296 0.0 ---- 296 0.0 ----
45-54 261 14.3 12.4-16.2 261 1.6 1.1-2.1 261 0.0 ---- 261 0.0 ----
55-64 202 12.7 11.0-14.5 201 1.9 1.3-2.5 202 0.0 ---- 202 0.0 ----
25-64 979 13.4 12.5-14.2 978 1.2 0.9-1.4 979 0.0 ---- 979 0.0 ----

Appendix 11-Data Book Page 126
Mean amount of tobacco used by daily smokers by type
Age
Group
(years)
Women
n
Mean #
of manu-
factured
cig.
95% CI n
Mean #of
hand-
rolled cig.
95% CI n
Mean # of
pipes of
tobacco
95%
CI n
Mean #
of
Other
95%
CI
25-34 30 5.8 3.6-7.9 30 1.5 0.0-3.5 30 0.0 ---- 30 0.0 ----
35-44 49 7.5 4.6-
10.5 49 1.0 0.1-1.9 49 0.0 ---- 49 0.0 ----
45-54 59 7.3 4.9-9.7 59 1.4 0.3-2.5 59 0.0 ---- 59 0.0 ----
55-64 40 6.8 4.4-9.2 40 2.5 1.0-4.1 40 0.0 ---- 40 0.0 ----
25-64 178 6.9 5.6-8.2 178 1.5 0.7-2.3 178 0.0 ---- 178 0.0 ----
Mean amount of tobacco used by daily smokers by type
Age
Group
(years)
Both Sexes
n
Mean #
of manu-
factured
cig.
95% CI n
Mean #of
hand-
rolled cig.
95%
CI n
Mean # of
pipes of
tobacco
95%
CI n
Mean #
of
Other
95%
CI
25-34 250 11.5 10.3-12.7 250 0.7 0.3-1.1 250 0.0 ---- 250 0.0 ----
35-44 345 13.7 12.4-15.0 345 1.1 0.7-1.5 345 0.0 ---- 345 0.0 ----
45-54 320 13.4 11.7-15.2 320 1.6 1.1-2.0 320 0.0 ---- 320 0.0 ----
55-64 242 12.1 10.5-13.7 241 2.0 1.4-2.5 242 0.0 ---- 242 0.0 ----
25-64 1157 12.8 11.9-13.6 1156 1.2 1.0-1.5 1157 0.0 ---- 1157 0.0 ----
Percentage of ex daily smokers in the population
Description: Percentage of ex-daily smokers among all respondents and the mean duration, in years, since ex-daily
smokers quit smoking daily.
Instrument question: In the past did you ever smoke daily? How old were you when you stopped smoking daily?
Ex-daily smokers among all respondents
Age Group
(years)
Men Women Both Sexes
n
% ex
daily
smokers
95% CI n
% ex
daily
smokers
95% CI n
% ex
daily
smokers
95% CI
25-34 544 8.5 5.7-11.2 910 0.8 0.2-1.4 1454 4.6 3.2-6.0
35-44 535 16.1 13.1-19.2 966 1.9 0.9-2.9 1501 9.2 7.6-10.8
45-54 496 23.7 19.8-27.5 958 3.1 2.0-4.3 1454 12.3 10.4-14.2
55-64 362 30.2 24.9-35.5 662 4.9 3.2-6.6 1024 17.0 14.2-19.9
25-64 1937 16.5 14.7-18.4 3496 2.2 1.6-2.7 5433 9.2 8.2-10.2
Mean years since cessation
Age Group
(years)
Men Women Both Sexes
n Mean
years 95% CI n
Mean
years 95% CI n
Mean
years 95% CI
25-34 14 9.9 8.4-11.3 2 10.3 8.2-12.4 16 9.9 8.6-11.2
35-44 45 14.5 12.4-16.5 7 15.6 12.3-18.8 52 14.5 12.7-16.4
45-54 59 15.2 12.7-17.7 17 17.2 12.9-21.4 76 15.6 13.4-17.7
55-64 56 15.5 13.1-17.9 23 18.4 13.7-23.1 79 16.0 13.9-18.2
25-64 174 14.4 13.2-15.6 49 16.8 14.4-19.3 223 14.7 13.7-15.8

Appendix 11-Data Book Page 127
Current Users of smokeless tobacco
Description: Percentage of current users of smokeless tobacco among all respondents.
Instrument question: Do you currently use any smokeless tobacco such as [snuff, chewing tobacco, betel]?
Current users of smokeless tobacco
Age Group
(years)
Men Women Both Sexes
n
%
Current
users
95% CI n
%
Current
users
95% CI n
%
Current
users
95% CI
25-34 544 0.6 0.1-1.1 910 3.7 2.2-5.2 1454 2.2 1.4-2.9
35-44 535 1.9 0.6-3.2 966 13.8 10.5-17.0 1501 7.7 5.7-9.6
45-54 496 4.2 1.9-6.6 958 21.3 17.7-24.9 1454 13.7 11.3-16.1
55-64 362 4.7 2.3-7.1 662 37.6 32.8-42.4 1024 21.9 19.0-24.7
25-64 1937 2.2 1.4-3.0 3496 14.9 13.0-16.9 5433 8.8 7.6-9.9
Smokeless tobacco use
Description: Status of using smokeless tobacco among all respondents.
Instrument questions: Do you currently use any smokeless tobacco such as [snuff, chewing tobacco, betel]? Do you
currently use smokeless tobacco products daily?
Smokeless tobacco use
Age Group
(years)
Men
n
Current user % Does not
use
smokeless
tobacco
95% CI % Daily 95% CI
% Non-
daily 95% CI
25-34 544 0.0 0.0-0.0 0.6 0.1-1.1 99.4 98.9-99.9
35-44 535 0.6 0.0-1.2 1.4 0.3-2.4 98.1 96.8-99.4
45-54 496 3.5 1.3-5.6 0.8 0.0-1.6 95.8 93.4-98.1
55-64 362 3.5 1.5-5.4 1.2 0.0-2.4 95.3 92.9-97.7
25-64 1937 1.3 0.7-1.9 0.9 0.4-1.4 97.8 97.0-98.6
Smokeless tobacco use
Age Group
(years)
Women
n
Current user % Does not
use
smokeless
tobacco
95% CI % Daily 95% CI
% Non-
daily 95% CI
25-34 910 3.3 1.9-4.8 0.4 0.0-0.7 96.3 94.8-97.8
35-44 966 12.3 9.3-15.4 1.4 0.7-2.2 86.2 83.0-89.5
45-54 958 19.2 15.7-22.8 2.1 1.0-3.2 78.7 75.1-82.3
55-64 662 35.6 30.9-40.3 2.1 0.9-3.2 62.4 57.6-67.2
25-64 3496 13.7 11.8-15.5 1.3 0.9-1.7 85.1 83.1-87.0
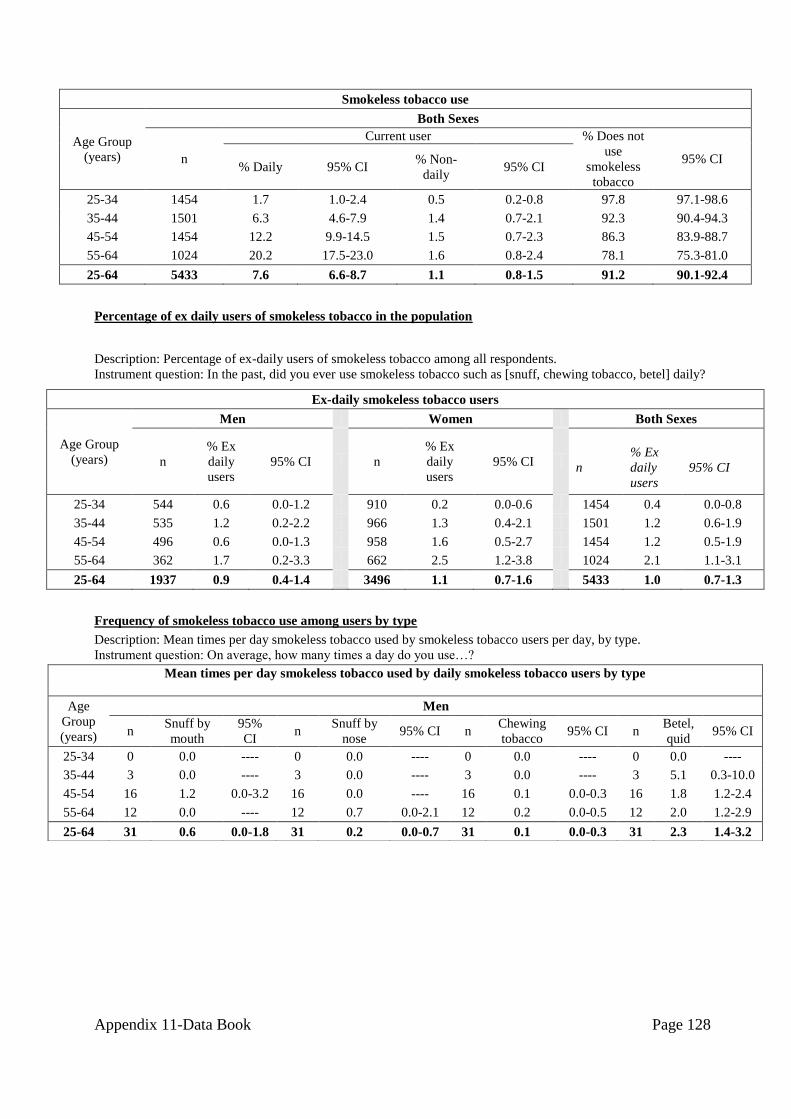
Appendix 11-Data Book Page 128
Smokeless tobacco use
Age Group
(years)
Both Sexes
n
Current user % Does not
use
smokeless
tobacco
95% CI % Daily 95% CI
% Non-
daily 95% CI
25-34 1454 1.7 1.0-2.4 0.5 0.2-0.8 97.8 97.1-98.6
35-44 1501 6.3 4.6-7.9 1.4 0.7-2.1 92.3 90.4-94.3
45-54 1454 12.2 9.9-14.5 1.5 0.7-2.3 86.3 83.9-88.7
55-64 1024 20.2 17.5-23.0 1.6 0.8-2.4 78.1 75.3-81.0
25-64 5433 7.6 6.6-8.7 1.1 0.8-1.5 91.2 90.1-92.4
Percentage of ex daily users of smokeless tobacco in the population
Description: Percentage of ex-daily users of smokeless tobacco among all respondents.
Instrument question: In the past, did you ever use smokeless tobacco such as [snuff, chewing tobacco, betel] daily?
Ex-daily smokeless tobacco users
Age Group
(years)
Men Women Both Sexes
n
% Ex
daily
users
95% CI n
% Ex
daily
users
95% CI n
% Ex
daily
users
95% CI
25-34 544 0.6 0.0-1.2 910 0.2 0.0-0.6 1454 0.4 0.0-0.8
35-44 535 1.2 0.2-2.2 966 1.3 0.4-2.1 1501 1.2 0.6-1.9
45-54 496 0.6 0.0-1.3 958 1.6 0.5-2.7 1454 1.2 0.5-1.9
55-64 362 1.7 0.2-3.3 662 2.5 1.2-3.8 1024 2.1 1.1-3.1
25-64 1937 0.9 0.4-1.4 3496 1.1 0.7-1.6 5433 1.0 0.7-1.3
Frequency of smokeless tobacco use among users by type
Description: Mean times per day smokeless tobacco used by smokeless tobacco users per day, by type.
Instrument question: On average, how many times a day do you use…?
Mean times per day smokeless tobacco used by daily smokeless tobacco users by type
Age
Group
(years)
Men
n Snuff by
mouth
95%
CI n
Snuff by
nose 95% CI n
Chewing
tobacco 95% CI n
Betel,
quid 95% CI
25-34 0 0.0 ---- 0 0.0 ---- 0 0.0 ---- 0 0.0 ----
35-44 3 0.0 ---- 3 0.0 ---- 3 0.0 ---- 3 5.1 0.3-10.0
45-54 16 1.2 0.0-3.2 16 0.0 ---- 16 0.1 0.0-0.3 16 1.8 1.2-2.4
55-64 12 0.0 ---- 12 0.7 0.0-2.1 12 0.2 0.0-0.5 12 2.0 1.2-2.9
25-64 31 0.6 0.0-1.8 31 0.2 0.0-0.7 31 0.1 0.0-0.3 31 2.3 1.4-3.2
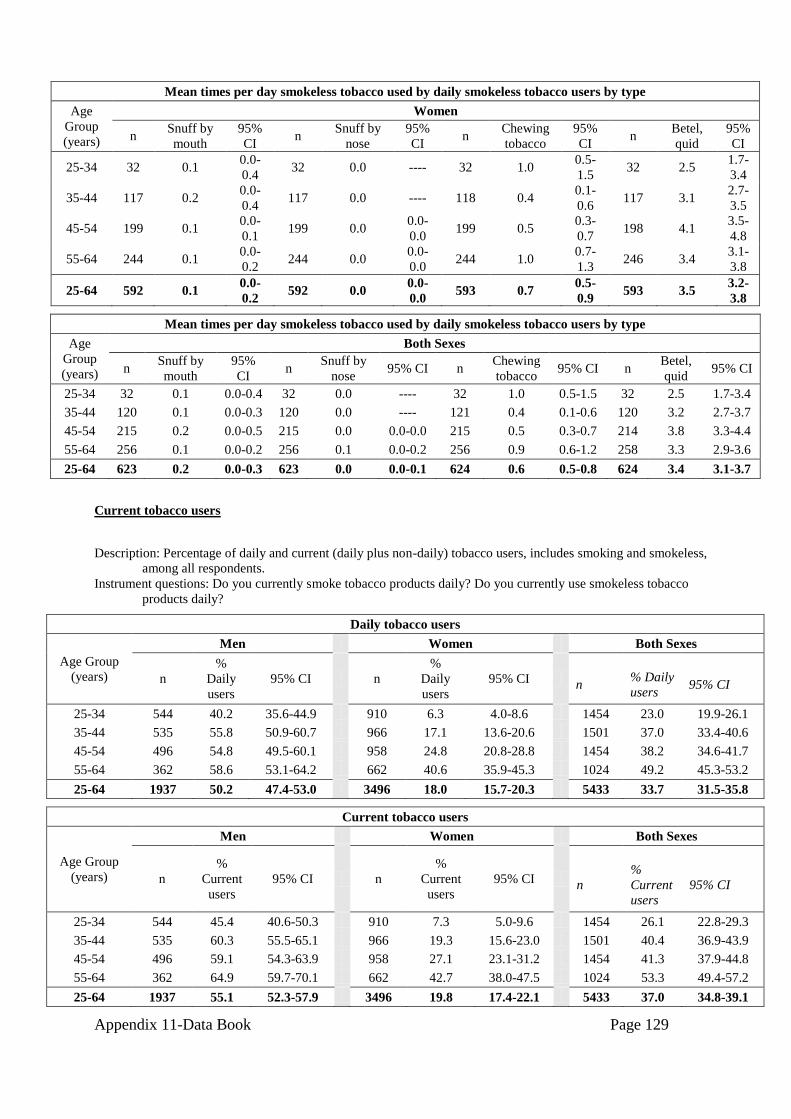
Appendix 11-Data Book Page 129
Mean times per day smokeless tobacco used by daily smokeless tobacco users by type
Age
Group
(years)
Women
n Snuff by
mouth
95%
CI n
Snuff by
nose
95%
CI n
Chewing
tobacco
95%
CI n
Betel,
quid
95%
CI
25-34 32 0.1 0.0-
0.4 32 0.0 ---- 32 1.0
0.5-
1.5 32 2.5
1.7-
3.4
35-44 117 0.2 0.0-
0.4 117 0.0 ---- 118 0.4
0.1-
0.6 117 3.1
2.7-
3.5
45-54 199 0.1 0.0-
0.1 199 0.0
0.0-
0.0 199 0.5
0.3-
0.7 198 4.1
3.5-
4.8
55-64 244 0.1 0.0-
0.2 244 0.0
0.0-
0.0 244 1.0
0.7-
1.3 246 3.4
3.1-
3.8
25-64 592 0.1 0.0-
0.2 592 0.0
0.0-
0.0 593 0.7
0.5-
0.9 593 3.5
3.2-
3.8
Mean times per day smokeless tobacco used by daily smokeless tobacco users by type
Age
Group
(years)
Both Sexes
n Snuff by
mouth
95%
CI n
Snuff by
nose 95% CI n
Chewing
tobacco 95% CI n
Betel,
quid 95% CI
25-34 32 0.1 0.0-0.4 32 0.0 ---- 32 1.0 0.5-1.5 32 2.5 1.7-3.4
35-44 120 0.1 0.0-0.3 120 0.0 ---- 121 0.4 0.1-0.6 120 3.2 2.7-3.7
45-54 215 0.2 0.0-0.5 215 0.0 0.0-0.0 215 0.5 0.3-0.7 214 3.8 3.3-4.4
55-64 256 0.1 0.0-0.2 256 0.1 0.0-0.2 256 0.9 0.6-1.2 258 3.3 2.9-3.6
25-64 623 0.2 0.0-0.3 623 0.0 0.0-0.1 624 0.6 0.5-0.8 624 3.4 3.1-3.7
Current tobacco users
Description: Percentage of daily and current (daily plus non-daily) tobacco users, includes smoking and smokeless,
among all respondents.
Instrument questions: Do you currently smoke tobacco products daily? Do you currently use smokeless tobacco
products daily?
Daily tobacco users
Age Group
(years)
Men Women Both Sexes
n
%
Daily
users
95% CI n
%
Daily
users
95% CI n % Daily
users 95% CI
25-34 544 40.2 35.6-44.9 910 6.3 4.0-8.6 1454 23.0 19.9-26.1
35-44 535 55.8 50.9-60.7 966 17.1 13.6-20.6 1501 37.0 33.4-40.6
45-54 496 54.8 49.5-60.1 958 24.8 20.8-28.8 1454 38.2 34.6-41.7
55-64 362 58.6 53.1-64.2 662 40.6 35.9-45.3 1024 49.2 45.3-53.2
25-64 1937 50.2 47.4-53.0 3496 18.0 15.7-20.3 5433 33.7 31.5-35.8
Current tobacco users
Age Group
(years)
Men Women Both Sexes
n
%
Current
users
95% CI n
%
Current
users
95% CI n
%
Current
users
95% CI
25-34 544 45.4 40.6-50.3 910 7.3 5.0-9.6 1454 26.1 22.8-29.3
35-44 535 60.3 55.5-65.1 966 19.3 15.6-23.0 1501 40.4 36.9-43.9
45-54 496 59.1 54.3-63.9 958 27.1 23.1-31.2 1454 41.3 37.9-44.8
55-64 362 64.9 59.7-70.1 662 42.7 38.0-47.5 1024 53.3 49.4-57.2
25-64 1937 55.1 52.3-57.9 3496 19.8 17.4-22.1 5433 37.0 34.8-39.1
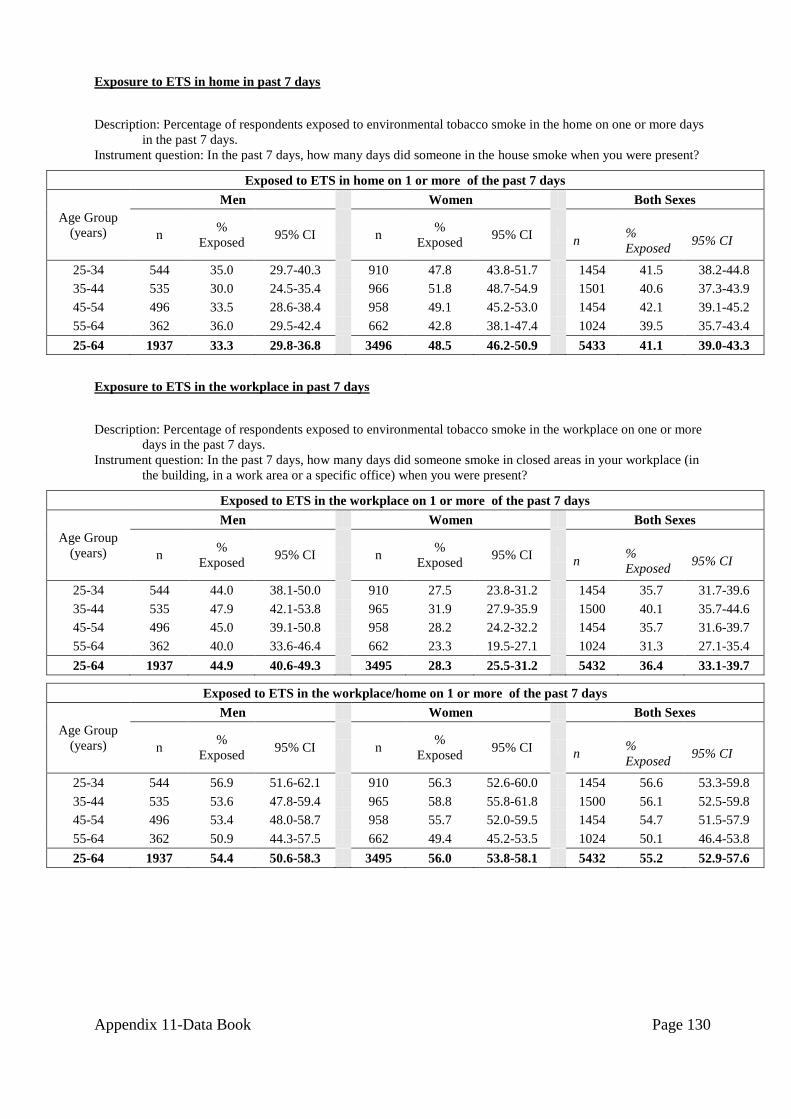
Appendix 11-Data Book Page 130
Exposure to ETS in home in past 7 days
Description: Percentage of respondents exposed to environmental tobacco smoke in the home on one or more days
in the past 7 days.
Instrument question: In the past 7 days, how many days did someone in the house smoke when you were present?
Exposed to ETS in home on 1 or more of the past 7 days
Age Group
(years)
Men Women Both Sexes
n %
Exposed 95% CI n
%
Exposed 95% CI n
%
Exposed 95% CI
25-34 544 35.0 29.7-40.3 910 47.8 43.8-51.7 1454 41.5 38.2-44.8
35-44 535 30.0 24.5-35.4 966 51.8 48.7-54.9 1501 40.6 37.3-43.9
45-54 496 33.5 28.6-38.4 958 49.1 45.2-53.0 1454 42.1 39.1-45.2
55-64 362 36.0 29.5-42.4 662 42.8 38.1-47.4 1024 39.5 35.7-43.4
25-64 1937 33.3 29.8-36.8 3496 48.5 46.2-50.9 5433 41.1 39.0-43.3
Exposure to ETS in the workplace in past 7 days
Description: Percentage of respondents exposed to environmental tobacco smoke in the workplace on one or more
days in the past 7 days.
Instrument question: In the past 7 days, how many days did someone smoke in closed areas in your workplace (in
the building, in a work area or a specific office) when you were present?
Exposed to ETS in the workplace on 1 or more of the past 7 days
Age Group
(years)
Men Women Both Sexes
n %
Exposed 95% CI n
%
Exposed 95% CI
n %
Exposed 95% CI
25-34 544 44.0 38.1-50.0 910 27.5 23.8-31.2 1454 35.7 31.7-39.6
35-44 535 47.9 42.1-53.8 965 31.9 27.9-35.9 1500 40.1 35.7-44.6
45-54 496 45.0 39.1-50.8 958 28.2 24.2-32.2 1454 35.7 31.6-39.7
55-64 362 40.0 33.6-46.4 662 23.3 19.5-27.1 1024 31.3 27.1-35.4
25-64 1937 44.9 40.6-49.3 3495 28.3 25.5-31.2 5432 36.4 33.1-39.7
Exposed to ETS in the workplace/home on 1 or more of the past 7 days
Age Group
(years)
Men Women Both Sexes
n %
Exposed 95% CI n
%
Exposed 95% CI
n %
Exposed 95% CI
25-34 544 56.9 51.6-62.1 910 56.3 52.6-60.0 1454 56.6 53.3-59.8
35-44 535 53.6 47.8-59.4 965 58.8 55.8-61.8 1500 56.1 52.5-59.8
45-54 496 53.4 48.0-58.7 958 55.7 52.0-59.5 1454 54.7 51.5-57.9
55-64 362 50.9 44.3-57.5 662 49.4 45.2-53.5 1024 50.1 46.4-53.8
25-64 1937 54.4 50.6-58.3 3495 56.0 53.8-58.1 5432 55.2 52.9-57.6

Appendix 11-Data Book Page 131
Alcohol Consumption
Alcohol consumption status
Description: Alcohol consumption status of all respondents.
Instrument questions: Have you consumed an alcoholic drink in the past 12 months? in the past 30 days?
Alcohol consumption status
Age Group
(years)
Men
n
%
Current
drinker
(past 30
days)
95% CI
% Drank
in past 12
months,
not current
95% CI
% Past 12
months
abstainer
95% CI
%
Lifetime
abstainer
95% CI
25-34 544 84.9 81.4-88.4 6.9 4.8-9.1 2.6 1.0-4.2 5.6 3.4-7.8
35-44 535 78.2 74.2-82.2 8.4 6.0-10.8 5.4 3.2-7.5 8.0 5.9-10.1
45-54 496 72.5 68.3-76.6 9.7 6.9-12.5 7.0 4.6-9.3 10.9 8.0-13.8
55-64 362 52.1 46.0-58.2 7.0 4.5-9.6 21.8 16.5-27.1 19.1 14.6-23.5
25-64 1937 76.3 73.9-78.7 7.9 6.7-9.2 6.7 5.4-8.0 9.1 7.5-10.6
Alcohol consumption status
Age Group
(years)
Women
n
%
Current
drinker
(past 30
days)
95% CI
% Drank
in past 12
months,
not
current
95% CI
% Past
12
months
abstainer
95% CI
%
Lifetime
abstainer
95% CI
25-34 910 32.0 28.1-35.9 14.6 12.1-17.1 11.1 8.7-13.4 42.3 38.3-46.2
35-44 966 35.6 32.0-39.2 12.4 9.9-14.8 12.0 9.8-14.1 40.0 36.6-43.5
45-54 958 34.0 30.1-37.9 11.1 9.0-13.2 15.1 12.5-17.7 39.8 36.2-43.3
55-64 662 19.6 15.9-23.3 5.3 3.2-7.3 18.3 14.8-21.7 56.9 52.1-61.7
25-64 3496 31.9 29.6-34.2 12.0 10.6-13.4 13.2 11.8-14.6 43.0 40.5-45.4
Alcohol consumption status
Age Group
(years)
Both Sexes
n
% Current
drinker
(past 30
days)
95% CI
% Drank in
past 12
months, not
current
95% CI
% Past 12
months
abstainer
95% CI
%
Lifetime
abstainer
95% CI
25-34 1454 58.0 54.7-61.4 10.8 9.2-
12.5 6.9 5.5-8.3 24.2
21.4-
27.0
35-44 1501 57.5 54.7-60.3 10.3 8.7-
12.0 8.6 7.0-10.1 23.6
21.5-
25.7
45-54 1454 51.1 47.9-54.4 10.5 8.8-
12.1 11.5 9.7-13.2 26.9
24.3-
29.6
55-64 1024 35.2 31.6-38.8 6.1 4.4-7.8 19.9 16.6-23.3 38.8 35.0-
42.6
25-64 5433 53.5 51.4-55.6 10.0 9.1-
10.9 10.0 9.0-11.1 26.5
24.8-
28.2
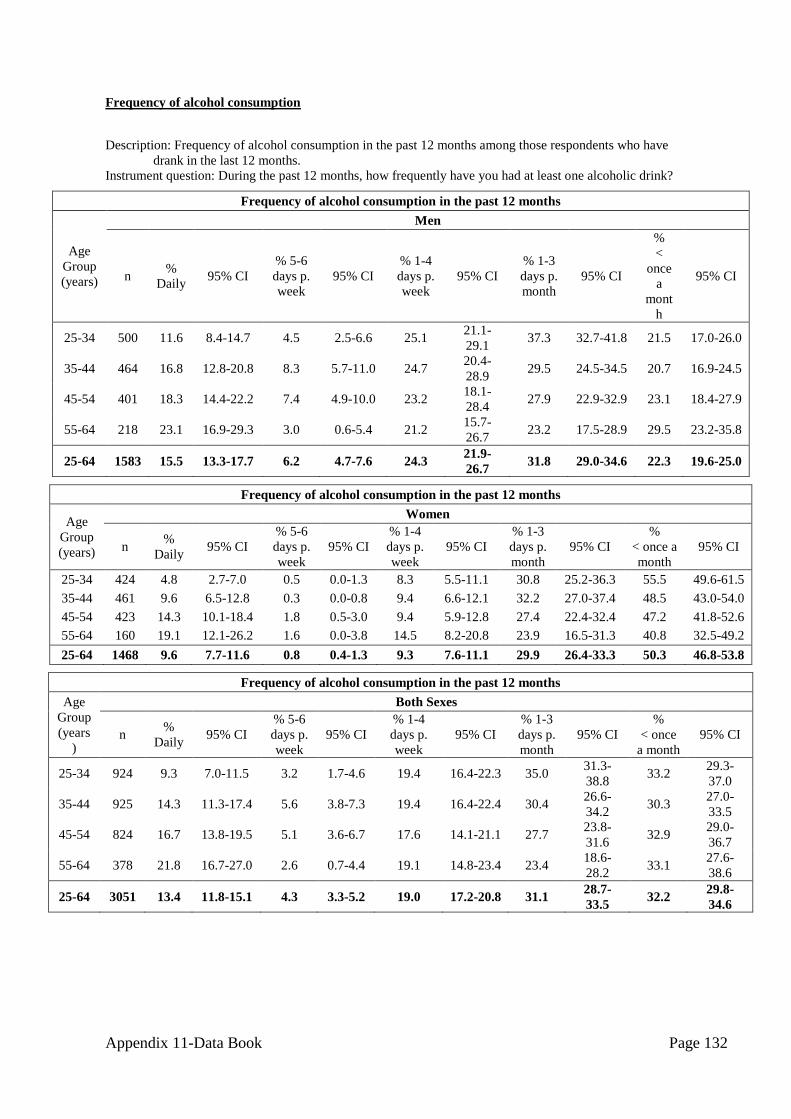
Appendix 11-Data Book Page 132
Frequency of alcohol consumption
Description: Frequency of alcohol consumption in the past 12 months among those respondents who have
drank in the last 12 months.
Instrument question: During the past 12 months, how frequently have you had at least one alcoholic drink?
Frequency of alcohol consumption in the past 12 months
Age
Group
(years)
Men
n %
Daily 95% CI
% 5-6
days p.
week
95% CI
% 1-4
days p.
week
95% CI
% 1-3
days p.
month
95% CI
%
<
once
a
mont
h
95% CI
25-34 500 11.6 8.4-14.7 4.5 2.5-6.6 25.1 21.1-
29.1 37.3 32.7-41.8 21.5 17.0-26.0
35-44 464 16.8 12.8-20.8 8.3 5.7-11.0 24.7 20.4-
28.9 29.5 24.5-34.5 20.7 16.9-24.5
45-54 401 18.3 14.4-22.2 7.4 4.9-10.0 23.2 18.1-
28.4 27.9 22.9-32.9 23.1 18.4-27.9
55-64 218 23.1 16.9-29.3 3.0 0.6-5.4 21.2 15.7-
26.7 23.2 17.5-28.9 29.5 23.2-35.8
25-64 1583 15.5 13.3-17.7 6.2 4.7-7.6 24.3 21.9-
26.7 31.8 29.0-34.6 22.3 19.6-25.0
Frequency of alcohol consumption in the past 12 months
Age
Group
(years)
Women
n %
Daily 95% CI
% 5-6
days p.
week
95% CI
% 1-4
days p.
week
95% CI
% 1-3
days p.
month
95% CI
%
< once a
month
95% CI
25-34 424 4.8 2.7-7.0 0.5 0.0-1.3 8.3 5.5-11.1 30.8 25.2-36.3 55.5 49.6-61.5
35-44 461 9.6 6.5-12.8 0.3 0.0-0.8 9.4 6.6-12.1 32.2 27.0-37.4 48.5 43.0-54.0
45-54 423 14.3 10.1-18.4 1.8 0.5-3.0 9.4 5.9-12.8 27.4 22.4-32.4 47.2 41.8-52.6
55-64 160 19.1 12.1-26.2 1.6 0.0-3.8 14.5 8.2-20.8 23.9 16.5-31.3 40.8 32.5-49.2
25-64 1468 9.6 7.7-11.6 0.8 0.4-1.3 9.3 7.6-11.1 29.9 26.4-33.3 50.3 46.8-53.8
Frequency of alcohol consumption in the past 12 months
Age
Group
(years
)
Both Sexes
n %
Daily 95% CI
% 5-6
days p.
week
95% CI
% 1-4
days p.
week
95% CI
% 1-3
days p.
month
95% CI
%
< once
a month
95% CI
25-34 924 9.3 7.0-11.5 3.2 1.7-4.6 19.4 16.4-22.3 35.0 31.3-
38.8 33.2
29.3-
37.0
35-44 925 14.3 11.3-17.4 5.6 3.8-7.3 19.4 16.4-22.4 30.4 26.6-
34.2 30.3
27.0-
33.5
45-54 824 16.7 13.8-19.5 5.1 3.6-6.7 17.6 14.1-21.1 27.7 23.8-
31.6 32.9
29.0-
36.7
55-64 378 21.8 16.7-27.0 2.6 0.7-4.4 19.1 14.8-23.4 23.4 18.6-
28.2 33.1
27.6-
38.6
25-64 3051 13.4 11.8-15.1 4.3 3.3-5.2 19.0 17.2-20.8 31.1 28.7-
33.5 32.2
29.8-
34.6
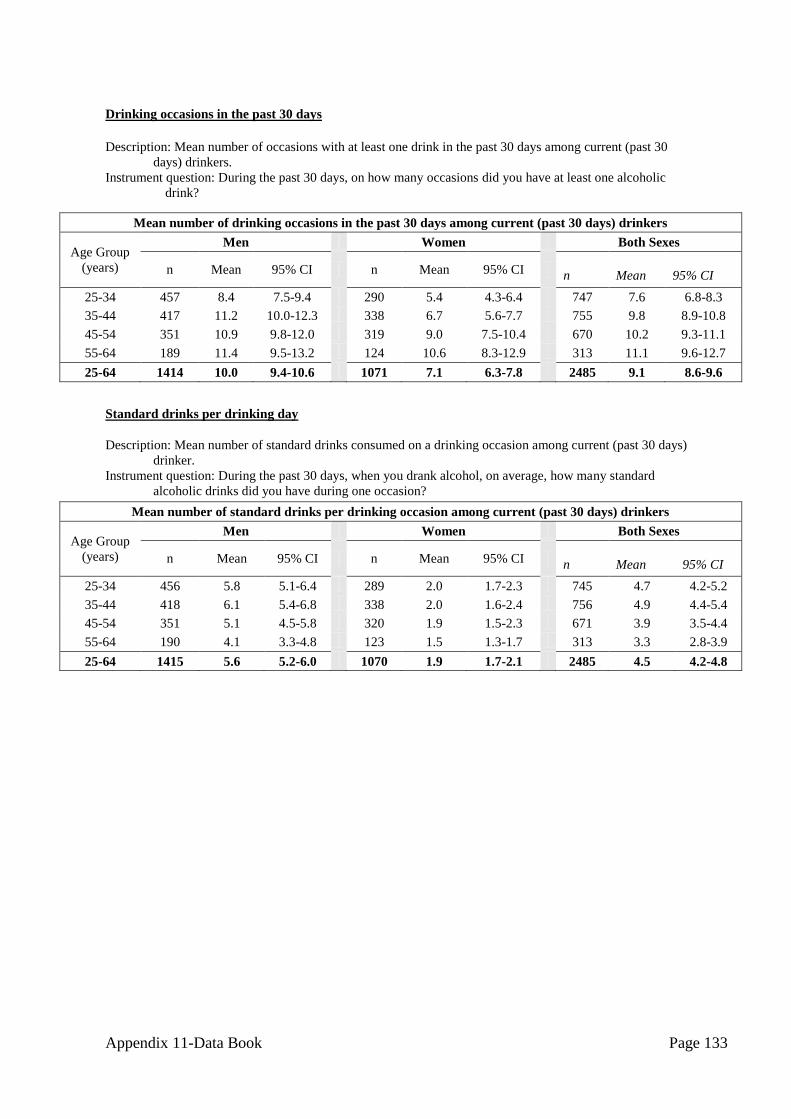
Appendix 11-Data Book Page 133
Mean number of drinking occasions in the past 30 days among current (past 30 days) drinkers
Age Group
(years)
Men Women Both Sexes
n Mean 95% CI n Mean 95% CI n Mean 95% CI
25-34 457 8.4 7.5-9.4 290 5.4 4.3-6.4 747 7.6 6.8-8.3
35-44 417 11.2 10.0-12.3 338 6.7 5.6-7.7 755 9.8 8.9-10.8
45-54 351 10.9 9.8-12.0 319 9.0 7.5-10.4 670 10.2 9.3-11.1
55-64 189 11.4 9.5-13.2 124 10.6 8.3-12.9 313 11.1 9.6-12.7
25-64 1414 10.0 9.4-10.6 1071 7.1 6.3-7.8 2485 9.1 8.6-9.6
Standard drinks per drinking day
Description: Mean number of standard drinks consumed on a drinking occasion among current (past 30 days)
drinker.
Instrument question: During the past 30 days, when you drank alcohol, on average, how many standard
alcoholic drinks did you have during one occasion?
Mean number of standard drinks per drinking occasion among current (past 30 days) drinkers
Age Group
(years)
Men Women Both Sexes
n Mean 95% CI n Mean 95% CI n Mean 95% CI
25-34 456 5.8 5.1-6.4 289 2.0 1.7-2.3 745 4.7 4.2-5.2
35-44 418 6.1 5.4-6.8 338 2.0 1.6-2.4 756 4.9 4.4-5.4
45-54 351 5.1 4.5-5.8 320 1.9 1.5-2.3 671 3.9 3.5-4.4
55-64 190 4.1 3.3-4.8 123 1.5 1.3-1.7 313 3.3 2.8-3.9
25-64 1415 5.6 5.2-6.0 1070 1.9 1.7-2.1 2485 4.5 4.2-4.8
Drinking occasions in the past 30 days
Description: Mean number of occasions with at least one drink in the past 30 days among current (past 30
days) drinkers.
Instrument question: During the past 30 days, on how many occasions did you have at least one alcoholic
drink?
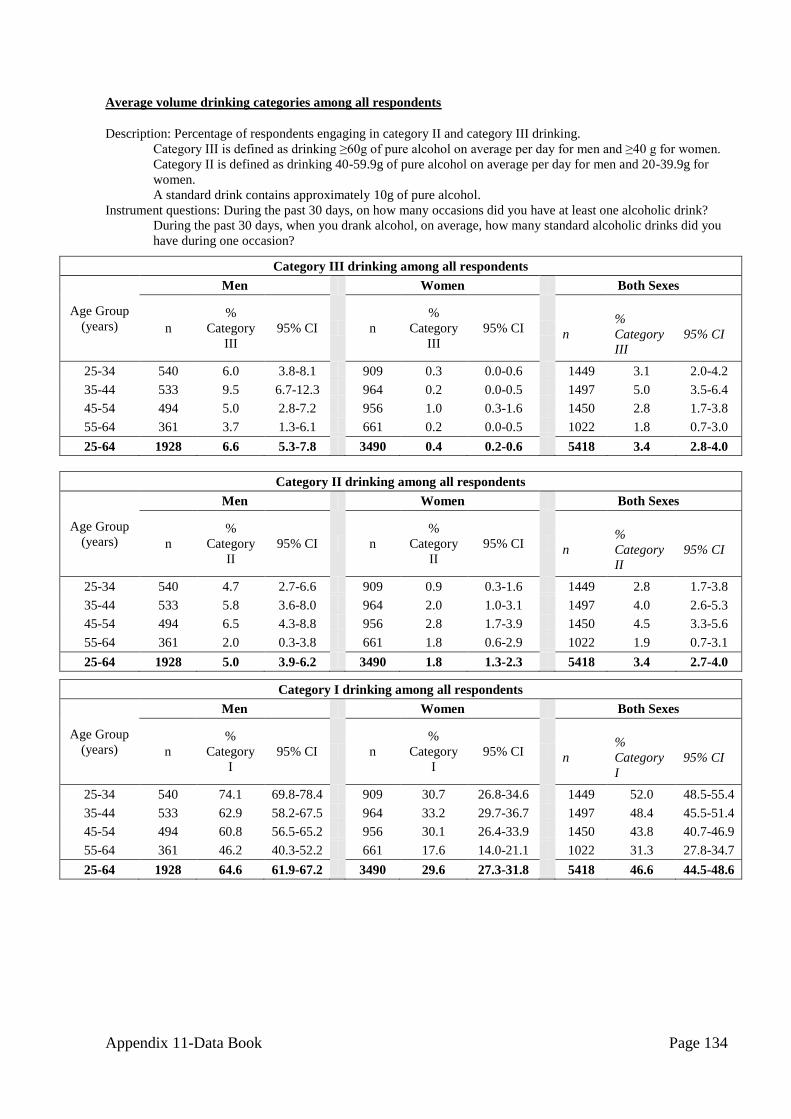
Appendix 11-Data Book Page 134
Average volume drinking categories among all respondents
Description: Percentage of respondents engaging in category II and category III drinking.
Category III is defined as drinking ≥60g of pure alcohol on average per day for men and ≥40 g for women.
Category II is defined as drinking 40-59.9g of pure alcohol on average per day for men and 20-39.9g for
women.
A standard drink contains approximately 10g of pure alcohol.
Instrument questions: During the past 30 days, on how many occasions did you have at least one alcoholic drink?
During the past 30 days, when you drank alcohol, on average, how many standard alcoholic drinks did you
have during one occasion?
Category III drinking among all respondents
Age Group
(years)
Men Women Both Sexes
n
%
Category
III
95% CI n
%
Category
III
95% CI n
%
Category
III
95% CI
25-34 540 6.0 3.8-8.1 909 0.3 0.0-0.6 1449 3.1 2.0-4.2
35-44 533 9.5 6.7-12.3 964 0.2 0.0-0.5 1497 5.0 3.5-6.4
45-54 494 5.0 2.8-7.2 956 1.0 0.3-1.6 1450 2.8 1.7-3.8
55-64 361 3.7 1.3-6.1 661 0.2 0.0-0.5 1022 1.8 0.7-3.0
25-64 1928 6.6 5.3-7.8 3490 0.4 0.2-0.6 5418 3.4 2.8-4.0
Category II drinking among all respondents
Age Group
(years)
Men Women Both Sexes
n
%
Category
II
95% CI n
%
Category
II
95% CI n
%
Category
II
95% CI
25-34 540 4.7 2.7-6.6 909 0.9 0.3-1.6 1449 2.8 1.7-3.8
35-44 533 5.8 3.6-8.0 964 2.0 1.0-3.1 1497 4.0 2.6-5.3
45-54 494 6.5 4.3-8.8 956 2.8 1.7-3.9 1450 4.5 3.3-5.6
55-64 361 2.0 0.3-3.8 661 1.8 0.6-2.9 1022 1.9 0.7-3.1
25-64 1928 5.0 3.9-6.2 3490 1.8 1.3-2.3 5418 3.4 2.7-4.0
Category I drinking among all respondents
Age Group
(years)
Men Women Both Sexes
n
%
Category
I
95% CI n
%
Category
I
95% CI n
%
Category
I
95% CI
25-34 540 74.1 69.8-78.4 909 30.7 26.8-34.6 1449 52.0 48.5-55.4
35-44 533 62.9 58.2-67.5 964 33.2 29.7-36.7 1497 48.4 45.5-51.4
45-54 494 60.8 56.5-65.2 956 30.1 26.4-33.9 1450 43.8 40.7-46.9
55-64 361 46.2 40.3-52.2 661 17.6 14.0-21.1 1022 31.3 27.8-34.7
25-64 1928 64.6 61.9-67.2 3490 29.6 27.3-31.8 5418 46.6 44.5-48.6
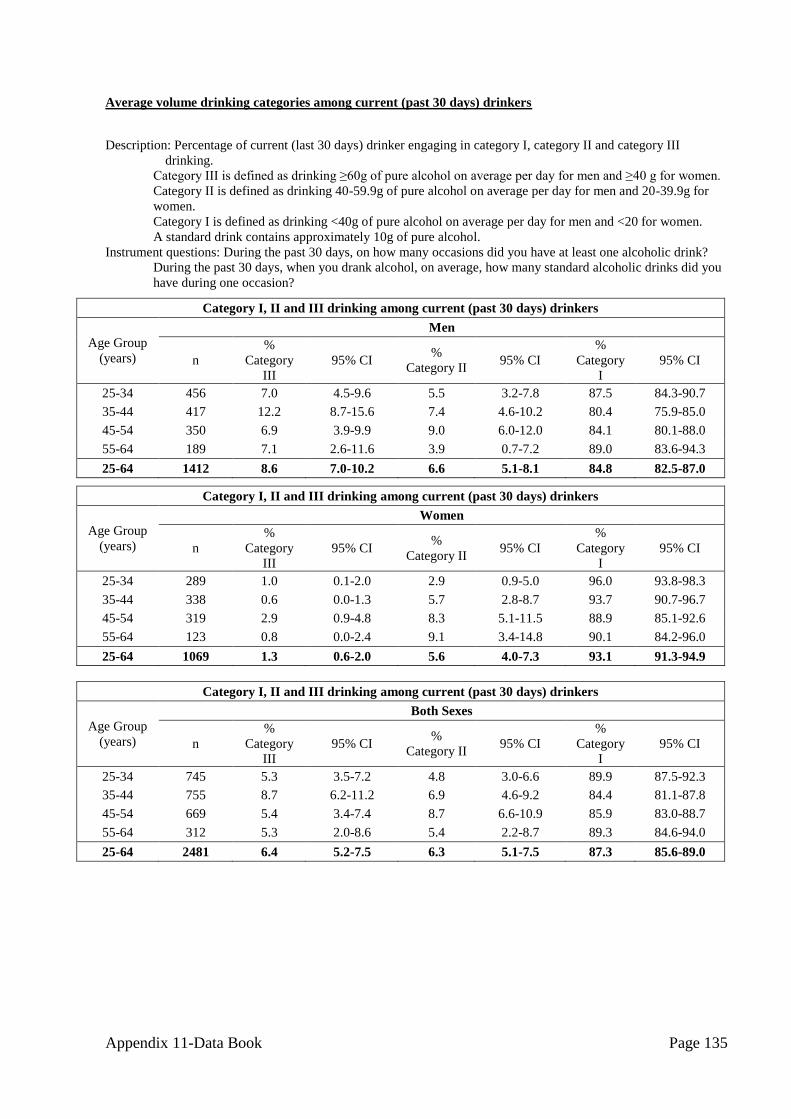
Appendix 11-Data Book Page 135
Average volume drinking categories among current (past 30 days) drinkers
Description: Percentage of current (last 30 days) drinker engaging in category I, category II and category III
drinking.
Category III is defined as drinking ≥60g of pure alcohol on average per day for men and ≥40 g for women.
Category II is defined as drinking 40-59.9g of pure alcohol on average per day for men and 20-39.9g for
women.
Category I is defined as drinking <40g of pure alcohol on average per day for men and <20 for women.
A standard drink contains approximately 10g of pure alcohol.
Instrument questions: During the past 30 days, on how many occasions did you have at least one alcoholic drink?
During the past 30 days, when you drank alcohol, on average, how many standard alcoholic drinks did you
have during one occasion?
Category I, II and III drinking among current (past 30 days) drinkers
Age Group
(years)
Men
n
%
Category
III
95% CI %
Category II 95% CI
%
Category
I
95% CI
25-34 456 7.0 4.5-9.6 5.5 3.2-7.8 87.5 84.3-90.7
35-44 417 12.2 8.7-15.6 7.4 4.6-10.2 80.4 75.9-85.0
45-54 350 6.9 3.9-9.9 9.0 6.0-12.0 84.1 80.1-88.0
55-64 189 7.1 2.6-11.6 3.9 0.7-7.2 89.0 83.6-94.3
25-64 1412 8.6 7.0-10.2 6.6 5.1-8.1 84.8 82.5-87.0
Category I, II and III drinking among current (past 30 days) drinkers
Age Group
(years)
Women
n
%
Category
III
95% CI %
Category II 95% CI
%
Category
I
95% CI
25-34 289 1.0 0.1-2.0 2.9 0.9-5.0 96.0 93.8-98.3
35-44 338 0.6 0.0-1.3 5.7 2.8-8.7 93.7 90.7-96.7
45-54 319 2.9 0.9-4.8 8.3 5.1-11.5 88.9 85.1-92.6
55-64 123 0.8 0.0-2.4 9.1 3.4-14.8 90.1 84.2-96.0
25-64 1069 1.3 0.6-2.0 5.6 4.0-7.3 93.1 91.3-94.9
Category I, II and III drinking among current (past 30 days) drinkers
Age Group
(years)
Both Sexes
n
%
Category
III
95% CI %
Category II 95% CI
%
Category
I
95% CI
25-34 745 5.3 3.5-7.2 4.8 3.0-6.6 89.9 87.5-92.3
35-44 755 8.7 6.2-11.2 6.9 4.6-9.2 84.4 81.1-87.8
45-54 669 5.4 3.4-7.4 8.7 6.6-10.9 85.9 83.0-88.7
55-64 312 5.3 2.0-8.6 5.4 2.2-8.7 89.3 84.6-94.0
25-64 2481 6.4 5.2-7.5 6.3 5.1-7.5 87.3 85.6-89.0

Appendix 11-Data Book Page 136
Largest number of drinks in the past 30 days
Description: Largest number of drinks consumed during a single occasion in the past 30 days among current
(past 30 days) drinker).
Instrument question: During the past 30 days what was the largest number of standard alcoholic drinks you
had on a single occasion, counting all types of alcoholic drinks together?
Mean maximum number of drinks consumed on one occasion in the past 30 days
Age Group
(years)
Men Women Both Sexes
n
Mean
maximum
number
95% CI n
Mean
maximum
number
95% CI n
Mean
maximum
number
95% CI
25-34 456 8.1 7.1-9.2 289 2.4 2.0-2.8 745 6.5 5.7-7.3
35-44 417 7.8 6.8-8.7 336 2.6 2.1-3.1 753 6.2 5.5-6.9
45-54 351 7.0 6.1-7.9 320 2.1 1.8-2.3 671 5.2 4.6-5.8
55-64 190 6.1 4.9-7.4 123 2.0 1.6-2.4 313 4.9 4.0-5.8
25-64 1414 7.6 7.0-8.2 1068 2.3 2.1-2.6 2482 6.0 5.5-6.5
Five/four or more drinks on a single occasion
Description: Percentage of men who had five or more/women who had four or more drinks on any day in the
past 30 days during a single occasion among the total population.
Instrument question: During the past 30 days, how many times did you have
for men: five or more
for women: four or more
standard alcoholic drinks in a single drinking occasion?
Five/four or more drinks on a single occasion at least once during the past 30 days
among total population
Age Group
(years)
Men Women
n % ≥ 5
drinks 95% CI n
% ≥
4drinks 95% CI
25-34 544 53.1 47.6-58.6 910 5.0 3.2-6.8
35-44 535 48.6 43.5-53.6 966 5.6 4.0-7.2
45-54 496 38.7 34.2-43.3 958 3.5 2.3-4.8
55-64 362 22.7 18.0-27.3 662 2.8 1.2-4.4
25-64 1937 45.1 41.9-48.3 3496 4.6 3.5-5.6
Five/four or more drinks on a single occasion
Description: Mean number of times in the past 30 days on which current (past 30 days) drinker drank five (for
men)/four (for women) or more drinks during a single occasion among current (past 30 days)
drinkers.
Instrument question: During the past 30 days, how many times did you have
for men: five or more
for women: four or more
standard alcoholic drinks in a single drinking occasion?

Appendix 11-Data Book Page 137
Mean number of times with five/four or more drinks during a single occasion in
the past 30 days among current drinkers
Age Group
(years)
Men Women
n
Mean
number
of times
95% CI n
Mean
number
of times
95% CI
25-34 453 3.3 2.8-3.9 289 0.5 0.2-0.7
35-44 413 4.0 3.2-4.7 336 0.4 0.2-0.5
45-54 347 3.3 2.6-3.9 320 0.4 0.2-0.7
55-64 188 2.4 1.6-3.3 122 0.3 0.0-0.5
25-64 1401 3.4 3.0-3.8 1067 0.4 0.3-0.6
Drinking with meals
Description: Percentage of current (past 30 days) drinkers who usually, sometimes, rarely or never drink with
meals.
Instrument questions: During the past 30 days, when you consumed an alcoholic drink, how often was it with
meals? (Please do not count snacks)
Drinking with meals among current drinker
Age
Group
(years)
Men
n % Usually
with meals 95% CI
%
Sometimes
with meals
95% CI
% Rarely
with
meals
95% CI
% Never
with
meals
95% CI
25-34 460 42.1 35.8-
48.5 24.8 19.1-30.4 11.1 7.5-14.7 22.0 17.2-26.8
35-44 419 42.3 36.1-
48.6 27.3 21.8-32.8 10.8 7.6-14.0 19.5 14.8-24.3
45-54 352 47.4 40.6-
54.2 29.6 24.1-35.1 6.0 3.2-8.7 17.1 12.5-21.6
55-64 190 52.2 43.5-
60.9 23.4 15.9-30.8 8.8 4.5-13.1 15.7 9.9-21.5
25-64 1421 44.0 39.5-
48.5 26.4 22.9-29.8 9.8 7.6-12.0 19.8 16.3-23.3
Drinking with meals among current drinker
Age Group
(years)
Women
n % Usually
with meals 95% CI
%
Sometimes
with meals
95% CI
%
Rarely
with
meals
95% CI
% Never
with
meals
95% CI
25-34 290 47.2 39.5-55.0 17.2 12.4-22.1 8.6 5.4-11.9 26.9 20.1-33.8
35-44 340 48.0 40.4-55.6 19.4 14.7-24.2 8.5 4.9-12.2 24.0 18.4-29.6
45-54 321 47.2 39.5-55.0 18.4 13.9-22.9 10.1 6.1-14.2 24.2 18.0-30.3
55-64 124 55.1 43.3-66.9 18.2 10.4-25.9 9.3 3.1-15.5 17.4 9.3-25.6
25-64 1075 48.1 42.7-53.5 18.3 15.2-21.3 9.0 6.5-11.5 24.6 20.3-28.9

Appendix 11-Data Book Page 138
Drinking with meals among current drinker
Age
Group
(years)
Both Sexes
n % Usually
with meals 95% CI
%
Sometimes
with meals
95% CI
% Rarely
with
meals
95% CI
% Never
with
meals
95% CI
25-34 750 43.6 38.2-
49.0 22.7 18.3-27.0 10.4 7.6-13.2 23.4 19.2-27.6
35-44 759 44.0 38.4-
49.7 25.0 20.7-29.2 10.1 7.5-12.7 20.9 16.7-25.1
45-54 673 47.3 41.3-
53.3 25.5 21.3-29.6 7.5 5.3-9.7 19.7 15.6-23.7
55-64 314 53.0 45.3-
60.8 21.9 16.2-27.6 8.9 5.4-12.4 16.2 11.2-21.2
25-64 2496 45.3 41.0-
49.6 23.9 21.1-26.7 9.6 7.8-11.4 21.2 17.9-24.5
Past 7 days drinking
Description: Frequency and quantity of drinks consumed in the past 7 days by current (past 30 days) drinkers,
grouped into three categories.
Instrument question: During each of the past 7 days, how many standard drinks of any alcoholic drink did you
have each day?
Frequency and quantity of drinks consumed in the past 7 days
Age Group
(years)
Men
n
% Drank
on 4+
days
95% CI
% 5+
drinks on
any day
95% CI
% 20+
drinks in 7
days
95% CI
25-34 439 24.6 20.4-28.8 35.8 30.1-41.5 16.7 13.0-20.5
35-44 398 34.6 29.5-39.7 36.8 31.0-42.6 21.7 17.4-26.1
45-54 339 32.9 27.5-38.2 32.9 27.8-38.0 19.7 14.8-24.5
55-64 179 32.9 25.4-40.5 21.1 14.7-27.5 15.8 9.9-21.7
25-64 1355 30.0 27.3-32.7 34.3 30.6-38.1 18.8 16.2-21.4
Frequency and quantity of drinks consumed in the past 7 days
Age Group
(years)
Women
n
% Drank
on 4+
days
95% CI
% 4+
drinks on
any day
95% CI
% 15+
drinks in 7
days
95% CI
25-34 282 10.5 6.2-14.8 4.5 1.9-7.2 1.5 0.2-2.8
35-44 325 20.3 15.1-25.5 6.5 3.7-9.2 2.4 0.8-4.0
45-54 315 24.4 18.6-30.2 4.5 2.3-6.8 4.6 2.3-6.9
55-64 121 34.7 24.9-44.6 2.6 0.0-5.6 2.9 0.2-5.6
25-64 1043 18.9 15.7-22.2 5.0 3.4-6.5 2.7 1.7-3.6
Frequency and quantity of drinks consumed in the past 7 days
Age Group
(years)
Both Sexes
n % Drank on
4+ days 95% CI
25-34 721 20.6 17.3-23.9
35-44 723 30.3 26.3-34.3
45-54 654 29.7 25.8-33.6
55-64 300 33.5 26.9-40.0
25-64 2398 26.6 24.4-28.8
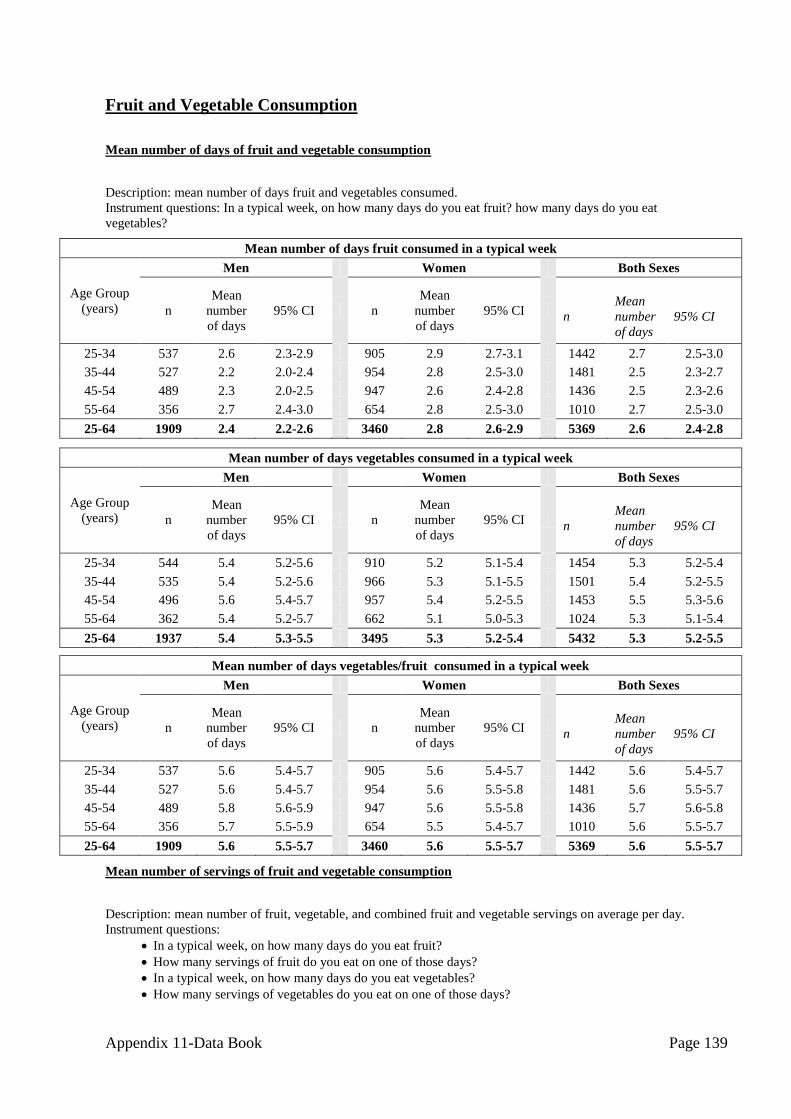
Appendix 11-Data Book Page 139
Fruit and Vegetable Consumption
Mean number of days of fruit and vegetable consumption
Description: mean number of days fruit and vegetables consumed.
Instrument questions: In a typical week, on how many days do you eat fruit? how many days do you eat
vegetables?
Mean number of days fruit consumed in a typical week
Age Group
(years)
Men Women Both Sexes
n
Mean
number
of days
95% CI n
Mean
number
of days
95% CI n
Mean
number
of days
95% CI
25-34 537 2.6 2.3-2.9 905 2.9 2.7-3.1 1442 2.7 2.5-3.0
35-44 527 2.2 2.0-2.4 954 2.8 2.5-3.0 1481 2.5 2.3-2.7
45-54 489 2.3 2.0-2.5 947 2.6 2.4-2.8 1436 2.5 2.3-2.6
55-64 356 2.7 2.4-3.0 654 2.8 2.5-3.0 1010 2.7 2.5-3.0
25-64 1909 2.4 2.2-2.6 3460 2.8 2.6-2.9 5369 2.6 2.4-2.8
Mean number of days vegetables consumed in a typical week
Age Group
(years)
Men Women Both Sexes
n
Mean
number
of days
95% CI n
Mean
number
of days
95% CI n
Mean
number
of days
95% CI
25-34 544 5.4 5.2-5.6 910 5.2 5.1-5.4 1454 5.3 5.2-5.4
35-44 535 5.4 5.2-5.6 966 5.3 5.1-5.5 1501 5.4 5.2-5.5
45-54 496 5.6 5.4-5.7 957 5.4 5.2-5.5 1453 5.5 5.3-5.6
55-64 362 5.4 5.2-5.7 662 5.1 5.0-5.3 1024 5.3 5.1-5.4
25-64 1937 5.4 5.3-5.5 3495 5.3 5.2-5.4 5432 5.3 5.2-5.5
Mean number of days vegetables/fruit consumed in a typical week
Age Group
(years)
Men Women Both Sexes
n
Mean
number
of days
95% CI n
Mean
number
of days
95% CI n
Mean
number
of days
95% CI
25-34 537 5.6 5.4-5.7 905 5.6 5.4-5.7 1442 5.6 5.4-5.7
35-44 527 5.6 5.4-5.7 954 5.6 5.5-5.8 1481 5.6 5.5-5.7
45-54 489 5.8 5.6-5.9 947 5.6 5.5-5.8 1436 5.7 5.6-5.8
55-64 356 5.7 5.5-5.9 654 5.5 5.4-5.7 1010 5.6 5.5-5.7
25-64 1909 5.6 5.5-5.7 3460 5.6 5.5-5.7 5369 5.6 5.5-5.7
Mean number of servings of fruit and vegetable consumption
Description: mean number of fruit, vegetable, and combined fruit and vegetable servings on average per day.
Instrument questions:
In a typical week, on how many days do you eat fruit?
How many servings of fruit do you eat on one of those days?
In a typical week, on how many days do you eat vegetables?
How many servings of vegetables do you eat on one of those days?

Appendix 11-Data Book Page 140
Mean number of servings of fruit on average per day
Age Group
(years)
Men Women Both Sexes
n
Mean
number
of
servings
95% CI n
Mean
number
of
servings
95% CI n
Mean
number
of
servings
95% CI
25-34 536 1.1 0.9-1.3 905 1.1 1.0-1.2 1441 1.1 1.0-1.2
35-44 527 0.9 0.8-1.1 954 1.1 0.9-1.2 1481 1.0 0.9-1.1
45-54 489 0.9 0.8-1.1 947 0.9 0.8-1.0 1436 0.9 0.8-1.0
55-64 356 1.1 0.9-1.3 654 1.1 0.9-1.2 1010 1.1 0.9-1.2
25-64 1908 1.0 0.9-1.1 3460 1.1 1.0-1.1 5368 1.0 0.9-1.1
Mean number of servings of vegetables on average per day
Age Group
(years)
Men Women Both Sexes
n
Mean
number
of
servings
95% CI n
Mean
number
of
servings
95% CI n
Mean
number
of
servings
95% CI
25-34 544 2.1 1.9-2.2 910 1.9 1.7-2.0 1454 2.0 1.8-2.1
35-44 535 2.0 1.9-2.2 966 1.9 1.7-2.0 1501 2.0 1.8-2.1
45-54 496 2.1 1.9-2.3 957 1.9 1.8-2.0 1453 2.0 1.9-2.1
55-64 362 2.0 1.8-2.2 662 1.8 1.6-2.0 1024 1.9 1.8-2.1
25-64 1937 2.1 1.9-2.2 3495 1.9 1.8-2.0 5432 2.0 1.8-2.1
Mean number of servings of fruit and/or vegetables on average per day
Age Group
(years)
Men Women Both Sexes
n
Mean
number
of
servings
95% CI n
Mean
number
of
servings
95% CI n
Mean
number
of
servings
95% CI
25-34 544 3.1 2.9-3.4 910 3.0 2.8-3.2 1454 3.1 2.9-3.3
35-44 535 2.9 2.7-3.2 966 2.9 2.7-3.1 1501 2.9 2.8-3.1
45-54 496 3.0 2.8-3.3 957 2.8 2.6-3.0 1453 2.9 2.7-3.1
55-64 362 3.1 2.8-3.4 662 2.8 2.6-3.1 1024 3.0 2.8-3.2
25-64 1937 3.1 2.9-3.2 3495 2.9 2.8-3.1 5432 3.0 2.8-3.1

Appendix 11-Data Book Page 141
Fruit and vegetable consumption per day
Description: Frequency of fruit and/or vegetable consumption.
Instrument questions:
In a typical week, on how many days do you eat fruit?
How many servings of fruit do you eat on one of those days?
In a typical week, on how many days do you eat vegetables?
How many servings of vegetables do you eat on one of those days?
Number of servings of fruit and/or vegetables on average per day
Age
Group
(years)
Men
n
% no fruit
and/or
vegetables
95% CI % 1-2
servings 95% CI
% 3-4
servings 95% CI
% ≥5
servings 95% CI
25-34 544 11.1 8.2-14.1 44.6 39.8-49.4 25.9 21.6-30.3 18.3 14.3-22.3
35-44 535 12.2 9.1-15.2 46.9 42.0-51.7 27.6 23.6-31.7 13.4 9.8-16.9
45-54 496 9.8 7.0-12.6 48.9 43.9-53.9 24.1 19.9-28.2 17.3 13.1-21.4
55-64 362 9.0 5.7-12.4 47.4 41.0-53.8 24.6 19.5-29.6 19.0 13.8-24.2
25-64 1937 10.9 9.1-12.7 46.5 43.3-49.7 25.9 23.4-28.5 16.7 13.8-19.5
Number of servings of fruit and/or vegetables on average per day
Age
Group
(years)
Women
n
% no fruit
and/or
vegetables
95% CI % 1-2
servings 95% CI
% 3-4
servings 95% CI
% ≥5
servings 95% CI
25-34 910 11.9 9.0-14.8 48.0 44.1-51.8 24.5 21.4-27.5 15.7 12.5-18.9
35-44 966 11.0 8.5-13.6 49.9 46.2-53.6 25.1 21.8-28.3 14.0 11.3-16.8
45-54 957 11.5 9.2-13.7 50.5 46.5-54.6 24.4 21.1-27.6 13.6 10.5-16.8
55-64 662 13.2 9.8-16.5 49.9 45.3-54.5 21.6 17.8-25.3 15.3 11.9-18.7
25-64 3495 11.7 9.9-13.5 49.3 46.8-51.9 24.2 22.4-26.1 14.7 12.5-16.9
Number of servings of fruit and/or vegetables on average per day
Age
Group
(years)
Both Sexes
n
% no fruit
and/or
vegetables
95% CI % 1-2
servings 95% CI
% 3-4
servings 95% CI
% ≥5
servings 95% CI
25-34 1454 11.5 9.2-13.7 46.3 43.1-49.5 25.2 22.5-27.9 17.0 14.0-19.9
35-44 1501 11.6 9.6-13.6 48.3 45.2-51.5 26.4 23.6-29.2 13.7 11.1-16.3
45-54 1453 10.7 8.8-12.7 49.8 46.4-53.2 24.2 21.4-27.0 15.2 12.4-18.1
55-64 1024 11.2 8.7-13.7 48.7 44.6-52.9 23.0 19.8-26.2 17.1 13.5-20.6
25-64 5432 11.3 9.8-12.8 48.0 45.6-50.3 25.1 23.2-26.9 15.7 13.4-17.9
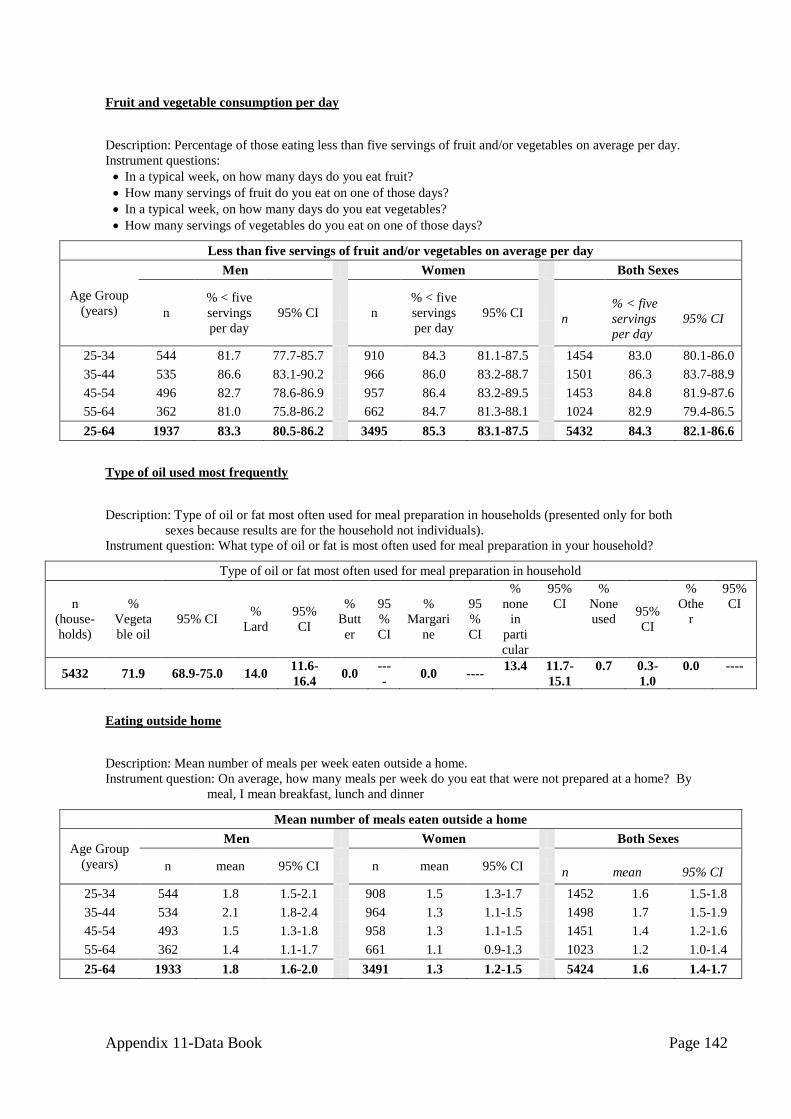
Appendix 11-Data Book Page 142
Fruit and vegetable consumption per day
Description: Percentage of those eating less than five servings of fruit and/or vegetables on average per day.
Instrument questions:
In a typical week, on how many days do you eat fruit?
How many servings of fruit do you eat on one of those days?
In a typical week, on how many days do you eat vegetables?
How many servings of vegetables do you eat on one of those days?
Less than five servings of fruit and/or vegetables on average per day
Age Group
(years)
Men Women Both Sexes
n
% < five
servings
per day
95% CI n
% < five
servings
per day
95% CI n
% < five
servings
per day
95% CI
25-34 544 81.7 77.7-85.7 910 84.3 81.1-87.5 1454 83.0 80.1-86.0
35-44 535 86.6 83.1-90.2 966 86.0 83.2-88.7 1501 86.3 83.7-88.9
45-54 496 82.7 78.6-86.9 957 86.4 83.2-89.5 1453 84.8 81.9-87.6
55-64 362 81.0 75.8-86.2 662 84.7 81.3-88.1 1024 82.9 79.4-86.5
25-64 1937 83.3 80.5-86.2 3495 85.3 83.1-87.5 5432 84.3 82.1-86.6
Type of oil used most frequently
Description: Type of oil or fat most often used for meal preparation in households (presented only for both
sexes because results are for the household not individuals).
Instrument question: What type of oil or fat is most often used for meal preparation in your household?
Type of oil or fat most often used for meal preparation in household
n
(house-
holds)
%
Vegeta
ble oil
95% CI %
Lard
95%
CI
%
Butt
er
95
%
CI
%
Margari
ne
95
%
CI
%
none
in
parti
cular
95%
CI
%
None
used 95%
CI
%
Othe
r
95%
CI
5432 71.9 68.9-75.0 14.0 11.6-
16.4 0.0
---
- 0.0 ----
13.4 11.7-
15.1
0.7 0.3-
1.0
0.0 ----
Eating outside home
Description: Mean number of meals per week eaten outside a home.
Instrument question: On average, how many meals per week do you eat that were not prepared at a home? By
meal, I mean breakfast, lunch and dinner
Mean number of meals eaten outside a home
Age Group
(years)
Men Women Both Sexes
n mean 95% CI n mean 95% CI n mean 95% CI
25-34 544 1.8 1.5-2.1 908 1.5 1.3-1.7 1452 1.6 1.5-1.8
35-44 534 2.1 1.8-2.4 964 1.3 1.1-1.5 1498 1.7 1.5-1.9
45-54 493 1.5 1.3-1.8 958 1.3 1.1-1.5 1451 1.4 1.2-1.6
55-64 362 1.4 1.1-1.7 661 1.1 0.9-1.3 1023 1.2 1.0-1.4
25-64 1933 1.8 1.6-2.0 3491 1.3 1.2-1.5 5424 1.6 1.4-1.7
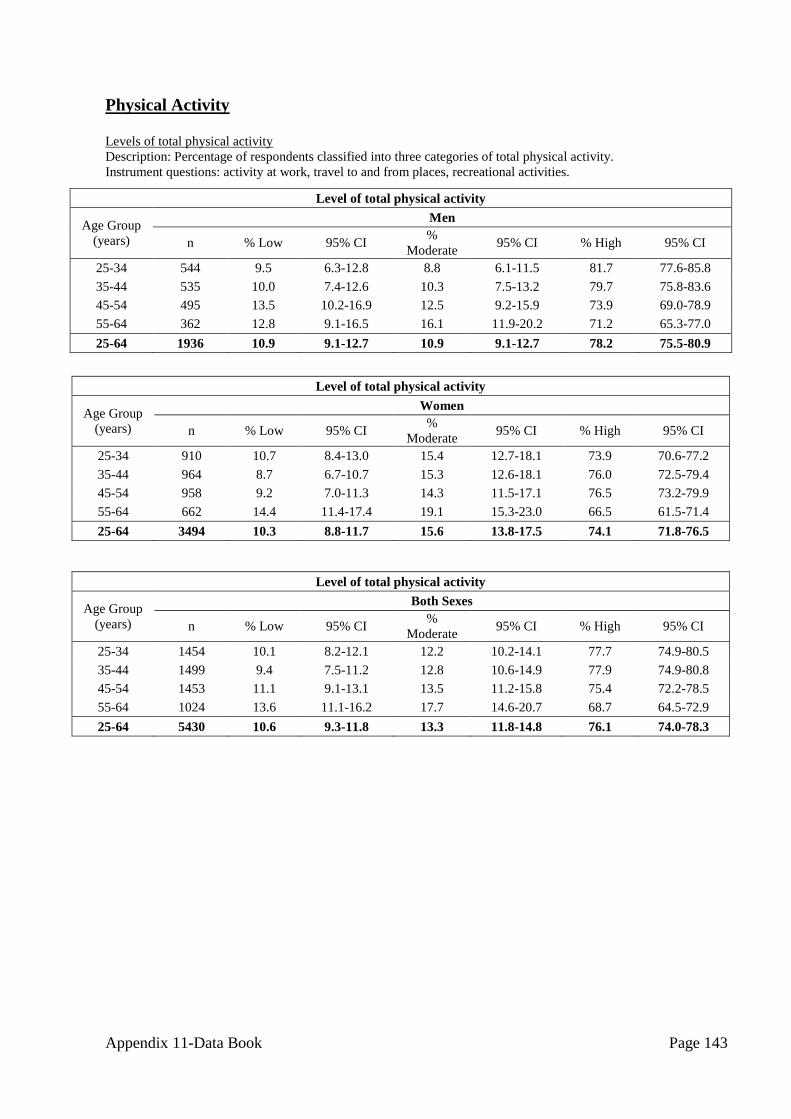
Appendix 11-Data Book Page 143
Physical Activity
Levels of total physical activity
Description: Percentage of respondents classified into three categories of total physical activity.
Instrument questions: activity at work, travel to and from places, recreational activities.
Level of total physical activity
Age Group
(years)
Women
n % Low 95% CI %
Moderate 95% CI % High 95% CI
25-34 910 10.7 8.4-13.0 15.4 12.7-18.1 73.9 70.6-77.2
35-44 964 8.7 6.7-10.7 15.3 12.6-18.1 76.0 72.5-79.4
45-54 958 9.2 7.0-11.3 14.3 11.5-17.1 76.5 73.2-79.9
55-64 662 14.4 11.4-17.4 19.1 15.3-23.0 66.5 61.5-71.4
25-64 3494 10.3 8.8-11.7 15.6 13.8-17.5 74.1 71.8-76.5
Level of total physical activity
Age Group
(years)
Both Sexes
n % Low 95% CI %
Moderate 95% CI % High 95% CI
25-34 1454 10.1 8.2-12.1 12.2 10.2-14.1 77.7 74.9-80.5
35-44 1499 9.4 7.5-11.2 12.8 10.6-14.9 77.9 74.9-80.8
45-54 1453 11.1 9.1-13.1 13.5 11.2-15.8 75.4 72.2-78.5
55-64 1024 13.6 11.1-16.2 17.7 14.6-20.7 68.7 64.5-72.9
25-64 5430 10.6 9.3-11.8 13.3 11.8-14.8 76.1 74.0-78.3
Level of total physical activity
Age Group
(years)
Men
n % Low 95% CI %
Moderate 95% CI % High 95% CI
25-34 544 9.5 6.3-12.8 8.8 6.1-11.5 81.7 77.6-85.8
35-44 535 10.0 7.4-12.6 10.3 7.5-13.2 79.7 75.8-83.6
45-54 495 13.5 10.2-16.9 12.5 9.2-15.9 73.9 69.0-78.9
55-64 362 12.8 9.1-16.5 16.1 11.9-20.2 71.2 65.3-77.0
25-64 1936 10.9 9.1-12.7 10.9 9.1-12.7 78.2 75.5-80.9
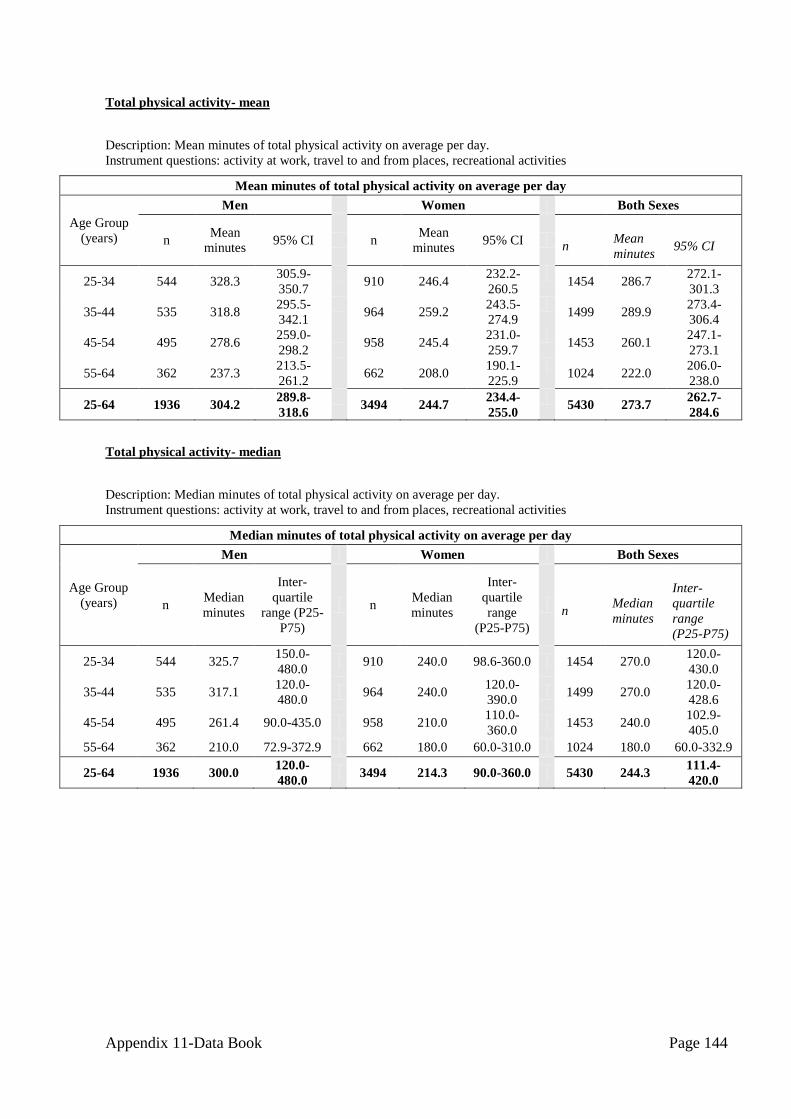
Appendix 11-Data Book Page 144
Total physical activity- mean
Description: Mean minutes of total physical activity on average per day.
Instrument questions: activity at work, travel to and from places, recreational activities
Mean minutes of total physical activity on average per day
Age Group
(years)
Men Women Both Sexes
n Mean
minutes 95% CI n
Mean
minutes 95% CI n
Mean
minutes 95% CI
25-34 544 328.3 305.9-
350.7
910 246.4
232.2-
260.5
1454 286.7
272.1-
301.3
35-44 535 318.8 295.5-
342.1
964 259.2
243.5-
274.9
1499 289.9
273.4-
306.4
45-54 495 278.6 259.0-
298.2
958 245.4
231.0-
259.7
1453 260.1
247.1-
273.1
55-64 362 237.3 213.5-
261.2
662 208.0
190.1-
225.9
1024 222.0
206.0-
238.0
25-64 1936 304.2 289.8-
318.6
3494 244.7
234.4-
255.0
5430 273.7
262.7-
284.6
Total physical activity- median
Description: Median minutes of total physical activity on average per day.
Instrument questions: activity at work, travel to and from places, recreational activities
Median minutes of total physical activity on average per day
Age Group
(years)
Men Women Both Sexes
n Median
minutes
Inter-
quartile
range (P25-
P75)
n Median
minutes
Inter-
quartile
range
(P25-P75)
n Median
minutes
Inter-
quartile
range
(P25-P75)
25-34 544 325.7 150.0-
480.0 910 240.0 98.6-360.0 1454 270.0
120.0-
430.0
35-44 535 317.1 120.0-
480.0 964 240.0
120.0-
390.0 1499 270.0
120.0-
428.6
45-54 495 261.4 90.0-435.0 958 210.0 110.0-
360.0 1453 240.0
102.9-
405.0
55-64 362 210.0 72.9-372.9 662 180.0 60.0-310.0 1024 180.0 60.0-332.9
25-64 1936 300.0 120.0-
480.0 3494 214.3 90.0-360.0 5430 244.3
111.4-
420.0

Appendix 11-Data Book Page 145
Domain-specific physical activity- mean
Description: Mean minutes spent in work-, transport- and recreation-related physical activity on average per
day.
Instrument questions: activity at work, travel to and from places, recreational activities
Mean minutes of work-related physical activity on average per day
Age Group
(years)
Men Women Both Sexes
n Mean
minutes 95% CI n
Mean
minutes 95% CI
n Mean
minutes 95% CI
25-34 544 287.2 265.8-
308.7
910 223.8
209.5-
238.0
1454 255.0
240.8-
269.2
35-44 535 287.4 264.9-
309.9
964 231.3
216.7-
246.0
1499 260.2
244.3-
276.0
45-54 495 251.2 232.6-
269.7
958 219.7
205.4-
233.9
1453 233.7
221.1-
246.3
55-64 362 214.2 191.0-
237.5
662 183.4
167.0-
199.7
1024 198.1
182.8-
213.4
25-64 1936 271.0 256.9-
285.2
3494 219.7
209.5-
229.9
5430 244.7
233.9-
255.5
Mean minutes of transport-related physical activity on average per day
Age Group
(years)
Men Women Both Sexes
n Mean
minutes 95% CI n
Mean
minutes 95% CI n
Mean
minutes 95% CI
25-34 544 24.9 20.6-29.2 910 20.5 17.5-23.4 1454 22.7 19.8-25.5
35-44 535 24.2 20.3-28.1 964 26.0 22.6-29.3 1499 25.0 22.4-27.7
45-54 495 22.7 18.6-26.7 958 21.5 18.5-24.6 1453 22.0 19.4-24.7
55-64 362 17.9 14.4-21.5 662 19.0 15.5-22.6 1024 18.5 15.9-21.1
25-64 1936 23.4 20.8-25.9 3494 22.0 20.1-24.0 5430 22.7 20.8-24.6
Mean minutes of recreation-related physical activity on average per day
Age Group
(years)
Men Women Both Sexes
n Mean
minutes 95% CI n
Mean
minutes 95% CI
n Mean
minutes 95% CI
25-34 544 16.2 11.6-20.7 910 2.1 0.9-3.3 1454 9.0 6.7-11.3
35-44 535 7.3 4.9-9.6 964 1.9 1.1-2.7 1499 4.7 3.4-5.9
45-54 495 4.8 2.9-6.6 958 4.2 2.7-5.6 1453 4.4 3.3-5.6
55-64 362 5.1 3.3-7.0 662 5.6 3.9-7.4 1024 5.4 4.0-6.8
25-64 1936 9.8 7.9-11.7 3494 3.0 2.2-3.8 5430 6.3 5.3-7.3

Appendix 11-Data Book Page 146
Domain-specific physical activity – median
Description: Median minutes spent on average per day in work-, transport- and recreation-related physical
activity.
Instrument questions: activity at work, travel to and from places, recreational activities
Median minutes of work-related physical activity on average per day
Age Group
(years)
Men Women Both Sexes
n Median
minutes
Inter-
quartile
range (P25-
P75)
n Median
minutes
Inter-
quartile
range
(P25-P75)
n
Median
minutes
Inter-
quartile
range
(P25-P75)
25-34 544 300.0 120.0-
471.4 910 180.0 60.0-360.0 1454 240.0 90.0-420.0
35-44 535 300.0 102.9-
450.0 964 180.0 90.0-360.0 1499 240.0 90.0-420.0
45-54 495 240.0 68.6-420.0 958 180 64.3-360.0 1453 210.0 68.6-360.0
55-64 362 180.0 51.4-360 662 124.3 42.9-300.0 1024 162.9 45.0-300.0
25-64 1936 257.1 90.0-420.0 3494 180.0 60.0-360.0 5430 240.0 72.9-390.0
Median minutes of transport-related physical activity on average per day
Age Group
(years)
Men Women Both Sexes
n Median
minutes
Inter-
quartile
range (P25-
P75)
n Median
minutes
Inter-
quartile
range
(P25-P75)
n Median
minutes
Inter-
quartile
range
(P25-P75)
25-34 544 0.0 0.0-30.0 910 0.0 0.0-23.6 1454 0.0 0.0-30.0
35-44 535 0.0 0.0-30.0 964 4.3 0.0-30.0 1499 0.0 0.0-30.0
45-54 495 0.0 0.0-30.0 958 0.0 0.0-30.0 1453 0.0 0.0-30.0
55-64 362 0.0 0.0-25.7 662 0.0 0.0-20.0 1024 0.0 0.0-21.4
25-64 1936 0.0 0.0-30.0 3494 0.0 0.0-30.0 5430 0.0 0.0-30.0
dian minutes of recreation-related physical activity on average per day
Age Group
(years)
Men Women Both Sexes
n Median
minutes
Inter-
quartile
range (P25-
P75)
n Median
minutes
Inter-
quartile
range
(P25-P75)
n
Median
minutes
Inter-
quartile
range
(P25-P75)
25-34 544 0.0 0.0-2.1 910 0.0 0.0-0.0 1454 0.0 0.0-0.0
35-44 535 0.0 0.0-0.0 964 0.0 0.0-0.0 1499 0.0 0.0-0.0
45-54 495 0.0 0.0-0.0 958 0.0 0.0-0.0 1453 0.0 0.0-0.0
55-64 362 0.0 0.0-0.0 662 0.0 0.0-0.0 1024 0.0 0.0-0.0
25-64 1936 0.0 0.0-0.0 3494 0.0 0.0-0.0 5430 0.0 0.0-0.0
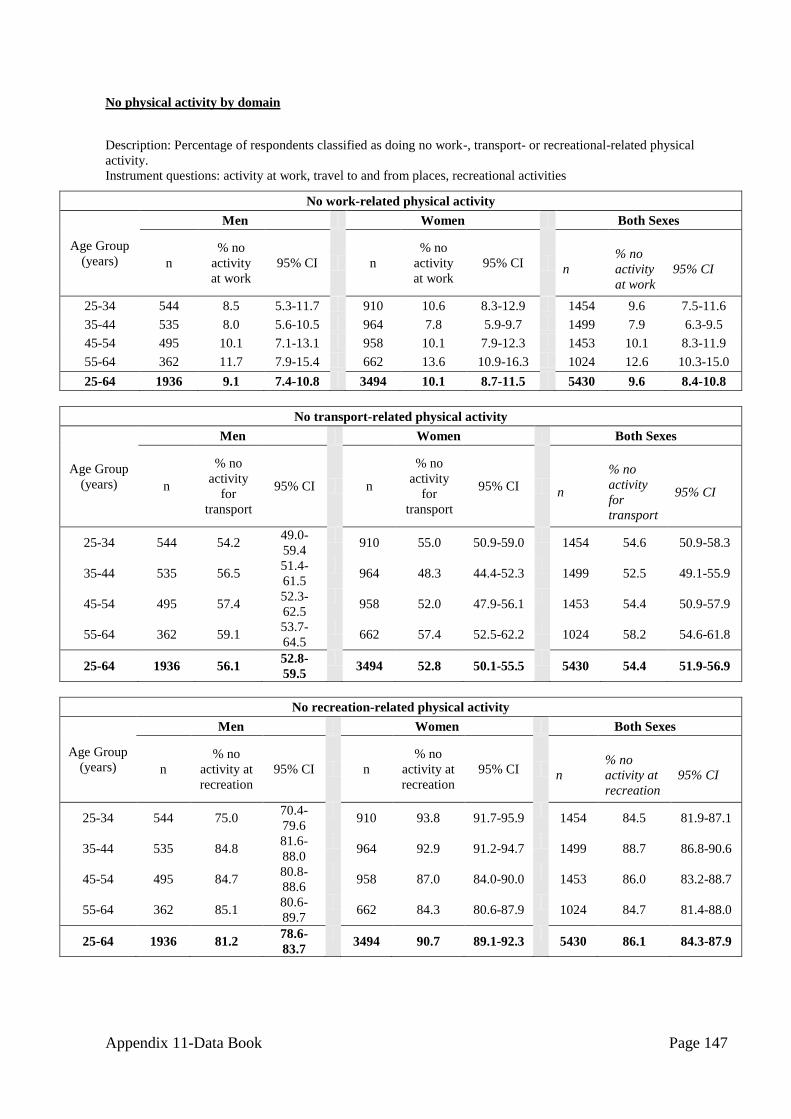
Appendix 11-Data Book Page 147
No physical activity by domain
Description: Percentage of respondents classified as doing no work-, transport- or recreational-related physical
activity.
Instrument questions: activity at work, travel to and from places, recreational activities
No work-related physical activity
Age Group
(years)
Men Women Both Sexes
n
% no
activity
at work
95% CI n
% no
activity
at work
95% CI n
% no
activity
at work
95% CI
25-34 544 8.5 5.3-11.7 910 10.6 8.3-12.9 1454 9.6 7.5-11.6
35-44 535 8.0 5.6-10.5 964 7.8 5.9-9.7 1499 7.9 6.3-9.5
45-54 495 10.1 7.1-13.1 958 10.1 7.9-12.3 1453 10.1 8.3-11.9
55-64 362 11.7 7.9-15.4 662 13.6 10.9-16.3 1024 12.6 10.3-15.0
25-64 1936 9.1 7.4-10.8 3494 10.1 8.7-11.5 5430 9.6 8.4-10.8
No transport-related physical activity
Age Group
(years)
Men Women Both Sexes
n
% no
activity
for
transport
95% CI n
% no
activity
for
transport
95% CI n
% no
activity
for
transport
95% CI
25-34 544 54.2 49.0-
59.4
910 55.0 50.9-59.0
1454 54.6 50.9-58.3
35-44 535 56.5 51.4-
61.5
964 48.3 44.4-52.3
1499 52.5 49.1-55.9
45-54 495 57.4 52.3-
62.5
958 52.0 47.9-56.1
1453 54.4 50.9-57.9
55-64 362 59.1 53.7-
64.5
662 57.4 52.5-62.2
1024 58.2 54.6-61.8
25-64 1936 56.1 52.8-
59.5
3494 52.8 50.1-55.5
5430 54.4 51.9-56.9
No recreation-related physical activity
Age Group
(years)
Men Women Both Sexes
n
% no
activity at
recreation
95% CI n
% no
activity at
recreation
95% CI n
% no
activity at
recreation
95% CI
25-34 544 75.0 70.4-
79.6
910 93.8 91.7-95.9
1454 84.5 81.9-87.1
35-44 535 84.8 81.6-
88.0
964 92.9 91.2-94.7
1499 88.7 86.8-90.6
45-54 495 84.7 80.8-
88.6
958 87.0 84.0-90.0
1453 86.0 83.2-88.7
55-64 362 85.1 80.6-
89.7
662 84.3 80.6-87.9
1024 84.7 81.4-88.0
25-64 1936 81.2 78.6-
83.7
3494 90.7 89.1-92.3
5430 86.1 84.3-87.9

Appendix 11-Data Book Page 148
Composition of total physical activity
Description: Percentage of work, transport and recreational activity contributing to total activity.
Instrument questions: activity at work, travel to and from places, recreational activities
Composition of total physical activity
Age Group
(years)
Men
n % Activity
from work 95% CI
% Activity
for
transport
95% CI
% Activity
during
leisure
time
95% CI
25-34 524 82.0 79.2-84.8 10.3 8.4-12.2 7.7 5.4-10.0
35-44 507 86.7 84.3-89.0 9.7 7.9-11.6 3.6 2.3-4.9
45-54 464 85.5 82.8-88.2 10.4 8.4-12.4 4.1 2.4-5.9
55-64 342 83.0 79.7-86.3 12.4 9.8-15.0 4.6 2.6-6.6
25-64 1837 84.2 82.5-86.0 10.4 9.0-11.8 5.4 4.2-6.5
Composition of total physical activity
Age Group
(years)
Women
n % Activity
from work 95% CI
% Activity
for
transport
95% CI
% Activity
during
leisure
time
95% CI
25-34 849 86.8 84.8-88.9 11.9 10.0-13.7 1.3 0.5-2.1
35-44 917 85.6 83.9-87.3 12.8 11.2-14.5 1.6 0.8-2.3
45-54 905 84.7 82.6-86.7 11.8 10.1-13.5 3.5 2.3-4.7
55-64 605 82.6 80.3-84.9 12.2 10.2-14.2 5.2 3.6-6.8
25-64 3276 85.4 84.1-86.7 12.2 11.0-13.4 2.4 1.7-3.0
Composition of total physical activity
Age Group
(years)
Both Sexes
n % Activity
from work 95% CI
% Activity
for
transport
95% CI
% Activity
during
leisure
time
95% CI
25-34 1373 84.4 82.5-86.3 11.1 9.6-12.5 4.5 3.2-5.8
35-44 1424 86.2 84.6-87.7 11.2 9.9-12.6 2.6 1.8-3.4
45-54 1369 85.0 83.2-86.9 11.2 9.8-12.6 3.8 2.7-4.9
55-64 947 82.8 80.7-84.9 12.3 10.7-13.9 4.9 3.5-6.4
25-64 5113 84.9 83.6-86.2 11.3 10.2-12.4 3.8 3.1-4.6
No vigorous physical activity
Description: Percentage of respondents not engaging in vigorous physical activity.
Instrument questions: activity at work, recreational activities
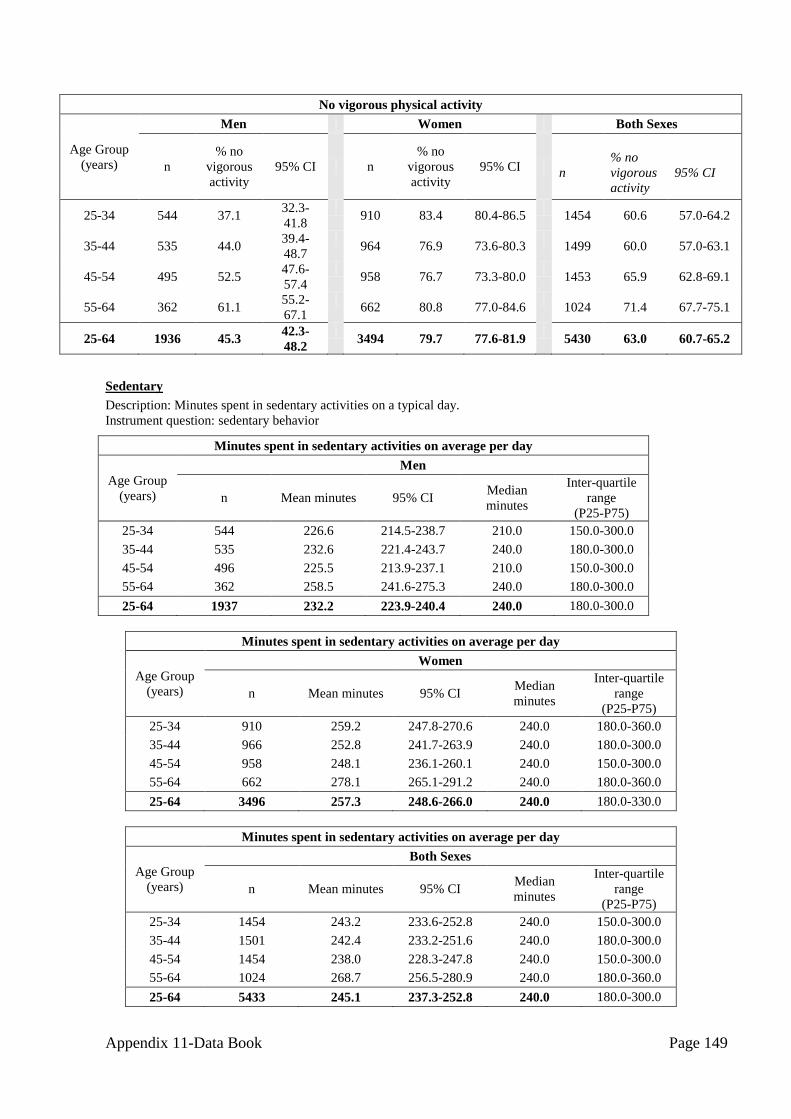
Appendix 11-Data Book Page 149
No vigorous physical activity
Age Group
(years)
Men Women Both Sexes
n
% no
vigorous
activity
95% CI n
% no
vigorous
activity
95% CI n
% no
vigorous
activity
95% CI
25-34 544 37.1 32.3-
41.8
910 83.4 80.4-86.5
1454 60.6 57.0-64.2
35-44 535 44.0 39.4-
48.7
964 76.9 73.6-80.3
1499 60.0 57.0-63.1
45-54 495 52.5 47.6-
57.4
958 76.7 73.3-80.0
1453 65.9 62.8-69.1
55-64 362 61.1 55.2-
67.1
662 80.8 77.0-84.6
1024 71.4 67.7-75.1
25-64 1936 45.3 42.3-
48.2
3494 79.7 77.6-81.9
5430 63.0 60.7-65.2
Sedentary
Description: Minutes spent in sedentary activities on a typical day.
Instrument question: sedentary behavior
Minutes spent in sedentary activities on average per day
Age Group
(years)
Men
n Mean minutes 95% CI Median
minutes
Inter-quartile
range
(P25-P75)
25-34 544 226.6 214.5-238.7 210.0 150.0-300.0
35-44 535 232.6 221.4-243.7 240.0 180.0-300.0
45-54 496 225.5 213.9-237.1 210.0 150.0-300.0
55-64 362 258.5 241.6-275.3 240.0 180.0-300.0
25-64 1937 232.2 223.9-240.4 240.0 180.0-300.0
Minutes spent in sedentary activities on average per day
Age Group
(years)
Women
n Mean minutes 95% CI Median
minutes
Inter-quartile
range
(P25-P75)
25-34 910 259.2 247.8-270.6 240.0 180.0-360.0
35-44 966 252.8 241.7-263.9 240.0 180.0-300.0
45-54 958 248.1 236.1-260.1 240.0 150.0-300.0
55-64 662 278.1 265.1-291.2 240.0 180.0-360.0
25-64 3496 257.3 248.6-266.0 240.0 180.0-330.0
Minutes spent in sedentary activities on average per day
Age Group
(years)
Both Sexes
n Mean minutes 95% CI Median
minutes
Inter-quartile
range
(P25-P75)
25-34 1454 243.2 233.6-252.8 240.0 150.0-300.0
35-44 1501 242.4 233.2-251.6 240.0 180.0-300.0
45-54 1454 238.0 228.3-247.8 240.0 150.0-300.0
55-64 1024 268.7 256.5-280.9 240.0 180.0-360.0
25-64 5433 245.1 237.3-252.8 240.0 180.0-300.0

Appendix 11-Data Book Page 150
Blood Pressure and Diabetes History
Blood pressure measurement and diagnosis
Description: Blood pressure measurement and diagnosis among all respondents.
Instrument questions:
Have you ever had your blood pressure measured by a doctor or other health worker?
Have you ever been told by a doctor or other health worker that you have raised blood pressure or
hypertension?
Have you been told in the past 12 months?
Blood pressure measurement and diagnosis
Age
Group
(years)
Men
n % Never
measured 95% CI
%
measured,
not
diagnosed
95% CI
%
diagnosed,
but not
within past
12 months
95% CI
%
diagnosed
within past
12 months
95% CI
25-34 544 69.2 64.2-74.2 29.2 24.3-34.2 0.8 0.0-1.6 0.8 0.0-1.8
35-44 535 62.7 58.0-67.3 34.0 29.6-38.3 1.3 0.3-2.2 2.1 0.9-3.3
45-54 496 56.3 51.0-61.7 34.0 28.9-39.0 4.2 2.5-6.0 5.5 3.1-7.8
55-64 362 48.9 43.5-54.3 35.5 30.3-40.6 5.2 2.8-7.6 10.5 6.4-14.6
25-64 1937 62.1 58.9-65.3 32.4 29.3-35.4 2.2 1.5-2.8 3.4 2.5-4.2
Blood pressure measurement and diagnosis
Age
Group
(years)
Women
n % Never
measured 95% CI
%
measured,
not
diagnosed
95% CI
%
diagnosed,
but not
within past
12 months
95% CI
%
diagnosed
within past
12 months
95% CI
25-34 910 41.2 37.3-45.0 54.3 50.4-58.2 2.3 1.3-3.3 2.2 1.2-3.3
35-44 966 42.5 38.5-46.6 49.2 45.3-53.1 3.2 2.1-4.4 5.0 3.5-6.5
45-54 958 38.2 34.5-41.9 45.5 41.5-49.4 5.5 3.8-7.3 10.8 8.6-13.0
55-64 662 37.7 32.9-42.5 38.3 34.0-42.7 7.6 5.2-9.9 16.4 12.7-20.1
25-64 3496 40.4 37.8-43.0 48.8 46.3-51.2 4.0 3.2-4.7 6.8 5.9-7.8
Blood pressure measurement and diagnosis
Age
Group
(years)
Both sexes
n
% Never
measure
d
95% CI
%
measured,
not
diagnosed
95% CI
% diagnosed,
but not
within past
12 months
95% CI
%
diagnosed
within past
12 months
95% CI
25-34 1454 54.9 51.4-58.5 42.0 38.4-45.5 1.6 0.9-2.2 1.6 0.8-2.3
35-44 1501 52.9 49.5-56.3 41.4 38.1-44.6 2.2 1.4-3.0 3.5 2.6-4.5
45-54 1454 46.3 42.8-49.7 40.3 36.8-43.9 5.0 3.7-6.2 8.4 6.8-10.1
55-64 1024 43.1 39.3-46.9 36.9 33.5-40.4 6.4 4.9-8.0 13.6 10.5-16.6
25-64 5433 51.0 48.5-53.5 40.8 38.4-43.2 3.1 2.6-3.6 5.1 4.4-5.8
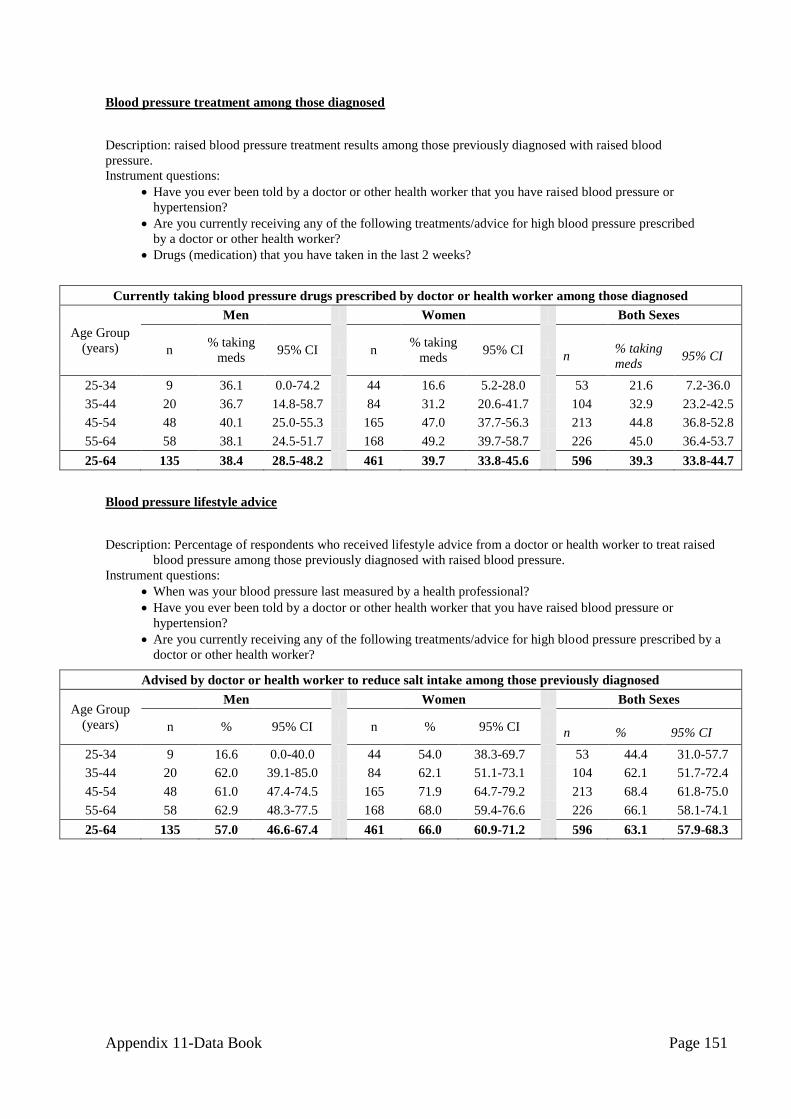
Appendix 11-Data Book Page 151
Blood pressure treatment among those diagnosed
Description: raised blood pressure treatment results among those previously diagnosed with raised blood
pressure.
Instrument questions:
Have you ever been told by a doctor or other health worker that you have raised blood pressure or
hypertension?
Are you currently receiving any of the following treatments/advice for high blood pressure prescribed
by a doctor or other health worker?
Drugs (medication) that you have taken in the last 2 weeks?
Currently taking blood pressure drugs prescribed by doctor or health worker among those diagnosed
Age Group
(years)
Men Women Both Sexes
n % taking
meds 95% CI n
% taking
meds 95% CI
n % taking
meds 95% CI
25-34 9 36.1 0.0-74.2 44 16.6 5.2-28.0 53 21.6 7.2-36.0
35-44 20 36.7 14.8-58.7 84 31.2 20.6-41.7 104 32.9 23.2-42.5
45-54 48 40.1 25.0-55.3 165 47.0 37.7-56.3 213 44.8 36.8-52.8
55-64 58 38.1 24.5-51.7 168 49.2 39.7-58.7 226 45.0 36.4-53.7
25-64 135 38.4 28.5-48.2 461 39.7 33.8-45.6 596 39.3 33.8-44.7
Blood pressure lifestyle advice
Description: Percentage of respondents who received lifestyle advice from a doctor or health worker to treat raised
blood pressure among those previously diagnosed with raised blood pressure.
Instrument questions:
When was your blood pressure last measured by a health professional?
Have you ever been told by a doctor or other health worker that you have raised blood pressure or
hypertension?
Are you currently receiving any of the following treatments/advice for high blood pressure prescribed by a
doctor or other health worker?
Advised by doctor or health worker to reduce salt intake among those previously diagnosed
Age Group
(years)
Men Women Both Sexes
n % 95% CI n % 95% CI n % 95% CI
25-34 9 16.6 0.0-40.0 44 54.0 38.3-69.7 53 44.4 31.0-57.7
35-44 20 62.0 39.1-85.0 84 62.1 51.1-73.1 104 62.1 51.7-72.4
45-54 48 61.0 47.4-74.5 165 71.9 64.7-79.2 213 68.4 61.8-75.0
55-64 58 62.9 48.3-77.5 168 68.0 59.4-76.6 226 66.1 58.1-74.1
25-64 135 57.0 46.6-67.4 461 66.0 60.9-71.2 596 63.1 57.9-68.3

Appendix 11-Data Book Page 152
Advised by doctor or health worker to lose weight among those previously diagnosed
Age Group
(years)
Men Women Both Sexes
n % 95% CI n % 95% CI n % 95% CI
25-34 9 16.6 0.0-40.0 44 29.7 15.3-44.0 53 26.3 14.5-38.1
35-44 20 39.8 17.2-62.4 84 40.8 30.1-51.4 104 40.5 30.1-50.9
45-54 48 55.2 40.6-69.7 165 48.4 40.4-56.5 213 50.6 43.2-58.0
55-64 58 46.7 29.6-63.7 168 52.8 43.7-61.9 226 50.5 41.1-60.0
25-64 135 45.1 34.6-55.5 461 45.2 39.4-51.0 596 45.2 39.4-50.9
Advised by doctor or health worker to stop smoking among those previously diagnosed
Age Group
(years)
Men Women Both Sexes
n % 95% CI n % 95% CI n % 95% CI
25-34 9 27.1 0.0-56.0 44 27.3 12.8-41.7 53 27.2 15.2-39.2
35-44 20 61.5 39.0-84.1 84 40.4 29.3-51.5 104 46.8 36.4-57.1
45-54 48 63.3 48.4-78.2 165 46.4 38.3-54.5 213 51.8 44.0-59.7
55-64 58 63.5 49.0-78.1 168 50.2 41.5-59.0 226 55.2 47.0-63.4
25-64 135 59.1 48.5-69.7 461 43.3 37.7-49.0 596 48.5 42.9-54.0
Advised by doctor or health worker to start or do more exercise among those previously diagnosed
Age Group
(years)
Men Women Both Sexes
n % 95% CI n % 95% CI n % 95% CI
25-34 9 16.6 0.0-40.0 44 31.5 16.8-46.1 53 27.6 15.0-40.3
35-44 20 51.6 28.2-75.0 84 53.7 42.0-65.5 104 53.1 42.6-63.5
45-54 48 69.9 56.7-83.2 165 58.5 50.4-66.6 213 62.2 55.0-69.4
55-64 58 63.2 49.0-77.4 168 64.9 56.5-73.2 226 64.2 56.2-72.3
25-64 135 58.3 48.0-68.5 461 55.2 49.4-61.0 596 56.2 50.6-61.8
Blood pressure advice by a traditional healer
Description: Percentage of respondents who have sought advice or received treatment from traditional healers
for raised blood pressure among those previously diagnosed with raised blood pressure.
Instrument questions:
When was your blood pressure last measured by a health professional?
Have you ever been told by a doctor or other health worker that you have raised blood pressure or
Have you ever seen a traditional healer for raised blood pressure?
Are you currently taking any herbal or traditional remedy for your high blood pressure?
Seen a traditional healer among those previously diagnosed
Age Group
(years)
Men Women Both Sexes
n % 95% CI n % 95% CI n % 95% CI
25-34 9 0.0 0.0-0.0 44 18.9 6.2-31.7 53 14.1 4.1-24.0
35-44 20 8.7 0.0-21.4 84 16.0 8.0-24.0 104 13.8 6.9-20.7
45-54 48 18.1 5.1-31.2 165 14.4 8.6-20.1 213 15.6 9.9-21.2
55-64 58 15.1 6.0-24.1 168 17.3 11.0-23.6 226 16.5 11.1-21.9
25-64 135 13.3 7.1-19.5 461 16.3 12.6-19.9 596 15.3 12.2-18.4

Appendix 11-Data Book Page 153
Currently taking herbal or traditional remedy for high blood pressure among those previously diagnosed
Age Group
(years)
Men Women Both Sexes
n % 95% CI n % 95% CI n % 95% CI
25-34 9 0.0 0.0-0.0 44 11.8 1.1-22.4 53 8.7 0.5-17.0
35-44 20 13.4 0.0-28.7 84 12.7 5.4-19.9 104 12.9 6.0-19.9
45-54 48 7.5 0.0-15.1 165 16.0 9.2-22.7 213 13.2 8.0-18.5
55-64 58 11.5 2.5-20.5 168 15.8 9.6-22.0 226 14.2 9.1-19.2
25-64 135 9.2 4.1-14.3 461 14.6 10.8-18.4 596 12.8 9.9-15.8
Diabetes measurement and diagnosis
Description: Diabetes measurement and diagnosis among all respondents.
Instrument questions:
Have you ever had your blood sugar measured by a doctor or other health worker?
Have you ever been told by a doctor or other health worker that you have raised blood sugar or
diabetes?
Have you been told in the past 12 months?
Blood sugar measurement and diagnosis
Age
Group
(years)
Men
n % Never
measured 95% CI
%
measured,
not
diagnosed
95% CI
%
diagnosed,
but not
within past
12 months
95% CI
%
diagnosed
within past
12 months
95% CI
25-34 544 89.1 85.9-
92.4 10.6 7.4-13.8 0.1 0.0-0.3 0.2 0.0-0.5
35-44 535 86.9 83.5-
90.3 13.0 9.6-16.3 0.0 0.0-0.0 0.2 0.0-0.4
45-54 496 84.5 80.8-
88.2 12.3 8.9-15.8 0.6 0.0-1.4 2.5 0.9-4.1
55-64 362 82.7 78.3-
87.1 14.7 10.4-19.0 1.0 0.1-1.8 1.6 0.3-2.9
25-64 1937 86.7 84.7-
88.7 12.2 10.3-14.0 0.3 0.1-0.5 0.8 0.4-1.2
Blood sugar measurement and diagnosis
Age
Group
(years)
Women
n % Never
measured 95% CI
%
measured,
not
diagnosed
95% CI
% diagnosed,
but not
within past
12 months
95% CI
%
diagnosed
within past
12 months
95% CI
25-34 910 85.7 82.6-
88.8 13.8 10.7-16.8 0.4 0.0-0.9 0.2 0.0-0.4
35-44 966 85.0 81.9-
88.1 13.7 10.7-16.7 0.2 0.0-0.4 1.1 0.4-1.8
45-54 958 79.9 76.4-
83.3 15.9 12.9-19.0 0.9 0.2-1.6 3.3 1.8-4.7
55-64 662 78.7 74.7-
82.7 15.5 12.0-19.0 0.2 0.0-0.4 5.7 3.4-7.9
25-64 3496 83.2 81.1-
85.3 14.5 12.5-16.4 0.4 0.2-0.7 1.9 1.3-2.4

Appendix 11-Data Book Page 154
Blood sugar measurement and diagnosis
Age
Group
(years)
Both sexes
n
% Never
measure
d
95% CI
%
measured,
not
diagnosed
95% CI
% diagnosed,
but not
within past
12 months
95% CI
%
diagnosed
within past
12 months
95% CI
25-34 1454 87.4 85.1-
89.6 12.2 10.0-14.4 0.3 0.0-0.5 0.2 0.0-0.3
35-44 1501 86.0 83.6-
88.4 13.3 10.9-15.7 0.1 0.0-0.2 0.6 0.2-1.0
45-54 1454 81.9 79.2-
84.7 14.3 11.9-16.8 0.8 0.3-1.3 2.9 1.8-4.1
55-64 1024 80.6 77.4-
83.8 15.1 12.4-17.8 0.5 0.1-1.0 3.7 2.3-5.2
25-64 5433 84.9 83.2-
86.6 13.4 11.8-14.9 0.4 0.2-0.5 1.3 1.0-1.7
Diabetes treatment among those diagnosed
Description: Diabetes treatment results among those previously diagnosed with raised blood sugar or diabetes.
Instrument questions:
Have you ever had your blood sugar measured by a doctor or other health worker?
Have you ever been told by a doctor or other health worker that you have raised blood sugar or
diabetes?
Are you currently receiving any of the following treatments/advice for diabetes prescribed by a
doctor or other health worker?
Currently taking insulin prescribed for diabetes among those previously diagnosed
Age Group
(years)
Men Women Both Sexes
n % taking
insulin 95% CI n
% taking
insulin 95% CI
n % taking
insulin 95% CI
25-34 2 59.4 0.0-100.0 5 0.0 0.0-0.0 7 18.3 0.0-50.9
35-44 1 0.0 0.0-0.0 12 4.8 0.0-14.4 13 4.2 0.0-12.8
45-54 17 0.0 0.0-0.0 38 23.9 7.0-40.8 55 14.9 3.7-26.1
55-64 12 19.4 0.0-42.5 35 15.3 2.1-28.4 47 16.5 4.9-28.1
25-64 32 11.1 0.0-23.4 90 16.0 7.5-24.5 122 14.5 7.6-21.3
Currently taking oral drugs prescribed for diabetes among those previously diagnosed
Age Group
(years)
Men Women Both Sexes
n % taking
meds 95% CI n
% taking
meds 95% CI n
% taking
meds 95% CI
25-34 2 59.4 0.0-100.0 5 63.5 20.0-100.0 7 62.2 25.0-99.4
35-44 1 100.0 100.0-
100.0
12 27.3 0.0-54.8
13 35.4 6.7-64.0
45-54 17 65.9 40.8-91.1 38 58.2 44.1-72.3 55 61.1 48.1-74.1
55-64 12 70.5 42.3-98.8 35 57.4 39.4-75.4 47 61.2 47.5-74.9
25-64 32 68.2 51.1-85.2 90 53.7 43.4-64.0 122 58.2 50.3-66.1
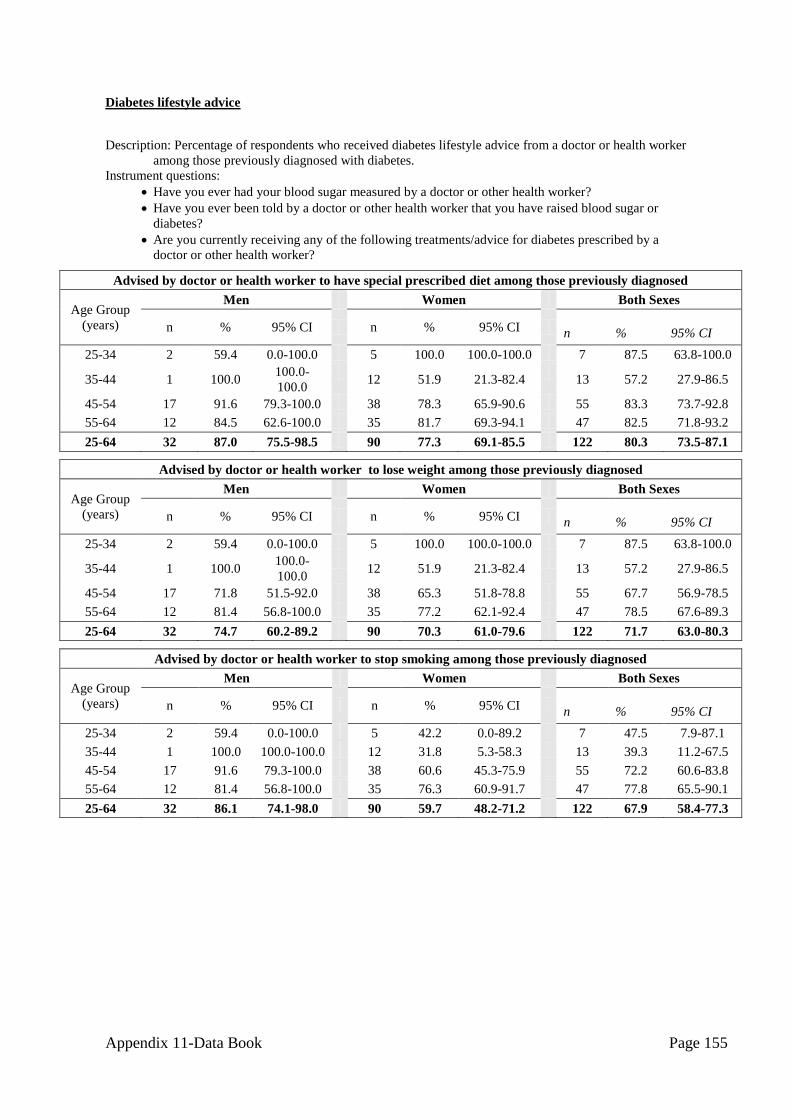
Appendix 11-Data Book Page 155
Diabetes lifestyle advice
Description: Percentage of respondents who received diabetes lifestyle advice from a doctor or health worker
among those previously diagnosed with diabetes.
Instrument questions:
Have you ever had your blood sugar measured by a doctor or other health worker?
Have you ever been told by a doctor or other health worker that you have raised blood sugar or
diabetes?
Are you currently receiving any of the following treatments/advice for diabetes prescribed by a
doctor or other health worker?
Advised by doctor or health worker to have special prescribed diet among those previously diagnosed
Age Group
(years)
Men Women Both Sexes
n % 95% CI n % 95% CI n % 95% CI
25-34 2 59.4 0.0-100.0 5 100.0 100.0-100.0 7 87.5 63.8-100.0
35-44 1 100.0 100.0-
100.0
12 51.9 21.3-82.4
13 57.2 27.9-86.5
45-54 17 91.6 79.3-100.0 38 78.3 65.9-90.6 55 83.3 73.7-92.8
55-64 12 84.5 62.6-100.0 35 81.7 69.3-94.1 47 82.5 71.8-93.2
25-64 32 87.0 75.5-98.5 90 77.3 69.1-85.5 122 80.3 73.5-87.1
Advised by doctor or health worker to lose weight among those previously diagnosed
Age Group
(years)
Men Women Both Sexes
n % 95% CI n % 95% CI n % 95% CI
25-34 2 59.4 0.0-100.0 5 100.0 100.0-100.0 7 87.5 63.8-100.0
35-44 1 100.0 100.0-
100.0
12 51.9 21.3-82.4
13 57.2 27.9-86.5
45-54 17 71.8 51.5-92.0 38 65.3 51.8-78.8 55 67.7 56.9-78.5
55-64 12 81.4 56.8-100.0 35 77.2 62.1-92.4 47 78.5 67.6-89.3
25-64 32 74.7 60.2-89.2 90 70.3 61.0-79.6 122 71.7 63.0-80.3
Advised by doctor or health worker to stop smoking among those previously diagnosed
Age Group
(years)
Men Women Both Sexes
n % 95% CI n % 95% CI n % 95% CI
25-34 2 59.4 0.0-100.0 5 42.2 0.0-89.2 7 47.5 7.9-87.1
35-44 1 100.0 100.0-100.0 12 31.8 5.3-58.3 13 39.3 11.2-67.5
45-54 17 91.6 79.3-100.0 38 60.6 45.3-75.9 55 72.2 60.6-83.8
55-64 12 81.4 56.8-100.0 35 76.3 60.9-91.7 47 77.8 65.5-90.1
25-64 32 86.1 74.1-98.0 90 59.7 48.2-71.2 122 67.9 58.4-77.3
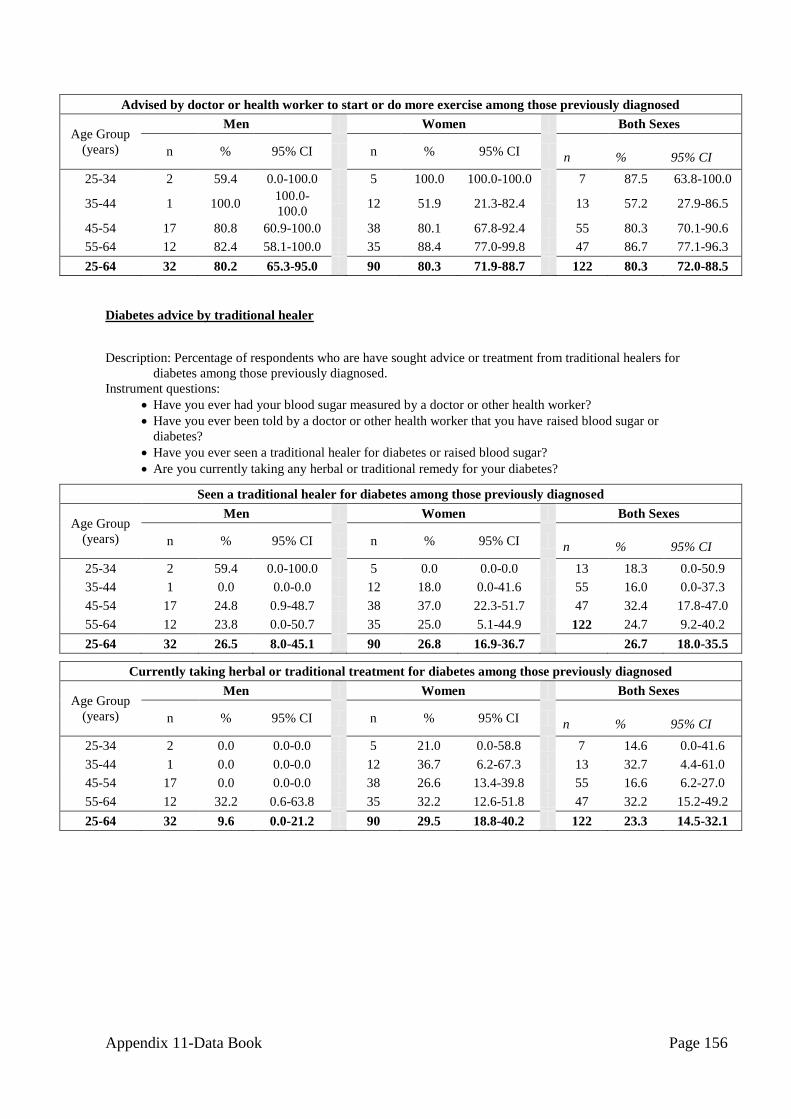
Appendix 11-Data Book Page 156
Advised by doctor or health worker to start or do more exercise among those previously diagnosed
Age Group
(years)
Men Women Both Sexes
n % 95% CI n % 95% CI n % 95% CI
25-34 2 59.4 0.0-100.0 5 100.0 100.0-100.0 7 87.5 63.8-100.0
35-44 1 100.0 100.0-
100.0
12 51.9 21.3-82.4
13 57.2 27.9-86.5
45-54 17 80.8 60.9-100.0 38 80.1 67.8-92.4 55 80.3 70.1-90.6
55-64 12 82.4 58.1-100.0 35 88.4 77.0-99.8 47 86.7 77.1-96.3
25-64 32 80.2 65.3-95.0 90 80.3 71.9-88.7 122 80.3 72.0-88.5
Diabetes advice by traditional healer
Description: Percentage of respondents who are have sought advice or treatment from traditional healers for
diabetes among those previously diagnosed.
Instrument questions:
Have you ever had your blood sugar measured by a doctor or other health worker?
Have you ever been told by a doctor or other health worker that you have raised blood sugar or
diabetes?
Have you ever seen a traditional healer for diabetes or raised blood sugar?
Are you currently taking any herbal or traditional remedy for your diabetes?
Seen a traditional healer for diabetes among those previously diagnosed
Age Group
(years)
Men Women Both Sexes
n % 95% CI n % 95% CI n % 95% CI
25-34 2 59.4 0.0-100.0 5 0.0 0.0-0.0 13 18.3 0.0-50.9
35-44 1 0.0 0.0-0.0 12 18.0 0.0-41.6 55 16.0 0.0-37.3
45-54 17 24.8 0.9-48.7 38 37.0 22.3-51.7 47 32.4 17.8-47.0
55-64 12 23.8 0.0-50.7 35 25.0 5.1-44.9 122 24.7 9.2-40.2
25-64 32 26.5 8.0-45.1 90 26.8 16.9-36.7 26.7 18.0-35.5
Currently taking herbal or traditional treatment for diabetes among those previously diagnosed
Age Group
(years)
Men Women Both Sexes
n % 95% CI n % 95% CI n % 95% CI
25-34 2 0.0 0.0-0.0 5 21.0 0.0-58.8 7 14.6 0.0-41.6
35-44 1 0.0 0.0-0.0 12 36.7 6.2-67.3 13 32.7 4.4-61.0
45-54 17 0.0 0.0-0.0 38 26.6 13.4-39.8 55 16.6 6.2-27.0
55-64 12 32.2 0.6-63.8 35 32.2 12.6-51.8 47 32.2 15.2-49.2
25-64 32 9.6 0.0-21.2 90 29.5 18.8-40.2 122 23.3 14.5-32.1
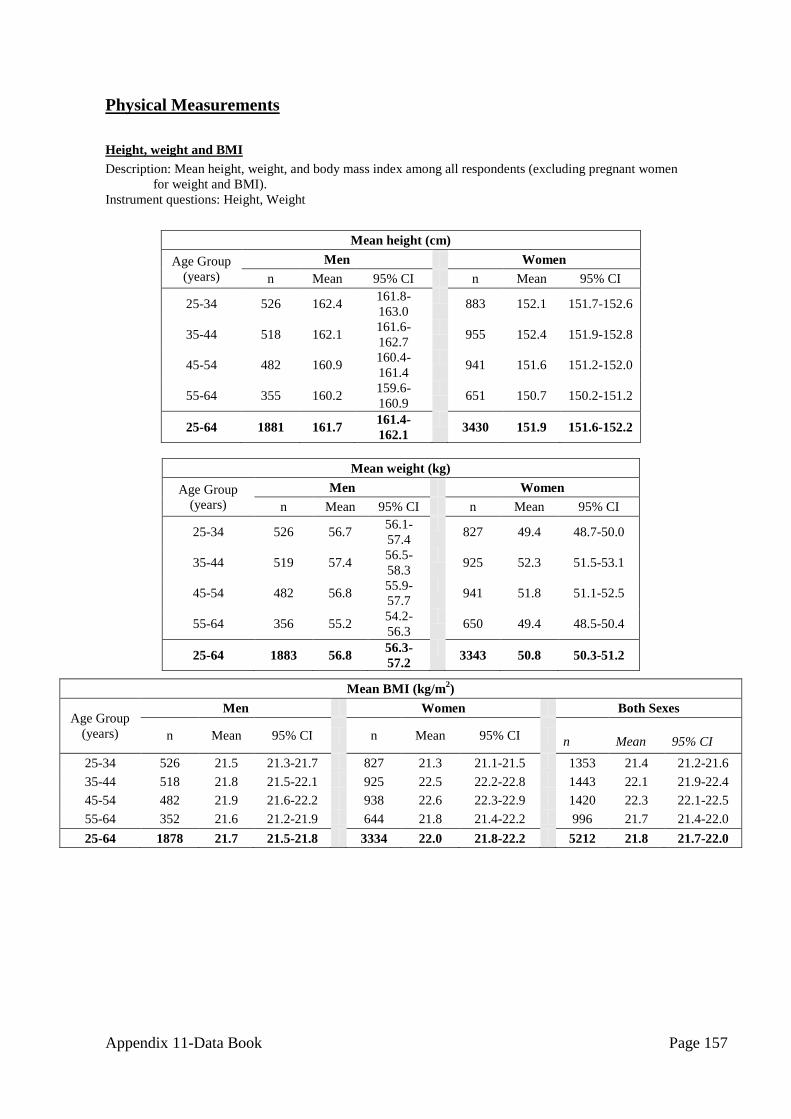
Appendix 11-Data Book Page 157
Physical Measurements
Height, weight and BMI
Description: Mean height, weight, and body mass index among all respondents (excluding pregnant women
for weight and BMI).
Instrument questions: Height, Weight
Mean height (cm)
Age Group
(years)
Men Women
n Mean 95% CI n Mean 95% CI
25-34 526 162.4 161.8-
163.0
883 152.1 151.7-152.6
35-44 518 162.1 161.6-
162.7
955 152.4 151.9-152.8
45-54 482 160.9 160.4-
161.4
941 151.6 151.2-152.0
55-64 355 160.2 159.6-
160.9
651 150.7 150.2-151.2
25-64 1881 161.7 161.4-
162.1
3430 151.9 151.6-152.2
Mean weight (kg)
Age Group
(years)
Men Women
n Mean 95% CI n Mean 95% CI
25-34 526 56.7 56.1-
57.4
827 49.4 48.7-50.0
35-44 519 57.4 56.5-
58.3
925 52.3 51.5-53.1
45-54 482 56.8 55.9-
57.7
941 51.8 51.1-52.5
55-64 356 55.2 54.2-
56.3
650 49.4 48.5-50.4
25-64 1883 56.8 56.3-
57.2
3343 50.8 50.3-51.2
Mean BMI (kg/m2)
Age Group
(years)
Men Women Both Sexes
n Mean 95% CI n Mean 95% CI n Mean 95% CI
25-34 526 21.5 21.3-21.7 827 21.3 21.1-21.5 1353 21.4 21.2-21.6
35-44 518 21.8 21.5-22.1 925 22.5 22.2-22.8 1443 22.1 21.9-22.4
45-54 482 21.9 21.6-22.2 938 22.6 22.3-22.9 1420 22.3 22.1-22.5
55-64 352 21.6 21.2-21.9 644 21.8 21.4-22.2 996 21.7 21.4-22.0
25-64 1878 21.7 21.5-21.8 3334 22.0 21.8-22.2 5212 21.8 21.7-22.0

Appendix 11-Data Book Page 158
BMI categories:
Description: Percentage of respondents (excluding pregnant women) in each BMI category.
Instrument questions: Height, Weight
BMI classifications
Age
Group
(years)
Men
n
% Under-
weight
<18.5
95% CI
% Normal
weight
18.5-24.9
95% CI % BMI
25.0-29.9 95% CI
% Obese
≥30.0 95% CI
25-34 526 7.3 4.7-9.9 85.1 81.4-88.7 7.1 4.7-9.5 0.6 0.0-1.1
35-44 518 9.5 6.9-12.1 78.0 74.1-81.9 11.0 8.0-13.9 1.6 0.5-2.7
45-54 482 10.7 7.2-14.3 74.6 70.0-79.2 14.0 10.3-17.8 0.7 0.0-1.4
55-64 352 15.6 11.4-
19.7 68.2 63.5-73.0 14.2 10.6-17.7 2.0 0.5-3.5
25-64 1878 9.7 8.1-11.2 78.7 76.6-80.8 10.5 9.0-12.1 1.1 0.6-1.5
BMI classifications
Age
Group
(years)
Women
n
% Under-
weight
<18.5
95% CI
% Normal
weight
18.5-24.9
95% CI % BMI
25.0-29.9 95% CI
% Obese
≥30.0 95% CI
25-34 827 16.5 13.1-
19.9 71.6 67.6-75.5 10.8 8.2-13.3 1.2 0.4-1.9
35-44 925 11.1 9.0-13.3 65.9 62.4-69.4 19.7 16.9-22.6 3.3 1.9-4.6
45-54 938 13.4 11.0-
15.8 62.6 59.2-66.0 20.3 17.3-23.3 3.8 2.4-5.2
55-64 644 20.9 17.8-
24.0 58.7 54.7-62.6 17.1 13.7-20.6 3.3 1.5-5.1
25-64 3334 14.9 13.3-
16.4 66.1 64.1-68.2 16.3 14.7-18.0 2.7 2.0-3.3
BMI classifications
Age
Group
(years)
Both Sexes
n
% Under-
weight
<18.5
95% CI
% Normal
weight
18.5-24.9
95% CI % BMI
25.0-29.9 95% CI
% Obese
≥30.0 95% CI
25-34 1353 11.8 9.6-14.1 78.4 75.4-81.4 8.9 7.0-10.8 0.9 0.4-1.3
35-44 1443 10.3 8.5-12.0 72.2 69.4-75.0 15.2 13.0-17.3 2.4 1.5-3.3
45-54 1420 12.2 10.2-
14.2 67.9 65.0-70.8 17.5 15.0-20.0 2.4 1.5-3.3
55-64 996 18.3 15.6-
21.0 63.3 60.0-66.5 15.7 13.2-18.2 2.7 1.6-3.8
25-64 5212 12.3 11.1-
13.5 72.4 70.8-74.0 13.5 12.2-14.7 1.9 1.4-2.3

Appendix 11-Data Book Page 159
BMI ≥25
Description: Percentage of respondents being classified as overweight (BMI≥25)
Instrument questions: Height, Weight
BMI≥25
Age Group
(years)
Men Women Both Sexes
n %
BMI≥25 95% CI n
%
BMI≥25 95% CI n
%
BMI≥25 95% CI
25-34 526 7.6 5.1-10.2 827 11.9 9.3-14.5 1353 9.8 7.8-11.7
35-44 518 12.6 9.4-15.7 925 23.0 19.8-26.1 1443 17.5 15.0-20.0
45-54 482 14.7 10.9-18.6 938 24.1 20.8-27.3 1420 19.9 17.3-22.5
55-64 352 16.2 12.6-19.8 644 20.4 16.5-24.4 996 18.4 15.5-21.4
25-64 1878 11.6 9.9-13.3 3334 19.0 17.1-20.9 5212 15.4 13.9-16.8
Waist circumference
Description: Mean waist circumference among all respondents (excluding pregnant women).
Instrument question: Waist circumference measurement
Waist circumference (cm)
Age Group
(years)
Men Women
n Mean 95% CI n Mean 95% CI
25-34 526 74.1 73.4-74.7 827 72.6 71.9-73.3
35-44 518 76.5 75.6-77.4 925 76.5 75.7-77.3
45-54 483 77.8 76.9-78.7 941 77.8 76.9-78.6
55-64 356 77.5 76.5-78.5 650 77.4 76.2-78.5
25-64 1883 76.0 75.5-76.5 3343 75.5 75.0-76.1
Hip circumference
Description: Mean hip circumference among all respondents (excluding pregnant women).
Instrument question: Hip circumference measurement
Hip circumference (cm)
Age Group
(years)
Men Women
n Mean 95% CI n Mean 95% CI
25-34 526 88.2 87.7-88.7 827 88.5 87.9-89.0
35-44 518 89.1 88.4-89.7 925 90.3 89.6-91.0
45-54 483 88.5 87.9-89.2 941 90.2 89.6-90.8
55-64 355 88.0 87.2-88.8 650 88.8 87.9-89.6
25-64 1882 88.5 88.1-88.9 3343 89.4 89.0-89.8
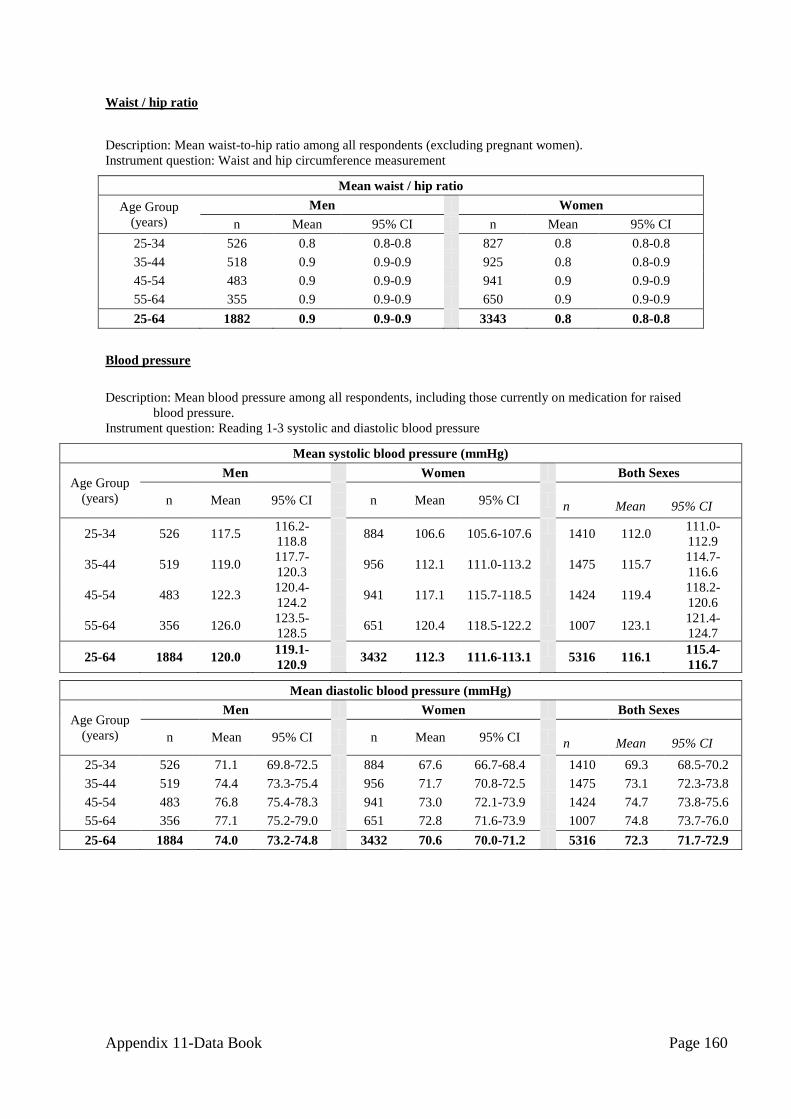
Appendix 11-Data Book Page 160
Waist / hip ratio
Description: Mean waist-to-hip ratio among all respondents (excluding pregnant women).
Instrument question: Waist and hip circumference measurement
Mean waist / hip ratio
Age Group
(years)
Men Women
n Mean 95% CI n Mean 95% CI
25-34 526 0.8 0.8-0.8 827 0.8 0.8-0.8
35-44 518 0.9 0.9-0.9 925 0.8 0.8-0.9
45-54 483 0.9 0.9-0.9 941 0.9 0.9-0.9
55-64 355 0.9 0.9-0.9 650 0.9 0.9-0.9
25-64 1882 0.9 0.9-0.9 3343 0.8 0.8-0.8
Blood pressure
Description: Mean blood pressure among all respondents, including those currently on medication for raised
blood pressure.
Instrument question: Reading 1-3 systolic and diastolic blood pressure
Mean systolic blood pressure (mmHg)
Age Group
(years)
Men Women Both Sexes
n Mean 95% CI n Mean 95% CI n Mean 95% CI
25-34 526 117.5 116.2-
118.8
884 106.6 105.6-107.6
1410 112.0
111.0-
112.9
35-44 519 119.0 117.7-
120.3
956 112.1 111.0-113.2
1475 115.7
114.7-
116.6
45-54 483 122.3 120.4-
124.2
941 117.1 115.7-118.5
1424 119.4
118.2-
120.6
55-64 356 126.0 123.5-
128.5
651 120.4 118.5-122.2
1007 123.1
121.4-
124.7
25-64 1884 120.0 119.1-
120.9
3432 112.3 111.6-113.1
5316 116.1
115.4-
116.7
Mean diastolic blood pressure (mmHg)
Age Group
(years)
Men Women Both Sexes
n Mean 95% CI n Mean 95% CI n Mean 95% CI
25-34 526 71.1 69.8-72.5 884 67.6 66.7-68.4 1410 69.3 68.5-70.2
35-44 519 74.4 73.3-75.4 956 71.7 70.8-72.5 1475 73.1 72.3-73.8
45-54 483 76.8 75.4-78.3 941 73.0 72.1-73.9 1424 74.7 73.8-75.6
55-64 356 77.1 75.2-79.0 651 72.8 71.6-73.9 1007 74.8 73.7-76.0
25-64 1884 74.0 73.2-74.8 3432 70.6 70.0-71.2 5316 72.3 71.7-72.9

Appendix 11-Data Book Page 161
Raised blood pressure
Description: Percentage of respondents with raised blood pressure.
Instrument question:
During the past two weeks, have you been treated for raised blood pressure with drugs (medication)
prescribed by a doctor or other health worker?
Reading 1-3 systolic and diastolic blood pressure
SBP ≥140 and/or DBP ≥ 90 mmHg, excluding those on medication for raised blood pressure
Age Group
(years)
Men Women Both Sexes
n % 95% CI n % 95% CI n % 95% CI
25-34 525 5.9 3.4-8.3 881 2.0 0.9-3.1 1406 3.9 2.5-5.3
35-44 517 11.7 9.0-14.4 943 6.9 5.1-8.8 1460 9.4 7.6-11.2
45-54 472 16.3 12.6-20.0 892 11.6 9.0-14.2 1364 13.8 11.5-16.1
55-64 334 22.4 17.2-27.7 594 15.1 11.8-18.3 928 18.7 15.4-22.0
25-64 1848 11.7 10.1-13.3 3310 7.2 6.2-8.2 5158 9.4 8.4-10.4
SBP ≥140 and/or DBP ≥ 90 mmHg or currently on medication for raised blood pressure
Age Group
(years)
Men Women Both Sexes
n % 95% CI n % 95% CI n % 95% CI
25-34 526 6.1 3.7-8.6 884 2.3 1.1-3.4 1410 4.2 2.8-5.6
35-44 519 11.9 9.2-14.7 956 8.2 6.3-10.1 1475 10.1 8.3-11.9
45-54 483 17.9 14.0-21.7 941 16.0 13.0-19.1 1424 16.9 14.4-19.4
55-64 356 26.6 21.2-32.1 651 22.0 18.4-25.5 1007 24.2 20.7-27.7
25-64 1884 12.8 11.1-14.5 3432 9.6 8.5-10.8 5316 11.2 10.1-12.3
SBP ≥160 and/or DBP ≥ 100 mmHg, excluding those on medication for raised blood pressure
Age Group
(years)
Men Women Both Sexes
n % 95% CI n % 95% CI n % 95% CI
25-34 525 1.7 0.1-3.3 881 0.4 0.0-0.9 1406 1.1 0.2-1.9
35-44 517 2.7 1.4-4.1 943 1.8 0.9-2.7 1460 2.3 1.5-3.1
45-54 472 5.3 2.9-7.7 892 3.0 1.8-4.3 1364 4.1 2.8-5.4
55-64 334 9.4 5.5-13.2 594 4.0 2.3-5.6 928 6.6 4.3-8.8
25-64 1848 3.7 2.6-4.7 3310 1.8 1.4-2.3 5158 2.7 2.1-3.3
SBP ≥160 and/or DBP ≥ 100 mmHg or currently on medication for raised blood pressure
Age Group
(years)
Men Women Both Sexes
n % 95% CI n % 95% CI n % 95% CI
25-34 526 2.0 0.3-3.7 884 0.7 0.1-1.3 1410 1.3 0.5-2.2
35-44 519 3.0 1.5-4.5 956 3.1 2.0-4.2 1475 3.1 2.1-4.0
45-54 483 7.1 4.5-9.6 941 7.9 5.9-9.9 1424 7.5 5.9-9.2
55-64 356 14.3 10.0-18.5 651 11.7 8.9-14.6 1007 12.9 10.2-15.7
25-64 1884 4.8 3.7-6.0 3432 4.5 3.7-5.3 5316 4.6 3.9-5.4

Appendix 11-Data Book Page 162
Treatment and control of raised blood pressure
Description: Percentage of respondents with treated and/or controlled of raised blood pressure among those with
raised blood pressure (SBP ≥140 and/or DBP ≥ 90 mmHg) or currently on medication for raised blood
pressure.
Instrument questions:
During the past two weeks, have you been treated for raised blood pressure with drugs (medication)
prescribed by a doctor or other health worker? / Reading 1-3 systolic and diastolic blood pressure
Respondents with treated and/or controlled raised blood pressure
Age Group
(years)
Men
n
% On
medication
and
SBP<140
and DBP<90
95% CI
% On
medication and
SBP≥140
and/orDBP≥90
95% CI
% Not on
medication and
SBP≥140
and/orDBP≥90
95% CI
25-34 27 4.6 0.0-13.5 0.0 0.0-0.0 95.4 86.5-100.0
35-44 65 1.5 0.0-4.4 0.8 0.0-2.4 97.7 94.5-100.0
45-54 84 6.0 1.4-10.7 4.4 0.0-9.5 89.6 82.4-96.8
55-64 97 12.7 5.4-20.1 7.6 1.9-13.2 79.7 70.6-88.8
25-64 273 6.2 3.2-9.2 3.4 1.4-5.5 90.4 86.8-94.0
Respondents with treated and/or controlled raised blood pressure
Age Group
(years)
Women
n
% On
medication
and SBP<140
and DBP<90
95% CI
% On
medication and
SBP≥140
and/orDBP≥90
95% CI
% Not on
medication and
SBP≥140
and/orDBP≥90
95% CI
25-34 20 11.7 0.0-24.8 0.0 0.0-0.0 88.3 75.2-100.0
35-44 77 7.0 1.4-12.7 9.0 2.4-15.6 84.0 74.8-93.2
45-54 155 22.5 15.1-29.9 8.7 3.4-14.0 68.8 59.8-77.7
55-64 146 21.2 13.7-28.7 15.7 8.3-23.0 63.2 53.6-72.7
25-64 398 17.6 13.1-22.1 10.1 6.3-13.8 72.3 66.4-78.3
Respondents with treated and/or controlled raised blood pressure
Age Group
(years)
Both Sexes
n
% On
medication
and
SBP<140
and DBP<90
95% CI
% On
medication and
SBP≥140
and/orDBP≥90
95% CI
% Not on
medication and
SBP≥140
and/orDBP≥90
95% CI
25-34 47 6.5 0.0-13.7 0.0 0.0-0.0 93.5 86.3-100.0
35-44 142 3.7 0.5-6.8 4.0 1.3-6.8 92.3 88.0-96.6
45-54 239 14.8 10.2-19.4 6.7 3.0-10.4 78.5 72.4-84.6
55-64 243 16.7 11.2-22.2 11.4 6.9-15.9 71.9 64.3-79.5
25-64 671 11.3 8.5-14.1 6.4 4.2-8.5 82.4 78.4-86.3

Appendix 11-Data Book Page 163
Mean heart rate
Description: Mean heart rate (beats per minute).
Instrument question: Reading 1-3 heart rate
Mean heart rate (beats per minute)
Age Group
(years)
Men Women Both Sexes
n mean 95% CI n mean 95% CI n mean 95% CI
25-34 526 76.2 75.0-77.4 884 84.9 83.9-86.0 1410 80.7 79.7-81.6
35-44 519 75.6 74.5-76.8 956 83.5 82.6-84.4 1475 79.5 78.6-80.3
45-54 483 76.8 75.6-78.1 941 80.0 79.1-80.8 1424 78.6 77.8-79.3
55-64 356 76.1 74.6-77.6 651 79.8 78.6-81.0 1007 78.0 77.0-79.1
25-64 1884 76.2 75.4-76.9 3432 82.7 82.1-83.4 5316 79.5 78.9-80.1
Biochemical Measurements
Mean fasting blood glucose
Description: mean fasting blood glucose results including those currently on medication for diabetes (non-
fasting recipients excluded).
Instrument questions:
During the last 12 hours have you had anything to eat or drink, other than water?
Blood glucose measurement
Mean fasting blood glucose (mmol/L)
Age Group
(years)
Men Women Both Sexes
n Mean 95% CI n Mean 95% CI n Mean 95% CI
25-34 490 3.9 3.9-4.0 842 3.7 3.6-3.8 1332 3.8 3.7-3.9
35-44 500 3.9 3.8-4.0 930 3.8 3.8-3.9 1430 3.9 3.8-4.0
45-54 463 4.2 4.1-4.4 922 4.2 4.1-4.3 1385 4.2 4.1-4.3
55-64 342 4.0 3.9-4.1 634 4.4 4.2-4.6 976 4.2 4.0-4.3
25-64 1795 4.0 3.9-4.1 3328 3.9 3.9-4.0 5123 4.0 3.9-4.0
Mean fasting blood glucose (mg/dl)
Age Group
(years)
Men Women Both Sexes
n Mean 95% CI n Mean 95% CI n Mean 95% CI
25-34 490 71.1 69.4-72.8 842 66.5 65.0-67.9 1332 68.7 67.5-70.0
35-44 500 70.9 69.3-72.5 930 69.2 67.7-70.8 1430 70.1 68.8-71.4
45-54 463 76.0 73.1-79.0 922 75.6 73.2-78.1 1385 75.8 73.8-77.8
55-64 342 71.5 69.4-73.6 634 78.5 74.8-82.3 976 75.2 72.8-77.5
25-64 1795 72.1 70.8-73.3 3328 70.9 69.6-72.3 5123 71.5 70.4-72.6
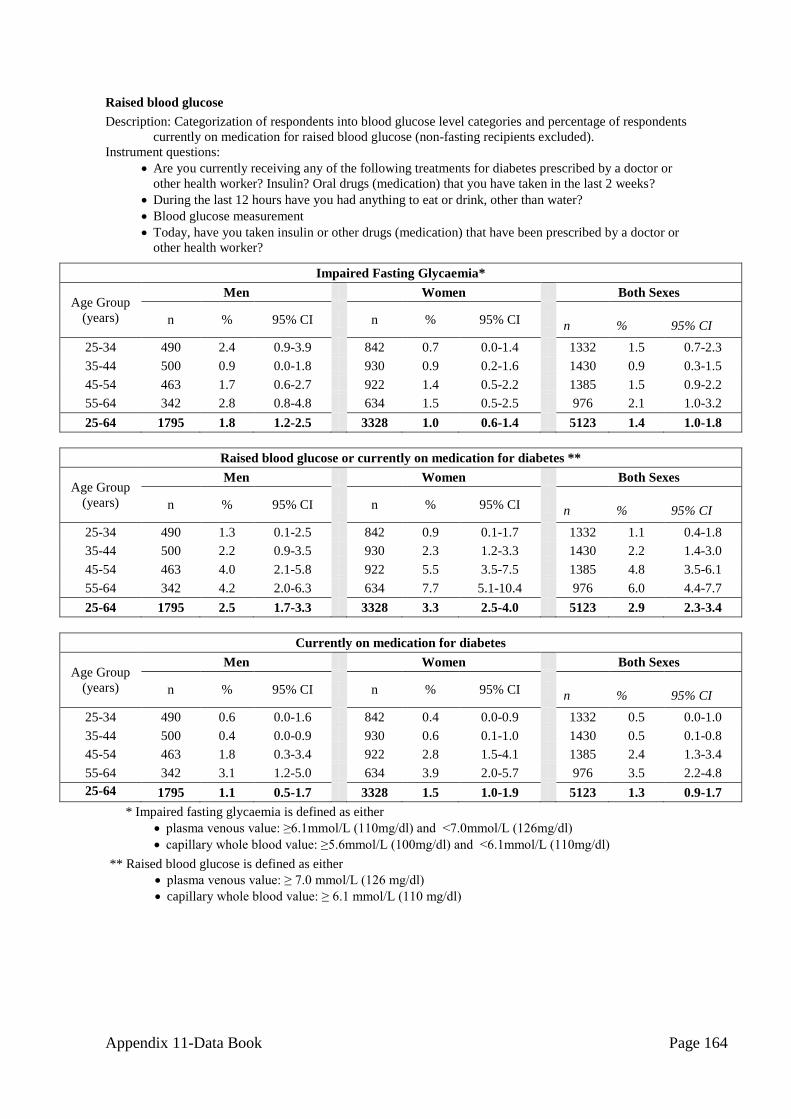
Appendix 11-Data Book Page 164
Raised blood glucose
Description: Categorization of respondents into blood glucose level categories and percentage of respondents
currently on medication for raised blood glucose (non-fasting recipients excluded).
Instrument questions:
Are you currently receiving any of the following treatments for diabetes prescribed by a doctor or
other health worker? Insulin? Oral drugs (medication) that you have taken in the last 2 weeks?
During the last 12 hours have you had anything to eat or drink, other than water?
Blood glucose measurement
Today, have you taken insulin or other drugs (medication) that have been prescribed by a doctor or
other health worker?
Impaired Fasting Glycaemia*
Age Group
(years)
Men Women Both Sexes
n % 95% CI n % 95% CI n % 95% CI
25-34 490 2.4 0.9-3.9 842 0.7 0.0-1.4 1332 1.5 0.7-2.3
35-44 500 0.9 0.0-1.8 930 0.9 0.2-1.6 1430 0.9 0.3-1.5
45-54 463 1.7 0.6-2.7 922 1.4 0.5-2.2 1385 1.5 0.9-2.2
55-64 342 2.8 0.8-4.8 634 1.5 0.5-2.5 976 2.1 1.0-3.2
25-64 1795 1.8 1.2-2.5 3328 1.0 0.6-1.4 5123 1.4 1.0-1.8
Raised blood glucose or currently on medication for diabetes **
Age Group
(years)
Men Women Both Sexes
n % 95% CI n % 95% CI n % 95% CI
25-34 490 1.3 0.1-2.5 842 0.9 0.1-1.7 1332 1.1 0.4-1.8
35-44 500 2.2 0.9-3.5 930 2.3 1.2-3.3 1430 2.2 1.4-3.0
45-54 463 4.0 2.1-5.8 922 5.5 3.5-7.5 1385 4.8 3.5-6.1
55-64 342 4.2 2.0-6.3 634 7.7 5.1-10.4 976 6.0 4.4-7.7
25-64 1795 2.5 1.7-3.3 3328 3.3 2.5-4.0 5123 2.9 2.3-3.4
Currently on medication for diabetes
Age Group
(years)
Men Women Both Sexes
n % 95% CI n % 95% CI n % 95% CI
25-34 490 0.6 0.0-1.6 842 0.4 0.0-0.9 1332 0.5 0.0-1.0
35-44 500 0.4 0.0-0.9 930 0.6 0.1-1.0 1430 0.5 0.1-0.8
45-54 463 1.8 0.3-3.4 922 2.8 1.5-4.1 1385 2.4 1.3-3.4
55-64 342 3.1 1.2-5.0 634 3.9 2.0-5.7 976 3.5 2.2-4.8
25-64 1795 1.1 0.5-1.7 3328 1.5 1.0-1.9 5123 1.3 0.9-1.7
** Raised blood glucose is defined as either
plasma venous value: ≥ 7.0 mmol/L (126 mg/dl)
capillary whole blood value: ≥ 6.1 mmol/L (110 mg/dl)
* Impaired fasting glycaemia is defined as either
plasma venous value: ≥6.1mmol/L (110mg/dl) and <7.0mmol/L (126mg/dl)
capillary whole blood value: ≥5.6mmol/L (100mg/dl) and <6.1mmol/L (110mg/dl)
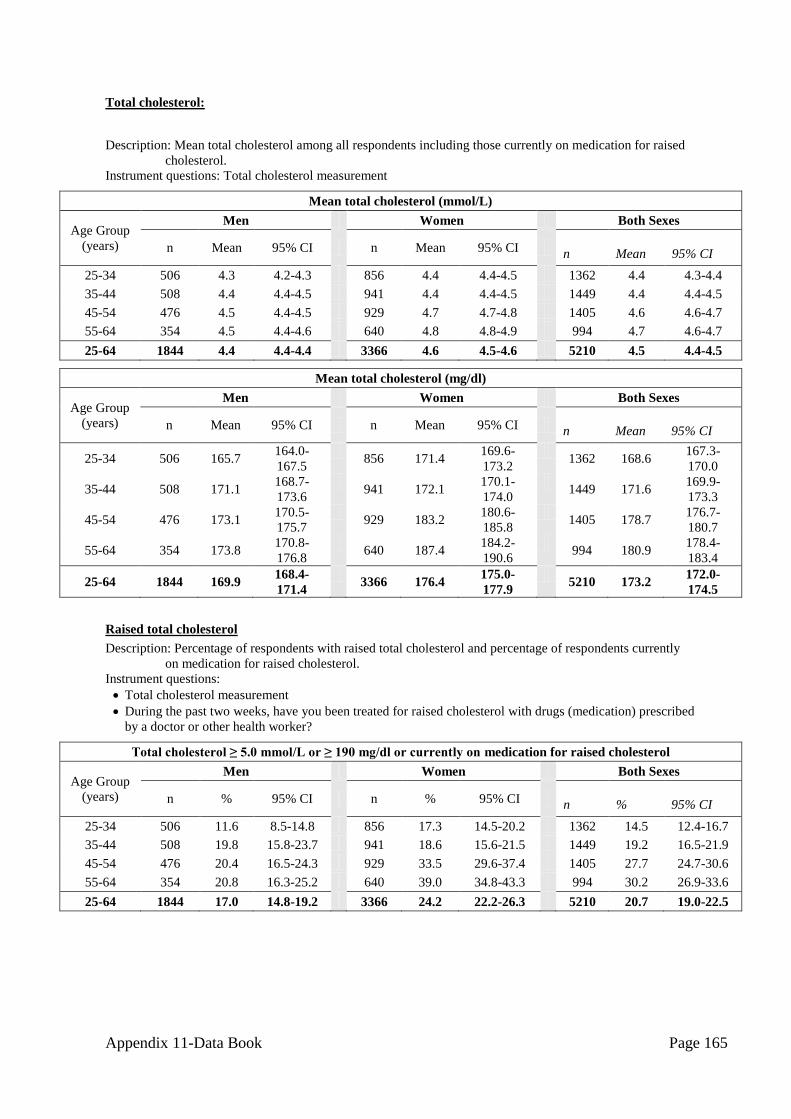
Appendix 11-Data Book Page 165
Total cholesterol:
Description: Mean total cholesterol among all respondents including those currently on medication for raised
cholesterol.
Instrument questions: Total cholesterol measurement
Mean total cholesterol (mmol/L)
Age Group
(years)
Men Women Both Sexes
n Mean 95% CI n Mean 95% CI n Mean 95% CI
25-34 506 4.3 4.2-4.3 856 4.4 4.4-4.5 1362 4.4 4.3-4.4
35-44 508 4.4 4.4-4.5 941 4.4 4.4-4.5 1449 4.4 4.4-4.5
45-54 476 4.5 4.4-4.5 929 4.7 4.7-4.8 1405 4.6 4.6-4.7
55-64 354 4.5 4.4-4.6 640 4.8 4.8-4.9 994 4.7 4.6-4.7
25-64 1844 4.4 4.4-4.4 3366 4.6 4.5-4.6 5210 4.5 4.4-4.5
Mean total cholesterol (mg/dl)
Age Group
(years)
Men Women Both Sexes
n Mean 95% CI n Mean 95% CI n Mean 95% CI
25-34 506 165.7 164.0-
167.5
856 171.4
169.6-
173.2
1362 168.6
167.3-
170.0
35-44 508 171.1 168.7-
173.6
941 172.1
170.1-
174.0
1449 171.6
169.9-
173.3
45-54 476 173.1 170.5-
175.7
929 183.2
180.6-
185.8
1405 178.7
176.7-
180.7
55-64 354 173.8 170.8-
176.8
640 187.4
184.2-
190.6
994 180.9
178.4-
183.4
25-64 1844 169.9 168.4-
171.4
3366 176.4
175.0-
177.9
5210 173.2
172.0-
174.5
Raised total cholesterol
Description: Percentage of respondents with raised total cholesterol and percentage of respondents currently
on medication for raised cholesterol.
Instrument questions:
Total cholesterol measurement
During the past two weeks, have you been treated for raised cholesterol with drugs (medication) prescribed
by a doctor or other health worker?
Total cholesterol ≥ 5.0 mmol/L or ≥ 190 mg/dl or currently on medication for raised cholesterol
Age Group
(years)
Men Women Both Sexes
n % 95% CI n % 95% CI n % 95% CI
25-34 506 11.6 8.5-14.8 856 17.3 14.5-20.2 1362 14.5 12.4-16.7
35-44 508 19.8 15.8-23.7 941 18.6 15.6-21.5 1449 19.2 16.5-21.9
45-54 476 20.4 16.5-24.3 929 33.5 29.6-37.4 1405 27.7 24.7-30.6
55-64 354 20.8 16.3-25.2 640 39.0 34.8-43.3 994 30.2 26.9-33.6
25-64 1844 17.0 14.8-19.2 3366 24.2 22.2-26.3 5210 20.7 19.0-22.5

Appendix 11-Data Book Page 166
Total cholesterol ≥ 6.2 mmol/L or ≥ 240 mg/dl or currently on medication for raised cholesterol
Age Group
(years)
Men Women Both Sexes
n % 95% CI n % 95% CI n % 95% CI
25-34 506 0.9 0.1-1.7 856 1.2 0.4-1.9 1362 1.0 0.5-1.6
35-44 508 2.7 1.2-4.2 941 2.4 1.3-3.6 1449 2.6 1.6-3.6
45-54 476 3.9 2.1-5.7 929 6.6 4.8-8.3 1405 5.4 4.0-6.7
55-64 354 4.7 2.1-7.2 640 10.0 7.2-12.9 994 7.4 5.2-9.7
25-64 1844 2.5 1.6-3.4 3366 3.9 3.2-4.7 5210 3.2 2.6-3.9
Summary of Combined Risk Factors
Summary of Combined Risk Factors
Description: Percentage of respondents with 0, 1-2, or 3-5 of the following risk factors:
current daily smoker
less than 5 servings of fruit & vegetables per day
low level of activity (<600 MET -minutes)
overweight or obese (BMI ≥ 25 kg/m2)
raised BP (SBP ≥ 140 and/or DBP ≥ 90 mmHg or currently on medication for raised BP).
Instrument questions: combined from Step 1 and Step 2
Summary of Combined Risk Factors
Age Group
(years)
Men
n
% with 0
risk
factors
95% CI % with 1-2
risk factors 95% CI
% with 3-5
risk factors 95% CI
25-44 1040 6.1 4.4-7.9 83.6 80.9-86.3 10.2 8.3-12.2
45-64 824 5.4 3.6-7.1 72.4 69.3-75.5 22.2 19.5-25.0
25-64 1864 5.9 4.4-7.4 80.0 77.9-82.2 14.1 12.5-15.7
Summary of Combined Risk Factors
Age Group
(years)
Women
n
% with 0
risk
factors
95% CI % with 1-2
risk factors 95% CI
% with 3-5
risk factors 95% CI
25-44 1725 10.2 8.2-12.2 85.5 83.3-87.8 4.2 3.2-5.3
45-64 1543 6.1 4.6-7.7 83.7 81.5-85.9 10.2 8.5-11.9
25-64 3268 8.7 7.1-10.3 84.8 83.0-86.7 6.5 5.6-7.3
Summary of Combined Risk Factors
Age Group
(years)
Both Sexes
n
% with 0
risk
factors
95% CI % with 1-2
risk factors 95% CI
% with 3-5
risk factors 95% CI
25-44 2765 8.1 6.5-9.7 84.5 82.6-86.5 7.3 6.2-8.5
45-64 2367 5.8 4.5-7.1 78.5 76.6-80.3 15.7 14.2-17.3
25-64 5132 7.3 6.0-8.6 82.4 80.9-84.0 10.2 9.3-11.2

Appendices 12-Fact Sheet Page 167
Appendix 12: Fact Sheet
CAMBODIA STEPS Survey 2010
1. BOTH URBAN AND RURAL AREAS
The STEPS survey of chronic disease risk factors in Cambodia was carried out from February 2010 to April 2010.
Cambodia carried out Step 1, Step 2 and Step 3. Socio demographic and behavioral information were collected in Step
1. Physical measurements such as height, weight and blood pressure were collected in Step 2, biochemical
measurements were collected to assess blood glucose and cholesterol levels in Step 3. The STEPS survey in Cambodia
was a population-based survey of adults aged 25-64. A Multiple Stages Cluster sample design was used to produce
representative data for that age range in Cambodia. A total of 5433 adults participated in the Cambodia STEPS survey.
The overall response rate was 96.30%. A repeat survey is planned for 2015 if funds permit.
Results for adults aged 25-64 years (incl. 95% CI) Both Sexes Males Females
Step 1 Tobacco Use
Percentage who currently smoke tobacco 29.4%
(27.4-31.3)
54.1% (51.3-56.9)
5.9% (4.3-7.5)
Percentage who currently smoke tobacco daily 26.4%
(24.5-28.3)
49.3% (46.5-52.1)
4.8% (3.3-6.2)
For those who smoke tobacco daily
Average age started smoking (years) 20.4
(20.0-20.8)
20.1 (19.7-20.5)
23.3 (21.2-25.3)
Percentage of daily smokers smoking manufactured cigarettes 87.1%
(84.0-90.2) 88.1%
(85.2-90.9) 77.5%
(66.4-88.6)
Mean number of manufactured cigarettes smoked per day (by
smokers of manufactured cigarettes)
12.8 (11.9-13.6)
13.4 (12.5-14.2)
6.9 (5.6-8.2)
Step 1 Alcohol Consumption
Percentage who are lifetime abstainers 26.5%
(24.8-28.2) 9.1%
(7.5-10.6) 43.0%
(40.5-45.4)
Percentage who are past 12 month abstainers 10.0% (9.0-11.1)
6.7% (5.4-8.0)
13.2% (11.8-14.6)
Percentage who currently drink (drank alcohol in the past 30 days) 53.5%
(51.4-55.6) 76.3%
(73.9-78.7) 31.9%
(29.6-34.2)
Percentage who engage in heavy episodic drinking (men who had 5
or more / women who had 4 or more drinks on any day in the past
30 days)
NA 45.1%
(41.9-48.3) 4.6%
(3.5-5.6)
Step 1 Fruit and Vegetable Consumption (in a typical week)
Mean number of days fruit consumed 2.6
(2.4-2.8) 2.4
(2.2-2.6) 2.8
(2.6-2.9)
Mean number of servings of fruit consumed on average per day 1.0
(0.9-1.1) 1.0
(0.9-1.1) 1.1
(1.0-1.1)
Mean number of days vegetables consumed 5.3
(5.2-5.5) 5.4
(5.3-5.5) 5.3
(5.2-5.4)
Mean number of servings of vegetables consumed on average per
day
2.0 (1.8-2.1)
2.1 (1.9-2.2)
1.9 (1.8-2.0)
Percentage who ate less than 5 servings of fruit and/or vegetables on
average per day
84.3% (82.1-86.6)
83.3% (80.5-86.2)
85.3% (83.1-87.5)
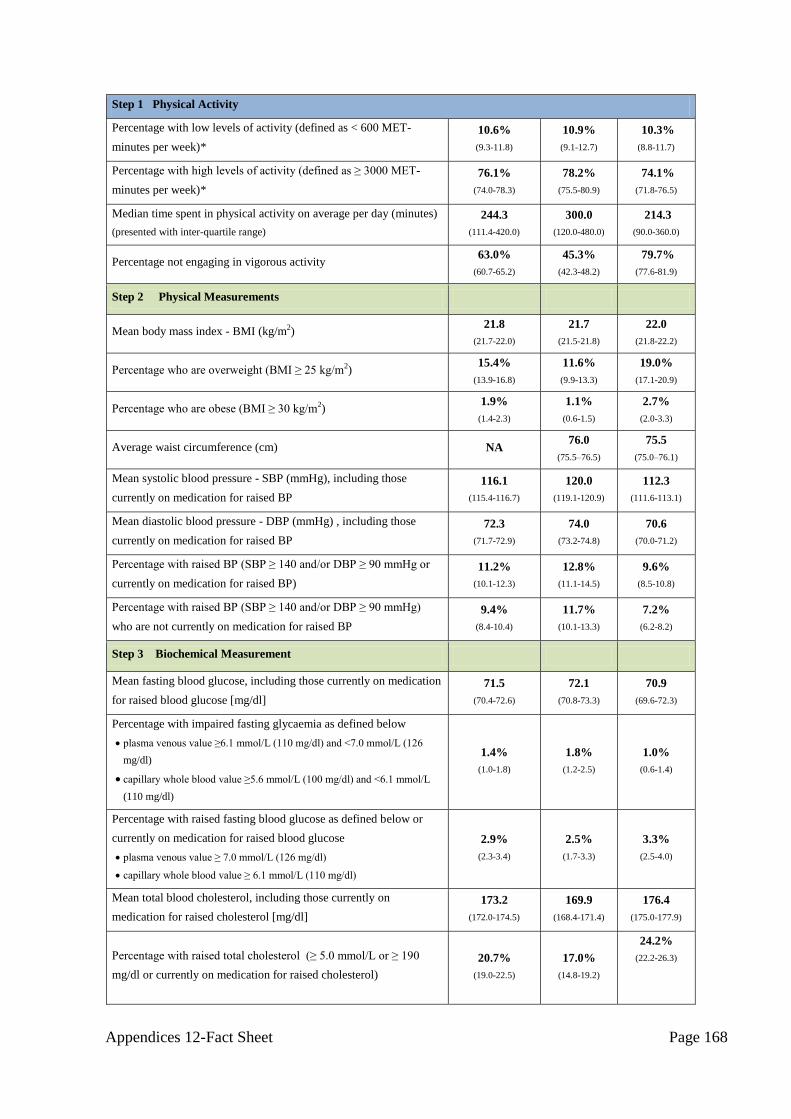
Appendices 12-Fact Sheet Page 168
Step 1 Physical Activity
Percentage with low levels of activity (defined as < 600 MET-
minutes per week)*
10.6%
(9.3-11.8)
10.9%
(9.1-12.7)
10.3%
(8.8-11.7)
Percentage with high levels of activity (defined as ≥ 3000 MET-
minutes per week)*
76.1%
(74.0-78.3)
78.2%
(75.5-80.9)
74.1%
(71.8-76.5)
Median time spent in physical activity on average per day (minutes)
(presented with inter-quartile range)
244.3
(111.4-420.0)
300.0
(120.0-480.0)
214.3
(90.0-360.0)
Percentage not engaging in vigorous activity 63.0%
(60.7-65.2)
45.3%
(42.3-48.2)
79.7%
(77.6-81.9)
Step 2 Physical Measurements
Mean body mass index - BMI (kg/m2) 21.8
(21.7-22.0)
21.7
(21.5-21.8)
22.0
(21.8-22.2)
Percentage who are overweight (BMI ≥ 25 kg/m2) 15.4%
(13.9-16.8)
11.6%
(9.9-13.3)
19.0%
(17.1-20.9)
Percentage who are obese (BMI ≥ 30 kg/m2) 1.9%
(1.4-2.3)
1.1%
(0.6-1.5)
2.7%
(2.0-3.3)
Average waist circumference (cm) NA 76.0
(75.5–76.5)
75.5
(75.0–76.1)
Mean systolic blood pressure - SBP (mmHg), including those
currently on medication for raised BP
116.1
(115.4-116.7)
120.0
(119.1-120.9)
112.3
(111.6-113.1)
Mean diastolic blood pressure - DBP (mmHg) , including those
currently on medication for raised BP
72.3
(71.7-72.9)
74.0
(73.2-74.8)
70.6
(70.0-71.2)
Percentage with raised BP (SBP ≥ 140 and/or DBP ≥ 90 mmHg or
currently on medication for raised BP)
11.2%
(10.1-12.3)
12.8%
(11.1-14.5)
9.6%
(8.5-10.8)
Percentage with raised BP (SBP ≥ 140 and/or DBP ≥ 90 mmHg)
who are not currently on medication for raised BP
9.4%
(8.4-10.4)
11.7%
(10.1-13.3)
7.2%
(6.2-8.2)
Step 3 Biochemical Measurement
Mean fasting blood glucose, including those currently on medication
for raised blood glucose [mg/dl]
71.5
(70.4-72.6)
72.1
(70.8-73.3)
70.9
(69.6-72.3)
Percentage with impaired fasting glycaemia as defined below
plasma venous value ≥6.1 mmol/L (110 mg/dl) and <7.0 mmol/L (126
mg/dl)
capillary whole blood value ≥5.6 mmol/L (100 mg/dl) and <6.1 mmol/L
(110 mg/dl)
1.4%
(1.0-1.8)
1.8%
(1.2-2.5)
1.0%
(0.6-1.4)
Percentage with raised fasting blood glucose as defined below or
currently on medication for raised blood glucose
plasma venous value ≥ 7.0 mmol/L (126 mg/dl)
capillary whole blood value ≥ 6.1 mmol/L (110 mg/dl)
2.9%
(2.3-3.4)
2.5%
(1.7-3.3)
3.3%
(2.5-4.0)
Mean total blood cholesterol, including those currently on
medication for raised cholesterol [mg/dl]
173.2
(172.0-174.5)
169.9
(168.4-171.4)
176.4
(175.0-177.9)
Percentage with raised total cholesterol (≥ 5.0 mmol/L or ≥ 190
mg/dl or currently on medication for raised cholesterol)
20.7%
(19.0-22.5)
17.0%
(14.8-19.2)
24.2%
(22.2-26.3)

Appendices 12-Fact Sheet Page 169
Summary of combined risk factors
-current daily smokers
-less than 5 servings of fruit & vegetables per day
-low level of activity
-overweight (BMI ≥ 25 kg/m2)
-raised BP (SBP ≥ 140 and/or DBP ≥ 90 mmHg or currently on medication for raised BP)
Percentage with none of the above risk factors 7.3%
(6.0-8.6)
5.9%
(4.4-7.4)
8.7%
(7.1-10.3)
Percentage with three or more of the above risk factors,
aged 25 to 44 years
7.3%
(6.2-8.5;)
10.2%
(8.3-12.2)
4.2%
(3.2-5.3)
Percentage with three or more of the above risk factors,
aged 45 to 64 years
15.7%
(14.2-17.3)
22.2%
(19.5-25.0)
10.2%
(8.5-11.9)
Percentage with three or more of the above risk factors,
aged 25 to 64 years
10.2%
(9.3-11.2)
14.1%
(12.5-15.7)
6.5%
(5.6-7.3)
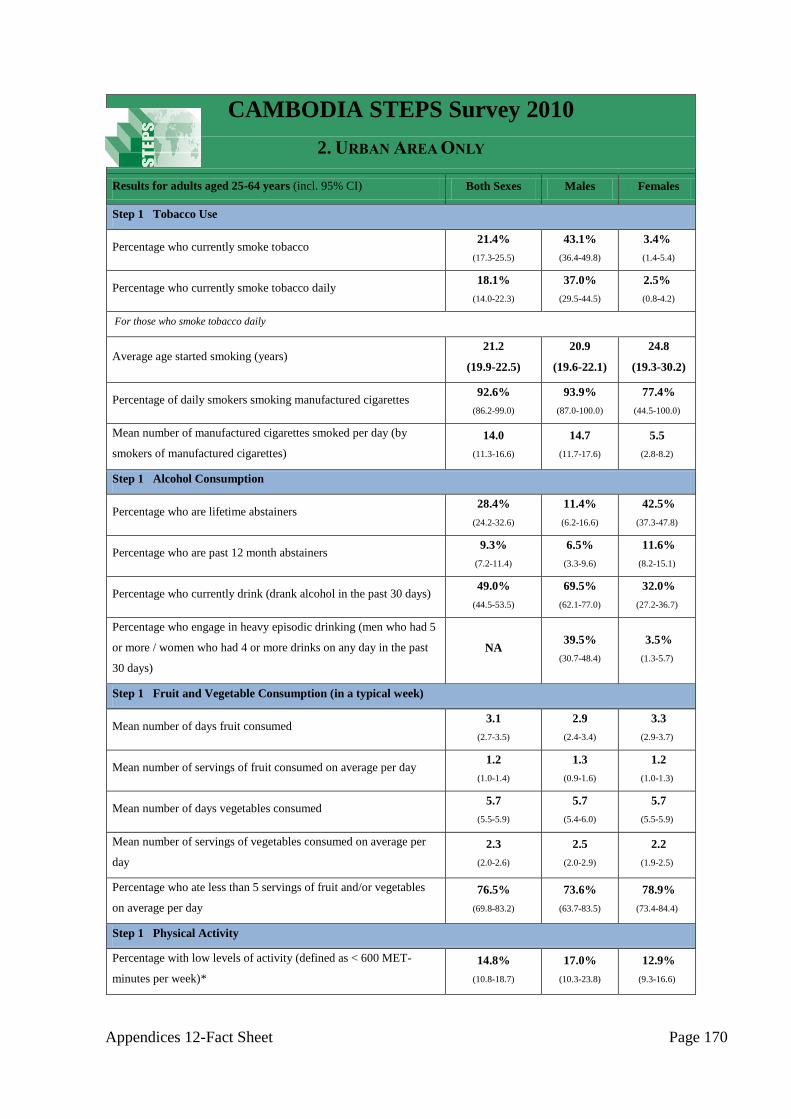
Appendices 12-Fact Sheet Page 170
CAMBODIA STEPS Survey 2010
2. URBAN AREA ONLY
Results for adults aged 25-64 years (incl. 95% CI) Both Sexes Males Females
Step 1 Tobacco Use
Percentage who currently smoke tobacco 21.4%
(17.3-25.5)
43.1%
(36.4-49.8)
3.4%
(1.4-5.4)
Percentage who currently smoke tobacco daily 18.1%
(14.0-22.3)
37.0%
(29.5-44.5)
2.5%
(0.8-4.2)
For those who smoke tobacco daily
Average age started smoking (years) 21.2
(19.9-22.5)
20.9
(19.6-22.1)
24.8
(19.3-30.2)
Percentage of daily smokers smoking manufactured cigarettes 92.6%
(86.2-99.0)
93.9%
(87.0-100.0)
77.4%
(44.5-100.0)
Mean number of manufactured cigarettes smoked per day (by
smokers of manufactured cigarettes)
14.0
(11.3-16.6)
14.7
(11.7-17.6)
5.5
(2.8-8.2)
Step 1 Alcohol Consumption
Percentage who are lifetime abstainers 28.4%
(24.2-32.6)
11.4%
(6.2-16.6)
42.5%
(37.3-47.8)
Percentage who are past 12 month abstainers 9.3%
(7.2-11.4)
6.5%
(3.3-9.6)
11.6%
(8.2-15.1)
Percentage who currently drink (drank alcohol in the past 30 days) 49.0%
(44.5-53.5)
69.5%
(62.1-77.0)
32.0%
(27.2-36.7)
Percentage who engage in heavy episodic drinking (men who had 5
or more / women who had 4 or more drinks on any day in the past
30 days)
NA 39.5%
(30.7-48.4)
3.5%
(1.3-5.7)
Step 1 Fruit and Vegetable Consumption (in a typical week)
Mean number of days fruit consumed 3.1
(2.7-3.5)
2.9
(2.4-3.4)
3.3
(2.9-3.7)
Mean number of servings of fruit consumed on average per day 1.2
(1.0-1.4)
1.3
(0.9-1.6)
1.2
(1.0-1.3)
Mean number of days vegetables consumed 5.7
(5.5-5.9)
5.7
(5.4-6.0)
5.7
(5.5-5.9)
Mean number of servings of vegetables consumed on average per
day
2.3
(2.0-2.6)
2.5
(2.0-2.9)
2.2
(1.9-2.5)
Percentage who ate less than 5 servings of fruit and/or vegetables
on average per day
76.5%
(69.8-83.2)
73.6%
(63.7-83.5)
78.9%
(73.4-84.4)
Step 1 Physical Activity
Percentage with low levels of activity (defined as < 600 MET-
minutes per week)*
14.8%
(10.8-18.7)
17.0%
(10.3-23.8)
12.9%
(9.3-16.6)

Appendices 12-Fact Sheet Page 171
Percentage with high levels of activity (defined as ≥ 3000 MET-
minutes per week)*
69.8%
(63.9-75.8)
67.9%
(59.2-76.6)
71.4%
(66.4-76.5)
Median time spent in physical activity on average per day (minutes)
(presented with inter-quartile range)
205.7
(60.0-385.7)
249.2
(60.0-420.0)
180.0
(75.0-360.0)
Percentage not engaging in vigorous activity 70.2%
(64.4-76.1)
56.7%
(47.0-66.5)
81.4%
(77.6-85.1)
Step 2 Physical Measurements
Mean body mass index - BMI (kg/m2) 23.0
(22.5-23.4)
22.6
(22.1-23.1)
23.3
(22.8-23.8)
Percentage who are overweight (BMI ≥ 25 kg/m2) 26.7%
(22.0-31.5)
25.0%
(18.9-31.1)
28.1%
(23.1-33.1)
Percentage who are obese (BMI ≥ 30 kg/m2) 3.6%
(2.2-5.0)
2.2%
(0.3-4.1)
4.8%
(3.0-6.6)
Average waist circumference (cm) NA 79.4
(77.6–81.2)
79.4
(77.9–80.8)
Mean systolic blood pressure - SBP (mmHg), including those
currently on medication for raised BP
117.6
(115.5-119.6)
123.2
(120.2-126.1)
113.0
(110.8-115.2)
Mean diastolic blood pressure - DBP (mmHg) , including those
currently on medication for raised BP
73.8
(72.1-75.5)
76.9
(74.4-79.4)
71.3
(69.7-72.9)
Percentage with raised BP (SBP ≥ 140 and/or DBP ≥ 90 mmHg or
currently on medication for raised BP)
16.9%
(14.1-19.6)
20.3%
(16.3-24.4)
14.0%
(11.1-17.0)
Percentage with raised BP (SBP ≥ 140 and/or DBP ≥ 90 mmHg)
who are not currently on medication for raised BP
12.8%
(9.9-15.6)
17.5%
(13.4-21.6)
8.8%
(5.7-12.0)
Step 3 Biochemical Measurement
Mean fasting blood glucose, including those currently on
medication for raised blood glucose [mg/dl]
76.8
(74.1-79.5)
76.8
(74.0-79.6)
76.8
(73.6-79.9)
Percentage with impaired fasting glycaemia as defined below
plasma venous value ≥6.1 mmol/L (110 mg/dl) and <7.0 mmol/L (126
mg/dl)
capillary whole blood value ≥5.6 mmol/L (100 mg/dl) and <6.1 mmol/L
(110 mg/dl)
1.7%
(0.6-2.8)
1.8%
(0.1-3.4)
1.6%
(0.6-2.6)
Percentage with raised fasting blood glucose as defined below or
currently on medication for raised blood glucose
plasma venous value ≥ 7.0 mmol/L (126 mg/dl)
capillary whole blood value ≥ 6.1 mmol/L (110 mg/dl)
5.6%
(4.0-7.2)
4.8%
(2.4-7.1)
6.2%
(4.2-8.2)
Mean total blood cholesterol, including those currently on
medication for raised cholesterol [mg/dl]
182.6
(178.4-186.8)
180.0
(174.6-185.4)
184.7
(180.7-188.8)
Percentage with raised total cholesterol (≥ 5.0 mmol/L or ≥ 190
mg/dl or currently on medication for raised cholesterol)
32.5%
(27.0-38.0)
29.1%
(21.1-37.1)
35.3%
(29.7-40.9)

Appendices 12-Fact Sheet Page 172
Summary of combined risk factors
-current daily smokers
-less than 5 servings of fruit & vegetables per day
-low level of activity
-overweight (BMI ≥ 25 kg/m2)
-raised BP (SBP ≥ 140 and/or DBP ≥ 90 mmHg or currently on medication for raised BP)
Percentage with none of the above risk factors 10.3%
(6.6-13.9)
9.7%
(4.8-14.6)
10.8%
(7.0-14.6)
Percentage with three or more of the above risk factors,
aged 25 to 44 years
12.4%
(9.1-15.7)
19.7%
(13.4-25.9)
6.1%
(3.2-9.0)
Percentage with three or more of the above risk factors,
aged 45 to 64 years
21.0%
(17.3-24.7)
28.7%
(21.7-35.8)
14.9%
(10.4-19.3)
Percentage with three or more of the above risk factors,
aged 25 to 64 years
15.9%
(13.7-18.2)
23.3%
(19.0-27.6)
9.8%
(7.4-12.1)

Appendices 12-Fact Sheet Page 173
CAMBODIA STEPS Survey 2010
3. RURAL AREA ONLY
Results for adults aged 25-64 years (incl. 95% CI) Both Sexes Males Females
Step 1 Tobacco Use
Percentage who currently smoke tobacco 31.1%
(28.9-33.3)
56.3 %
(53.2-59.4)
6.5%
(4.6-8.3)
Percentage who currently smoke tobacco daily 28.2 %
(26.1-30.4)
51.8 %
(48.8-54.7)
5.3 %
(3.5-7.1)
For those who smoke tobacco daily
Average age started smoking (years) 20.3
(19.8-20.7)
20.0
(19.6-20.4)
23.1
(20.9-25.3)
Percentage of daily smokers smoking manufactured cigarettes 86.3 %
(82.9-89.8)
87.3 %
(84.1-90.4)
77.5 %
(65.6-89.5)
Mean number of manufactured cigarettes smoked per day (by
smokers of manufactured cigarettes)
12.6
(11.7-13.5)
13.2
(12.3-14.1)
7.1
(5.6-8.5)
Step 1 Alcohol Consumption
Percentage who are lifetime abstainers 26.1 %
(24.2-27.9)
8.6 %
(7.1-10.1)
43.1 %
(40.2-45.9)
Percentage who are past 12 month abstainers 10.2 %
(9.0-11.3)
6.7 %
(5.3-8.2)
13.6 %
(12.0-15.1)
Percentage who currently drink (drank alcohol in the past 30 days) 54.5 %
(52.1-56.8)
77.6 %
(75.1-80.1)
31.9 %
(29.2-34.5)
Percentage who engage in heavy episodic drinking (men who had 5
or more / women who had 4 or more drinks on any day in the past 30
days)
NA 46.2 %
(42.8-49.6)
4.8 %
(3.6-6.0)
Step 1 Fruit and Vegetable Consumption (in a typical week)
Mean number of days fruit consumed 2.5
(2.3-2.7)
2.3
(2.1-2.5)
2.7
(2.5-2.8)
Mean number of servings of fruit consumed on average per day 1.0
(0.9-1.1)
1.0
(0.9-1.1)
1.0
(0.9-1.1)
Mean number of days vegetables consumed 5.3
(5.2-5.4)
5.4
(5.2-5.5)
5.2
(5.0-5.3)
Mean number of servings of vegetables consumed on average per day 1.9
(1.8-2.0)
2.0
(1.8-2.1)
1.8
(1.7-1.9)
Percentage who ate less than 5 servings of fruit and/or vegetables on
average per day
86.0 %
(83.7-88.3)
85.2
(82.4-88.1)
86.8 %
(84.3-89.2)
Step 1 Physical Activity
Percentage with low levels of activity (defined as < 600 MET-
minutes per week)*
9.7 %
(8.3-11.0)
9.7 %
(7.9-11.4)
9.7 %
(8.1-11.3)
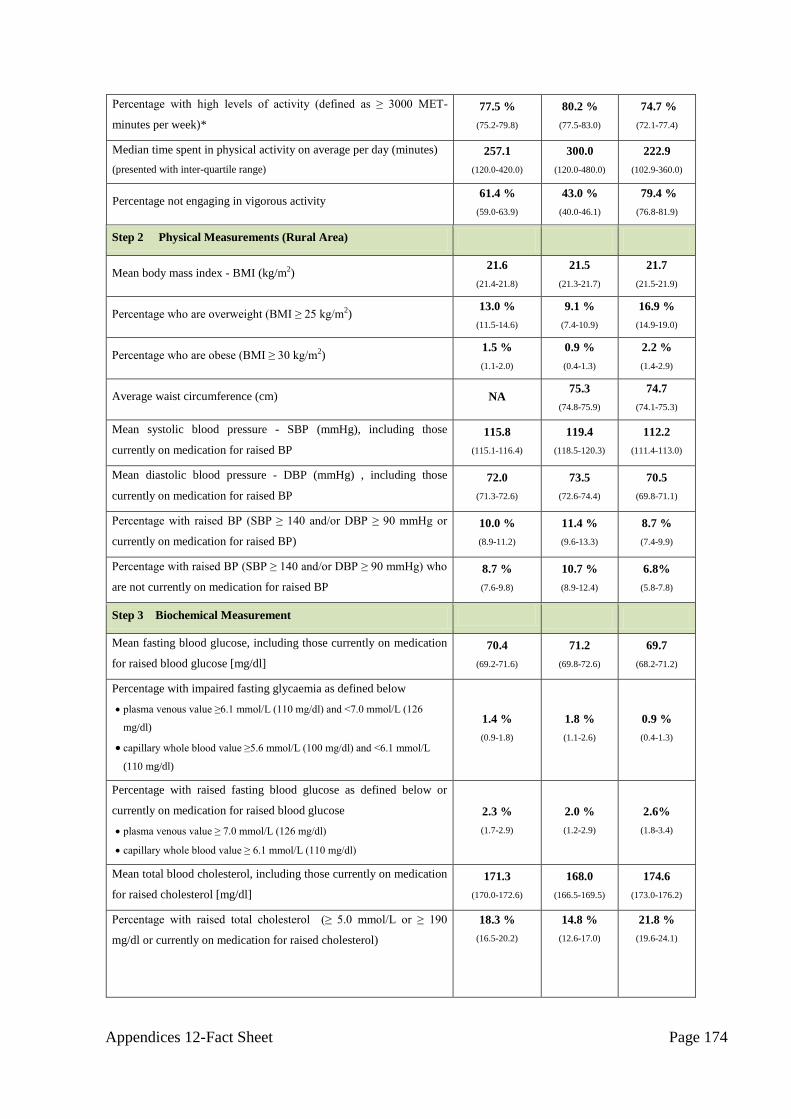
Appendices 12-Fact Sheet Page 174
Percentage with high levels of activity (defined as ≥ 3000 MET-
minutes per week)*
77.5 %
(75.2-79.8)
80.2 %
(77.5-83.0)
74.7 %
(72.1-77.4)
Median time spent in physical activity on average per day (minutes)
(presented with inter-quartile range)
257.1
(120.0-420.0)
300.0
(120.0-480.0)
222.9
(102.9-360.0)
Percentage not engaging in vigorous activity 61.4 %
(59.0-63.9)
43.0 %
(40.0-46.1)
79.4 %
(76.8-81.9)
Step 2 Physical Measurements (Rural Area)
Mean body mass index - BMI (kg/m2) 21.6
(21.4-21.8)
21.5
(21.3-21.7)
21.7
(21.5-21.9)
Percentage who are overweight (BMI ≥ 25 kg/m2) 13.0 %
(11.5-14.6)
9.1 %
(7.4-10.9)
16.9 %
(14.9-19.0)
Percentage who are obese (BMI ≥ 30 kg/m2) 1.5 %
(1.1-2.0)
0.9 %
(0.4-1.3)
2.2 %
(1.4-2.9)
Average waist circumference (cm) NA 75.3
(74.8-75.9)
74.7
(74.1-75.3)
Mean systolic blood pressure - SBP (mmHg), including those
currently on medication for raised BP
115.8
(115.1-116.4)
119.4
(118.5-120.3)
112.2
(111.4-113.0)
Mean diastolic blood pressure - DBP (mmHg) , including those
currently on medication for raised BP
72.0
(71.3-72.6)
73.5
(72.6-74.4)
70.5
(69.8-71.1)
Percentage with raised BP (SBP ≥ 140 and/or DBP ≥ 90 mmHg or
currently on medication for raised BP)
10.0 %
(8.9-11.2)
11.4 %
(9.6-13.3)
8.7 %
(7.4-9.9)
Percentage with raised BP (SBP ≥ 140 and/or DBP ≥ 90 mmHg) who
are not currently on medication for raised BP
8.7 %
(7.6-9.8)
10.7 %
(8.9-12.4)
6.8%
(5.8-7.8)
Step 3 Biochemical Measurement
Mean fasting blood glucose, including those currently on medication
for raised blood glucose [mg/dl]
70.4
(69.2-71.6)
71.2
(69.8-72.6)
69.7
(68.2-71.2)
Percentage with impaired fasting glycaemia as defined below
plasma venous value ≥6.1 mmol/L (110 mg/dl) and <7.0 mmol/L (126
mg/dl)
capillary whole blood value ≥5.6 mmol/L (100 mg/dl) and <6.1 mmol/L
(110 mg/dl)
1.4 %
(0.9-1.8)
1.8 %
(1.1-2.6)
0.9 %
(0.4-1.3)
Percentage with raised fasting blood glucose as defined below or
currently on medication for raised blood glucose
plasma venous value ≥ 7.0 mmol/L (126 mg/dl)
capillary whole blood value ≥ 6.1 mmol/L (110 mg/dl)
2.3 %
(1.7-2.9)
2.0 %
(1.2-2.9)
2.6%
(1.8-3.4)
Mean total blood cholesterol, including those currently on medication
for raised cholesterol [mg/dl]
171.3
(170.0-172.6)
168.0
(166.5-169.5)
174.6
(173.0-176.2)
Percentage with raised total cholesterol (≥ 5.0 mmol/L or ≥ 190
mg/dl or currently on medication for raised cholesterol)
18.3 %
(16.5-20.2)
14.8 %
(12.6-17.0)
21.8 %
(19.6-24.1)

Appendices 12-Fact Sheet Page 175
Summary of combined risk factors
-current daily smokers
-less than 5 servings of fruit & vegetables per day
-low level of activity
-overweight (BMI ≥ 25 kg/m2)
-raised BP (SBP ≥ 140 and/or DBP ≥ 90 mmHg or currently on medication for raised BP)
Percentage with none of the above risk factors 6.7 %
(5.3-8.1)
5.2 %
(3.7-6.7)
8.2%
(6.4-10.0)
Percentage with three or more of the above risk factors,
aged 25 to 44 years
6.4 %
(5.2-7.7)
8.7 %
(6.7-10.7)
3.9 %
(2.8-4.9)
Percentage with three or more of the above risk factors,
aged 45 to 64 years
14.4 %
(12.6-16.2)
20.7 %
(17.6-23.7)
8.9 %
(7.1-10.8)
Percentage with three or more of the above risk factors,
aged 25 to 64 years
9.1%
(8.0-10.1)
12.4 %
(10.7-14.1)
5.7 %
(4.7-6.7)
For additional information, please contact:
STEPS country focal point Dr PRAK Piseth Rainsey: [email protected]

Morning exercise of a group of overweight men in Phnom Penh
(Photo taken with informed consent, S Oum, July 2010)