nbr national bank of rwanda annual report 2006
TRANSCRIPT

NBR NATIONAL BANK OF RWANDA
ANNUAL REPORT 2006
JUNE 2007

2
Table of contents Part I: Economic and financial development
Chapter I International economic environment.…………………………………………………………………….5
I.1 Economic overview …………………………..…………………………………………………………………..5
I.2 World trade ………………………….……………………………………………………………………………….9
I.3 Interest rates and capital markets ………………….…………………………………………………10
Chapter II National economic development ...…………….………………………………………………………….13
II.1 Real sector ……….………………………………………………………………………………………………….13
II.1.1 Gross domestic product …….………………………………………………………………….13
II.1.2 Prices ………….………………………………………………………………………………………26
II.2 Public finance and domestic public debt …….………………………………………………….34
II.2.1 Public finance…………………………..………………….…………………………………………34
II.2.2 Domestic public debt………………………….……………………………………………………38
II.3 Monetary and financial sector ………………..……………………………………………………….39
II.3.1 Monetary sector ...………………………………………………………………………………….39
II.3.2 Extended monetary survey ………………………………………………………………………47
II.4 External sector ……………………………………………………………………………………………………..48
II.4.1 Balance of payments ………………..……………………………………………………………48
II.4.2 Foreign debt …………………………………………………..………………………………………60
Part II Activities of the Bank
Chapter III Activities related to the main missions of the Bank………………………………….………….71
III.1 Foreign exchange policy and operations……………………………………………………………….71
III.1.1 Foreign exchange policy……………………………………………………………………………….71
III.1.2 NBR foreign exchange operations….…………………………………………………………….74
III.2 Implementation of monetary policy…………………………………………………………………..….77
III.2.1 Regulation measures……………..………………………………………………………………………77
III.2.2 Money market operations…………………………….…………………………………………………77
III.3 Management of special funds and lines of credit…..……………………………………………80
III.3.1 Special funds management …………………………………………………………………………….80

3
III.3.2 Credit lines………………………………….………………………… ……………………………………….85
III 4 Foreign reserves management…………………………………………………………………………………90
III.4.1. NBR foreign assets development in 2006……………………………..……………………….90
III.4.2. Financial performance in 2006…………….………………………………………………………..93
III.4.3. Foreign exchange market……………………………………………………………………………….94
III.5 Currency issuing activities …………………………………………………………………………………….94
III.5.1 Currency in circulation management ……….…………………………………………………….94
III.5.2 Control of counterfeit banknotes………………………………………………………………………97
III.5.3 Clearing house…………………………………………………………………………………………………..98
III.5.4 banknotes and traveller’s cheques Import …………………………………………………..102
III.5.5 NBR branches Operations ………………………………………………………………………………103
III.5.6 Management of dormant accounts…………………………………………………………………103
III.6 Soundness of banking and financial system….…………………..……………………………………104
III.6.1 Bank supervision ………………………………….………………………. ……………………………….104
III.6.2 Supervision of COOPECS and other micro-finance institutions………………….…..110
III.6.3 Information centre for risks and non performing loans…………………………………..115
III.6.4 Payment system……………………………………….………………………………………………………118
Chapter IV Backup activities……………………………………………………………………………………………………….120
IV.1 Statutory management organs of the Bank...………………………………………………………………120
IV.2 Human resources management……….……………………………………………………………………………123
IV.2.1 Personnel movements………………………………………………………………………………………………123
IV.2.2 Social policy…………………………………………………………………………………………………………….128
IV.2.3 Medical services………………………………………………………………………………………………………129
IV.3 Organisation and information systems………………………………………………………………………………130
IV.4 Internal audit of the Bank’s operations…………………….………………………………………………….134
IV.4.1 General Auditing.………….……………………………………………………………………………………….134
IV.4.2 Specific audits……………………………………………………………………………………………………….136
IV.4.3 Investigations commissioned by the Bank management……………………………………….137
IV.5 Legal matters………………………………………………………………………………………………………………….137
IV.6 other backup activities……………………………………………………………………………………………….. 138
4
PART I
ECONOMIC AND FINANCIAL DEVELOPMENT
5
CHAPTER I INTERNATIONAL ECONOMIC ENVIRONMENT
I.1 ECONOMIC OVERVIEW I.1.1 Production During the year 2006, the world economic growth continued at a steady rate in spite of a
slight slowdown in some economies. The inflationary pressures calmed down mainly due to
the decline in energy prices since the month of September. Throughout the year 2006,
according to the International Monetary Fund (IMF) estimates, the economic growth rate
was 5.1% compared to 4.9% recorded in 2005.
In the United States, the growth rate of the economic activity slowed down to a rate of
0.5% in the third quarter of the year against 0.6% in the second quarter due to the decline
of investments in the residential construction industry, following a setback in the property
market. In addition, the increase in imports and the stock adjustment in the manufacturing
industry were among the barriers to the growth of GDP. Nevertheless, the decline in
energy prices and the steady dynamism of earned incomes continued to stimulate
consumption. The economic growth rate therefore remained the highest due to the
steadiness of private consumption. The IMF forecasts in September indicated a growth rate
of 3.4% at the end of 2006 compared to 3.2% in 2005.
In the euro zone, the economic growth remained constant due to the increase in domestic
demand. After a sharp increase during the first six months of the year, the GDP growth
rate was 0.5% in the third quarter of 2006, and accounted for 2.4% for the whole year; the
highest level recorded since the year 2000. The economic outlook for the zone remained
positive and the business climate remained favorable to a growth close to the potential
rate.
In Japan, the economic revival was sustained, due to the strength of exports and the
dynamism of corporate investments. Gross domestic product increased by 0.5% in the third
quarter against 0.4% in the second quarter; that is, an estimate of 2.7% on average
throughout the year, compared to 2.6% in 2005.
6
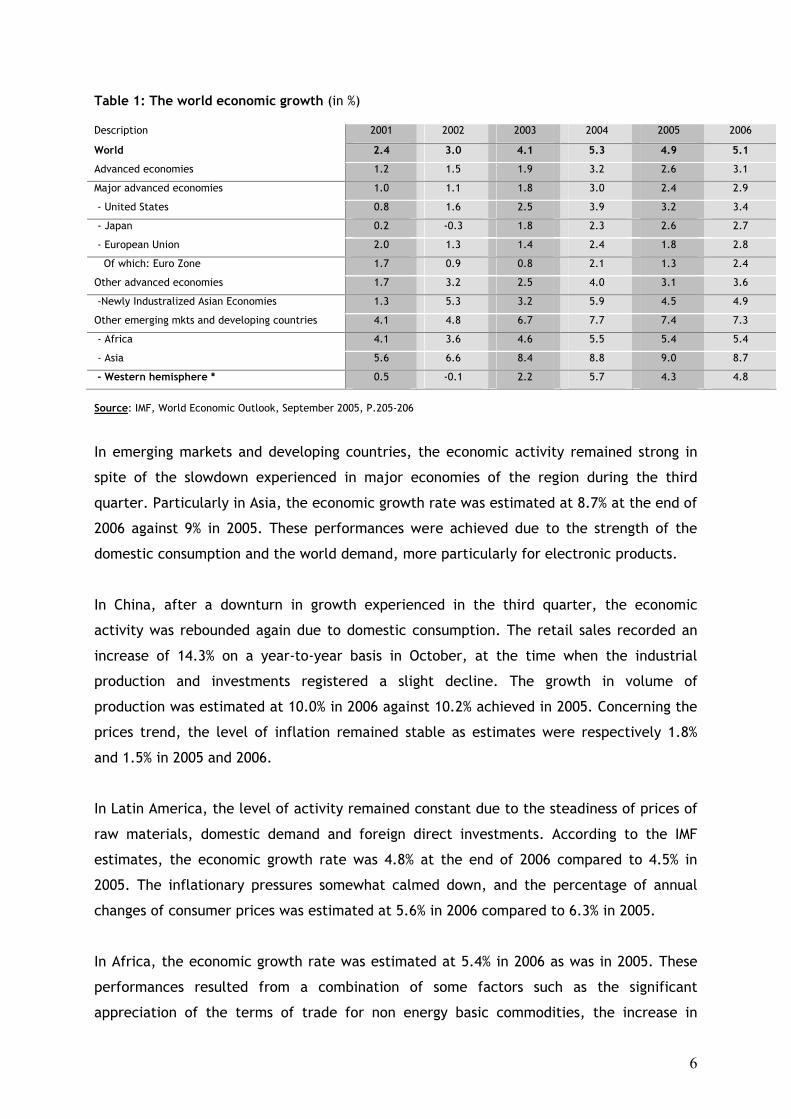
Table 1: The world economic growth (in %) Description 2001 2002 2003 2004 2005 2006
World 2.4 3.0 4.1 5.3 4.9 5.1
Advanced economies 1.2 1.5 1.9 3.2 2.6 3.1
Major advanced economies 1.0 1.1 1.8 3.0 2.4 2.9
- United States 0.8 1.6 2.5 3.9 3.2 3.4
- Japan 0.2 -0.3 1.8 2.3 2.6 2.7
- European Union 2.0 1.3 1.4 2.4 1.8 2.8
Of which: Euro Zone 1.7 0.9 0.8 2.1 1.3 2.4
Other advanced economies 1.7 3.2 2.5 4.0 3.1 3.6
-Newly Industralized Asian Economies 1.3 5.3 3.2 5.9 4.5 4.9
Other emerging mkts and developing countries 4.1 4.8 6.7 7.7 7.4 7.3
- Africa 4.1 3.6 4.6 5.5 5.4 5.4
- Asia 5.6 6.6 8.4 8.8 9.0 8.7
- Western hemisphere * 0.5 -0.1 2.2 5.7 4.3 4.8
Source: IMF, World Economic Outlook, September 2005, P.205-206
In emerging markets and developing countries, the economic activity remained strong in
spite of the slowdown experienced in major economies of the region during the third
quarter. Particularly in Asia, the economic growth rate was estimated at 8.7% at the end of
2006 against 9% in 2005. These performances were achieved due to the strength of the
domestic consumption and the world demand, more particularly for electronic products.
In China, after a downturn in growth experienced in the third quarter, the economic
activity was rebounded again due to domestic consumption. The retail sales recorded an
increase of 14.3% on a year-to-year basis in October, at the time when the industrial
production and investments registered a slight decline. The growth in volume of
production was estimated at 10.0% in 2006 against 10.2% achieved in 2005. Concerning the
prices trend, the level of inflation remained stable as estimates were respectively 1.8%
and 1.5% in 2005 and 2006.
In Latin America, the level of activity remained constant due to the steadiness of prices of
raw materials, domestic demand and foreign direct investments. According to the IMF
estimates, the economic growth rate was 4.8% at the end of 2006 compared to 4.5% in
2005. The inflationary pressures somewhat calmed down, and the percentage of annual
changes of consumer prices was estimated at 5.6% in 2006 compared to 6.3% in 2005.
In Africa, the economic growth rate was estimated at 5.4% in 2006 as was in 2005. These
performances resulted from a combination of some factors such as the significant
appreciation of the terms of trade for non energy basic commodities, the increase in
7
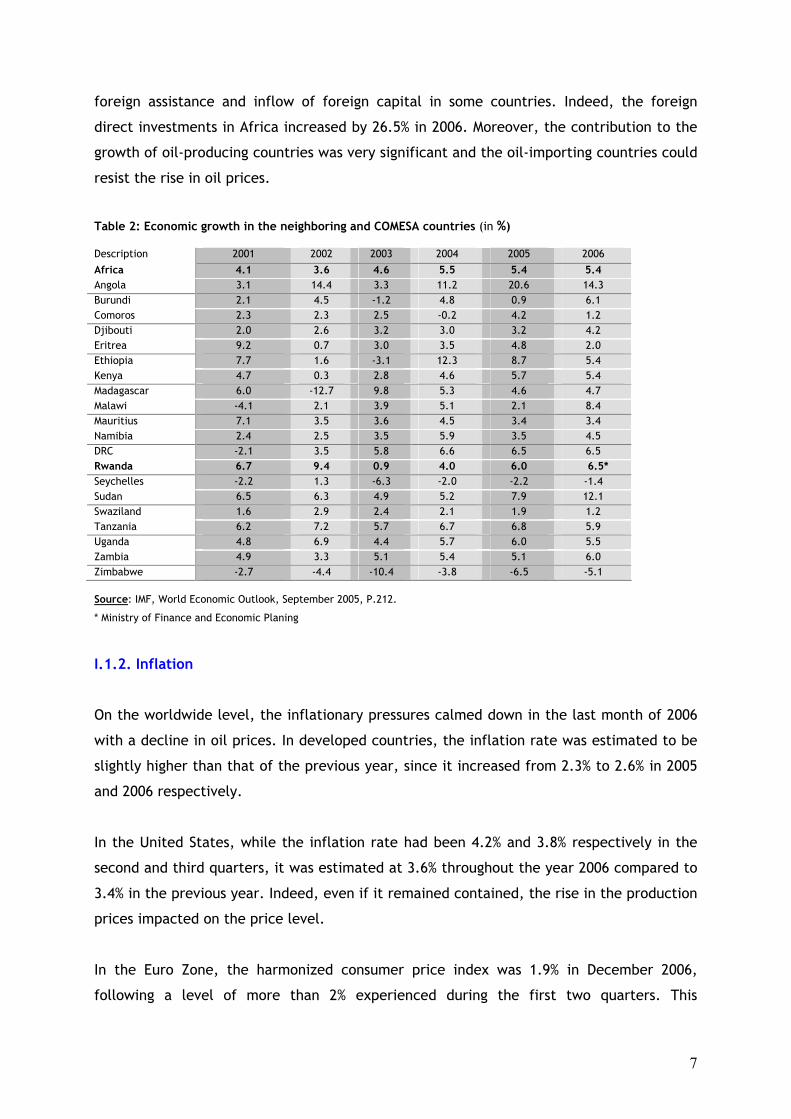
foreign assistance and inflow of foreign capital in some countries. Indeed, the foreign
direct investments in Africa increased by 26.5% in 2006. Moreover, the contribution to the
growth of oil-producing countries was very significant and the oil-importing countries could
resist the rise in oil prices.
Table 2: Economic growth in the neighboring and COMESA countries (in %) Description 2001 2002 2003 2004 2005 2006
Africa 4.1 3.6 4.6 5.5 5.4 5.4 Angola 3.1 14.4 3.3 11.2 20.6 14.3 Burundi 2.1 4.5 -1.2 4.8 0.9 6.1 Comoros 2.3 2.3 2.5 -0.2 4.2 1.2 Djibouti 2.0 2.6 3.2 3.0 3.2 4.2 Eritrea 9.2 0.7 3.0 3.5 4.8 2.0 Ethiopia 7.7 1.6 -3.1 12.3 8.7 5.4 Kenya 4.7 0.3 2.8 4.6 5.7 5.4 Madagascar 6.0 -12.7 9.8 5.3 4.6 4.7 Malawi -4.1 2.1 3.9 5.1 2.1 8.4 Mauritius 7.1 3.5 3.6 4.5 3.4 3.4 Namibia 2.4 2.5 3.5 5.9 3.5 4.5 DRC -2.1 3.5 5.8 6.6 6.5 6.5 Rwanda 6.7 9.4 0.9 4.0 6.0 6.5* Seychelles -2.2 1.3 -6.3 -2.0 -2.2 -1.4 Sudan 6.5 6.3 4.9 5.2 7.9 12.1 Swaziland 1.6 2.9 2.4 2.1 1.9 1.2 Tanzania 6.2 7.2 5.7 6.7 6.8 5.9 Uganda 4.8 6.9 4.4 5.7 6.0 5.5 Zambia 4.9 3.3 5.1 5.4 5.1 6.0 Zimbabwe -2.7 -4.4 -10.4 -3.8 -6.5 -5.1 Source: IMF, World Economic Outlook, September 2005, P.212.
* Ministry of Finance and Economic Planing
I.1.2. Inflation
On the worldwide level, the inflationary pressures calmed down in the last month of 2006
with a decline in oil prices. In developed countries, the inflation rate was estimated to be
slightly higher than that of the previous year, since it increased from 2.3% to 2.6% in 2005
and 2006 respectively.
In the United States, while the inflation rate had been 4.2% and 3.8% respectively in the
second and third quarters, it was estimated at 3.6% throughout the year 2006 compared to
3.4% in the previous year. Indeed, even if it remained contained, the rise in the production
prices impacted on the price level.
In the Euro Zone, the harmonized consumer price index was 1.9% in December 2006,
following a level of more than 2% experienced during the first two quarters. This
8
performance was mainly due to the decline in energy prices that had been going on since
September 2006. On annual average, the inflation rate was 2.3% compared to 2.2% in 2005.
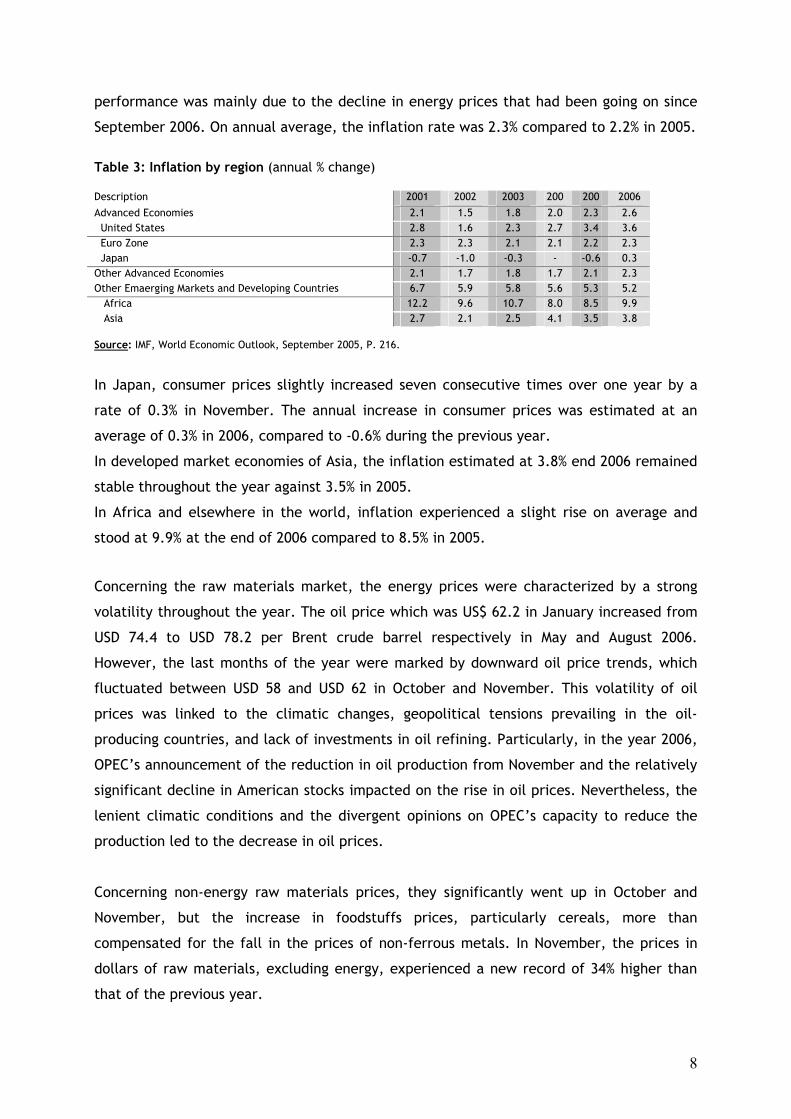
Table 3: Inflation by region (annual % change) Description 2001 2002 2003 200 200 2006
Advanced Economies 2.1 1.5 1.8 2.0 2.3 2.6 United States 2.8 1.6 2.3 2.7 3.4 3.6 Euro Zone 2.3 2.3 2.1 2.1 2.2 2.3 Japan -0.7 -1.0 -0.3 - -0.6 0.3 Other Advanced Economies 2.1 1.7 1.8 1.7 2.1 2.3 Other Emaerging Markets and Developing Countries 6.7 5.9 5.8 5.6 5.3 5.2 Africa 12.2 9.6 10.7 8.0 8.5 9.9 Asia 2.7 2.1 2.5 4.1 3.5 3.8 Source: IMF, World Economic Outlook, September 2005, P. 216.
In Japan, consumer prices slightly increased seven consecutive times over one year by a
rate of 0.3% in November. The annual increase in consumer prices was estimated at an
average of 0.3% in 2006, compared to -0.6% during the previous year.
In developed market economies of Asia, the inflation estimated at 3.8% end 2006 remained
stable throughout the year against 3.5% in 2005.
In Africa and elsewhere in the world, inflation experienced a slight rise on average and
stood at 9.9% at the end of 2006 compared to 8.5% in 2005.
Concerning the raw materials market, the energy prices were characterized by a strong
volatility throughout the year. The oil price which was US$ 62.2 in January increased from
USD 74.4 to USD 78.2 per Brent crude barrel respectively in May and August 2006.
However, the last months of the year were marked by downward oil price trends, which
fluctuated between USD 58 and USD 62 in October and November. This volatility of oil
prices was linked to the climatic changes, geopolitical tensions prevailing in the oil-
producing countries, and lack of investments in oil refining. Particularly, in the year 2006,
OPEC’s announcement of the reduction in oil production from November and the relatively
significant decline in American stocks impacted on the rise in oil prices. Nevertheless, the
lenient climatic conditions and the divergent opinions on OPEC’s capacity to reduce the
production led to the decrease in oil prices.
Concerning non-energy raw materials prices, they significantly went up in October and
November, but the increase in foodstuffs prices, particularly cereals, more than
compensated for the fall in the prices of non-ferrous metals. In November, the prices in
dollars of raw materials, excluding energy, experienced a new record of 34% higher than
that of the previous year.

9
I.2. WORLD TRADE
During the year 2006, the dynamism of the world trade grew stronger, following a
deceleration in the beginning of 2005. However, some economic uncertainties remained,
particularly in relation to the volatility of the prospects for consumption and employment
in European countries. According to the IMF estimates, the real growth of the world trade
was 8.9% at the end of 2006. According to the same estimates, the world export of goods
and services increased by 8% in developed countries and by 10.7% in emerging and
developing countries, compared to the respective rates of 5.5% and 11.8% recorded in
2005. Likewise, the volume of imports increased by 7.5% in developed countries and 13% in
emerging and developing countries. Concerning the terms of trade, they depreciated for
the third consecutive time by 0.9% at the end of 2006 in developed countries, while
improving in emerging and developing countries by 4% in 2006, compared to 4.5% in 2005.
Table 4: Developments of the world trade (annual % change) Description 2001 2002 2003 2004 2005 2006
Trade in goods and services - Volume 0.1 3.4 5.3 10.6 7.4 8.9 - Price deflator in USD -3.3 1.2 10.5 9.7 5.4 4.6 - Trade in volume - Exports Advanced economies -0.9 2.2 3.3 8.8 5.5 8.0 Emerging markets and developing countries 3.6 6.7 10.8 14.6 11.8 10.7 - Imports Advanced economies -0.1 2.6 4.0 9.1 6.0 7.5 Emerging markets and developing countries 3.3 6.5 10.2 16.4 11.9 13.0 - Terms of trade Advanced Economies 0.2 0.8 0.9 -0.2 -1.3 -0.9 Emerging markets and developing countries -3.2 1.2 0.8 2.7 4.5 4.0 Trade in goods World trade - Volume -0.3 3.7 6.3 10.9 7.5 9.4 - Price deflators in USD -3.8 0.6 10.1 9.9 6.1 4.8 World trade prices in USD - Manufactured products -3.7 2.4 14.2 9.4 3.6 2.2 - Petroleum products -13.8 2.5 15.8 30.7 41.3 29.7 - Non petroleum products -4.9 1.7 6.9 18.5 10.3 22.1
Source: IMF, World Economic Outlook, September 2005, P.233.

10
At the same time, the volume of world trade in goods increased by 9.4% in 2006 compared
to 7.5% in the previous year. As for the development of trade in goods by sector, it was
very influenced by the relative increase in prices. Thus, the manufactured products and oil
experienced a significant decline in the growth rate of their prices, which rose by 2.2% and
29.7% respectively at the end of 2006, against 3.6% and 41.3% in 2005. As regards non
energy basic commodities, their prices improved significantly at a progressive rate of 22.1%
in 2006, compared to 10.3% in the previous year.
Table 5: Foreign trade in goods of sub-Sahara African countries (annual % change)
Description 2001 2002 2003 2004 2005 2006
Value in US dollars Exports -6.4 2.6 26.3 30.3 27.1 22.0 Imports 1.2 10.7 25.1 26.2 21.1 16.7 Exports 1.5 1.7 7.3 7.5 5.5 4,5 Imports 6.6 9.7 8.6 9.1 12.4 11,4 Unit value in US dollars Exports -7.8 1.2 18.0 21.2 20.6 17.1 Imports -4.8 2.8 17.8 15.6 8.2 4.9 Terms of trade -3.1 -1.6 0.1 4.8 11.4 11.6
Source: IMF, World Economic Outlook, September 2005, P.237.
The African trade in goods remained constant even if their growth rate significantly came
down in volume and value. The growth rate of African real exports was 4.3% at the end of
2006, against 5.2% in 2005, while real imports increased by 10.5% against 10.7% over the
same period. The terms of trade remained favorable for Africa whose exports mainly
consisted of basic commodities.
This same trend remained valid for sub-Saharan Africa whose trade was appreciably
influenced by the relative price developments. Exports, just as imports in nominal terms,
remained sustained, but their growth rate was very appreciably reduced from 27.1% to
22.0% for exports and from 21.1% to 16.7% for imports between 2005 and 2006. Likewise,
the trends of the volume of exports and imports followed the same trend as the value in
exchanges, that is the respective rates of growth of 4.5% and 11.4% in 2006, against 5.5%
and 12.4% in 2005. Export prices increased more quickly than import prices, and the terms
of trade improved by 11.6% compared to the previous year.

11
I.3. INTEREST RATES AND CAPITAL MARKETS
Within the context of constant world economic growth, central banks adjusted their
monetary policy. Therefore, in order not to exceed the targeted inflation rate, the
European Central Bank (ECB) applied a tight monetary policy consistent with the amount of
liquidity in the economy, the amount of credit and the very low levels of interest rates in
relation to other economic indicators. On December 7, 2006, the Board of Governors
increased by 25 basis points of the EBC’s reference rate, and the discount rate therefore
reached 3.5%, while the facility rate for the marginal loan rose to 4.5%. For the whole year
2006, the leading interest rate of the EBC was 2.8% on average. Short-term as well as long
term interest rates followed the same trend, standing respectively at 3.1% and 4.1% in
2006, compared to 2.2% and 3.4% in 2005. Nevertheless, the rise in short- and long-term
interest rates had only a limited impact on the monetary developments at the end of 2006.
The yield of public bonds increased over 10 years, following the growing optimism of
economic operators as regards the improvement in short- and medium-term economic
outlook.
On December 12, in the United States, the Board of Governors of the Federal Reserves
Bank decided to maintain their reference rate at 5.25%. However, this decision had only a
very limited impact on the yield of the public bonds whose rate passed from 4.28% to
4.79% from 2005 to 2006. For a period of three months, the rates appreciably increased,
passing from 3.2% to 5.1% between 2005 and 2006, and the 10-year interest rates followed
the same trend, rising to 5.1% in 2006 against 4.3% in 2005. The inflationary forecasts, the
steadiness of the risk premium and the best economic outlook that prevailed over the year
2006 led to a very positive yield.
In its meeting of December 18-19, 2006, the Japanese Central Bank decided to maintain its
reference rate at 0.25%. Since the bank gave up the zero rate policy in September 2001,
the new interest rate has not yet changed. The decision to raise the buying rates would
consolidate a monetary policy that is in harmony with the price dynamics whose objective
is to get out of deflation. Thus, for a period of three months, the average deposit rate rose
from 0% to 0.4% from 2005 to 2006. At the same time, long-term rates slightly increased to
1.9% in 2006, compared to 1.4% in 2005.
12
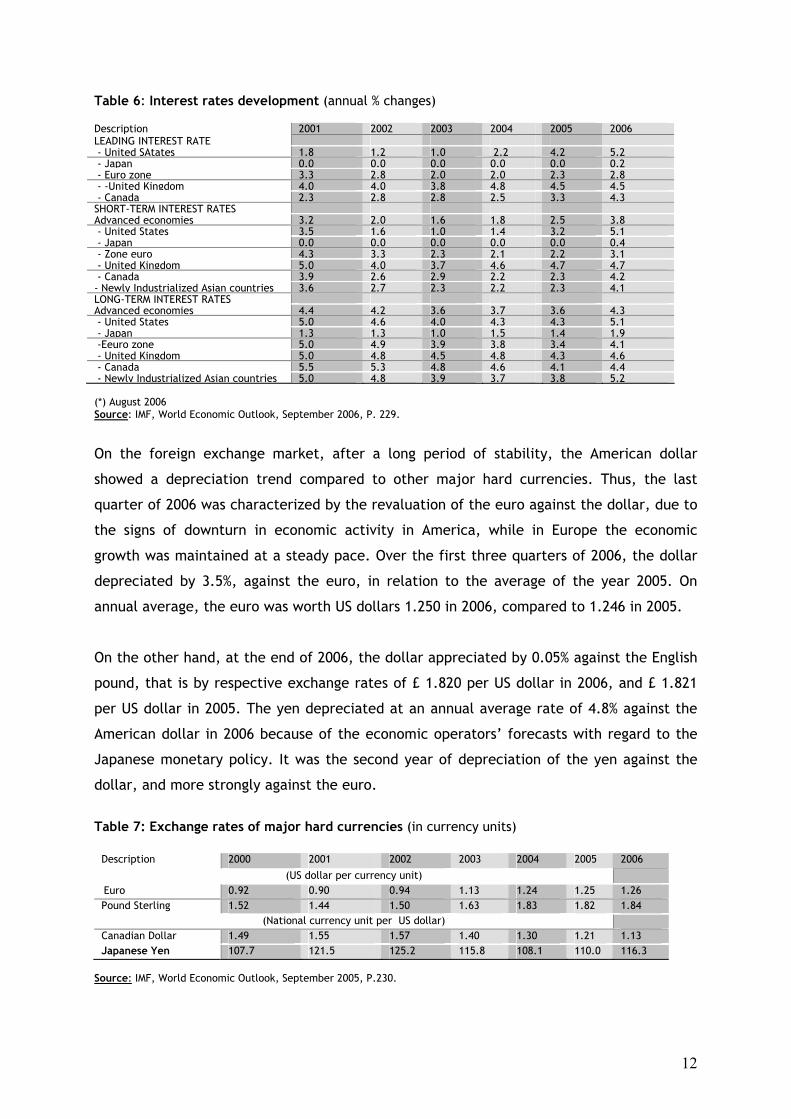
Table 6: Interest rates development (annual % changes) Description 2001 2002 2003 2004 2005 2006 LEADING INTEREST RATE - United SAtates 1.8 1.2 1.0 2.2 4.2 5.2 - Japan 0.0 0.0 0.0 0.0 0.0 0.2 - Euro zone 3.3 2.8 2.0 2.0 2.3 2.8 - -United Kingdom 4.0 4.0 3.8 4.8 4.5 4.5 - Canada 2.3 2.8 2.8 2.5 3.3 4.3 SHORT-TERM INTEREST RATES Advanced economies 3.2 2.0 1.6 1.8 2.5 3.8 - United States 3.5 1.6 1.0 1.4 3.2 5.1 - Japan 0.0 0.0 0.0 0.0 0.0 0.4 - Zone euro 4.3 3.3 2.3 2.1 2.2 3.1 - United Kingdom 5.0 4.0 3.7 4.6 4.7 4.7 - Canada 3.9 2.6 2.9 2.2 2.3 4.2 - Newly Industrialized Asian countries 3.6 2.7 2.3 2.2 2.3 4.1 LONG-TERM INTEREST RATES Advanced economies 4.4 4.2 3.6 3.7 3.6 4.3 - United States 5.0 4.6 4.0 4.3 4.3 5.1 - Japan 1.3 1.3 1.0 1.5 1.4 1.9 -Eeuro zone 5.0 4.9 3.9 3.8 3.4 4.1 - United Kingdom 5.0 4.8 4.5 4.8 4.3 4.6 - Canada 5.5 5.3 4.8 4.6 4.1 4.4 - Newly Industrialized Asian countries 5.0 4.8 3.9 3.7 3.8 5.2 (*) August 2006 Source: IMF, World Economic Outlook, September 2006, P. 229.
On the foreign exchange market, after a long period of stability, the American dollar
showed a depreciation trend compared to other major hard currencies. Thus, the last
quarter of 2006 was characterized by the revaluation of the euro against the dollar, due to
the signs of downturn in economic activity in America, while in Europe the economic
growth was maintained at a steady pace. Over the first three quarters of 2006, the dollar
depreciated by 3.5%, against the euro, in relation to the average of the year 2005. On
annual average, the euro was worth US dollars 1.250 in 2006, compared to 1.246 in 2005.
On the other hand, at the end of 2006, the dollar appreciated by 0.05% against the English
pound, that is by respective exchange rates of £ 1.820 per US dollar in 2006, and £ 1.821
per US dollar in 2005. The yen depreciated at an annual average rate of 4.8% against the
American dollar in 2006 because of the economic operators’ forecasts with regard to the
Japanese monetary policy. It was the second year of depreciation of the yen against the
dollar, and more strongly against the euro.
Table 7: Exchange rates of major hard currencies (in currency units)
Description 2000 2001 2002 2003 2004 2005 2006
(US dollar per currency unit) Euro 0.92 0.90 0.94 1.13 1.24 1.25 1.26
Pound Sterling 1.52 1.44 1.50 1.63 1.83 1.82 1.84 (National currency unit per US dollar)
Canadian Dollar 1.49 1.55 1.57 1.40 1.30 1.21 1.13 Japanese Yen 107.7 121.5 125.2 115.8 108.1 110.0 116.3
Source: IMF, World Economic Outlook, September 2005, P.230.

13
Chapter II: NATIONAL ECONOMIC DEVELOPMENT
II.1 REAL SECTOR II.1.1 GROSS DOMESTIC PRODUCT
1. GDP RESOURCES
Real GDP grew by 6.5% in 2006 compared to the previous year. This growth resulted from
the good performance in the secondary and tertiary sectors, which increased by 17.7% and
7.4% respectively; while that of the primary sector remained rather moderate with an
increase of 0.6%. GDP per capita in Rwandan Francs at current prices improved by 19.8%,
rising from 151.334 to 181.288 thousands RWF between 2005 and 2006. Expressed in USD,
the GDP per capita increased by 21.9%, rising from USD 271 to USD 331, due not only to the
economic growth achieved in 2006, but also to the appreciation of the Rwandan franc
against the US dollar.
Table 8: Developments in resources and uses of GDP (in billion RWF, at constant prices of 2001)
Description 2001 2002 2003 2004 2005 2006 RESOURCES
Primary Sector
283
323
307
309
325 327
Secondary Sector
99
106
110
123
130 153
Tertiary Sector
317
345
361
389
425 456 Imputed bank service charges -13 -12 - 14 - 17 -18 -22
Import taxes
55
61
61
64
69 78 GDP 742 823 825 869 931 992
Economic growth in %
8.5
11.0
0.3
5.3
7.2 6.5 USES
Final consumption
757
846
808
858
922 981
Investments
102
107
116
129
145 151
Exports (G&NFS)
63
64
72
89
95 102
Less imports (G&NFS)
180
194
170
207
232 242 Memo item : Current GDP per capita, in RWF 93 740 96 139 114 530 132 836 151 334 18 1288 in US$ 212 202 214 230 271 331 Source: MINECOFIN, Macroeconomics Department
As far as the structure of GDP is concerned, the tertiary sector was leading with 46.0% in
2006, followed by the primary and secondary sectors with 33% and 15% respectively.
14
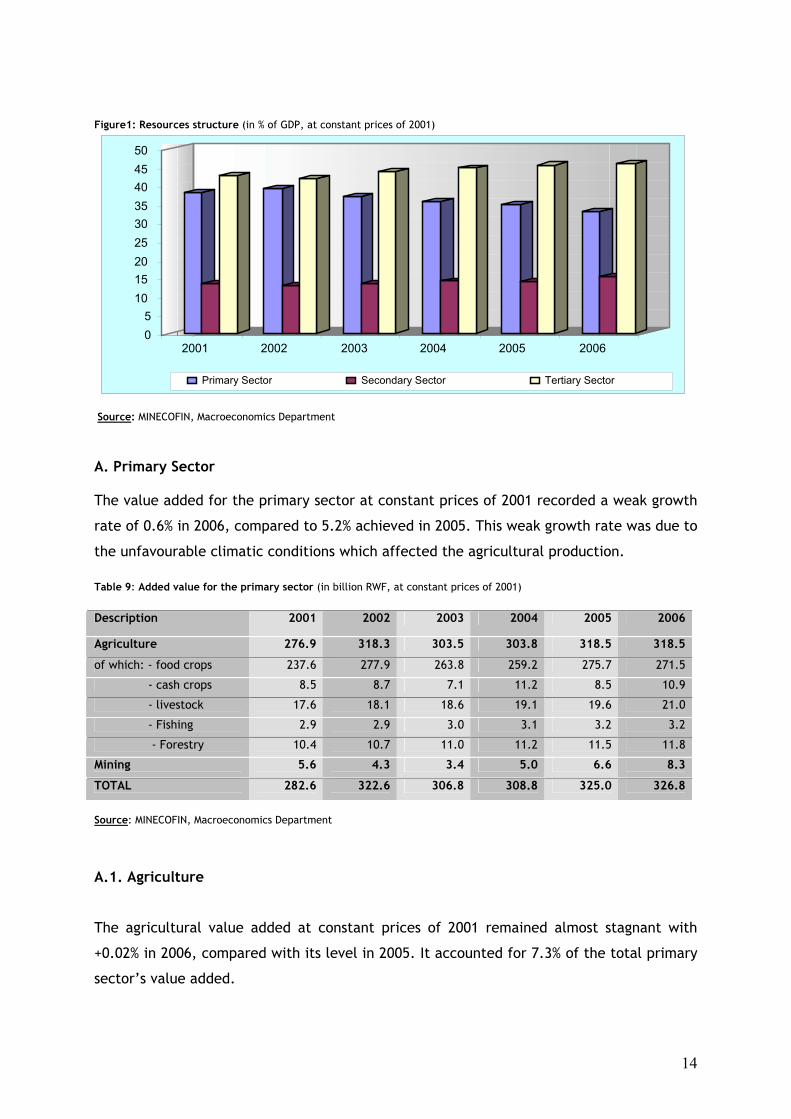
Figure1: Resources structure (in % of GDP, at constant prices of 2001)
Source: MINECOFIN, Macroeconomics Department
A. Primary Sector The value added for the primary sector at constant prices of 2001 recorded a weak growth
rate of 0.6% in 2006, compared to 5.2% achieved in 2005. This weak growth rate was due to
the unfavourable climatic conditions which affected the agricultural production. Table 9: Added value for the primary sector (in billion RWF, at constant prices of 2001)
Description 2001 2002 2003 2004 2005 2006
Agriculture 276.9 318.3 303.5 303.8 318.5 318.5
of which: - food crops 237.6 277.9 263.8 259.2 275.7 271.5
- cash crops 8.5 8.7 7.1 11.2 8.5 10.9
- livestock 17.6 18.1 18.6 19.1 19.6 21.0
- Fishing 2.9 2.9 3.0 3.1 3.2 3.2
- Forestry 10.4 10.7 11.0 11.2 11.5 11.8
Mining 5.6 4.3 3.4 5.0 6.6 8.3
TOTAL 282.6 322.6 306.8 308.8 325.0 326.8
Source: MINECOFIN, Macroeconomics Department
A.1. Agriculture
The agricultural value added at constant prices of 2001 remained almost stagnant with
+0.02% in 2006, compared with its level in 2005. It accounted for 7.3% of the total primary
sector’s value added.
0 5
10 15 20 25 30 35 40 45 50
2001 2002 2003 2004 2005 2006
Primary Sector Secondary Sector Tertiary Sector
15
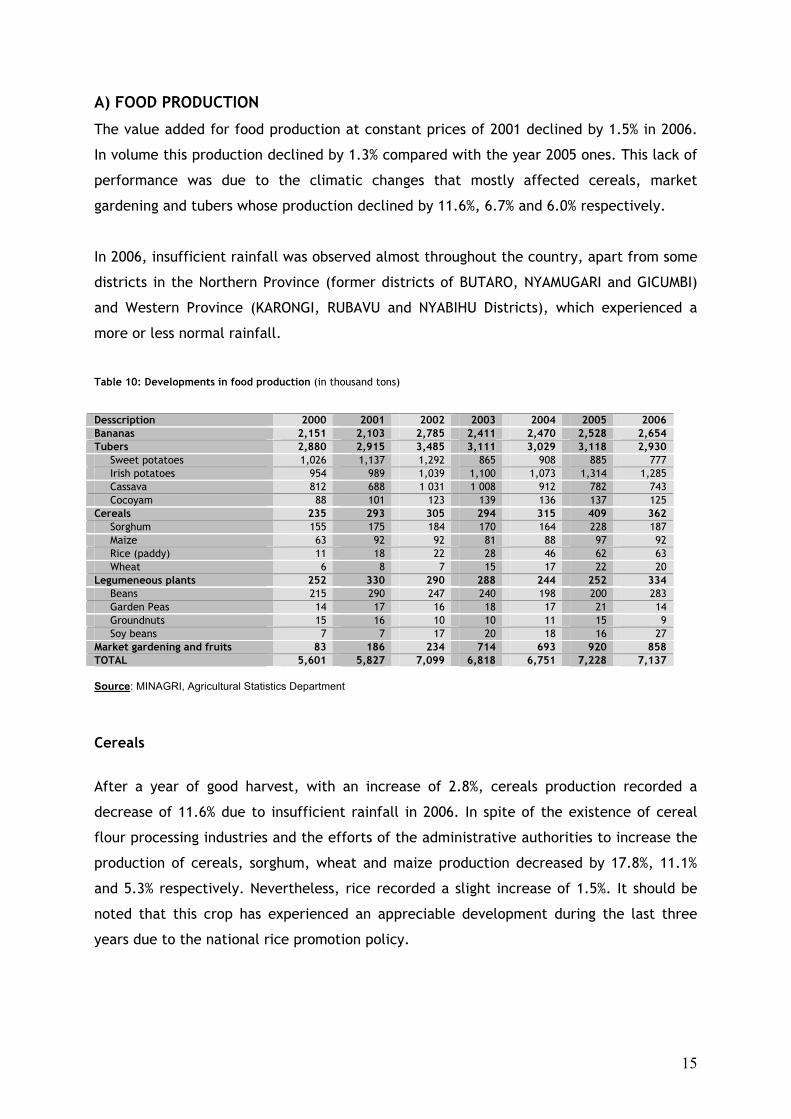
A) FOOD PRODUCTION
The value added for food production at constant prices of 2001 declined by 1.5% in 2006.
In volume this production declined by 1.3% compared with the year 2005 ones. This lack of
performance was due to the climatic changes that mostly affected cereals, market
gardening and tubers whose production declined by 11.6%, 6.7% and 6.0% respectively.
In 2006, insufficient rainfall was observed almost throughout the country, apart from some
districts in the Northern Province (former districts of BUTARO, NYAMUGARI and GICUMBI)
and Western Province (KARONGI, RUBAVU and NYABIHU Districts), which experienced a
more or less normal rainfall.
Table 10: Developments in food production (in thousand tons)
Desscription 2000 2001 2002 2003 2004 2005 2006 Bananas 2,151 2,103 2,785 2,411 2,470 2,528 2,654 Tubers 2,880 2,915 3,485 3,111 3,029 3,118 2,930 Sweet potatoes 1,026 1,137 1,292 865 908 885 777 Irish potatoes 954 989 1,039 1,100 1,073 1,314 1,285 Cassava 812 688 1 031 1 008 912 782 743 Cocoyam 88 101 123 139 136 137 125 Cereals 235 293 305 294 315 409 362 Sorghum 155 175 184 170 164 228 187 Maize 63 92 92 81 88 97 92 Rice (paddy) 11 18 22 28 46 62 63 Wheat 6 8 7 15 17 22 20 Legumeneous plants 252 330 290 288 244 252 334 Beans 215 290 247 240 198 200 283 Garden Peas 14 17 16 18 17 21 14 Groundnuts 15 16 10 10 11 15 9 Soy beans 7 7 17 20 18 16 27 Market gardening and fruits 83 186 234 714 693 920 858 TOTAL 5,601 5,827 7,099 6,818 6,751 7,228 7,137 Source: MINAGRI, Agricultural Statistics Department
Cereals
After a year of good harvest, with an increase of 2.8%, cereals production recorded a
decrease of 11.6% due to insufficient rainfall in 2006. In spite of the existence of cereal
flour processing industries and the efforts of the administrative authorities to increase the
production of cereals, sorghum, wheat and maize production decreased by 17.8%, 11.1%
and 5.3% respectively. Nevertheless, rice recorded a slight increase of 1.5%. It should be
noted that this crop has experienced an appreciable development during the last three
years due to the national rice promotion policy.
16
Tubers
The climatic conditions also affected all tuber crops, so that sweet potatoes, cocoyams,
Irish potatoes and cassava production decreased by 12.2%, 8.5%, 5% and 2.2% respectively.
In general, tubers’ production declined by 6.0% in 2006, compared with the year 2005.
Market gardening and fruits
In 2006, market gardening and fruits production declined by 6.7% when compared with
2005, following climatic conditions.
Banana
Owing to Government’s efforts to protect and diversify banana plantations, banana
production improved these last years, rising from 2 528 to 2 654 thousands of tons, which is
an increase of 5% between 2005 and 2006.
Legumes
After a slight recovery in legumes’ production in 2005, the year 2006 experienced a very
good performance with a rise of 32.4%. This performance concerned beans and soya beans
whose production increased by 41.7% and 69.6% respectively, while garden peas and
groundnuts production recorded increaments of 32.4% and 39.9% respectively.
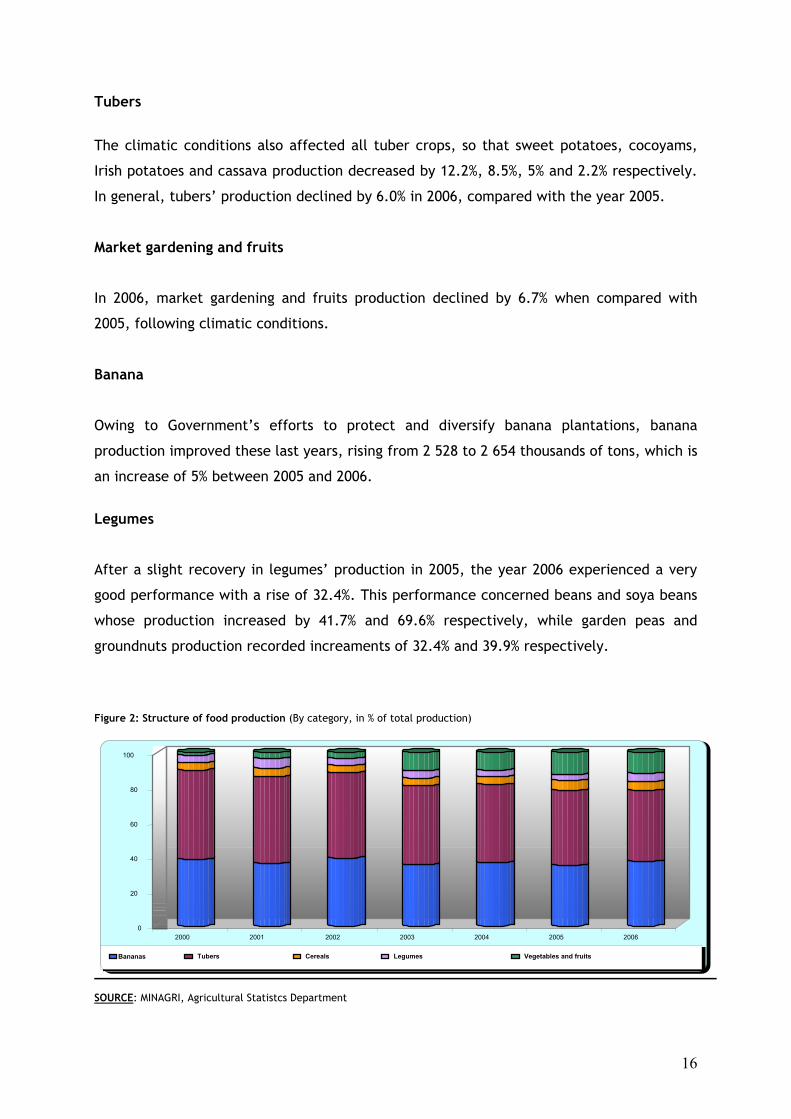
Figure 2: Structure of food production (By category, in % of total production)
SOURCE: MINAGRI, Agricultural Statistcs Department
0
20
40
60
80
100
2000 2001 2002 2003 2004 2005 2006 Bananas Tubers Cereals Legumes Vegetables and fruits

17
b) Export crops
Agricultural products remained the country’s major exports to the international markets.
Owing to coffee performance, value added in this branch of activity at constant prices of
2001, increased by 21.5% in 2006 compared with the year 2005.
Coffee
Thanks in particular to a good policy of supervision of peasants by agriculture veterinaries
and supply of pesticides and fertilizers, coffee production increased by 41.6% in 2006. With
the increase of washing stations in almost all the regions of the country, the quality of
Rwandan coffee also continues to improve. The operational washing stations increased to
84 in 2006 compared to 45 in 2005. It is worth noting that the long-term objective is to
have enough washing stations to highly improve the quality of Rwandan coffee.
High quality coffee production known as "Fully washed" increased significantly, passing
from 1,100 to 1,846 tons that is an increase of 67.8% between 2005 and 2006. Farmers as
well as investors in this sector were extremely encouraged by the stability of coffee prices
on international market which averaged US$/kg 3.19 annually.
Tea
Tea production rose by 3.1% in 2006 after the privatization of some manufacturing units
made it possible to improve production and marketing of this crop. For instance, PFUNDA
unit successively produced 1,245 tons in 2005 and 1,330 tons in 2006, compared to 920
tons in 2004, the year of its privatization.
Pyrethrum
Pyrethrum production experienced a remarkable progress for the two consecutive years
with an increase of 53.7% in 2006. It rose to 30 tons compared to 20 tons in the previous
year, and only 1.4 tons in 2004. This performance was achieved due, inter alia, to the
improvement in electricity supply by the end of 2005.

18
Table 11: Exports crops production (in tons) Description 2001 2002 2003 2004 2005 2006
Marketable coffee 18,267 19,427 14,175 28,762 18,597 26,598
Ordinary coffee 18,799 19,397 13,841 28,246 17,497 24,752
Fully washed coffee 30 334 516 1,100 1,846
Dry tea 17,814 14,948 15,483 14,178 16,458 1,973
Pyrethrum extract 22 13 15 1.4 20 30
Source: OCIR THE, Statistics Department & OCIR CAFÉ, SOPYRWA
A.2. Animal production
The value added of livestock production at constant prices of 2001 increased by 6.7% in
2006 compared with that of the year 2005. The livestock sub-sector improved by an
increase of 7.3%, while fishing almost remained unchanged.
Indeed, thanks to the improvement in the breeds of cattle distributed to peasants by the
Government project "One Cow One Household Program" financed by donors, milk
production increased by 46%, rising from 133.8 to 195.38 million of litres between 2005
and 2006. Over the same period, meat production also recorded a remarkable rise of 28.3%
of the total volume. This rise was explained by the fact that the large scale cattle-
breeding areas (Eastern Province, especially former UMUTARA and KIBUNGO Provinces) did
not experience a lot of cases of foot-and-mouth disease as in the previous years, and a
good proportion of the livestock repatriated from Tanzania by the Rwandans who returned
to the country was sold for slaughtering.
Table 12: Animal production development Description 2001 2002 2003 2004 2005 2006
Meat (in thousand tons)
35.1
37.1
41.5
43.6
53.6
68.7
Cattle
9.9
10.7
12.5
14.2
13.1
19.0
Goats
5.5
6.5
6.7
6.7
9.2
13.6
Sheep
1.6
1.6
2.1
2.3
2.7
3.9
Pigs
16.5
15.3
17.3
16.2
25.5
28.6
Rabbits
0.5
0.6
0.5
0.7
0.7
0.9
Poultry
1.1
2.4
2.4
3.4
2.4
2.8
Milk (in million litres)
36.2
73.9
127.1
132.2
13.8
195.3
Eggs (in tons)
589
1256
1284
1805
1251
1303 Source: MINAGRI
19
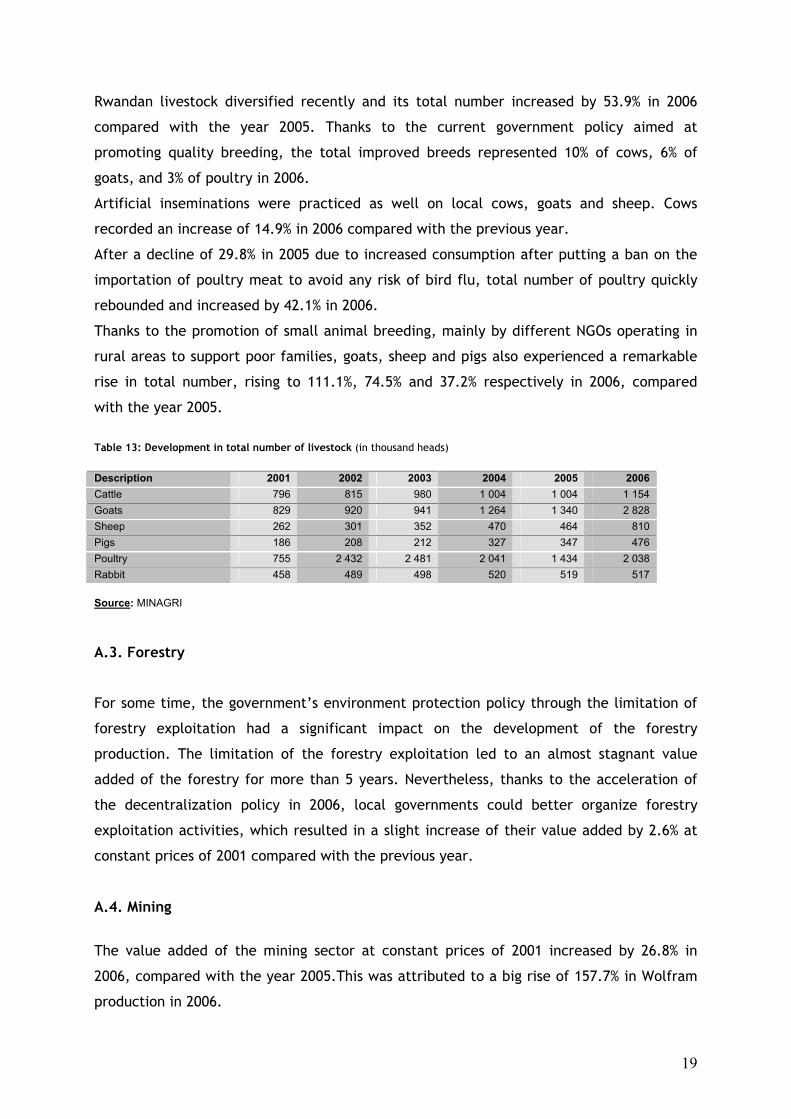
Rwandan livestock diversified recently and its total number increased by 53.9% in 2006
compared with the year 2005. Thanks to the current government policy aimed at
promoting quality breeding, the total improved breeds represented 10% of cows, 6% of
goats, and 3% of poultry in 2006.
Artificial inseminations were practiced as well on local cows, goats and sheep. Cows
recorded an increase of 14.9% in 2006 compared with the previous year.
After a decline of 29.8% in 2005 due to increased consumption after putting a ban on the
importation of poultry meat to avoid any risk of bird flu, total number of poultry quickly
rebounded and increased by 42.1% in 2006.
Thanks to the promotion of small animal breeding, mainly by different NGOs operating in
rural areas to support poor families, goats, sheep and pigs also experienced a remarkable
rise in total number, rising to 111.1%, 74.5% and 37.2% respectively in 2006, compared
with the year 2005.
Table 13: Development in total number of livestock (in thousand heads)
Description 2001 2002 2003 2004 2005 2006 Cattle 796 815 980 1 004 1 004 1 154 Goats 829 920 941 1 264 1 340 2 828 Sheep 262 301 352 470 464 810 Pigs 186 208 212 327 347 476 Poultry 755 2 432 2 481 2 041 1 434 2 038 Rabbit 458 489 498 520 519 517 Source: MINAGRI A.3. Forestry
For some time, the government’s environment protection policy through the limitation of
forestry exploitation had a significant impact on the development of the forestry
production. The limitation of the forestry exploitation led to an almost stagnant value
added of the forestry for more than 5 years. Nevertheless, thanks to the acceleration of
the decentralization policy in 2006, local governments could better organize forestry
exploitation activities, which resulted in a slight increase of their value added by 2.6% at
constant prices of 2001 compared with the previous year.
A.4. Mining
The value added of the mining sector at constant prices of 2001 increased by 26.8% in
2006, compared with the year 2005.This was attributed to a big rise of 157.7% in Wolfram
production in 2006.

20
On the other hand, tin and Coltan production declined by 15.4% and 31.8% respectively,
compared with the year 2005. This led to a slight rise of 1.8% in the total mining
production in 2006, which implies that the rise in this sector’s value added is much more
bound to the improvement in ore prices and/or declining in their mining costs.
Table 14: Production of major precious metals development (in tons) 2000 2001 2002 2003 2004 2005 2006
Tin 365 555 672 1,458 354 4,532 3,835
Colombo Tantalite
360 395 277 187 220 276 188
Wolfram 144 162 325 120 157 557 1,436
TOTAL 869 1,112 1,274 1,765 3,931 5,365 5,459 Source: MINITERE, Mining and Geology Department B. Secondary sector
During the year 2006, the valued added of the secondary sector at constant prices of 2001
rose by 17.7%, mainly due to manufacturing industry’s good performance, whose value
added increased by 22.6%. The added value in “Construction and Public Works” branch also
recorded a considerable increase of 10.7%, while that of electrical energy production
strongly increased by 52.0%. However, this rise does not reflect a sustainable solution to
the energy crisis that the country has been undergoing for three years, but rather
represents the use of additional generators that were installed during the year 2006.
Figure 3: Value added in secondary sector by branch of activity (in billion RWF, at constant prices of 2001)
SOURCE: MINICOFIN, Macroéconomics Department
3.3
3.8
4.2
3.5
4.1
6.2
51.3
56.3
56.4
60.0
62.3
76.4
44.8
46.0
49.8
59.3
63.9
70.7
0.0 20.0 40.0 60.0 80.0 100.0
2001
2002
2003
2004
2005
2006
Electricity, gas and water Manufacturing industry Construction
21
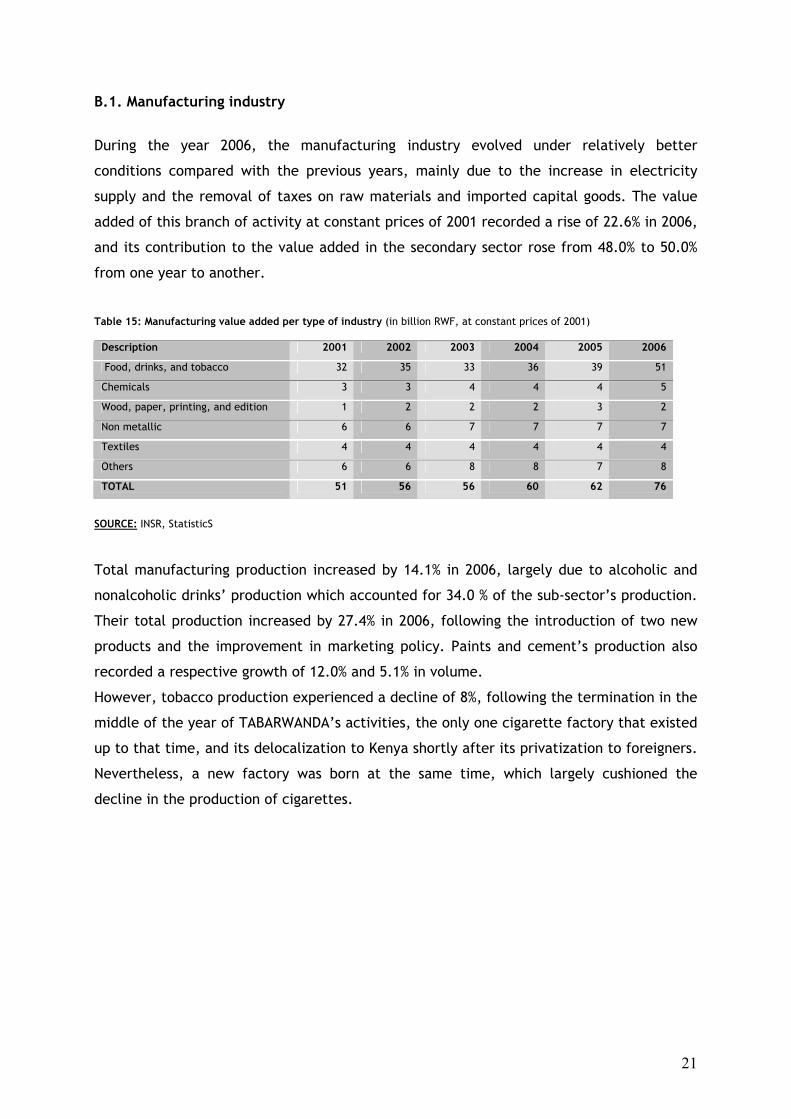
B.1. Manufacturing industry
During the year 2006, the manufacturing industry evolved under relatively better
conditions compared with the previous years, mainly due to the increase in electricity
supply and the removal of taxes on raw materials and imported capital goods. The value
added of this branch of activity at constant prices of 2001 recorded a rise of 22.6% in 2006,
and its contribution to the value added in the secondary sector rose from 48.0% to 50.0%
from one year to another.
Table 15: Manufacturing value added per type of industry (in billion RWF, at constant prices of 2001)
Description 2001 2002 2003 2004 2005 2006
Food, drinks, and tobacco 32 35 33 36 39 51
Chemicals 3 3 4 4 4 5
Wood, paper, printing, and edition 1 2 2 2 3 2
Non metallic 6 6 7 7 7 7
Textiles 4 4 4 4 4 4
Others 6 6 8 8 7 8
TOTAL 51 56 56 60 62 76
SOURCE: INSR, StatisticS
Total manufacturing production increased by 14.1% in 2006, largely due to alcoholic and
nonalcoholic drinks’ production which accounted for 34.0 % of the sub-sector’s production.
Their total production increased by 27.4% in 2006, following the introduction of two new
products and the improvement in marketing policy. Paints and cement’s production also
recorded a respective growth of 12.0% and 5.1% in volume. However, tobacco production experienced a decline of 8%, following the termination in the
middle of the year of TABARWANDA’s activities, the only one cigarette factory that existed
up to that time, and its delocalization to Kenya shortly after its privatization to foreigners.
Nevertheless, a new factory was born at the same time, which largely cushioned the
decline in the production of cigarettes.

22
Table 16: Evolution of the major industrial production (in tons, unless otherwise indicated)
Description 2000 2001 2002 2003 2004 2005 2006 Animal feeds 3 118 3 264 3 362 3 563 3 670 3 340 3 340
Modern beer (in thousand litres) 44 244 47 961 53 993 41 228 43 795 54 053 70 218
Confectionaries 12 600 12 978 13 367 13 902 15 292 16 821 18 167
Soft drinks (in thousand litres) 20 778 22 842 21 407 19 279 21 650 28 653 35 152
Tobacco (in million units) 327 278 391 324 365 373 343
Textiles (in metres) 9 934 10 431 3 684 4 254 3 957 3 698 3 532
Hides and Skins 1 742 1 829 1 983 2 728 2 150 3 138 3 527
Paints 1 041 1 363 1 745 2 422 2 274 2 114 2 367
Cement 70 716 88 161 100 568 110 104 104 288 101 127 10 6253
Corrugated iron sheets 5 435 4 532 3 993 5 191 6 022 6 684 7586
Coffee 16 098 18 268 19 546 13 805 28 762 18 597 26 341
Tea 1 4481 17 817 15 879 15 437 14 193 16 457 16 973
Sugar 1 068 6 363 6 589 6 791 8 256 9 972 9862
Soaps 5 867 4 043 5 571 7 880 7 412 6 530 6 428
PVC tubes 3 578 3 864 3 091 4 328 4 692 4 960 5 310 SOURCE: INSR, Macroéconomics Statistics
B.2. Electricity, gas and water supply
The use of additional power generators in 2006 resulted in an increase of the value added
by 52.0% at the 2001 constant prices of electricity and water supply. Electricity supply
increased to 168 million of kWh compared to 116 million of kWh in 2005 that is an increase
of 45.3%.
Water supply almost remained stagnant for the three consecutive years in spite of its low
level in relation to the high demand. This is a very alarming situation in view of the low
degree of satisfaction of the population’s drinking water requirements in cities and rural
areas. Nevertheless, it is hoped that the planned big projects to build new water purifying
stations at KARENGE and NYABARONGO will bring about a sustainable solution to this
problem.
Table 17: Production and availability of electricity, gas and water
Description 2000 2001 2002 2003 2004 2005 2006 1. Electricity (in million kWh)
National production 110 89 93 118 91 116 168
Exports 1 1 8 3 2 2 2
Imports 94 122 136 121 116 89 64
Electricity available 203 209 226 235 204 203 230
2. Treated water (in million m3) 16 16 17 18 16 16 16
3. Methane gas (in million Nm) 1,4 0,8 0,9 0,3 0,14 0,17 0,0
SOURCE: ELECTROGAZ & METHANE GAS PRODUCTION UNIT

23
Concerning the extraction of methane gas, it is worth to point out that the small
extraction unit on the Lake Kivu terminated its activities in 2006. Built in 1963, it was too
obsolete and extraction cost had become increasingly unbearable. The extraction process
will resume only with the implementation of a new big project which is still under
consideration to extract methane in view of power energy.
B.3. Construction and Public Works
Construction and public works branch is increasingly becoming significant in the industrial
sector since it accounted for 46.0% of its added value at constant prices of 2001. In 2006,
this sector recorded an increase of 10.7% of its added value at constant prices of 2001,
against 7.7% in 2005. This growth was primarily due to the construction and rehabilitation
of road and housing infrastructures.
Figure 4: Value added of the construction and public works branch (in billion RWF, at constant prices of 2001)
SOURCE: MINECOFIN, Macroeconomics Department
C. Tertiary Sector
In 2006, the value added at constant prices of 2001 of the tertiary sector increased by
7.4%, primarily generated by commercial activities, public administrations and financial
services. The contribution of this sector to the 2006 GDP, at 2001 constant prices,
amounted to 46.0%, which is the same rate as the previous year.
0.0
10.0
20.0
30.0
40.0
50.0
60.0
70.0
80.0
2001 2002 2003 2004 2005 2006
Building industry and Public Works
24
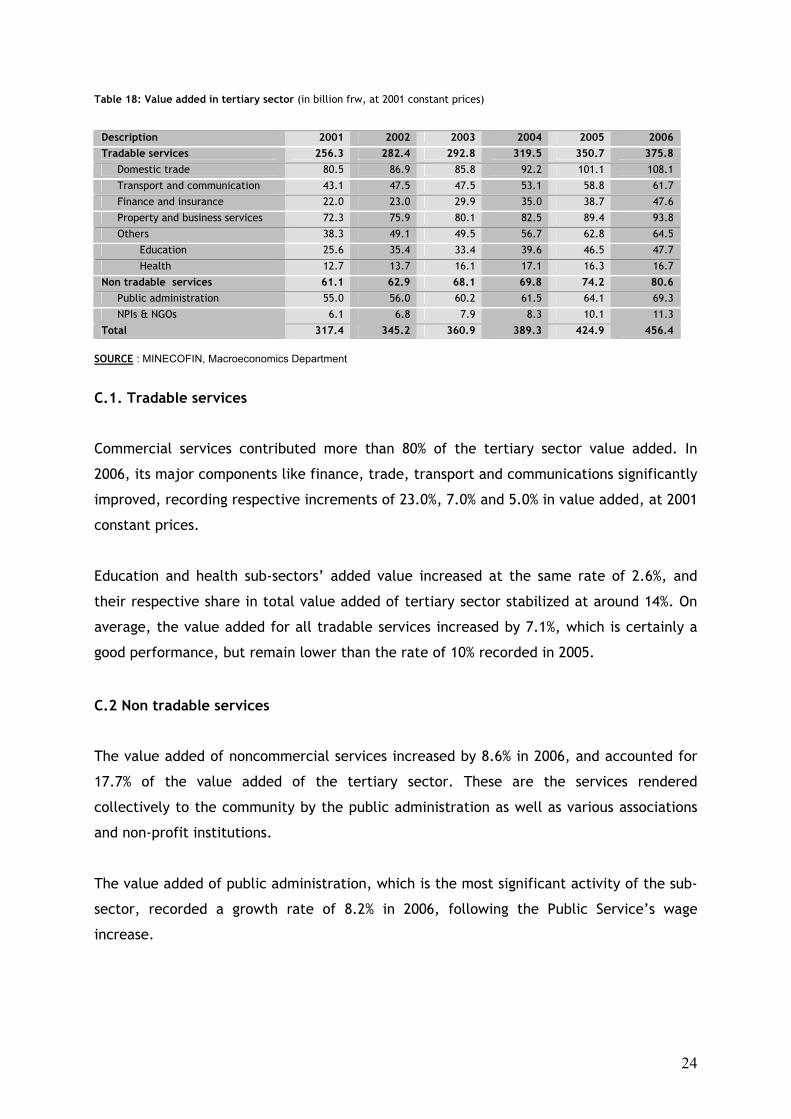
Table 18: Value added in tertiary sector (in billion frw, at 2001 constant prices)
Description 2001 2002 2003 2004 2005 2006 Tradable services 256.3 282.4 292.8 319.5 350.7 375.8 Domestic trade 80.5 86.9 85.8 92.2 101.1 108.1
Transport and communication 43.1 47.5 47.5 53.1 58.8 61.7
Finance and insurance 22.0 23.0 29.9 35.0 38.7 47.6
Property and business services 72.3 75.9 80.1 82.5 89.4 93.8
Others 38.3 49.1 49.5 56.7 62.8 64.5
Education 25.6 35.4 33.4 39.6 46.5 47.7
Health 12.7 13.7 16.1 17.1 16.3 16.7
Non tradable services 61.1 62.9 68.1 69.8 74.2 80.6 Public administration 55.0 56.0 60.2 61.5 64.1 69.3
NPIs & NGOs 6.1 6.8 7.9 8.3 10.1 11.3
Total 317.4 345.2 360.9 389.3 424.9 456.4 SOURCE : MINECOFIN, Macroeconomics Department
C.1. Tradable services
Commercial services contributed more than 80% of the tertiary sector value added. In
2006, its major components like finance, trade, transport and communications significantly
improved, recording respective increments of 23.0%, 7.0% and 5.0% in value added, at 2001
constant prices.
Education and health sub-sectors’ added value increased at the same rate of 2.6%, and
their respective share in total value added of tertiary sector stabilized at around 14%. On
average, the value added for all tradable services increased by 7.1%, which is certainly a
good performance, but remain lower than the rate of 10% recorded in 2005.
C.2 Non tradable services
The value added of noncommercial services increased by 8.6% in 2006, and accounted for
17.7% of the value added of the tertiary sector. These are the services rendered
collectively to the community by the public administration as well as various associations
and non-profit institutions.
The value added of public administration, which is the most significant activity of the sub-
sector, recorded a growth rate of 8.2% in 2006, following the Public Service’s wage
increase.

25
Figure 5: Value added for major tertiary sector activities (in billion RWF, at constant prices of 2001)
SOURCE: MINECOFIN, MACROECONOMICS DEPARTMENT
2. GDP USES Final consumption increased by 23.7% at the current prices in 2006, compared to the year
2005. This increase was much more due to private sector final consumption, which rose to
27.2% against 22.9% for the public sector consumption.
Table 19: Structure of GDP uses (in billion RWF, at current prices)
Description 2001 2002 2003 2004 2005 2006 Final consumption expenditure 757 811 982 1,152 1,348 1,668 Public administration 139 152 182 206 239 304
Private (including changes in stock) 619 659 800 946 1110 1364
Gross domestic investments 102 106 133 171 209 235 Gross capital Formation 102 106 133 171 209 235
Construction 73 74 91 124 146 166
Equipments (durable goods) 28 31 42 47 63 69
Resource Balance -117 -136 -160 -185 -226 -271 Exports (G&NSF) 63 54 75 115 136 142
Goods (fob) 41 32 34 56 70 76
Non factor Services 21 22 41 59 67 66
Imports (G&NSF) 180 189 235 301 362 413
Goods (fob) 102 101 125 163 203 226
Non factor services 78 89 110 138 160 187
Nominal GDP 742 781 955 1,138 1,332 1,632 SOURCE : MINECOFIN, Macroeconomics Department
Gross domestic investment at current prices also increased by 12.2% compared to the 2005
level. Private sector investment increased by about 33.0% against 10.3% in 2005. This
investment primarily took place at the level of real estate and industry sectors.
-
20
40
60
80
100
120
2001 2002 2003 2004 2005 2006 Domestic trade Transport & communication Finances Publ. Adm.& ASBL & NGOs
26
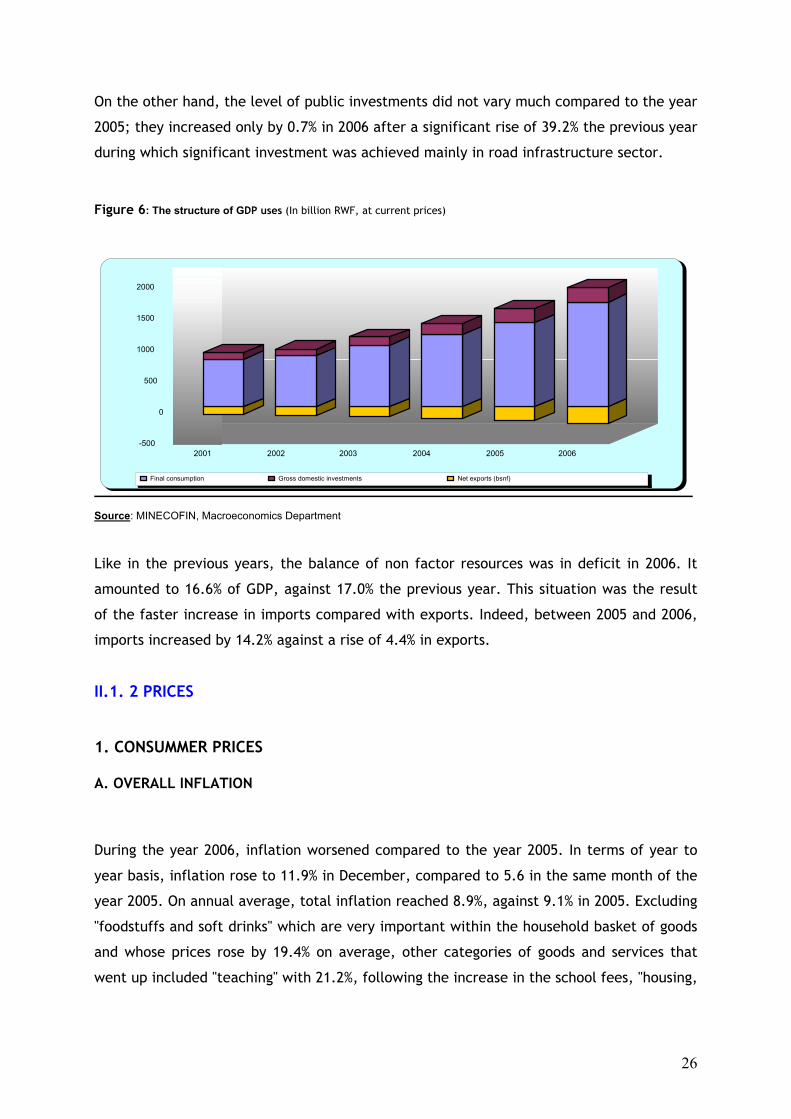
On the other hand, the level of public investments did not vary much compared to the year
2005; they increased only by 0.7% in 2006 after a significant rise of 39.2% the previous year
during which significant investment was achieved mainly in road infrastructure sector.
Figure 6: The structure of GDP uses (In billion RWF, at current prices)
Source: MINECOFIN, Macroeconomics Department
Like in the previous years, the balance of non factor resources was in deficit in 2006. It
amounted to 16.6% of GDP, against 17.0% the previous year. This situation was the result
of the faster increase in imports compared with exports. Indeed, between 2005 and 2006,
imports increased by 14.2% against a rise of 4.4% in exports.
II.1. 2 PRICES
1. CONSUMMER PRICES A. OVERALL INFLATION
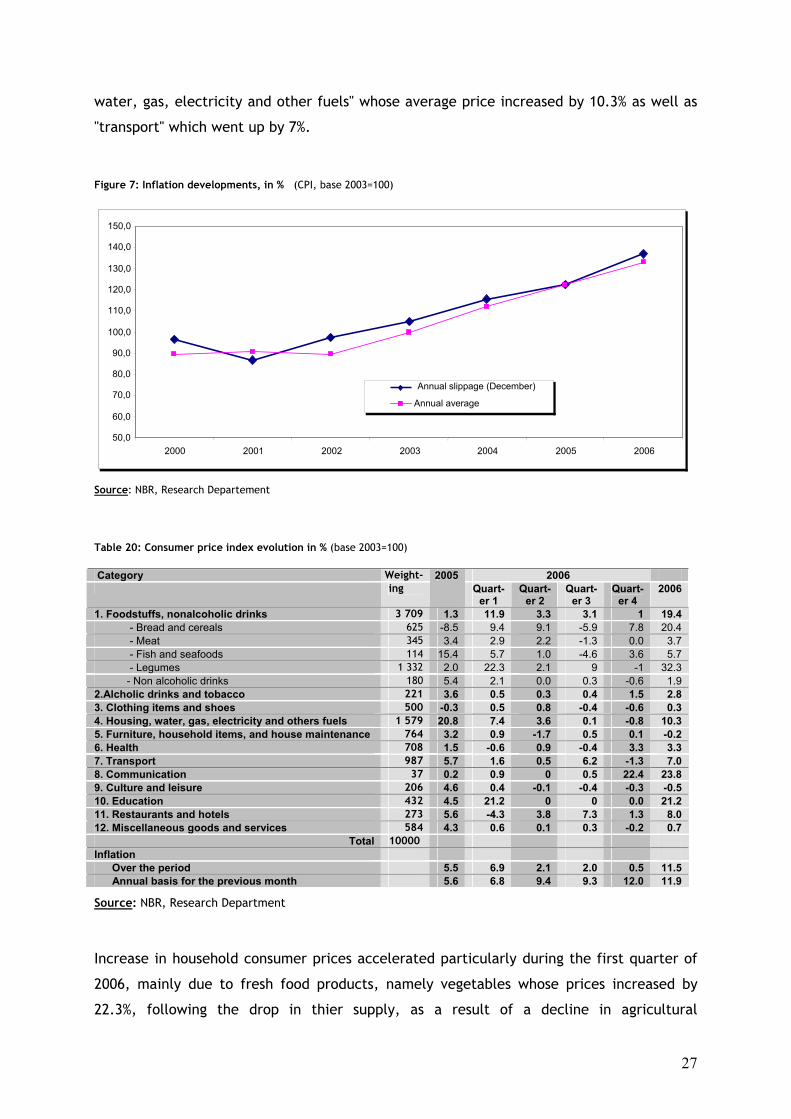
During the year 2006, inflation worsened compared to the year 2005. In terms of year to
year basis, inflation rose to 11.9% in December, compared to 5.6 in the same month of the
year 2005. On annual average, total inflation reached 8.9%, against 9.1% in 2005. Excluding
"foodstuffs and soft drinks" which are very important within the household basket of goods
and whose prices rose by 19.4% on average, other categories of goods and services that
went up included "teaching" with 21.2%, following the increase in the school fees, "housing,
-500
0
500
1000
1500
2000
2001 2002 2003 2004 2005 2006
Final consumption Gross domestic investments Net exports (bsnf)
27
water, gas, electricity and other fuels" whose average price increased by 10.3% as well as
"transport" which went up by 7%.
Figure 7: Inflation developments, in % (CPI, base 2003=100)
Source: NBR, Research Departement
Table 20: Consumer price index evolution in % (base 2003=100)
Category Weight- 2006 ing
2005 Quart-
er 1 Quart-
er 2 Quart-
er 3 Quart-
er 4 2006
1. Foodstuffs, nonalcoholic drinks 3 709 1.3 11.9 3.3 3.1 1 19.4 - Bread and cereals 625 -8.5 9.4 9.1 -5.9 7.8 20.4 - Meat 345 3.4 2.9 2.2 -1.3 0.0 3.7 - Fish and seafoods 114 15.4 5.7 1.0 -4.6 3.6 5.7 - Legumes 1 332 2.0 22.3 2.1 9 -1 32.3 - Non alcoholic drinks 180 5.4 2.1 0.0 0.3 -0.6 1.9 2.Alcholic drinks and tobacco 221 3.6 0.5 0.3 0.4 1.5 2.8 3. Clothing items and shoes 500 -0.3 0.5 0.8 -0.4 -0.6 0.3 4. Housing, water, gas, electricity and others fuels 1 579 20.8 7.4 3.6 0.1 -0.8 10.3 5. Furniture, household items, and house maintenance 764 3.2 0.9 -1.7 0.5 0.1 -0.2 6. Health 708 1.5 -0.6 0.9 -0.4 3.3 3.3 7. Transport 987 5.7 1.6 0.5 6.2 -1.3 7.0 8. Communication 37 0.2 0.9 0 0.5 22.4 23.8 9. Culture and leisure 206 4.6 0.4 -0.1 -0.4 -0.3 -0.5 10. Education 432 4.5 21.2 0 0 0.0 21.2 11. Restaurants and hotels 273 5.6 -4.3 3.8 7.3 1.3 8.0 12. Miscellaneous goods and services 584 4.3 0.6 0.1 0.3 -0.2 0.7
Total 10000 Inflation Over the period 5.5 6.9 2.1 2.0 0.5 11.5 Annual basis for the previous month 5.6 6.8 9.4 9.3 12.0 11.9
Source: NBR, Research Department
Increase in household consumer prices accelerated particularly during the first quarter of
2006, mainly due to fresh food products, namely vegetables whose prices increased by
22.3%, following the drop in thier supply, as a result of a decline in agricultural
50,0
60,0
70,0
80,0
90,0
100,0
110,0
120,0
130,0
140,0
150,0
2000 2001 2002 2003 2004 2005 2006
Annual slippage (December)
Annual average
28
production. This was due to climatic vagaries, which characterized the last quarter of the
year 2005 and the early months of 2006.
Similarly, energy prices strongly increased (+11.0%) during the first half of the year,
following an increase in oil and charcoal prices.
Table 21: Inflation development according to product origin (CPI change in % , base 2003=100)
Weight- 2005 2006
ing Jan Mar Jun Sep Dec Jan Mar Jun Sep Dec Products 10000 118.2 122.4 122.1 124.6 122.2 124.3 130.8 133.5 136.3 136.9 Monthly changes 2.2 2.4 -0.5 0.9 0.2 1.8 1.5 0.9 1.0 0.8 Year to year basis 11.6 12.9 11.1 8.2 5.6 5.2 6.8 9.4 9.3 12.1 Local products 6956 119.2 125.2 122.8 126.4 123.6 127.7 136.1 137.5 141.4 142.0 Monthly changes 3.3 3.3 -0.4 1.1 0.2 3.3 1.5 1.1 1.6 1.1 Year to year basis 12.6 15.1 11.5 8.5 7.1 7.1 8.7 12.0 11.9 14.8 Imported goods 3044 117.9 118.0 120.3 120.5 118.7 118.7 120.7 123.4 123.8 124.0 Monthly changes 1.1 0.1 -0.7 0.5 0.1 0.1 1.3 0.2 -0.2 0.2 Year to year basis 11.0 9.5 9.7 6.9 1.7 0.7 2.3 2.6 2.8 4.5
Source: NBR, Research Department
Unlike local products, the overall level of imported goods and services prices increased
moderately by 4.5% in December 2006 on year to year basis, compared to only 1.7% in
2005. This follows prices stability in major trading partner countries of Rwanda that export
these products on one hand, and on the other hand, the appreciation of Rwandan franc
against the US dollar, which is the major transaction currency.
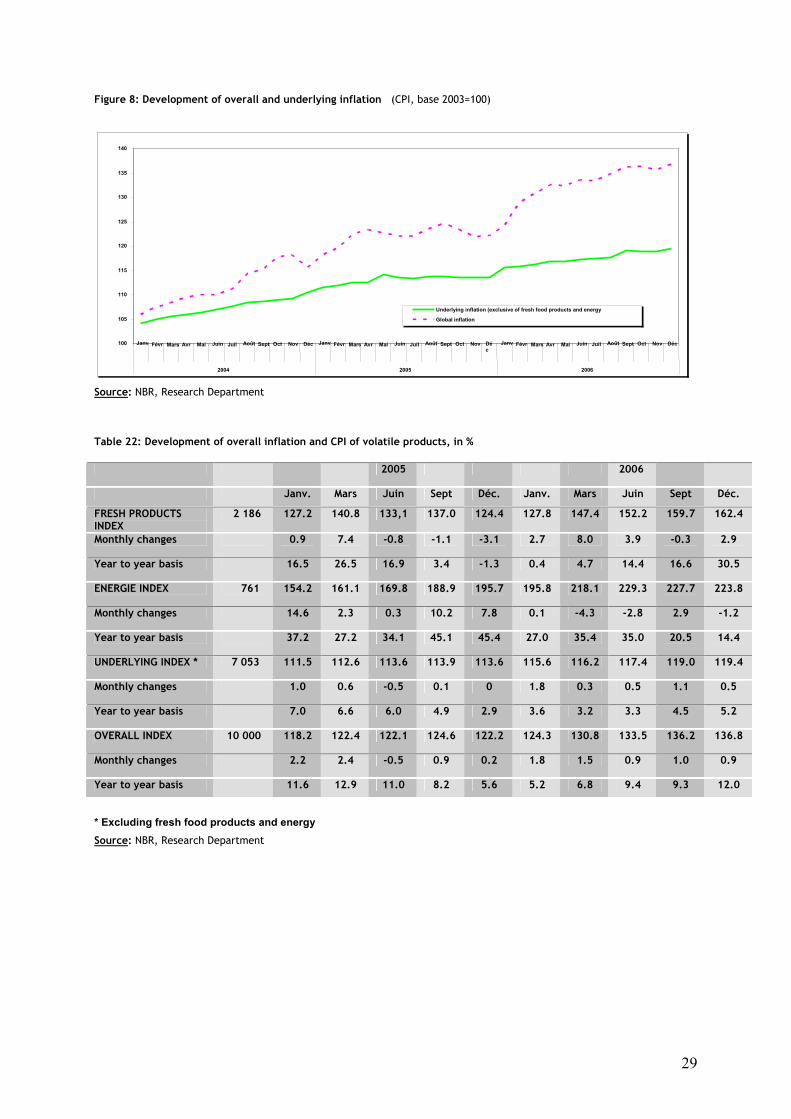
B. UNDERLYING INFLATION
Unlike the previous periods, underlying inflation experienced an upward trend in 2006. On
year to year basis, underlying inflation reached 5.2% in December, compared to 2.9% in the
same month of the previous year. This rise in the underlying inflation which best reflect
the effectiveness of monetary and foreign exchange policy implemented by the National
Bank of Rwanda, shows that the inflationary tensions which marked the year 2006 was not
only due to fresh food products and energy whose prices are very volatile, but also to other
products and services. As already stated above, teaching, transport and communications
are the most concerned.
29
Figure 8: Development of overall and underlying inflation (CPI, base 2003=100)
Source: NBR, Research Department
Table 22: Development of overall inflation and CPI of volatile products, in %
2005 2006
Janv. Mars Juin Sept Déc. Janv. Mars Juin Sept Déc.
FRESH PRODUCTS INDEX
2 186 127.2 140.8 133,1 137.0 124.4 127.8 147.4 152.2 159.7 162.4
Monthly changes 0.9 7.4 -0.8 -1.1 -3.1 2.7 8.0 3.9 -0.3 2.9
Year to year basis 16.5 26.5 16.9 3.4 -1.3 0.4 4.7 14.4 16.6 30.5
ENERGIE INDEX 761 154.2 161.1 169.8 188.9 195.7 195.8 218.1 229.3 227.7 223.8
Monthly changes 14.6 2.3 0.3 10.2 7.8 0.1 -4.3 -2.8 2.9 -1.2
Year to year basis 37.2 27.2 34.1 45.1 45.4 27.0 35.4 35.0 20.5 14.4
UNDERLYING INDEX * 7 053 111.5 112.6 113.6 113.9 113.6 115.6 116.2 117.4 119.0 119.4
Monthly changes 1.0 0.6 -0.5 0.1 0 1.8 0.3 0.5 1.1 0.5
Year to year basis 7.0 6.6 6.0 4.9 2.9 3.6 3.2 3.3 4.5 5.2
OVERALL INDEX 10 000 118.2 122.4 122.1 124.6 122.2 124.3 130.8 133.5 136.2 136.8
Monthly changes 2.2 2.4 -0.5 0.9 0.2 1.8 1.5 0.9 1.0 0.9
Year to year basis 11.6 12.9 11.0 8.2 5.6 5.2 6.8 9.4 9.3 12.0
* Excluding fresh food products and energy
Source: NBR, Research Department
100
105
110
115
120
125
130
135
140
Janv Févr Mars Avr Mai Juin Juil Août Sept Oct Nov Déc Janv Févr Mars Avr Mai Juin Juil Août Sept Oct Nov Déc
Janv Févr Mars Avr Mai Juin Juil Août Sept Oct Nov Déc
2004 2005 2006
Underlying inflation (exclusive of fresh food products and energy Global inflation

30
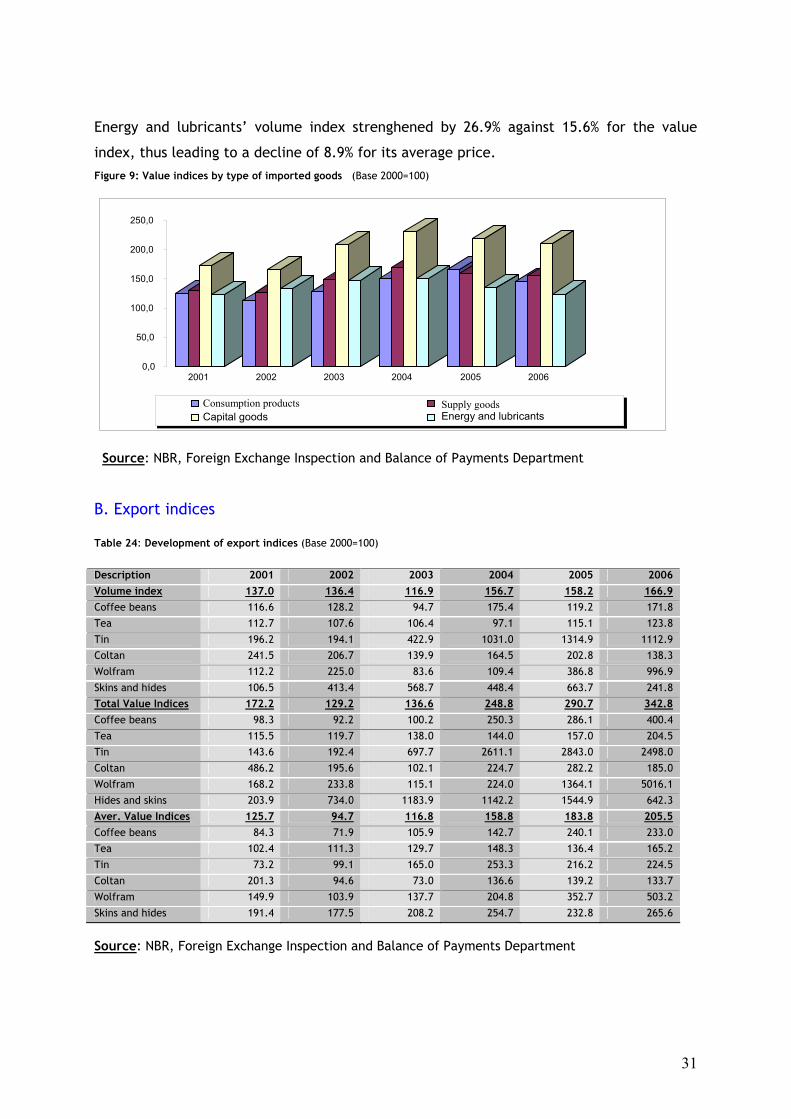
2. Foreign trade indices A. Import indices Unlike the previous year, the average import value index decreased by 7.9% due to a
stronger increase in the volume index, compared to the value indices which were 33% and
22.5% respectively.
As regards the volume index of consumer goods, it rose from 97.4 to 140.1, which is a rise
of 43.8% compared to the value index of 25.6%, implying a decrease of 12.6% in average
price index.
Table 23: Development of import price index (base 2003=100)
Description 2001 2002 2003 2004 2005 2006
Volume Index 110.7 110.3 109.7 126.0 157.1 208.9
Consumer goods: 92.5 76.2 72.9 88.0 97.4 140.1
Of which food stuffs 122.9 92.0 85.9 98.8 104.1 160.2
Capital goods 139.8 178.3 180.6 183.8 257.5 306.0
Intermediary goods 141.1 161.3 163.9 189.6 271.7 364.1
Energy and lubricants: 116.1 115.3 118.1 139.3 153.9 195.3
Of which fuel 114.3 114.7 118.0 137.6 153.4 195.1
Value index 148.4 144.9 169.7 214.5 269.3 329.9
Consumer goods: 115.6 85.9 94.7 131.6 162.8 204.5
Of which food stuffs 136.5 92.0 86.9 125.0 128.4 173.5
Capital goods 243.3 297.8 376.4 424.8 564.3 644.5
intermediary goods 183,9 205.6 244.2 320.1 434.2 564.8
Energy and lubricants: 143.8 154.3 174.7 209.5 210.1 242.8
Of which fuel 134,8 151.7 173.8 202.0 203.0 233.9
Average value index 134.1 131.4 154.7 170.2 171.4 157.9
Consumer goods: 125.0 112.8 129.8 149.5 167.1 146.0
Of which food stuffs 111.0 100.0 101.1 126.6 123.3 108.3
Capital goods 174.1 167.1 208.4 231.2 219.1 210.6
Intermediary goods 130.3 127.5 149.0 168.8 159.8 155.1
Energy and lubricants: 123.9 133.8 147.9 150.4 136.5 124.3
Of which fuel 118.0 132.3 147.3 146.8 132.4 119.9
Source: NBR, Foreign Exchange Inspection and Balance of Payments Department
The volume and value of foodstuffs increased by 53.9% and 35.1% respectively, while their
value declined by 12.2 % on average. For capital and intermediary goods, their volume
index increased by 18.8% and 34% respectively, against 14.2% and 30.1% for the value
index.
31
Energy and lubricants’ volume index strenghened by 26.9% against 15.6% for the value
index, thus leading to a decline of 8.9% for its average price. Figure 9: Value indices by type of imported goods (Base 2000=100)
Source: NBR, Foreign Exchange Inspection and Balance of Payments Department B. Export indices Table 24: Development of export indices (Base 2000=100)
Description 2001 2002 2003 2004 2005 2006 Volume index 137.0 136.4 116.9 156.7 158.2 166.9 Coffee beans 116.6 128.2 94.7 175.4 119.2 171.8
Tea 112.7 107.6 106.4 97.1 115.1 123.8
Tin 196.2 194.1 422.9 1031.0 1314.9 1112.9
Coltan 241.5 206.7 139.9 164.5 202.8 138.3
Wolfram 112.2 225.0 83.6 109.4 386.8 996.9
Skins and hides 106.5 413.4 568.7 448.4 663.7 241.8
Total Value Indices 172.2 129.2 136.6 248.8 290.7 342.8 Coffee beans 98.3 92.2 100.2 250.3 286.1 400.4
Tea 115.5 119.7 138.0 144.0 157.0 204.5
Tin 143.6 192.4 697.7 2611.1 2843.0 2498.0
Coltan 486.2 195.6 102.1 224.7 282.2 185.0
Wolfram 168.2 233.8 115.1 224.0 1364.1 5016.1
Hides and skins 203.9 734.0 1183.9 1142.2 1544.9 642.3
Aver. Value Indices 125.7 94.7 116.8 158.8 183.8 205.5 Coffee beans 84.3 71.9 105.9 142.7 240.1 233.0
Tea 102.4 111.3 129.7 148.3 136.4 165.2
Tin 73.2 99.1 165.0 253.3 216.2 224.5
Coltan 201.3 94.6 73.0 136.6 139.2 133.7
Wolfram 149.9 103.9 137.7 204.8 352.7 503.2
Skins and hides 191.4 177.5 208.2 254.7 232.8 265.6
Source: NBR, Foreign Exchange Inspection and Balance of Payments Department
0,0
50,0
100,0
150,0
200,0
250,0
2001 2002 2003 2004 2005 2006
Consumption products Supply goodsCapital goods Energy and lubricants

32
During the year 2006, exports value index recorded an increase of 11.8% on average against
15.7% for the previous year. This was a result of the increase in average price of tea, tin,
wolfram, hides and skins which rose by 21.1%, 3.8%, 42.7% and 14.1% respectively.
It should however be noted that between 2002 and 2006, wolfram average value index
experienced a very significant increase.
As for coffee beans and Coltan, their average value index went down by about 3.0% and
3.9% respectively, owing to the fact that coffee beans volume grew stronger than their
value, while both the volume and value of Coltan declined.
Figure 10: Average value indices of the major exports (Base 1990=100)
Source: NBR, Foreign Exchange Inspection and Balance of Payments Department Terms of trade Table 25: Terms of trade index and trade related to total earnings
Description 2001 2002 2003 2004 2005 2006
Average export value indices 125.7 94.7 116.8 158,8 183.8 205.5
Average imports value indices 134.1 131.4 154.7 170,2 171.4 157.9
Terms of trade index 93.8 72.1 75.5 93,3 107.2 130.1
Export volume index 137.0 136.4 116.9 156,7 158.2 166.9
Trade related to total earnings index 128.5 98.3 88.2 146,2 169.6 217.1
Source: NBR, Foreign Exchange Inspection and Balance of Payments Department
0.0 100.0 200.0 300.0 400.0 500.0 600.0
2001 2002 2003 2004 2005 2006
Coffee beans Tea Tin Wolfram
33
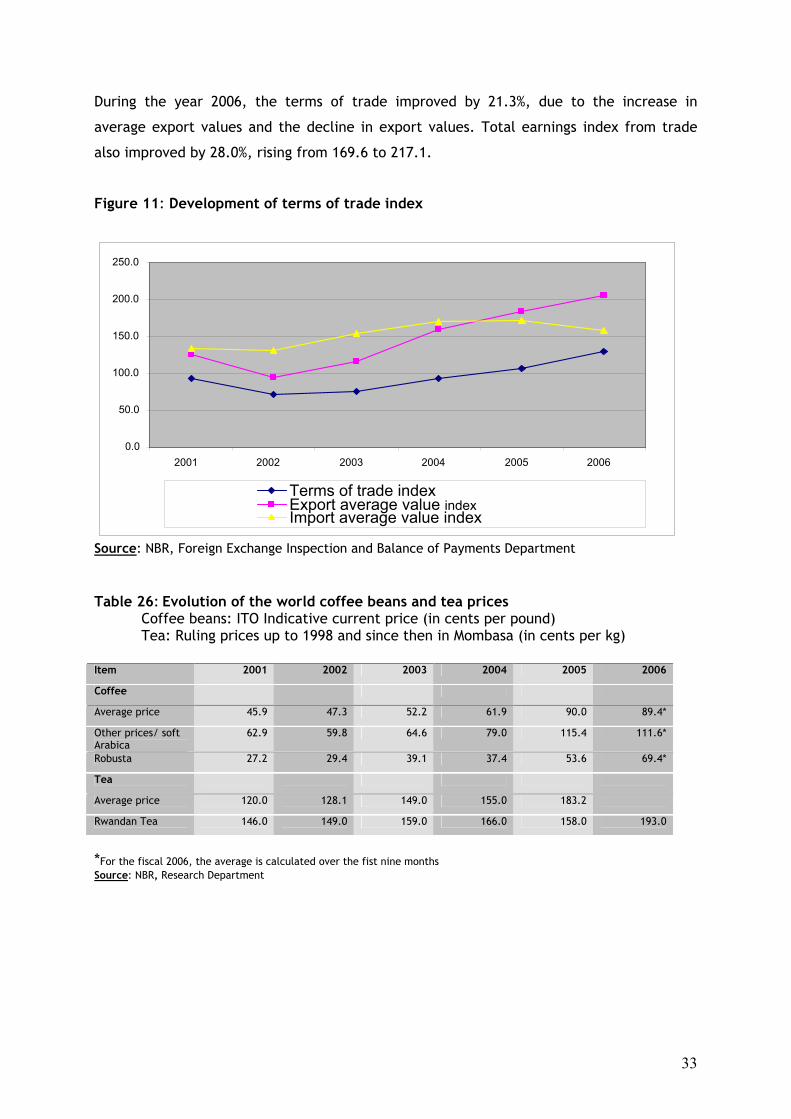
During the year 2006, the terms of trade improved by 21.3%, due to the increase in
average export values and the decline in export values. Total earnings index from trade
also improved by 28.0%, rising from 169.6 to 217.1.
Figure 11: Development of terms of trade index
Source: NBR, Foreign Exchange Inspection and Balance of Payments Department Table 26: Evolution of the world coffee beans and tea prices
Coffee beans: ITO Indicative current price (in cents per pound) Tea: Ruling prices up to 1998 and since then in Mombasa (in cents per kg) Item 2001 2002 2003 2004 2005 2006
Coffee
Average price 45.9 47.3 52.2 61.9 90.0 89.4*
Other prices/ soft Arabica
62.9 59.8 64.6 79.0 115.4 111.6*
Robusta 27.2 29.4 39.1 37.4 53.6 69.4*
Tea
Average price 120.0 128.1 149.0 155.0 183.2
Rwandan Tea 146.0 149.0 159.0 166.0 158.0 193.0
*For the fiscal 2006, the average is calculated over the fist nine months Source: NBR, Research Department
0.0
50.0
100.0
150.0
200.0
250.0
2001 2002 2003 2004 2005 2006
Terms of trade indexExport average value index Import average value index
34
II.2 PUBLIC FINANCE AND DOMESTIC DEBT
II.2.1 PUBLIC FINANCE
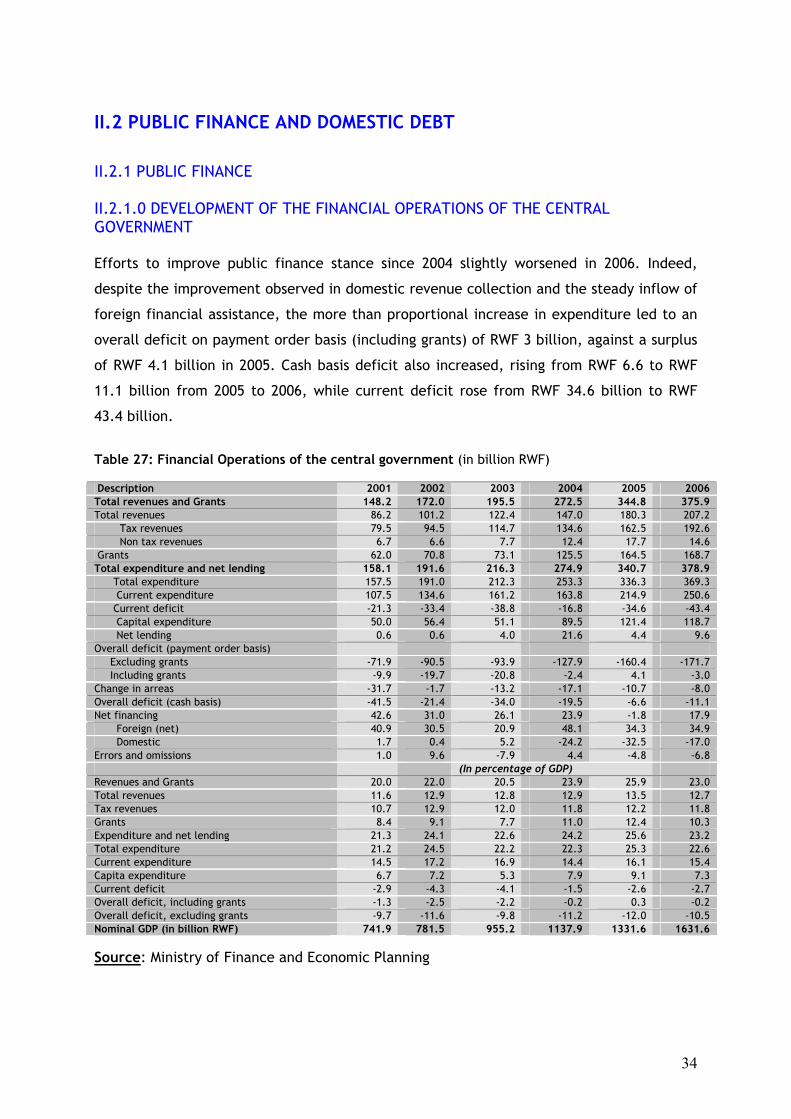
II.2.1.0 DEVELOPMENT OF THE FINANCIAL OPERATIONS OF THE CENTRAL GOVERNMENT Efforts to improve public finance stance since 2004 slightly worsened in 2006. Indeed,
despite the improvement observed in domestic revenue collection and the steady inflow of
foreign financial assistance, the more than proportional increase in expenditure led to an
overall deficit on payment order basis (including grants) of RWF 3 billion, against a surplus
of RWF 4.1 billion in 2005. Cash basis deficit also increased, rising from RWF 6.6 to RWF
11.1 billion from 2005 to 2006, while current deficit rose from RWF 34.6 billion to RWF
43.4 billion.
Table 27: Financial Operations of the central government (in billion RWF) Description 2001 2002 2003 2004 2005 2006 Total revenues and Grants 148.2 172.0 195.5 272.5 344.8 375.9 Total revenues 86.2 101.2 122.4 147.0 180.3 207.2 Tax revenues 79.5 94.5 114.7 134.6 162.5 192.6 Non tax revenues 6.7 6.6 7.7 12.4 17.7 14.6 Grants 62.0 70.8 73.1 125.5 164.5 168.7 Total expenditure and net lending 158.1 191.6 216.3 274.9 340.7 378.9 Total expenditure 157.5 191.0 212.3 253.3 336.3 369.3 Current expenditure 107.5 134.6 161.2 163.8 214.9 250.6 Current deficit -21.3 -33.4 -38.8 -16.8 -34.6 -43.4 Capital expenditure 50.0 56.4 51.1 89.5 121.4 118.7 Net lending 0.6 0.6 4.0 21.6 4.4 9.6 Overall deficit (payment order basis) Excluding grants -71.9 -90.5 -93.9 -127.9 -160.4 -171.7 Including grants -9.9 -19.7 -20.8 -2.4 4.1 -3.0 Change in arreas -31.7 -1.7 -13.2 -17.1 -10.7 -8.0 Overall deficit (cash basis) -41.5 -21.4 -34.0 -19.5 -6.6 -11.1 Net financing 42.6 31.0 26.1 23.9 -1.8 17.9 Foreign (net) 40.9 30.5 20.9 48.1 34.3 34.9 Domestic 1.7 0.4 5.2 -24.2 -32.5 -17.0 Errors and omissions 1.0 9.6 -7.9 4.4 -4.8 -6.8 (In percentage of GDP) Revenues and Grants 20.0 22.0 20.5 23.9 25.9 23.0 Total revenues 11.6 12.9 12.8 12.9 13.5 12.7 Tax revenues 10.7 12.9 12.0 11.8 12.2 11.8 Grants 8.4 9.1 7.7 11.0 12.4 10.3 Expenditure and net lending 21.3 24.1 22.6 24.2 25.6 23.2 Total expenditure 21.2 24.5 22.2 22.3 25.3 22.6 Current expenditure 14.5 17.2 16.9 14.4 16.1 15.4 Capita expenditure 6.7 7.2 5.3 7.9 9.1 7.3 Current deficit -2.9 -4.3 -4.1 -1.5 -2.6 -2.7 Overall deficit, including grants -1.3 -2.5 -2.2 -0.2 0.3 -0.2 Overall deficit, excluding grants -9.7 -11.6 -9.8 -11.2 -12.0 -10.5 Nominal GDP (in billion RWF) 741.9 781.5 955.2 1137.9 1331.6 1631.6 Source: Ministry of Finance and Economic Planning
35
II.2.1.1 GOVERNMENT REVENUES
Government revenues and grants amounted to RWF 375.9 billion (23.0% of GDP) as of end
2006, compared to RWF 348.2 billion (25.9% GDP) for end 2005, that is an increase of 8.0%.
Total domestic revenues amounted to RWF 207.2 billion (accounting for 55.1% of
government resources), compared to RWF 180.3 billion the previous year (51.8% of total
expenditure).
II.2.1.1.1 TAX REVENUES
Tax revenues increased by 18.5%, passing from RWF 162.5 to RWF 192.6 billion between
2005 and 2006. This increase accounted for 20.7% in 2005, and in proportion to GDP, these
revenues accounted for 11.8% against 12.2% in the previous year.
Tax collection globally took advantage of economic activity expansion (particularly in
industry and service sectors). Thus, direct taxes increased by 27.2%, passing from RWF 50.7
to RWF 64.5 billion between 2005 and 2006. Taxes on goods and services rose by 14.0%,
passing from 80.9 to RWF 94.7 billion, while those on foreign trade increased only by 3.0%.
The stagnation of foreign trade revenues in the context of rise in imports is explained by
the increase in tax-free imported capital goods, the growing impact of imports from
COMESA zone, the appreciation of the Rwandan franc against the dollar, and the removal
of MAGERWA taxes. It should be highlighted that the rise in domestic revenues has also
benefited from recent reforms initiated in tax collection, such as the “pay as you earn”
system known as PAYE, the public service, reform and the widening of the tax base on the
employees’ fringe benefits.
Concerning VAT, the liquidity injection into the economy through public expenditure, on
one hand, and credit to the private sector on the other hand, increased the demand for
taxable goods, thereby leading to the increase in revenues.
Tax revenue performance exceeded the budget forecasts by 8.9%, which had been put at
RWF 176.8 billion and those of the Poverty Reduction and Growth Facility program (PRGF)
by 12.1% which had been forecasted at RWF 171.8 billion.
36
II.2.1.1.2 NONTAX REVENUES
Nontax revenues declined from RWF 17.7 billion to RWF 14.6 billion from 2005 to 2006 that
is a fall of 17.5%. However, they were higher than the revised budget estimates of 2.8
billion.
The performance of this component resulted from the collection of the balance of the
proceeds from the sale of Government vehicles, the sale of the strategic fuel stock, as well
as the balance payment on the sale of the National Police plot.
II.2.1.1.3 GRANTS
Revenue in grants rose from RWF 164.5 billion to RWF 168.7 billion (+2.5%) between 2005
and 2006, of which 43.1% was budgetary support and 56.9% was capital grants. The latter
included 44.2% of MDRI debt relief (Multilateral Debt Relief Initiative) and 55.8% of project
support.
In general, although the proportion of external financial grants in total revenue has slightly
dropped in 2006 (they accounted for 44.8% of the total revenues against 47.7% the previous
year), they still play a vital role in government revenue.
II.2.1.2 PUBLIC EXPENDITURE
Total expenditure and net lending totaled RWF 378.9 billion at the end of 2006 this is an
increase of 11.2% compared with the year 2005. In proportion to GDP, total expenditure
and net lending accounted for 23.2%, against 25.6% in the previous year. The current
expenditure represented 66.1% of total expenditure, while the difference constitutes the
capital expenditure.
II.2.1.2.1 CURRENT EXPENDITURE
Made up of wages and salaries, expenditure on goods and services, exceptional
expenditure, interest payments, as well as subsidies and transfers, current expenditure
amounted at RWF 250.6 billion at end of 2006, which is an increase of 16.6%, compared to
the year 2005.
37
This trend indicates a slight difference compared to the budget forecasts of RWF 248.3
billion and the PRGF program of worth RWF 244.1 billion. In proportion to GDP, the current
expenditure accounted for 15.4% against 16.1% for the previous year.
Current expenditures were divided into subsidies and transfers for 28.7%, expenditure on
goods and services for 28.6%, wages and salaries worth 24.8%, exceptional expenditure
with 13.4%, and interest payments accounting for 4.5%.
II.2.1.2.2 Capital expenditures Capital expenditures totaled RWF 118.7 billion against RWF 106.7 billion for the previous
year, representing a rise of 11.2%. They were financed up to 69.9% by external resources
and the balance by domestic resources.
II.2.1.3 NET LENDING Mainly made up of loans to public companies, net lending rose from RWF 4.4 billion to RWF
9.6 billion from 2005 to 2006, which is an increase of 118.2%. Among the factors of
increase for this category, particularly was the Lake Kivu Methane gas Project.
II.2.1.4 BUDGET DEFICIT AND ITS FINANCING II.2.1.4.1 Budget deficit As stated above, the central government financial operations showed a total deficit of RWF
3 billion on payment order basis including grants at end of 2006, compared to a surplus of
RWF 4.1 billion the previous year that is a worsening of 173.1%, despite an increase in
foreign financial aid and better performance in domestic tax collection.
38
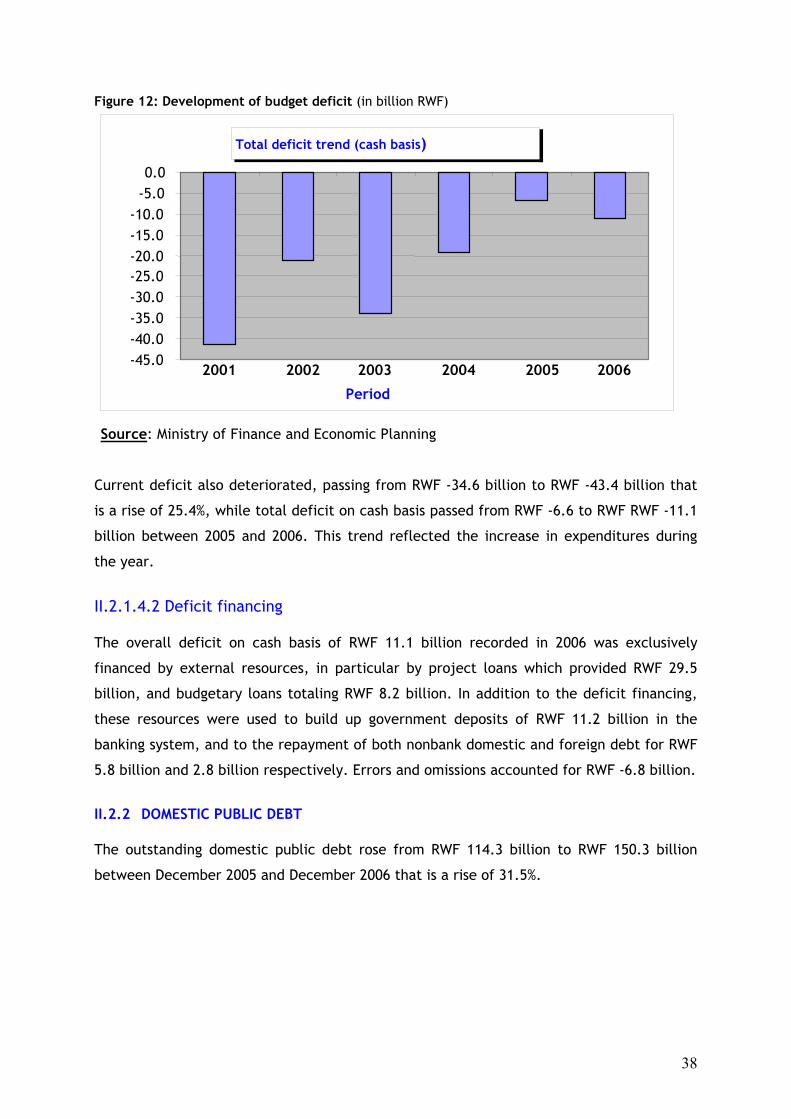
Figure 12: Development of budget deficit (in billion RWF)
Source: Ministry of Finance and Economic Planning Current deficit also deteriorated, passing from RWF -34.6 billion to RWF -43.4 billion that
is a rise of 25.4%, while total deficit on cash basis passed from RWF -6.6 to RWF RWF -11.1
billion between 2005 and 2006. This trend reflected the increase in expenditures during
the year.
II.2.1.4.2 Deficit financing The overall deficit on cash basis of RWF 11.1 billion recorded in 2006 was exclusively
financed by external resources, in particular by project loans which provided RWF 29.5
billion, and budgetary loans totaling RWF 8.2 billion. In addition to the deficit financing,
these resources were used to build up government deposits of RWF 11.2 billion in the
banking system, and to the repayment of both nonbank domestic and foreign debt for RWF
5.8 billion and 2.8 billion respectively. Errors and omissions accounted for RWF -6.8 billion.
II.2.2 DOMESTIC PUBLIC DEBT The outstanding domestic public debt rose from RWF 114.3 billion to RWF 150.3 billion
between December 2005 and December 2006 that is a rise of 31.5%.
Total deficit trend (cash basis)
-45.0 -40.0 -35.0 -30.0 -25.0 -20.0 -15.0 -10.0 -5.0 0.0
2001 2002 2003 2004 2005 2006 Period
39
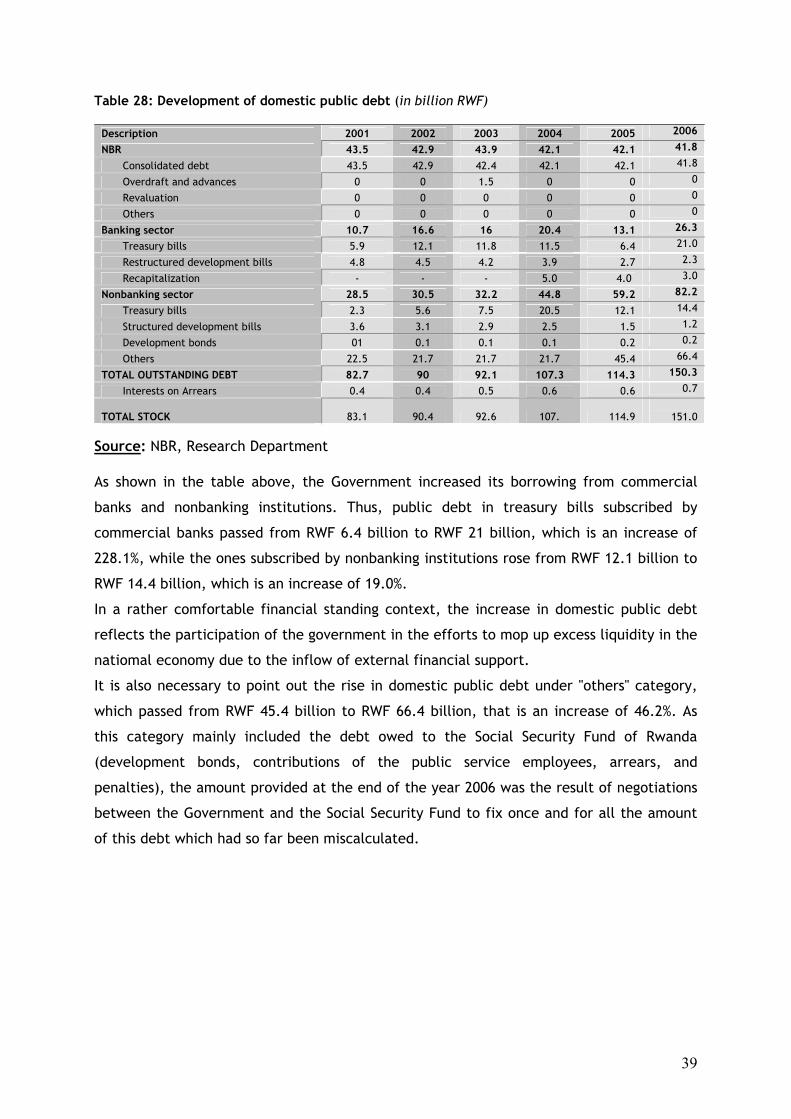
Table 28: Development of domestic public debt (in billion RWF)
Description 2001 2002 2003 2004 2005 2006
NBR 43.5 42.9 43.9 42.1 42.1 41.8
Consolidated debt 43.5 42.9 42.4 42.1 42.1 41.8
Overdraft and advances 0 0 1.5 0 0 0
Revaluation 0 0 0 0 0 0
Others 0 0 0 0 0 0
Banking sector 10.7 16.6 16 20.4 13.1 26.3
Treasury bills 5.9 12.1 11.8 11.5 6.4 21.0
Restructured development bills 4.8 4.5 4.2 3.9 2.7 2.3
Recapitalization - - - 5.0 4.0 3.0
Nonbanking sector 28.5 30.5 32.2 44.8 59.2 82.2
Treasury bills 2.3 5.6 7.5 20.5 12.1 14.4
Structured development bills 3.6 3.1 2.9 2.5 1.5 1.2
Development bonds 01 0.1 0.1 0.1 0.2 0.2
Others 22.5 21.7 21.7 21.7 45.4 66.4
TOTAL OUTSTANDING DEBT 82.7 90 92.1 107.3 114.3 150.3
Interests on Arrears 0.4 0.4 0.5 0.6 0.6 0.7
TOTAL STOCK 83.1 90.4 92.6 107. 114.9
151.0 Source: NBR, Research Department As shown in the table above, the Government increased its borrowing from commercial
banks and nonbanking institutions. Thus, public debt in treasury bills subscribed by
commercial banks passed from RWF 6.4 billion to RWF 21 billion, which is an increase of
228.1%, while the ones subscribed by nonbanking institutions rose from RWF 12.1 billion to
RWF 14.4 billion, which is an increase of 19.0%.
In a rather comfortable financial standing context, the increase in domestic public debt
reflects the participation of the government in the efforts to mop up excess liquidity in the
natiomal economy due to the inflow of external financial support.
It is also necessary to point out the rise in domestic public debt under "others" category,
which passed from RWF 45.4 billion to RWF 66.4 billion, that is an increase of 46.2%. As
this category mainly included the debt owed to the Social Security Fund of Rwanda
(development bonds, contributions of the public service employees, arrears, and
penalties), the amount provided at the end of the year 2006 was the result of negotiations
between the Government and the Social Security Fund to fix once and for all the amount
of this debt which had so far been miscalculated.
40
II.3 MONETARY AND FINANCIAL SECTOR
IIII..33..11 MMOONNEETTAARRYY SSUURRVVEEYY
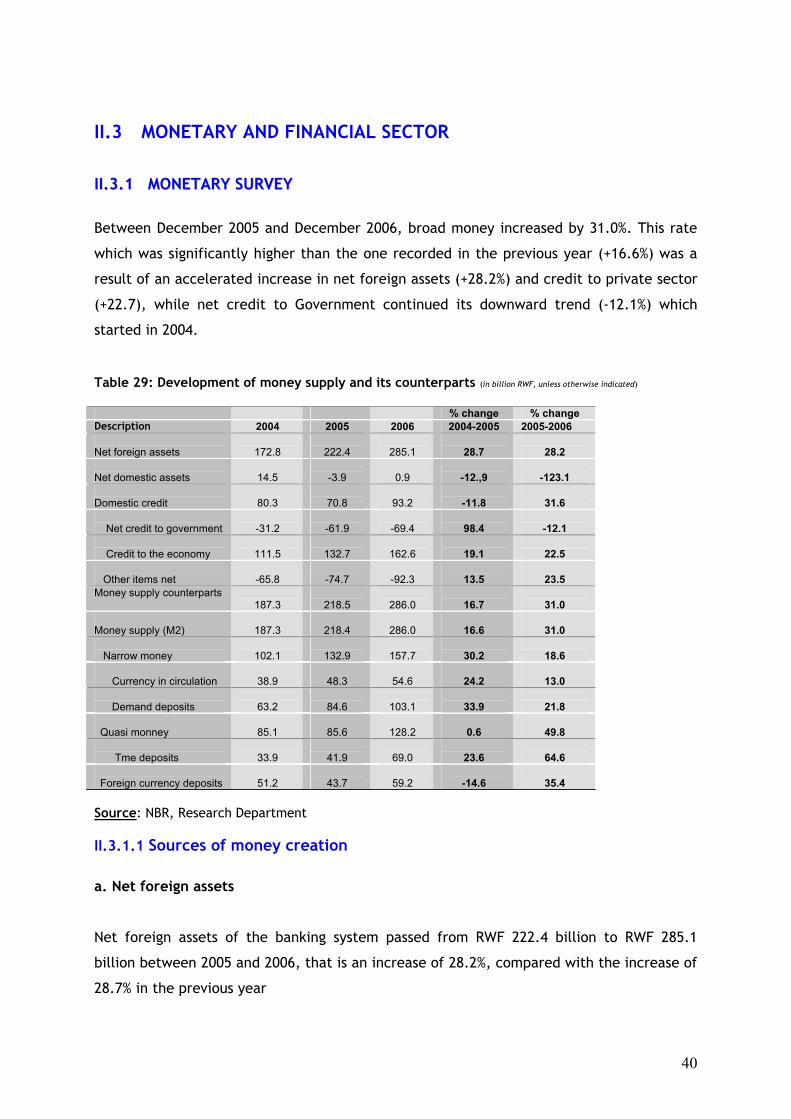
Between December 2005 and December 2006, broad money increased by 31.0%. This rate
which was significantly higher than the one recorded in the previous year (+16.6%) was a
result of an accelerated increase in net foreign assets (+28.2%) and credit to private sector
(+22.7), while net credit to Government continued its downward trend (-12.1%) which
started in 2004.
Table 29: Development of money supply and its counterparts (in billion RWF, unless otherwise indicated)
% change % change Description 2004 2005 2006 2004-2005 2005-2006 Net foreign assets
172.8
222.4
285.1
28.7
28.2
Net domestic assets
14.5
-3.9
0.9
-12.,9
-123.1
Domestic credit
80.3
70.8
93.2
-11.8
31.6
Net credit to government
-31.2
-61.9
-69.4
98.4
-12.1
Credit to the economy
111.5
132.7
162.6
19.1
22.5
Other items net
-65.8
-74.7
-92.3
13.5
23.5
Money supply counterparts 187.3
218.5
286.0
16.7
31.0
Money supply (M2)
187.3
218.4
286.0
16.6
31.0
Narrow money
102.1
132.9
157.7
30.2
18.6
Currency in circulation
38.9
48.3
54.6
24.2
13.0
Demand deposits
63.2
84.6
103.1
33.9
21.8
Quasi monney
85.1
85.6
128.2
0.6
49.8
Tme deposits
33.9
41.9
69.0
23.6
64.6
Foreign currency deposits
51.2
43.7
59.2
-14.6
35.4
Source: NBR, Research Department II.3.1.1 Sources of money creation
a. Net foreign assets
Net foreign assets of the banking system passed from RWF 222.4 billion to RWF 285.1
billion between 2005 and 2006, that is an increase of 28.2%, compared with the increase of
28.7% in the previous year
41
This trend was a result of significant inflows of external resources for budgetary support,
better performance by exports sector (+7.2% compared to the previous year), and increase
in private transfers.
The major donors for budgetary support were the United Kingdom with USD 63.7 million,
the European Union with USD 22.5 million, Sweden with USD 10.9 million, the African
Development Fund with USD 8 million, and the World Bank with USD 6.9 million.
As for project support, the major donors were IDA with USD 45 million, the Global Fund
with USD 14.9 million, the International Agriculture Development Fund (FIDA) with USD 10
million, the European Union with USD 5 million, and the Belgian Technical Cooperation
with USD 2.8 million.
In addition, the implementation of the Multilateral Debt Relief Initiative (MDRI) brought
about the reduction of NBR’s liabilities in relation to the IMF of USD 76 million (worth RWF
42.4 billion), which increased as much net foreign assets of the banking system.
As regards private transfers, it should be noted that USD 15 million were transferred in
July by a local private company.
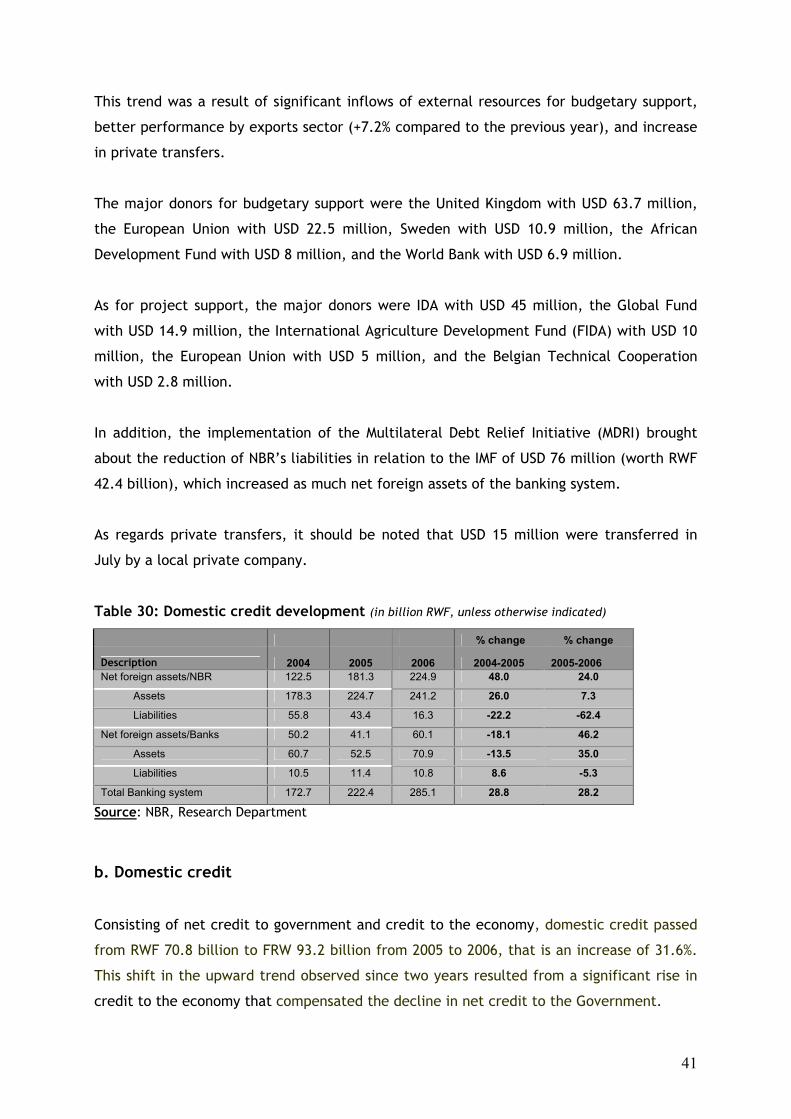
Table 30: Domestic credit development (in billion RWF, unless otherwise indicated)
% change % change
Description 2004 2005 2006 2004-2005 2005-2006 Net foreign assets/NBR 122.5 181.3 224.9 48.0 24.0
Assets 178.3 224.7 241.2 26.0 7.3
Liabilities 55.8 43.4 16.3 -22.2 -62.4
Net foreign assets/Banks 50.2 41.1 60.1 -18.1 46.2
Assets 60.7 52.5 70.9 -13.5 35.0
Liabilities 10.5 11.4 10.8 8.6 -5.3
Total Banking system 172.7 222.4 285.1 28.8 28.2
Source: NBR, Research Department
b. Domestic credit
Consisting of net credit to government and credit to the economy, domestic credit passed
from RWF 70.8 billion to FRW 93.2 billion from 2005 to 2006, that is an increase of 31.6%.
This shift in the upward trend observed since two years resulted from a significant rise in
credit to the economy that compensated the decline in net credit to the Government.
42
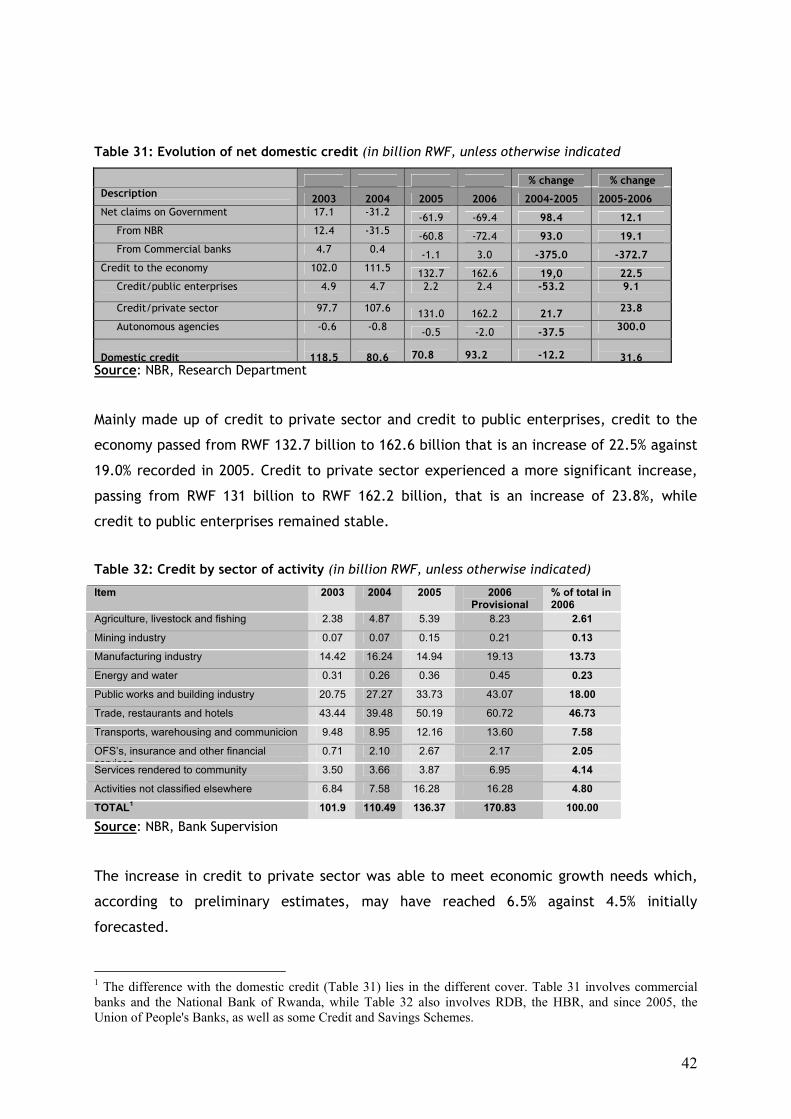
Table 31: Evolution of net domestic credit (in billion RWF, unless otherwise indicated
% change % change Description 2003 2004 2005 2006 2004-2005 2005-2006 Net claims on Government 17.1 -31.2 -61.9 -69.4 98.4 12.1 From NBR 12.4 -31.5 -60.8 -72.4 93.0 19.1 From Commercial banks 4.7 0.4 -1.1 3.0 -375.0 -372.7 Credit to the economy 102.0 111.5 132.7 162.6 19,0 22.5 Credit/public enterprises 4.9 4.7 2.2 2.4 -53.2 9.1
Credit/private sector 97.7 107.6 131.0 162.2 21.7 23.8
Autonomous agencies -0.6 -0.8 -0.5 -2.0 -37.5 300.0
Domestic credit
118.5
80.6 70.8 93.2 -12.2
31.6
Source: NBR, Research Department
Mainly made up of credit to private sector and credit to public enterprises, credit to the
economy passed from RWF 132.7 billion to 162.6 billion that is an increase of 22.5% against
19.0% recorded in 2005. Credit to private sector experienced a more significant increase,
passing from RWF 131 billion to RWF 162.2 billion, that is an increase of 23.8%, while
credit to public enterprises remained stable.
Table 32: Credit by sector of activity (in billion RWF, unless otherwise indicated)
Item 2003 2004 2005 2006 Provisional
% of total in 2006
Agriculture, livestock and fishing 2.38 4.87 5.39 8.23 2.61
Mining industry 0.07 0.07 0.15 0.21 0.13
Manufacturing industry 14.42 16.24 14.94 19.13 13.73
Energy and water 0.31 0.26 0.36 0.45 0.23
Public works and building industry 20.75 27.27 33.73 43.07 18.00
Trade, restaurants and hotels 43.44 39.48 50.19 60.72 46.73
Transports, warehousing and communicion 9.48 8.95 12.16 13.60 7.58
OFS’s, insurance and other financial services
0.71 2.10 2.67 2.17 2.05
Services rendered to community 3.50 3.66 3.87 6.95 4.14
Activities not classified elsewhere 6.84 7.58 16.28 16.28 4.80
TOTAL1 101.9 110.49 136.37 170.83 100.00
Source: NBR, Bank Supervision
The increase in credit to private sector was able to meet economic growth needs which,
according to preliminary estimates, may have reached 6.5% against 4.5% initially
forecasted.
1 The difference with the domestic credit (Table 31) lies in the different cover. Table 31 involves commercial banks and the National Bank of Rwanda, while Table 32 also involves RDB, the HBR, and since 2005, the Union of People's Banks, as well as some Credit and Savings Schemes.
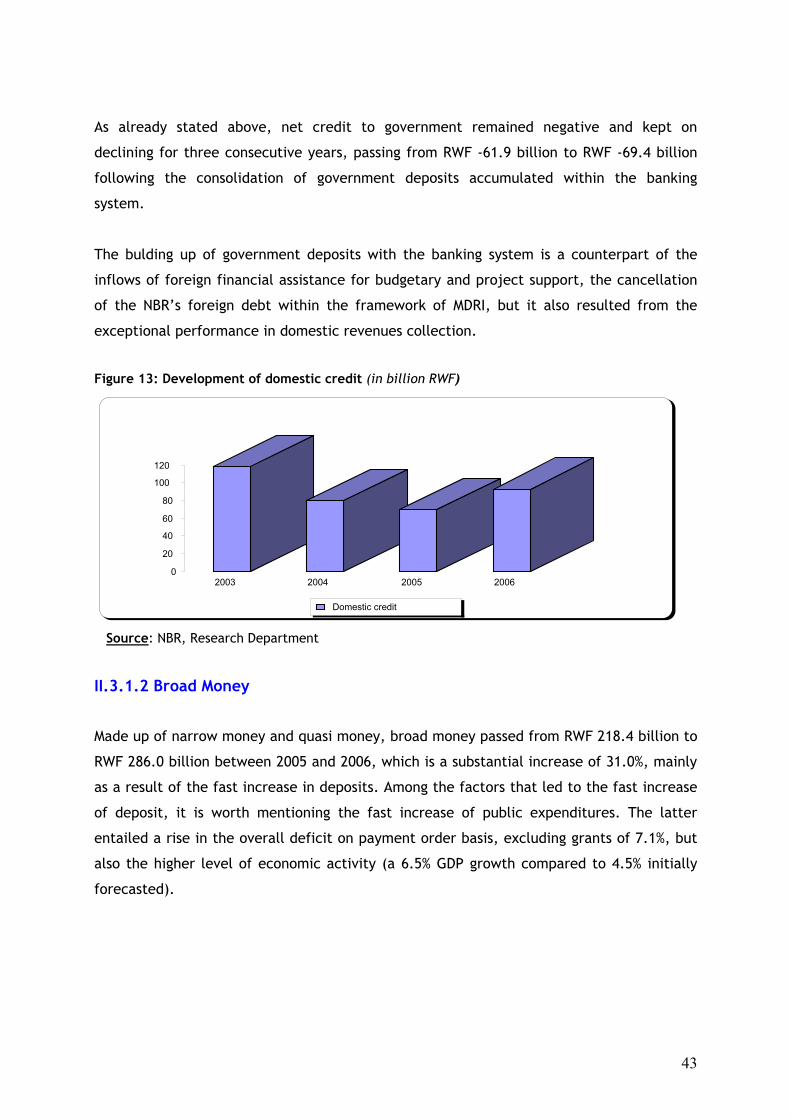
43
As already stated above, net credit to government remained negative and kept on
declining for three consecutive years, passing from RWF -61.9 billion to RWF -69.4 billion
following the consolidation of government deposits accumulated within the banking
system.
The bulding up of government deposits with the banking system is a counterpart of the
inflows of foreign financial assistance for budgetary and project support, the cancellation
of the NBR’s foreign debt within the framework of MDRI, but it also resulted from the
exceptional performance in domestic revenues collection.
Figure 13: Development of domestic credit (in billion RWF)
Source: NBR, Research Department
II.3.1.2 Broad Money
Made up of narrow money and quasi money, broad money passed from RWF 218.4 billion to
RWF 286.0 billion between 2005 and 2006, which is a substantial increase of 31.0%, mainly
as a result of the fast increase in deposits. Among the factors that led to the fast increase
of deposit, it is worth mentioning the fast increase of public expenditures. The latter
entailed a rise in the overall deficit on payment order basis, excluding grants of 7.1%, but
also the higher level of economic activity (a 6.5% GDP growth compared to 4.5% initially
forecasted).
0 20
40
60
80
100
120
2003 2004 2005 2006
Domestic credit
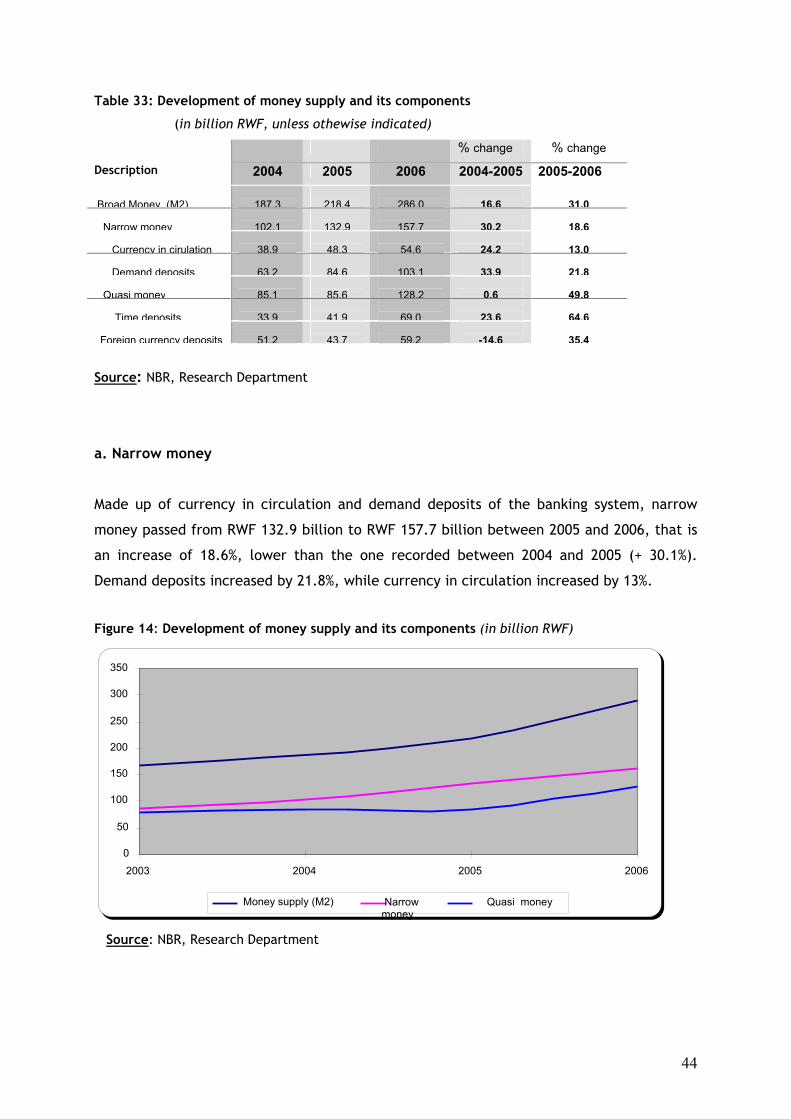
44
Table 33: Development of money supply and its components
(in billion RWF, unless othewise indicated)
% change % change Description 2004 2005 2006 2004-2005 2005-2006 Broad Money (M2)
187,3
218,4
286,0
16,6
31,0
Narrow money
102,1
132,9
157,7
30,2
18,6
Currency in cirulation
38,9
48,3
54,6
24,2
13,0
Demand deposits
63,2
84,6
103,1
33,9
21,8
Quasi money
85,1
85,6
128,2
0,6
49,8
Time deposits
33,9
41,9
69,0
23,6
64,6
Foreign currency deposits
51,2
43,7
59,2
-14,6
35,4
Source: NBR, Research Department
a. Narrow money
Made up of currency in circulation and demand deposits of the banking system, narrow
money passed from RWF 132.9 billion to RWF 157.7 billion between 2005 and 2006, that is
an increase of 18.6%, lower than the one recorded between 2004 and 2005 (+ 30.1%).
Demand deposits increased by 21.8%, while currency in circulation increased by 13%.
Figure 14: Development of money supply and its components (in billion RWF)
Source: NBR, Research Department
0
50
100
150 200
250
300 350
2003 2004 2005 2006
Money supply (M2) Narrow money
Quasi money
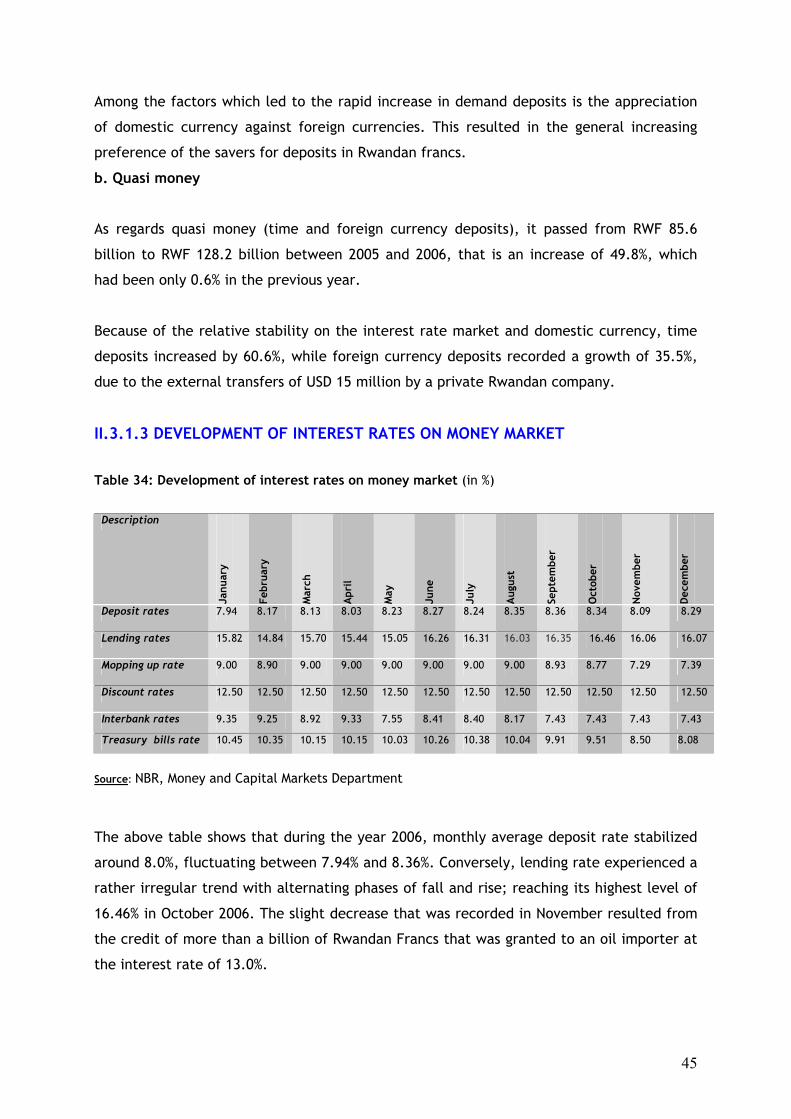
45
Among the factors which led to the rapid increase in demand deposits is the appreciation
of domestic currency against foreign currencies. This resulted in the general increasing
preference of the savers for deposits in Rwandan francs.
b. Quasi money
As regards quasi money (time and foreign currency deposits), it passed from RWF 85.6
billion to RWF 128.2 billion between 2005 and 2006, that is an increase of 49.8%, which
had been only 0.6% in the previous year.
Because of the relative stability on the interest rate market and domestic currency, time
deposits increased by 60.6%, while foreign currency deposits recorded a growth of 35.5%,
due to the external transfers of USD 15 million by a private Rwandan company.
II.3.1.3 DEVELOPMENT OF INTEREST RATES ON MONEY MARKET Table 34: Development of interest rates on money market (in %)
Description
Janu
ary
Febr
uary
Mar
ch
Apr
il
May
June
July
Aug
ust
Sept
embe
r
Oct
ober
N
ovem
ber
Dec
embe
r
Deposit rates 7.94 8.17 8.13 8.03 8.23 8.27 8.24 8.35 8.36 8.34 8.09 8.29
Lending rates 15.82 14.84 15.70 15.44 15.05 16.26 16.31 16.03 16.35 16.46 16.06 16.07
Mopping up rate 9.00 8.90 9.00 9.00 9.00 9.00 9.00 9.00 8.93 8.77 7.29 7.39
Discount rates 12.50 12.50 12.50 12.50 12.50 12.50 12.50 12.50 12.50 12.50 12.50 12.50
Interbank rates 9.35 9.25 8.92 9.33 7.55 8.41 8.40 8.17 7.43 7.43 7.43 7.43
Treasury bills rate 10.45 10.35 10.15 10.15 10.03 10.26 10.38 10.04 9.91 9.51 8.50 8.08
Source: NBR, Money and Capital Markets Department
The above table shows that during the year 2006, monthly average deposit rate stabilized
around 8.0%, fluctuating between 7.94% and 8.36%. Conversely, lending rate experienced a
rather irregular trend with alternating phases of fall and rise; reaching its highest level of
16.46% in October 2006. The slight decrease that was recorded in November resulted from
the credit of more than a billion of Rwandan Francs that was granted to an oil importer at
the interest rate of 13.0%.
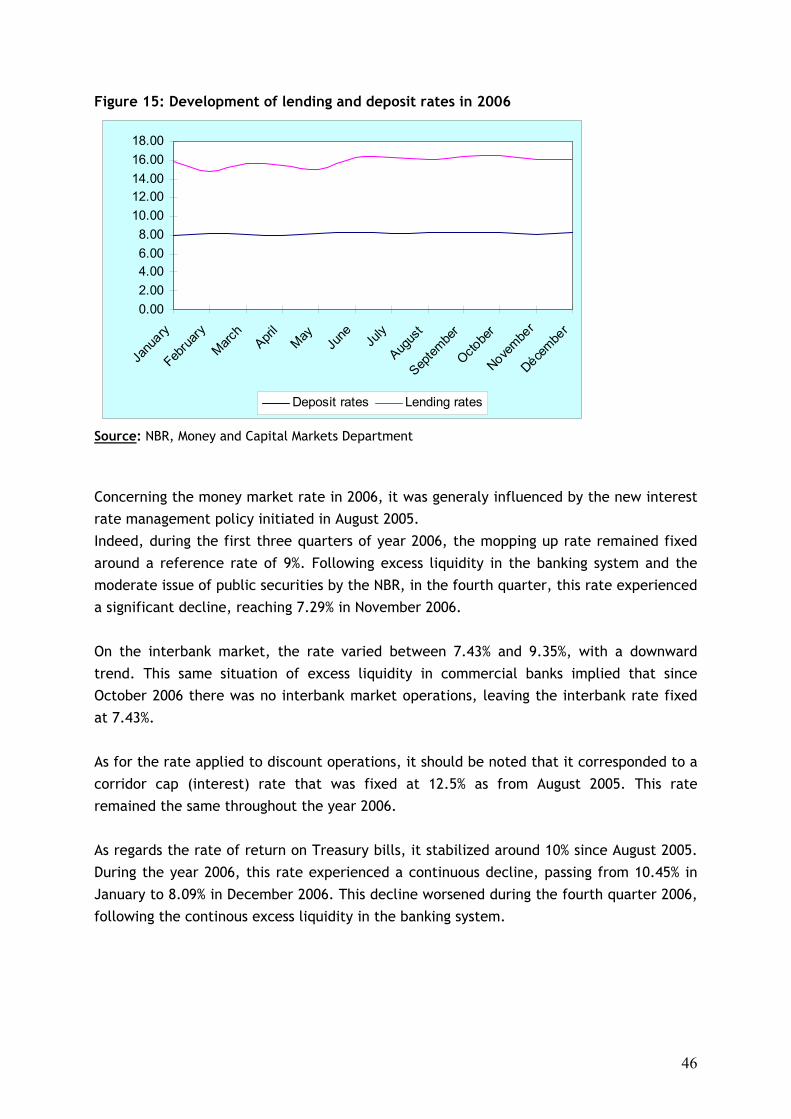
46
Figure 15: Development of lending and deposit rates in 2006
0.002.004.006.008.00
10.0012.0014.0016.0018.00
Janu
ary
Februa
ryMarc
hApri
lMay
June Ju
ly
Augus
t
Septem
ber
Octobe
r
Novembe
r
Décembe
r
Deposit rates Lending rates
Source: NBR, Money and Capital Markets Department
Concerning the money market rate in 2006, it was generaly influenced by the new interest
rate management policy initiated in August 2005.
Indeed, during the first three quarters of year 2006, the mopping up rate remained fixed
around a reference rate of 9%. Following excess liquidity in the banking system and the
moderate issue of public securities by the NBR, in the fourth quarter, this rate experienced
a significant decline, reaching 7.29% in November 2006.
On the interbank market, the rate varied between 7.43% and 9.35%, with a downward
trend. This same situation of excess liquidity in commercial banks implied that since
October 2006 there was no interbank market operations, leaving the interbank rate fixed
at 7.43%.
As for the rate applied to discount operations, it should be noted that it corresponded to a
corridor cap (interest) rate that was fixed at 12.5% as from August 2005. This rate
remained the same throughout the year 2006.
As regards the rate of return on Treasury bills, it stabilized around 10% since August 2005.
During the year 2006, this rate experienced a continuous decline, passing from 10.45% in
January to 8.09% in December 2006. This decline worsened during the fourth quarter 2006,
following the continous excess liquidity in the banking system.
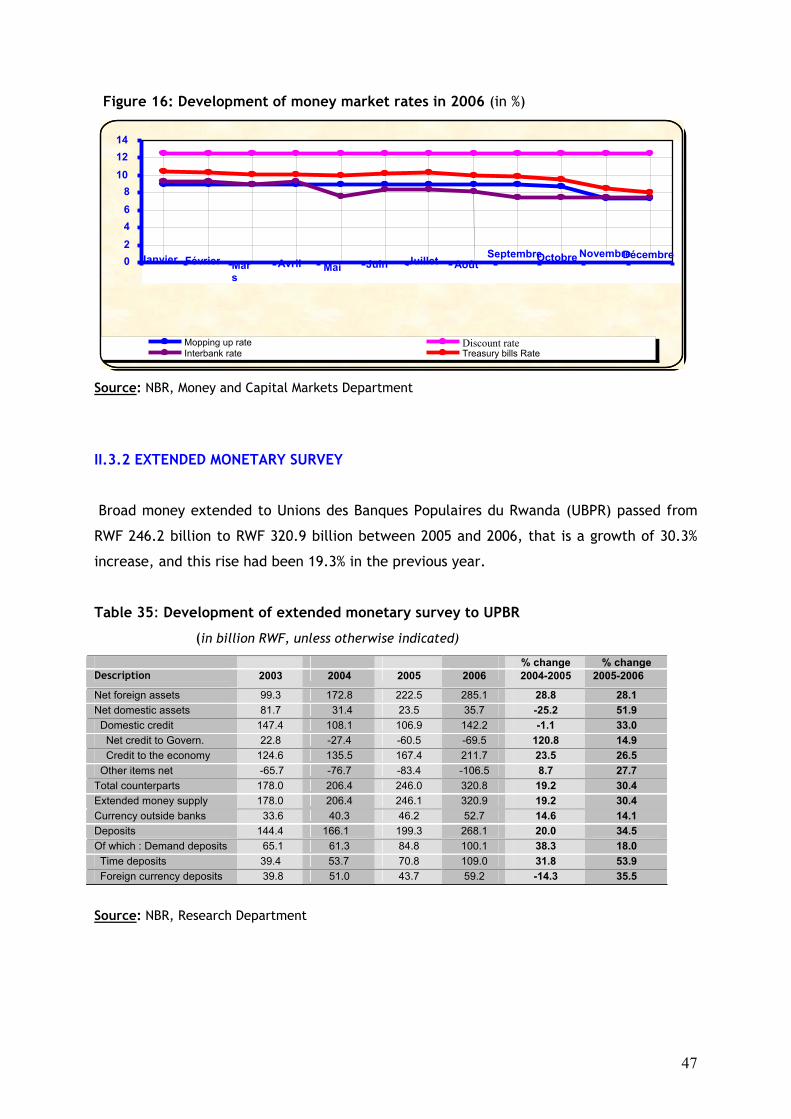
47
Figure 16: Development of money market rates in 2006 (in %)
Source: NBR, Money and Capital Markets Department
II.3.2 EXTENDED MONETARY SURVEY
Broad money extended to Unions des Banques Populaires du Rwanda (UBPR) passed from
RWF 246.2 billion to RWF 320.9 billion between 2005 and 2006, that is a growth of 30.3%
increase, and this rise had been 19.3% in the previous year.
Table 35: Development of extended monetary survey to UPBR
(in billion RWF, unless otherwise indicated)
% change % change Description 2003 2004 2005 2006 2004-2005 2005-2006
Net foreign assets 99.3 172.8 222.5 285.1 28.8 28.1 Net domestic assets 81.7 31.4 23.5 35.7 -25.2 51.9 Domestic credit 147.4 108.1 106.9 142.2 -1.1 33.0 Net credit to Govern. 22.8 -27.4 -60.5 -69.5 120.8 14.9 Credit to the economy 124.6 135.5 167.4 211.7 23.5 26.5 Other items net -65.7 -76.7 -83.4 -106.5 8.7 27.7 Total counterparts 178.0 206.4 246.0 320.8 19.2 30.4 Extended money supply 178.0 206.4 246.1 320.9 19.2 30.4 Currency outside banks 33.6 40.3 46.2 52.7 14.6 14.1 Deposits 144.4 166.1 199.3 268.1 20.0 34.5 Of which : Demand deposits 65.1 61.3 84.8 100.1 38.3 18.0 Time deposits 39.4 53.7 70.8 109.0 31.8 53.9 Foreign currency deposits 39.8 51.0 43.7 59.2 -14.3 35.5
Source: NBR, Research Department
02468
10 12 14
Janvier Février Mars
Avril Mai Juin Juillet AoûtSeptembreOctobre Novembre Décembre
Mopping up rate Discount rate Interbank rate Treasury bills Rate
48
Between the extended broad money and broad money (Table 1), by end December 2006
there was a difference of RWF 34.9 billion, corresponding to the amount of deposits
collected by UPBR and not deposited in commercial banks. This difference amounted to
RWF 27.7 billion the previous year. The deposits of this financial institution in the banking
sector rose to RWF 4.9 billion and RWF 13.9 billion in 2005 and 2006 respectively. UBPR
network also achieved an increase of 45% in deposits in 2006 against 35% in the previous
year.
As regards loans, the difference amounted to RWF 49.1 billion in December 2006 between
the extended monetary survey and monetary survey that is a change of 41.7% between
2005 and 2006, against 59.2% between 2005 and 2004.
It thus appears that UBPR accumulated deposits by achieving the most exceptional results
in this field. These results are explained by the bankruptcy in 2006 of a number of some
competing micro-finance institutions, but more particularly by the decentralization of
public finance, which channeled significant inflows of financial resources to rural areas,
the most privileged action areas of UBPR.
II.4 EXTERNAL SECTOR
II.4.1.BALANCE OF PAYMENTS 1. GENERAL DEVELOPMENT
The decrease in net current transfers combined with the significant volume of imports in
comparison with that of exports, and the deficits of services and revenues balance led to
the increase in current account balance deficit recorded in 2006. However, the significant
surplus recorded by capital and financial operations account in 2006 enabled to cover the
current account deficit and allowed a positive balance of the balance of payments.

49
Figure 17: Development of the major aggregates of the balance of payments (in million USD)
Source: NBR, Foreign Exchange Inspection and Balance of Payments Department
Table 36: Development of the major aggregates of the Balance of Payments (in million USD)
Description 2002 2003 2004 2005 2006 Trade balance -140.6 -165.4 -177.9 -228.7 -296.69 Net services -140.6 -127.3 -137.2 -166.6 -225.27 Net income -19.1 -30.5 -33.7 -27.2 -18.67 Net current transferts 195.3 226.4 313.9 364.5 323.82 Current account balance(including current transferts
-105.9 -96.8 -34.7 -57.82 -216.80
Capital and financial operations account 110.9 71.3 134.9 175.9 291.31 Errors and omissions 7.87 -10.23 7.65 1.03 5.63 Overall balance 12.8 -35.7 107.9 119.2 80.13 Source: NBR, Foreign Exchange Inspection and Balance of Payments Department
2. CURRENT TRANSACTIONS
Following a very significant volume of imported goods and services, external current
deficit worsened much in 2006, compared to 2005. It amounted to USD 216.80 million in
2006, representing 8.86% of the forecasted GDP at USD 2 445.81 million, while in 2005 this
deficit totaled USD 57.82 million, representing 2.77% of the GDP, forecasted at USD 2 091
million in 2005.
-300
-200
-100
0
100
200
300
400
2002 2003 2004 2005 2006
Current
balancCapital account and financial operations account operations accountErrors and ommissions
Overral balancel
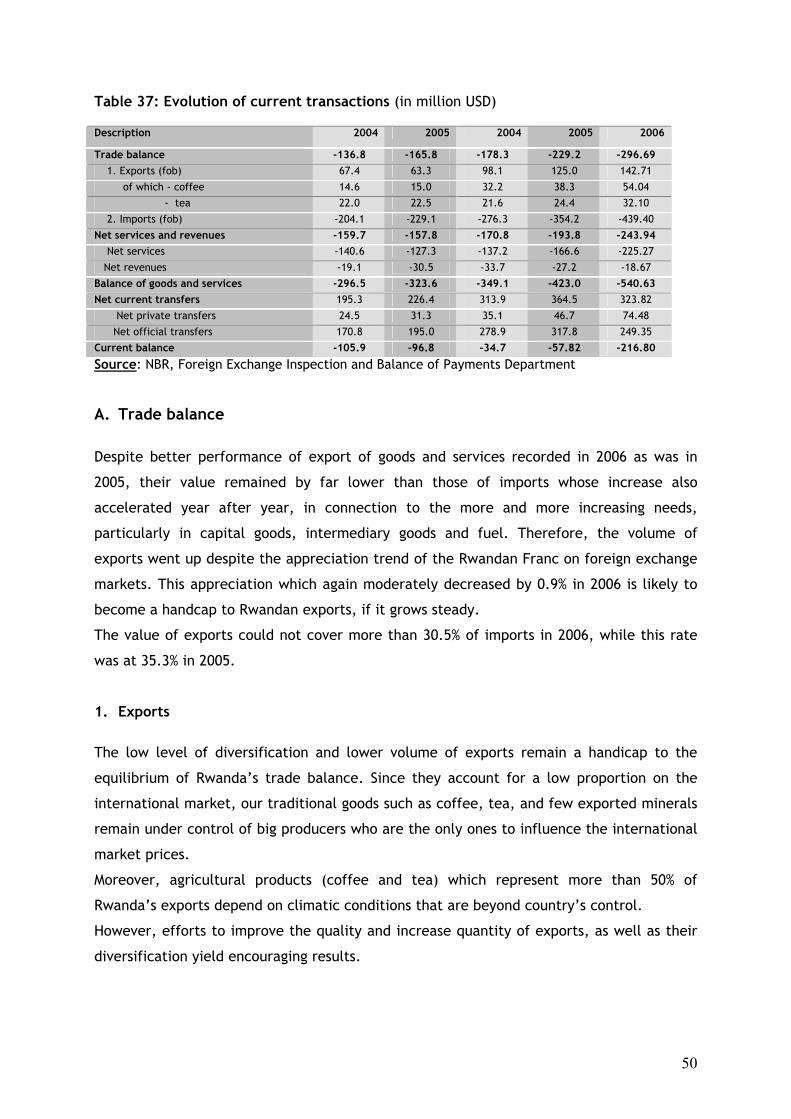
50
Table 37: Evolution of current transactions (in million USD) Description 2004 2005 2004 2005 2006
Trade balance -136.8 -165.8 -178.3 -229.2 -296.69 1. Exports (fob) 67.4 63.3 98.1 125.0 142.71
of which - coffee 14.6 15.0 32.2 38.3 54.04
- tea 22.0 22.5 21.6 24.4 32.10
2. Imports (fob) -204.1 -229.1 -276.3 -354.2 -439.40
Net services and revenues -159.7 -157.8 -170.8 -193.8 -243.94 Net services -140.6 -127.3 -137.2 -166.6 -225.27
Net revenues -19.1 -30.5 -33.7 -27.2 -18.67
Balance of goods and services -296.5 -323.6 -349.1 -423.0 -540.63 Net current transfers 195.3 226.4 313.9 364.5 323.82
Net private transfers 24.5 31.3 35.1 46.7 74.48
Net official transfers 170.8 195.0 278.9 317.8 249.35
Current balance -105.9 -96.8 -34.7 -57.82 -216.80
Source: NBR, Foreign Exchange Inspection and Balance of Payments Department
A. Trade balance
Despite better performance of export of goods and services recorded in 2006 as was in
2005, their value remained by far lower than those of imports whose increase also
accelerated year after year, in connection to the more and more increasing needs,
particularly in capital goods, intermediary goods and fuel. Therefore, the volume of
exports went up despite the appreciation trend of the Rwandan Franc on foreign exchange
markets. This appreciation which again moderately decreased by 0.9% in 2006 is likely to
become a handcap to Rwandan exports, if it grows steady.
The value of exports could not cover more than 30.5% of imports in 2006, while this rate
was at 35.3% in 2005.
1. Exports
The low level of diversification and lower volume of exports remain a handicap to the
equilibrium of Rwanda’s trade balance. Since they account for a low proportion on the
international market, our traditional goods such as coffee, tea, and few exported minerals
remain under control of big producers who are the only ones to influence the international
market prices.
Moreover, agricultural products (coffee and tea) which represent more than 50% of
Rwanda’s exports depend on climatic conditions that are beyond country’s control.
However, efforts to improve the quality and increase quantity of exports, as well as their
diversification yield encouraging results.
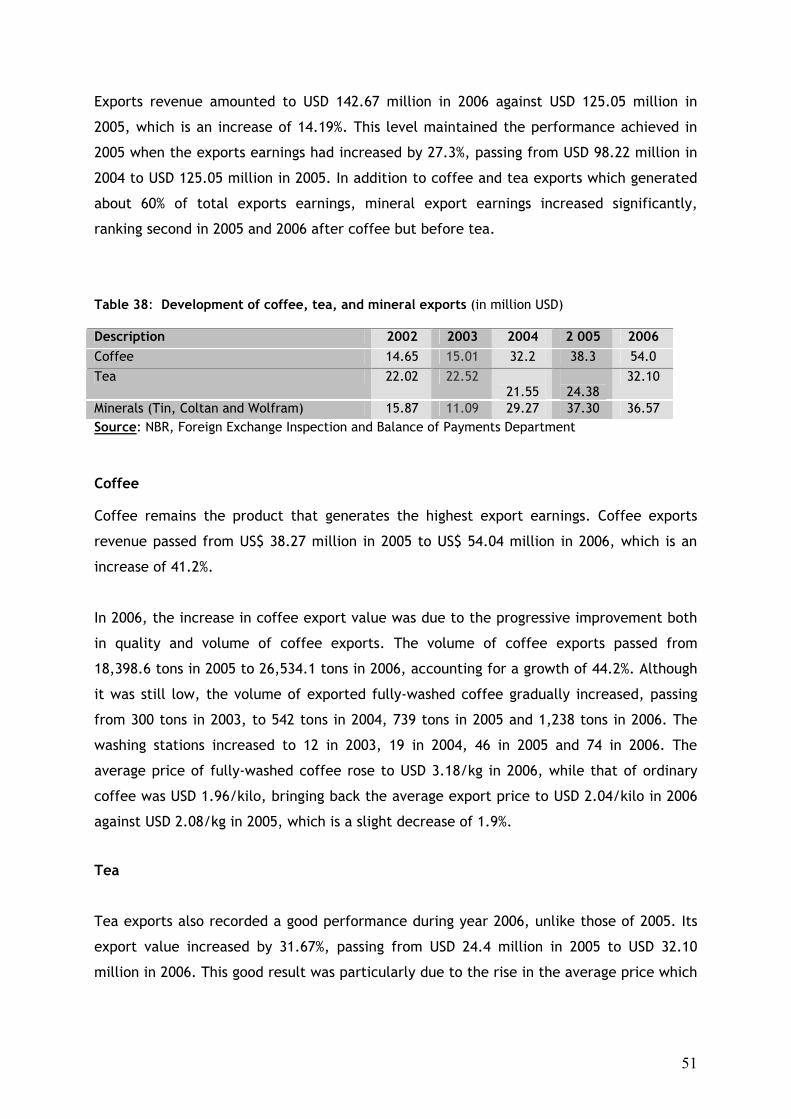
51
Exports revenue amounted to USD 142.67 million in 2006 against USD 125.05 million in
2005, which is an increase of 14.19%. This level maintained the performance achieved in
2005 when the exports earnings had increased by 27.3%, passing from USD 98.22 million in
2004 to USD 125.05 million in 2005. In addition to coffee and tea exports which generated
about 60% of total exports earnings, mineral export earnings increased significantly,
ranking second in 2005 and 2006 after coffee but before tea.
Table 38: Development of coffee, tea, and mineral exports (in million USD) Description 2002 2003 2004 2 005 2006 Coffee 14.65 15.01 32.2 38.3 54.0 Tea 22.02 22.52
21.55
24.38 32.10
Minerals (Tin, Coltan and Wolfram) 15.87 11.09 29.27 37.30 36.57 Source: NBR, Foreign Exchange Inspection and Balance of Payments Department
Coffee
Coffee remains the product that generates the highest export earnings. Coffee exports
revenue passed from US$ 38.27 million in 2005 to US$ 54.04 million in 2006, which is an
increase of 41.2%.
In 2006, the increase in coffee export value was due to the progressive improvement both
in quality and volume of coffee exports. The volume of coffee exports passed from
18,398.6 tons in 2005 to 26,534.1 tons in 2006, accounting for a growth of 44.2%. Although
it was still low, the volume of exported fully-washed coffee gradually increased, passing
from 300 tons in 2003, to 542 tons in 2004, 739 tons in 2005 and 1,238 tons in 2006. The
washing stations increased to 12 in 2003, 19 in 2004, 46 in 2005 and 74 in 2006. The
average price of fully-washed coffee rose to USD 3.18/kg in 2006, while that of ordinary
coffee was USD 1.96/kilo, bringing back the average export price to USD 2.04/kilo in 2006
against USD 2.08/kg in 2005, which is a slight decrease of 1.9%.
Tea
Tea exports also recorded a good performance during year 2006, unlike those of 2005. Its
export value increased by 31.67%, passing from USD 24.4 million in 2005 to USD 32.10
million in 2006. This good result was particularly due to the rise in the average price which
52
passed from USD 1.57/kg in 2005 to 1.93/Kg in 2006, which is an increase of 22.43%,
following an improvement in the quality of exported tea.
Exported volume experienced a slight rise of 7.5%, passing from 15 481 tons in 2005 to 16
649 tons in 2006. The best results were particularly achieved by OCIR-Thé, which exported
more than 77% of the total volume of production, by achieving an average price of about
USD 2.0/kg in 2006 for a total volume of 12 832.3 tons, while the second exporter, namely
SORWAThé did not achieve an average price of USD 1.86/kg out of a total exported volume
of 2 262 tons. The other two exporters, namely Pfunda Tea and Rwanda Mountain Tea
exported only 9.0% of the total volume, that is 1 236.3 tons and 318.4 tons respectively at
an average price of USD 1.5/kg.
Minerals
In spite of an exceptional increase in wolfram export earnings, which experienced an
improvement on the international market by achieving an all-time high price, the value of
mineral exports, namely tin, colombo tantalite (coltan) and wolfram passed from USD 37.3
million in 2005 to USD 36.57 million in 2006; representing a decline of 1.96%. This decrease
recorded in tin and coltan exports whose volumes appreciably dropped in spite of a good
price achieved on the tin market in 2006. The investment planned by major producers to
increase these two minerals production, particularly REDEMI and COPIMAR experienced a
considerable delay due to the slowness in the privatization process for the former and
financial constraints for the latter. Tin export value passed from USD 17.86 million in 2005
to USD 15.87 million in 2006, while coltan export value passed from USD 16.87 million in
2005 to USD 11.17 million in 2006, accounting for respective declines of 11.14% and
33.75%.
The volume of tin exports in 2005 amounted to 4 532 tons, while only 3 835 tons were
exported in 2006, which is a reduction of 15.37%. The volume of 1 062 tons of coltan
exported in 2005 decreased to 724 tons in 2006, that is a reduction of 31.78%.
Nevertheless, their prices did not put significant changes over the two periods.

53
Table 39: Developments of the value and volume of major exports (value in million USD and volume in tons)
Description 2002 2003 2004 2005 2006 Coffee Value 14.65 15.01 32.23 38.27 54.05 Volume 19
797 14 700 27
085 18
399
26 534 Tea Value 22.02 22.52
21.55
24.38
32.10 Volume 14 574 14 331 13
064 15
481
16649 Tin Value 1.41 4.49
15.88
17.86
15.87 Volume 672 1,458 3
553 4
532
3 835 Colombo tantalite Value 13.95 6.37
12.99
16.87
11.17 Volume 1 086.32 732.00 861 1 062 724 Wolfram Value 0.52 0.23
0.40
2.58
9.53 Volume 324.69 120.00 158 557 1,436 Hides and Skins Value 2.64 3.78
3.39
4.73
1.99 Volume 1,983.82 272.00 2
151 3
183 1
160 Pyrethrum extract Value 1.05 1.28
0.65
-
1.92 Volume 13.12 20.00 10
- 45
Other products 8.53 9.37 11.14
20.37
16.59
TOTAL VALUE 67.4 63.3 98.2 125.05 142.67
Source: NBR, Foreign Exchange Inspection and Balance of Payments Department
The high amount of Wolfram exports in 2006 was due to a high demand of the world
economy, particularly China and European countries since 2003 to the extent that export
price experienced successive increases, passing from USD 1.60/kg in 2002 to USD 1.89/kg
in 2003, USD 2.57/kg in 2004, USD 4.62/kg in 2005 and USD 6.64/kg in 2006. This
improvement in the market price led to a progressive increase in the export volume but at
the rate of the few production means available.
Hides and Skins

54
Hides and skins exports decreased considerably in 2006. They decreased from USD 4.73
million at the end of 2005 to USD 1.99 million at the end of 2006, which is a reduction of
57.99%. Some companies such as RWAGASABO, AFRICAN HIDES AND SKINS and SOCOPETROL
which had been active in 2005 exported nothing in 2006. This situation was mainly the
result of the new government policy prohibiting the export of untreated skins (without
value added) from the beginning of the year 2006.
Other products
The other export products, particularly flowers, fresh fruits, maracuja juice, textiles,
cosmetics and cement did not experience significant changes over period under review. In
addition, some goods were not exported. This is particularly the case for quinquina.
Nevertheless, in 2006, SOPYRWA Company which did not export anything in 2005 exported
44.5 tons of pyrethrum worth USD 2.08 million.
The re-exports which experienced a significant fall of 41.9% stabilized at USD 49.9 million
at the end of 2006. The good results achieved in 2005 were mainly due to the repatriation
of light and heavy machines by foreign road construction companies on completion of a
significant work of road rehabilitation throughout the country. The following major
products were re-exported in 2006: benzine (aeroplane fuel), drugs, second hand cloths,
cars, as well as various apparatuses and machines.
2. Imports
Imports were classified in four main categories, namely consumer goods, capital goods,
intermediary goods, and energy and lubricants.
Compared to the year 2005, the imports CIF in 2006, experienced a growth rate value of
23.47%, passing from USD 471.4 million in 2005 to USD 582.05 million in 2006. All
categories of imported goods experienced at least a rise of more than 15% in their values.
Intermediary goods
The value of imported intermediary goods increased by 31.48%, passing from USD 111.16
million at the end of 2005 to USD 146.15 million at the end of 2006. This significant rise
was particularly due to the volume increase of 33.97%, while the unit price of imported
goods dropped by 1.88%. Intermediary goods are classified into 4 categories, namely
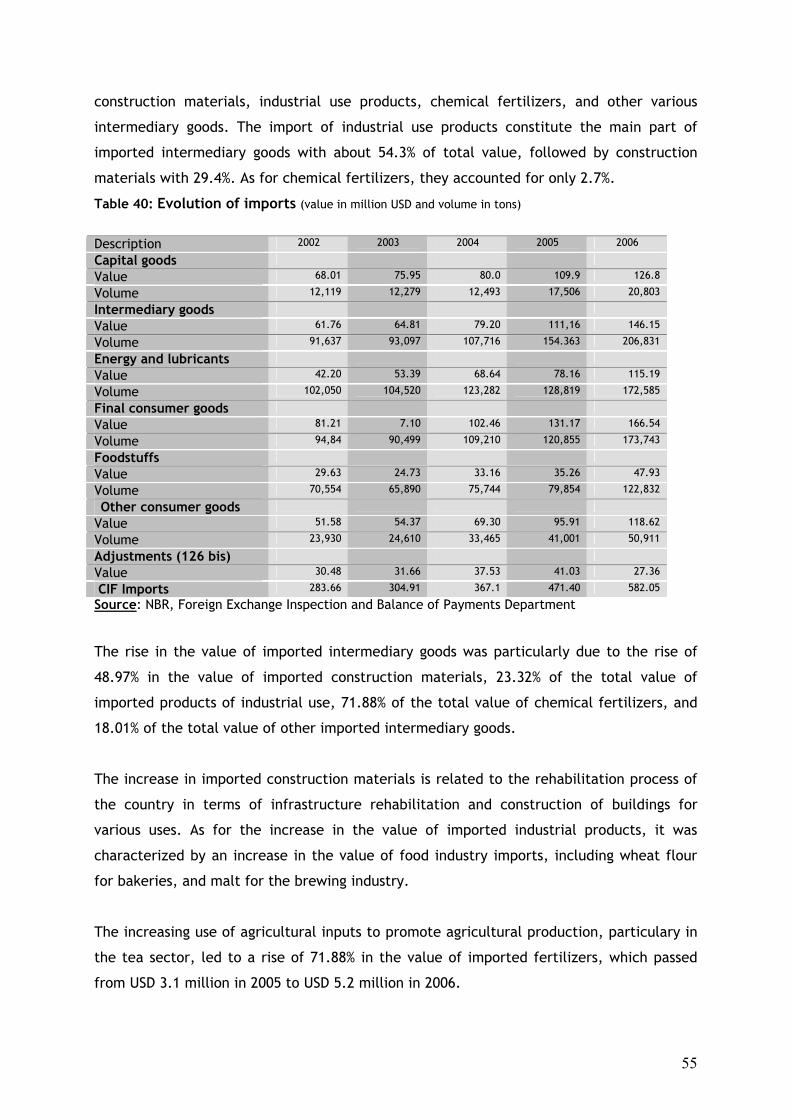
55
construction materials, industrial use products, chemical fertilizers, and other various
intermediary goods. The import of industrial use products constitute the main part of
imported intermediary goods with about 54.3% of total value, followed by construction
materials with 29.4%. As for chemical fertilizers, they accounted for only 2.7%.
Table 40: Evolution of imports (value in million USD and volume in tons)
Description 2002 2003 2004 2005 2006
Capital goods
Value 68.01 75.95 80.0 109.9 126.8
Volume 12,119 12,279 12,493 17,506 20,803
Intermediary goods
Value 61.76 64.81 79.20 111,16 146.15
Volume 91,637 93,097 107,716 154.363 206,831
Energy and lubricants
Value 42.20 53.39 68.64 78.16 115.19
Volume 102,050 104,520 123,282 128,819 172,585
Final consumer goods
Value 81.21 7.10 102.46 131.17 166.54
Volume 94,84 90,499 109,210 120,855 173,743
Foodstuffs
Value 29.63 24.73 33.16 35.26 47.93
Volume 70,554 65,890 75,744 79,854 122,832
Other consumer goods
Value 51.58 54.37 69.30 95.91 118.62
Volume 23,930 24,610 33,465 41,001 50,911
Adjustments (126 bis)
Value 30.48 31.66 37.53 41.03 27.36
CIF Imports 283.66 304.91 367.1 471.40 582.05
Source: NBR, Foreign Exchange Inspection and Balance of Payments Department
The rise in the value of imported intermediary goods was particularly due to the rise of
48.97% in the value of imported construction materials, 23.32% of the total value of
imported products of industrial use, 71.88% of the total value of chemical fertilizers, and
18.01% of the total value of other imported intermediary goods.
The increase in imported construction materials is related to the rehabilitation process of
the country in terms of infrastructure rehabilitation and construction of buildings for
various uses. As for the increase in the value of imported industrial products, it was
characterized by an increase in the value of food industry imports, including wheat flour
for bakeries, and malt for the brewing industry.
The increasing use of agricultural inputs to promote agricultural production, particulary in
the tea sector, led to a rise of 71.88% in the value of imported fertilizers, which passed
from USD 3.1 million in 2005 to USD 5.2 million in 2006.

56
Final consumer goods
The value of imports in final consumer goods increased by 27.0%, passing from USD 131.2
million in 2005 to USD 166.5 million in 2006. The volume of foodstuffs showed an increase
of 37.0%, stabilizing at a value of USD 48 million against USD 35 million in 2005. This
situation was related to local weak production of food crops during the great farming
season of 2006. The most imported foodstuffs were cooking oil and fats, cereals, flours and
seeds, as well as sugar and soft drinks which constitute 80% of the value of foodstuffs
imports.
Cooking oil and fats as well as sugar and soft drinks, which accounted each for 30% of the
value of foodstuffs import, increased respectively by 34% and 90% in value between 2005
and 2006; that is respective values of USD 14.6 million in 2006 against USD 10.9 million in
2005 for cooking oil and fats, and USD 12.1 million in 2006 against USD 6.4 million in 2005
for sugar and soft drinks. Cereals which represented 20% of the total value of foodstuffs
imports in 2006 experienced a value increase of 72.0%, passing from USD 64 million at the
end of 2005 to USD 11.0 million at the end of 2006.
Capital goods
Likewise, the value of imported capital goods increased by 15%, passing from USD 109.9
million in 2005 to USD 126.8 million in 2006. This was due to the rise in transport
equipments imports, which passed from USD 24.4 million at the end of 2005 to USD 30.7
million at the end of 2006, which is a growth rate of 26%. This transport equipment, mostly
trucks and buses, was particularly imported by AKAGERA MOTORS and SORWATRACO to
meet the public’s increasing demand and ONATRACOM for the renewal of its cartage.
The value of imported machines, equipment and tools increased by 9.6%, representing USD
70.98 million at the end of 2006, against USD 64.73 million at the end of 2005. This
increase was particularly noticeable through MTN RWANDACEL and TERRACOM’s imported
communication equipment and the import of automatic data processing machines and
other office furniture and equipment. In addition, the imported power generators by
private individuals appreciably curbed with Electrogaz’s purchase of big electricity
genetators which increased and tried to stabilize power distribution.
57
Energy and lubricants
Fuel represented more than 90% of imported energy and lubricants. Fuel imports increased
by 27.2% at the end of 2006 compared to the same period of 2005. This can be explained
by a significant increase in the particular volume of fuel consumed by ELECTROGAZ’s
electricity generators which came to curb the power crisis the country had been suffering
since the closing of the northern hydroelectric stations. The increase in the value of
imported fuel and lubricants was furthered by the continous rise in the international
market prices. The value of imported energy and lubricants totaled USD 115.19 million in
2006. They represented 78.16 in 2005 that is an increase of 47.37%.
B. Services and revenues balance Net balance of services and revenues experienced the same trend as the one for trade
balance. Fee received by residents for the services rendered to non-residents could not
even cover 50% of the one paid for the services received from the non-residents because
the most part of the paid services were related to imported goods.
Service balance
The balance of services remained structurally adverse, particularly due to the cost of
transport of imported goods. This was linked with the landlocked situation of the country.
The cost of transport and insurance of goods amounted to USD 142.65 million that is
38.28% of all services provided to non-residents in 2006, against USD 83.61 million in 2005,
with an increase of 70.61% in the volume of imported goods in 2006. The amount of
technical assistance also increased significantly in terms of the value of financial
assistance and capital operations for the benefit of the country.
On the other hand, with the credit of the balance of services, a significant rise in travel
receipts and other transports were experienced, following a particularly significant
movement of people in Rwanda in 2006, compared to 2005, mostly due to tourist reasons
and other businesses. The value of the services posted to the credit rose to USD 147.39
million in 2006, against USD 119.71 million in 2005, which is an increase of 23.12%.

58
Table 41: Evolution service exchanges and revenues (in million USD)
Description 2002 2003 2004 2005 2006
Net services -141.6 -127.2 -137.06 -166.46 -225.27
Credit 46.06 76.47 102.65 119.71 147.39
Freight and insurance 2.22 4.47 6.94 7.01 8.68
Other transports 10.03 13.92 14.50 17.76 25.10
Travels 11.80 30.08 43.50 48.76 59.15
Other services 22.0 28.00 37.71 46.17 54.46
Debit -187.7 -203.66 -239.7 -286.17 -372.65
Freight and insurance -53.77 -54.08 -65.23 -83.61 -142.65
Other transports -28.88 -24.14 -26.51 -38.21 -38.97
Travels -23.86 -26.06 -31.48 -36.75 -39.71
Other services -81.17 -99.38 -116.49 -127.60 -151.33
Net revenues -19.1 -30.5 -33.7 -2.,2 -18.7
Credit 8.45 6.17 5.56 15.45 20.34
Return on investissements 8.45 5.97 5.37 15.20 18.76
Earned income 0.00 0.19 0.19 0.24 1.58
Property income 0.00 0.02 0.00 0.00 0.00
Debit -27.5 -36.7 -39.2 -42.7 -39.01
Return on direct investments -0.36 -5.50 -2.97 -3.61 -3.29
Return on other investissements -13.30 -16.43 -20.30 -17.89 -12.13
Earned income -1360 -14.49 -15.72 -20.68 -23.11
Property income -0.24 -0.29 -0.23 -0.48 -0.48
Net services and revenues -160.67 -157.72 -170.71 -193.67 -243.94
Source: NBR, Foreign Exchange Inspection and Balance of Payments Department
Revenues balance
Although the net balance of revenues improved, passing from USD -27.2 million in 2005 to
USD -18.7 million in 2006, mostly due to the increase in the NBR’s return on investments, it
could not significantly compensate for the balance of the balance of net services and
revenues whose deficit worsened in 2006, following a significant deterioration of the
balance of services. Indeed, the balance of the balance of revenues remained structurally
very weak, representing only 7.65% of the balance of net services and incomes in 2006.
C. Transfers without contreparts
The current net transfers without counterparts recorded in 2006 decreased by 11.16%,
declining to USD 323.82 million whereby they amounted to USD 364.52 million in 2005. This
deterioration was mainly due to a significant decline in net current support which passed
from USD 200.12 million in 2005 to USD 128.35 million in 2006 that is a decrease of 35.86%.
The financial assistance was granted by the United Kingdom (USD 63.67 million), the
European Union (USD 22.47 million), Sweden (USD 10.91 million), African Peace Keeping

59
Union (USD 8.04 million) and Multi-donor Trust Fund (USD 1.29 million). A financial
assistance of USD 21.97 million was also received in 2006 within the framework of HIPC
(Heavily Indebted Poor Countries) initiative.
Although decreased, the current budgetary support without counterparts accounted for
51.47% of the net current official transfers of USD 249.35 million in 2006, representing 77%
of the total net current transfers without counterparts.
The net private current transfers which amounted to US 46.73 million in 2005 increased to
US$ 74.48 million in 2006, which is a sharp increase of 59.39%. These transfers mainly
consisted of donations to various religious non profit-making associations working in
Rwanda, and private individuals leaving in the country.
2. CAPITAL AND FINANCIAL OPERATIONS ACCOUNT
The year 2006 was characterized by an increase of 65.56% in the capital and financial
operations account, compared to the results of 2005. The account balance therefore
passed from USD 175.95 million in 2005 to USD 291.31 million in 2006.
Since Rwanda took advantage of the canceletion of debt within the framework of
Multilateral Debt Reduction Initiative (MDRI), the capital account which had recorded a
balance of USD 93.47 million at the end of 2005 increased significantly to USD 1400.08
million. The transfer operations in terms of capital grants to finance the development of
the country amounted to USD 173.48 million, including USD 76.6 million from the IMF.
After recording a significant amount of USD 108.61 million in 2004, the disbursements of
official loans for current budget and project support decreased progressively in 2005 and
2006. They came down to USD 89.98 million in 2005 and to only USD 68.07 million in 2006.
The Government current budget support rose to USD 14.83 million in 2006, drawn on the
loans from ADB (USD 7.95 million) and IDA (USD 6.88 million). Concerning the project
support loans, they totaled USD 53.24 million in 2006 against USD 59.10 million in 2005
that is a reduction of 9.92%.
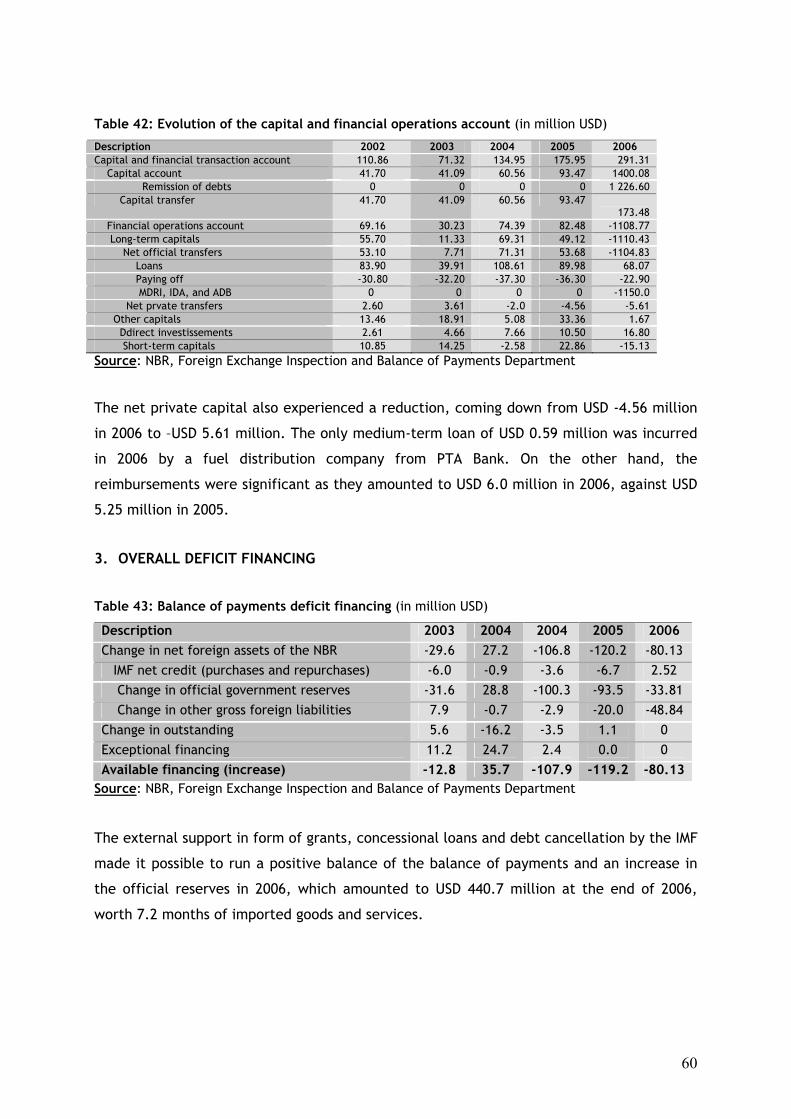
60
Table 42: Evolution of the capital and financial operations account (in million USD)
Description 2002 2003 2004 2005 2006 Capital and financial transaction account 110.86 71.32 134.95 175.95 291.31 Capital account 41.70 41.09 60.56 93.47 1400.08 Remission of debts 0 0 0 0 1 226.60 Capital transfer 41.70 41.09 60.56 93.47
173.48 Financial operations account 69.16 30.23 74.39 82.48 -1108.77 Long-term capitals 55.70 11.33 69.31 49.12 -1110.43 Net official transfers 53.10 7.71 71.31 53.68 -1104.83 Loans 83.90 39.91 108.61 89.98 68.07 Paying off -30.80 -32.20 -37.30 -36.30 -22.90 MDRI, IDA, and ADB 0 0 0 0 -1150.0 Net prvate transfers 2.60 3.61 -2.0 -4.56 -5.61 Other capitals 13.46 18.91 5.08 33.36 1.67 Ddirect investissements 2.61 4.66 7.66 10.50 16.80 Short-term capitals 10.85 14.25 -2.58 22.86 -15.13 Source: NBR, Foreign Exchange Inspection and Balance of Payments Department
The net private capital also experienced a reduction, coming down from USD -4.56 million
in 2006 to –USD 5.61 million. The only medium-term loan of USD 0.59 million was incurred
in 2006 by a fuel distribution company from PTA Bank. On the other hand, the
reimbursements were significant as they amounted to USD 6.0 million in 2006, against USD
5.25 million in 2005.
3. OVERALL DEFICIT FINANCING
Table 43: Balance of payments deficit financing (in million USD)
Description 2003 2004 2004 2005 2006 Change in net foreign assets of the NBR -29.6 27.2 -106.8 -120.2 -80.13 IMF net credit (purchases and repurchases) -6.0 -0.9 -3.6 -6.7 2.52 Change in official government reserves -31.6 28.8 -100.3 -93.5 -33.81 Change in other gross foreign liabilities 7.9 -0.7 -2.9 -20.0 -48.84 Change in outstanding 5.6 -16.2 -3.5 1.1 0 Exceptional financing 11.2 24.7 2.4 0.0 0 Available financing (increase) -12.8 35.7 -107.9 -119.2 -80.13
Source: NBR, Foreign Exchange Inspection and Balance of Payments Department
The external support in form of grants, concessional loans and debt cancellation by the IMF
made it possible to run a positive balance of the balance of payments and an increase in
the official reserves in 2006, which amounted to USD 440.7 million at the end of 2006,
worth 7.2 months of imported goods and services.

61
II.4.2. FOREIGN DEBT 1. EXTERNAL PUBLIC DEBT The externa public debt of Rwanda mostly composed of multilateral debt, while bilateral
debt accounted only for a small part of the total external public debt. The external public
debt stock owed to multilateral creditors is estimated at about 84.0% of the total debt in
2006, while the bilateral debt amounted to about 16.0%.
The outstanding of external public debt took a new turn since 2005 with the cancellation
of all debts of Rwanda owed to the Paris Club. This situation improved significantly in 2006
with the implementation of the Multilatereal Debt Reduction Initiative (MDRI) policy.
The Multilateral Debt Reduction Initiative, which was proposed by the G8 countries at the
Gleneagles summit of July 8, 2005, is a plan implemented by the countries which have
completed the HIPC (Heavily Indebted Poor Countries) initiative aiming at cancelling the
debt owed to the multilateral financial institutions, including the African Development
Fund (ADF), the World Bank’s International Development Association (IDA), and the
International Monetary Fund (IMF).
Figure18: Evolution of the external public debt (in million USD)
0.0
200.0
400.0
600.0
800.0
1000.0
1200.0
1400.0
1600.0
1800.0
2000 2001 2002 2003 2004 2005 2006
Multileteral DebtBilateral DebtTotal Debt
Source: NBR, Foreign Exchange Inspection and Balance of Payments Department The MDRI should provide the beneficiary countries with the opportunity to substantially
reduce the repayment of their total debt, and through sustainable economic performance,
ensure additional inflows of resources to help them achieve the Millenium Development
Goals. It is estimated that the implementation of the MDRI will bring down the foreign debt

62
average discounted cash flow (DCF), compared to the exports of the HIPC which have
reached the completion point, including Rwanda which passed from 140.0% to less than
60.0%.
1.1 . External debt stock
External public debt stock decreased by 73.0% passing from USD 1 551.5 million in 2005 to
USD 419.5 million in 2006. This situation was the result of the cancellation of the
multilateral debt concluded by the G8 countries in favour of the 18 countries that have
reached the completion point, including Rwanda.
It should be noted that, a part from cancellation of external public debt stock by
multilateral creditors which had a significant impact on the current debt situation, loan
disbursements from multilateral creditors in 2006 did not markedly impact the amount of
stock of external public debt in 2006.
Table 44: Development of external public debt stock (in million USD)
Description 2000 2001 2002 2003 2004 2005 2006 Multilateral debt 1096.8 1 101.5 1 240.9 1 350.8 1 501.8 1 467.80 337.0 IDA 693.9 714 827.2 904.5 1024.3 985.7 162.8 AfDB-ADF 218.6 209 226.2 239.8 260.4 277.1 38.8 BADEA 33.4 29.4 26.2 22.9 19.8 16.4 16.4 OPEC countries 6.8 6.8 10.7 16.6 17.5 16.5 17.7 EIB 5.6 5 5.5 7.9 11.1 16.2 16.8 EU (EEC) 21.5 20.3 23.9 24.6 26.3 227 22.4 IFAD 31.2 33 37.2 44,1 50.5 53 55.6 IMF 85.8 83.9 84 90.5 92.1 80.2 6.5 BILATERAL DEBT 163.7 143.7 159.4 171.4 178.2 83.7 82.5 Paris Club 68.1 64 74.5 86.5 93.1 0 0 France 35.2 33.6 40.2 48.6 52.9 0 0 Austria 8.7 8.3 9.6 10.1 11 0 0 Japan 13.6 11.9 13.2 14.8 15.4 0 0 Netherlands 0.7 0.7 0.8 1 1.1 0 0 BNP Paris 2.9 2.8 3.3 3.9 4.3 0 0 COFACE 3.5 3.3 3.9 5 5.4 0 0 Canada 3 3 3 3.1 3.1 0 0 USA 0.6 0.6 0.6 0 0 0 0 Non Paris Club 9..6 79.7 84.9 84.9 85.1 83.7 82.5 China 32.1 16.5 21.2 20.2 19.6 18.1 18.1 Saudi Arabia 30.6 30.6 30.2 29.9 30.3 30.1 29.8 Kuwait 29.4 29.3 30.5 31.7 32.1 32.4 32.4 ABU DHABI 2.5 2.6 2.7 2.7 2.7 2.7 1.8 Libya 1 0.8 0.4 0.4 04 0.4 0.4 GRAND TOTAL 1.260.6 1,245.2 1,400.2 1,522.2 1,680.1 1,551.5 419.5 Source: NBR, Foreign Exchange Inspection and Balance of Payments Department
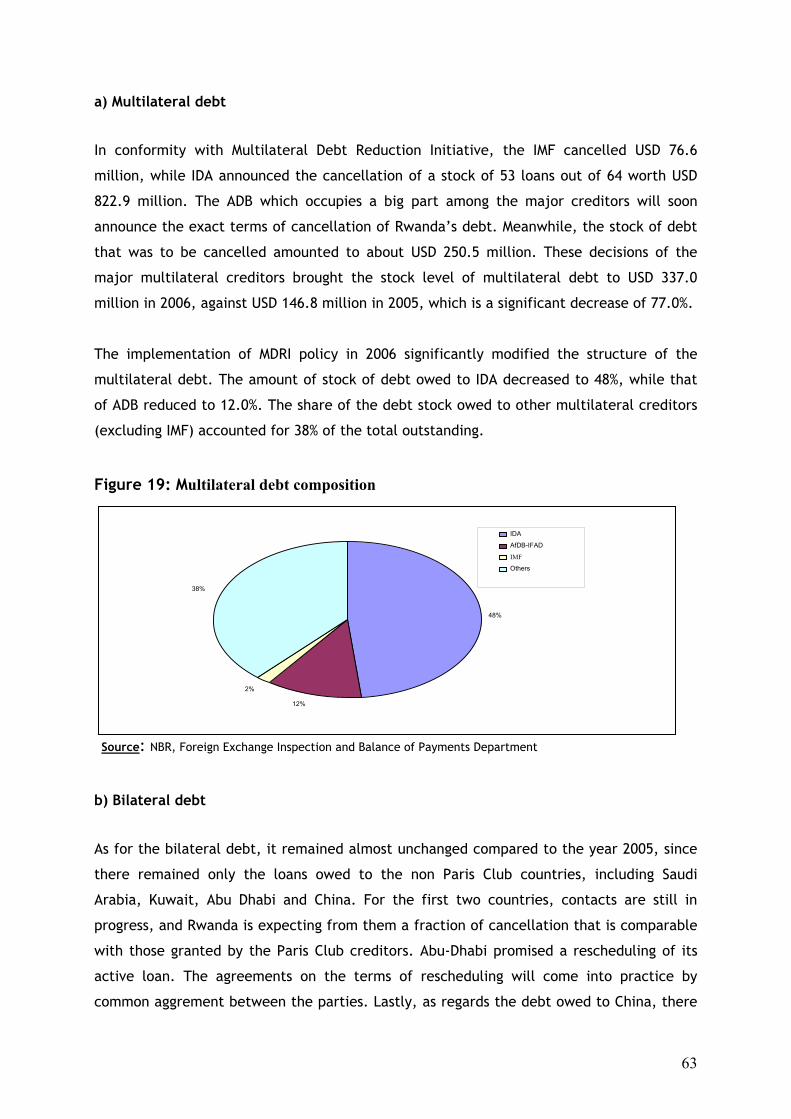
63
a) Multilateral debt
In conformity with Multilateral Debt Reduction Initiative, the IMF cancelled USD 76.6
million, while IDA announced the cancellation of a stock of 53 loans out of 64 worth USD
822.9 million. The ADB which occupies a big part among the major creditors will soon
announce the exact terms of cancellation of Rwanda’s debt. Meanwhile, the stock of debt
that was to be cancelled amounted to about USD 250.5 million. These decisions of the
major multilateral creditors brought the stock level of multilateral debt to USD 337.0
million in 2006, against USD 146.8 million in 2005, which is a significant decrease of 77.0%.
The implementation of MDRI policy in 2006 significantly modified the structure of the
multilateral debt. The amount of stock of debt owed to IDA decreased to 48%, while that
of ADB reduced to 12.0%. The share of the debt stock owed to other multilateral creditors
(excluding IMF) accounted for 38% of the total outstanding.
Figure 19: Multilateral debt composition
Source: NBR, Foreign Exchange Inspection and Balance of Payments Department b) Bilateral debt
As for the bilateral debt, it remained almost unchanged compared to the year 2005, since
there remained only the loans owed to the non Paris Club countries, including Saudi
Arabia, Kuwait, Abu Dhabi and China. For the first two countries, contacts are still in
progress, and Rwanda is expecting from them a fraction of cancellation that is comparable
with those granted by the Paris Club creditors. Abu-Dhabi promised a rescheduling of its
active loan. The agreements on the terms of rescheduling will come into practice by
common aggrement between the parties. Lastly, as regards the debt owed to China, there
48%
12% 2%
38%
IDA
AfDB-IFAD
IMF
Others

64
is some hope to reach soon a formal agreement since it has already announced its
intention of soon cancelliing the stock of 4 remaining loans. Nevertheless, bilateral debt
stock slightly dropped equally in 2006 (-1.4%), passing from USD 83.7 million in 2005 to USD
82.5 million in 2006.
c) Structure of the amount of debt as per loan currency
Table 45: Structure of bilateral debt stock as per foreign currency loan (in million USD)
2001 2002 2003 2004 2005 2006 Currency Amount % total
outst. Amount % total
outst. Amount % total
outst. Amount % Total
outst. Amount % total
outst. Amount % total
outst. SDR 946.03 76.0% 1082.9 77.5% 1195.0 78.5% 1348.3 80,2% 1
324.1 85.3% 260.7 62.1%
US$ 132.13 10.6% 125.8 9.0% 125.4 8.2% 119.9 7.1% 104.8 6.8% 37.1 8.8% EURO 74.63 6.0% 87.1 6.2% 101.2 6.6% 111.9 6.7% 38.8 2.5% 39.3 9.4% SR 31.33 2.5% 30.2 2.2% 29.9 2.0% 30.3 1.8% 30 1.9% 29.8 7.1% KD 29.3 2.4% 30.5 2.2% 31.8 2.1% 32.1 1.9% 32.1 2.1% 32.4 7.7% YUAN 16.5 1.3% 21.2 1.5% 20.3 1.3% 19.6 1.2% 18.6 1.2% 18.1 4.3% Others 15.28 1.2% 19.3 1.4% 18.6 1.2% 18.6 1.1% 3.1 0.2% 2.1 0.5% Total 1245.2 100.0% 1397.0 100.0% 1522.2 100.0% 1680.7 100.0% 1551.5 100.0% 419.5 100.0%
Source: NBR, Foreign Exchange Inspection and Balance of Payments Department
Concerning the structure of bilateral debt as per foreign currency loan, the SDR component
remained predominent in 2006, compared with other foreign currencies, even if its
importance in absolute terms significantly fell between 2005 and 2006, taking into account
the reduction of the amount of SDR loans, particularly those of the IMF, ADB and part of
the IDA loans. The signficant reduction against the dollar recorded in 2006 resulted from
IDA’s cancellation of all loans in USD. Out of USD 104.8 million in 2005, the volume of loans
in USD fell to 37.1 million in 2006.
1.2. Loan disbursements
Loan disbursements reduced much in 2006 to USD 64.8 million since they were estimated
at USD 100.9 million in 2005 that is a decrease of 36% between 2005 and 2006.

65
Table 46: Evolution of loan disbursements (in million USD)
Description 2001 2002 2003 2004 2005 2006 Multilateral loans 90.4 91.5 43.5 106.7 10.9 64.8 Of which: IDA 53.7 73.3 25.4 83.2 47.7 36.5
AfDB-ADF 11.7 9.1 6.0 13.5 36.8 17.8
Bilateral loans 1.1 1.5 0.0 0.0 0.0 0.0 Total 91.5 93 43.5 106.7 100.9 64.8 Of which:
Project loans 42.6 46.1 31.2 44.3 92.7 55.4
Budget support loans 30.8 46.0 11.4 60.7 8.2 6.9
Drawings for BOP supports (IMF)
18.1 0.8 0.8 1.7 0.0 2.5
Source: NBR, Foreign Exchange and Balance of Payments Department
These disbursements have remained 100% multilateral and exclusively IDA share and ADB
group since 2003. IDA loans took the lion’s share, followed by the ADB group. In 2006, IDA
loan disbursements amounted to USD 36.5 million against USD 47.7 million in 2005 that is a
23.5% fall. ADB loan disbursements also fell to USD 17.8 million in 2006, against USD 36.8
million in 2005, which is a decrease of 51.3%.
In 2006, most of the disbursements were geared towards development projects as it was
also the case in 2005 but in absolute terms different proportions, given that disbursements
were low, amounting to USD 55.4 million against USD 92.7 million in 2005. Drawings on
budgetary support under external debt dropped significantly, passing from USD 60.7 million
in 2004 to USD 8.2 million in 2005, and to USD 6.9 million in 2006.
Figure 20: Loan drawings as per type of financing (in million USD)
30.516.1
42.630.8
46.146
31.211.4
44.360.7
92.7
8.2
55.4
6.9
0 10 20 30 40 50 60 70 80 90 100
2000
2001
2002
2003
2004
2005
2006
Budgetary support loans
Project loans
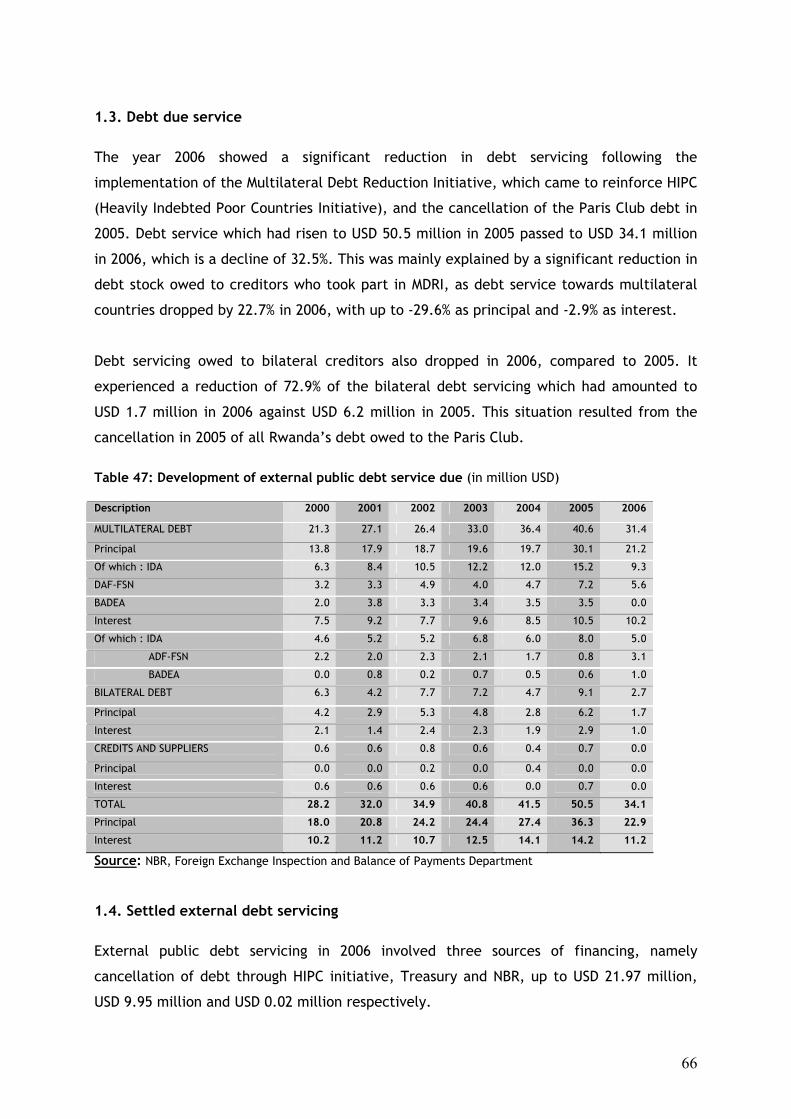
66
1.3. Debt due service
The year 2006 showed a significant reduction in debt servicing following the
implementation of the Multilateral Debt Reduction Initiative, which came to reinforce HIPC
(Heavily Indebted Poor Countries Initiative), and the cancellation of the Paris Club debt in
2005. Debt service which had risen to USD 50.5 million in 2005 passed to USD 34.1 million
in 2006, which is a decline of 32.5%. This was mainly explained by a significant reduction in
debt stock owed to creditors who took part in MDRI, as debt service towards multilateral
countries dropped by 22.7% in 2006, with up to -29.6% as principal and -2.9% as interest.
Debt servicing owed to bilateral creditors also dropped in 2006, compared to 2005. It
experienced a reduction of 72.9% of the bilateral debt servicing which had amounted to
USD 1.7 million in 2006 against USD 6.2 million in 2005. This situation resulted from the
cancellation in 2005 of all Rwanda’s debt owed to the Paris Club.
Table 47: Development of external public debt service due (in million USD) Description 2000 2001 2002 2003 2004 2005 2006
MULTILATERAL DEBT 21.3 27.1 26.4 33.0 36.4 40.6 31.4
Principal 13.8 17.9 18.7 19.6 19.7 30.1 21.2
Of which : IDA 6.3 8.4 10.5 12.2 12.0 15.2 9.3
DAF-FSN 3.2 3.3 4.9 4.0 4.7 7.2 5.6
BADEA 2.0 3.8 3.3 3.4 3.5 3.5 0.0
Interest 7.5 9.2 7.7 9.6 8.5 10.5 10.2
Of which : IDA 4.6 5.2 5.2 6.8 6.0 8.0 5.0
ADF-FSN 2.2 2.0 2.3 2.1 1.7 0.8 3.1
BADEA 0.0 0.8 0.2 0.7 0.5 0.6 1.0
BILATERAL DEBT 6.3 4.2 7.7 7.2 4.7 9.1 2.7
Principal 4.2 2.9 5.3 4.8 2.8 6.2 1.7
Interest 2.1 1.4 2.4 2.3 1.9 2.9 1.0
CREDITS AND SUPPLIERS 0.6 0.6 0.8 0.6 0.4 0.7 0.0
Principal 0.0 0.0 0.2 0.0 0.4 0.0 0.0
Interest 0.6 0.6 0.6 0.6 0.0 0.7 0.0
TOTAL 28.2 32.0 34.9 40.8 41.5 50.5 34.1
Principal 18.0 20.8 24.2 24.4 27.4 36.3 22.9
Interest 10.2 11.2 10.7 12.5 14.1 14.2 11.2
Source: NBR, Foreign Exchange Inspection and Balance of Payments Department 1.4. Settled external debt servicing
External public debt servicing in 2006 involved three sources of financing, namely
cancellation of debt through HIPC initiative, Treasury and NBR, up to USD 21.97 million,
USD 9.95 million and USD 0.02 million respectively.
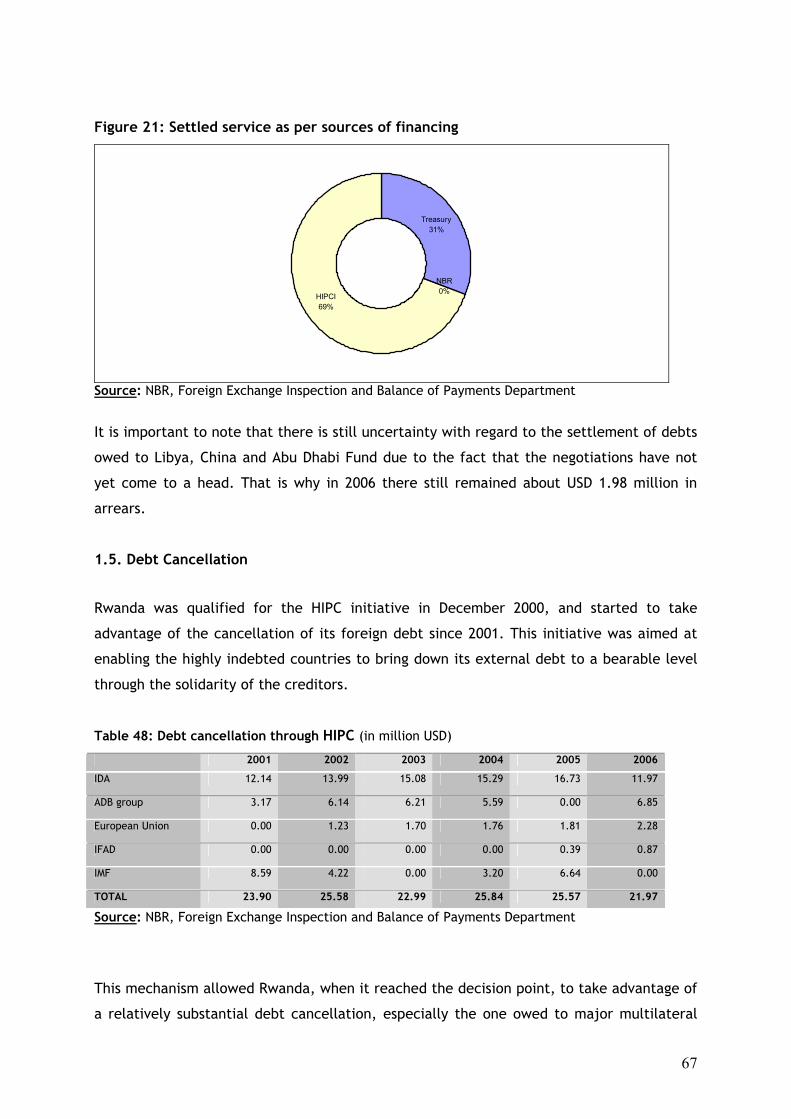
67
Figure 21: Settled service as per sources of financing
HIPCI69%
NBR0%
Treasury31%
Source: NBR, Foreign Exchange Inspection and Balance of Payments Department
It is important to note that there is still uncertainty with regard to the settlement of debts
owed to Libya, China and Abu Dhabi Fund due to the fact that the negotiations have not
yet come to a head. That is why in 2006 there still remained about USD 1.98 million in
arrears.
1.5. Debt Cancellation
Rwanda was qualified for the HIPC initiative in December 2000, and started to take
advantage of the cancellation of its foreign debt since 2001. This initiative was aimed at
enabling the highly indebted countries to bring down its external debt to a bearable level
through the solidarity of the creditors.
Table 48: Debt cancellation through HIPC (in million USD)
2001 2002 2003 2004 2005 2006
IDA 12.14 13.99 15.08 15.29 16.73 11.97
ADB group 3.17 6.14 6.21 5.59 0.00 6.85
European Union 0.00 1.23 1.70 1.76 1.81 2.28
IFAD 0.00 0.00 0.00 0.00 0.39 0.87
IMF 8.59 4.22 0.00 3.20 6.64 0.00
TOTAL 23.90 25.58 22.99 25.84 25.57 21.97
Source: NBR, Foreign Exchange Inspection and Balance of Payments Department
This mechanism allowed Rwanda, when it reached the decision point, to take advantage of
a relatively substantial debt cancellation, especially the one owed to major multilateral
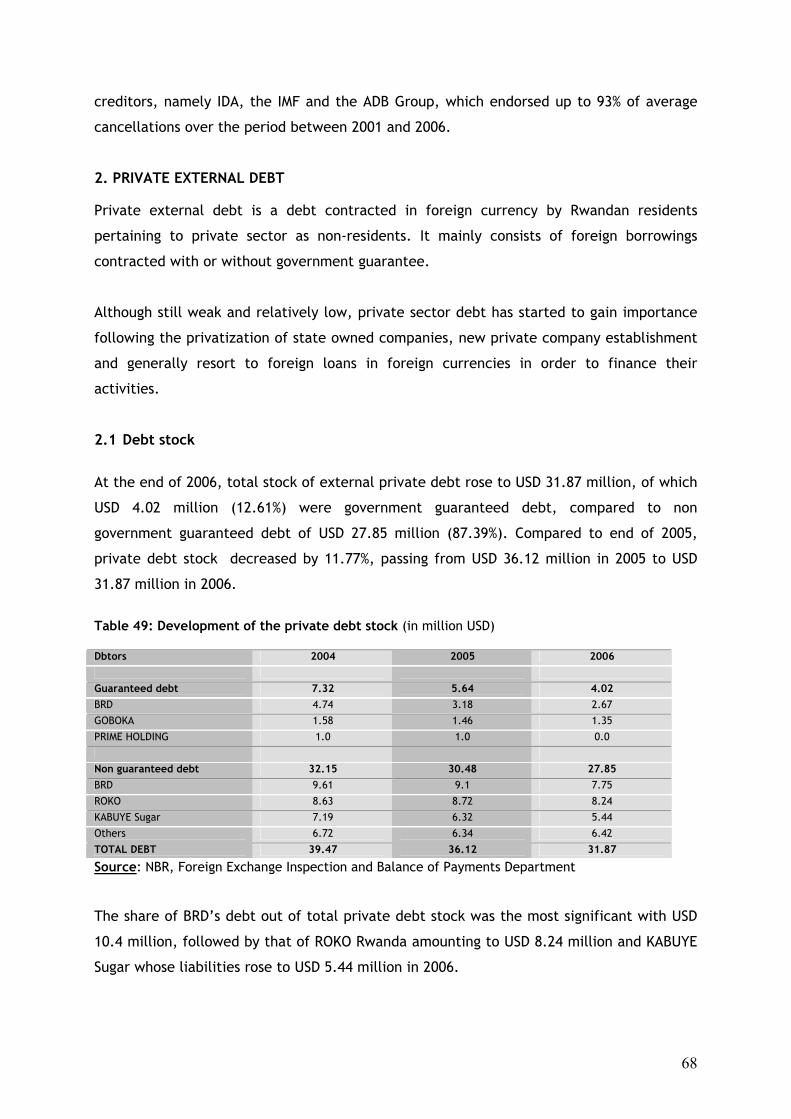
68
creditors, namely IDA, the IMF and the ADB Group, which endorsed up to 93% of average
cancellations over the period between 2001 and 2006.
2. PRIVATE EXTERNAL DEBT Private external debt is a debt contracted in foreign currency by Rwandan residents
pertaining to private sector as non-residents. It mainly consists of foreign borrowings
contracted with or without government guarantee.
Although still weak and relatively low, private sector debt has started to gain importance
following the privatization of state owned companies, new private company establishment
and generally resort to foreign loans in foreign currencies in order to finance their
activities.
2.1 Debt stock
At the end of 2006, total stock of external private debt rose to USD 31.87 million, of which
USD 4.02 million (12.61%) were government guaranteed debt, compared to non
government guaranteed debt of USD 27.85 million (87.39%). Compared to end of 2005,
private debt stock decreased by 11.77%, passing from USD 36.12 million in 2005 to USD
31.87 million in 2006.
Table 49: Development of the private debt stock (in million USD) Dbtors 2004 2005 2006
Guaranteed debt 7.32 5.64 4.02 BRD 4.74 3.18 2.67
GOBOKA 1.58 1.46 1.35
PRIME HOLDING 1.0 1.0 0.0
Non guaranteed debt 32.15 30.48 27.85 BRD 9.61 9.1 7.75
ROKO 8.63 8.72 8.24
KABUYE Sugar 7.19 6.32 5.44
Others 6.72 6.34 6.42
TOTAL DEBT 39.47 36.12 31.87
Source: NBR, Foreign Exchange Inspection and Balance of Payments Department
The share of BRD’s debt out of total private debt stock was the most significant with USD
10.4 million, followed by that of ROKO Rwanda amounting to USD 8.24 million and KABUYE
Sugar whose liabilities rose to USD 5.44 million in 2006.
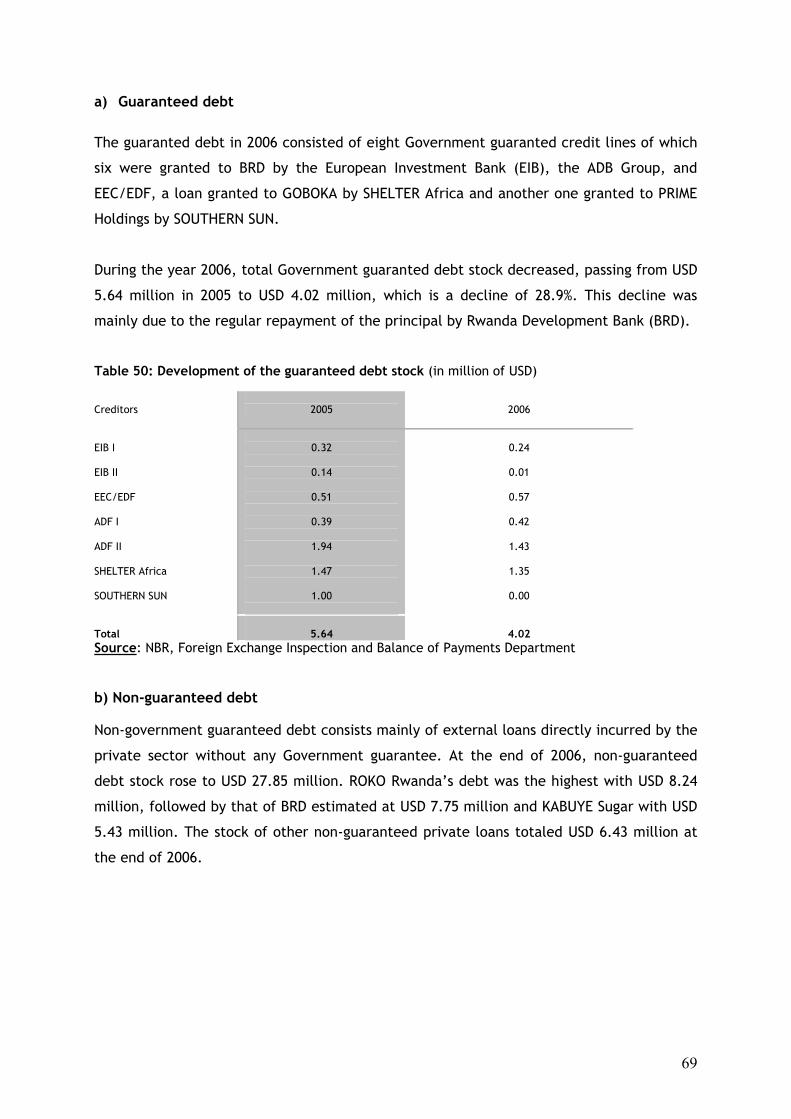
69
a) Guaranteed debt
The guaranted debt in 2006 consisted of eight Government guaranted credit lines of which
six were granted to BRD by the European Investment Bank (EIB), the ADB Group, and
EEC/EDF, a loan granted to GOBOKA by SHELTER Africa and another one granted to PRIME
Holdings by SOUTHERN SUN.
During the year 2006, total Government guaranted debt stock decreased, passing from USD
5.64 million in 2005 to USD 4.02 million, which is a decline of 28.9%. This decline was
mainly due to the regular repayment of the principal by Rwanda Development Bank (BRD).
Table 50: Development of the guaranteed debt stock (in million of USD) Creditors
2005
2006
EIB I EIB II EEC/EDF ADF I ADF II SHELTER Africa SOUTHERN SUN
0.32
0.14
0.51
0.39
1.94
1.47
1.00
0.24
0.01
0.57
0.42
1.43
1.35
0.00
Total
5.64
4.02
Source: NBR, Foreign Exchange Inspection and Balance of Payments Department b) Non-guaranteed debt Non-government guaranteed debt consists mainly of external loans directly incurred by the
private sector without any Government guarantee. At the end of 2006, non-guaranteed
debt stock rose to USD 27.85 million. ROKO Rwanda’s debt was the highest with USD 8.24
million, followed by that of BRD estimated at USD 7.75 million and KABUYE Sugar with USD
5.43 million. The stock of other non-guaranteed private loans totaled USD 6.43 million at
the end of 2006.

70
Figure 22: Development of guaranteed debt stock by borrower
Source: NBR, Foreign Exchange Inspection and Balance of Payments Department 2.2. Disbursement and debt service The amount disbursed as external private debt was concerned with only two loans. Out of
these disbursements totalling USD 4.64 million at the end of 2006, the most significant was
in favor of RWACOF with USD 4.05 million from SUCAFINA S.A., within the framework of
the 2006 coffee season, and the other one of USD 0.59 million granted to PETROCOM by
PTA BANK was intended to finance the importation of fifteen trailers for petroleum
products transportion.
The service due on private debt in 2006 was estimated at USD 12.83 million, of which USD
11.37 million was the principal and USD 1.45 million was interests. It included a short-term
loan of USD 5.36 million as well as a medium and long term loans of USD 7.54 million,
which are 43.90% and 56.10% respectively. The provisional liabilities of the guaranteed
debt as the principal and interests in 2006 was USD 2.17 million compared to USD 10.66
million in relation to non government guaranteed debt.
The amount repayed in relation to private debt servicing at the end of 2006 totaled USD
9.29 million, of which USD 7.95 million is the principal and USD 1.34 million as interests
payment. More significant repayments of USD 4.05 million were made by RWACOF, USD
2.80 million by BRD, and USD 1.20 million by PRIME HOLDINGS.
28%
29%20%
23%
BRD Roko Kabuye Others
71
_______________________________________________________
PART II: ACTIVITIES OF THE BANK _______________________________________________________
72
CHAPTER III: ACTIVITIES RELATED TO THE MAIN MISSIONS OF THE BANK
III.1 FOREIGN EXCHANGE POLICY AND OPERATIONS
III.1.1. FOREIGN EXCHANGE POLICY
A. Revision of the regulations
The main reforms carried out within the regulation framework date from early 90s. These
reforms were completed in March 1995 with the publication of the Statutory Order n°1 of
03/03/1995 on the organization of the foreign exchange market.
Pursuant to this law, the National Bank of Rwanda enacted the Exchange Control
Regulations of 06 March 1995 whose main innovations are the liberalization of foreign
trade, the transfer to approved intermediaries of the tasks related to the validation of
import and export licences as well as invisible operations, the establishment of foreign
exchange bureaux, the regulation of foreign currency accounts held with commercial banks
and the liberalization of some capital operations.
In March 2003, the Exchange Control Regulations were once again reformed, especially
regarding the regulation pertaining to import and export, invisible operations, capital
operations and procedures for checking the regularity of the operations validated by the
approved intermediaries. These reforms were mainly aimed at channelling through the
official network the foreign currency request addressed to the parallel market, clarifying
some ambiguous passages, simplifying the methods of reporting foreign exchange
operations at NBR, substituting on-site checking for the routine inspection of all foreign
exchange transactions and establishing a separation between authorized and unauthorized
capital operations.
The evaluation of these reforms enabled to establish that the majority of expected results
were largely achieved.
In spite of such reforms, the Exchange Control Regulations turned out to be, for some
points, in conflict with the economic environment characterised by stability of the foreign
exchange market and the speeding up of regional integration.

73
This is the reason why the Bank was involved in broad consultations with the main users of
the exchange control regulations, the majority being also the stakeholders in the
management of foreign exchange operations, with a view to seeking suitable solutions
together.
This led to the approval in December 2006 of new Exchange Control Regulations by the
Board of Directors of the Bank.
The reforms are primarily related to the regulations governing imports, invisible
operations, foreign currency accounts, capital operations and the deletion of some
inoperative or repetitive provisions.
As regards imports, the ceiling on transfers for imports prepayment was removed.
However, the obligation to hold relevant papers within prescribed time was maintained.
Moreover, in order to take into account new developments as regards cross-boarder trade,
the threshold from which the subscription of a bank’s statement of imports becomes
compulsory is significantly increased from USD 5 000 to USD 20 000.
Concerning invisible operations, the ceiling has been removed for foreign exchange
transactions related to tourism and business trips, school fees and wages and incomes. It is
the same for withdrawals from foreign currencies accounts. In addition, relevant
documents required for trips related foreign exchange transactions have been considerably
reduced to consider only the identity card.
To encourage travellers’ use of the means of payment other than cash (traveller’s
cheques, credit card…), the purchase of cash was limited to USD 20 000, and expenses
beyond this threshold must be through other means of payment.
As for capital operations, residents are authorized, for the purpose of their activities, to
freely contract loans in foreign currencies from non-resident foreign international banks
and financial institutions. Moreover, they can negotiate loans in foreign currency from
other non-resident foreign private economic operators at LIBOR interest rate increased to
a margin set by the Bank. In addition, non-residents are eligible for various public shares in
accordance with conditions to be set out, and resident legal entities dealing in savings are
authorized to invest in shares abroad according to methods to be defined.
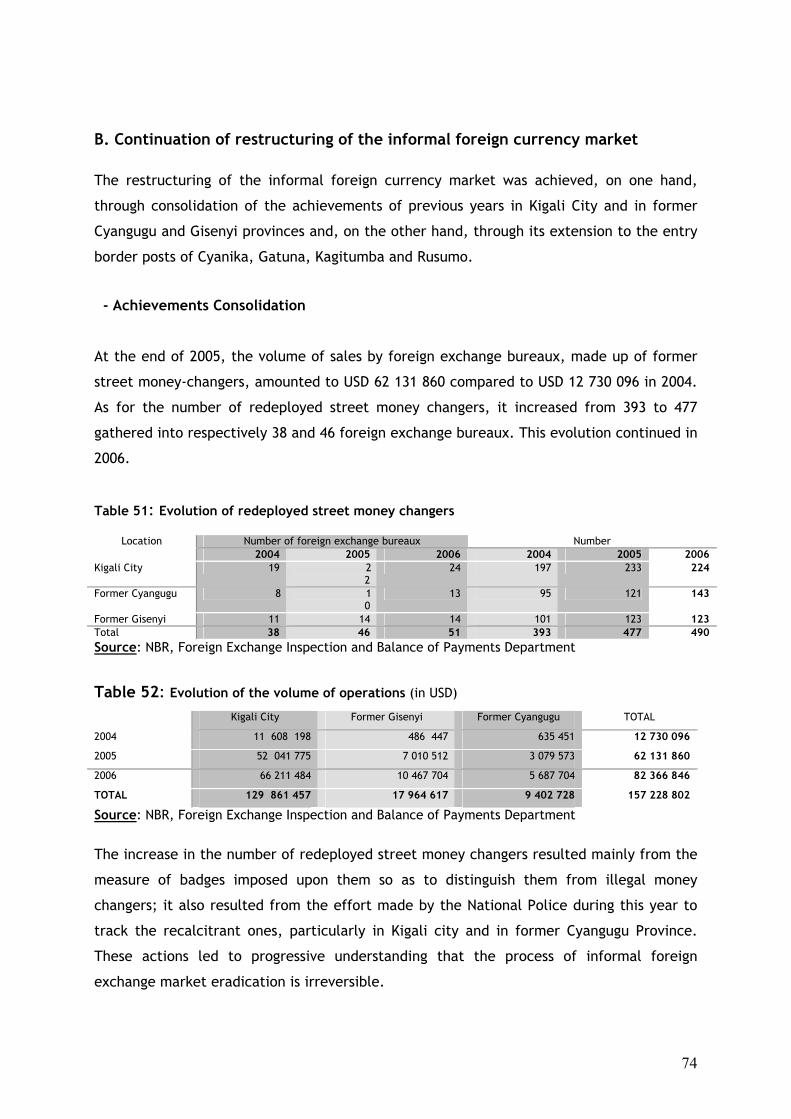
74
B. Continuation of restructuring of the informal foreign currency market
The restructuring of the informal foreign currency market was achieved, on one hand,
through consolidation of the achievements of previous years in Kigali City and in former
Cyangugu and Gisenyi provinces and, on the other hand, through its extension to the entry
border posts of Cyanika, Gatuna, Kagitumba and Rusumo.
- Achievements Consolidation
At the end of 2005, the volume of sales by foreign exchange bureaux, made up of former
street money-changers, amounted to USD 62 131 860 compared to USD 12 730 096 in 2004.
As for the number of redeployed street money changers, it increased from 393 to 477
gathered into respectively 38 and 46 foreign exchange bureaux. This evolution continued in
2006.
Table 51: Evolution of redeployed street money changers
Location Number of foreign exchange bureaux Number 2004 2005 2006 2004 2005 2006 Kigali City 19 2
2 24 197 233 224
Former Cyangugu 8 10
13 95 121 143
Former Gisenyi 11 14 14 101 123 123 Total 38 46 51 393 477 490 Source: NBR, Foreign Exchange Inspection and Balance of Payments Department
Table 52: Evolution of the volume of operations (in USD) Kigali City Former Gisenyi Former Cyangugu TOTAL
2004 11 608 198 486 447 635 451 12 730 096
2005 52 041 775 7 010 512 3 079 573 62 131 860
2006 66 211 484 10 467 704 5 687 704 82 366 846
TOTAL 129 861 457 17 964 617 9 402 728 157 228 802
Source: NBR, Foreign Exchange Inspection and Balance of Payments Department
The increase in the number of redeployed street money changers resulted mainly from the
measure of badges imposed upon them so as to distinguish them from illegal money
changers; it also resulted from the effort made by the National Police during this year to
track the recalcitrant ones, particularly in Kigali city and in former Cyangugu Province.
These actions led to progressive understanding that the process of informal foreign
exchange market eradication is irreversible.
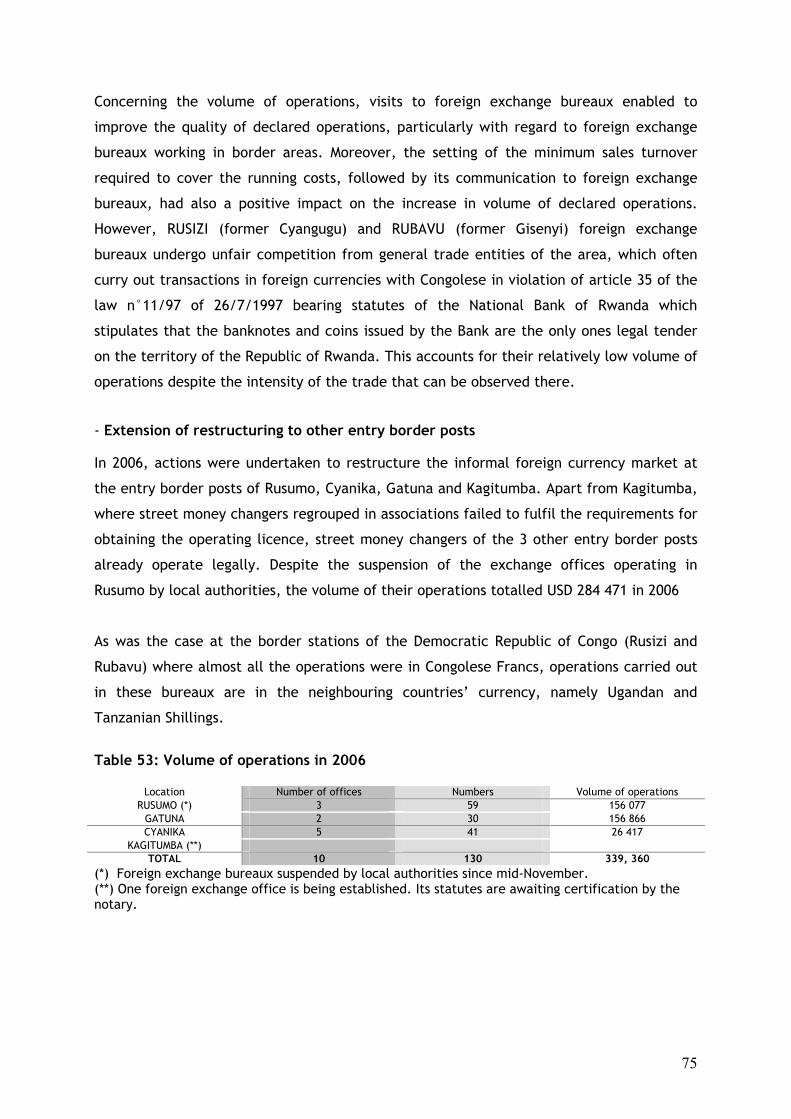
75
Concerning the volume of operations, visits to foreign exchange bureaux enabled to
improve the quality of declared operations, particularly with regard to foreign exchange
bureaux working in border areas. Moreover, the setting of the minimum sales turnover
required to cover the running costs, followed by its communication to foreign exchange
bureaux, had also a positive impact on the increase in volume of declared operations.
However, RUSIZI (former Cyangugu) and RUBAVU (former Gisenyi) foreign exchange
bureaux undergo unfair competition from general trade entities of the area, which often
curry out transactions in foreign currencies with Congolese in violation of article 35 of the
law n°11/97 of 26/7/1997 bearing statutes of the National Bank of Rwanda which
stipulates that the banknotes and coins issued by the Bank are the only ones legal tender
on the territory of the Republic of Rwanda. This accounts for their relatively low volume of
operations despite the intensity of the trade that can be observed there.
- Extension of restructuring to other entry border posts
In 2006, actions were undertaken to restructure the informal foreign currency market at
the entry border posts of Rusumo, Cyanika, Gatuna and Kagitumba. Apart from Kagitumba,
where street money changers regrouped in associations failed to fulfil the requirements for
obtaining the operating licence, street money changers of the 3 other entry border posts
already operate legally. Despite the suspension of the exchange offices operating in
Rusumo by local authorities, the volume of their operations totalled USD 284 471 in 2006
As was the case at the border stations of the Democratic Republic of Congo (Rusizi and
Rubavu) where almost all the operations were in Congolese Francs, operations carried out
in these bureaux are in the neighbouring countries’ currency, namely Ugandan and
Tanzanian Shillings.
Table 53: Volume of operations in 2006
Location Number of offices Numbers Volume of operations RUSUMO (*) 3 59 156 077
GATUNA 2 30 156 866 CYANIKA 5 41 26 417
KAGITUMBA (**) TOTAL 10 130 339, 360
(*) Foreign exchange bureaux suspended by local authorities since mid-November. (**) One foreign exchange office is being established. Its statutes are awaiting certification by the notary.
76
III.1.2. NBR FOREIGN EXCHANGE OPERATIONS IN 2006 NBR foreign exchange operations which generated foreign currency resources are primarily
made up of external budgetary support and projects accounts provisioning in foreign
currencies, banks and other customers. Compared to the year 2005, the volume of such
foreign currency resources slightly increased by 0.6% and reached USD 448.0 million in
2006 compared to USD 445.4 million in 2005. However, this stability of the resources hides
significant variations in some components. This is the case of the budgetary support, which
decreased by 39% between 2005 and 2006. On the other hand, projects support increased
significantly by 32%; provisioning of projects accounts recorded a net increase of 32.07 % in
2006, thus contributing to reducing the decline of foreign currency resources.
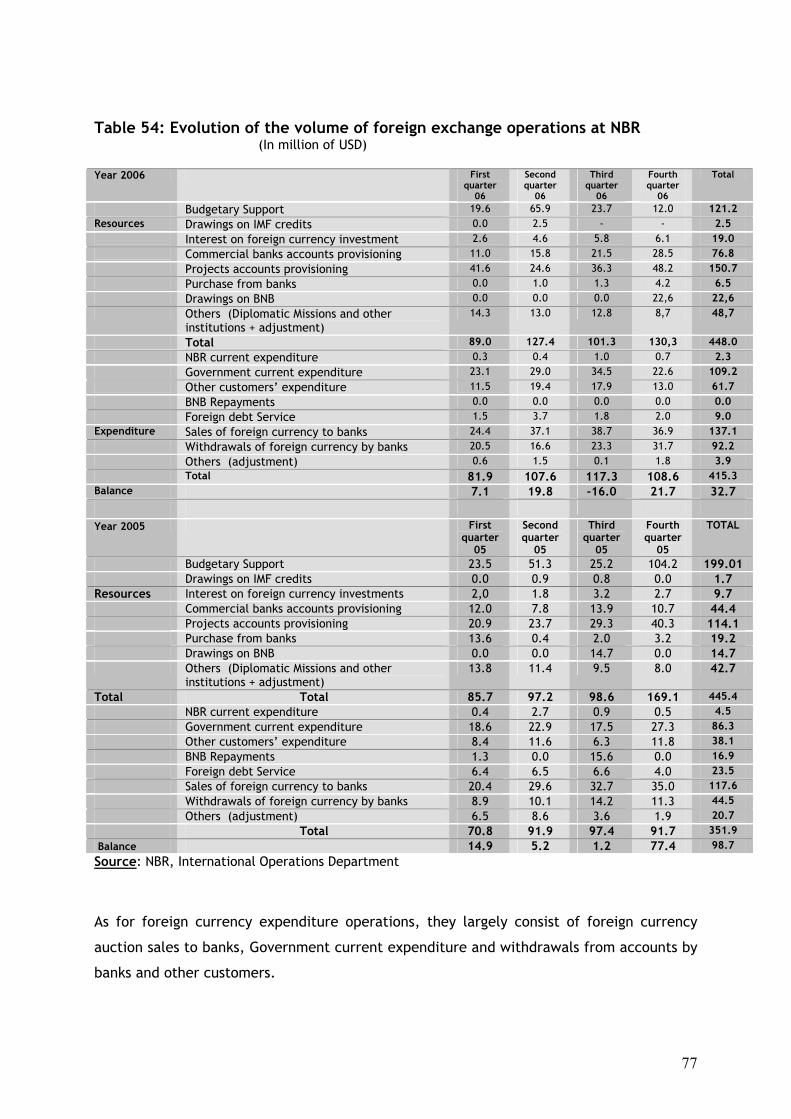
77
Table 54: Evolution of the volume of foreign exchange operations at NBR (In million of USD) Year 2006 First
quarter 06
Second quarter
06
Third quarter
06
Fourth quarter
06
Total
Budgetary Support 19.6 65.9 23.7 12.0 121.2 Resources Drawings on IMF credits 0.0 2.5 - - 2.5 Interest on foreign currency investment 2.6 4.6 5.8 6.1 19.0 Commercial banks accounts provisioning 11.0 15.8 21.5 28.5 76.8 Projects accounts provisioning 41.6 24.6 36.3 48.2 150.7 Purchase from banks 0.0 1.0 1.3 4.2 6.5 Drawings on BNB 0.0 0.0 0.0 22,6 22,6 Others (Diplomatic Missions and other
institutions + adjustment) 14.3 13.0 12.8 8,7 48,7
Total 89.0 127.4 101.3 130,3 448.0 NBR current expenditure 0.3 0.4 1.0 0.7 2.3 Government current expenditure 23.1 29.0 34.5 22.6 109.2 Other customers’ expenditure 11.5 19.4 17.9 13.0 61.7 BNB Repayments 0.0 0.0 0.0 0.0 0.0 Foreign debt Service 1.5 3.7 1.8 2.0 9.0 Expenditure Sales of foreign currency to banks 24.4 37.1 38.7 36.9 137.1 Withdrawals of foreign currency by banks 20.5 16.6 23.3 31.7 92.2 Others (adjustment) 0.6 1.5 0.1 1.8 3.9 Total 81.9 107.6 117.3 108.6 415.3 Balance 7.1 19.8 -16.0 21.7 32.7 Year 2005 First
quarter 05
Second quarter
05
Third quarter
05
Fourth quarter
05
TOTAL
Budgetary Support 23.5 51.3 25.2 104.2 199.01 Drawings on IMF credits 0.0 0.9 0.8 0.0 1.7 Resources Interest on foreign currency investments 2,0 1.8 3.2 2.7 9.7 Commercial banks accounts provisioning 12.0 7.8 13.9 10.7 44.4 Projects accounts provisioning 20.9 23.7 29.3 40.3 114.1 Purchase from banks 13.6 0.4 2.0 3.2 19.2 Drawings on BNB 0.0 0.0 14.7 0.0 14.7 Others (Diplomatic Missions and other
institutions + adjustment) 13.8 11.4 9.5 8.0 42.7
Total Total 85.7 97.2 98.6 169.1 445.4 NBR current expenditure 0.4 2.7 0.9 0.5 4.5 Government current expenditure 18.6 22.9 17.5 27.3 86.3 Other customers’ expenditure 8.4 11.6 6.3 11.8 38.1 BNB Repayments 1.3 0.0 15.6 0.0 16.9 Foreign debt Service 6.4 6.5 6.6 4.0 23.5 Sales of foreign currency to banks 20.4 29.6 32.7 35.0 117.6 Withdrawals of foreign currency by banks 8.9 10.1 14.2 11.3 44.5 Others (adjustment) 6.5 8.6 3.6 1.9 20.7 Total 70.8 91.9 97.4 91.7 351.9 Balance 14.9 5.2 1.2 77.4 98.7
Source: NBR, International Operations Department
As for foreign currency expenditure operations, they largely consist of foreign currency
auction sales to banks, Government current expenditure and withdrawals from accounts by
banks and other customers.
78
The year 2006 was characterized by an increase in the Bank’s foreign currency
expenditures. The volume of these expenditures was USD 415.3 million in 2006 compared
to USD 351.9 million in 2005, which is an increase of 18.01%. This increase primarily
resulted from the use of foreign currency accounts by banks (107.19%) and other customers
(62.10%), the Government current expenditure (26.61%) and the auction sales of foreign
exchange (+16.54%).
III.2. IMPLEMENTATION OF MONETARY POLICY
III.2.1. REGULATION MEASURES
In order to suitably fulfil its mission, during the year 2006, the National Bank of
Rwanda implemented a prudent and stern monetary policy consistent with the
economic situation so as to achieve monetary target agreed upon with the IMF.
In this regard, the National Bank of Rwanda continued to use indirect instruments for
monetary aggregates control, such as reserve requirements, intervention on the money
market and the discount rate.
The legal provisions for adapting the Bank’s instruments to economic realities, mostly
those related to the new policy of interest rate management, implementation of overnight
investments and the reserve requirement constitution period were not modified during the
year 2006.
III.2.2. MONEY MARKET OPERATIONS Steady growth in excess liquidity that was observed in the banking system for more than
three years continued during the year 2006. This growth in banks’ treasury is a result of
high government expenditure, and credit to private sector growth. Considering this
liquidity growth, the Bank intensified its interventions on the money market to mop up
liquidity, combining Treasury Bills issue, liquidity borrowing and overnight investment
facility.
2.2.1. Liquidity borrowing and overnight operations
During the year 2006, total liquidity borrowing amounted to RWF 360.25 billion against
RWF 415.5 billion in 2005. At the same time, the Bank carried out overnight investment

79
operations with a total amount of RWF 1 401.98 billion. The decrease in the amount of
liquidity borrowed in 2006 is accounted for by the increase in overnight investments since
banks prefer such a deposit of one day to prevent abrupt treasury shortages.
Table 55: Liquidity loan on the money market Period 2004 2005 2006
Number of operations
Ordinary borrowing
Temporary or smoothing operations
Overnight
67
42
25
--
81
74
7
103
296
51
--
245
Amount
to be borrowed (in billion RWF)
borrowed (in billion RWF)
overnight (in billion RWF)
188.40
161.56
--
502.5
415.5
418.92
527.0
360.25
1 401.98
Interest paid on
- Liquidity borrowing (in million RWF)
- Overnight (in million RWF)
197.44
--
315.30
79.76
596.76
280.93
Source: NBR, Money and Capital Markets Department
2.2.2. Management of the discount window
The persistence of excess liquidity in the banking system accounted for the non-existence
of resort to the discount window. It should be noted that since August 2004 there has not
been any refinancing request.
2.2.3. Interbank market operations
For the third consecutive year, cash exchange has been falling. Interbank lending
amounted to RWF 34.45 billion in 2006 compared to RWF 37.55 billion in 2005, which is a
decrease of 8%. It should be noted that a significant volume of cash exchange was
concentrated in May and August.
Table 56: Evolution of interbank market operations (in billion RWF) Year 2003 2004 2005 2006
Variation 81.49 54.41 37.55 34.45
In % -- 33.23 30.99 8.26
Source: NBR, Money and Capital Markets Department
2.2.4. Evolution of Treasury bills’market
In 2006, NBR perfomed 52 operations of Treasury Bills issue and mobilized RWF 282.69
billion compared to RWF 161.15 billion in 2005, which was an annual increase of 75.42%.
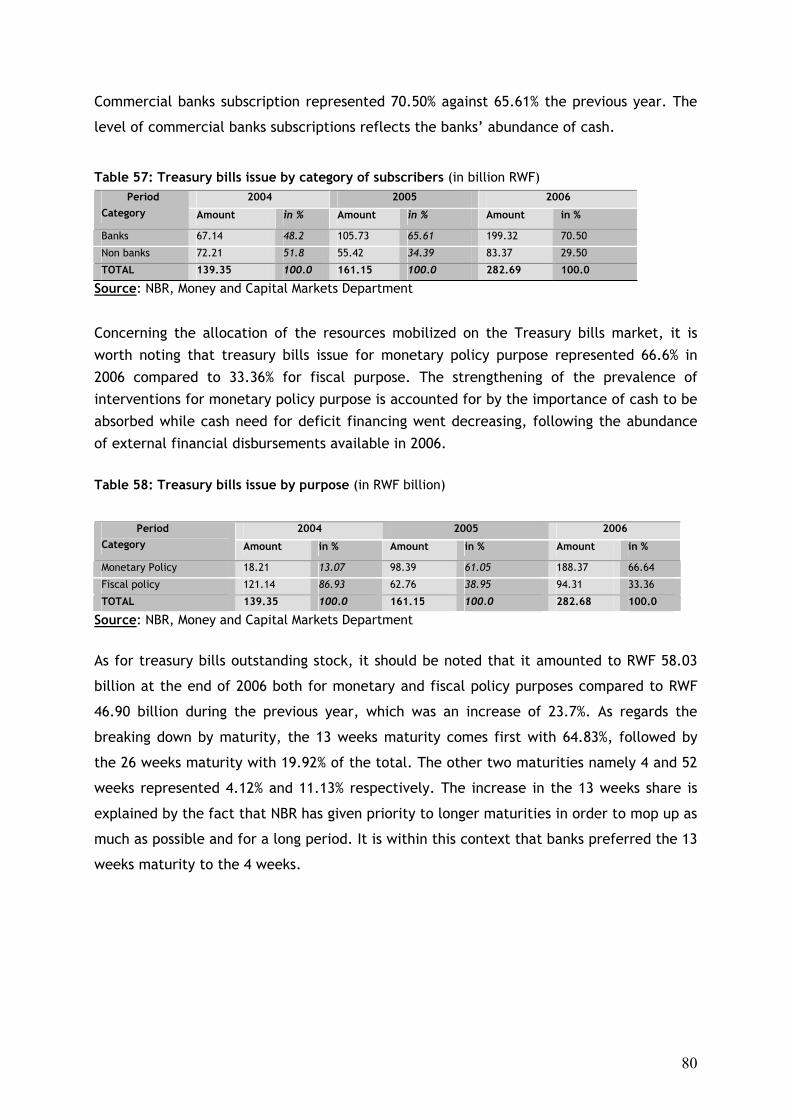
80
Commercial banks subscription represented 70.50% against 65.61% the previous year. The
level of commercial banks subscriptions reflects the banks’ abundance of cash.
Table 57: Treasury bills issue by category of subscribers (in billion RWF) 2004 2005 2006 Period
Category Amount in % Amount in % Amount in %
Banks 67.14 48.2 105.73 65.61 199.32 70.50
Non banks 72.21 51.8 55.42 34.39 83.37 29.50
TOTAL 139.35 100.0 161.15 100.0 282.69 100.0
Source: NBR, Money and Capital Markets Department
Concerning the allocation of the resources mobilized on the Treasury bills market, it is
worth noting that treasury bills issue for monetary policy purpose represented 66.6% in
2006 compared to 33.36% for fiscal purpose. The strengthening of the prevalence of
interventions for monetary policy purpose is accounted for by the importance of cash to be
absorbed while cash need for deficit financing went decreasing, following the abundance
of external financial disbursements available in 2006. Table 58: Treasury bills issue by purpose (in RWF billion)
2004 2005 2006 Period
Category Amount in % Amount in % Amount in %
Monetary Policy 18.21 13.07 98.39 61.05 188.37 66.64
Fiscal policy 121.14 86.93 62.76 38.95 94.31 33.36
TOTAL 139.35 100.0 161.15 100.0 282.68 100.0
Source: NBR, Money and Capital Markets Department
As for treasury bills outstanding stock, it should be noted that it amounted to RWF 58.03
billion at the end of 2006 both for monetary and fiscal policy purposes compared to RWF
46.90 billion during the previous year, which was an increase of 23.7%. As regards the
breaking down by maturity, the 13 weeks maturity comes first with 64.83%, followed by
the 26 weeks maturity with 19.92% of the total. The other two maturities namely 4 and 52
weeks represented 4.12% and 11.13% respectively. The increase in the 13 weeks share is
explained by the fact that NBR has given priority to longer maturities in order to mop up as
much as possible and for a long period. It is within this context that banks preferred the 13
weeks maturity to the 4 weeks.

81
Table 59: Outstanding Treasury bills by maturity (in billion RWF)
31 Dec. 2004 31 Dec. 2005 31 Dec. 2006 Period Maturity Amount in % Amount in % Amount in %
4 weeks 10.13 29.96 17.91 38.19 2.39 4.12
13 weeks 11.77 34.80 3.85 8.20 37.62 64.83
26 weeks 11.92 35.24 7.88 16.81 11.56 19.92
52 weeks -- -- 17.26 36.80 6.45 11.13
TOTAL 33.82 100.0 46.90 100.0 58.03 100.0
Source: NBR, Money and Capital Markets Department
Concerning the category of subscribers, banks took the biggest share with more than 57%
of the outstanding by the end of December 2006 compared to 46% in the previous year.
Table 60: Outstanding Treasury bills by category and purpose (in billion RWF)
2004 2005 2006 Period
Category Amount in % Amount En % Amount in %
Monetary policy
Banks
Non-banks
4.99
4.90
0.09
14.76
31.27
18.22
13.05
66.67
26.06
16.7
9.39
44.90
Government Accounts
Banks
Non-banks
28.83
8.75
20.08
85.24
15.63
3.57
12.06
33.33
31.97
16.95
15.02
55.10
TOTAL 33.82 100.0 46.90 100.0 58.03 100.00
Source: NBR, Money and Capital Markets Department
III.2.2.5. Penalty to Banks for non-compliance with instructions in relation to the management of the banking liquidity It should be noted that in year 2006, banks strictly respected the instructions in force. The
fines paid by banks amounted to only RWF 1 093 919.
III.2.2.6. Recovery of interests paid by NBR on money market operations With reference to the Agreement n°01/2005 signed on 20 September 2005 committing
MINECOFIN to refund interests paid by NBR on money market operations, an amount of
RWF 3 619 205 905 was repaid to NBR during the year 2006, with a monthly average of RWF
301 598 384.

82
III.3. MANAGEMENT OF SPECIAL FUNDS AND LINES OF CREDIT III.3.1 Special Funds Management
Currently, NBR manages four facilities, notably:
- Agricultural Guarantee Facility;
- Guarantee Fund and Credit Lines for facilitating the training of the retrenched Rwandan
civil servants;
- Guarantee Fund for the Dairy Cattle Breeding Development Support Project - PADEBL;
- Housing Financing Fund;
3.1.1. The Agricultural Guarantee Facility The Agricultural Guarantee Facility (FGA) help to stimulate bank loans for development
activities in Agriculture sub-sectors. The aim is to reduce bank risks related to agricultural
loans and overcome insufficiency of guarantees for promoters of economically cost-
effective and financially viable projects that do not have a negative impact on the
environment.
FGA resources come from allocations provided in the Government Development Budget and
donors’ subsidies. The initial grant is two billion eight hundred and sixty million five
hundred and sixty-two thousand Rwanda Francs (RWF 2 860 562 000) of which RWF 1 000
000 000 are subsidies to the Government Budget and RWF 1 760 562 000 as financing by the
Netherlands Cooperation, through the Kingdom of the Dutch Embassy in Kigali. Since
August 2005, the Netherlands Cooperation has already disbursed two instalments totalling
RWF 1 072 646 053.
In 2006, Seventy-one (71) files were evaluated within the framework of the Agricultural
Guarantee Facility, and supported up to RWF 3 102 567 461. In addition, following the
proposals submitted to the Bank Management, an amount of RWF 500 million was set for an
individual and livestock integrated in FGA eligible activities.
In total, 104 projects have currently been supported. The overall amount committed is
RWF 3 739 998 223 distributed as follows:
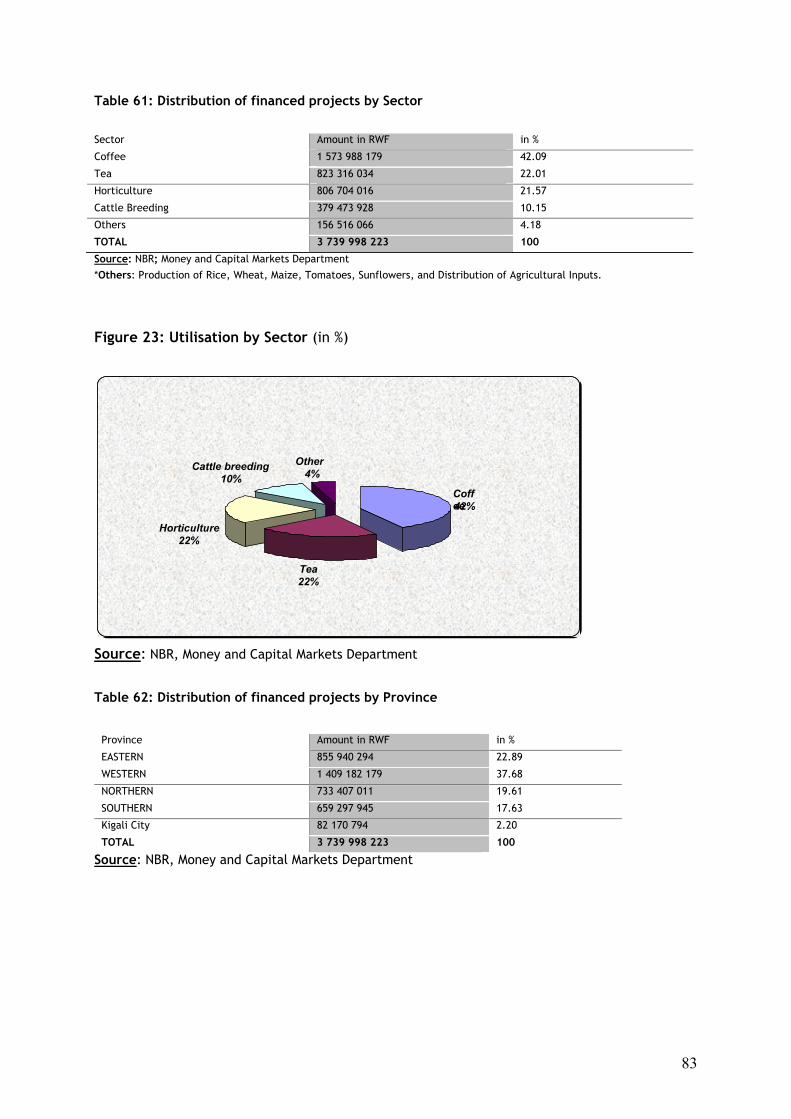
83
Table 61: Distribution of financed projects by Sector Sector Amount in RWF in %
Coffee 1 573 988 179 42.09
Tea 823 316 034 22.01
Horticulture 806 704 016 21.57
Cattle Breeding 379 473 928 10.15
Others 156 516 066 4.18
TOTAL 3 739 998 223 100
Source: NBR; Money and Capital Markets Department
*Others: Production of Rice, Wheat, Maize, Tomatoes, Sunflowers, and Distribution of Agricultural Inputs.
Figure 23: Utilisation by Sector (in %)
Source: NBR, Money and Capital Markets Department
Table 62: Distribution of financed projects by Province
Province Amount in RWF in %
EASTERN 855 940 294 22.89
WESTERN 1 409 182 179 37.68
NORTHERN 733 407 011 19.61
SOUTHERN 659 297 945 17.63
Kigali City 82 170 794 2.20
TOTAL 3 739 998 223 100
Source: NBR, Money and Capital Markets Department
Coffee42%
Tea 22%
Horticulture 22%
Cattle breeding 10%
Other 4%

84
Figure 24: Distribution of financed projects by Province
Source: NBR, Money and Capital Markets Department
3.1.2. Guarantee Fund and Credit Lines for facilitating the training of retrenched civil servants of the Republic of Rwanda The Guarantee Fund and Credit Lines for facilitating the training of retrenched civil
servants resources come from an allocation provided in the Government Budget. The initial
allocation is RWF 200 000 000 and RWF 700 000 000 for the Guarantee Fund and Credit
Lines respectively.
From 1st January to 31St December 2006, one hundred and fifty-four (154) application files
were evaluated and received the support of the Guarantee Fund and Credit Line
refinancing up to RWF 350 444 325 and RWF 643 455 787 respectively.
All in all, 156 projects have been endorsed and financed totaling RWF 357 702 125 and RWF
651 971 387 respectively. Table 63: Utilisation by Sector
Loan (in RWF) Guarantee (in RWF)
Livestock 13 515 600 12 027 430
Agric-Processing 10 412 450 5 206 225
Transport 586 867 207 310 480 404
General Trade 38 176 130 25 988 066
Various jobs 3 000 000 4 000 000
651 971 387 357 702 125
Source: NBR, Money and Capital Markets Department
Ea23%
West37%
Northern 20%
SouthS18%
Kiga2%

85
Fig. 25: Utilisation by Sector
0
100 000 000
200 000 000
300 000 000
400 000 000
500 000 000
600 000 000
Livestock Agri-Processing Transport Gener.Commerce Handcrafts Miscellan.
Loan Guarantee
Source: NBR, Money and Capital Markets Department
Table 64: Utilisation by PFI*
Loan (in RWF) Guarantee (in RWF)
AL-HALAAL 283 804 368 142 899 185
BK 8 000 000 4 000 000
ZIGAMA-CSS 20 015 600 15 507 800
RIM s.a 92 522 050 47 435 826
UBPR 247 629 369 147 859 314
651 971 387 357 702 125
Source: NBR, Money and Capital Markets Department
Figure 26: Utilisation by PFI
-
50 000 000
100 000 000
150 000 000
200 000 000
250 000 000
300 000 000
AL-HALAAL BK CSS RIM UBPR
Loan Guarantee
Source: NBR, Money and Capital Markets Department
• PFI: Participating Financial Institutions
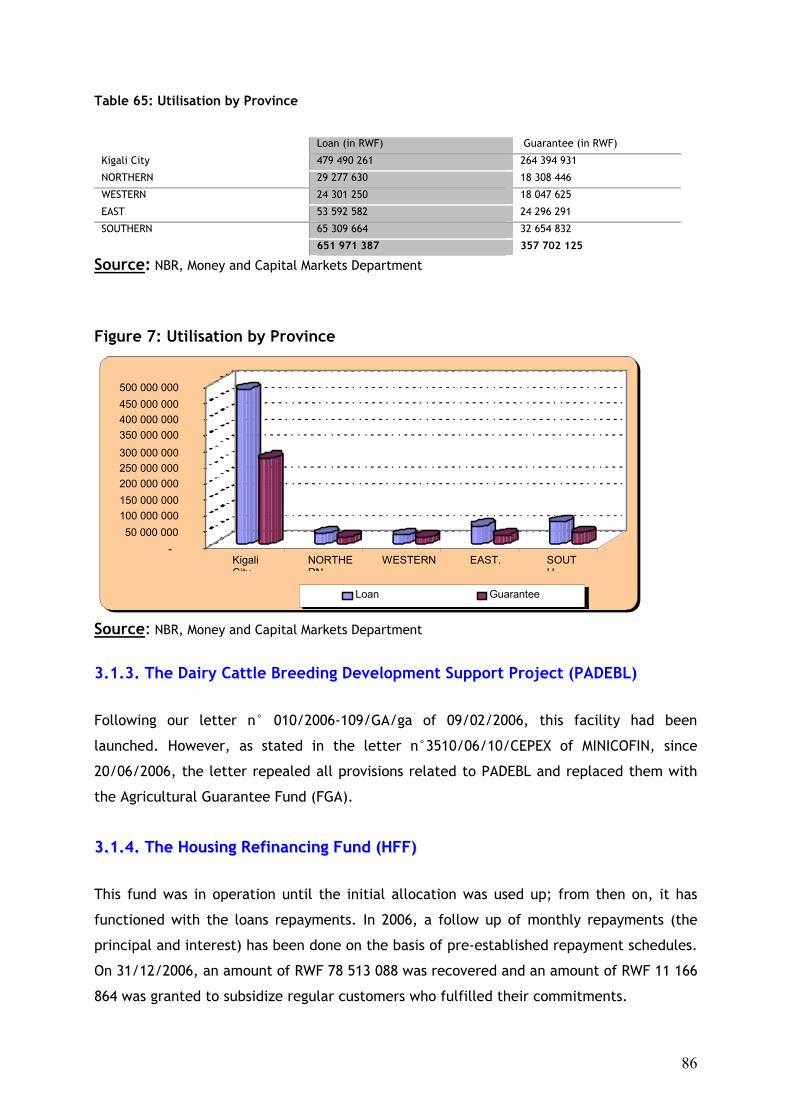
86
Table 65: Utilisation by Province
Loan (in RWF) Guarantee (in RWF)
Kigali City 479 490 261 264 394 931
NORTHERN 29 277 630 18 308 446
WESTERN 24 301 250 18 047 625
EAST 53 592 582 24 296 291
SOUTHERN 65 309 664 32 654 832
651 971 387 357 702 125
Source: NBR, Money and Capital Markets Department
Figure 7: Utilisation by Province
- 50 000 000
100 000 000 150 000 000 200 000 000 250 000 000 300 000 000 350 000 000 400 000 000 450 000 000 500 000 000
Kigali City
NORTHERN
WESTERN EAST. SOUTH
Loan Guarantee
Source: NBR, Money and Capital Markets Department
3.1.3. The Dairy Cattle Breeding Development Support Project (PADEBL) Following our letter n° 010/2006-109/GA/ga of 09/02/2006, this facility had been
launched. However, as stated in the letter n°3510/06/10/CEPEX of MINICOFIN, since
20/06/2006, the letter repealed all provisions related to PADEBL and replaced them with
the Agricultural Guarantee Fund (FGA).
33..11..44.. TThhee HHoouussiinngg RReeffiinnaanncciinngg FFuunndd ((HHFFFF)) This fund was in operation until the initial allocation was used up; from then on, it has
functioned with the loans repayments. In 2006, a follow up of monthly repayments (the
principal and interest) has been done on the basis of pre-established repayment schedules.
On 31/12/2006, an amount of RWF 78 513 088 was recovered and an amount of RWF 11 166
864 was granted to subsidize regular customers who fulfilled their commitments.

87
III.3.2 Credit Lines
The four credit Lines concerned are:
- Rural Sector Development Support Project (Rural Investment Facility “RIF”-IDA 3483-Rw
component);
- Preferential Refinancing Facility for Agricultural Diversification;
- Export and Cash Crop Development Project; and
- Private Sector Development Support Project (IDA 2541-Rw).
33..22..11.. RRuurraall IInnvveessttmmeenntt FFaacciilliittyy ((RRIIFF))
RIF is used to refinance partially medium and long-term loans granted by Participating
Financial Institutions (PFI) in favour of Rural Development Projects.
In its new structure, the Rural Investment Facility component, abbreviated as RIF, has
become a sub-component called the value added support to small and medium enterprises
of rural sector« Support to Value Adding Rural Micro Enterprises ». The amount allocated
to the first phase starting from 2001 to June 2007, thus increased from SDR 5 620 000 to
SDR 7 500 000.
NBR is committed to partially refinance medium and long-term loans granted by PFI to
refinance Rural Investment Projects. On 31/12/2006, 2 332 files had been refinanced with
a total amount of USD 3 169 878.76. Up to this date, the overall budget had been utilised
100%, with a total amount of USD 10 000 000.
Table 66: Projects refinanced up to date (RIF) Periods Number of projects Amount refinanced in USD
2002 32 869 922.07
2003 129 1 416 800.34
2004 423 2 295 827
2005 1 187 2 270 967.67
2006 2 332 3 169 878.76
Total 4 103 10 023 395.84
That is 100.23% Source: NBR, Money and Capital Markets Department
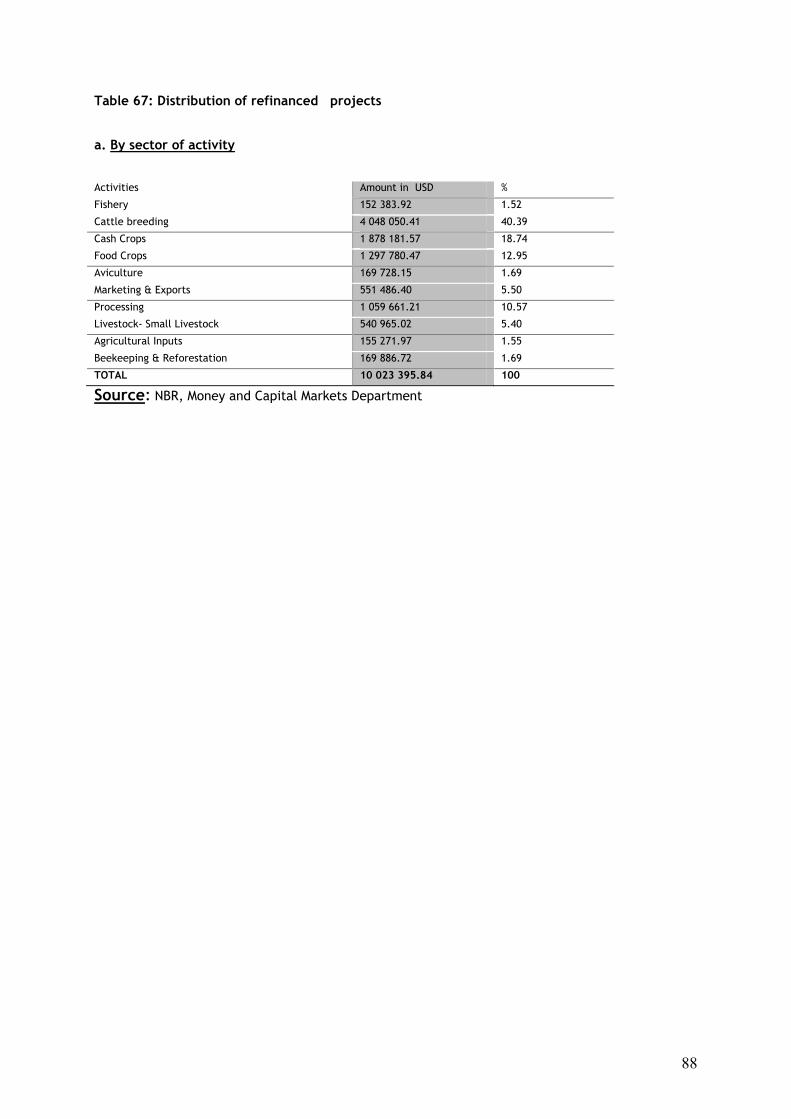
88
Table 67: Distribution of refinanced projects
a. By sector of activity
Activities Amount in USD %
Fishery 152 383.92 1.52
Cattle breeding 4 048 050.41 40.39
Cash Crops 1 878 181.57 18.74
Food Crops 1 297 780.47 12.95
Aviculture 169 728.15 1.69
Marketing & Exports 551 486.40 5.50
Processing 1 059 661.21 10.57
Livestock- Small Livestock 540 965.02 5.40
Agricultural Inputs 155 271.97 1.55
Beekeeping & Reforestation 169 886.72 1.69
TOTAL 10 023 395.84 100
Source: NBR, Money and Capital Markets Department
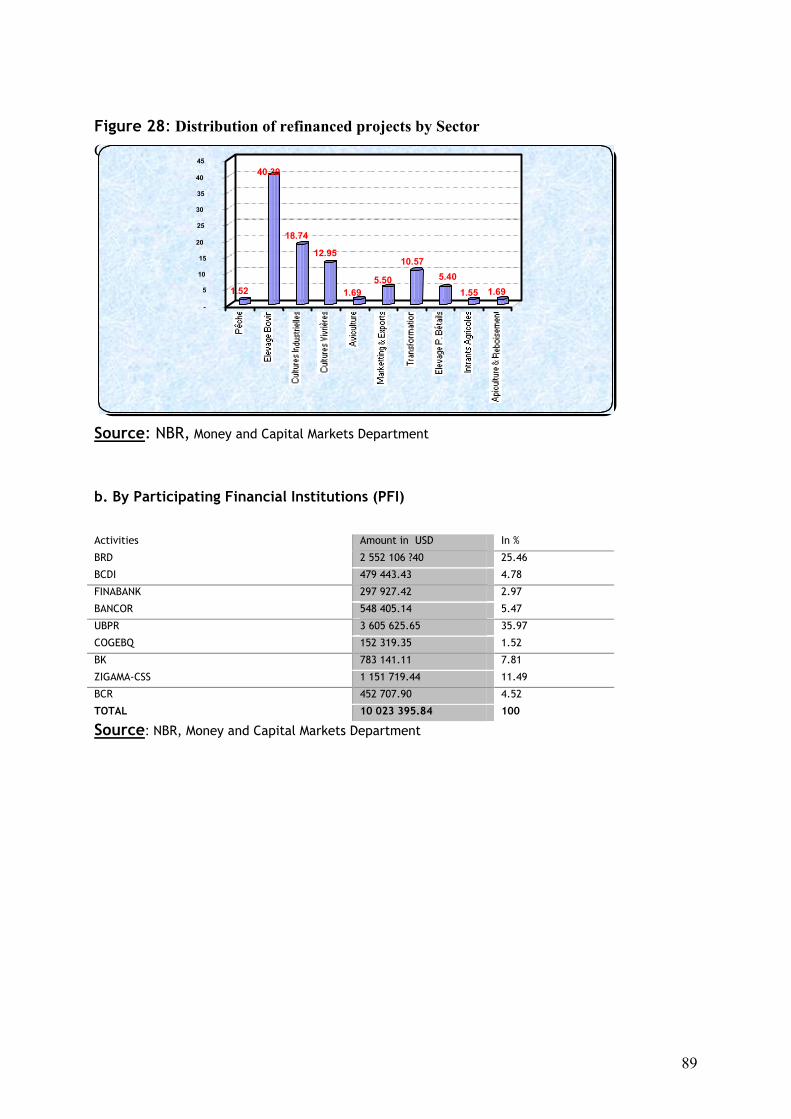
89
Figure 28: Distribution of refinanced projects by Sector Ca
1.52
40.39
18.74 12.95
1.69 5.50
10.57 5.40
1.55 1.69 - 5
10 15
20 25 30 35 40 45
Source: NBR, Money and Capital Markets Department
b. By Participating Financial Institutions (PFI)
Activities Amount in USD In %
BRD 2 552 106 ?40 25.46
BCDI 479 443.43 4.78
FINABANK 297 927.42 2.97
BANCOR 548 405.14 5.47
UBPR 3 605 625.65 35.97
COGEBQ 152 319.35 1.52
BK 783 141.11 7.81
ZIGAMA-CSS 1 151 719.44 11.49
BCR 452 707.90 4.52
TOTAL 10 023 395.84 100
Source: NBR, Money and Capital Markets Department
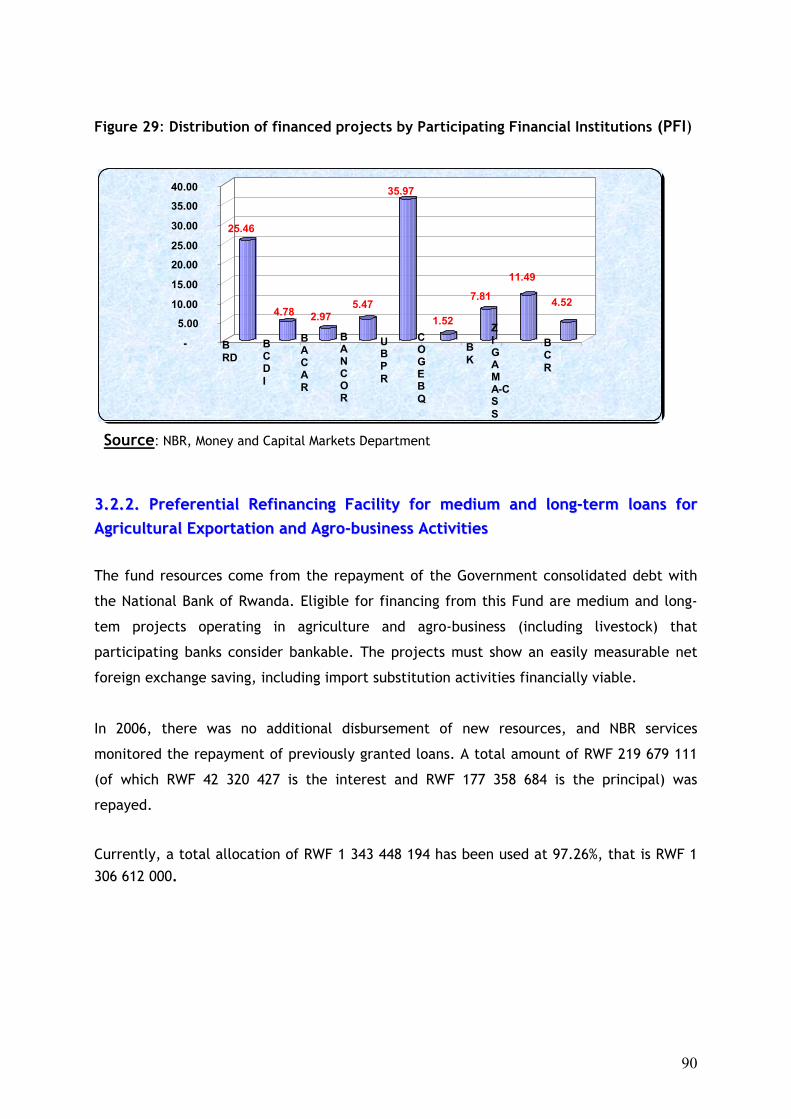
90
Figure 29: Distribution of financed projects by Participating Financial Institutions (PFI)
25.46
4.78 2.97 5.47
35.97
1.52
7.81
11.49
4.52
- 5.00
10.00 15.00 20.00 25.00 30.00 35.00 40.00
B RD
B C D I
B A C A R
BA N COR
UB P R
COGEBQ
BK
ZI G A M A-CS S
BCR
Source: NBR, Money and Capital Markets Department
33..22..22.. PPrreeffeerreennttiiaall RReeffiinnaanncciinngg FFaacciilliittyy ffoorr mmeeddiiuumm aanndd lloonngg--tteerrmm llooaannss ffoorr AAggrriiccuullttuurraall EExxppoorrttaattiioonn aanndd AAggrroo--bbuussiinneessss AAccttiivviittiieess
The fund resources come from the repayment of the Government consolidated debt with
the National Bank of Rwanda. Eligible for financing from this Fund are medium and long-
tem projects operating in agriculture and agro-business (including livestock) that
participating banks consider bankable. The projects must show an easily measurable net
foreign exchange saving, including import substitution activities financially viable.
In 2006, there was no additional disbursement of new resources, and NBR services
monitored the repayment of previously granted loans. A total amount of RWF 219 679 111
(of which RWF 42 320 427 is the interest and RWF 177 358 684 is the principal) was
repayed.
Currently, a total allocation of RWF 1 343 448 194 has been used at 97.26%, that is RWF 1
306 612 000.

91
Table 68: Resource utilization Sector Amount in RWF in %
1 Agro-processing industry 548,412,000 41.97
2 Exports of hides and skins 233,000,000 17.83
3 Coffee and Pyrethrum 325,200,000 24.89
4 Flower growing and export 200,000,000 15.31
Total 1,306,612,000 100
SSoouurrccee:: NBR, Money and Capital Markets Department
33..22..33.. PPrriivvaattee SSeeccttoorr DDeevveellooppmmeenntt SSuuppppoorrtt PPrroojjeecctt ((IIDDAA 22554411--RRww))
This project was put in place to allow for the launch of private sector activities or new
activities with a view to fostering economic growth. The project was closed in 2001.
Currently, NBR follows up repayments only. Recoveries are based on the pre-established
repayment schedules; and in 2006, an amount of RWF 102 743 498 (principal) and RWF 14
695 358 (interest) were refunded.
3.2.4. Export and Cash Crop Development Project (PDCRE) The Export and Cash Crop Development Project (Credit nn°° 559966--RRww//FFIIDDAA)) hhaass aann oobbjjeeccttiivvee
ttoo iinnccrreeaassee aanndd ddiivveerrssiiffyy iinnccoommeess ooff tthhee ppoooorreesstt ccaasshh ccrroopp ffaarrmmeerrss bbyy ddeevveellooppiinngg
ccoommmmeerrcciiaall pprroocceessssiinngg aanndd ffiinnaanncciiaallllyy vviiaabbllee mmaarrkkeett aaccttiivviittiieess.. AA ffoorreeiiggnn ccuurrrreennccyy llooaann
aammoouunnttiinngg ttoo SSDDRR 12 300 000 was availed to a target group of beneficiaries living in the
project areas.
The Government of Rwanda entrusted NBR with the management of the Project Credit
Lines with a total amount of SDR 2 910 000 distributed as follows:
• SDR 1 200,000 for long-term loans;
• SDR 660 000 for short-term loans;
• SDR 1 050 000 for Overdraft Facilities.
The project area covers the following four former provinces: KIBUYE, GIKONGORO, KIGALI-
NGALI and KIBUNGO; while the target group comprises households in the Project area living
below the poverty line, ensuring that women heading households are given priority.
92
In 2006, NBR received and followed up only one application from a UBPR customer for an
amount of RWF 14 million, a sub-project of the coffee crop.
Considering the fact that the final beneficiaries and the intervention area boundaries have
slowed down the functioning of this credit line, in its letter of 20 October 2006 addressed
to the Minister of Finance and Economic Planning, NBR requested that the latter be
entrusted to another manager.
III.4. FOREIGN RESERVES MANAGEMENT
In 2006, the international economic and financial context was conducive to the
profitability of foreign reserves because it was the world’s greatest expansion period since
the beginning of 1970. The United States were not the only world engine. Economic
activity in Japan and Europe strengthened in addition to the contributions of important
emerging countries such as China, India, Brazil, Russia and oil producing countries. Due to
such general economic strengthening coupled with inflationary tensions resulting from the
rise in the raw material prices, central banks tightened loan conditions.
This was the case in the United States of America, where the Federal Reserve pursued its
policy of increasing interest rates starting from June 2004, from 4.25% at the beginning of
the year to 5.25% in June, before a break following signs of a slow down in the second
quarter due to the faltering of the real estate market. The European Central Bank
increased five times its reference rate from 2.25% to 3.50%, considering that the Euro Zone
economic strengthening would be sufficient to support the least accommodating policy.
The Central Bank of England also increased the rates twice, from 4.5% at the beginning of
the year to 5% in December. Similarly, in July, the Central Bank of Japan put an end to its
zero rate policy by increasing the latter to 0.25%.
III.4.1 NBR foreign assets development in 2006
NBR gross foreign assets moderately increased from USD 407.98 million to USD 440.69
million between end December 2005 and end December 2006, which was a growth of 8%.
This growth mainly resulted from significant banks accounts provisioning, government
projects accounts provisioning by donors and overdraft from BNB.
Thus, NBR average gross reserves rose from USD 342 million in 2005 to USD 422 million in
2006 which is a growth rate of 23.39 %. It should be noted however, that budgetary
support which used to be the major source of NBR gross reserves for the previous years,

93
decreased significantly in 2006 from USD 199.01 to USD 121.22 million from end December
2005 to end December 2006, which is a decrease of USD 77.79 million.
Figure 30: Development of NBR foreign assets from 2002 to2006 (in million of USD)
150
200
250
300
350
400
450
500
2002 2003 2004 2005 2006
Source: NBR, International Operations Department Out of a total amount of USD 448.04 million of revenues in foreign currency recorded in
2006, the contributions of each of the three major sources of receipts were USD 121.22
million for budgetary support (27%), USD 77 million for foreign currency accounts
provisioning (17%), and USD 151 million for government project financing, which is 34% of
total foreign exchange receipts collected in 2006.
Figure 31: NBR foreign exchange receipts and expenses development in 2006 (in million of USD)
0.00 10.00 20.00 30.00 40.00 50.00 60.00 70.00 80.00
January
FFebr
March
March
May
June
July
Aaugust
Septemb
October
Novemb
Decemb
Receipts Expenses
Source: NBR, International Operations Department
94
On the expenditure side, a total amount of USD 415.29 million was disbursed in 2006 of
which USD 137.05 million were sold to banks (33%), USD 109.24 million to cover
Government current expenditure (26.31%), and USD 92.16 million of withdrawals by banks
on their accounts with NBR, while USD 61.68 million were sold to other NBR customers.
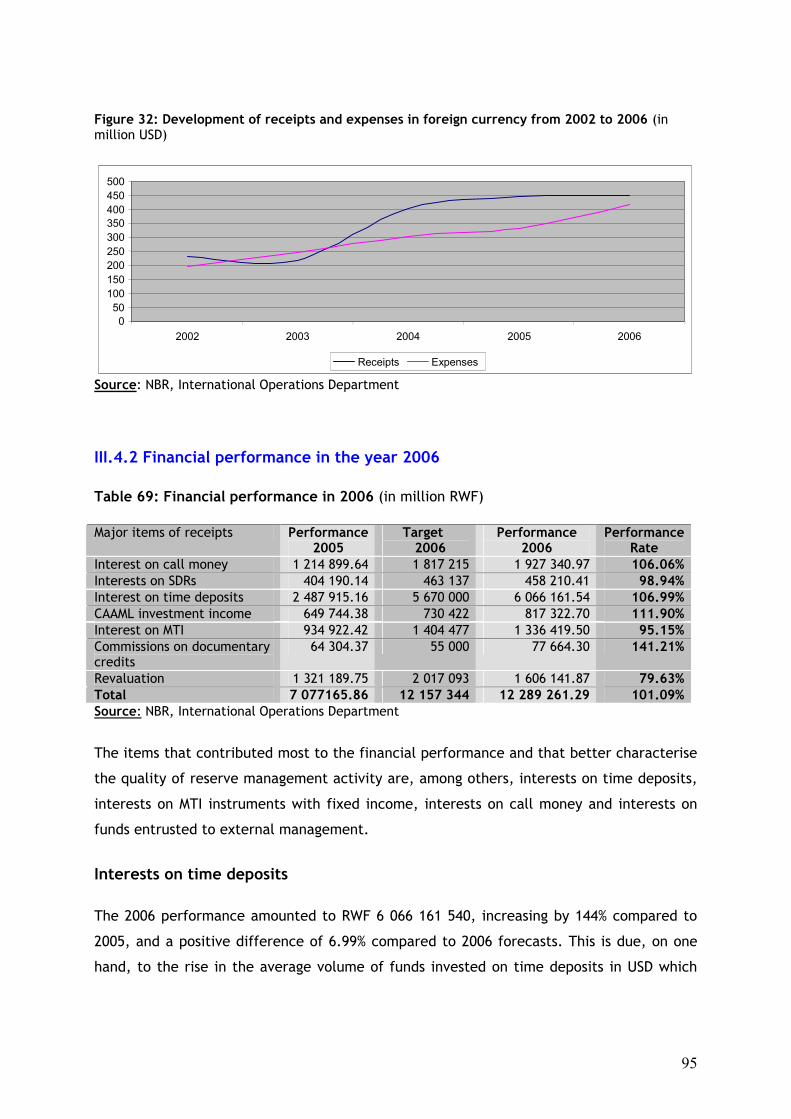
95
Figure 32: Development of receipts and expenses in foreign currency from 2002 to 2006 (in million USD)
0 50
100 150 200 250 300 350 400 450 500
2002 2003 2004 2005 2006 Receipts Expenses
Source: NBR, International Operations Department III.4.2 Financial performance in the year 2006 Table 69: Financial performance in 2006 (in million RWF) Major items of receipts Performance
2005 Target 2006
Performance 2006
Performance Rate
Interest on call money 1 214 899.64 1 817 215 1 927 340.97 106.06% Interests on SDRs 404 190.14 463 137 458 210.41 98.94% Interest on time deposits 2 487 915.16 5 670 000 6 066 161.54 106.99% CAAML investment income 649 744.38 730 422 817 322.70 111.90% Interest on MTI 934 922.42 1 404 477 1 336 419.50 95.15% Commissions on documentary credits
64 304.37 55 000 77 664.30 141.21%
Revaluation 1 321 189.75 2 017 093 1 606 141.87 79.63% Total 7 077165.86 12 157 344 12 289 261.29 101.09% Source: NBR, International Operations Department
The items that contributed most to the financial performance and that better characterise
the quality of reserve management activity are, among others, interests on time deposits,
interests on MTI instruments with fixed income, interests on call money and interests on
funds entrusted to external management.
Interests on time deposits The 2006 performance amounted to RWF 6 066 161 540, increasing by 144% compared to
2005, and a positive difference of 6.99% compared to 2006 forecasts. This is due, on one
hand, to the rise in the average volume of funds invested on time deposits in USD which
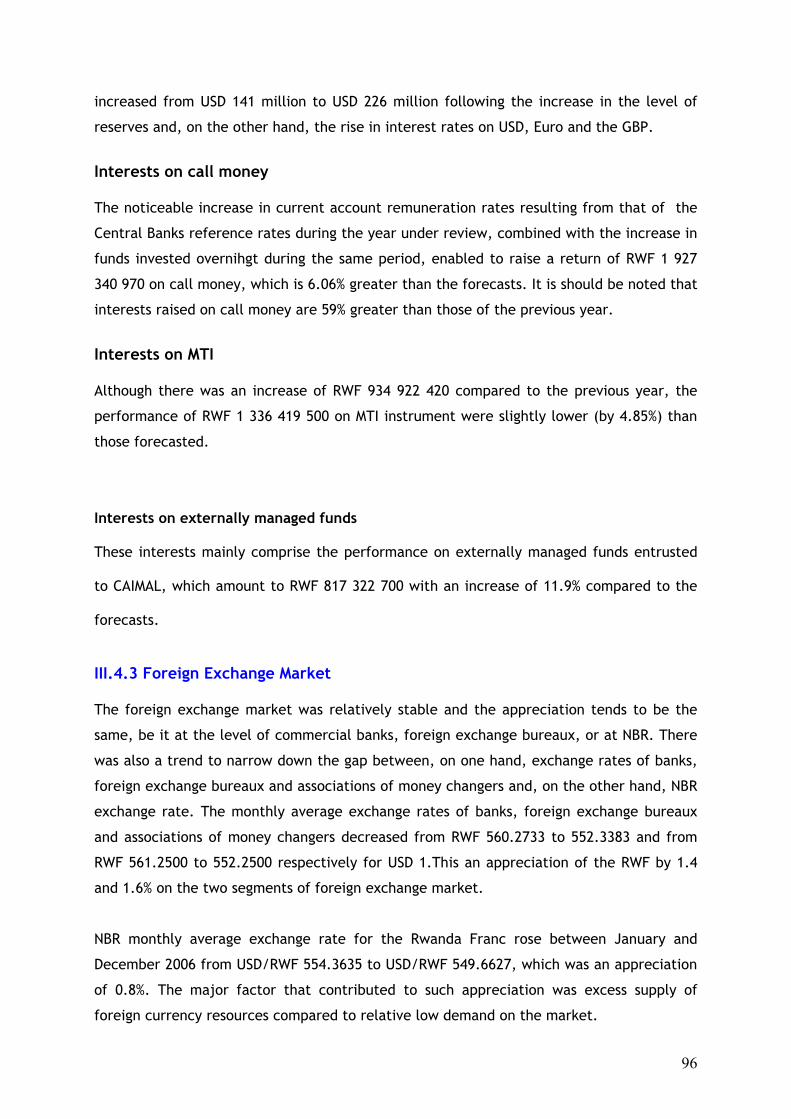
96
increased from USD 141 million to USD 226 million following the increase in the level of
reserves and, on the other hand, the rise in interest rates on USD, Euro and the GBP.
Interests on call money The noticeable increase in current account remuneration rates resulting from that of the
Central Banks reference rates during the year under review, combined with the increase in
funds invested overnihgt during the same period, enabled to raise a return of RWF 1 927
340 970 on call money, which is 6.06% greater than the forecasts. It is should be noted that
interests raised on call money are 59% greater than those of the previous year.
Interests on MTI Although there was an increase of RWF 934 922 420 compared to the previous year, the
performance of RWF 1 336 419 500 on MTI instrument were slightly lower (by 4.85%) than
those forecasted.
Interests on externally managed funds These interests mainly comprise the performance on externally managed funds entrusted
to CAIMAL, which amount to RWF 817 322 700 with an increase of 11.9% compared to the
forecasts.
III.4.3 Foreign Exchange Market The foreign exchange market was relatively stable and the appreciation tends to be the
same, be it at the level of commercial banks, foreign exchange bureaux, or at NBR. There
was also a trend to narrow down the gap between, on one hand, exchange rates of banks,
foreign exchange bureaux and associations of money changers and, on the other hand, NBR
exchange rate. The monthly average exchange rates of banks, foreign exchange bureaux
and associations of money changers decreased from RWF 560.2733 to 552.3383 and from
RWF 561.2500 to 552.2500 respectively for USD 1.This an appreciation of the RWF by 1.4
and 1.6% on the two segments of foreign exchange market.
NBR monthly average exchange rate for the Rwanda Franc rose between January and
December 2006 from USD/RWF 554.3635 to USD/RWF 549.6627, which was an appreciation
of 0.8%. The major factor that contributed to such appreciation was excess supply of
foreign currency resources compared to relative low demand on the market.
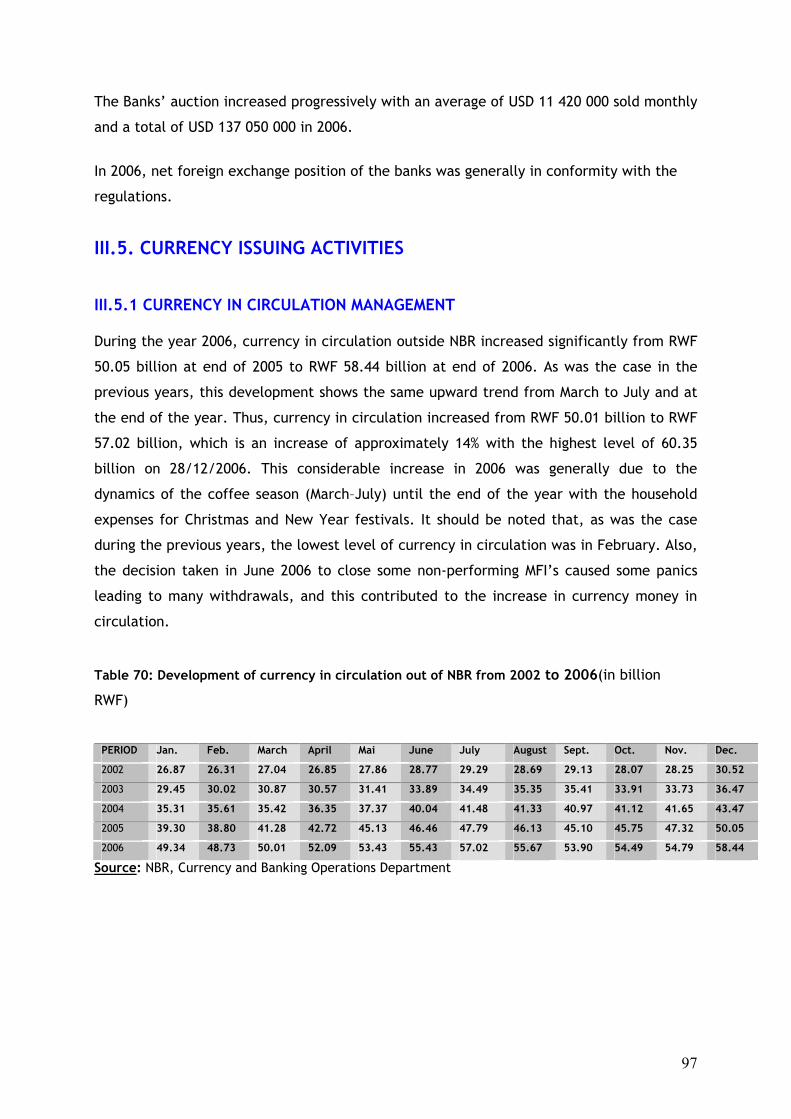
97
The Banks’ auction increased progressively with an average of USD 11 420 000 sold monthly
and a total of USD 137 050 000 in 2006.
In 2006, net foreign exchange position of the banks was generally in conformity with the
regulations.
III.5. CURRENCY ISSUING ACTIVITIES III.5.1 CURRENCY IN CIRCULATION MANAGEMENT During the year 2006, currency in circulation outside NBR increased significantly from RWF
50.05 billion at end of 2005 to RWF 58.44 billion at end of 2006. As was the case in the
previous years, this development shows the same upward trend from March to July and at
the end of the year. Thus, currency in circulation increased from RWF 50.01 billion to RWF
57.02 billion, which is an increase of approximately 14% with the highest level of 60.35
billion on 28/12/2006. This considerable increase in 2006 was generally due to the
dynamics of the coffee season (March–July) until the end of the year with the household
expenses for Christmas and New Year festivals. It should be noted that, as was the case
during the previous years, the lowest level of currency in circulation was in February. Also,
the decision taken in June 2006 to close some non-performing MFI’s caused some panics
leading to many withdrawals, and this contributed to the increase in currency money in
circulation.
Table 70: Development of currency in circulation out of NBR from 2002 to 2006(in billion
RWF)
PERIOD Jan. Feb. March April Mai June July August Sept. Oct. Nov. Dec.
2002 26.87 26.31 27.04 26.85 27.86 28.77 29.29 28.69 29.13 28.07 28.25 30.52
2003 29.45 30.02 30.87 30.57 31.41 33.89 34.49 35.35 35.41 33.91 33.73 36.47
2004 35.31 35.61 35.42 36.35 37.37 40.04 41.48 41.33 40.97 41.12 41.65 43.47
2005 39.30 38.80 41.28 42.72 45.13 46.46 47.79 46.13 45.10 45.75 47.32 50.05
2006 49.34 48.73 50.01 52.09 53.43 55.43 57.02 55.67 53.90 54.49 54.79 58.44
Source: NBR, Currency and Banking Operations Department

98
Figure 33: Development of currency in circulation outside NBR from 2002 to 2006
(in billion RWF)
Source: NBR, Currency and Banking Operations Department
Table 71: Composition of currency outside NBR from 2004 to 2006 (in million RWF)
Denominations Year
RWF 1 RWF 5 RWF 10 RWF 20 RWF 50 RWF 100 RWF 500 RWF 1000 RWF 5000 TOTAL
1.61 41.04 99.29 187.86 345.15 2 320.92 1 951.62 10.467,61 43 021.55 58.43
6.64
2006
0.003
%
0.070% 0.17 % 0.321 % 0.592 % 3 972 % 3.357 % 17.913 % 73.621 % 100 %
1.48 33.09 90.30 156.78 298.97 2 272.43 2 108.59 9 642.11 35 684.79 50.28
8.54
2005
0.003
%
0.07% 0.18% 0.31% 0.59% 4.52% 4.19% 19.17% 70.96% 100%
1.39 11.01 31.67 52.76 96.35 2 359.91 2 073.2 7 600.97 27 165.85 39.39
3.11
2004
0.003
%
0.03% 0.08% 0.13% 0.24% 5.99% 5.26% 19.3% 68.96% 100%
Source: NBR, Currency and Banking Operations Department
0
10
20
30
40
50
60
70
DEC-1 JAN FEB MAR APR. MA JUN JUL. AUG. SEPT OCT. NOV. DEC.
PERIOD (month)
2002 2003 2004 2005 2006
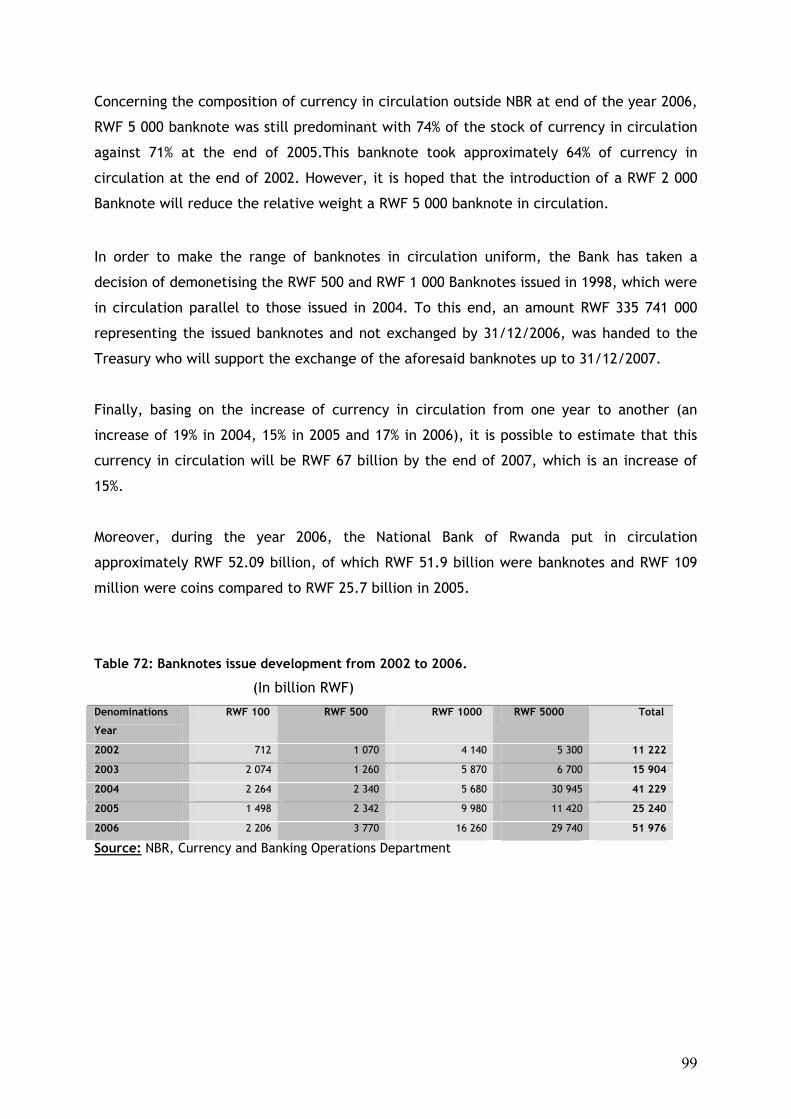
99
Concerning the composition of currency in circulation outside NBR at end of the year 2006,
RWF 5 000 banknote was still predominant with 74% of the stock of currency in circulation
against 71% at the end of 2005.This banknote took approximately 64% of currency in
circulation at the end of 2002. However, it is hoped that the introduction of a RWF 2 000
Banknote will reduce the relative weight a RWF 5 000 banknote in circulation.
In order to make the range of banknotes in circulation uniform, the Bank has taken a
decision of demonetising the RWF 500 and RWF 1 000 Banknotes issued in 1998, which were
in circulation parallel to those issued in 2004. To this end, an amount RWF 335 741 000
representing the issued banknotes and not exchanged by 31/12/2006, was handed to the
Treasury who will support the exchange of the aforesaid banknotes up to 31/12/2007.
Finally, basing on the increase of currency in circulation from one year to another (an
increase of 19% in 2004, 15% in 2005 and 17% in 2006), it is possible to estimate that this
currency in circulation will be RWF 67 billion by the end of 2007, which is an increase of
15%.
Moreover, during the year 2006, the National Bank of Rwanda put in circulation
approximately RWF 52.09 billion, of which RWF 51.9 billion were banknotes and RWF 109
million were coins compared to RWF 25.7 billion in 2005.
Table 72: Banknotes issue development from 2002 to 2006.
(In billion RWF)
Denominations
Year
RWF 100 RWF 500 RWF 1000 RWF 5000 Total
2002 712 1 070 4 140 5 300 11 222
2003 2 074 1 260 5 870 6 700 15 904
2004 2 264 2 340 5 680 30 945 41 229
2005 1 498 2 342 9 980 11 420 25 240
2006 2 206 3 770 16 260 29 740 51 976
Source: NBR, Currency and Banking Operations Department

100
Table 73: Coins issue development from 2002 to 2006
(In million RWF)
Coins Year
RWF1 RWF5 RWF10 RWF 20 RWF 50 Total
2002 340 5 090 8 410 18 790 33 150 65 780
2003 490 3 240 4 850 24 460 40 760 73 800
2004 1 650 11 355 32 080 64 410 113 015 222 510
2005 40 22 650 59 340 105 580 208 950 396 560
2006 260 8 520 10 020 29 990 60 820 109 610
Source: NBR, Currency and Banking Operations Department
It is worth noting that new issue of banknotes was greater in 2006 than in 2005 due to
NBR’s policy to put into circulation new banknotes. This policy was implemented through
supplying its branches (MUSANZE, HUYE and RUSIZI) with new banknotes and coins and by
increasing the level of sorting banknotes, which resulted in a greater quantity of banknotes
destroyed in 2006. For this purpose, NBR provided its branches with an amount RWF 27 581
820 000 equivalent to 52% of the total amount issued.
However, unlike banknotes, whose new issue almost doubled, there was a growing demand
in new coins during the year 2006. This situation can be explained by the replacement of
old demonetised coins by new ones of the same value which was completed at the
beginning of the year 2004. It is worth noting that there is a study in progress to replace
RWF 100 banknote with a coin of the same value.
III.5.2. CONTROL OF COUNTERFEIT BANKNOTES
As regards counterfeiting, during the year 2006, the National Bank of Rwanda had 1 419
counterfeit Banknotes in RWF, of which 1 184 were counterfeit banknotes of RWF 5000,
208 were counterfeit banknotes of RWF 1000, 25 were counterfeit Banknotes of RWF 500, 2
were counterfeit Banknotes of RWF100 compared to 720 counterfeit Banknotes in 2005.
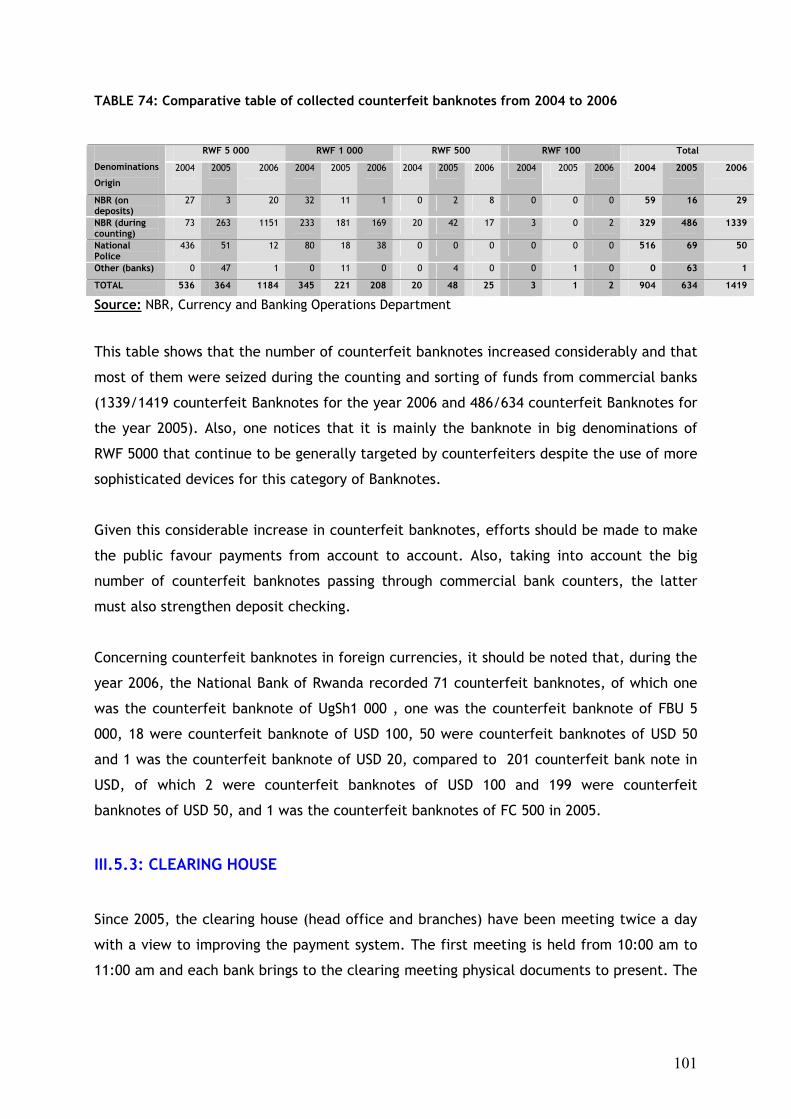
101
TABLE 74: Comparative table of collected counterfeit banknotes from 2004 to 2006
RWF 5 000 RWF 1 000 RWF 500 RWF 100 Total
Denominations
Origin
2004 2005 2006 2004 2005 2006 2004 2005 2006 2004 2005 2006 2004 2005 2006
NBR (on deposits)
27 3 20 32 11 1 0 2 8 0 0 0 59 16 29
NBR (during counting)
73 263 1151 233 181 169 20 42 17 3 0 2 329 486 1339
National Police
436 51 12 80 18 38 0 0 0 0 0 0 516 69 50
Other (banks) 0 47 1 0 11 0 0 4 0 0 1 0 0 63 1
TOTAL 536 364 1184 345 221 208 20 48 25 3 1 2 904 634 1419
Source: NBR, Currency and Banking Operations Department
This table shows that the number of counterfeit banknotes increased considerably and that
most of them were seized during the counting and sorting of funds from commercial banks
(1339/1419 counterfeit Banknotes for the year 2006 and 486/634 counterfeit Banknotes for
the year 2005). Also, one notices that it is mainly the banknote in big denominations of
RWF 5000 that continue to be generally targeted by counterfeiters despite the use of more
sophisticated devices for this category of Banknotes.
Given this considerable increase in counterfeit banknotes, efforts should be made to make
the public favour payments from account to account. Also, taking into account the big
number of counterfeit banknotes passing through commercial bank counters, the latter
must also strengthen deposit checking.
Concerning counterfeit banknotes in foreign currencies, it should be noted that, during the
year 2006, the National Bank of Rwanda recorded 71 counterfeit banknotes, of which one
was the counterfeit banknote of UgSh1 000 , one was the counterfeit banknote of FBU 5
000, 18 were counterfeit banknote of USD 100, 50 were counterfeit banknotes of USD 50
and 1 was the counterfeit banknote of USD 20, compared to 201 counterfeit bank note in
USD, of which 2 were counterfeit banknotes of USD 100 and 199 were counterfeit
banknotes of USD 50, and 1 was the counterfeit banknotes of FC 500 in 2005.
III.5.3: CLEARING HOUSE
Since 2005, the clearing house (head office and branches) have been meeting twice a day
with a view to improving the payment system. The first meeting is held from 10:00 am to
11:00 am and each bank brings to the clearing meeting physical documents to present. The

102
second meeting takes place at 3:00 pm to process dishonoured bills and exchange ideas on
their fate.
The number of clearing house operations during the year 2006 amounted to 284 240 for a
total of operations amounting to approximately RWF 965 639 million, compared to 244 423
operations in 20052 for a total amount of approximately RWF 798 381 million. These
operations are divided into various categories, namely cheques and transfer orders
presented and received by each bank.
Table 75: Cheques presented at the clearing house (Amount in million RWF) Bank Year and Branch
NBR BCR BK FINA B BCDI BANCOR
COGEB UBPR BHR TOTAL
Amount 17,530 98,289 80,353 18,458 79,206 23,864 20,457 14,710 131 352,998 Headquarter Number 4,817 38,435 40,231 9,542 28,604 9,404 14,213 4,144 81 149,471
Amount 21 815 626 0 1,640 0 200 171 0 3,473 Huye Number 27 194 247 0 224 0 145 58 0 895 Amount 20 214 396 117 136 0 81 48 0 1,012 Musanze Number 13 118 198 147 154 0 89 56 0 775 Amount 0 0 0 0 0 0 0 0 0 0
2005
Rusizi Number 0 0 0 0 0 0 0 0 0 0 Amount 17,588 99,631 82,198 18,794 81,296 23,864 20,856 14,992 131 359,350 TOTAL Number 4,864 38,978 41,170 9,930 29,406 9,404 14,587 4,326 81 152,746 Amount 11,223 95,200 90,516 17,809 100,725 29,972 25,827 17,469 1.50
1 390,246 Head
office Number 4,068 44,848 38,779 8,101 31,284 11,240 19,257 5,567 821 163,965 Amount 253 1,199 1,042 0 1,960 0 1,475 1,000 0 6,930 Huye Number 357 602 553 0 498 0 41 161 0 2,212 Amount 36 652 816 317 531 0 415 190 0 2,958 Musanze Number 31 488 670 278 479 0 571 181 0 2,698 Amount 0 4 50 0 29 5 38 10 0 136 Rusizi Number 0 16 14 0 24 11 20 7 0 92 Amount 11,512 97,055 92,424 18,126 103,24
5 29,977 27,755 18,669 1.50
1 400,270
2006
TOTAL
Number 4,456 45,954 40,016 8,379 32,285 11,251 19,889 5,916 821 168.967 Source: NBR, Currency and Banking Operations Department
Table 76: Transfer orders presented at the clearing house (In million RWF) Bank
Year and Branch
NBR BCR BK FINA B BCDI BANCOR COGEB UBPR BHR TOTAL
Amount 199,456 89,784 42,739 10,142 71,154 4,221 8,096 7,163 0 432,755 Headquarter Number 33,591 13,427 25,424 4,410 8,071 1,579 2,097 1,660 0 90,259
Amount 2,873 725 494 0 448 0 9 3 0 4,552 Huye Number 100 174 174 0 145 0 5 5 0 603 Amount 146 342 656 425 104 0 2 49 0 1,724 Musanze Number 55 143 413 138 55 0 1 10 0 815 Amount 0 0 0 0 0 0 0 0 0 0
2005
Rusizi Number 0 0 0 0 0 0 0 0 0 0 Amount 202,47
5 90.851 45,390 10,567 71,706 4,221 8,107 7,215 0 439,031 TOTAL
Number 33,746 13,744 26,011 4,548 8,271 1,579 2,103 1,675 0 91,677 Amount 249,184 111,712 49,409 12,116 97,040 5,270 15,623 7,989 130 548,477 Headquart
er Number 40,774 18,167 28,764 4,731 9,148 2,740 3,564 3,243 100 111,231 Amount 4,433 3,092 2,228 0 1, 615 0 43 758 0 12,169 Huye Number 357 602 553 0 498 0 41 161 0 2,212 Amount 348 1,096 1,481 407 112 0 222 588 0 4,254 Musanze Number 162 466 156 272 109 0 150 312 0 1.627 Amount 1 117 55 0 237 1 1 57 0 469 Rusizi Number 7 54 37 0 55 2 4 44 0 203 Amount 253.96
6 116.01
7 53.173 12.523 99.004 5.271 15.889 9.392 0 565.369
2006
TOTAL
Number 41.300 19.289 29.510 5.003 9.810 2.742 3.759 3.760 0 115.273 Source: NBR, Currency and Banking Operations Department
2 Adjustment of the erroneous data from Musanze District branch

103
Cheques and transfer orders operations increased in number and volume, and this is a
proof of positive changes in the use of other means of payment other than cash.
Furthermore, the increase in transfer orders presented shows the predominance of
transactions with NBR, which results mainly from the size of operations done on OTR
accounts for various government payments. Moreover, it is worth noting an interesting
increase in operations initiated at branches level which clearing operations started in
August 2005. In this respect, transactions increased from 1 418 for an amount of 6 276
million in 2005 to 4 042 for an amount of 16 892 million in 2006.
Furthermore, it is worth noting transactions with bank cards, which started in March 2005
for Points of Sale (POS) and in November 2005 for Automatic Teller Machines (ATM).
Table 77: Operations development at the POS (2005-2006)
Year
2005 (March –December) 2006
Bank Amount Number of operations
Amount Number of operations
BCR 6,255,099 548 8,934,191 681 BK 13,671,689 1,308 12,012,418 1,224 FINA BANK 5,726,778 511 1,135,188 80 BCDI 9,107,386 672 8,746,068 621 BANCOR 6,463,222 490 3,217,593 185 COGEBANQUE 1,455,328 207 3,820,444 333 UBPR 737,780 110 2,558,174 134 BHR 0 0 0 0 TOTAL 43,417,282 3,846 40,424,076 3,258 Source: NBR, Currency and Banking Operations Department
Figure 34: Operations development at the POS (2005-2006)
UBPR6%
BHR0%
BK30%
FINA BANK3%
BCDI22%
BANCOR8%
COGEBA9%
BCR22%
BCR BK FINA BANK BCDI BANCOR COGEBA UBPR BHR
Source: NBR, Currency and Banking Operations Department

104
One would note the downwards trend of transactions at POS in amounts and number.
During the year 2006, the operations rose to 3 258 for a total amount of RWF 40 424 076
compared to 3 846 operations for a total amount of RWF 43 417 282 in 2005. This
downward trend, which turned to the advantage of ATM transactions, is explained by the
fact that economic operators still prefer cash payment instead of account operations. To
this end, relevant authorities should make more effort to convince economic operators to
use this means of payment.
Table 78: ATM operations development (2005-2006)
Year 2005 (March – December) 2006
Bank Amount Number of operations Amount Number of operations
BCR 1,855,000 44 258,933,660 6,612
BK 3,225,000 85 358,189,916 9,414
FINA BANK 2,702,000 136 40,980.00 1,181
BCDI 3,951,000 97 517,760,000 14,631
BANCOR 2,791,000 55 54,285,000 1,891
COGEBANQUE 1,393,000 58 140,567,000 3,739
UBPR 2,419,000 58 54,525,000 1,356
BHR 0 0 0 0
TOTAL 18,336,000 533 1,425,300,576 38,824
Source: NBR, Currency and Banking Operations Department
Figure 35: ATM operations development (2005 -2006)
BANCOR4%
COGEBANQUE10% UBPR
4%
FINA BANK3%
BCDI36%
BK25%
BCR18%
BHR0%
BCR BK FINA BANK BCDI BANCOR COGEBANQUE UBPR BHR
Source: NBR, Currency and Banking Operations Department
Conversely, ATM operations increased considerably as shown in the table above. During the
year 2006, the number of this kind of operations increased to 38 824 for a volume of RWF1
425 300 576 compared to 533 operations for a volume of RWF 18 336 000 in 2005. There
was a positive trend with the predominance efforts of BCDI (36%), BK (25%), BCR (18%) and
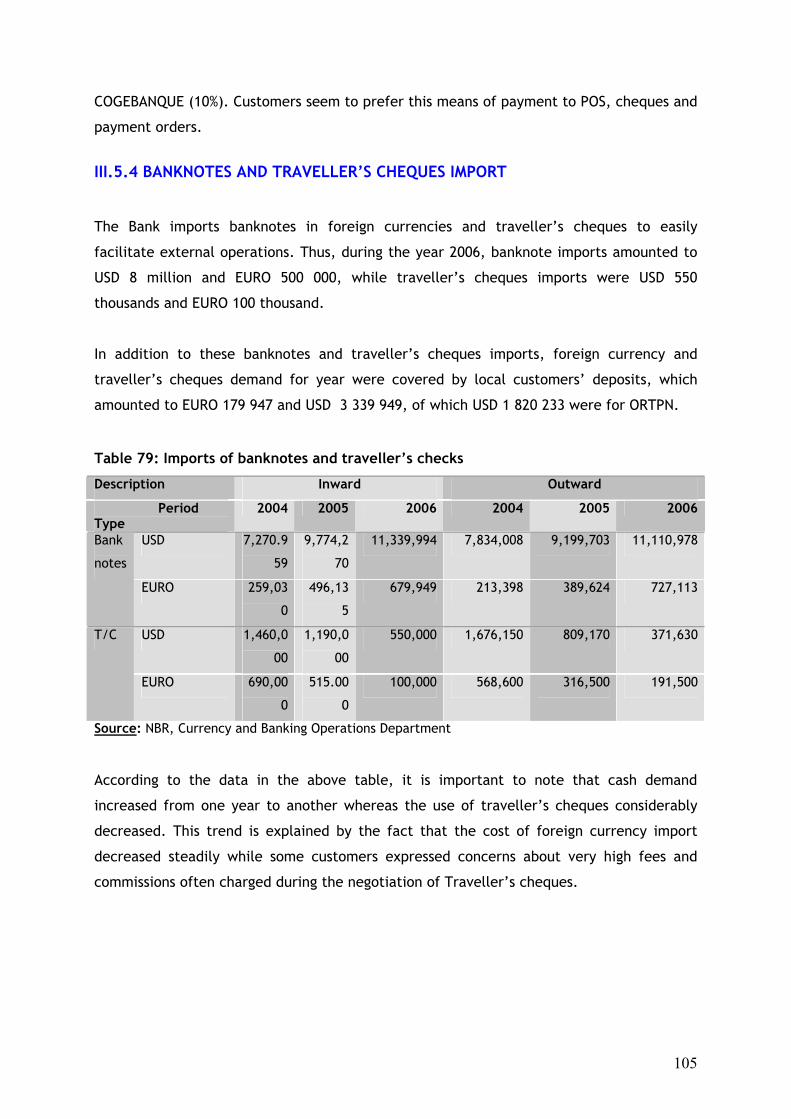
105
COGEBANQUE (10%). Customers seem to prefer this means of payment to POS, cheques and
payment orders.
III.5.4 BANKNOTES AND TRAVELLER’S CHEQUES IMPORT
The Bank imports banknotes in foreign currencies and traveller’s cheques to easily
facilitate external operations. Thus, during the year 2006, banknote imports amounted to
USD 8 million and EURO 500 000, while traveller’s cheques imports were USD 550
thousands and EURO 100 thousand.
In addition to these banknotes and traveller’s cheques imports, foreign currency and
traveller’s cheques demand for year were covered by local customers’ deposits, which
amounted to EURO 179 947 and USD 3 339 949, of which USD 1 820 233 were for ORTPN.
Table 79: Imports of banknotes and traveller’s checks
Description Inward Outward
Period Type
2004 2005 2006 2004 2005 2006
USD 7,270.9
59
9,774,2
70
11,339,994 7,834,008 9,199,703 11,110,978 Bank
notes
EURO 259,03
0
496,13
5
679,949 213,398 389,624 727,113
USD 1,460,0
00
1,190,0
00
550,000 1,676,150 809,170 371,630 T/C
EURO 690,00
0
515.00
0
100,000 568,600 316,500 191,500
Source: NBR, Currency and Banking Operations Department
According to the data in the above table, it is important to note that cash demand
increased from one year to another whereas the use of traveller’s cheques considerably
decreased. This trend is explained by the fact that the cost of foreign currency import
decreased steadily while some customers expressed concerns about very high fees and
commissions often charged during the negotiation of Traveller’s cheques.

106
III.5.5. NBR BRANCHES OPERATIONS The three NBR branches namely Musanze, Huye and Rusizi have been operational since
23/05/2005, 20/06/2005 and 15/11/2006 respectively for cash operations and since
01/08/2005 for clearing house operations for the first two branches and since 27/11/2007
for Rusizi branch. The latter was officially inaugurated on 20/01/2007.
Cash operations mainly consist of customers’ deposits and withdrawals but it is worth
noting that money served come from headquarter which amount to RWF 19 516 170 000 for
Huye branch, RWF 7 134 050 000 for Musanze and RWF 931 600 000 for Rusizi.
Table 80: Deposits and withdrawals at each branch
2005 2006 Period Branch Deposits Withdrawals Deposits Withdrawals
MUSANZE 3,279,917,000 5,661,409,000 8,948,450,139 14,318,962,511 HUYE 2,059,451,000 6,873,493,000 3,042,955,000 20,986,895,000 RUSIZI 0 0 1,208,058,200 1,290,540,795 TOTAL 5,339,368,000 12,534,902,000 13,199,463,339 36,596,398,306
Source: NBR, Currency and Banking Operations Department
As was in the previous year, Musanze branch has more deposits and fewer withdrawals
compared to Huye during the year 2006. This is justified by the fact that Muzanze branch
received fewer supplies from the head office (RWF 7 134 050 000 compared to RWF 19 516
170 000).
Concerning foreign currency operations, it is important to note that Musanze branch
recorded a bigger number of operations compared to Huye branch, ORTPN and NGOs
working in the areas covered by the aforementioned branches being the most important
customers.
III.5.6. MANAGEMENT OF DORMANT ACCOUNTS
According to Instruction n° 03/2001 of NBR related to dormant accounts balances,
commercial banks must transfer dormant accounts balances to NBR.
During the year 2006, there was no major change in dormant accounts balances transferred
to NBR. On the contrary, a big number of customers claimed their balance.
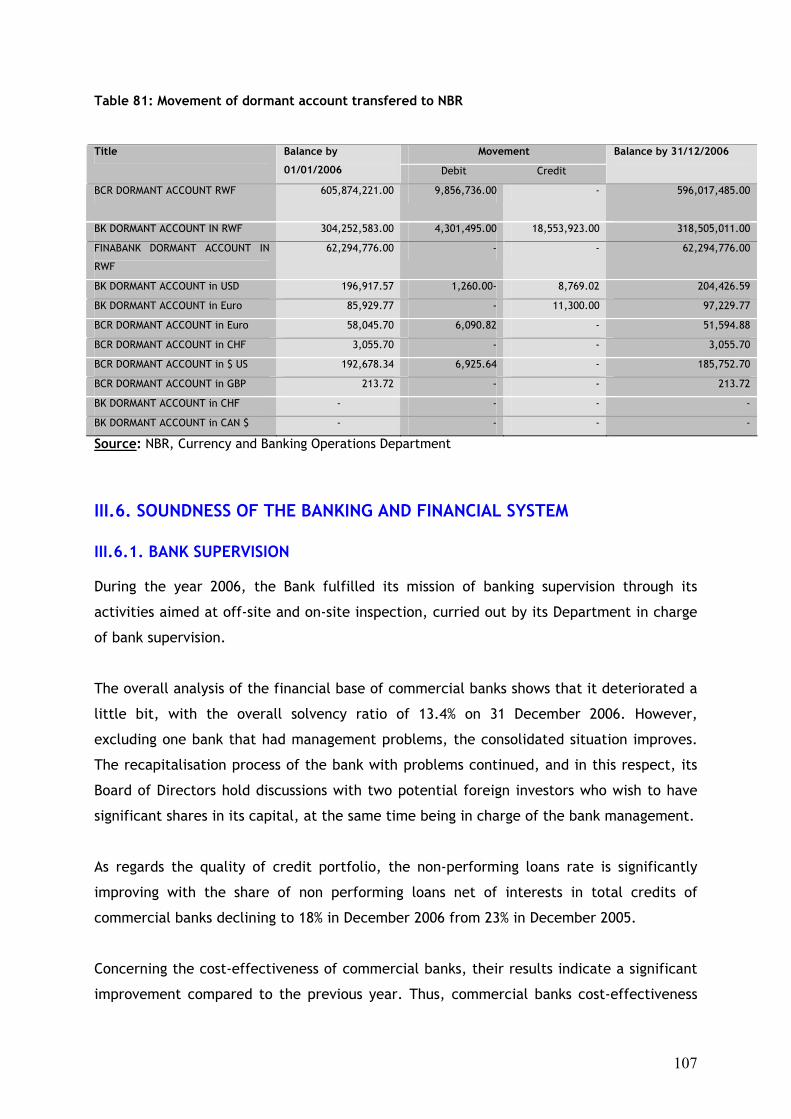
107
Table 81: Movement of dormant account transfered to NBR
Movement Title Balance by
01/01/2006 Debit Credit
Balance by 31/12/2006
BCR DORMANT ACCOUNT RWF 605,874,221.00 9,856,736.00 - 596,017,485.00
BK DORMANT ACCOUNT IN RWF 304,252,583.00 4,301,495.00 18,553,923.00 318,505,011.00
FINABANK DORMANT ACCOUNT IN
RWF
62,294,776.00 - - 62,294,776.00
BK DORMANT ACCOUNT in USD 196,917.57 1,260.00- 8,769.02 204,426.59
BK DORMANT ACCOUNT in Euro 85,929.77 - 11,300.00 97,229.77
BCR DORMANT ACCOUNT in Euro 58,045.70 6,090.82 - 51,594.88
BCR DORMANT ACCOUNT in CHF 3,055.70 - - 3,055.70
BCR DORMANT ACCOUNT in $ US 192,678.34 6,925.64 - 185,752.70
BCR DORMANT ACCOUNT in GBP 213.72 - - 213.72
BK DORMANT ACCOUNT in CHF - - - -
BK DORMANT ACCOUNT in CAN $ - - - -
Source: NBR, Currency and Banking Operations Department
III.6. SOUNDNESS OF THE BANKING AND FINANCIAL SYSTEM III.6.1. BANK SUPERVISION During the year 2006, the Bank fulfilled its mission of banking supervision through its
activities aimed at off-site and on-site inspection, curried out by its Department in charge
of bank supervision.
The overall analysis of the financial base of commercial banks shows that it deteriorated a
little bit, with the overall solvency ratio of 13.4% on 31 December 2006. However,
excluding one bank that had management problems, the consolidated situation improves.
The recapitalisation process of the bank with problems continued, and in this respect, its
Board of Directors hold discussions with two potential foreign investors who wish to have
significant shares in its capital, at the same time being in charge of the bank management.
As regards the quality of credit portfolio, the non-performing loans rate is significantly
improving with the share of non performing loans net of interests in total credits of
commercial banks declining to 18% in December 2006 from 23% in December 2005.
Concerning the cost-effectiveness of commercial banks, their results indicate a significant
improvement compared to the previous year. Thus, commercial banks cost-effectiveness
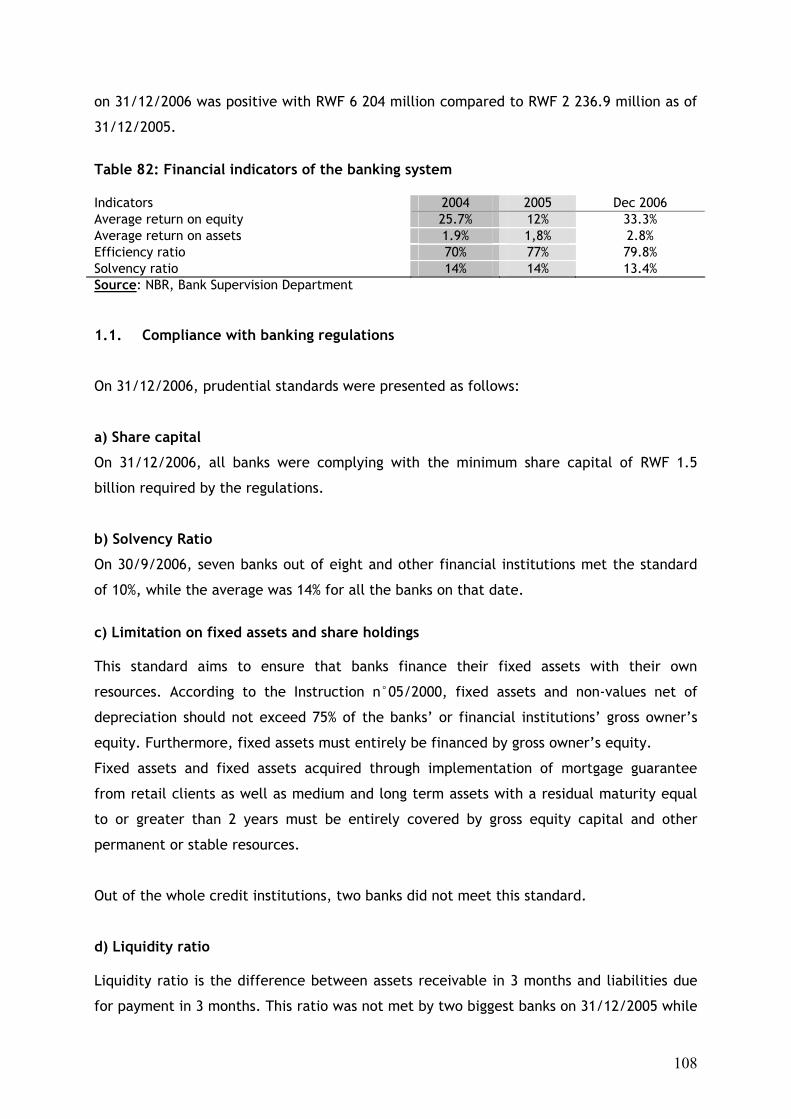
108
on 31/12/2006 was positive with RWF 6 204 million compared to RWF 2 236.9 million as of
31/12/2005.
Table 82: Financial indicators of the banking system Indicators 2004 2005 Dec 2006 Average return on equity 25.7% 12% 33.3% Average return on assets 1.9% 1,8% 2.8% Efficiency ratio 70% 77% 79.8% Solvency ratio 14% 14% 13.4% Source: NBR, Bank Supervision Department 1.1. Compliance with banking regulations
On 31/12/2006, prudential standards were presented as follows:
a) Share capital
On 31/12/2006, all banks were complying with the minimum share capital of RWF 1.5
billion required by the regulations.
b) Solvency Ratio
On 30/9/2006, seven banks out of eight and other financial institutions met the standard
of 10%, while the average was 14% for all the banks on that date.
c) Limitation on fixed assets and share holdings This standard aims to ensure that banks finance their fixed assets with their own
resources. According to the Instruction n°05/2000, fixed assets and non-values net of
depreciation should not exceed 75% of the banks’ or financial institutions’ gross owner’s
equity. Furthermore, fixed assets must entirely be financed by gross owner’s equity.
Fixed assets and fixed assets acquired through implementation of mortgage guarantee
from retail clients as well as medium and long term assets with a residual maturity equal
to or greater than 2 years must be entirely covered by gross equity capital and other
permanent or stable resources.
Out of the whole credit institutions, two banks did not meet this standard.
d) Liquidity ratio Liquidity ratio is the difference between assets receivable in 3 months and liabilities due
for payment in 3 months. This ratio was not met by two biggest banks on 31/12/2005 while
109
they are among those with the most liquidity in the Rwandan banking system. This
paradoxical situation led to a more in-depth analysis of the directive on the liquidity ratio
and, after the revision of that instruction in 2006, which gave a weight of 80% instead of
100% to demand deposits or other accounts payable to customers, all banks meet this
standard.
e) Foreign exchange net position
Banks must comply with a ratio of approximately 20% between foreign assets (all foreign
currencies together) and total equity capital of each bank. During the year 2006, only one
bank did not report any overrun. The instruction will be revised in 2007 to set limits as per
foreign currency.
f) Risk division and covering
Three out of eight credit institutions did not meet the standard that requires them not to
grant more than 25% and 5% of its net equity capital to an individual and to an executive or
an administrator and his/her relative respectively.
In order to closely follow up banks with problems, the Bank conducted in 2006 an
intensified supervision of a bank being restructured by permanently sending to that bank a
controller with the title of provisional auditor.
1.2. On-site and off-site inspection This year was devoted to effective establishment of the Risk Based Supervision (RBS) by
putting in place off-site inspection instruments required for such approach and modifying
methods of on-site inspection.
With regard to off-site inspection, during the year 2006, the Bank modified the format of
its quarterly analysis notes, which from now on will be summarised on a single statistical
page. The Banking Supervision Department opted for adopting the CAMELS (Capital-Assets-
Management-Earnings-Liquidity-Sensitivity to Market Risk) of banks, and indicates the
quarterly changes in their major financial indicators. Such an analysis and the CAMELS
grading will be quarterly sent to banks starting from the financial year 2007.
110
Such improvements were put in place, thanks to the IMF assistance, provided through its
regional technical assistance office (EAST AFRITAC) based in Dar Es Salaam, Tanzania,
which sent two missions to NBR. The first took place in June and was charged with
evaluating progress made in putting in place the Risk Based Supervision. The second was
conducted in September 2006 and its terms of reference were to assist the bank in putting
in place some on-site inspection guides including inspection manual and the new quarterly
note format for a bank and the entire banking system.
The recommendations from these two assistance missions, which are being implemented,
are related to:
• the finalisation of the risk based supervision instruments (policy paper on RBS, risk
management guide, risk management programme, CAMELS grading guide,
inspection methodology);
• the improvement in the quality of supervision (strengthen pre-inspection
procedures, organise meetings with the boards of directors of the banks and other
financial institutions, strengthen off-site inspection and put in place a quality
insurance programme to facilitate the transition between the two supervision
approaches);
• Creation of a permanent dialogue with the auditors/external auditors of the
financial institutions;
• Establishing within the Banking Supervision Department, a Research and Policy Unit
to strengthen banking supervision capacities.
• the disclosure of the instructions on CAMELS grading;
• the adoption of the off-site inspection manual and the revision of the flash report
sent to NBR;
• Strengthening of the off-site inspection instruments by setting stress tests and
putting in place early prevention warning systems.
As regards the actual on-site inspection mission, the new RBS approach allowed for the
supervision of the majority of the Rwandan banks. Only two banks (BCR and FINABANK) out
of the eight banks in the Rwanda banking system did not undergo on-site inspection. This
can be explained by the time devoted to the setting up of the necessary framework for the
new supervision approach (RBS) and the training in that area.
111
Thus, during the year 2006, 5 general inspections (BRD, BK, COGEBANQUE, BANCOR and
BHR) and one punctual inspection (BCDI) were carried out following the new risk based
approach started by NBR in December 2005 with the transmission of a risk management
guide to banks.
At the end of the supervisions carried out in banks in the year 2006, there was an
improvement in the implementation of bank chart of accounts and the process of credit
granting. However dysfunctions remain in the area of risk management and monitoring, in
particular with regard to the funding of outstanding credits. In addition, following such
supervision, meetings were organized at the National Bank with members of the Boards of
Directors and the management of the inspected banks so as to discuss the weaknesses
noted during supervision and plans of action to be set up to address them.
1.3 Follow-up of the bank in difficulties Rwandan financial sector restructuring continues after restructuring and privatisation of
two banks carried out in 2004; the Banking Supervision Department concentrated its action
on a bank which remained not only under capitalized after the constitution of the reserves
required by the regulation, but also faced management problems. The mandate of the
provisional auditor whom the Bank had sent to this bank in September 2005 ended in
February 2006. However, in order to closely follow-up the activities of the bank which did
not comply with its rectification plan, this mandate was extended in the form of
intensified supervision
The shareholders of this bank with problems who were unable to contribute in due time
the RWF 2.5 billion to increase owner’s equity required with a view to complying with the
minimum solvency ratio of 10%, opened their capital to foreign investors and the latter
carried out diligent work for the bank. The discussions on the establishment of an MOU for
the resumption of the bank partnership and its management will continue in 2007.
1.4. Follow-up of the non performing loans
With regard to non performing loans recovery, on 19/04/2006, a questionnaire was sent to
banks to enable them develop their outstanding credit recovery plans. On 24/04/2006, a
meeting was organised between Bank Supervision Department and those in charge of
outstanding credit recovery to exchange views on methods of speeding up the recovery of
non performing loans. Discussions between NBR and banks relating to methods of
monitoring the action plans decided in 2006 will continue in 2007.

112
Moreover, a seminar on non performing loans recovery, chaired by the Minister of Justice,
in collaboration with NBR Governor, took place on 30/5/2006. Participants appreciated
efforts made in terms of improving the legal and regulatory framework with a view to
facilitate the non performing loans recovery. In particular, they hailed the publication of
land law in Rwanda that provides for the registrars of the land titles who will be
technicians rather than politicians as was the case before. This will resolve many
problems, especially at the level of Kigali City.
The mandate of the commission put in place in 2005 to follow-up the implementation of
the recommendations from the 2005 seminar was renewed in 2006 and the commission was
extended to two other members, namely the current Secretary of the Association of
Rwandan Banks (ABR) as well as a representative of the Ministry having banks in its
attributions. Other recommendations were put forth in the 2006 seminar and they
constitute technical specifications of the commission for monitoring their implementation.
However, the work of the commission could not progress satisfactorily due to the
unavailability of the registrars of the land titles who were only appointed on 13/12/2006
by the Cabinet. Before taking up duties, six appointed registrars of land titles must be
sworn in.
1.5. Legal and regulatory framework
The year 2006 ended with the submission to the Cabinet and Parliament of a new banking
law draft, which will be adopted in 2007.
The NBR will continue with the IMF assistance, to elaborate new regulations to accompany
this new banking law, of which the most important ones are:
- the approval of banks
- the solvency ratio
- good governance
- the division of risks
- and the memorandum for co-operation with the foreign banking supervision
authorities.
In order to strengthen the financial base of banks, in their meeting of 14 December 2006,
the Board of Directors of the National Bank of Rwanda decided to increase the minimum

113
initial capital of a commercial bank to RWF 5 billion and RWF 300 million for micro finance
institutions in form of limited liability companies. This decision materialized by the
circular of 29/12/2006 to concerned financial institutions, giving them a one-year grace
period as from 1 January 2007 to conform to it.
114
1.6. New Approvals
In 2006, NBR approved a new bank called “Opportunity International Bank of Rwanda Ltd|
and a discount house called “Continental Discount House of Rwanda (CDHR)” and it is
processing two other applications related to the Marathon bank project (application
received on 24/10/2006) and the International Commercial Bank project (ICB) Financial
Holdings Limited (application received on 15/12/2006).
In addition, two BCR branches (Kisimenti- Remera), one BANCOR branch (Nyabugogo), one
BCDI branch (institution head office - Nyarugenge District), two COGEBANQUE branches
(Rwamagana, Kacyiru) and one BCR Mobile Bank based in Rwamagana, were authorized.
The banks requested and obtained the approval of 18 members of their bank and branch
top management to work in their respective banks.
The auditing firm KLSA PANNELL KERR FORESTER was authorized to be included on the list
of auditors for banks and other financial institutions, while two appraisers of bank
guarantee fixed assets were added on the list.
III.6.2. SUPERVISION OF COOPECS AND OTHER MICRO-FINANCE INSTITUTIONS 2.1. Supervision work
During the year 2006, the micro-finance section in the Bank Supervision Department
focused primarily on the on-site inspection and examining the files of the MFI’s in
difficulties.
To deal with the high number of MFI’s to be supervised, besides the thorough inspection
programme; a programme was designed for targeted institution supervision and extended
over two days. This programme made it possible to visit many MFI’s during the year 2006
and the results are satisfactory since they enabled to quickly form a clear opinion,
particularly on the treasury of the targeted MFI’s, the quality of its management and the
capacity to ensure internal control. This programme will continue in 2007 to supervise
various MFI’s which the Department will have to visit, especially during the most difficult
events following the winding-up of 9 big micro-finance institutions.
115
The work plan, which provides for general supervision in 10 MFI’s, has been achieved as
expected. Thus the following institutions were subjected to general supervision in the first
quarter of 2006:
1. CFE AGASEKE SA ;
2. ONGERA Micro-finance SA ;
3. GWIZA Micro-finance SA ;
4. INTAMBWE Micro finance SA ;
5. URUMULI Micro finance SA ;
6. Union des COOPECs IWACU ;
7. SWOFT SA ;
8. Union des COOPECs UMUTANGUHA ;
9. COOPEC EBENEZER UMUCYO ;
10. UBPR
Concerning supervision targeting some institutions, the following microfinance institutions
were visited by the Bank:
1. CAF ISONGA SA ;
2. ASEC SA ;
3. INKINGI SA ;
4. CMF URUGERO SA ;
5. GASABO SA ;
6. SWOFT SA;
7. IMF UNGUKA SA;
8. COOPEC ABIZERANYE ;
9. COOPEC ITI ;
10. CLECAM RUHENGERI ;
11. URUNANA Micro-finance SA ;
12. COOPEC UBUMWE BY’INYARUREMA ;
13. IMF UNGUKA SA ;
14. CSPKI ;
15. GASABO SA ;
16. COPECYA ;
17. COOPEC ISHEMA MULINDI ;
18. UNION DES COOPECs JYAMBERE ;
116
19. UCEA ;
20. CLECAM affiliated to Union des CLECAM RUHENGERI;
21. AMICOKA ;
22. ITI ;
23. CODESOBU ;
24. Coopérative de Solidarité Communautaire ISANGANO (CSC ISANGANO) ;
25. COOPEC INKUNGA ;
26. CAF ISONGA SA ;
27. COOPEC TWITEZIMBERE ;
28. COOPEC UMUTANGUHA GASARENDA;
29. KOZIBI ;
30. COOPEC INZIRA ;
31. COOPEC INGASHYA ;
32. CEPES ;
33. INKINGI Microfinance SA ;
34. COOPEC Espoir.
2.2. Liquidation of MFI’s in a situation of payment suspension and rescue plan for the micro-finance sector
After the tour of Minister of State in the Ministry of Finance and Economic Planning and the
Governor of National Bank of Rwanda that took place in 2005 in all provinces of the
country to sensitise the MFI that had started their activities in an anarchistic way, thereby
requesting them to apply for the NBR approval, the latter did its supervision work, but it
was noted that for some MFI’s, it was so late that it was not possible to turn them round in
spite of the monitoring mechanisms set up after their approval. Thus the Bank submitted
to the Government a report on the situation that prevailed at the beginning of the year
2006 suggesting measures for the financial sector rescue, and the most significant action
was the closing of MFI’s with significant signs of difficulties characterized by suspension of
payments at their counters. These MFI’s had the following common characteristics:
- Poor governance;
- significant losses resulting from their poor management of credit files, which led to
serious problems in later recoveries;
- The loss of trust among the population which resulted in massive withdrawals of
deposits followed by the stopping of new deposits. This situation resulted in the
suspension of payments which characterized the majority of these institutions;
117
- Some of them had failed to meet the approval conditions required for obtaining a
certificate of approval delivered by the NBR, especially with regard to the release
of the minimum capital.
The following MFI’s were concerned by this measure:
1.GWIZA Micro Finances SA;
2.INTAMBWE Micro Finances SA;
3.URUMULI Micro Finances SA ;
4.COOPECs INTERA and their Union;
5.COOPEC IWACU (ex SOLIDARITE FEMININE IWACU) and their Union;
6.ONGERA Micro Finances SA ;
7.COOPEC UBUMWE IWACU;
8.Compagnie de micro finance URUGERO SA
Besides these 8 MFI’s, it should be noted that the case of COOPEC GISUBIZO which had
closed in November 2005; its liquidation process had already started before the closing of
the other eight. On 31/12/2006 only the liquidator of COOPEC UBUMWE IWACU had not
been yet appointed by the Court.
In order to protect depositors, NBR proposed a follow-up plan materialized by a
Government intervention aimed at accompanying the liquidation of these MFI’s so that the
negative impact caused by the closing of 8 important MFI’s may not result in liquidity
problems already experienced by several MFI’s, following the loss of the trust among the
population. This situation would have spread with disastrous effects for the depositors in
this sector if the Government had not intervened to calm the situation and to prevent the
systemic bankruptcy in the micro finance sector. This plan was adopted. To implement it,
the liquidation of the MFI was coupled with an operation aimed at the absorption of assets
and liabilities of these MFI’s by the Banques Populaires network. To this end, the UBPR was
appointed "Provisional Administrator" of these MFI and it was proposed that the provisional
administration be followed immediately by the liquidation of each MFI concerned. With
this intention, a memorandum of agreement was signed between UBPR and NBR for the
implementation of the provisional administration, and terms of reference intended for the
auditors/liquidators was worked out for their recruitment to implement the liquidation.
118
To compensate depositors, the Government agreed to refund 50% of the deposits, and the
other part had to be recovered with the repayments of the loans granted by the MFI being
liquidated. The operation of compensating the population has already started and will
continue in 2007. However, to protect operational MFI’s which have not yet experienced
difficulties; the following measures were deemed necessary:
1. A different communication strategy depending on the entities concerned (customers,
depositors and borrowers, local authorities, National police, MINIJUST…) was adopted;
2.The national micro finance policy was adopted; it outlines the major trends in the
sector and defines or decides the roles between the stakeholders. This policy also
enabled to put in place a stabilization fund and its role will be to intervene in case an
MFI goes bankrupt to prevent resort to the Government budget in the future. The
adopted policy provided the foundations for the drafting of the law on the micro
finance sector. There has not been any separate law for COOPECs. Their activities
were integrated in this law which emphasizes activity rather than the legal form
adopted by the stakeholders;
3. In order to prevent this liquidity problem in the future, NBR proposed the
implementation of reserve requirement from deposits mobilized by MFI’s that will still
be operational. These reserves will serve to cushion liquidity for these MFI’s and will
also prevent MFI’s from granting loans beyond their capacity. In order not to penalize
them, these reserve requirements will be directly deposited as treasury bills for these
MFI’s which, if need be, will obtain financing from the banking sector through the
mobilization of those treasury bills.
4. NBR will also strengthen the supervision and monitoring of MFI’s with provisional
approval in order to determine their exact financial situation and accompany them
towards the obtaining of final approval. This exercise will be completed at the end of
2007.
5. Putting in place a commission to recover the loans granted by closed MFI’s,
composed of all District Mayors, representatives of Security Services, the National
Police, Attorney General and the Private Sector in the District. This Commission is
charged with providing support to the Banques Populaires in the process of recovering
loans granted by MFI’s under liquidation.
6. It was also decided to compel MFI managers to accept their responsibility in the
bankruptcy of the MFI concerned.
7. The initial capital of the existing and new MFI’s was increased to RWF 300 million for
MFI’s with the legal status of a Limited liability company.
119
2.3 MFI Approval
Efforts made in 2005 and 2006 to organise the entry into and exercise of activities in the
micro-finance sector stopped the anarchical starting of MFI’s. It is within this context that
a decision was made to close all MFI’S that would start without the approval of NBR. Those
which tried to open without approval were fast closed by local authorities. In 2006, only
one MFI was authorised to open.
III.6.3. INFORMATION CENTRE FOR RISK AND NON PERFORMING LOANS
The information centre has two major objectives:
- Centralise all the commitments of customers both in the banking and the micro
finance sectors with the aim of enabling financial institutions to reduce the risk of
granting loans to non-performing customers in the Rwandan banking sector.
-Allow NBR to know the quality and volume of credit portfolio.
In order for the centre to fulfil its mission, data must be complete, reliable and up-to-
date. In order for these objectives to be attained, modernisation of the information centre
shall be an essential element and the revision of the system related to the applications of
the centre has been provided for.
3.1. Centralized Bank Statements
During the year 2006 and in the context of decentralization of financial institution risks,
efforts mainly focused on verifying the reliability of data availed by banks and other
financial institutions regarding loans and the updating of such data in order to centralise
quality information.
Data exchange between NBR and banks is channelled through the BANKNNET network given
that since June 2004 the activity of entering the statements from financial institutions has
been centralised in banks and other financial institutions. What has been found is that
some users do not master the data-entering screen and their electronic statements contain
many errors. The correction of such errors takes much time, sometimes requiring the
intervention of the Organization and Information System Department.
120
Banks and other financial institutions have speeded up their statement process especially
those related to new loans compared to the previous year. Concerning credit statements,
most of banks are up-to-date in their statements including those made through the
interbank network. It should be noted that although some banks have put in place
interfaces and make their statements in the form of a text file, their risk statements still
contain errors.
3.2. Preparation and forwarding of statistical data
Concerning the statistics on loans, data on new loans authorised by the 6 commercial
banks, which are needed by the Monetary and Foreign Exchange Policy Committee, are
availed every week as expected. During the year 2006, commercial banks authorised the
disbursement of new loans totalling RWF 94 589 million, of which RWF 10 891 million were
authorised for the coffee season.
As regards the statistical data for banks available at the information centre for use, they
are only those of October 2006. Credits outstanding by 31 October comprised an amount of
RWF 164,925 million of disbursement loans.
Although the statistical data of the information centre are not yet fully up-to-date, several
activities were achieved during the year 2006, notably:
- the validation of new loans was done until November 2006 for most of banks and
MFI’s and the number of loans reported every month continued to rise. The monthly
average of new loans rose from 200 in 2003 to 1 200 in 2006;
- the number of new economic operators established in 2006 was 5 458 while it was 3
268 in 2005;
3.3 Integration of MFI’s into the information centre
In the context of COOPECS and MFI’s integration into the information centre, 12 COOPECS
and MFI’s provided and consulted the data at the information centre. Given an important
volume of activities, the integration of new MFI’s data was not speeded up during the year
2006.
121
In order to improve the quality of the declared data, a regular follow-up of the users of the
information centre applications from MFI’s (new users or those for whom most of the
stated information contained errors) was carried out.

122
3.4. Improvement of the data at the information centre
In the context of improving the quality of the data at the information centre and its
automation, a remodelling has been programmed. A project design document was drafted
by a team of data-processing specialists in charge of remodelling applications for the risk
and non performing loans. In order to be aware of some realities, a tour was organised in
financial institutions in January 2006 and a guide questionnaire for interviews with some
services was developed.
It should be noted that during the remodelling, bank customers will be identified starting
from their first contacts with the bank, that is, the bank account opening.
During remodelling, other information that is not currently available at the information
centre will be taken into account. This will mainly consist in identifying within the risk
survey, cancelled loans from other loans as well as entering information that is not
available in the data base, which is referred to in decisions making, the revision of the
codification used such as the use of the new catalogue list related to the branch of
activities, credit categories, new districts, etc.
However, during data processing, the problem linked to the identification of customers of
the banks hinders NBR activities. The checking of the bank customers identification takes
much time since there are no fixed definite criteria used for the allocation of a number to
the bank customers. Thus, the allocation of the identification numbers to new economic
operators must be done with much care since it is necessary to check the identification of
the person to avoid, on the one hand, the duplication of the numbers for the same person
and, on the other hand, recording commitments with a person who did not receive them.
Also, this problem hinders the activities of the banks while consulting the data at the
information centre.

123
4. FINANCIAL SECTOR DEVELOPMENT PLAN
After the joint Mission conducted in February 2005 by the IMF and World Bank experts
within the framework of the Financial Sector Evaluation Programme (FSEP), Rwandan
Government in collaboration with NBR decided to bridge the gaps in Rwandan financial
sector raised by this Mission as soon as possible. Thus, during the year 2006, the Bank
acted as the leader to set up a development plan of the coherent financial sector, whose
paper was presented during the seminar organized on 28/09/2006 that brought together all
the stakeholders in the economic development of the Country. Observations were given
during this seminar and this made it possible to finalize the paper, which is the base for all
the orientation that will be followed to improve Rwandan financial sector.
Specifically, short-term and long-term actions aimed at developing Rwandan financial
sector were decided. For banks and their supervision, such actions are related to the
increase in competition between banks, the reform of the Banques Populaires, the revision
of the law on leasing, the setting up of a Private Credit Office as well as capacity building
for the Rwanda Development Bank so that it can mobilise long-term resources and increase
agricultural sector credit. It was also decided that a strategic plan should be prepared for
the Housing Bank, which would be the only institution to work with long-term resources, so
that it can suitably fulfil its mission of housing financing. Thus this bank would give up
demand deposits collection. The actions that were decided are part of a national plan that
was presented to the donors.
III.6.4 PAYMENT SYSTEM
The year 2006 was devoted to the continuation of the planed programme of the year 2005
that was not completed on the one hand, and to the launching of other actions planned in
modernization of the national payment system program, on the other hand. Thus, the
achievements of the year 2006 focused on the continuation of the implementation of the
recommendations contained in the paper on the study for "stocktaking" of the National
Payment System, the completion of the daily work of the Service, the development of the
Real Time Gross Settlement System (RTGS) and finally participation in the activities
organized by Swift.
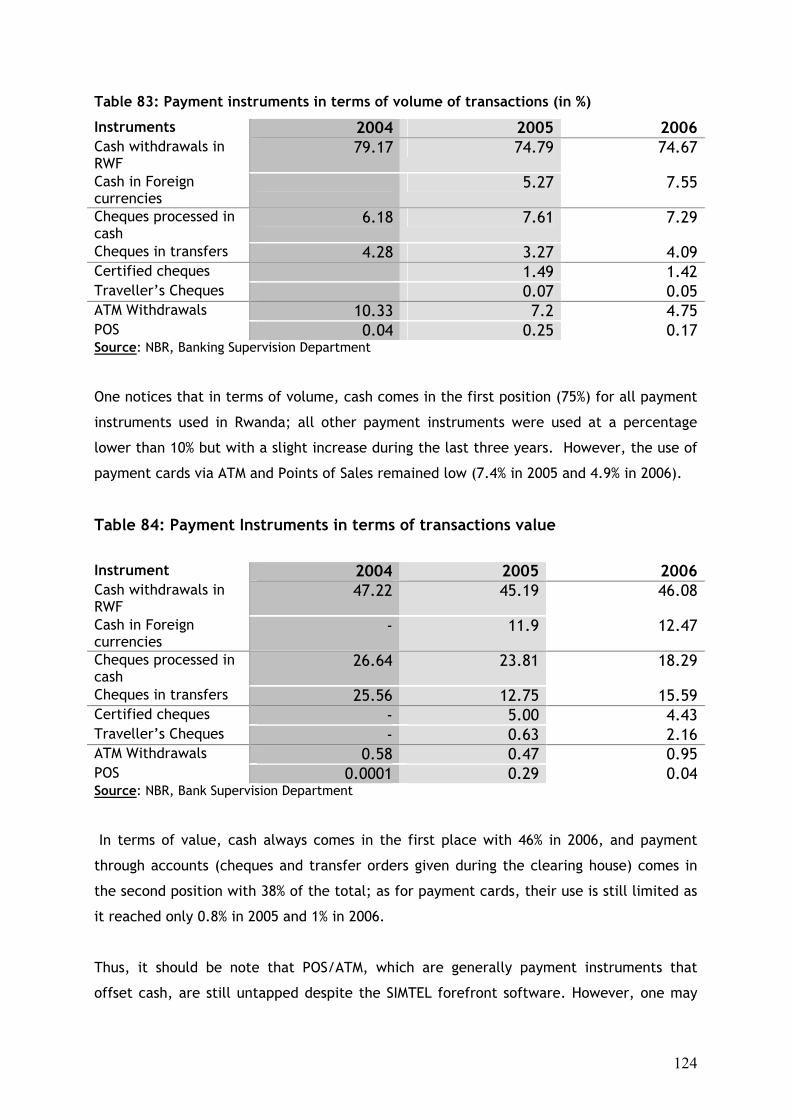
124
Table 83: Payment instruments in terms of volume of transactions (in %)
Instruments 2004 2005 2006 Cash withdrawals in RWF
79.17 74.79 74.67
Cash in Foreign currencies
5.27 7.55
Cheques processed in cash
6.18 7.61 7.29
Cheques in transfers 4.28 3.27 4.09 Certified cheques 1.49 1.42 Traveller’s Cheques 0.07 0.05 ATM Withdrawals 10.33 7.2 4.75 POS 0.04 0.25 0.17 Source: NBR, Banking Supervision Department
One notices that in terms of volume, cash comes in the first position (75%) for all payment
instruments used in Rwanda; all other payment instruments were used at a percentage
lower than 10% but with a slight increase during the last three years. However, the use of
payment cards via ATM and Points of Sales remained low (7.4% in 2005 and 4.9% in 2006).
Table 84: Payment Instruments in terms of transactions value
Instrument 2004 2005 2006 Cash withdrawals in RWF
47.22 45.19 46.08
Cash in Foreign currencies
- 11.9 12.47
Cheques processed in cash
26.64 23.81 18.29
Cheques in transfers 25.56 12.75 15.59 Certified cheques - 5.00 4.43 Traveller’s Cheques - 0.63 2.16 ATM Withdrawals 0.58 0.47 0.95 POS 0.0001 0.29 0.04 Source: NBR, Bank Supervision Department
In terms of value, cash always comes in the first place with 46% in 2006, and payment
through accounts (cheques and transfer orders given during the clearing house) comes in
the second position with 38% of the total; as for payment cards, their use is still limited as
it reached only 0.8% in 2005 and 1% in 2006.
Thus, it should be note that POS/ATM, which are generally payment instruments that
offset cash, are still untapped despite the SIMTEL forefront software. However, one may
125
hope that with the new dynamics in prospect in SIMTEL, on the one hand, and the adoption
of "API" project by banks and service companies on the other hand, the use of cash will be
reduced in favour of cards and other payment operations on accounts.
Concerning the continuation of the implementation of the recommendations contained in
the study paper of stocktaking of National Payment System, NBR approved, in collaboration
with banks, service enterprises and SIMTEL, the proposal of the IBCTI consultancy firm on
the implementation of the API Project "Connection of banks to service firms". The
implementation of API Project is currently underway and will be operational by March
2007.
CHAPTER IV: BACKUP ACTIVITIES
IV.1 STATUTORY MANAGEMENT ORGANS OF THE BANK 1. Board of Directors
Within the framework of defining the general policy of the bank and monitoring its
management, the Board of Directors of the National bank of Rwanda held four ordinary
sessions and three extraordinary sessions in accordance with the existing regulations during
the year 2006. During these sessions, technical issues related to the Bank missions and
administrative and financial management were dealt with.
As regards technical issues, the Board reviewed monetary developments on a quarterly
basis and, where necessary, recommendations were made.
The Board paid particular attention to banks and micro-finance institutions supervision. It
is within this context that the Board approved the law governing micro-finance activities,
which will also cover savings and credit co-operatives. Moreover, the Board gave views on
the implementation of the rescue plans for some institutions and closely followed up the
process of liquidating eight MFI’s which were closed.
The challenges of the Rwandan Financial Sector as well as the priorities of Banking
Supervision during the period under review were subject to a thorough review by the
Board. At this level, the most considered were reviewing and adopting the new draft
banking law by the Board of Directors and the approval of “Opportunity International
Bank”, which specializes in micro-finance services.
126
Moreover, the Board considered the alarming financial standing of a bank, and a
restructuring programme for the same bank was put in place and its recapitalisation has
been recommended.
In the area of foreign exchange, the Board adopted new foreign exchange regulations,
which mark a new stage in the liberalization strengthening of foreign exchange system in
Rwanda. The major reforms introduced relate to the elimination of all ceilings on current
operations that are again provided within the regulations, total liberalization of foreign
currency accounts and a larger opening towards total liberalization of capital operations.
During the period under review, the Board also examined administrative and financial
issues of the Bank. Taking into consideration the action plan for the development of the
financial sector approved by the Government, inter alia, integrating the supervision of non
banking financial institutions within the NBR as well as the strengthening of the service in
charge of the payment system supervision by making it autonomous, the Board of Directors
approved the proposal of the Management of the Bank which consists in putting in place
two new units, namely the Department in charge of Non-banking Financial Institutions
Supervision and an autonomous division in charge of payment system supervision.
In conformity with the policy of decentralization of public services adopted by the
Government, the Board closely followed-up the preliminary works for the opening of the
Western branch in CYANGUGU, whose inauguration was expected in January 2007. It also
provided the foundations for the opening of another new branch in the Eastern Province at
RWAMAGANA.
Furthermore, the Board examined the case of Rehabilitation/Extension of the Bank’s
Building. To this end, after the analysis of the conclusions of the technical analysis jointly
carried out by the Bank’s technicians and the Tender Board, the Board approved the idea
of drafting a simple project aimed at solving only the major problems of the
waterproofness of the building and extension on the 1st and 4th floor.
As always done annually, in March 2006, the Board of Directors approved the Annual Report
and the Financial Statements of the financial year 2005 while in July and December 2006,
it respectively examined and approved the proposals on the documents on the 2006 budget
revision and those in relation to the 2007 budget.
127
2. Management Committee
The Management Committee which is composed of Governor and the Vice - Governor, is a
coordinating and a consulting organ among the Bank management members. Through its
regular meetings, the NBR management committee ensures the smooth functioning of
different organs of the bank and implementation of the Board of Directors’ decisions.
Within the framework of monetary and exchange rate policy implementation, the
management committee monitors on a daily basis the activities of the monetary policy and
exchange committee (CPMC) in order to keep monetary aggregates developments in line
with macro-economic programme adopted by the government. Thus, during the year 2006,
the examination of monetary developments showed that despite BNR interventions aiming
at liquidity control, money supply considerably deviated from its forecasted level within
the economic program of the year; however, other monetary targets, namely reserve
money and NBR net foreign assets were met. Following the weaknesses in the financial
system generally identified in 2005 by the World Bank and IMF joint mission, one of the
priorities of the Management Committee was to follow a proposal on the Financial Sector
development plan in Rwanda. Four wide areas were concerned: (1) banking and micro
finance Institutions and access to the credit, (2) pension funds and insurance activities, (3)
the capital market, as well as (4) payment systems. During the year 2006, a series of
actions to be implemented within 18 coming months were approved by the Cabinet, which
started the process of their implementation.
With regard to the foreign exchange policy, the Management Committee closely followed-
up the reforms operated in the exchange control regulations revision and supervised many
NBR exchange operations which had to do with the purchase and sale of foreign currencies
to meet the banks, government and other customers’ needs, while keeping a level of
foreign currency cash resources within the economic program targets.
As was in the previous years, the Management Committee concentrated its effort on the
Banking system monitoring activities, focusing on on-site and off-site inspection of
financial institutions. The follow-up activities of banks with problems were also included
on its agenda. It is within this context that the Management Committee was involved in the
regular management of the restructuring programm of a bank and its recapitalisation
process.
128
The management of micro-finance institutions was one of the major concerns of the
monetary authorities in the year 2006. The idea of establishing a national policy aimed at
accompanying and stimulating the development of the micro-finance sector materialised
with a law, the on-site and off-site inspection missions as well as consultation meetings
with heads of MFI’s experiencing difficulties informed the Management Committee about
the real situation of MFI’s and were consequently enabled to guide its decisions.
As regards the modernization of the National Payment System, the actions of the
Management Committee were carried out through effective implementation of the
recommendations in the Report on the study of "stock tacking" of the payment system,
which put forward a certain number of projects, especially the one on public transport of
funds, procurement of the international payment cards, bank cheques, netting of low
amount… The financial restructuring of a long awaited SIMTEL finally was effective through
the impetus given by monetary authorities. Within this framework, an American company -
KANBAY, specialized in electronic money decided to join SIMTEL in joint venture and
negotiations on this proposal are underway.
The administrative management of the Bank was also part of the schedule of conditions of
the Management Committee in the year 2006 with the aim of fulfilling the major missions
of the Bank. The most important achievements include the coordination of the
development of the action plans of the Bank units of as well as various reports, the
evaluation of the Bank staff performance, procedures elaboration, the auditing reports on
the operations of the Bank review, the ICT independence project management, etc.
IV.2 HUMAN RESOURCE MANAGEMENT
As of December 31, 2006, the Bank staff totalled 453 compared to 469 on December 31
2005. During the year 2006, the Bank recruited 13 employees, of which 3 were for the
newly opened western Bank Branch.
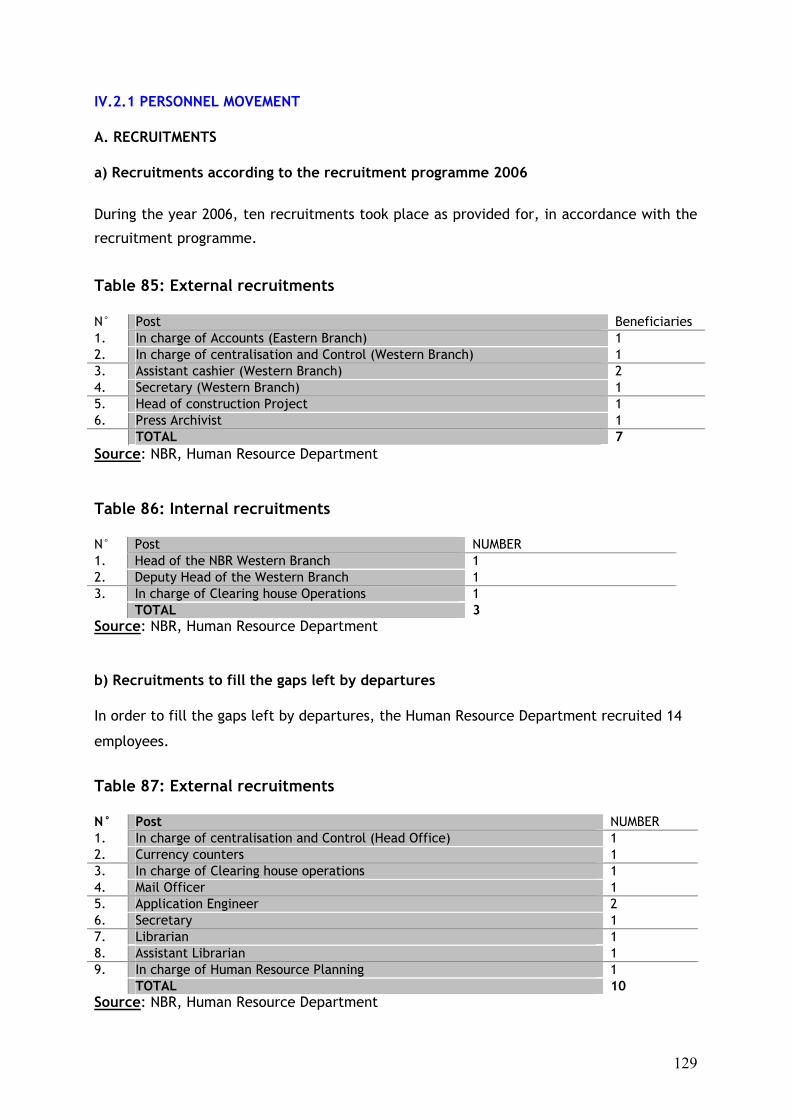
129
IV.2.1 PERSONNEL MOVEMENT A. RECRUITMENTS a) Recruitments according to the recruitment programme 2006 During the year 2006, ten recruitments took place as provided for, in accordance with the
recruitment programme.
Table 85: External recruitments N° Post Beneficiaries 1. In charge of Accounts (Eastern Branch) 1 2. In charge of centralisation and Control (Western Branch) 1 3. Assistant cashier (Western Branch) 2 4. Secretary (Western Branch) 1 5. Head of construction Project 1 6. Press Archivist 1 TOTAL 7 Source: NBR, Human Resource Department Table 86: Internal recruitments N° Post NUMBER 1. Head of the NBR Western Branch 1 2. Deputy Head of the Western Branch 1 3. In charge of Clearing house Operations 1 TOTAL 3 Source: NBR, Human Resource Department b) Recruitments to fill the gaps left by departures In order to fill the gaps left by departures, the Human Resource Department recruited 14
employees.
Table 87: External recruitments N° Post NUMBER 1. In charge of centralisation and Control (Head Office) 1 2. Currency counters 1 3. In charge of Clearing house operations 1 4. Mail Officer 1 5. Application Engineer 2 6. Secretary 1 7. Librarian 1 8. Assistant Librarian 1 9. In charge of Human Resource Planning 1 TOTAL 10 Source: NBR, Human Resource Department
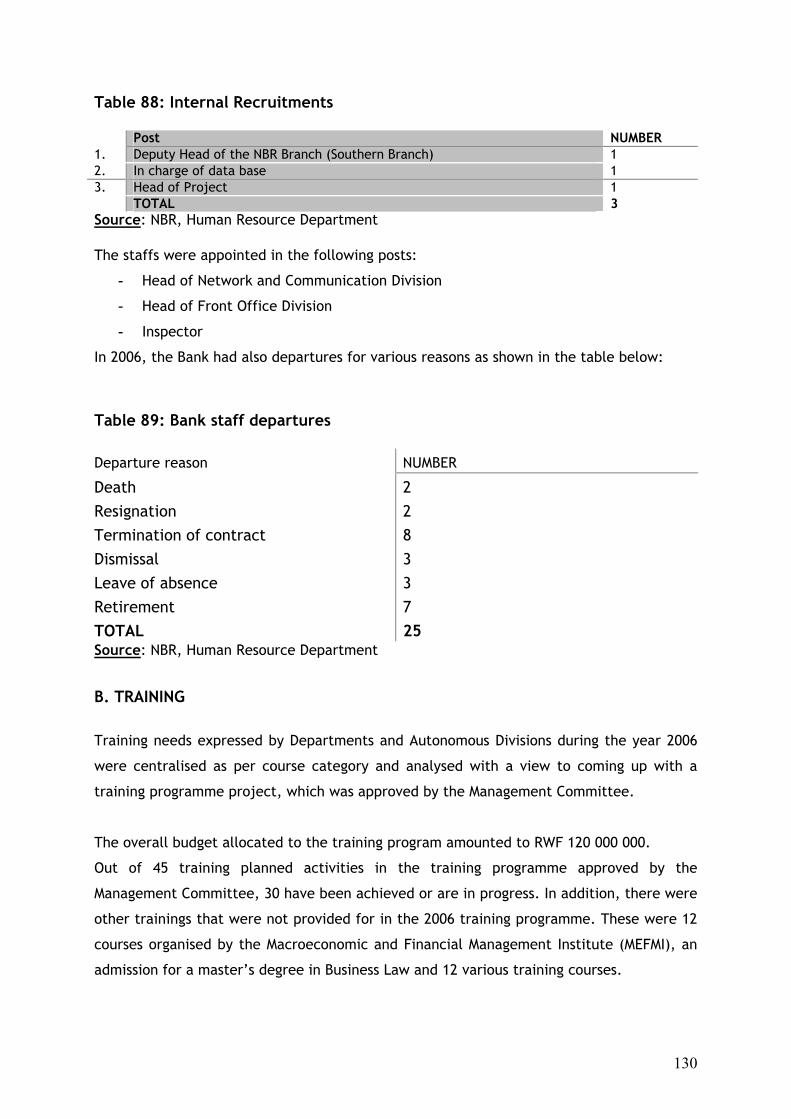
130
Table 88: Internal Recruitments Post NUMBER 1. Deputy Head of the NBR Branch (Southern Branch) 1 2. In charge of data base 1 3. Head of Project 1 TOTAL 3 Source: NBR, Human Resource Department The staffs were appointed in the following posts:
- Head of Network and Communication Division
- Head of Front Office Division
- Inspector
In 2006, the Bank had also departures for various reasons as shown in the table below:
Table 89: Bank staff departures Departure reason NUMBER
Death Resignation Termination of contract Dismissal Leave of absence Retirement TOTAL
2 2 8 3 3 7 25
Source: NBR, Human Resource Department B. TRAINING
Training needs expressed by Departments and Autonomous Divisions during the year 2006
were centralised as per course category and analysed with a view to coming up with a
training programme project, which was approved by the Management Committee.
The overall budget allocated to the training program amounted to RWF 120 000 000.
Out of 45 training planned activities in the training programme approved by the
Management Committee, 30 have been achieved or are in progress. In addition, there were
other trainings that were not provided for in the 2006 training programme. These were 12
courses organised by the Macroeconomic and Financial Management Institute (MEFMI), an
admission for a master’s degree in Business Law and 12 various training courses.
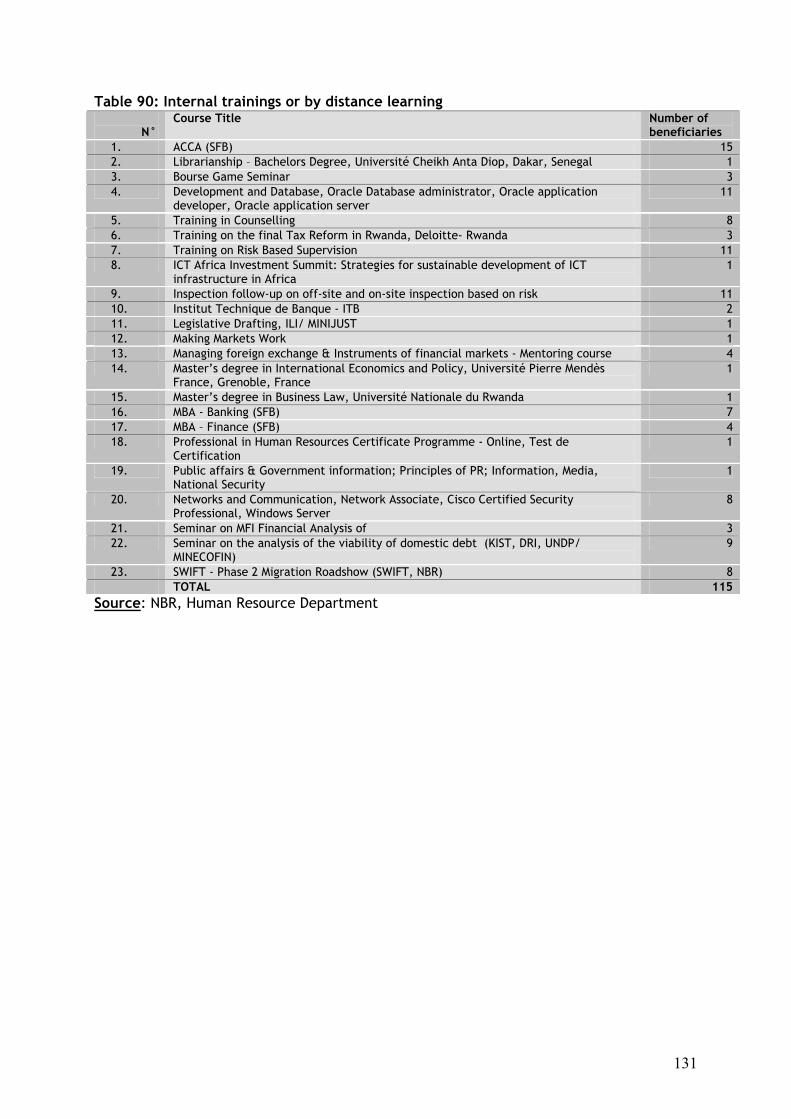
131
Table 90: Internal trainings or by distance learning N°
Course Title Number of beneficiaries
1. ACCA (SFB) 15 2. Librarianship – Bachelors Degree, Université Cheikh Anta Diop, Dakar, Senegal 1 3. Bourse Game Seminar 3 4. Development and Database, Oracle Database administrator, Oracle application
developer, Oracle application server 11
5. Training in Counselling 8 6. Training on the final Tax Reform in Rwanda, Deloitte- Rwanda 3 7. Training on Risk Based Supervision 11 8. ICT Africa Investment Summit: Strategies for sustainable development of ICT
infrastructure in Africa 1
9. Inspection follow-up on off-site and on-site inspection based on risk 11 10. Institut Technique de Banque - ITB 2 11. Legislative Drafting, ILI/ MINIJUST 1 12. Making Markets Work 1 13. Managing foreign exchange & Instruments of financial markets - Mentoring course 4 14. Master’s degree in International Economics and Policy, Université Pierre Mendès
France, Grenoble, France 1
15. Master’s degree in Business Law, Université Nationale du Rwanda 1 16. MBA - Banking (SFB) 7 17. MBA – Finance (SFB) 4 18. Professional in Human Resources Certificate Programme - Online, Test de
Certification 1
19. Public affairs & Government information; Principles of PR; Information, Media, National Security
1
20. Networks and Communication, Network Associate, Cisco Certified Security Professional, Windows Server
8
21. Seminar on MFI Financial Analysis of 3 22. Seminar on the analysis of the viability of domestic debt (KIST, DRI, UNDP/
MINECOFIN) 9
23. SWIFT - Phase 2 Migration Roadshow (SWIFT, NBR) 8 TOTAL 115
Source: NBR, Human Resource Department
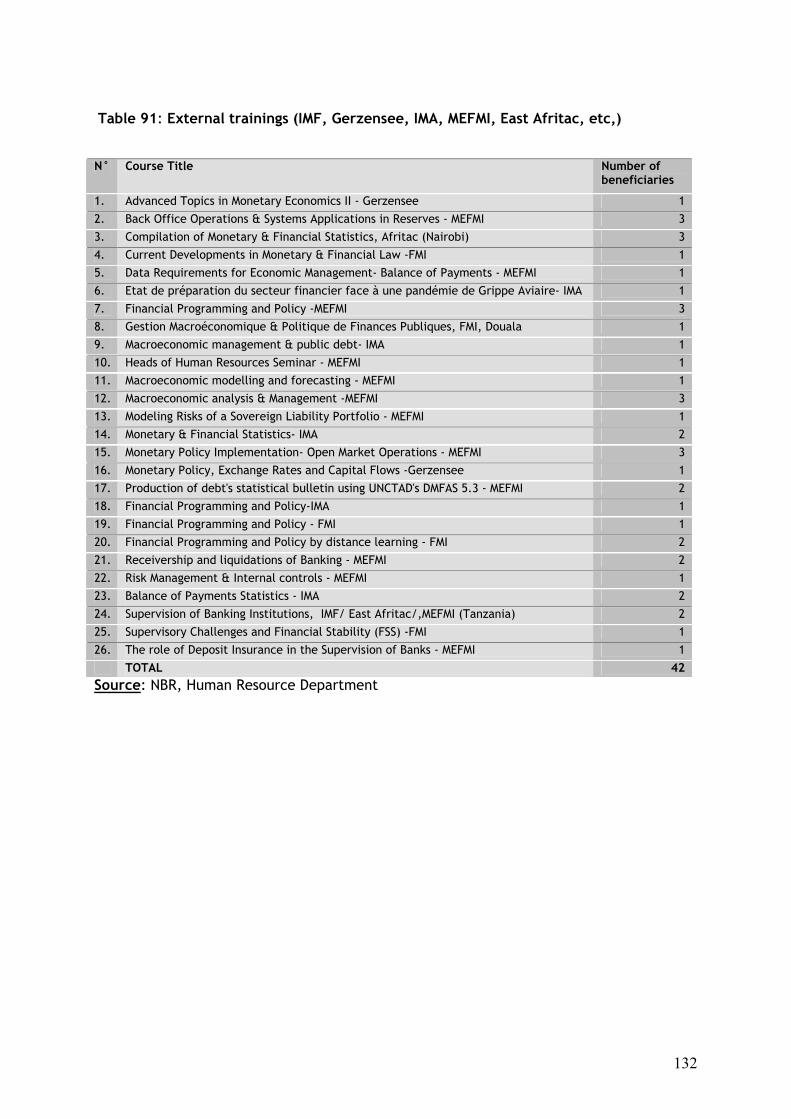
132
Table 91: External trainings (IMF, Gerzensee, IMA, MEFMI, East Afritac, etc,)
N° Course Title Number of beneficiaries
1. Advanced Topics in Monetary Economics II - Gerzensee 1 2. Back Office Operations & Systems Applications in Reserves - MEFMI 3 3. Compilation of Monetary & Financial Statistics, Afritac (Nairobi) 3 4. Current Developments in Monetary & Financial Law -FMI 1 5. Data Requirements for Economic Management- Balance of Payments - MEFMI 1 6. Etat de préparation du secteur financier face à une pandémie de Grippe Aviaire- IMA 1 7. Financial Programming and Policy -MEFMI 3 8. Gestion Macroéconomique & Politique de Finances Publiques, FMI, Douala 1 9. Macroeconomic management & public debt- IMA 1 10. Heads of Human Resources Seminar - MEFMI 1 11. Macroeconomic modelling and forecasting - MEFMI 1 12. Macroeconomic analysis & Management -MEFMI 3 13. Modeling Risks of a Sovereign Liability Portfolio - MEFMI 1 14. Monetary & Financial Statistics- IMA 2 15. Monetary Policy Implementation- Open Market Operations - MEFMI 3 16. Monetary Policy, Exchange Rates and Capital Flows -Gerzensee 1 17. Production of debt's statistical bulletin using UNCTAD's DMFAS 5.3 - MEFMI 2 18. Financial Programming and Policy-IMA 1 19. Financial Programming and Policy - FMI 1 20. Financial Programming and Policy by distance learning - FMI 2 21. Receivership and liquidations of Banking - MEFMI 2 22. Risk Management & Internal controls - MEFMI 1 23. Balance of Payments Statistics - IMA 2 24. Supervision of Banking Institutions, IMF/ East Afritac/,MEFMI (Tanzania) 2 25. Supervisory Challenges and Financial Stability (FSS) -FMI 1 26. The role of Deposit Insurance in the Supervision of Banks - MEFMI 1
TOTAL 42 Source: NBR, Human Resource Department
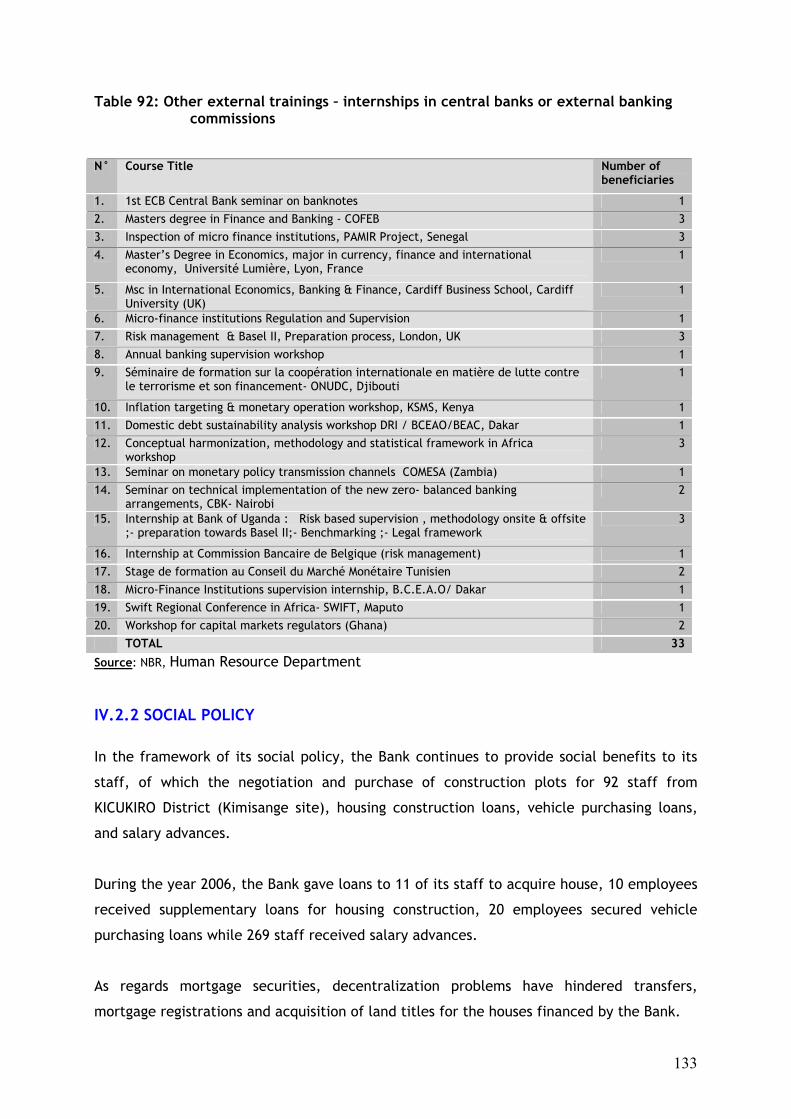
133
Table 92: Other external trainings – internships in central banks or external banking commissions
N° Course Title Number of
beneficiaries
1. 1st ECB Central Bank seminar on banknotes 1 2. Masters degree in Finance and Banking - COFEB 3 3. Inspection of micro finance institutions, PAMIR Project, Senegal 3 4. Master’s Degree in Economics, major in currency, finance and international
economy, Université Lumière, Lyon, France 1
5. Msc in International Economics, Banking & Finance, Cardiff Business School, Cardiff University (UK)
1
6. Micro-finance institutions Regulation and Supervision 1 7. Risk management & Basel II, Preparation process, London, UK 3 8. Annual banking supervision workshop 1 9. Séminaire de formation sur la coopération internationale en matière de lutte contre
le terrorisme et son financement- ONUDC, Djibouti 1
10. Inflation targeting & monetary operation workshop, KSMS, Kenya 1 11. Domestic debt sustainability analysis workshop DRI / BCEAO/BEAC, Dakar 1 12. Conceptual harmonization, methodology and statistical framework in Africa
workshop 3
13. Seminar on monetary policy transmission channels COMESA (Zambia) 1 14. Seminar on technical implementation of the new zero- balanced banking
arrangements, CBK- Nairobi 2
15. Internship at Bank of Uganda : Risk based supervision , methodology onsite & offsite ;- preparation towards Basel II;- Benchmarking ;- Legal framework
3
16. Internship at Commission Bancaire de Belgique (risk management) 1 17. Stage de formation au Conseil du Marché Monétaire Tunisien 2 18. Micro-Finance Institutions supervision internship, B.C.E.A.O/ Dakar 1 19. Swift Regional Conference in Africa- SWIFT, Maputo 1 20. Workshop for capital markets regulators (Ghana) 2
TOTAL 33
Source: NBR, Human Resource Department IV.2.2 SOCIAL POLICY In the framework of its social policy, the Bank continues to provide social benefits to its
staff, of which the negotiation and purchase of construction plots for 92 staff from
KICUKIRO District (Kimisange site), housing construction loans, vehicle purchasing loans,
and salary advances.
During the year 2006, the Bank gave loans to 11 of its staff to acquire house, 10 employees
received supplementary loans for housing construction, 20 employees secured vehicle
purchasing loans while 269 staff received salary advances.
As regards mortgage securities, decentralization problems have hindered transfers,
mortgage registrations and acquisition of land titles for the houses financed by the Bank.
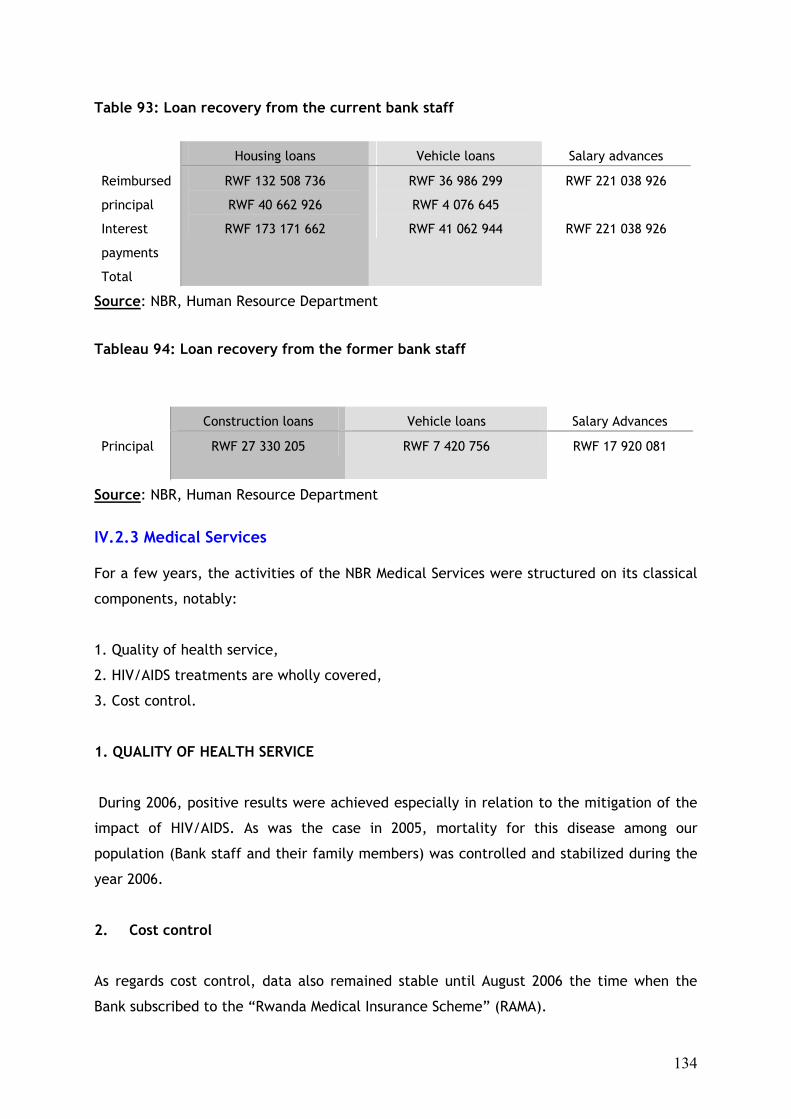
134
Table 93: Loan recovery from the current bank staff
Housing loans Vehicle loans Salary advances
Reimbursed
principal
Interest
payments
Total
RWF 132 508 736
RWF 40 662 926
RWF 173 171 662
RWF 36 986 299
RWF 4 076 645
RWF 41 062 944
RWF 221 038 926
RWF 221 038 926
Source: NBR, Human Resource Department
Tableau 94: Loan recovery from the former bank staff
Construction loans Vehicle loans Salary Advances
Principal
RWF 27 330 205 RWF 7 420 756 RWF 17 920 081
Source: NBR, Human Resource Department IV.2.3 Medical Services For a few years, the activities of the NBR Medical Services were structured on its classical
components, notably:
1. Quality of health service,
2. HIV/AIDS treatments are wholly covered,
3. Cost control.
1. QUALITY OF HEALTH SERVICE
During 2006, positive results were achieved especially in relation to the mitigation of the
impact of HIV/AIDS. As was the case in 2005, mortality for this disease among our
population (Bank staff and their family members) was controlled and stabilized during the
year 2006.
2. Cost control
As regards cost control, data also remained stable until August 2006 the time when the
Bank subscribed to the “Rwanda Medical Insurance Scheme” (RAMA).
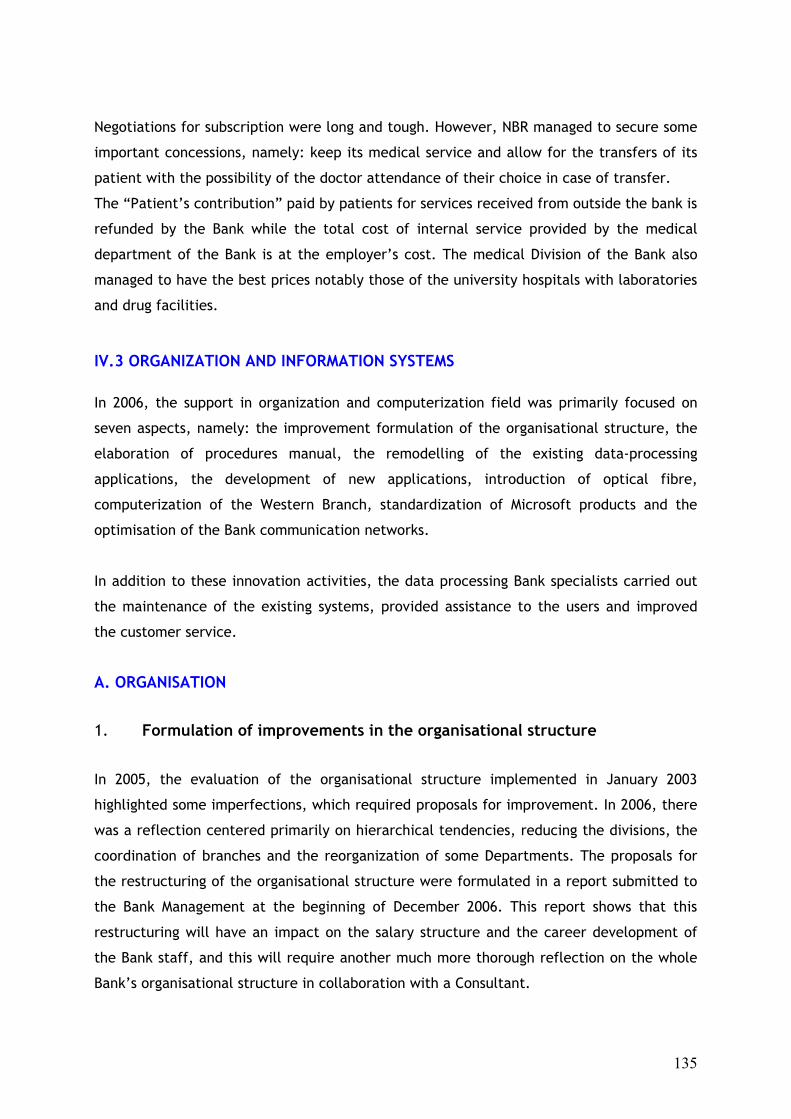
135
Negotiations for subscription were long and tough. However, NBR managed to secure some
important concessions, namely: keep its medical service and allow for the transfers of its
patient with the possibility of the doctor attendance of their choice in case of transfer.
The “Patient’s contribution” paid by patients for services received from outside the bank is
refunded by the Bank while the total cost of internal service provided by the medical
department of the Bank is at the employer’s cost. The medical Division of the Bank also
managed to have the best prices notably those of the university hospitals with laboratories
and drug facilities.
IV.3 ORGANIZATION AND INFORMATION SYSTEMS In 2006, the support in organization and computerization field was primarily focused on
seven aspects, namely: the improvement formulation of the organisational structure, the
elaboration of procedures manual, the remodelling of the existing data-processing
applications, the development of new applications, introduction of optical fibre,
computerization of the Western Branch, standardization of Microsoft products and the
optimisation of the Bank communication networks.
In addition to these innovation activities, the data processing Bank specialists carried out
the maintenance of the existing systems, provided assistance to the users and improved
the customer service.
A. ORGANISATION
1. Formulation of improvements in the organisational structure
In 2005, the evaluation of the organisational structure implemented in January 2003
highlighted some imperfections, which required proposals for improvement. In 2006, there
was a reflection centered primarily on hierarchical tendencies, reducing the divisions, the
coordination of branches and the reorganization of some Departments. The proposals for
the restructuring of the organisational structure were formulated in a report submitted to
the Bank Management at the beginning of December 2006. This report shows that this
restructuring will have an impact on the salary structure and the career development of
the Bank staff, and this will require another much more thorough reflection on the whole
Bank’s organisational structure in collaboration with a Consultant.

136
2. Elaboration of the manual procedure
The elaboration of the manual procedure is a very hard exercise, which mobilizes several
bank staffs as well as the Bank Management. The objective is to describe as clearly as
possible all the complex risky operations that require several people to intervene. This
exercise started in August 2004, and up to now out of about 250 manual procedures, 200
have already been approved and other 50 procedures are to be drafted.
3. Elaboration of the general classification plan
The Bank global thematic directory made up of classes, sub-classes and sub-sub classes was
worked out by an internal team of the Bank. It reflects all the processed documents and
will make an invaluable helper in the development of the general classification Plan, which
will be finalized in 2007 under external consultant supervision. A consultant is awaited to
validate the work already done, train the stakeholders, work out the general classification
Plan and ensure its implementation.
4. Feasibility study for the introduction of electronic signature at NBR
The electronic signature is a new practice but which is growing rapidly especially in
developed countries. It makes it possible to significantly reduce the work time and the use
of paper. A preliminary study revealed that only one division in the Banking Operations
Department of the Bank signs more than 10 000 signatures per day, and through an
extrapolation one can realize that the volume of work in connection with the manual
signature at NBR is impressive if not excessive. It is in this context that a study on the
opportunity of introducing electronic signature and the constraints related to this
innovation in the daily management of the Bank is being conducted. Currently the study is
at the stage of categorization of the documents according to the level of risk.
4. The user trainings For about 7 years, through its data processing bank specialists, the Bank has organized
training sessions each year, intended for its entire office staff. The purpose of this training
is to strengthen the potential of its executives for better utilisation of the data-processing
tools put at their disposal. In 2006, training in Lotus Notes was conducted for 21 senior
staff of the Bank out of 25 candidates who had initially registered. Other staff received
training in other office automation modules such as the mastery of data-processing tool,
Word, Excel and Power Point
137
B. OFFICE AUTOMATION AND DATA PROCESSING
1. Remodelling of existing data-processing applications
In the context of its wish to obtain an effective and modern information system, the
NBR was committed to breaking with old practices which made it too dependent on
external ICT service providers. Thus, at the end of 2005, it launched a far-reaching
project consisting in redesigning the banking software set up in 1999. These are in
particular an accounting and financial system, human resource management system,
risk centralisation and non performing loans, exchange and logical management. In
2006, an in-depth training was offered to ten data processing bank staff specialists with
the aim of making them autonomous as far as modern technology is concerned. This
training was followed by a design phase jointly conducted by the E-Tools partner.
2. Development of new applications
Still in partnership with E-Tools experts, the Bank intends to set up new developed
software with modern tools. It will have to do with Electronic Management of Documents,
the library, the management of special funds and credit lines. In 2006, the design of all
these applications was jointly carried out by E-Tools experts; the development has been
going on since November 2006, and the first applications are expected to be operational
around end of February 2007.
2. Installation and operations of the specialized applications
During the year 2006, SYGADE software installation of at NBR continued. Negotiations
between MINECOFIN, UNDP, UNCTAD and NBR ended; a three-year budget was programmed
and a planning of implementation was done and approved by four parties. Thus, NBR and
MINECOFIN will use this working tool. To this end, two Bank executives attended training in
advanced administration oracle.
4. DATA-PROCESSING NETWORK ACTIVITIES
A. Optic fibres introduction
Apart from the significance of exchanges that the Bank establishes with its partners, it still
needs to be connected to permanent and protected Internet, with a large bandwidth; the
optical fibre is the suitable solution. Thanks to this connection, NBR will make all its

138
communications through optical fibre, i.e. telephone calls, data exchange with branches,
data exchange with partners, connection to the Internet and possibly communication
through Videoconferences.
Rwanda Information and Technology Authority (RITA) is committed to finance Government
institutions connection to the optic fibre. It is within this framework that NBR has already
had a line from TERRACOM Server to its building. Taking into account the fact that internal
networks are not concerned by RITA Project, the Bank will allocate the initial budget to
the restructuring of its internal network so that it may benefit from the advantages
offered by the optic fibre.
B. Computerization of the Western Branch
Each time NBR opens a branch, computer and telephone networks are put in place as well
as equipments and application installation, head office connection, configuration of a
system allowing for online work with existing systems. This work is executed by an internal
team of the Bank.
C. Standardization of Microsoft Products.
Since 2004, the American Corporation, Microsoft, has been working in close collaboration
with Rwandan Institutions within the framework of vision 2020 by providing them with
favourable financial and technical conditions. A prerequisite to this collaboration is the
standardization of their software.
In 2006, NBR fulfilled this prerequisite and this allowed it to acquire new software
necessary for effective operation of its systems. The implementation of this software
required the presence of four Microsoft experts who worked in close collaboration with 8
Bank’s data-processing specialists for a period of two months. Currently, NBR has official
versions with licenses, which operate in protected platforms.
5. MANAGEMENT OF WHAT IS ALREADY IN EXISTANCE
A. Optimisation of communication costs The Bank’s telephone network has had many changes due to the increase in needs, the
evolution of the profession of the Bank as well as technology. However, these changes
139
were not accompanied by documentation, which caused serious maintenance problems. To
address this situation, a document discussing in details the weaknesses and strengths of
the telephone network was drafted. For a few months, the network has been more
available; faults and servicing time have considerably decreased.
B. Database Administration
In order to ensure the Disaster Recovery Plan, the database Administrator regularly saves
and restores data and also carries out the control and configuration of the Bank’s
information system.
In 2006, particularly important tasks were achieved, including, among other things, the
installation of a more powerful IBM P570 server, data migration, system control and
monitoring.
IV.4 INTERNAL AUDIT OF THE BANK’S OPERATIONS
As was in the previous year, during the year 2006, the choice of the operations to be
audited was based on the extent of risks identified in various activities of the Bank. The
audit approach adopted was the one based on the risks with a view to proposing corrective
measures in the event of failure of the internal audit system.
It’s within this framework that general auditing was conducted in activities pertaining to
Currency and Banking Operations, Monetary Policy, Reserve Management activities,
Banking Supervision activities, Budget management activities and Social Fund Division
activities. In addition, specific audits as well as other investigations commissioned by the
Bank Management were conducted.
IV.4.1. GENERAL AUDITING 1. Verification Auditing of the Back Office Accounts
The audit mission revealed that, generally, internal control systems aimed at mitigating
the risks of errors, omissions or irregularities in the computation and outcome of
international operations are in place and operational within Back Office. Tools are entered
according to accounting practices generally accepted.
However, the audit mission formulated recommendations to improve:

140
- regularity and exhaustiveness of reconciliation of accounts in foreign currencies;
- reconciliation of deposit operations
- parameterisation of accounting operations; and
- Procedure manual.
2. Auditing of banking supervision
The audit mission observed with satisfaction that the supervision regularly follows-up the
bank statements and compliance with the chart of accounts as support to reliable data
production. However, weaknesses were identified and recommendations were made to
strengthen banking supervision and make it more effective.
3. Auditing of budget management activities
The audit mission analysed operations relating to budgetary control in accordance with the
audit program approved by the Bank Management and, at the end of the evaluation of the
internal control system put in place to control the Bank expenditures, the following major
observations were made:
The team noted with satisfaction that the Budget Division prepares the budget for each
financial year and carries out budget audit in the course of the year. However, some
weaknesses were identified and recommendations were made to strengthen the internal
control system in place.
4. Auditing intervention activities on the money market
At the end of the audit mission carried out on money market operations, the Internal
Control Department found that the procedures for intervention on money market are well
followed and that the results are relatively satisfactory.
However, some weaknesses were identified, and made recommendations constitute a
guide to a reflection aimed at making money market interventions more effective.
5. Auditing of the Social Fund Division activities

141
The audit mission analysed operations pertaining to the Social Fund activities in
accordance with the audit program approved by the Bank Management and, at the end of
the evaluation of the internal control system put in place to prevent and control insolvency
risk, the following main observations were made.
The team of auditors noted with satisfaction that the Social Fund assisted by CGFS,
deployed much effort to put in place regulations (instructions and procedures) for staff
loan and salary advance management.
Recommendations were made to strengthen the internal control system in place.
6. Auditing the quality of the customer service After reviewing the operations pertaining to the quality of services provided by NBR to its
customers, the audit mission in general found that the service provided to the customers
seems to be satisfactory, but with some weaknesses requiring particular attention.
Recommendations were made to strengthen the internal control system in place.
IV.4.2. SPECIFIC AUDITS 1. Audit of the safe
The audit mission found that physical cash resources of the safe tallied with the account
and extra-account balance and that the internal control systems of the safe ran smoothly.
However, some weaknesses were identified and recommendations made to strengthen the
internal control system in place.
2. Unexpected Auditing in areas of Cash
Fourteen (14) audits of cash resources were carried out during the year 2006; 12 at the
Major counters of the head office and one in each of the two branches. It was noted that
the internal system control in place is suitable and operates effectively.
However, some weaknesses were identified during auditing the bank branches and
recommendations were made to strengthen the internal control system in place.

142
3. Data provided to the IMF in form of Technical Memorandum of Understanding (TMU)
Twelve opinions of the audit were submitted to the Bank Management as regards the
reliability of the financial statistical data provided to the IMF. The monthly data
forwarded to the IMF were regularly checked and corrected in consultation with the
Research Department and other data producing Departments, before they were
forwarded to the IMF.
4. Auditing the Bank’s procurement process
The audit mission appreciated the safety plan put in the procurement process and the
invoices payment, but it also noted weaknesses in procurement management.
Recommendations were made to strengthen the internal control system in place.
5. Auditing the reconciliation of accounts
In general, the audit mission made led to some improvements in the accounts
reconciliation, especially with regard to the reconciliation of foreign corresponding
accounts. However, much effort is required for clearing accounts where irregularities were
identified.
Recommendations were made to strengthen the internal control system in place.
IV.4.3 Investigations commissioned by the Bank Management • Investigation on the new transport system at NBR
The audit mission found that the new transport system for the bank staff on duty is
beneficial in terms of cost and speed.
The advantage of the system is that it is decentralised. Thus Departments in need of
transport do not have to wait for the availability of drivers or vehicles; the authorisation is
immediately given and the bank staff does his/her work fast.
However, some weaknesses were identified and recommendations were made to
strengthen the internal control system in place.
143
IV.5 LEGAL MATTERS
In 2006, the major activities in judicial area relate to the drafting of the legal regulations
pertaining to the National Bank of Rwanda mission as well as the management of
contentious issues.
Thus, the Bank’s Legal Division actively participated in the drafting of many legal
regulations, which were adopted by the Government during the year. The regulations
adopted are the following:
- The regulation governing the National Bank of Rwanda whose aim was to update the
law n° 11/97 of 26 July 1997 on the statutes of the National Bank of Rwanda (law in
force);
- The regulation on the organization of the banking activities whose aim is to update
the law governing banks and other financial institutions (law in force);
- The regulation governing the prevention and suppression of money laundering and
terrorism financing;
- The regulation pertaining to the establishment of a Centre for Financial Information
Processing;
- The regulation in relation to the organization of micro finance activities.
In addition, the Legal Division took part in negotiations between the National Bank of
Rwanda and the Bank of the Republic of Burundi pertaining to the litigation of SDR 287
170.27 outstanding since 1992. These negotiations led to the recovery of SDR 216 823.65 in
favour of the National Bank of Rwanda
Finally, following the closure of some micro finance institutions by the NBR, the Legal
Division ensured the management of the contentious issues relating to these MFI’s until
court orders for their liquidation were obtained.
IV.6 OTHER BACKUP ACTIVITIES
In 2006, other backup activities concerned investments as well as maintenance and
security work. The overall amount of the investments was around RWF 600 million and
primarily related to computer equipments (80%), machines (7%), material and furniture

144
(5%), a light van for money transportation (4 %) and the procurement of a plot for the
construction of the Northern Branch (4%).
Within the areas of security, the management of the overall security system is in the final
phase of final post-acceptance (with only one year of maintenance freely granted until the
end of February 2007) and ways and means were examined so as to sign a maintenance
contract with a South-African firm in February 2007.
Concerning fire control, the National Police, which currently has a fire protection service
for Kigali City, was contacted to provide a free training to the Bank’s personnel on the
handling of some fire protection devices and, in principle, an agreement was reached.
PART III: FINANCIAL STATEMENT AS AT 31-12-2006
NATIONAL BANK OF RWANDA
DIRECTORS’ REPORT

2
AND
FINANCIAL STATEMENTS
31 DECEMBER 2006
GRANT THORNTON Chartered Accountants

NATIONAL BANK OF RWANDA DIRECTORS’ REPORT AND FINANCIAL STATEMENTS FOR THE YEAR ENDED 31 DECEMBER 2006
TABLE OF CONTENTS Board of Directors Directors’ Report Financial Reporting Responsibilities Auditors’ Report Income Statement Balance Sheet Statement of Changes in Equity Cash Flow Statement Notes to the Financial Statements
NATIONAL BANK OF RWANDA DIRECTORS’ REPORT AND FINANCIAL STATEMENTS FOR THE YEAR ENDED 31 DECEMBER 2006
1
ORGANISATION STRUCTURE OF THE BANK Board of Directors Mr. François KANIMBA Mrs. Consolata RUSAGARA Mr. Victor SHINGIRO Mr. Uzziel NDAGIJIMANA Mr. Prosper MUSAFIRI Mr. Cyrille NDENGEYINGOMA
Governor of the National Bank of Rwanda and Chairman of the Board of Directors Deputy Governor and Member of the Board of Directors Board Members
AUDIT COMMITTEE Mr. Manassé TWAHIRWA Mr. Gaston MPATSWE Mrs. Madeleine NIRERE
Chairman of the Audit Committee Member of the Audit Committee Member of the Audit Committee
REGISTERED OFFICE Avenue Paul VI P.O Box 531 Kigali, Rwanda EXTERNAL AUDITORS Grant Thornton Chartered Accountants Fairfax House 21, Mgr Gonin Street Port Louis MAURITIUS
LAWYER Mr. François Xavier RUTAGENGWA Avenue Paul VI P.O Box 531 Kigali, Rwanda
NATIONAL BANK OF RWANDA DIRECTORS’ REPORT AND FINANCIAL STATEMENTS FOR THE YEAR ENDED 31 DECEMBER 2006
2
ORGANISATION STRUCTURE OF THE BANK (Continued) Senior Management Team Mr. François KANIMBA - Governor Mrs. Consolata RUSAGARA - Deputy Governor Mr. Jean Damascène NKURUNZIZA - Director - Banking Operations Mr. Vianney KAGABO - Director – International Operations Mr. Philémon SAFARI - Director – Monetary and Financial Markets
Mr. Gakuba KABATI - Director – Accounting and Budgeting Mr. Théobald NKURANGA - Director - Information Technology Mr. Sylvère MUCUNGURA - Director - General Services Mrs. Angélique KANTENGWA - Director - Supervision Mr. Védaste HIMILI - Director – Internal Audit Mr. Musoni RUTAYISIRE - Director - Research Mr. Apollinaire MURASIRA - Director- Personnel Mr. Alexis HABIYAMBERE - Director- Governor’s Office Mr. François Xavier RUTAGENGWA- Legal Mr. Josué NKWAYA - Secretary of the Governor Mr. Dr. Juru RURANGANWA - Medical Department
NATIONAL BANK OF RWANDA DIRECTORS’ REPORT AND FINANCIAL STATEMENTS FOR THE YEAR ENDED 31 DECEMBER 2006
3
The directors are pleased to submit their report together with the audited financial statements for the year ended 31 December 2006. LEGAL FRAMEWORK The National Bank of Rwanda operates under the Law No. 11/97 dated 26 July 1997. MAIN ACTIVITIES The main activities of the Bank are to formulate and implement monetary policy in view of preserving the value of the local currency and to ensure its stability. To this end, it exercises control of money supply and credit, ensures the good functioning of the money market, the foreign exchange market, and the banking and financial system. INCOME STATEMENT The results for the year 2006 are set out on page 6. DIVIDEND The Board of Directors recommend the payment of a dividend of FRW’000 1,987,038 (2005: FRW 000’s 1,109,478) to the Government of Rwanda for the year ended 31 December 2006. DIRECTORS
The directors who served during the year 2006 until the date of this report are listed on page 1. AUDITORS The Minister of Finance and Economic Planning appointed Grant Thornton, Chartered Accountants, as
auditors of the Bank during the year 2006.
By order of the Board GOVERNOR …………………………………2007
NATIONAL BANK OF RWANDA DIRECTORS’ REPORT AND FINANCIAL STATEMENTS FOR THE YEAR ENDED 31 DECEMBER 2006
4
FINANCIAL REPORTING RESPONSIBILITIES The accompanying financial statements of the National Bank of Rwanda have been prepared by management in accordance with International Financial Reporting Standards (IFRS) as stated in Note 2 to these financial statements and the provisions of the Law No. 11/97 of 26/7/1997. These financial statements contain certain items that reflect best estimates and judgment of management. It is the responsibility of management to ensure that all data in the financial statements are reliable and that all information in the annual report is consistent with the financial statements. In support of its responsibility for the integrity and reliability of these financial statements and for the accounting system from which they are derived, management has developed and maintains a system of internal controls to provide reasonable assurance that transactions are properly authorized and recorded, that financial information is reliable, that the assets are safeguarded and liabilities recognized, and that the operations are carried out effectively. The Bank has an Internal Audit Department, whose functions include reviewing internal controls, including accounting and financial controls and their application on an ongoing basis. The Board of Directors is responsible for ensuring that management fulfills its responsibilities for financial reporting and internal controls. The Law No. 11/97 of 26 July 1997 requires the Bank to prepare its financial statements on a yearly basis which give a true and fair view of its financial position at the end of each year as well as of its operations and cash flows for the year then ended. It also requires that the Board of Directors keep accounting records that disclose with reasonable accuracy at any time the financial position of the Bank. The Board has also a general responsibility for taking such steps as are reasonably open to it to safeguard the assets of the Bank and to prevent and detect fraud and other irregularities. In the opinion of the Directors, the financial statements give a true and fair view of the Bank’s financial position as at 31 December 2006. The Directors assert that nothing has come to the attention that would adversely affect the going concern ability of the Bank in the forthcoming twelve months following the date of this report. Signed on behalf of the Board of Directors by: - ________________________________________________________ Governor Deputy Governor
………………………….2007
5
AUDITORS’ REPORT TO THE MINISTER OF FINANCE AND ECONOMIC PLANNING ON THE FINANCIAL STATEMENTS OF NATIONAL BANK OF RWANDA We have audited the financial statements of the National Bank of Rwanda (the Bank) on pages 6 to 27 which have been prepared in accordance with the accounting policies set out on pages 10 to 14. Directors’ responsibilities The directors are responsible for the preparation of the financial statements which are in accordance with and comply with International Financial Reporting Standards (IFRS) in so far as applicable to the Bank, and which present fairly the financial position of the Bank at 31 December 2006 and of its financial performance, changes in equity and cash flows for the year then ended. They are also responsible for safeguarding the assets of the Bank and hence for taking reasonable steps for the prevention and detection of fraud and other irregularities. Auditors’ responsibilities It is our responsibility to form an independent opinion, based on our audit, on those financial statements and to report our opinion to you. Basis of opinion We conducted our audit in accordance with International Standards on Auditing. An audit includes examination, on a test basis, of evidence relevant to the amounts and disclosures in the financial statements. It also includes an assessment of the significant estimates and judgments made by the directors in the preparation of the financial statements, and of whether the accounting policies are appropriate to the Bank’s circumstances, consistently applied and adequately disclosed. We planned and performed our audit so as to obtain all the information and explanations which we considered necessary in order to provide us with sufficient evidence to give reasonable assurance as to whether the financial statements are free from material misstatement. In forming our opinion, we also evaluated the overall adequacy of the presentation of information in the financial statements. We believe that our audit provides a reasonable basis for our opinion. We have no relationship with, or any interests in, the Bank other than in our capacity as auditors. Opinion In our opinion:
• The financial statements on pages 6 to 27 give a true and fair view of the state of affairs of the Bank as at 31 December 2006 and of its profit and cash flows for the year then ended
• The financial statements have been prepared in accordance with IFRS’s and comply with the
Law No. 11/97 of 26/7/1997 except in so far as the Bank has not considered it appropriate to do so, having regard to its functions and circumstances, as explained in Note 2 to these financial statements.
Grant Thornton Chartered Accountants Port-Louis, Mauritius Date: …………………..2007

6
NATIONAL BANK OF RWANDA INCOME STATEMENT FOR THE YEAR ENDED 31 DECEMBER 2006 Notes 2006 2005 Frw’ 000 Frw’ 000 Interest income 3 11,747,211 6,636,671 Interest expense 4 (4,097,966) (1,832,371) Net interest income 7,649,245 4,804,300 Net commissions and fees income 5 147,307 104,869 Profit on foreign exchange transactions 6 1,533,950 1,825,224 Other income 7 4,660,973 2,588,147 Net income before non interest expenses 13,991,475 9,322,540 Operating costs 8 (9,047,236) (7,029,820) Depreciation of foreign assets (2,022,124) (661,136) Profit for the year 2,922,115 1,631,584 The notes on pages 10 to 27 form an integral part of these financial statements
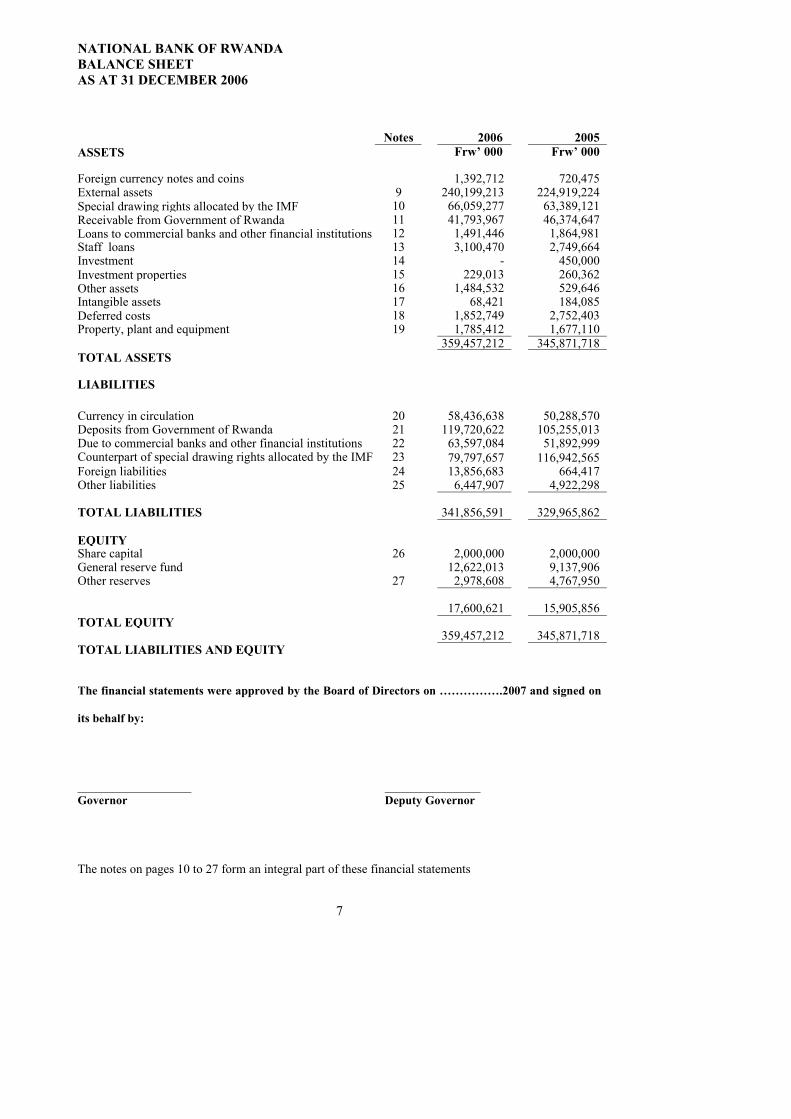
NATIONAL BANK OF RWANDA BALANCE SHEET AS AT 31 DECEMBER 2006
7
Notes 2006 2005 ASSETS Frw’ 000 Frw’ 000 Foreign currency notes and coins 1,392,712 720,475 External assets 9 240,199,213 224,919,224 Special drawing rights allocated by the IMF 10 66,059,277 63,389,121 Receivable from Government of Rwanda 11 41,793,967 46,374,647 Loans to commercial banks and other financial institutions 12 1,491,446 1,864,981 Staff loans 13 3,100,470 2,749,664 Investment 14 - 450,000 Investment properties 15 229,013 260,362 Other assets 16 1,484,532 529,646 Intangible assets 17 68,421 184,085 Deferred costs 18 1,852,749 2,752,403 Property, plant and equipment 19 1,785,412 1,677,110 359,457,212 345,871,718 TOTAL ASSETS LIABILITIES Currency in circulation 20 58,436,638 50,288,570 Deposits from Government of Rwanda 21 119,720,622 105,255,013 Due to commercial banks and other financial institutions 22 63,597,084 51,892,999 Counterpart of special drawing rights allocated by the IMF 23 79,797,657 116,942,565 Foreign liabilities 24 13,856,683 664,417 Other liabilities 25 6,447,907 4,922,298 TOTAL LIABILITIES 341,856,591 329,965,862 EQUITY Share capital 26 2,000,000 2,000,000 General reserve fund 12,622,013 9,137,906 Other reserves 27 2,978,608 4,767,950 17,600,621 15,905,856 TOTAL EQUITY 359,457,212 345,871,718 TOTAL LIABILITIES AND EQUITY The financial statements were approved by the Board of Directors on …………….2007 and signed on
its behalf by:
___________________ ________________ Governor Deputy Governor The notes on pages 10 to 27 form an integral part of these financial statements

NATIONAL BANK OF RWANDA STATEMENT OF CHANGES IN EQUITY FOR THE YEAR ENDED 31 DECEMBER 2006
8
Authorized and Issued
Share Capital
General Reserve
FundOther
Reserves
Total
Frw’ 000 Frw’ 000 Frw’000 Frw’ 000 At 1 January 2005 2,000,000 7,082,165 5,341,097 14,423,262 Profit for the year - 1,631,584 - 1,631,584 Transfer to reserves - (195,790) 195,790 - Transfer of reserves on foreign exchange fluctuations
- 619,947
(619,947)
-
Transfer to equity funds - - (36,679) (36,679) Gain on revaluation of foreign assets 19,038 19,038 Write back of currency printing costs
- - (131,349)
(131,349)
At 31 December 2005 2,000,000 9,137,906 4,767,950 15,905,856 At 1 January 2006 2,000,000 9,137,906 4,767,950 15,905,856 Profit for the year - 2,922,115 - 2,922,115 Transfer to reserves - (350,654) 350,654 - Transfer of reserves on foreign exchange fluctuations
- 2,022,124 (2,022,124)
-
Transfer to equity funds
- - (40,100)
(40,100) Gain on revaluation of foreign assets - - 53,577 53,577 Write back of currency printing costs - - (131,349) (131,349) Dividend paid in 2006 - (1,109,478) - (1,109,478) At 31 December 2006 2,000,000 12,622,013 2,978,608 17,600,621 The notes on pages 10 to 27 form an integral part of these financial statements

9
NATIONAL BANK OF RWANDA CASH FLOW STATEMENT FOR THE YEAR ENDED 31 DECEMBER 2006 Note 2006 2005 Frw’ 000 Frw’ 000 OPERATING ACTIVITIES
Net cash inflows from operating activities 29 (a)
11,513,961
41,710,012
CASH FLOW FROM INVESTING ACTIVITIES Acquisition of investments - (250,000) Acquisition of property, plant and equipment (1,303) (259,341) Purchase of intangible assets (580,306) (81,470) Proceeds from disposal of property, plant and equipment 3,407 93,895 Net cash outflows from investing activities (578,202) (496,916) CASH FLOW FROM FINANCING ACTIVITIES Dividend paid (1,109,477) - Currency in circulation 8,148,068 10,895,464 Net cash inflow from financing activities
7,038,591
10,895,464
Net increase in cash and cash equivalents 17,974,350 52,108,560 Cash and cash equivalents at 1 January 2006 225,639,699 178,441,198 Foreign exchange revaluation losses (2,022,124) (4,910,059) Cash and cash equivalents at 31 December 2006 29(b) 241,591,925 225,639,699

10
The notes on pages 10 to 27 form an integral part of these financial statements
NATIONAL BANK OF RWANDA NOTES TO THE FINANCIAL STATEMENTS FOR THE YEAR ENDED 31 DECEMBER 2006
11
1. LEGAL FRAMEWORK
The National Bank of Rwanda (the Bank) operates under the Law No. 11/97 of 26 July 1997. The principal activities of the Bank are to:
• Formulate and implement monetary policy with the main objective of maintaining the value
and stability of the local currency • Intervene on the foreign exchange market and implement an appropriate policy to ensure
the external stability of the currency • Be the sole supplier of bank notes on behalf of the Government of Rwanda • Supervise the banking and finance sector of the country in order to ensure a stable and
efficient financial market system • Act as the Government’s banker for all treasury, banking and credit operations
The Bank’s share capital of Frw 2 billion is fully subscribed by the Rwandan Government. It may be
increased by either a transfer from the reserves following a decision of the Board of Directors ratified by
a presidential decree or by a new share issue of the Government of Rwanda.
Section 65 of the Law No. 11/97 of 26 July 1997 stipulates that the net profit of the Bank shall be
allocated as follows:
• 20% of net profit for the year is allocated to the General Reserve Fund • After any other allocations that the Board of Directors deems appropriate at the end of each
year, the remainder is paid to the Government At 31December 2006, the total equity of the Bank amounted to Frw’s 000 17,600,621.
2. ACCOUNTING POLICIES (a) Application of International Financial Reporting Standards (IFRS)
The Bank has adopted all IFRS which it deemed appropriate to its functions except for the re-assessment of the loan given to the Government of Rwanda at below market rates in accordance with IAS 39, Financial Instruments and Recognition and the application of IAS 38 in respect of currency printing and issue costs.
Re-assessment of the loan given to the Government of Rwanda
The loan has not been accounted for its fair value as per IAS 39. The Bank assumes that the loan granted to the Government before 1994, consolidated in December 1995 at an interest rate of 2 %, will be repaid yearly by deducting 30 % of the annual dividend paid to Government, the sole shareholder.
The loan dates back to 7 February 1996 and since then there has been no additional loan to the Government. The Bank also manages the Government Main Account (OTR) and an interest comparable to the market rate is charged in case of overdraft.
NATIONAL BANK OF RWANDA NOTES TO THE FINANCIAL STATEMENTS FOR THE YEAR ENDED 31 DECEMBER 2006
12
2 ACCOUNTING POLICIES (Contd) (a) Application of International Financial Reporting Standards (Contd)
Recognition of deferred printing costs
The Bank incurs yearly printing costs for notes and coins in Frw and these costs are expensed in the Income Statement in the period they are incurred. In 2003, however, Frw000’s 4,380,181 were incurred for currency printing and issue costs. The Bank has judged it more suitable to adopt the policy of amortising these costs over a period of five years instead of writing off the whole amount in the year 2003.
According to IAS 38, the whole cost should have been expensed in 2003. The financial effect of this treatment would turn the current year profits to Frw000’s 2,922,115 and the retained earnings would be Frw000’s 15,600,621 at 31 December 2006.
(b) Basis of preparation
The financial statements are prepared in Rwandan Francs (Frw), rounded to the nearest thousand (‘000). The financial statements have been prepared in accordance with IFRS and under historical cost convention except for the valuation of assets available for sale and financial assets and liabilities at their fair value which are accounted in the Income Statement.
(c) Accounting estimates The preparation of financial statements in accordance with IFRS requires management to make
estimates and assumptions that affect the amounts reported in the financial statements and the notes to the financial statements. These estimates are based on management’s best knowledge of current event. Actual results may differ from those estimates.
(d) Revenue and expenses
Income and expenses are accounted for on an accrual basis.
(e) Property, plant and equipment
Property, plant and equipment are recorded at cost less accumulated depreciation. Depreciation is
calculated using the straight-line method and is applied over the estimated useful lives of the assets, as
shown below:
Buildings 5-10% Machinery 20% Motor vehicles 25% Office furniture 20% Computer equipment 33.33% Security equipment 10%

NATIONAL BANK OF RWANDA NOTES TO THE FINANCIAL STATEMENTS FOR THE YEAR ENDED 31 DECEMBER 2006
13
(f) Intangible assets
Intangible assets are recorded at cost less accumulated depreciation. Depreciation is calculated using the
straight-line method and is applied over the estimated useful lives of the assets, as shown below:
Computer software 25 %

NATIONAL BANK OF RWANDA NOTES TO THE FINANCIAL STATEMENTS FOR THE YEAR ENDED 31 DECEMBER 2006
14
2 ACCOUNTING POLICIES (Contd) (g) Consumables
Stocks of consumables are valued at weighted average cost. Provisions are made for all anticipated
stock losses, impairment and obsolescence.
(h) Foreign currency transactions and balances
Transactions in foreign currencies are recorded using the rate of exchange ruling at the date of the transactions. Monetary assets and liabilities denominated in foreign currencies are translated in Frw using the rate of exchange ruling at the balance sheet date. Gains and losses are accounted in the Income Statement.
(i) Financial assets and liabilities
The Bank accounts for financial assets and liabilities as well as the associated income and expense streams separately by distinguishing between foreign and local currency activities. Assets and liabilities in local currency relate to the Bank’s normal operations which include implementation of monetary policies, supply of bank notes and coins as well as banking operations. Assets and liabilities in foreign currencies relate to management of foreign assets and liabilities. The separate disclosure of its operations in foreign and local currency enables the Bank to evaluate its performance and properly follow up its risk profile. The Bank recognizes financial assets or financial liabilities on its balance sheet when and only when it becomes a party to the contractual provision of the instrument. Assets and liabilities denominated in foreign currencies are translated to Frw at the rates of exchange prevailing at the balance sheet date.
(j) Currency in circulation Notes and coins issued represent an unserviced liability of the Bank and are recorded at face value in the balance sheet.
(k) Employee benefits
As per the Law relating to employees’ pension, the Bank contributes 5 % to the pension scheme and the employee 3 % of their monthly salary. The Bank’s 5 % contribution is expensed in the Income Statement.
The Bank also subscribes to a staff protection insurance policy with a local insurance company. The
employees’ contribution to this cost amounts to a third of total premiums and the remaining two thirds
are borne by the Bank.
The Bank provides medical facilities for its employees as well as their respective families.

NATIONAL BANK OF RWANDA NOTES TO THE FINANCIAL STATEMENTS FOR THE YEAR ENDED 31 DECEMBER 2006
15
2 ACCOUNTING POLICIES (Contd)
(l) Investment
The investment relates to capital subscribed in SIMTEL which is neither listed on the stock exchange nor available for sale. All unlisted investments are recorded in the financial statements at cost.
(m) Investment properties
Investment properties are shown at cost less accumulated depreciation. Depreciation is calculated using the straight basis over its estimated economic useful life at the rate of 10 %.
(n) Loans and provisions for loans impairment
The Bank, as the Government’s banker, can give an overdraft facility to the Government in order to enable the latter to operate in case of a cash shortage. The amount of such overdraft facilities is limited to 11 % of the Government’s total revenue in the preceding fiscal year. According to the agreement No 5/96 signed between the Government and the Bank on 6 February 1996 and Article 79 of Law 11/97, all loans given to the Government before and during the war of 1994, that is, before 31 December 1994, including the balance revised at 6 March 1995, have been consolidated at an interest rate of 2 %.
The Bank as lender of last resort can also lend for a period not exceeding 7 days.
The loan should be secured. They are granted at the interest rate practiced on the inter-bank money
market.
The Bank equally manages lines of credit granted to the Government by providers of fund and then
retroceded to the private sector. For these lines of credit the Bank in general charges favourable interest
rates to the commercial banks which in turn apply the appropriate rates to their clients.
The Bank also gives loan facilities for the refinancing of agricultural and agro industrial activities at
favourable rates of interests to commercial banks. In turn, these are re-lent to their clients at
preferential rates of interests.
The Bank gives housing and car loans to its personnel as well as short term loan not exceeding one year
at favourable rates. Any advance on salary is interest free.

NATIONAL BANK OF RWANDA NOTES TO THE FINANCIAL STATEMENTS FOR THE YEAR ENDED 31 DECEMBER 2006
16
Provision is made for all doubtful debts as per order 03/2000 of 29 March 2000 which deals with classification of assets and follow-up of obligations by banks and other credit institutions.
2 MAIN ACCOUNTING POLICIES (Contd)
(o) Cash and cash equivalents
Cash and cash equivalents comprise cash in hand; bank balances with other financial institutions and
short term liquidity investments.
(p) Income taxes
The Bank is exempt from taxes under Section 71 of the Law 11/97.
(q) Dividend payable
Dividends are recognised on payment. Dividends declared after the balance sheet date but before approval of the financial statements are disclosed in the notes to the accounts.
(r) Comparatives Comparative figures have been adjusted where necessary in order to conform to the changes made in the present financial statements.
NATIONAL BANK OF RWANDA NOTES TO THE FINANCIAL STATEMENTS FOR THE YEAR ENDED 31 DECEMBER 2006
17
2006 2005 3 INTEREST INCOME Frw ’000 Frw ’000 Interest on domestic assets 932,522 935,701 Interest on foreign assets 10,814,689 5,700,970 11,747,211 6,636,671 4 INTEREST EXPENSE
Interest expense on domestic borrowings 3,637,645 1,299,297 Interest expense on foreign borrowings 33,473 27,972 IMF charges 426,848 505,102 4,097,966 1,832,371 5 NET COMMISSIONS AND FEES INCOME Commission and fee income 226,570 189,069 Commission and fees charges (79,263) (84,200) 147,307 104,869 6 PROFIT ON FOREIGN EXCHANGE TRANSACTIONS Profit on sale of foreign currencies 1,822,823 2,168,688 Loss on foreign exchange transactions (288,873) (343,464) 1,533,950 1,825,224 7 OTHER INCOME Write back of currency printing costs 131,348 131,348 Fines, penalties and other administrative income 60,813 150,982 Write back of accruals and provisions(see note 7.a below) 297,322 886,582 Profit on sales of property, plant and equipment 3,346 37,124 Revenue grant from the Government of Rwanda 3,637,611 1,298,133 Other income (see note 7.b below) 530,533 83,978 4,660,973 2,588,147 7.a Details of Write Back of Accruals and Provisions Write back on provisions for doubtful debts from former
employeees 24,799 5,653
Write back on provision for leaves payable 141,820 222,512 Write back on provision for depreciation on CAAML Fund - 483,455 Writ back of other provision for doubtful debts 130,703 174,962 297,322 886,582 7.b Details of Other Income Sales of demonetised coins 363,966 - Other non banking income 160,014 82,915 Income from exceptional items 6,553 1,063 530,533 83,978 8 OPERATING COSTS Staff costs 4,091,891 3,931,451 Depreciation of property, plant and equipment 471,942 408,343 Amortisation of intangible assets 116,968 109,470 Amortisation of investment property 31,349 31,349 Amortisation of deferred costs 859,945 876,037 Provisions for liabilities and charges 169,291 318,780 Amortisation of investments 450,000 - Other expenses 2,855,850 1,354,390 9,047,236 7,029,820

NATIONAL BANK OF RWANDA NOTES TO THE FINANCIAL STATEMENTS FOR THE YEAR ENDED 31 DECEMBER 2006
18
8 OPERATING COSTS (Cont) Staff costs are made of: Salaries and other allowances 3,249,301 3,164,826 Pensions 365,548 241,357 Medical expenses 143,130 223,876 Training and development 306,421 279,971 Other staff costs 27,491 21,421 4,091,891 3,931,451
The average number of employees during the year was 453 (2005: 469).
9
EXTERNAL ASSETS
2006
2005
Frw’ 000 Frw’ 000 Current accounts 24,573,078 57,191,923 Placements with banks 134,757,968 84,501,350 Foreign investments 51,332,518 51,453,802 Special Drawing Rights 12,525,879 14,345,577 Other foreign investments 16,689,715 16,863,371 Interests receivables 320,055 563,201 240,199,213 224,919,224 10 SPECIAL DRAWING RIGHTS ALLOCATED BY THE IMF
Special Drawing Rights allocated by the IMF refers to the Rwandan Government’s total capital subscription to the International Monetary Fund (IMF). It is equal to SDR 80,100,000 and was converted to FRW using closing rate of SDR as at 31 December 2006.
11
RECEIVABLE FROM GOVERNMENT OF RWANDA
2006
2005
Frw’ 000 Frw’ 000 At 1 January 2006 46,374,647 42,136,020 Loss on foreign exchange fluctuations (4,581,765) 4,248,923 41,792,882 46,384,943 Accrued interest on overdraft 1,085 (10,296) At 31 January 2006 41,793,967 46,374,647
On 7 February 1996, the Bank signed an agreement with the Government of Rwanda with the view to consolidate the loan of Frw 34.457 billion at an interest rate of 2 %. This balance has increased to Frw 43.469 in August 1997 as per Article 79 of Law 11/97. The repayment of this loan is made by retaining 30 % of the annual dividend payable to the Government since 2002 and interest is calculated at 2 % per annum. As at 31 December 2006, a sum of Frw 1.677 billion has been paid. Article 49 of the law No.11/97 sets the limit of the Government of Rwanda’s overdraft facility at 11% of the gross Government revenues collected during the preceding fiscal year. The limit for the year 2006 was Frw 15.790 billion. This limit was not exceeded in 2006.

NATIONAL BANK OF RWANDA NOTES TO THE FINANCIAL STATEMENTS FOR THE YEAR ENDED 31 DECEMBER 2006
19
12 LOANS TO COMMERCIAL BANKS AND OTHER 2006 2005 FINANCIAL INSTITUTIONS Frw’ 000 Frw’ 000 Loan to the National Post Office (ONP) 24,146 61,146 Line of credit to commercial banks 515,911 675,087 Line of credit to the agricultural and agro technical sectors 951,389 1, 128,748 1,491,446 1,864,981
2006 2005 13 STAFF LOANS Frw’ 000 Frw’ 000 Loans to staff 3,179,044 2,853,667 Less: provisions for doubtful debts (78,574) (104,003) 3,100,470 2,749,664 14 INVESTMENT 2006 2005 Frw’ 000 Frw’ 000 Cost At 1 January 2006 450,000 200,000 Additions during the year - 250,000 Write off (450,000) - At 31 December 2006 - 450,000
The investment relates to capital subscribed in SIMTEL which is neither listed on the stock exchange nor available for sale. All unlisted investments are recorded in the financial statements at cost. Management has assumed that this investment has already been wholly depreciated at 31 December 2006.
15 INVESTMENT PROPERTIES Frw’ 000 Cost At 1 January and 31 December 2006 313,490 Depreciation At 1 January 2006 53,128 Charge for the year 31,349 At 31 December 2006 84,477 Net book value At 31 December 2006 229,013 At 31 December 2005 260,362
NATIONAL BANK OF RWANDA NOTES TO THE FINANCIAL STATEMENTS FOR THE YEAR ENDED 31 DECEMBER 2006
20
2006 2005 16 OTHER ASSETS Frw’ 000 Frw’ 000 Prepayments and deferred charges 1,160,043 387,278 Consumables 118,433 135,448 Other debtors 272,114 100,795 Provision for bad debts (66,058) (93,875) 1,484,532 529,646 17 INTANGIBLE ASSETS Frw’ 000 Cost At 1 January 2006 708,361 Additions 1,303 At 31 December 2006 709,664 Amortisation As at 1 January 2006 524,276 Charge for the year 116,967 As at 31 December 2006 641,243 Net Book Value At 31 December 2006 68,421 At 31 December 2005 184,085 18 DEFERRED COSTS Cost of
Production of Notes
Cost of Production of
Coins
Total Frw’ 000 Frw’ 000 Frw’ 000 Cost At 1 January 2006 3,984,759 395,422 4,380,181 Write off (70,598) (9,860) (80,458) At 31 December 2006 3,914,161 385,562 4,299,723 Depreciation At 1 January 2006 1,472,824 154,954 1,627,778 Write off (36,475) (4,273) (40,748) Charge for the year 782,832 77,112 859,944 At 31 December 2006 2,219,181 227,793 2,446,974 Net book Value At 31 December 2006 1,694,980 157,769 1,852,749 At 31 December 2005 2,511,935 240,468 2,752,403
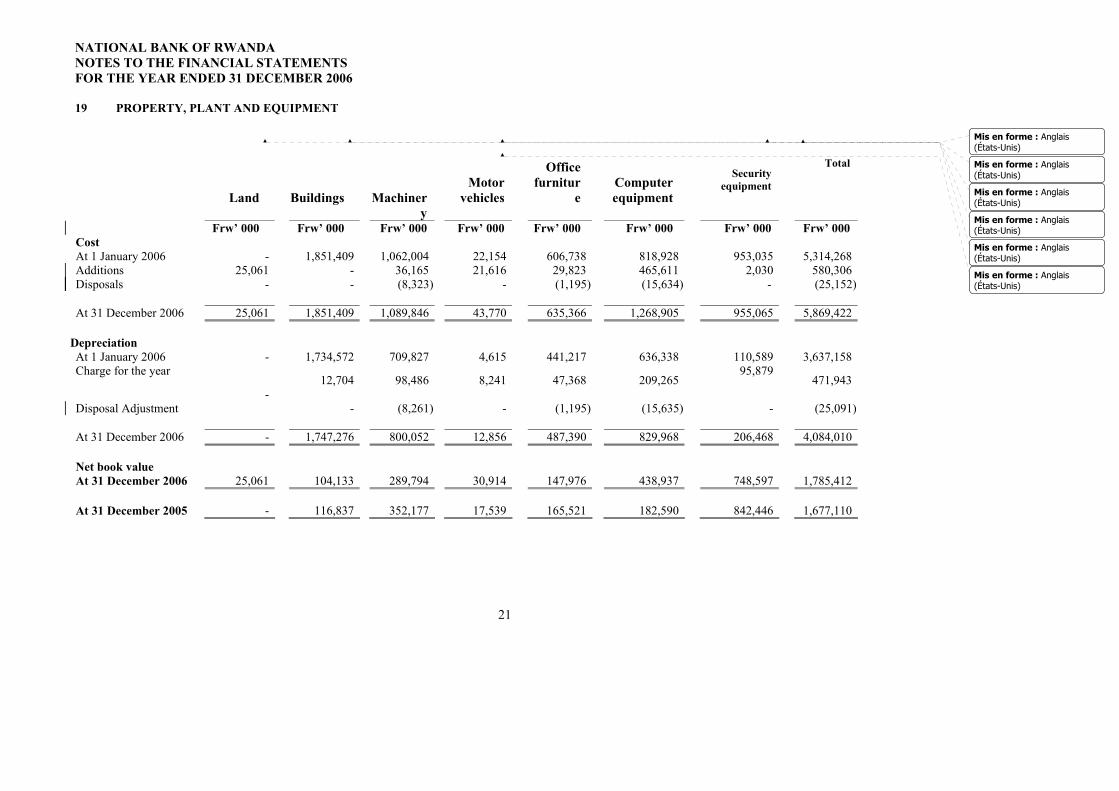
NATIONAL BANK OF RWANDA NOTES TO THE FINANCIAL STATEMENTS FOR THE YEAR ENDED 31 DECEMBER 2006
21
19 PROPERTY, PLANT AND EQUIPMENT
Land
Buildings
Machinery
Motor vehicles
Office furnitur
e
Computer equipment
Security equipment
Total
Frw’ 000 Frw’ 000 Frw’ 000 Frw’ 000 Frw’ 000 Frw’ 000 Frw’ 000 Frw’ 000 Cost At 1 January 2006 - 1,851,409 1,062,004 22,154 606,738 818,928 953,035 5,314,268 Additions 25,061 - 36,165 21,616 29,823 465,611 2,030 580,306 Disposals - - (8,323) - (1,195) (15,634) - (25,152) At 31 December 2006 25,061 1,851,409 1,089,846 43,770 635,366 1,268,905 955,065 5,869,422 Depreciation At 1 January 2006 - 1,734,572 709,827 4,615 441,217 636,338 110,589 3,637,158 Charge for the year
12,704
98,486
8,241
47,368
209,265 95,879
471,943
Disposal Adjustment -
-
(8,261)
-
(1,195)
(15,635)
-
(25,091) At 31 December 2006 - 1,747,276 800,052 12,856 487,390 829,968 206,468 4,084,010 Net book value At 31 December 2006 25,061 104,133 289,794 30,914 147,976 438,937 748,597 1,785,412 At 31 December 2005 - 116,837 352,177 17,539 165,521 182,590 842,446 1,677,110
Mis en forme : Anglais(États-Unis)
Mis en forme : Anglais(États-Unis)
Mis en forme : Anglais(États-Unis)
Mis en forme : Anglais(États-Unis)
Mis en forme : Anglais(États-Unis)
Mis en forme : Anglais(États-Unis)
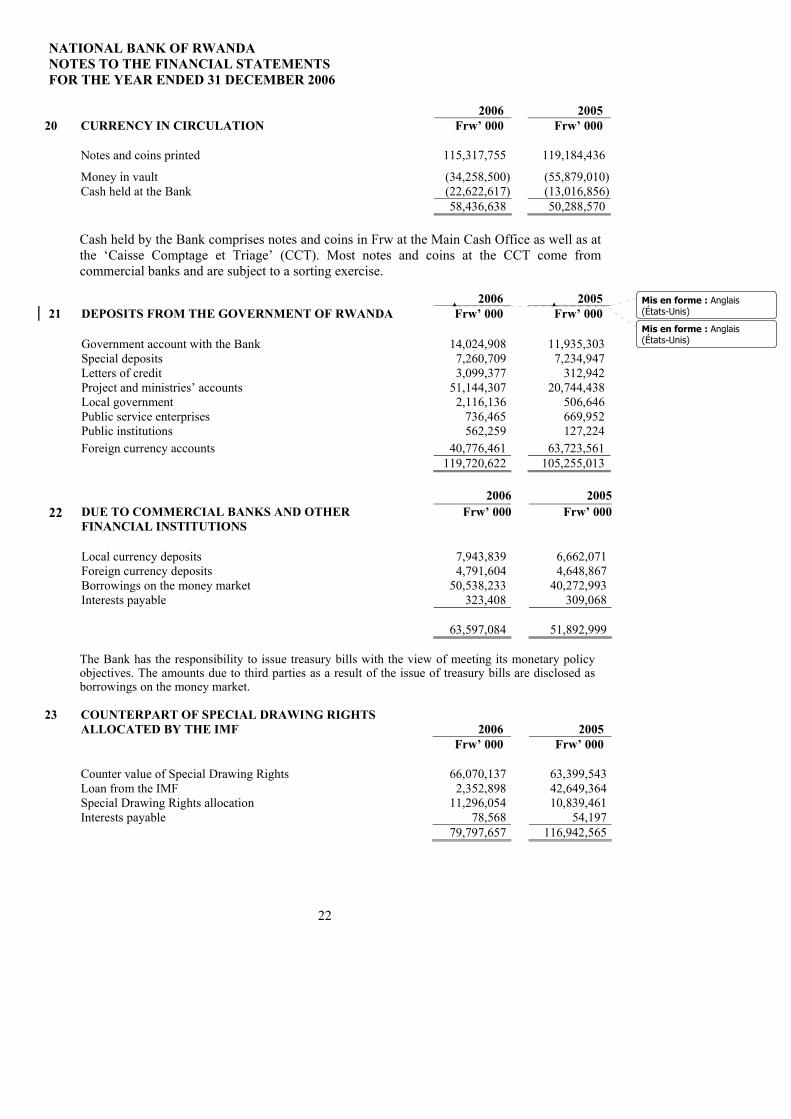
NATIONAL BANK OF RWANDA NOTES TO THE FINANCIAL STATEMENTS FOR THE YEAR ENDED 31 DECEMBER 2006
22
2006 2005 20 CURRENCY IN CIRCULATION Frw’ 000 Frw’ 000 Notes and coins printed 115,317,755 119,184,436
Money in vault (34,258,500) (55,879,010) Cash held at the Bank (22,622,617) (13,016,856) 58,436,638 50,288,570
Cash held by the Bank comprises notes and coins in Frw at the Main Cash Office as well as at the ‘Caisse Comptage et Triage’ (CCT). Most notes and coins at the CCT come from commercial banks and are subject to a sorting exercise.
2006 200522 DUE TO COMMERCIAL BANKS AND OTHER
FINANCIAL INSTITUTIONS Frw’ 000 Frw’ 000
Local currency deposits 7,943,839 6,662,071 Foreign currency deposits 4,791,604 4,648,867 Borrowings on the money market 50,538,233 40,272,993 Interests payable 323,408 309,068 63,597,084 51,892,999
The Bank has the responsibility to issue treasury bills with the view of meeting its monetary policy objectives. The amounts due to third parties as a result of the issue of treasury bills are disclosed as borrowings on the money market.
23 COUNTERPART OF SPECIAL DRAWING RIGHTS
ALLOCATED BY THE IMF
2006
2005 Frw’ 000 Frw’ 000 Counter value of Special Drawing Rights 66,070,137 63,399,543 Loan from the IMF 2,352,898 42,649,364 Special Drawing Rights allocation 11,296,054 10,839,461 Interests payable 78,568 54,197 79,797,657 116,942,565
2006 2005 21 DEPOSITS FROM THE GOVERNMENT OF RWANDA Frw’ 000 Frw’ 000
Government account with the Bank 14,024,908 11,935,303 Special deposits 7,260,709 7,234,947 Letters of credit 3,099,377 312,942 Project and ministries’ accounts 51,144,307 20,744,438 Local government 2,116,136 506,646 Public service enterprises 736,465 669,952 Public institutions 562,259 127,224 Foreign currency accounts 40,776,461 63,723,561 119,720,622 105,255,013
Mis en forme : Anglais(États-Unis)
Mis en forme : Anglais(États-Unis)

NATIONAL BANK OF RWANDA NOTES TO THE FINANCIAL STATEMENTS FOR THE YEAR ENDED 31 DECEMBER 2006
23
2006 2005 24 FOREIGN LIABILITIES Frw’ 000 Frw’ 000 National Bank of Belgium current account 11,775,325 - Public deposits in local currency 174,213 118,505 Public deposits in foreign currencies 1,907,145 545,912 13,856,683 664,417
25 OTHER LIABILITIES 2006 2005 Frw’ 000 Frw’ 000 Staff costs payable 218,655 191,287 Non statutory accounts in Frw 1,043,436 1,118,019 Non statutory accounts in foreign currencies 379,263 357,111 Other accruals 23,162 763,052 Other payables 4,370,583 2,043,725 Provisions for contingencies 260,636 319,366 Staff leaves payable 152,172 129,738 6,447,907 4,922,298
2006 2005 26 SHARE CAPITAL Frw’ 000 Frw’ 000 Authorised, issued and fully paid 2,000,000 2,000,000
The authorised share capital of the Bank is Frw 2 billion as stipulated by Section 6 of Law No. 11/97 dated 26 July 1997. It is subscribed by the Government of Rwanda.
27 OTHER RESERVES
Currency printing
costs
Staff welfare fund
Profit/(loss) charged in
equity
Foreign currency revaluation
reserves
Total Frw’ 000 Frw’ 000 Frw’000 Frw’000 Frw’ 000 At 1 January 2006 262,697 1,746,720 (17,641) 2,776,174 4,767,950 Write back on reserves (131,348) - - (2,022,124) (2,153,472) Reserve allocation - 350,654 - - 350,654
Other movements
-
-
13,476 -
13,476
At 31 December 2006 131,349 2,097,374 (4,165) 754,050 2,978,608
Mis en forme : Anglais(États-Unis)
Mis en forme : Anglais(États-Unis)

NATIONAL BANK OF RWANDA NOTES TO THE FINANCIAL STATEMENTS FOR THE YEAR ENDED 31 DECEMBER 2006
24
28 DIVIDEND 2006 2005 Frw’ 000 Frw’ 000 Proposed dividend 1,987,038 1,109,477 29 (a) CASHFLOWS FROM OPERATING ACTIVITIES
2006
2005 Frw’ 000 Frw’ 000
Net profit for the year 2,922,115 1,631,584
Adjustments for: Depreciation of property, plant and equipment 471,943 408,343 Amortisation of intangible assets 116,967 109,470 Intangible assets written off 31,349 31,349 Amortisation of investment property 859,944 876,037 Amortisation of deferred costs (131,348) (131,349) Write back of currency reserve (3,346) (37,124) Loss on Foreign exchange transactions 2,022,124 4,910,059 Loss / (Profit) on sale of property, plant and equipment 13,477 (17,641) Impairment of investment 450,000 - Other movements in reserves 39,708 - Operating profit before working capital changes 6,792,933 7,780,728 (Increase) / decrease in Special Drawing Rights allocated by the
IMF (2,670,156)
6,966,682 Decrease (Increase)/ in receivables from Government of Rwanda 4,580,680 (4,238,627) Decrease in loans to commercial banks and other financial
institutions
373,535
380,414 Increase in staff loans (350,806) (273,097) Increase in other assets (954,886) (261,781) Increase in deposit from the Government of Rwanda 14,465,609 25,962,453 Increase in amounts due to commercial banks and other financial
institutions
11,704,085
27,852,186 Increase / (Decrease) in foreign liabilities 13,192,266 (2,690,268) Increase in counterpart of special drawing rights allocated by the
IMF (37,144,908)
(17,703,130) Decrease/ (increase) in other liabilities 1,525,609 (2,065,548) Net cash from operating activities 11,513,961 41,710,012
29 (b) CASH AND CASH EQUIVALENT Foreign currency notes and coins 1,392,712 720,475 External assets 240,199,213 224,919,224 241,591,925 225,639,699
Mis en forme : Anglais(États-Unis)
Mis en forme : Anglais(États-Unis)
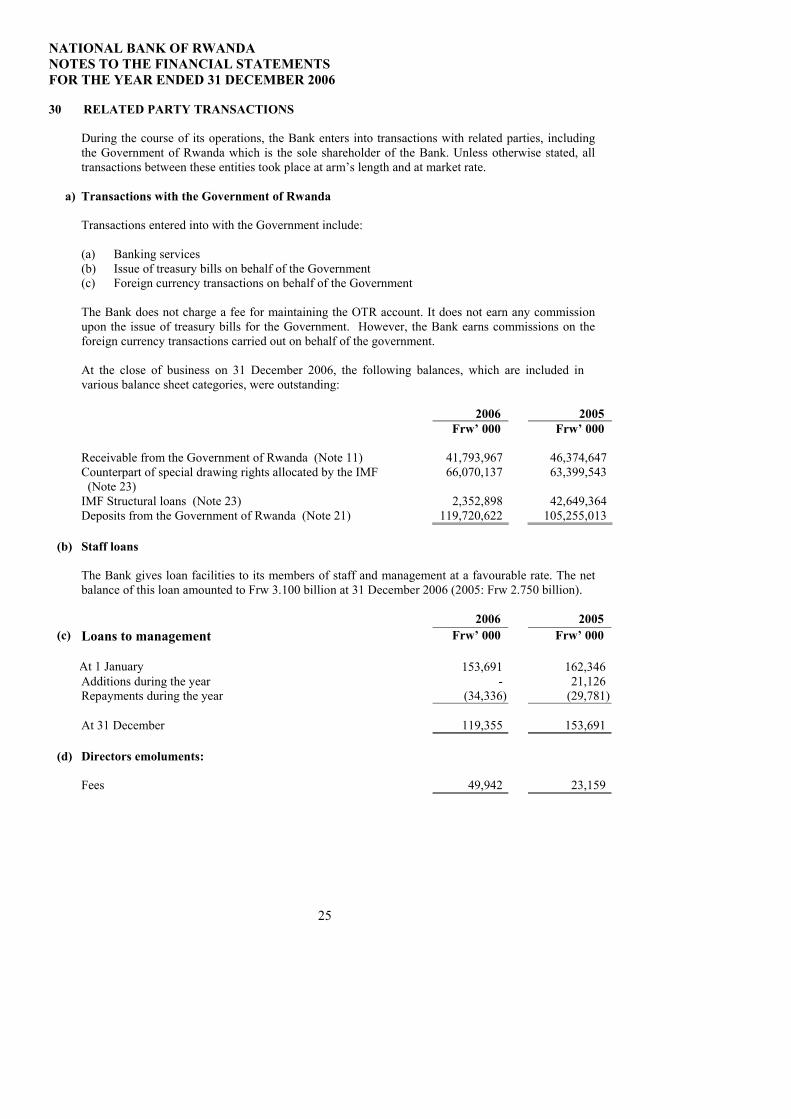
NATIONAL BANK OF RWANDA NOTES TO THE FINANCIAL STATEMENTS FOR THE YEAR ENDED 31 DECEMBER 2006
25
30 RELATED PARTY TRANSACTIONS
During the course of its operations, the Bank enters into transactions with related parties, including the Government of Rwanda which is the sole shareholder of the Bank. Unless otherwise stated, all transactions between these entities took place at arm’s length and at market rate.
a) Transactions with the Government of Rwanda
Transactions entered into with the Government include:
(a) Banking services (b) Issue of treasury bills on behalf of the Government (c) Foreign currency transactions on behalf of the Government The Bank does not charge a fee for maintaining the OTR account. It does not earn any commission upon the issue of treasury bills for the Government. However, the Bank earns commissions on the foreign currency transactions carried out on behalf of the government.
At the close of business on 31 December 2006, the following balances, which are included in various balance sheet categories, were outstanding:
2006 2005 Frw’ 000 Frw’ 000 Receivable from the Government of Rwanda (Note 11) 41,793,967 46,374,647 Counterpart of special drawing rights allocated by the IMF
(Note 23) 66,070,137 63,399,543
IMF Structural loans (Note 23) 2,352,898 42,649,364 Deposits from the Government of Rwanda (Note 21) 119,720,622 105,255,013
(b) Staff loans
The Bank gives loan facilities to its members of staff and management at a favourable rate. The net balance of this loan amounted to Frw 3.100 billion at 31 December 2006 (2005: Frw 2.750 billion).
2006 2005
(c) Loans to management Frw’ 000 Frw’ 000
At 1 January 153,691 162,346 Additions during the year - 21,126 Repayments during the year (34,336) (29,781) At 31 December 119,355 153,691
(d) Directors emoluments: Fees 49,942 23,159
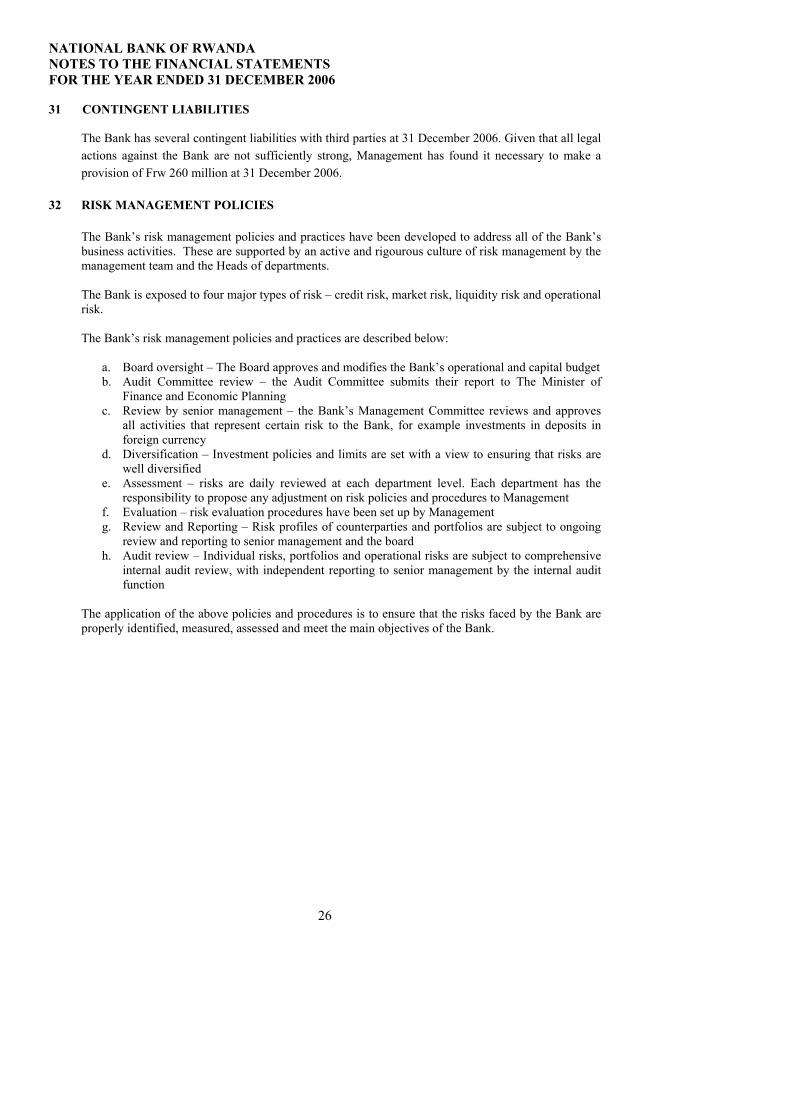
NATIONAL BANK OF RWANDA NOTES TO THE FINANCIAL STATEMENTS FOR THE YEAR ENDED 31 DECEMBER 2006
26
31 CONTINGENT LIABILITIES
The Bank has several contingent liabilities with third parties at 31 December 2006. Given that all legal actions against the Bank are not sufficiently strong, Management has found it necessary to make a provision of Frw 260 million at 31 December 2006.
32 RISK MANAGEMENT POLICIES
The Bank’s risk management policies and practices have been developed to address all of the Bank’s business activities. These are supported by an active and rigourous culture of risk management by the management team and the Heads of departments. The Bank is exposed to four major types of risk – credit risk, market risk, liquidity risk and operational risk. The Bank’s risk management policies and practices are described below:
a. Board oversight – The Board approves and modifies the Bank’s operational and capital budget b. Audit Committee review – the Audit Committee submits their report to The Minister of
Finance and Economic Planning c. Review by senior management – the Bank’s Management Committee reviews and approves
all activities that represent certain risk to the Bank, for example investments in deposits in foreign currency
d. Diversification – Investment policies and limits are set with a view to ensuring that risks are well diversified
e. Assessment – risks are daily reviewed at each department level. Each department has the responsibility to propose any adjustment on risk policies and procedures to Management
f. Evaluation – risk evaluation procedures have been set up by Management g. Review and Reporting – Risk profiles of counterparties and portfolios are subject to ongoing
review and reporting to senior management and the board h. Audit review – Individual risks, portfolios and operational risks are subject to comprehensive
internal audit review, with independent reporting to senior management by the internal audit function
The application of the above policies and procedures is to ensure that the risks faced by the Bank are properly identified, measured, assessed and meet the main objectives of the Bank.
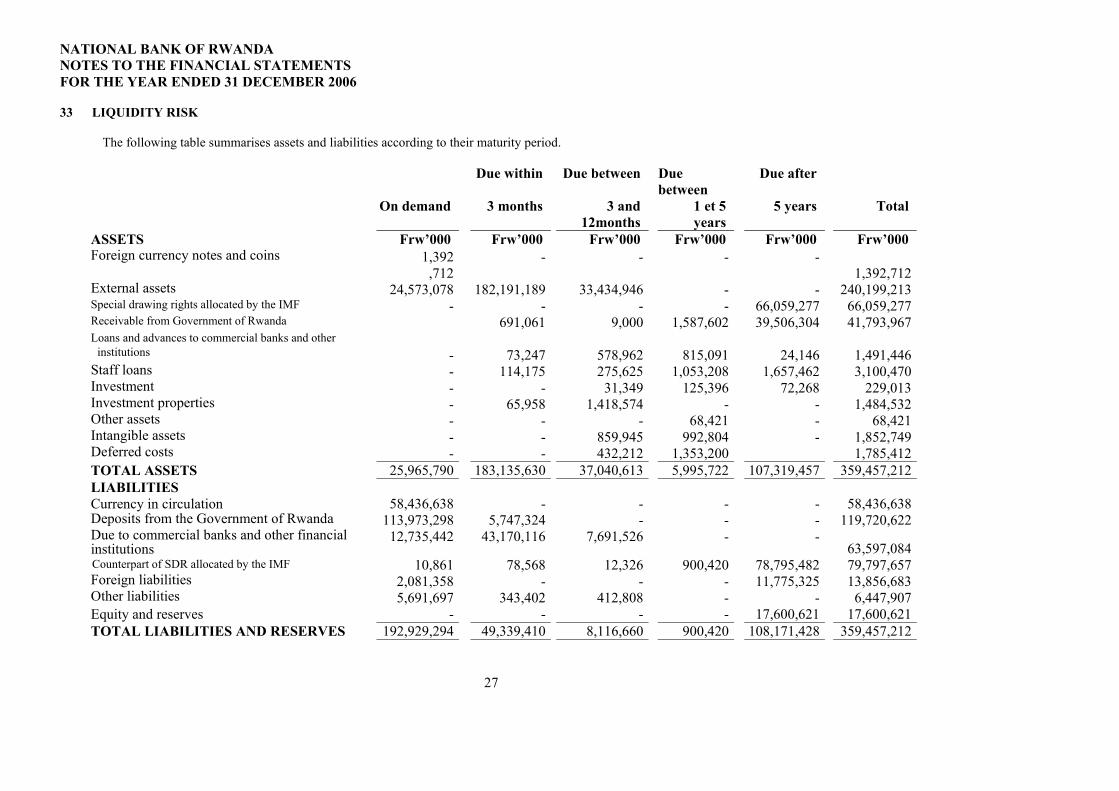
NATIONAL BANK OF RWANDA NOTES TO THE FINANCIAL STATEMENTS FOR THE YEAR ENDED 31 DECEMBER 2006
27
33 LIQUIDITY RISK
The following table summarises assets and liabilities according to their maturity period.
Due within Due between Due between
Due after
On demand 3 months 3 and 12months
1 et 5 years
5 years Total
ASSETS Frw’000 Frw’000 Frw’000 Frw’000 Frw’000 Frw’000 Foreign currency notes and coins 1,392
,712 - - - -
1,392,712External assets 24,573,078 182,191,189 33,434,946 - - 240,199,213Special drawing rights allocated by the IMF - - - - 66,059,277 66,059,277Receivable from Government of Rwanda 691,061 9,000 1,587,602 39,506,304 41,793,967Loans and advances to commercial banks and other
institutions -
73,247
578,962
815,091
24,146
1,491,446Staff loans - 114,175 275,625 1,053,208 1,657,462 3,100,470Investment - - 31,349 125,396 72,268 229,013Investment properties - 65,958 1,418,574 - - 1,484,532Other assets - - - 68,421 - 68,421Intangible assets - - 859,945 992,804 - 1,852,749Deferred costs - - 432,212 1,353,200 1,785,412TOTAL ASSETS 25,965,790 183,135,630 37,040,613 5,995,722 107,319,457 359,457,212LIABILITIES Currency in circulation 58,436,638 - - - - 58,436,638Deposits from the Government of Rwanda 113,973,298 5,747,324 - - - 119,720,622Due to commercial banks and other financial institutions
12,735,442 43,170,116 7,691,526 - - 63,597,084
Counterpart of SDR allocated by the IMF 10,861 78,568 12,326 900,420 78,795,482 79,797,657Foreign liabilities 2,081,358 - - - 11,775,325 13,856,683Other liabilities 5,691,697 343,402 412,808 - - 6,447,907Equity and reserves - - - - 17,600,621 17,600,621TOTAL LIABILITIES AND RESERVES 192,929,294 49,339,410 8,116,660 900,420 108,171,428 359,457,212
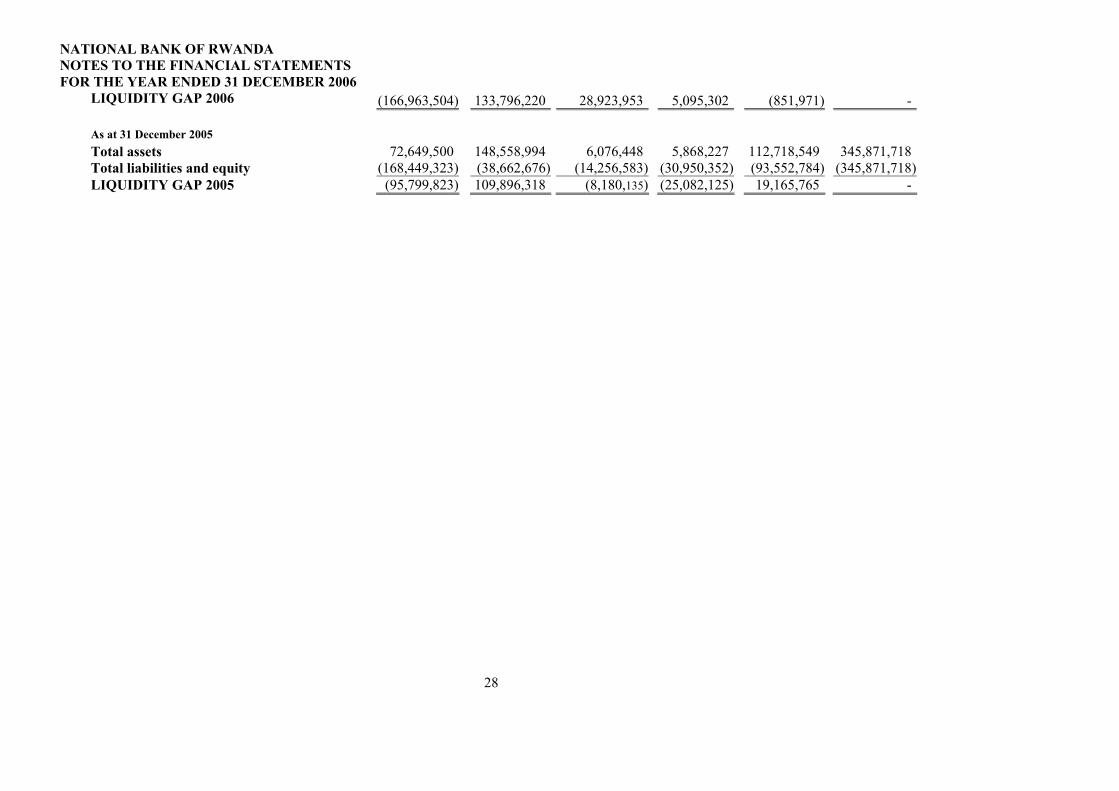
NATIONAL BANK OF RWANDA NOTES TO THE FINANCIAL STATEMENTS FOR THE YEAR ENDED 31 DECEMBER 2006
28
LIQUIDITY GAP 2006 (166,963,504) 133,796,220 28,923,953 5,095,302 (851,971) - As at 31 December 2005 Total assets 72,649,500 148,558,994 6,076,448 5,868,227 112,718,549 345,871,718Total liabilities and equity (168,449,323) (38,662,676) (14,256,583) (30,950,352) (93,552,784) (345,871,718)LIQUIDITY GAP 2005 (95,799,823) 109,896,318 (8,180,135) (25,082,125) 19,165,765 -

29
34 CURRENCY RISK
The various currencies to which the Bank was exposed at 31 December 2006 are summarised in the table below (all expressed in Frw’000): - USD GBP EURO DTS AUTRES Total
ASSETS External assets 203,296,016 21,573,653 2,565,908 12,606,512 157,124 240,199,213 SDR allocated by the IMF - - - 66,059,277 - 66,059,277 Others 1,206,870 168,092 6,365 - 11,385 1,392,712 TOTAL ASSETS 204,502,886 21,741,745 2,572,273 78,665,789 168,509 307,651,202 LIABILITIES Counterpart of SDR allocated by the IMF - - - 79,797,657 - 79,797,657 Liabilities to residents 38,789,104 4,286,581 2,831,028 - 48,303 45,955,016 Other foreign liabilities 365,019 13,545,703 - 95 174,213 14,085,030 TOTAL LIABILITIES 39,154,123 17,832,284 2,831,028 79,797,752 222,516 139,837,703 Net balance sheet position 2006 165,348,763 3,909,461 (258,755) (1,131,963) (54,007) 167,813,499 At 31 December 2006 Total assets 202,075,276 920,637 7,920,864 78,035,752 76,291 289,028,820 Total liabilities (63,112,247) (427,748) (5,717,047) (116,942,656) (167,512) (186,367,210) Net balance sheet position 2005 138,963,029 492,889 2,203,817 (38,906,904) (91,221) 102,661,610

30
35. INTEREST RATES RISK The following table shows the risk related to the Bank’s interest rate fluctuation on assets and liabilities. Items are allocated to time bands by reference to the earlier of the next contractual interest rate reprising date and maturity date.
Between 0 -
3 months
Between 3
to 12months
More than
one year
Non interest bearing
accounts
Total
Frw’000 Frw’000 Frw’000 Frw’000 Frw’000 ASSETS Foreign currency notes and coins
- - - 1,392,712 1,392,712
External assets 188,633,412 51,402,586 - 163,215 240,199,213 Special drawing rights allocated by the IMF
-
-
-
66,059,277
66,059,277
Receivable from Government of Rwanda
- 1,086 41,792,881 41,793,967
Loans and advances to commercial banks and other institutions
73,247
578,962
839,237
-
1,491,446
Staff loans 63,625 274,999 2,618,599 143,247 3,100,470 Investment - - - 229,013 229,013 Investment properties - - - 1,484,532 1,484,532 Other assets - - - 68,421 68,421 Intangible assets - - - 1,852,749 1,852,749 Deferred costs - - - 1,785,412 1,785,412
TOTAL ASSETS 188,770,284 52,257,633 45,250,717 73,178,578 359,457,212 LIABILITIES Currency in circulation - - - 58,436,638 58,436,638 Deposits from Government
- - - 119,720,622 119,720,622
Loans from banks and other financial institutions
42,958,505
7,579,728
-
13,058,851
63,597,084
Counterpart of SDR allocated by the IMF
78,568
12,326
13,636,626
66,070,137
79,797,657
Foreign liabilities -
-
11,775,325
2,081,358
13,856,683
Other liabilities - - - 6,447,907 6,447,907 Equity and reserves - - - 17,600,621 17,600,621 TOTAL LIABILITIES
43,037,073 7,592,054 25,411,951 283,416,134 359,457,212
Interest sensitivity gap 31 December 2006 145,733,211
44,665,579
19,838,766 (210,237,556)
-
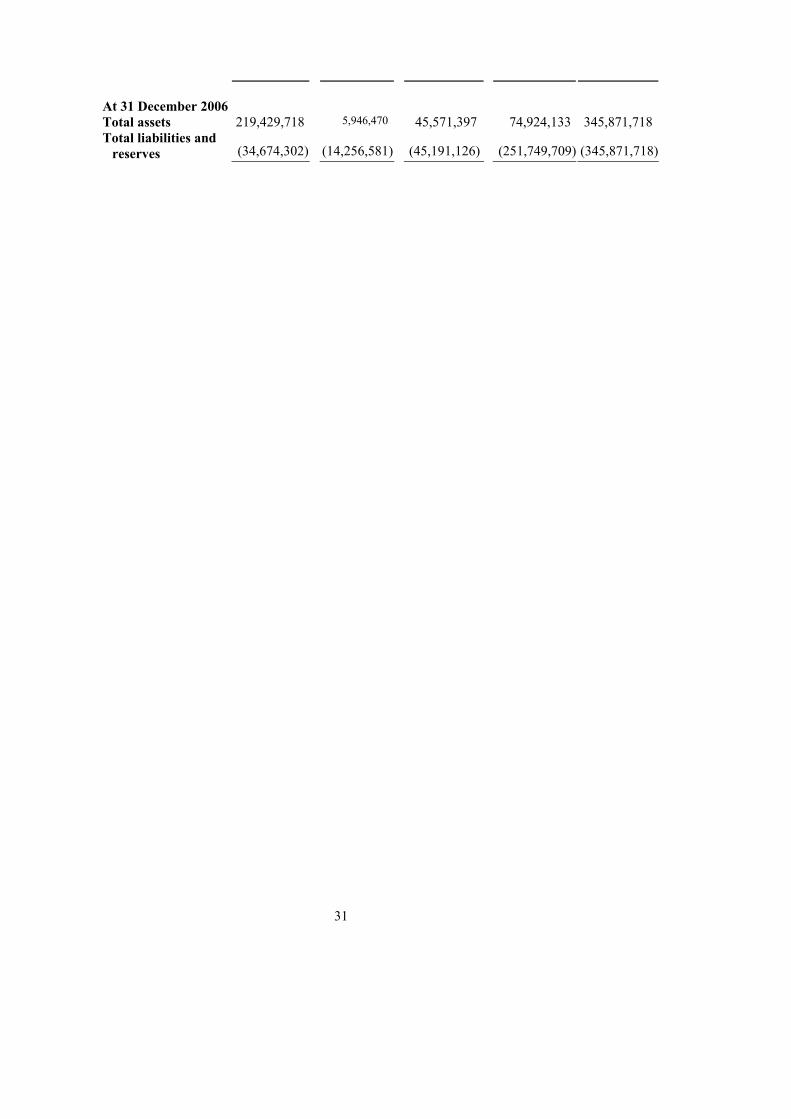
31
At 31 December 2006 Total assets 219,429,718 5,946,470 45,571,397 74,924,133 345,871,718 Total liabilities and
reserves
(34,674,302)
(14,256,581)
(45,191,126)
(251,749,709) (345,871,718)
STATISTICAL APPENDICES
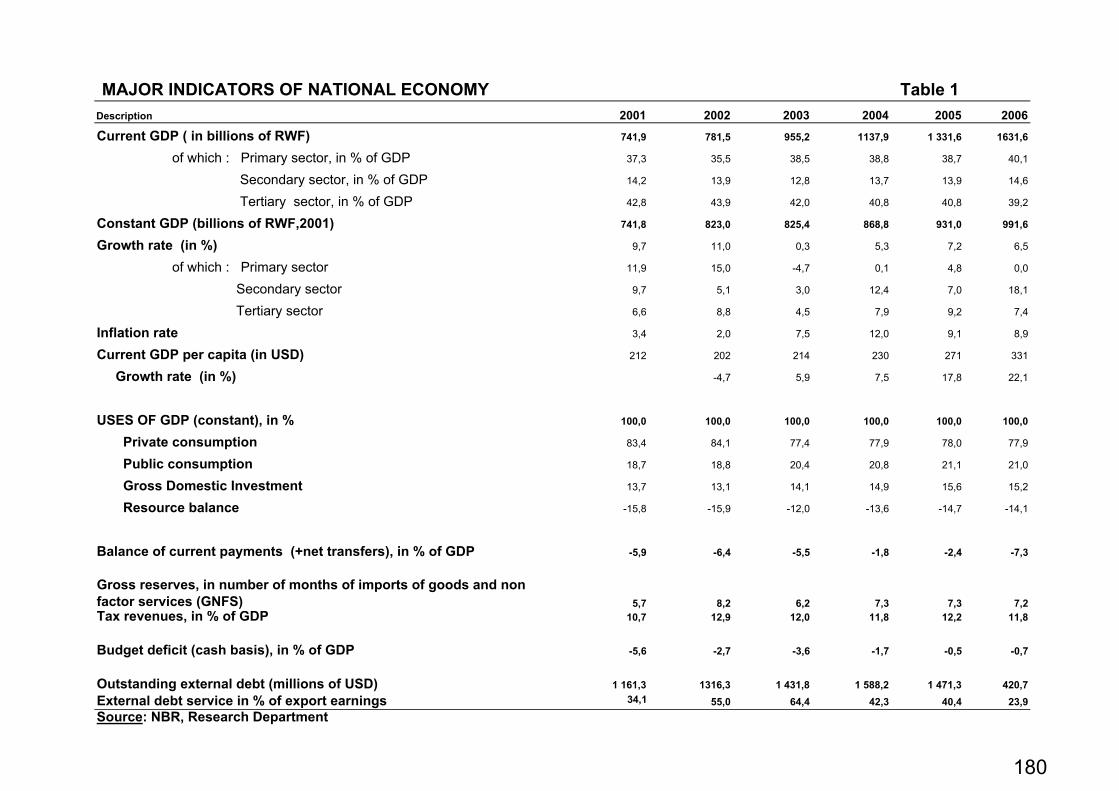
MAJOR INDICATORS OF NATIONAL ECONOMY Table 1Description 2001 2002 2003 2004 2005 2006
Current GDP ( in billions of RWF) 741,9 781,5 955,2 1137,9 1 331,6 1631,6
of which : Primary sector, in % of GDP 37,3 35,5 38,5 38,8 38,7 40,1
Secondary sector, in % of GDP 14,2 13,9 12,8 13,7 13,9 14,6
Tertiary sector, in % of GDP 42,8 43,9 42,0 40,8 40,8 39,2
Constant GDP (billions of RWF,2001) 741,8 823,0 825,4 868,8 931,0 991,6
Growth rate (in %) 9,7 11,0 0,3 5,3 7,2 6,5
of which : Primary sector 11,9 15,0 -4,7 0,1 4,8 0,0
Secondary sector 9,7 5,1 3,0 12,4 7,0 18,1
Tertiary sector 6,6 8,8 4,5 7,9 9,2 7,4
Inflation rate 3,4 2,0 7,5 12,0 9,1 8,9
Current GDP per capita (in USD) 212 202 214 230 271 331
Growth rate (in %) -4,7 5,9 7,5 17,8 22,1
USES OF GDP (constant), in % 100,0 100,0 100,0 100,0 100,0 100,0
Private consumption 83,4 84,1 77,4 77,9 78,0 77,9
Public consumption 18,7 18,8 20,4 20,8 21,1 21,0
Gross Domestic Investment 13,7 13,1 14,1 14,9 15,6 15,2
Resource balance -15,8 -15,9 -12,0 -13,6 -14,7 -14,1
Balance of current payments (+net transfers), in % of GDP -5,9 -6,4 -5,5 -1,8 -2,4 -7,3
Gross reserves, in number of months of imports of goods and non factor services (GNFS) 5,7 8,2 6,2 7,3 7,3 7,2Tax revenues, in % of GDP 10,7 12,9 12,0 11,8 12,2 11,8
Budget deficit (cash basis), in % of GDP -5,6 -2,7 -3,6 -1,7 -0,5 -0,7
Outstanding external debt (millions of USD) 1 161,3 1316,3 1 431,8 1 588,2 1 471,3 420,7External debt service in % of export earnings 34,1 55,0 64,4 42,3 40,4 23,9Source: NBR, Research Department
180
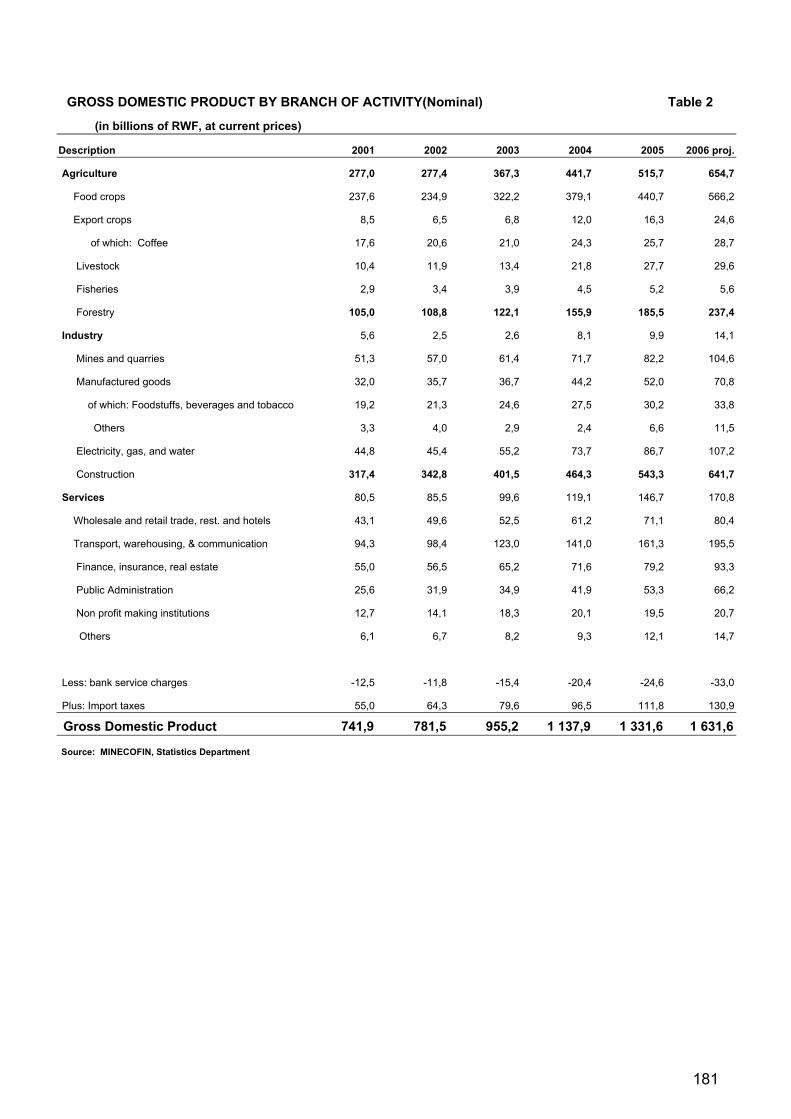
GROSS DOMESTIC PRODUCT BY BRANCH OF ACTIVITY(Nominal) Table 2
(in billions of RWF, at current prices)
Description 2001 2002 2003 2004 2005 2006 proj.
Agriculture 277,0 277,4 367,3 441,7 515,7 654,7
Food crops 237,6 234,9 322,2 379,1 440,7 566,2
Export crops 8,5 6,5 6,8 12,0 16,3 24,6
of which: Coffee 17,6 20,6 21,0 24,3 25,7 28,7
Livestock 10,4 11,9 13,4 21,8 27,7 29,6
Fisheries 2,9 3,4 3,9 4,5 5,2 5,6
Forestry 105,0 108,8 122,1 155,9 185,5 237,4
Industry 5,6 2,5 2,6 8,1 9,9 14,1
Mines and quarries 51,3 57,0 61,4 71,7 82,2 104,6
Manufactured goods 32,0 35,7 36,7 44,2 52,0 70,8
of which: Foodstuffs, beverages and tobacco 19,2 21,3 24,6 27,5 30,2 33,8
Others 3,3 4,0 2,9 2,4 6,6 11,5
Electricity, gas, and water 44,8 45,4 55,2 73,7 86,7 107,2
Construction 317,4 342,8 401,5 464,3 543,3 641,7
Services 80,5 85,5 99,6 119,1 146,7 170,8
Wholesale and retail trade, rest. and hotels 43,1 49,6 52,5 61,2 71,1 80,4
Transport, warehousing, & communication 94,3 98,4 123,0 141,0 161,3 195,5
Finance, insurance, real estate 55,0 56,5 65,2 71,6 79,2 93,3
Public Administration 25,6 31,9 34,9 41,9 53,3 66,2
Non profit making institutions 12,7 14,1 18,3 20,1 19,5 20,7
Others 6,1 6,7 8,2 9,3 12,1 14,7
Less: bank service charges -12,5 -11,8 -15,4 -20,4 -24,6 -33,0
Plus: Import taxes 55,0 64,3 79,6 96,5 111,8 130,9
Gross Domestic Product 741,9 781,5 955,2 1 137,9 1 331,6 1 631,6
Source: MINECOFIN, Statistics Department
181
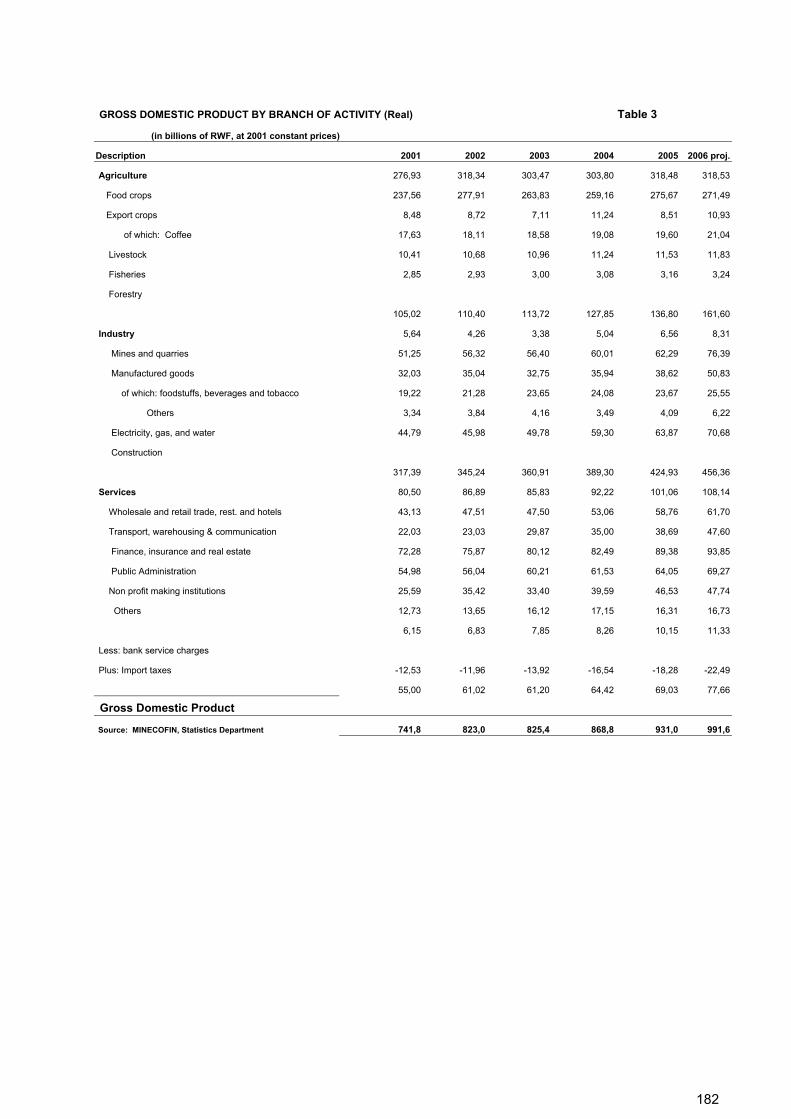
GROSS DOMESTIC PRODUCT BY BRANCH OF ACTIVITY (Real) Table 3
(in billions of RWF, at 2001 constant prices)
Description 2001 2002 2003 2004 2005 2006 proj.
Agriculture 276,93 318,34 303,47 303,80 318,48 318,53
Food crops 237,56 277,91 263,83 259,16 275,67 271,49
Export crops 8,48 8,72 7,11 11,24 8,51 10,93
of which: Coffee 17,63 18,11 18,58 19,08 19,60 21,04
Livestock 10,41 10,68 10,96 11,24 11,53 11,83
Fisheries 2,85 2,93 3,00 3,08 3,16 3,24
Forestry
105,02 110,40 113,72 127,85 136,80 161,60
Industry 5,64 4,26 3,38 5,04 6,56 8,31
Mines and quarries 51,25 56,32 56,40 60,01 62,29 76,39
Manufactured goods 32,03 35,04 32,75 35,94 38,62 50,83
of which: foodstuffs, beverages and tobacco 19,22 21,28 23,65 24,08 23,67 25,55
Others 3,34 3,84 4,16 3,49 4,09 6,22
Electricity, gas, and water 44,79 45,98 49,78 59,30 63,87 70,68
Construction
317,39 345,24 360,91 389,30 424,93 456,36
Services 80,50 86,89 85,83 92,22 101,06 108,14
Wholesale and retail trade, rest. and hotels 43,13 47,51 47,50 53,06 58,76 61,70
Transport, warehousing & communication 22,03 23,03 29,87 35,00 38,69 47,60
Finance, insurance and real estate 72,28 75,87 80,12 82,49 89,38 93,85
Public Administration 54,98 56,04 60,21 61,53 64,05 69,27
Non profit making institutions 25,59 35,42 33,40 39,59 46,53 47,74
Others 12,73 13,65 16,12 17,15 16,31 16,73
6,15 6,83 7,85 8,26 10,15 11,33
Less: bank service charges
Plus: Import taxes -12,53 -11,96 -13,92 -16,54 -18,28 -22,49
55,00 61,02 61,20 64,42 69,03 77,66
Gross Domestic Product
Source: MINECOFIN, Statistics Department 741,8 823,0 825,4 868,8 931,0 991,6
182
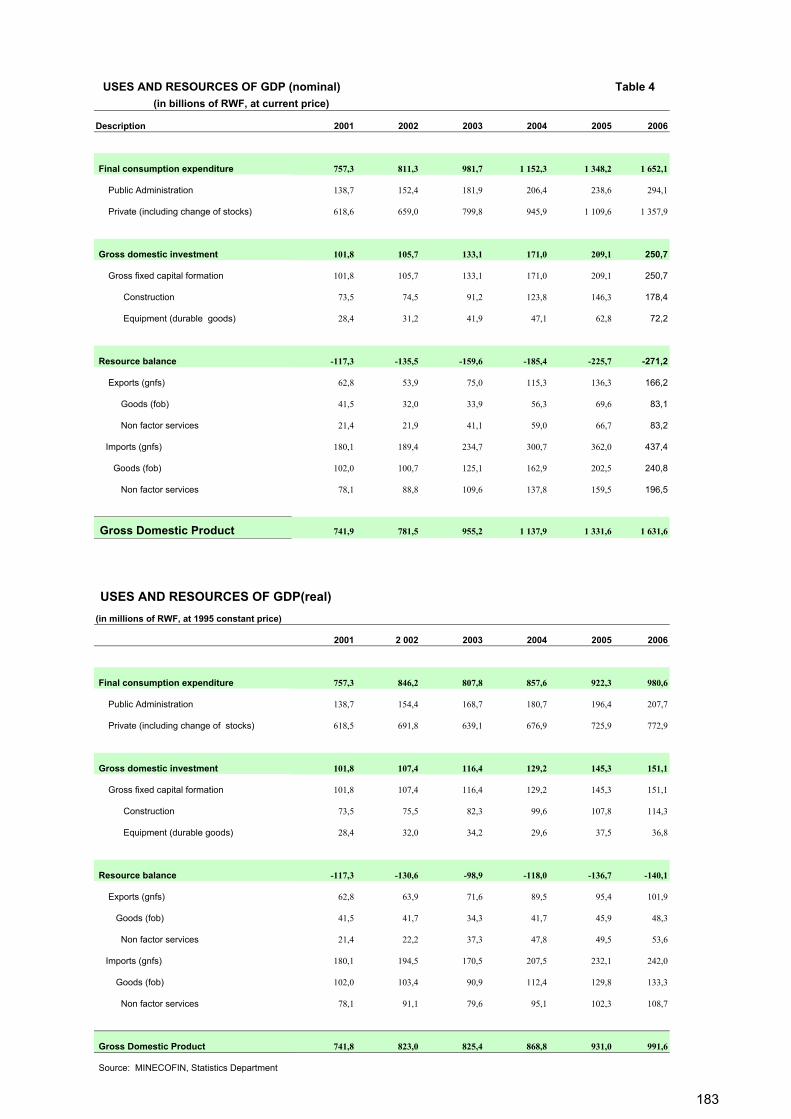
USES AND RESOURCES OF GDP (nominal) Table 4 (in billions of RWF, at current price)
Description 2001 2002 2003 2004 2005 2006
Final consumption expenditure 757,3 811,3 981,7 1 152,3 1 348,2 1 652,1
Public Administration 138,7 152,4 181,9 206,4 238,6 294,1
Private (including change of stocks) 618,6 659,0 799,8 945,9 1 109,6 1 357,9
Gross domestic investment 101,8 105,7 133,1 171,0 209,1 250,7
Gross fixed capital formation 101,8 105,7 133,1 171,0 209,1 250,7
Construction 73,5 74,5 91,2 123,8 146,3 178,4
Equipment (durable goods) 28,4 31,2 41,9 47,1 62,8 72,2
Resource balance -117,3 -135,5 -159,6 -185,4 -225,7 -271,2
Exports (gnfs) 62,8 53,9 75,0 115,3 136,3 166,2
Goods (fob) 41,5 32,0 33,9 56,3 69,6 83,1
Non factor services 21,4 21,9 41,1 59,0 66,7 83,2
Imports (gnfs) 180,1 189,4 234,7 300,7 362,0 437,4
Goods (fob) 102,0 100,7 125,1 162,9 202,5 240,8
Non factor services 78,1 88,8 109,6 137,8 159,5 196,5
Gross Domestic Product 741,9 781,5 955,2 1 137,9 1 331,6 1 631,6
USES AND RESOURCES OF GDP(real)(in millions of RWF, at 1995 constant price)
2001 2 002 2003 2004 2005 2006
Final consumption expenditure 757,3 846,2 807,8 857,6 922,3 980,6
Public Administration 138,7 154,4 168,7 180,7 196,4 207,7
Private (including change of stocks) 618,5 691,8 639,1 676,9 725,9 772,9
Gross domestic investment 101,8 107,4 116,4 129,2 145,3 151,1
Gross fixed capital formation 101,8 107,4 116,4 129,2 145,3 151,1
Construction 73,5 75,5 82,3 99,6 107,8 114,3
Equipment (durable goods) 28,4 32,0 34,2 29,6 37,5 36,8
Resource balance -117,3 -130,6 -98,9 -118,0 -136,7 -140,1
Exports (gnfs) 62,8 63,9 71,6 89,5 95,4 101,9
Goods (fob) 41,5 41,7 34,3 41,7 45,9 48,3
Non factor services 21,4 22,2 37,3 47,8 49,5 53,6
Imports (gnfs) 180,1 194,5 170,5 207,5 232,1 242,0
Goods (fob) 102,0 103,4 90,9 112,4 129,8 133,3
Non factor services 78,1 91,1 79,6 95,1 102,3 108,7
Gross Domestic Product 741,8 823,0 825,4 868,8 931,0 991,6
Source: MINECOFIN, Statistics Department
183

Monthly Evolution of Consumer Price Index(for the general index and the divisions index) Table 52003 = 100
Divisions Weights Jan.06 Febr.06 Mar.06 Apr.06 Mar.06 June06 July06 Aug.06 Sept.06 Oct.06 Nov.06 Dec.0601. Food and non-alcoholic 3 709 127,7 133,4 140,6 142,6 141,1 145,2 147,0 150,1 150,0 149,9 148,5 151,4 - Bread and cereals 625 129,1 132,8 137,2 144,8 147,5 151,2 147,4 143,0 142,5 144,2 150,3 153,8 - Meat 345 122,4 122,0 119,6 120,5 119,8 122,2 121,8 121,1 120,6 120,2 119,5 120,6 - Fish 114 133,6 135,2 142,7 146,6 144,4 144,0 142,2 140,8 137,4 137,3 145,6 142,3 - Vegetables 1 332 126,9 137,5 152,7 152,0 147,9 155,6 161,9 171,4 170,1 171,4 163,7 167,8 - Non-alcoholic beverages 180 123,3 123,8 125,2 125,5 125,2 125,2 125,4 125,4 125,6 125,7 125,6 125,102. Alcoholic beverages and 221 114,7 115,1 115,0 114,9 115,3 115,3 115,2 115,5 115,6 116,2 117,2 117,603. Clothing and footwear 500 105,4 105,4 105,7 105,7 106,3 106,5 106,7 106,7 106,1 106,0 105,3 105,504. Housing, water, electricity, gas and other fuels
1 579 146,0 161,4 156,5 164,0 165,2 162,0 157,4 158,4 162,1 162,8 161,6 160,8
05. Furnishing, household equipment and routine
764 118,7 118,4 118,4 117,6 117,5 116,4 116,5 117,1 117,1 116,9 116,7 117,2
06. Health 708 106,3 106,5 105,6 105,7 105,9 106,5 107,5 107,3 106,4 107,5 108,0 109,807. Transport 987 114,3 115,1 115,5 115,5 116,0 116,1 115,8 116,0 123,0 122,9 122,9 121,708. Communication 37 109,2 109,9 110,1 110,1 110,1 110,1 110,1 110,1 110,7 135,7 135,9 135,909. Recreation and culture 206 112,9 112,8 113,3 113,2 113,3 113,2 113,1 113,3 112,6 112,4 113,1 113,810. Education 432 139,5 139,5 139,5 139,5 139,5 139,5 139,5 139,3 139,5 139,5 139,5 139,511. Restaurants and hotels 273 113,3 111,6 111,5 109,0 110,3 115,6 115,1 115,8 124,0 125,3 126,1 125,612. Miscellaneous goods and 584 109,5 109,4 109,5 109,5 109,2 109,6 109,5 109,9 109,9 109,6 109,7 109,7
GENERAL INDEX 10 000 124,4 128,9 130,8 132,6 132,4 133,5 133,5 134,9 136,3 136,5 135,9 136,9Monthly changes 1,8 3,7 1,5 1,4 -0,2 0,9 0,0 1,0 1,0 0,2 -0,5 0,8Changes over 12 months 5,2 7,8 6,8 7,5 7,9 9,4 9,4 9,2 9,3 10,6 11,4 12,1
Source: NBR, Research Department
2006
184
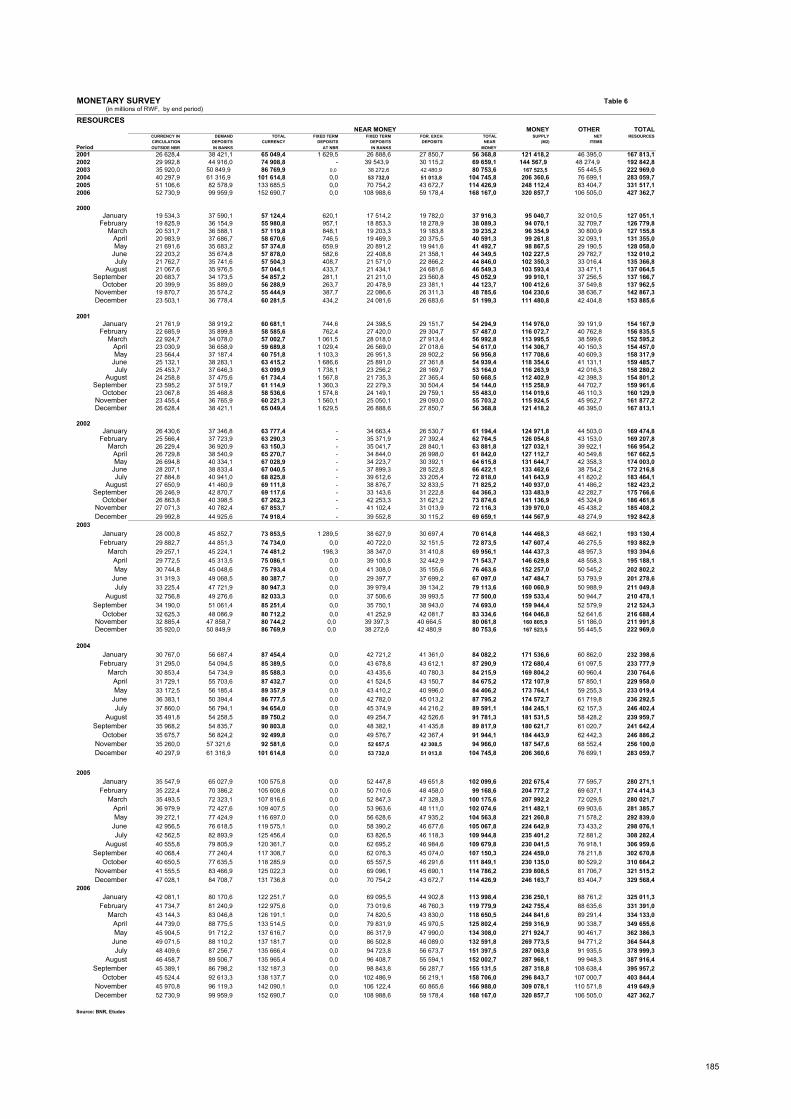
MONETARY SURVEY Table 6 (in millions of RWF, by end period)
RESOURCESMONEY OTHER TOTAL
CURRENCY IN DEMAND TOTAL FIXED TERM FIXED TERM FOR. EXCH. TOTAL SUPPLY NET RESOURCES CIRCULATION DEPOSITS CURRENCY DEPOSITS DEPOSITS DEPOSITS NEAR (M2) ITEMS
Period OUTSIDE NBR IN BANKS AT NBR IN BANKS MONEY
2001 26 628,4 38 421,1 65 049,4 1 629,5 26 888,6 27 850,7 56 368,8 121 418,2 46 395,0 167 813,12002 29 992,8 44 916,0 74 908,8 - 39 543,9 30 115,2 69 659,1 144 567,9 48 274,9 192 842,82003 35 920,0 50 849,9 86 769,9 0,0 38 272,6 42 480,9 80 753,6 167 523,5 55 445,5 222 969,02004 40 297,9 61 316,9 101 614,8 0,0 53 732,0 51 013,8 104 745,8 206 360,6 76 699,1 283 059,72005 51 106,6 82 578,9 133 685,5 0,0 70 754,2 43 672,7 114 426,9 248 112,4 83 404,7 331 517,12006 52 730,9 99 959,9 152 690,7 0,0 108 988,6 59 178,4 168 167,0 320 857,7 106 505,0 427 362,7
2000January 19 534,3 37 590,1 57 124,4 620,1 17 514,2 19 782,0 37 916,3 95 040,7 32 010,5 127 051,1
February 19 825,9 36 154,9 55 980,8 957,1 18 853,3 18 278,9 38 089,3 94 070,1 32 709,7 126 779,8March 20 531,7 36 588,1 57 119,8 848,1 19 203,3 19 183,8 39 235,2 96 354,9 30 800,9 127 155,8
April 20 983,9 37 686,7 58 670,6 746,5 19 469,3 20 375,5 40 591,3 99 261,8 32 093,1 131 355,0May 21 691,6 35 683,2 57 374,8 659,9 20 891,2 19 941,6 41 492,7 98 867,5 29 190,5 128 058,0
June 22 203,2 35 674,8 57 878,0 582,6 22 408,8 21 358,1 44 349,5 102 227,5 29 782,7 132 010,2July 21 762,7 35 741,6 57 504,3 408,7 21 571,0 22 866,2 44 846,0 102 350,3 33 016,4 135 366,8
August 21 067,6 35 976,5 57 044,1 433,7 21 434,1 24 681,6 46 549,3 103 593,4 33 471,1 137 064,5September 20 683,7 34 173,5 54 857,2 281,1 21 211,0 23 560,8 45 052,9 99 910,1 37 256,5 137 166,7
October 20 399,9 35 889,0 56 288,9 263,7 20 478,9 23 381,1 44 123,7 100 412,6 37 549,8 137 962,5November 19 870,7 35 574,2 55 444,9 387,7 22 086,6 26 311,3 48 785,6 104 230,6 38 636,7 142 867,3December 23 503,1 36 778,4 60 281,5 434,2 24 081,6 26 683,6 51 199,3 111 480,8 42 404,8 153 885,6
2001January 21 761,9 38 919,2 60 681,1 744,6 24 398,5 29 151,7 54 294,9 114 976,0 39 191,9 154 167,9
February 22 685,9 35 899,8 58 585,6 762,4 27 420,0 29 304,7 57 487,0 116 072,7 40 762,8 156 835,5March 22 924,7 34 078,0 57 002,7 1 061,5 28 018,0 27 913,4 56 992,8 113 995,5 38 599,6 152 595,2
April 23 030,9 36 658,9 59 689,8 1 029,4 26 569,0 27 018,6 54 617,0 114 306,7 40 150,3 154 457,0May 23 564,4 37 187,4 60 751,8 1 103,3 26 951,3 28 902,2 56 956,8 117 708,6 40 609,3 158 317,9
June 25 132,1 38 283,1 63 415,2 1 686,6 25 891,0 27 361,8 54 939,4 118 354,6 41 131,1 159 485,7July 25 453,7 37 646,3 63 099,9 1 738,1 23 256,2 28 169,7 53 164,0 116 263,9 42 016,3 158 280,2
August 24 258,8 37 475,6 61 734,4 1 567,8 21 735,3 27 365,4 50 668,5 112 402,9 42 398,3 154 801,2September 23 595,2 37 519,7 61 114,9 1 360,3 22 279,3 30 504,4 54 144,0 115 258,9 44 702,7 159 961,6
October 23 067,8 35 468,8 58 536,6 1 574,8 24 149,1 29 759,1 55 483,0 114 019,6 46 110,3 160 129,9November 23 455,4 36 765,9 60 221,3 1 560,1 25 050,1 29 093,0 55 703,2 115 924,5 45 952,7 161 877,2December 26 628,4 38 421,1 65 049,4 1 629,5 26 888,6 27 850,7 56 368,8 121 418,2 46 395,0 167 813,1
2002January 26 430,6 37 346,8 63 777,4 - 34 663,4 26 530,7 61 194,4 124 971,8 44 503,0 169 474,8
February 25 566,4 37 723,9 63 290,3 - 35 371,9 27 392,4 62 764,5 126 054,8 43 153,0 169 207,8March 26 229,4 36 920,9 63 150,3 - 35 041,7 28 840,1 63 881,8 127 032,1 39 922,1 166 954,2
April 26 729,8 38 540,9 65 270,7 - 34 844,0 26 998,0 61 842,0 127 112,7 40 549,8 167 662,5May 26 694,8 40 334,1 67 028,9 - 34 223,7 30 392,1 64 615,8 131 644,7 42 358,3 174 003,0
June 28 207,1 38 833,4 67 040,5 - 37 899,3 28 522,8 66 422,1 133 462,6 38 754,2 172 216,8July 27 884,8 40 941,0 68 825,8 - 39 612,6 33 205,4 72 818,0 141 643,9 41 820,2 183 464,1
August 27 650,9 41 460,9 69 111,8 - 38 876,7 32 833,5 71 825,2 140 937,0 41 486,2 182 423,2September 26 246,9 42 870,7 69 117,6 - 33 143,6 31 222,8 64 366,3 133 483,9 42 282,7 175 766,6
October 26 863,8 40 398,5 67 262,3 - 42 253,3 31 621,2 73 874,6 141 136,9 45 324,9 186 461,8November 27 071,3 40 782,4 67 853,7 - 41 102,4 31 013,9 72 116,3 139 970,0 45 438,2 185 408,2December 29 992,8 44 925,6 74 918,4 - 39 552,8 30 115,2 69 659,1 144 567,9 48 274,9 192 842,8
2003January 28 000,8 45 852,7 73 853,5 1 289,5 38 627,9 30 697,4 70 614,8 144 468,3 48 662,1 193 130,4
February 29 882,7 44 851,3 74 734,0 0,0 40 722,0 32 151,5 72 873,5 147 607,4 46 275,5 193 882,9March 29 257,1 45 224,1 74 481,2 198,3 38 347,0 31 410,8 69 956,1 144 437,3 48 957,3 193 394,6
April 29 772,5 45 313,5 75 086,1 0,0 39 100,8 32 442,9 71 543,7 146 629,8 48 558,3 195 188,1May 30 744,8 45 048,6 75 793,4 0,0 41 308,0 35 155,6 76 463,6 152 257,0 50 545,2 202 802,2
June 31 319,3 49 068,5 80 387,7 0,0 29 397,7 37 699,2 67 097,0 147 484,7 53 793,9 201 278,6July 33 225,4 47 721,9 80 947,3 0,0 39 979,4 39 134,2 79 113,6 160 060,9 50 988,9 211 049,8
August 32 756,8 49 276,6 82 033,3 0,0 37 506,6 39 993,5 77 500,0 159 533,4 50 944,7 210 478,1September 34 190,0 51 061,4 85 251,4 0,0 35 750,1 38 943,0 74 693,0 159 944,4 52 579,9 212 524,3
October 32 625,3 48 086,9 80 712,2 0,0 41 252,9 42 081,7 83 334,6 164 046,8 52 641,6 216 688,4November 32 885,4 47 858,7 80 744,2 0,0 39 397,3 40 664,5 80 061,8 160 805,9 51 186,0 211 991,8December 35 920,0 50 849,9 86 769,9 0,0 38 272,6 42 480,9 80 753,6 167 523,5 55 445,5 222 969,0
2004January 30 767,0 56 687,4 87 454,4 0,0 42 721,2 41 361,0 84 082,2 171 536,6 60 862,0 232 398,6
February 31 295,0 54 094,5 85 389,5 0,0 43 678,8 43 612,1 87 290,9 172 680,4 61 097,5 233 777,9March 30 853,4 54 734,9 85 588,3 0,0 43 435,6 40 780,3 84 215,9 169 804,2 60 960,4 230 764,6
April 31 729,1 55 703,6 87 432,7 0,0 41 524,5 43 150,7 84 675,2 172 107,9 57 850,1 229 958,0May 33 172,5 56 185,4 89 357,9 0,0 43 410,2 40 996,0 84 406,2 173 764,1 59 255,3 233 019,4
June 36 383,1 50 394,4 86 777,5 0,0 42 782,0 45 013,2 87 795,2 174 572,7 61 719,8 236 292,5July 37 860,0 56 794,1 94 654,0 0,0 45 374,9 44 216,2 89 591,1 184 245,1 62 157,3 246 402,4
August 35 491,8 54 258,5 89 750,2 0,0 49 254,7 42 526,6 91 781,3 181 531,5 58 428,2 239 959,7September 35 968,2 54 835,7 90 803,8 0,0 48 382,1 41 435,8 89 817,9 180 621,7 61 020,7 241 642,4
October 35 675,7 56 824,2 92 499,8 0,0 49 576,7 42 367,4 91 944,1 184 443,9 62 442,3 246 886,2November 35 260,0 57 321,6 92 581,6 0,0 52 657,5 42 308,5 94 966,0 187 547,6 68 552,4 256 100,0December 40 297,9 61 316,9 101 614,8 0,0 53 732,0 51 013,8 104 745,8 206 360,6 76 699,1 283 059,7
2005January 35 547,9 65 027,9 100 575,8 0,0 52 447,8 49 651,8 102 099,6 202 675,4 77 595,7 280 271,1
February 35 222,4 70 386,2 105 608,6 0,0 50 710,6 48 458,0 99 168,6 204 777,2 69 637,1 274 414,3March 35 493,5 72 323,1 107 816,6 0,0 52 847,3 47 328,3 100 175,6 207 992,2 72 029,5 280 021,7
April 36 979,9 72 427,6 109 407,5 0,0 53 963,6 48 111,0 102 074,6 211 482,1 69 903,6 281 385,7May 39 272,1 77 424,9 116 697,0 0,0 56 628,6 47 935,2 104 563,8 221 260,8 71 578,2 292 839,0
June 42 956,5 76 618,5 119 575,1 0,0 58 390,2 46 677,6 105 067,8 224 642,9 73 433,2 298 076,1July 42 562,5 82 893,9 125 456,4 0,0 63 826,5 46 118,3 109 944,8 235 401,2 72 881,2 308 282,4
August 40 555,8 79 805,9 120 361,7 0,0 62 695,2 46 984,6 109 679,8 230 041,5 76 918,1 306 959,6September 40 068,4 77 240,4 117 308,7 0,0 62 076,3 45 074,0 107 150,3 224 459,0 78 211,8 302 670,8
October 40 650,5 77 635,5 118 285,9 0,0 65 557,5 46 291,6 111 849,1 230 135,0 80 529,2 310 664,2November 41 555,5 83 466,9 125 022,3 0,0 69 096,1 45 690,1 114 786,2 239 808,5 81 706,7 321 515,2December 47 028,1 84 708,7 131 736,8 0,0 70 754,2 43 672,7 114 426,9 246 163,7 83 404,7 329 568,4
2006January 42 081,1 80 170,6 122 251,7 0,0 69 095,5 44 902,8 113 998,4 236 250,1 88 761,2 325 011,3
February 41 734,7 81 240,9 122 975,6 0,0 73 019,6 46 760,3 119 779,9 242 755,4 88 635,6 331 391,0March 43 144,3 83 046,8 126 191,1 0,0 74 820,5 43 830,0 118 650,5 244 841,6 89 291,4 334 133,0
April 44 739,0 88 775,5 133 514,5 0,0 79 831,9 45 970,5 125 802,4 259 316,9 90 338,7 349 655,6May 45 904,5 91 712,2 137 616,7 0,0 86 317,9 47 990,0 134 308,0 271 924,7 90 461,7 362 386,3
June 49 071,5 88 110,2 137 181,7 0,0 86 502,8 46 089,0 132 591,8 269 773,5 94 771,2 364 544,8July 48 409,6 87 256,7 135 666,4 0,0 94 723,8 56 673,7 151 397,5 287 063,8 91 935,5 378 999,3
August 46 458,7 89 506,7 135 965,4 0,0 96 408,7 55 594,1 152 002,7 287 968,1 99 948,3 387 916,4September 45 389,1 86 798,2 132 187,3 0,0 98 843,8 56 287,7 155 131,5 287 318,8 108 638,4 395 957,2
October 45 524,4 92 613,3 138 137,7 0,0 102 486,9 56 219,1 158 706,0 296 843,7 107 000,7 403 844,4November 45 970,8 96 119,3 142 090,1 0,0 106 122,4 60 865,6 166 988,0 309 078,1 110 571,8 419 649,9December 52 730,9 99 959,9 152 690,7 0,0 108 988,6 59 178,4 168 167,0 320 857,7 106 505,0 427 362,7
Source: BNR, Etudes
NEAR MONEY
185
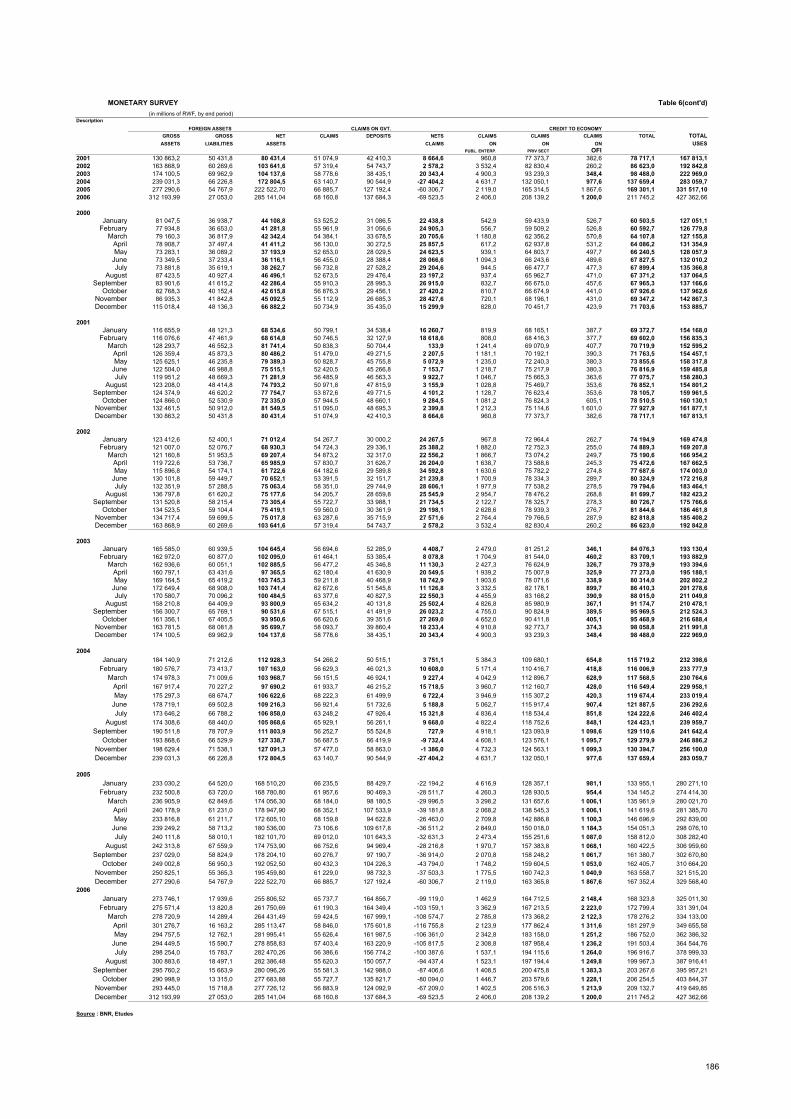
MONETARY SURVEY Table 6(cont'd) (in millions of RWF, by end period)
DescriptionFOREIGN ASSETS CLAIMS ON GVT. CREDIT TO ECONOMY
GROSS GROSS NET CLAIMS DEPOSITS NETS CLAIMS CLAIMS CLAIMS TOTAL TOTALASSETS LIABILITIES ASSETS CLAIMS ON ON ON USES
PUBL. ENTERP. PRIV SECT OFI2001 130 863,2 50 431,8 80 431,4 51 074,9 42 410,3 8 664,6 960,8 77 373,7 382,6 78 717,1 167 813,12002 163 868,9 60 269,6 103 641,6 57 319,4 54 743,7 2 578,2 3 532,4 82 830,4 260,2 86 623,0 192 842,82003 174 100,5 69 962,9 104 137,6 58 778,6 38 435,1 20 343,4 4 900,3 93 239,3 348,4 98 488,0 222 969,02004 239 031,3 66 226,8 172 804,5 63 140,7 90 544,9 -27 404,2 4 631,7 132 050,1 977,6 137 659,4 283 059,72005 277 290,6 54 767,9 222 522,70 66 885,7 127 192,4 -60 306,7 2 119,0 165 314,5 1 867,6 169 301,1 331 517,102006 312 193,99 27 053,0 285 141,04 68 160,8 137 684,3 -69 523,5 2 406,0 208 139,2 1 200,0 211 745,2 427 362,66
2000January 81 047,5 36 938,7 44 108,8 53 525,2 31 086,5 22 438,8 542,9 59 433,9 526,7 60 503,5 127 051,1
February 77 934,8 36 653,0 41 281,8 55 961,9 31 056,6 24 905,3 556,7 59 509,2 526,8 60 592,7 126 779,8March 79 160,3 36 817,9 42 342,4 54 384,1 33 678,5 20 705,6 1 180,8 62 356,2 570,8 64 107,8 127 155,8
April 78 908,7 37 497,4 41 411,2 56 130,0 30 272,5 25 857,5 617,2 62 937,8 531,2 64 086,2 131 354,9May 73 283,1 36 089,2 37 193,9 52 653,0 28 029,5 24 623,5 939,1 64 803,7 497,7 66 240,5 128 057,9
June 73 349,5 37 233,4 36 116,1 56 455,0 28 388,4 28 066,6 1 094,3 66 243,6 489,6 67 827,5 132 010,2July 73 881,8 35 619,1 38 262,7 56 732,8 27 528,2 29 204,6 944,5 66 477,7 477,3 67 899,4 135 366,8
August 87 423,5 40 927,4 46 496,1 52 673,5 29 476,4 23 197,2 937,4 65 962,7 471,0 67 371,2 137 064,5September 83 901,6 41 615,2 42 286,4 55 910,3 28 995,3 26 915,0 832,7 66 675,0 457,6 67 965,3 137 166,6
October 82 768,3 40 152,4 42 615,8 56 876,3 29 456,1 27 420,2 810,7 66 674,9 441,0 67 926,6 137 962,6November 86 935,3 41 842,8 45 092,5 55 112,9 26 685,3 28 427,6 720,1 68 196,1 431,0 69 347,2 142 867,3December 115 018,4 48 136,3 66 882,2 50 734,9 35 435,0 15 299,9 828,0 70 451,7 423,9 71 703,6 153 885,7
2001January 116 655,9 48 121,3 68 534,6 50 799,1 34 538,4 16 260,7 819,9 68 165,1 387,7 69 372,7 154 168,0
February 116 076,6 47 461,9 68 614,8 50 746,5 32 127,9 18 618,6 808,0 68 416,3 377,7 69 602,0 156 835,3March 128 293,7 46 552,3 81 741,4 50 838,3 50 704,4 133,9 1 241,4 69 070,9 407,7 70 719,9 152 595,2
April 126 359,4 45 873,3 80 486,2 51 479,0 49 271,5 2 207,5 1 181,1 70 192,1 390,3 71 763,5 154 457,1May 125 625,1 46 235,8 79 389,3 50 828,7 45 755,8 5 072,9 1 235,0 72 240,3 380,3 73 855,6 158 317,8
June 122 504,0 46 988,8 75 515,1 52 420,5 45 266,8 7 153,7 1 218,7 75 217,9 380,3 76 816,9 159 485,8July 119 951,2 48 669,3 71 281,9 56 485,9 46 563,3 9 922,7 1 046,7 75 665,3 363,6 77 075,7 158 280,3
August 123 208,0 48 414,8 74 793,2 50 971,8 47 815,9 3 155,9 1 028,8 75 469,7 353,6 76 852,1 154 801,2September 124 374,9 46 620,2 77 754,7 53 872,6 49 771,5 4 101,2 1 128,7 76 623,4 353,6 78 105,7 159 961,5
October 124 866,0 52 530,9 72 335,0 57 944,5 48 660,1 9 284,5 1 081,2 76 824,3 605,1 78 510,5 160 130,1November 132 461,5 50 912,0 81 549,5 51 095,0 48 695,3 2 399,8 1 212,3 75 114,6 1 601,0 77 927,9 161 877,1December 130 863,2 50 431,8 80 431,4 51 074,9 42 410,3 8 664,6 960,8 77 373,7 382,6 78 717,1 167 813,1
2002January 123 412,6 52 400,1 71 012,4 54 267,7 30 000,2 24 267,5 967,8 72 964,4 262,7 74 194,9 169 474,8
February 121 007,0 52 076,7 68 930,3 54 724,3 29 336,1 25 388,2 1 882,0 72 752,3 255,0 74 889,3 169 207,8March 121 160,8 51 953,5 69 207,4 54 873,2 32 317,0 22 556,2 1 866,7 73 074,2 249,7 75 190,6 166 954,2
April 119 722,6 53 736,7 65 985,9 57 830,7 31 626,7 26 204,0 1 638,7 73 588,6 245,3 75 472,6 167 662,5May 115 896,8 54 174,1 61 722,6 64 182,6 29 589,8 34 592,8 1 630,6 75 782,2 274,8 77 687,6 174 003,0
June 130 101,8 59 449,7 70 652,1 53 391,5 32 151,7 21 239,8 1 700,9 78 334,3 289,7 80 324,9 172 216,8July 132 351,9 57 288,5 75 063,4 58 351,0 29 744,9 28 606,1 1 977,9 77 538,2 278,5 79 794,6 183 464,1
August 136 797,8 61 620,2 75 177,6 54 205,7 28 659,8 25 545,9 2 954,7 78 476,2 268,8 81 699,7 182 423,2September 131 520,8 58 215,4 73 305,4 55 722,7 33 988,1 21 734,5 2 122,7 78 325,7 278,3 80 726,7 175 766,6
October 134 523,5 59 104,4 75 419,1 59 560,0 30 361,9 29 198,1 2 628,6 78 939,3 276,7 81 844,6 186 461,8November 134 717,4 59 699,5 75 017,8 63 287,6 35 715,9 27 571,6 2 764,4 79 766,5 287,9 82 818,8 185 408,2December 163 868,9 60 269,6 103 641,6 57 319,4 54 743,7 2 578,2 3 532,4 82 830,4 260,2 86 623,0 192 842,8
2003January 165 585,0 60 939,5 104 645,4 56 694,6 52 285,9 4 408,7 2 479,0 81 251,2 346,1 84 076,3 193 130,4
February 162 972,0 60 877,0 102 095,0 61 464,1 53 385,4 8 078,8 1 704,9 81 544,0 460,2 83 709,1 193 882,9March 162 936,6 60 051,1 102 885,5 56 477,2 45 346,8 11 130,3 2 427,3 76 624,9 326,7 79 378,9 193 394,6
April 160 797,1 63 431,6 97 365,5 62 180,4 41 630,9 20 549,5 1 939,2 75 007,9 325,9 77 273,0 195 188,1May 169 164,5 65 419,2 103 745,3 59 211,8 40 468,9 18 742,9 1 903,6 78 071,6 338,9 80 314,0 202 802,2
June 172 649,4 68 908,0 103 741,4 62 672,6 51 545,8 11 126,8 3 332,5 82 178,1 899,7 86 410,3 201 278,6July 170 580,7 70 096,2 100 484,5 63 377,6 40 827,3 22 550,3 4 455,9 83 168,2 390,9 88 015,0 211 049,8
August 158 210,8 64 409,9 93 800,9 65 634,2 40 131,8 25 502,4 4 826,8 85 980,9 367,1 91 174,7 210 478,1September 156 300,7 65 769,1 90 531,6 67 515,1 41 491,9 26 023,2 4 755,0 90 824,9 389,5 95 969,5 212 524,3
October 161 356,1 67 405,5 93 950,6 66 620,6 39 351,6 27 269,0 4 652,0 90 411,8 405,1 95 468,9 216 688,4November 163 781,5 68 081,8 95 699,7 58 093,7 39 860,4 18 233,4 4 910,8 92 773,7 374,3 98 058,8 211 991,8December 174 100,5 69 962,9 104 137,6 58 778,6 38 435,1 20 343,4 4 900,3 93 239,3 348,4 98 488,0 222 969,0
2004January 184 140,9 71 212,6 112 928,3 54 266,2 50 515,1 3 751,1 5 384,3 109 680,1 654,8 115 719,2 232 398,6
February 180 576,7 73 413,7 107 163,0 56 629,3 46 021,3 10 608,0 5 171,4 110 416,7 418,8 116 006,9 233 777,9March 174 978,3 71 009,6 103 968,7 56 151,5 46 924,1 9 227,4 4 042,9 112 896,7 628,9 117 568,5 230 764,6
April 167 917,4 70 227,2 97 690,2 61 933,7 46 215,2 15 718,5 3 960,7 112 160,7 428,0 116 549,4 229 958,1May 175 297,3 68 674,7 106 622,6 68 222,3 61 499,9 6 722,4 3 946,9 115 307,2 420,3 119 674,4 233 019,4
June 178 719,1 69 502,8 109 216,3 56 921,4 51 732,6 5 188,8 5 062,7 115 917,4 907,4 121 887,5 236 292,6July 173 646,2 66 788,2 106 858,0 63 248,2 47 926,4 15 321,8 4 836,4 118 534,4 851,8 124 222,6 246 402,4
August 174 308,6 68 440,0 105 868,6 65 929,1 56 261,1 9 668,0 4 822,4 118 752,6 848,1 124 423,1 239 959,7September 190 511,8 78 707,9 111 803,9 56 252,7 55 524,8 727,9 4 918,1 123 093,9 1 098,6 129 110,6 241 642,4
October 193 868,6 66 529,9 127 338,7 56 687,5 66 419,9 -9 732,4 4 608,1 123 576,1 1 095,7 129 279,9 246 886,2November 198 629,4 71 538,1 127 091,3 57 477,0 58 863,0 -1 386,0 4 732,3 124 563,1 1 099,3 130 394,7 256 100,0December 239 031,3 66 226,8 172 804,5 63 140,7 90 544,9 -27 404,2 4 631,7 132 050,1 977,6 137 659,4 283 059,7
2005January 233 030,2 64 520,0 168 510,20 66 235,5 88 429,7 -22 194,2 4 616,9 128 357,1 981,1 133 955,1 280 271,10
February 232 500,8 63 720,0 168 780,80 61 957,6 90 469,3 -28 511,7 4 260,3 128 930,5 954,4 134 145,2 274 414,30March 236 905,9 62 849,6 174 056,30 68 184,0 98 180,5 -29 996,5 3 298,2 131 657,6 1 006,1 135 961,9 280 021,70
April 240 178,9 61 231,0 178 947,90 68 352,1 107 533,9 -39 181,8 2 068,2 138 545,3 1 006,1 141 619,6 281 385,70May 233 816,8 61 211,7 172 605,10 68 159,8 94 622,8 -26 463,0 2 709,8 142 886,8 1 100,3 146 696,9 292 839,00
June 239 249,2 58 713,2 180 536,00 73 106,6 109 617,8 -36 511,2 2 849,0 150 018,0 1 184,3 154 051,3 298 076,10July 240 111,8 58 010,1 182 101,70 69 012,0 101 643,3 -32 631,3 2 473,4 155 251,6 1 087,0 158 812,0 308 282,40
August 242 313,8 67 559,9 174 753,90 66 752,6 94 969,4 -28 216,8 1 970,7 157 383,8 1 068,1 160 422,5 306 959,60September 237 029,0 58 824,9 178 204,10 60 276,7 97 190,7 -36 914,0 2 070,8 158 248,2 1 061,7 161 380,7 302 670,80
October 249 002,8 56 950,3 192 052,50 60 432,3 104 226,3 -43 794,0 1 748,2 159 604,5 1 053,0 162 405,7 310 664,20November 250 825,1 55 365,3 195 459,80 61 229,0 98 732,3 -37 503,3 1 775,5 160 742,3 1 040,9 163 558,7 321 515,20December 277 290,6 54 767,9 222 522,70 66 885,7 127 192,4 -60 306,7 2 119,0 163 365,8 1 867,6 167 352,4 329 568,40
2006January 273 746,1 17 939,6 255 806,52 65 737,7 164 856,7 -99 119,0 1 462,9 164 712,5 2 148,4 168 323,8 325 011,30
February 275 571,4 13 820,8 261 750,69 61 190,3 164 349,4 -103 159,1 3 362,9 167 213,5 2 223,0 172 799,4 331 391,04March 278 720,9 14 289,4 264 431,49 59 424,5 167 999,1 -108 574,7 2 785,8 173 368,2 2 122,3 178 276,2 334 133,00
April 301 276,7 16 163,2 285 113,47 58 846,0 175 601,8 -116 755,8 2 123,9 177 862,4 1 311,6 181 297,9 349 655,58May 294 757,5 12 762,1 281 995,41 55 626,4 161 987,5 -106 361,0 2 342,8 183 158,0 1 251,2 186 752,0 362 386,32
June 294 449,5 15 590,7 278 858,83 57 403,4 163 220,9 -105 817,5 2 308,8 187 958,4 1 236,2 191 503,4 364 544,76July 298 254,0 15 783,7 282 470,26 56 386,6 156 774,2 -100 387,6 1 537,1 194 115,6 1 264,0 196 916,7 378 999,33
August 300 883,6 18 497,1 282 386,48 55 620,3 150 057,7 -94 437,4 1 523,1 197 194,4 1 249,8 199 967,3 387 916,41September 295 760,2 15 663,9 280 096,26 55 581,3 142 988,0 -87 406,6 1 408,5 200 475,8 1 383,3 203 267,6 395 957,21
October 290 998,9 13 315,0 277 683,88 55 727,7 135 821,7 -80 094,0 1 446,7 203 579,6 1 228,1 206 254,5 403 844,37November 293 445,0 15 718,8 277 726,12 56 883,9 124 092,9 -67 209,0 1 402,5 206 516,3 1 213,9 209 132,7 419 649,85December 312 193,99 27 053,0 285 141,04 68 160,8 137 684,3 -69 523,5 2 406,0 208 139,2 1 200,0 211 745,2 427 362,66
Source : BNR, Etudes
186
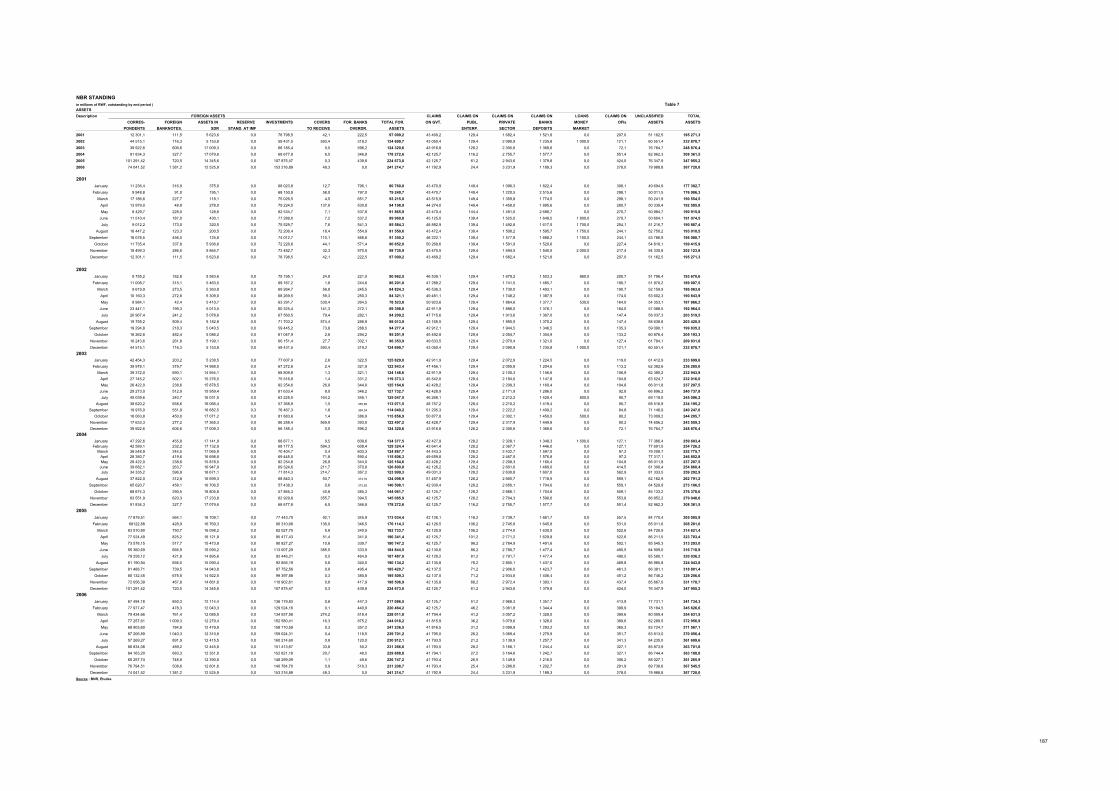
NBR STANDING in millions of RWF, outstanding by end period ) Table 7ASSETSDescription CLAIMS CLAIMS ON CLAIMS ON CLAIMS ON LOANS CLAIMS ON UNCLASSIFIED TOTAL
CORRES- FOREIGN ASSETS IN RESERVE INVESTMENTS COVERS FOR. BANKS TOTAL FOR. ON GVT. PUBL. PRIVATE BANKS MONEY OFIs ASSETS ASSETSPONDENTS BANKNOTES. SDR STAND. AT IMF TO RECEIVE OVERDR. ASSETS ENTERP. SECTOR DEPOSITS MARKET
2001 12 301,1 111,5 5 623,6 0,0 78 798,5 42,1 222,5 97 099,2 43 469,2 129,4 1 682,4 1 521,8 0,0 207,0 51 162,5 195 271,32002 44 515,1 116,3 5 153,8 0,0 59 431,5 593,4 319,2 124 699,7 43 050,4 129,4 2 090,9 1 235,8 1 000,0 121,1 60 551,4 232 878,72003 39 922,6 606,6 17 009,3 0,0 66 185,4 0,5 596,2 124 320,6 43 916,8 128,2 2 305,6 1 368,6 0,0 72,1 76 764,7 248 876,42004 91 834,3 327,7 17 079,6 0,0 68 677,8 6,5 346,8 178 272,6 42 125,7 116,2 2 755,7 1 577,7 0,0 551,4 82 962,3 308 361,52005 101 291,42 720,5 14 345,6 0,0 107 875,47 0,3 439,8 224 673,0 42 125,7 61,2 2 943,6 1 379,8 0,0 424,0 76 347,9 347 955,22006 74 041,52 1 381,2 12 525,9 0,0 153 216,89 49,3 0,0 241 214,7 41 792,9 24,4 3 231,9 1 189,3 0,0 278,0 79 988,8 367 720,0
2001January 11 236,4 316,9 375,0 0,0 68 023,8 12,7 796,1 80 760,8 43 470,9 149,4 1 096,3 1 822,4 0,0 308,1 49 694,9 177 302,7
February 9 948,8 91,0 195,1 0,0 68 150,9 58,0 797,0 79 240,7 43 470,7 149,4 1 220,5 2 515,6 0,0 298,1 50 011,5 176 906,3March 17 186,6 227,7 118,1 0,0 75 026,5 4,5 651,7 93 215,0 43 515,9 149,4 1 359,8 1 774,5 0,0 298,1 50 241,9 190 554,5
April 13 979,0 48,8 278,0 0,0 79 224,5 137,8 530,8 94 198,9 44 274,0 149,4 1 458,0 1 885,6 0,0 280,7 50 339,4 192 585,8May 8 429,7 228,0 128,6 0,0 82 534,7 7,1 537,8 91 865,9 43 470,4 144,4 1 491,0 2 688,7 0,0 270,7 50 984,7 190 915,8
June 11 510,4 187,0 430,1 0,0 77 289,0 7,2 537,2 89 960,8 45 125,0 139,4 1 525,0 1 649,5 1 800,0 270,7 50 604,1 191 074,5July 9 012,2 173,0 320,5 0,0 75 529,7 7,6 541,3 85 584,3 48 882,9 139,4 1 492,6 1 617,5 1 700,0 254,1 51 216,7 190 887,4
August 18 447,2 123,3 200,5 0,0 72 206,4 18,4 554,9 91 550,6 43 472,4 139,4 1 508,2 1 595,7 1 750,0 244,1 52 750,2 193 010,5September 16 078,5 456,5 125,8 0,0 74 012,7 110,1 566,6 91 350,2 46 222,1 139,4 1 577,9 1 668,2 1 100,0 244,1 53 786,9 196 088,7
October 11 735,4 337,8 5 936,6 0,0 72 226,6 44,1 571,4 90 852,0 50 268,6 139,4 1 591,9 1 520,6 0,0 227,4 54 816,1 199 415,9November 18 499,3 286,5 5 864,7 0,0 73 482,7 32,3 570,5 98 735,9 43 470,5 129,4 1 694,5 1 540,5 2 000,0 217,4 54 335,8 202 123,8December 12 301,1 111,5 5 623,6 0,0 78 798,5 42,1 222,5 97 099,2 43 469,2 129,4 1 682,4 1 521,8 0,0 207,0 51 162,5 195 271,3
2002January 9 755,2 182,8 5 583,6 0,0 75 195,1 24,9 221,0 90 962,5 46 539,1 129,4 1 679,2 1 503,3 860,0 200,7 51 796,4 193 670,6
February 11 008,7 315,1 5 463,5 0,0 69 167,2 1,8 244,6 86 201,0 47 289,2 129,4 1 741,5 1 485,7 0,0 190,7 51 970,2 189 007,5March 9 619,9 273,5 5 363,8 0,0 69 264,7 56,8 245,5 84 824,3 45 536,3 129,4 1 730,0 1 493,1 0,0 190,7 52 159,9 186 063,6
April 10 160,3 272,8 5 309,0 0,0 68 269,5 59,3 250,3 84 321,1 49 481,1 129,4 1 748,2 1 387,9 0,0 174,0 53 602,3 190 843,9May 8 984,1 42,4 5 410,7 0,0 63 291,7 530,4 264,5 78 523,8 50 923,6 129,4 1 864,6 1 377,7 530,0 164,0 54 353,1 187 866,2
June 23 447,1 199,3 5 013,5 0,0 60 325,4 141,3 272,1 89 398,8 42 911,9 129,4 1 896,0 1 376,1 0,0 164,0 57 088,5 192 964,5July 20 967,4 241,2 5 078,6 0,0 67 560,5 79,4 282,1 94 209,2 47 715,6 129,4 1 913,6 1 367,0 0,0 147,4 58 037,3 203 519,5
August 19 755,2 509,4 5 182,8 0,0 71 703,2 574,4 288,9 98 013,9 43 165,5 129,4 1 955,5 1 370,2 0,0 147,4 58 638,8 203 420,5September 19 294,8 218,3 5 040,5 0,0 59 445,2 73,8 288,5 94 277,4 42 912,1 129,4 1 944,5 1 346,5 0,0 135,3 59 090,1 199 835,2
October 18 262,6 482,4 5 086,2 0,0 61 047,9 2,6 294,2 95 201,9 45 492,8 129,4 2 054,7 1 304,9 0,0 133,2 60 876,4 205 193,3November 16 243,6 261,8 5 199,1 0,0 60 151,4 27,7 302,1 96 353,9 49 633,5 129,4 2 070,4 1 321,0 0,0 127,4 61 784,1 209 831,8December 44 515,1 116,3 5 153,8 0,0 59 431,5 593,4 319,2 124 699,7 43 050,4 129,4 2 090,9 1 235,8 1 000,0 121,1 60 551,4 232 878,7
2003January 42 454,3 203,2 5 238,5 0,0 77 607,9 2,6 322,5 125 829,0 42 911,9 129,4 2 072,9 1 224,5 0,0 119,0 61 412,9 233 699,6
February 39 978,1 379,7 14 988,5 0,0 67 272,8 2,4 321,9 122 943,4 47 456,1 129,4 2 055,8 1 204,6 0,0 113,2 62 382,6 236 285,0March 39 372,0 690,1 14 954,1 0,0 68 809,9 1,3 321,1 124 148,6 42 911,9 129,4 2 100,3 1 156,6 0,0 106,9 62 390,2 232 943,9
April 27 745,2 502,1 15 276,5 0,0 75 516,9 1,4 331,2 119 373,3 45 542,0 129,4 2 194,0 1 147,8 0,0 104,8 63 524,7 232 016,0May 26 422,0 238,6 15 878,5 0,0 82 254,6 26,9 344,0 125 164,6 42 428,2 129,4 2 208,3 1 160,4 0,0 104,8 66 011,8 237 207,5
June 29 273,0 512,9 15 959,4 0,0 81 633,4 8,0 346,2 127 732,7 42 428,9 129,4 2 171,9 1 286,0 0,0 92,8 66 896,2 240 737,8July 45 039,6 240,7 16 031,5 0,0 63 225,5 164,2 346,1 125 047,5 46 268,1 129,4 2 212,2 1 429,4 800,0 90,7 69 119,0 245 096,2
August 38 620,2 658,6 16 066,4 0,0 57 368,9 1,5 355,89 113 071,5 48 757,2 129,4 2 210,2 1 419,4 0,0 90,7 68 516,9 234 195,2September 19 976,0 551,9 16 682,5 0,3 76 467,3 1,6 369,54 114 049,2 51 205,3 129,4 2 222,2 1 409,2 0,0 84,8 71 146,9 240 247,0
October 16 063,8 450,0 17 071,2 0,0 81 883,6 1,4 386,9 115 856,9 50 877,8 129,4 2 302,1 1 450,0 500,0 80,2 73 009,2 244 205,7November 17 633,3 277,2 17 365,3 0,0 86 258,4 569,9 393,0 122 497,2 42 428,7 129,4 2 317,9 1 449,8 0,0 80,2 74 656,2 243 559,3December 39 922,6 606,6 17 009,3 0,0 66 185,4 0,5 596,2 124 320,6 43 916,8 128,2 2 305,6 1 368,6 0,0 72,1 76 764,7 248 876,4
2004January 47 292,6 455,8 17 141,9 0,0 68 877,1 0,5 609,6 134 377,5 42 427,9 128,2 2 328,1 1 348,3 1 500,0 127,1 77 366,4 259 603,4
February 42 589,1 232,2 17 132,9 0,0 68 177,5 584,3 608,4 129 324,4 43 641,4 128,2 2 367,7 1 446,0 0,0 127,1 77 691,5 254 726,2March 36 548,9 244,5 17 065,9 0,0 70 404,7 0,4 603,3 124 867,7 44 443,3 128,2 2 432,7 1 597,0 0,0 97,2 79 209,7 252 775,7
April 28 380,7 419,6 16 698,8 0,0 69 445,0 71,8 590,4 115 606,3 49 659,8 128,2 2 467,5 1 576,8 0,0 97,2 77 317,1 246 852,8May 26 422,0 238,6 15 878,5 0,0 82 254,6 26,9 344,0 125 164,6 42 428,2 129,4 2 208,3 1 160,4 0,0 104,8 66 011,8 237 207,5
June 39 682,1 263,7 16 947,9 0,0 69 324,6 211,7 370,8 126 800,8 42 126,2 128,2 2 601,6 1 489,0 0,0 414,5 81 300,4 254 860,4July 34 335,2 596,9 16 671,1 0,0 71 814,3 214,7 367,2 123 999,3 49 031,3 128,2 2 630,8 1 607,0 0,0 562,9 81 333,5 259 292,9
August 37 822,0 312,8 16 699,3 0,0 68 840,3 50,7 373,76 124 098,9 51 457,9 128,2 2 665,7 1 718,5 0,0 559,1 82 162,9 262 791,2September 65 620,7 458,1 16 706,5 0,0 57 438,3 0,6 373,92 140 598,1 42 930,4 128,2 2 656,1 1 704,6 0,0 559,1 84 529,9 273 106,5
October 68 674,3 290,5 16 805,8 0,0 57 865,3 40,6 385,3 144 061,7 42 125,7 128,2 2 666,1 1 704,6 0,0 559,1 85 133,2 276 378,6November 63 551,9 620,3 17 233,8 0,0 62 929,8 355,7 394,5 145 085,9 42 125,7 128,2 2 704,3 1 598,6 0,0 553,8 86 852,2 279 048,6December 91 834,3 327,7 17 079,6 0,0 68 677,8 6,5 346,8 178 272,6 42 125,7 116,2 2 755,7 1 577,7 0,0 551,4 82 962,3 308 361,5
2005January 77 879,51 564,1 16 709,1 0,0 77 443,70 92,1 345,9 173 034,4 42 126,1 116,2 2 739,7 1 661,7 0,0 557,5 84 770,4 305 005,9
February 68122,88 428,9 16 769,3 0,0 90 310,68 136,0 346,5 176 114,3 42 126,5 106,2 2 745,8 1 645,8 0,0 531,0 85 011,6 308 281,0March 83 510,80 750,7 16 098,2 0,0 82 027,75 5,8 340,5 182 733,7 42 125,9 106,2 2 774,0 1 630,0 0,0 522,6 84 728,9 314 621,4
April 77 524,49 825,2 16 121,9 0,0 95 477,43 51,4 341,0 190 341,4 42 125,7 101,2 2 771,2 1 629,8 0,0 522,6 86 211,5 323 703,4May 73 578,15 517,7 15 473,8 0,0 90 827,27 10,6 339,7 180 747,2 42 125,7 96,2 2 784,9 1 491,6 0,0 502,1 85 545,3 313 293,0
June 55 360,69 666,9 15 090,2 0,0 113 007,29 385,5 333,9 184 844,5 42 130,6 86,2 2 780,7 1 477,4 0,0 490,5 84 909,0 316 718,9July 79 258,12 421,8 14 895,6 0,0 92 446,21 0,5 464,9 187 487,0 42 128,2 81,2 2 791,7 1 477,4 0,0 490,5 85 580,1 320 036,2
August 81 190,94 656,0 15 090,4 0,0 92 856,19 0,6 340,0 190 134,2 42 135,8 76,2 2 805,1 1 437,0 0,0 469,8 86 985,8 324 043,8September 81 488,71 739,5 14 943,8 0,0 87 752,56 0,8 495,4 185 420,7 42 137,5 71,2 2 906,0 1 423,7 0,0 461,3 86 381,1 318 801,4
October 80 132,45 675,5 14 922,5 0,0 99 397,88 0,3 380,8 195 509,3 42 137,5 71,2 2 934,8 1 406,4 0,0 451,2 86 746,2 329 256,6November 72 056,39 467,8 14 661,6 0,0 110 902,61 0,6 417,9 198 506,9 42 135,8 66,2 2 972,4 1 393,1 0,0 437,4 85 667,0 331 178,7December 101 291,42 720,5 14 345,6 0,0 107 875,47 0,3 439,8 224 673,0 42 125,7 61,2 2 943,6 1 379,8 0,0 424,0 76 347,9 347 955,2
2006January 67 494,18 850,3 12 114,4 0,0 136 179,83 0,6 447,3 217 086,5 42 125,7 51,2 2 968,3 1 357,7 0,0 413,9 77 731,1 341 734,3
February 77 977,47 478,3 12 043,3 0,0 129 524,16 0,1 440,9 220 464,2 42 125,7 46,2 3 061,8 1 344,4 0,0 399,9 78 184,5 345 626,6March 79 434,66 761,4 12 085,5 0,0 134 937,58 274,2 518,4 228 011,8 41 794,4 41,2 3 057,2 1 328,0 0,0 389,6 80 009,4 354 631,5
April 77 257,61 1 009,3 12 279,4 0,0 152 580,41 16,3 875,2 244 018,2 41 815,9 36,2 3 079,6 1 328,0 0,0 389,6 82 289,5 372 956,9May 68 903,60 784,8 12 479,9 0,0 158 710,59 0,3 357,2 241 236,5 41 816,5 31,2 3 099,9 1 293,2 0,0 365,3 83 724,7 371 567,1
June 67 206,89 1 040,3 12 310,8 0,0 159 024,31 0,4 118,5 239 701,2 41 795,0 26,2 3 089,4 1 279,9 0,0 351,7 83 813,0 370 056,4July 57 269,27 891,9 12 415,5 0,0 160 214,60 0,8 120,0 230 912,1 41 793,5 21,2 3 138,9 1 257,7 0,0 341,3 84 235,0 361 699,6
August 66 834,08 489,2 12 445,8 0,0 151 413,67 33,8 50,2 231 266,6 41 793,5 28,2 3 168,1 1 244,4 0,0 327,1 85 873,9 363 701,8September 64 163,20 683,3 12 351,0 0,0 152 621,18 20,7 49,5 229 888,8 41 794,1 27,2 3 164,6 1 242,7 0,0 327,1 86 744,4 363 188,8
October 65 257,74 748,8 12 390,8 0,0 148 299,09 1,1 49,6 226 747,2 41 793,4 26,5 3 149,6 1 216,0 0,0 306,2 88 027,1 361 265,9November 76 794,51 508,6 12 601,6 0,0 140 784,70 0,9 518,3 231 208,7 41 793,4 25,4 3 286,8 1 202,7 0,0 291,9 89 736,6 367 545,5December 74 041,52 1 381,2 12 525,9 0,0 153 216,89 49,3 0,0 241 214,7 41 792,9 24,4 3 231,9 1 189,3 0,0 278,0 79 988,8 367 720,0
Source : BNR, Etudes
FOREIGN ASSETS
187
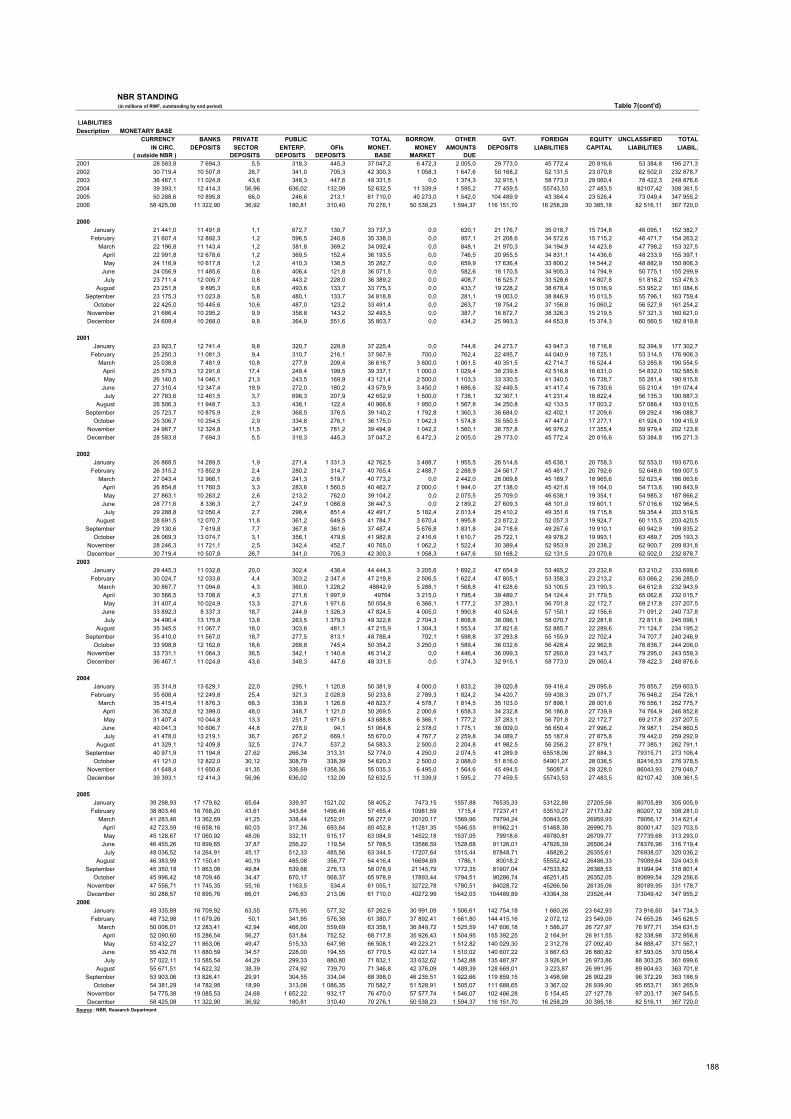
NBR STANDING (in millions of RWF, outstanding by end period) Table 7(cont'd)
LIABILITIES Description MONETARY BASE
CURRENCY BANKS PRIVATE PUBLIC TOTAL BORROW. OTHER GVT. FOREIGN EQUITY UNCLASSIFIED TOTALIN CIRC. DEPOSITS SECTOR ENTERP. OFIs MONET. MONEY AMOUNTS DEPOSITS LIABILITIES CAPITAL LIABILITIES LIABIL.
( outside NBR ) DEPOSITS DEPOSITS DEPOSITS BASE MARKET DUE2001 28 583,8 7 694,3 5,5 318,3 445,3 37 047,2 6 472,3 2 005,0 29 773,0 45 772,4 20 816,6 53 384,8 195 271,32002 30 719,4 10 507,8 26,7 341,0 705,3 42 300,3 1 058,3 1 647,6 50 168,2 52 131,5 23 070,8 62 502,0 232 878,72003 36 467,1 11 024,8 43,6 348,3 447,6 48 331,5 0,0 1 374,3 32 915,1 58 773,0 29 060,4 78 422,3 248 876,62004 39 393,1 12 414,3 56,96 636,02 132,09 52 632,5 11 339,9 1 595,2 77 459,5 55743,53 27 483,5 82107,42 308 361,52005 50 288,6 10 895,8 66,0 246,6 213,1 61 710,0 40 273,0 1 542,0 104 489,9 43 364,4 23 526,4 73 049,4 347 955,22006 58 425,08 11 322,90 36,92 180,81 310,40 70 276,1 50 538,23 1 594,37 116 151,70 16 258,29 30 385,18 82 516,11 367 720,0
2000January 21 441,0 11 491,8 1,1 672,7 130,7 33 737,3 0,0 620,1 21 176,7 35 018,7 15 734,8 46 095,1 152 382,7
February 21 607,4 12 892,3 1,2 596,5 240,6 35 338,0 0,0 957,1 21 208,6 34 572,6 15 715,2 46 471,7 154 263,2March 22 196,8 11 143,4 1,2 381,8 369,2 34 092,4 0,0 848,1 21 970,3 34 194,9 14 423,8 47 798,2 153 327,5
April 22 991,8 12 678,6 1,2 369,5 152,4 36 193,5 0,0 746,5 20 955,5 34 831,1 14 436,6 48 233,9 155 397,1May 24 116,9 10 617,8 1,2 410,3 136,5 35 282,7 0,0 659,9 17 636,4 33 800,2 14 544,2 48 882,9 150 806,3
June 24 056,9 11 485,6 0,8 406,4 121,8 36 071,5 0,0 582,6 18 170,5 34 905,3 14 794,9 50 775,1 155 299,9July 23 711,4 12 005,7 0,8 443,2 228,0 36 389,2 0,0 408,7 16 525,7 33 528,6 14 807,8 51 818,2 153 478,3
August 23 251,8 9 895,3 0,8 493,6 133,7 33 775,3 0,0 433,7 19 228,2 38 678,4 15 016,9 53 952,2 161 084,6September 23 175,3 11 023,8 5,8 480,1 133,7 34 818,8 0,0 281,1 19 003,0 38 846,9 15 013,5 55 796,1 163 759,4
October 22 425,0 10 445,6 10,6 487,0 123,2 33 491,4 0,0 263,7 18 754,2 37 156,8 15 060,2 56 527,9 161 254,2November 21 686,4 10 295,2 9,9 358,8 143,2 32 493,5 0,0 387,7 16 872,7 38 326,3 15 219,5 57 321,3 160 621,0December 24 609,4 10 268,0 9,8 364,9 551,6 35 803,7 0,0 434,2 25 993,3 44 653,8 15 374,3 60 560,5 182 819,8
2001January 23 923,7 12 741,4 9,8 320,7 229,8 37 225,4 0,0 744,6 24 273,7 43 947,3 18 716,8 52 394,9 177 302,7
February 25 250,3 11 081,3 9,4 310,7 216,1 37 567,9 700,0 762,4 22 495,7 44 040,9 18 725,1 53 314,5 176 906,3March 25 036,8 7 481,9 10,8 277,9 209,4 36 616,7 3 600,0 1 061,5 40 351,5 42 714,7 16 524,4 53 285,8 190 554,5
April 25 579,3 12 291,6 17,4 249,4 199,5 39 337,1 1 000,0 1 029,4 38 239,5 42 516,8 16 631,0 54 832,0 192 585,8May 26 140,5 14 046,1 21,3 243,5 169,9 43 121,4 2 500,0 1 103,3 33 330,5 41 340,5 16 738,7 55 281,4 190 915,8
June 27 310,4 12 347,4 19,9 272,0 180,2 43 579,9 3 450,0 1 686,6 32 449,5 41 417,4 16 730,6 55 210,4 191 074,4July 27 783,6 12 461,5 3,7 696,3 207,9 42 652,9 1 500,0 1 738,1 32 307,1 41 231,4 16 822,4 56 135,3 190 887,3
August 26 506,3 11 948,7 3,3 436,1 122,4 40 966,8 1 950,0 1 567,8 34 250,8 42 133,5 17 003,2 57 088,4 193 010,5September 25 723,7 10 875,9 2,9 368,5 376,5 39 140,2 1 792,8 1 360,3 36 684,0 42 402,1 17 209,6 59 292,4 196 088,7
October 25 306,7 10 254,5 2,9 334,8 276,1 36 175,0 1 042,3 1 574,8 35 550,5 47 447,0 17 277,1 61 924,0 199 415,9November 24 987,7 12 324,8 11,5 347,5 781,2 39 494,9 1 042,2 1 560,1 36 757,8 46 976,2 17 355,4 59 979,4 202 123,8December 28 583,8 7 694,3 5,5 318,3 445,3 37 047,2 6 472,3 2 005,0 29 773,0 45 772,4 20 816,6 53 384,8 195 271,3
2002January 26 868,5 14 289,5 1,9 271,4 1 331,3 42 762,5 3 488,7 1 955,5 26 514,6 45 638,1 20 758,3 52 553,0 193 670,6
February 26 315,2 13 852,9 2,4 280,2 314,7 40 765,4 2 488,7 2 288,9 24 561,7 45 461,7 20 792,6 52 648,6 189 007,5March 27 043,4 12 966,1 2,6 241,3 519,7 40 773,2 0,0 2 442,0 26 069,8 45 189,7 18 965,6 52 623,4 186 063,6
April 26 854,8 11 760,5 3,3 283,6 1 560,5 40 462,7 2 000,0 1 944,0 27 138,0 45 421,6 19 164,0 54 713,6 190 843,9May 27 863,1 10 263,2 2,6 213,2 762,0 39 104,2 0,0 2 075,5 25 709,0 46 638,1 19 354,1 54 985,3 187 866,2
June 28 771,6 8 336,3 2,7 247,9 1 088,8 38 447,3 0,0 2 189,2 27 609,3 48 101,0 19 601,1 57 016,6 192 964,5July 29 288,8 12 050,4 2,7 298,4 851,4 42 491,7 5 182,4 2 013,4 25 410,2 49 351,6 19 715,8 59 354,4 203 519,5
August 28 691,5 12 070,7 11,8 361,2 649,5 41 784,7 3 670,4 1 995,8 23 872,2 52 057,3 19 924,7 60 115,5 203 420,5September 29 130,6 7 619,8 7,7 367,8 361,6 37 487,4 5 676,8 1 831,8 24 718,6 49 267,6 19 910,1 60 942,9 199 835,2
October 28 069,3 13 074,7 3,1 356,1 479,6 41 982,8 2 416,6 1 610,7 25 722,1 49 978,2 19 993,1 63 489,7 205 193,3November 28 246,3 11 721,1 2,5 342,4 452,7 40 765,0 1 062,2 1 522,4 30 389,4 52 953,9 20 238,2 62 900,7 209 831,8December 30 719,4 10 507,8 26,7 341,0 705,3 42 300,3 1 058,3 1 647,6 50 168,2 52 131,5 23 070,8 62 502,0 232 878,7
2003January 29 445,3 11 032,6 20,0 302,4 438,4 44 444,3 3 205,6 1 692,2 47 654,9 53 465,2 23 232,8 63 210,2 233 699,6
February 30 024,7 12 033,6 4,4 303,2 2 347,4 47 219,8 2 506,5 1 622,4 47 805,1 53 358,3 23 213,2 63 066,2 236 285,0March 30 867,7 11 094,6 4,3 360,0 1 228,2 48842,9 5 288,1 1 568,8 41 628,6 53 100,5 23 190,3 64 612,8 232 943,9
April 30 566,5 13 708,6 4,3 271,6 1 997,9 49764 3 215,0 1 795,4 39 489,7 54 124,4 21 779,5 65 062,8 232 015,7May 31 407,4 10 024,9 13,3 271,6 1 971,6 50 054,9 6 366,1 1 777,2 37 283,1 56 701,8 22 172,7 69 217,8 237 207,5
June 33 892,3 8 337,3 18,7 244,9 1 326,3 47 824,5 4 005,0 1 990,8 40 524,6 57 150,1 22 156,6 71 091,2 240 737,8July 34 490,4 13 175,8 13,8 263,5 1 379,3 49 322,8 2 704,3 1 808,8 38 096,1 58 070,7 22 281,8 72 811,6 245 096,1
August 35 345,5 11 067,7 18,0 303,6 481,1 47 215,9 1 304,3 1 553,4 37 821,6 52 885,7 22 289,6 71 124,7 234 195,2September 35 410,0 11 567,0 18,7 277,5 813,1 48 788,4 702,1 1 598,8 37 293,8 55 155,9 22 702,4 74 707,7 240 246,9
October 33 908,8 12 162,6 18,6 268,8 745,4 50 354,2 3 250,0 1 589,4 36 032,6 56 428,4 22 962,8 76 838,7 244 206,0November 33 731,1 11 064,3 36,5 342,1 1 140,4 46 314,2 0,0 1 446,4 36 099,3 57 260,8 23 143,7 79 295,0 243 559,3December 36 467,1 11 024,8 43,6 348,3 447,6 48 331,5 0,0 1 374,3 32 915,1 58 773,0 29 060,4 78 422,3 248 876,6
2004January 35 314,9 13 629,1 22,0 295,1 1 120,8 50 381,9 4 000,0 1 833,2 39 020,8 59 416,4 29 095,6 75 855,7 259 603,5
February 35 608,4 12 249,8 25,4 321,3 2 028,8 50 233,8 2 789,3 1 824,2 34 420,7 59 438,3 29 071,7 76 948,2 254 726,1March 35 415,4 11 876,3 66,3 338,9 1 126,8 48 823,7 4 578,7 1 814,5 35 103,0 57 898,1 28 001,6 76 556,1 252 775,7
April 36 352,8 12 399,0 48,0 348,7 1 121,0 50 269,5 2 000,6 1 658,3 34 232,8 56 186,8 27 739,9 74 764,9 246 852,8May 31 407,4 10 044,8 13,3 251,7 1 971,6 43 688,8 6 366,1 1 777,2 37 283,1 56 701,8 22 172,7 69 217,8 237 207,5
June 40 041,3 10 606,7 44,8 278,0 94,1 51 064,8 2 378,0 1 775,1 36 009,0 56 650,4 27 996,2 78 987,1 254 860,5July 41 478,0 13 219,1 36,7 267,2 669,1 55 670,0 4 767,7 2 259,8 34 089,7 55 187,9 27 875,8 79 442,0 259 292,9
August 41 329,1 12 409,8 32,5 274,7 537,2 54 583,3 2 500,0 2 204,8 41 982,5 56 256,2 27 879,1 77 385,1 262 791,1September 40 971,9 11 194,8 27,62 266,34 313,31 52 774,0 4 250,0 2 074,5 41 289,9 65518,06 27 884,3 79315,71 273 106,4
October 41 121,0 12 822,0 30,12 308,79 338,39 54 620,3 2 500,0 2 088,0 51 816,0 54901,27 28 036,5 82416,53 276 378,5November 41 648,4 11 650,6 41,35 336,69 1358,36 55 035,3 6 495,0 1 564,6 45 494,5 56087,4 28 328,0 86043,93 279 048,7December 39 393,1 12 414,3 56,96 636,02 132,09 52 632,5 11 339,9 1 595,2 77 459,5 55743,53 27 483,5 82107,42 308 361,5
2005January 39 298,93 17 179,62 65,64 339,97 1521,02 58 405,2 7473,15 1557,88 76535,33 53122,88 27205,56 80705,89 305 005,9
February 38 803,46 16 768,20 43,61 343,64 1496,46 57 455,4 10981,59 1715,4 77237,41 53510,27 27173,82 80207,12 308 281,0March 41 283,46 13 362,69 41,25 338,44 1252,01 56 277,9 20120,17 1569,96 79794,24 50843,05 26959,93 79056,17 314 621,4
April 42 723,59 16 658,16 60,03 317,36 693,64 60 452,8 11281,35 1546,55 91962,21 51468,38 26990,75 80001,47 323 703,5May 45 128,67 17 060,92 48,06 332,11 515,17 63 084,9 14522,18 1537,05 79918,6 49780,81 26709,77 77739,68 313 293,0
June 46 455,26 10 899,65 37,87 256,22 119,54 57 768,5 13586,59 1528,68 91126,01 47826,39 26506,24 78376,96 316 719,4July 48 036,52 14 264,91 45,17 512,33 485,56 63 344,5 17207,64 1515,44 87848,71 46826,2 26355,61 76938,07 320 036,2
August 46 383,99 17 150,41 40,19 485,08 356,77 64 416,4 16694,69 1786,1 80018,2 55552,42 26486,33 79089,64 324 043,8September 45 350,18 11 863,08 49,84 539,68 276,13 58 078,9 21145,79 1772,35 81907,04 47533,82 26368,53 81994,94 318 801,4
October 45 996,42 18 709,46 34,47 670,17 568,37 65 978,9 17893,44 1794,51 90286,74 46251,45 26352,05 80699,54 329 256,6November 47 556,71 11 745,35 55,16 1163,5 534,4 61 055,1 32722,78 1780,51 84028,72 45266,56 26135,06 80189,95 331 178,7December 50 288,57 10 895,76 66,01 246,63 213,06 61 710,0 40272,99 1542,03 104489,89 43364,38 23526,44 73049,42 347 955,2
2006January 49 335,89 16 709,92 63,55 575,95 577,32 67 262,6 30 991,09 1 506,61 142 754,18 1 660,26 23 642,93 73 916,60 341 734,3
February 48 732,98 11 679,26 50,1 341,95 576,38 61 380,7 37 892,41 1 661,80 144 415,16 2 072,12 23 549,09 74 655,28 345 626,5March 50 006,01 12 283,41 42,94 466,00 559,69 63 358,1 36 849,72 1 525,59 147 606,18 1 586,27 26 727,97 76 977,71 354 631,5
April 52 090,60 15 286,54 56,27 531,84 752,52 68 717,8 35 926,43 1 504,95 155 392,25 2 164,91 26 911,55 82 338,98 372 956,8May 53 432,27 11 863,06 49,47 515,33 647,98 66 508,1 49 223,21 1 512,82 140 029,30 2 312,78 27 092,40 84 888,47 371 567,1
June 55 432,78 11 880,59 34,57 228,00 194,55 67 770,5 42 027,14 1 510,02 140 607,22 3 667,63 26 880,82 87 593,05 370 056,4July 57 022,11 13 585,54 44,29 299,33 880,80 71 832,1 33 632,62 1 542,88 135 487,97 3 926,91 26 973,86 88 303,25 361 699,6
August 55 671,51 14 622,32 38,39 274,92 739,70 71 346,8 42 376,09 1 489,39 128 669,01 3 223,87 26 991,95 89 604,63 363 701,8September 53 903,06 13 826,41 29,91 304,55 334,04 68 398,0 46 235,51 1 922,66 119 859,15 3 498,98 26 902,29 96 372,29 363 188,9
October 54 381,29 14 782,95 18,99 313,08 1 086,35 70 582,7 51 528,91 1 505,07 111 688,65 3 367,02 26 939,90 95 653,71 361 265,9November 54 775,38 19 085,53 24,68 1 652,22 932,17 76 470,0 57 577,74 1 546,07 102 466,28 5 154,45 27 127,78 97 203,17 367 545,5December 58 425,08 11 322,90 36,92 180,81 310,40 70 276,1 50 538,23 1 594,37 116 151,70 16 258,29 30 385,18 82 516,11 367 720,0
Source : NBR, Research Department
188

CONSOLIDATED BALANCE SHEET OF DEPOSIT BANKS Table 8(in millions of RWF, by end period)
ASSETS
DescriptionRESERVES FOREIGN OTHER ASSET TOTAL
ASSETS CLAIMS ON CLAIMS ON CLAIMS ON TOTAL ELEMENTS ASSETSGVT. PUBLIC ENTER. PRIV. SECTOR
2001 15 235,2 33 763,9 7 605,8 831,4 75 867,1 76 874,2 19 197,1 152 500,42002 12 536,7 39 106,0 14 409,8 3 362,8 83 005,3 86 977,4 22 359,4 175 389,12003 13 054,7 49 779,7 14 861,8 4 772,1 94 728,9 99 872,6 24 866,6 202 435,42004 16 221,7 60 758,7 21 015,0 4 631,7 133 168,8 137 800,5 25 598,0 261 393,92005 15 136,5 52 617,6 24 760,0 2 119,0 182 550,4 184 669,4 27 665,9 304 849,42006 17 017,1 70 998,1 26 367,9 2 381,6 234 103,5 236 485,1 34 490,2 385 358,4
69 507,72001
January 14 242,0 35 895,1 7 328,3 670,6 67 148,4 67 898,6 18 523,2 143 887,2February 13 090,0 36 835,9 7 275,8 658,7 67 275,5 68 013,8 18 527,2 143 742,7
March 12 742,2 35 078,7 7 322,4 1 092,1 67 820,6 69 022,3 18 618,4 142 784,0April 15 754,2 32 160,5 7 205,0 1 031,8 68 843,8 69 985,2 18 731,1 143 836,0May 17 251,8 33 759,3 7 358,3 1 090,7 70 858,9 72 059,2 19 484,2 149 912,8
June 17 715,0 32 543,2 7 295,5 1 079,4 73 802,5 74 991,5 19 296,3 151 841,5July 15 808,8 34 366,9 7 603,0 907,4 74 282,4 75 189,7 18 491,7 151 460,2
August 14 846,9 31 657,4 7 499,5 889,5 74 071,1 74 960,5 19 588,6 148 552,8September 13 762,1 33 024,7 7 650,5 989,3 75 155,0 76 144,3 19 684,3 150 266,0
October 12 781,5 34 014,0 7 676,0 941,8 75 610,1 76 929,6 19 050,7 150 451,8November 15 603,7 33 725,5 7 624,6 1 083,0 74 803,7 77 270,3 20 511,1 154 735,1December 15 235,2 33 763,9 7 605,8 831,4 75 867,0 76 874,1 19 197,1 152 676,1
2002January 16 608,1 32 443,6 7 728,6 838,5 74 417,2 75 663,3 23 620,5 156 064,1
February 15 407,0 34 805,7 7 435,2 1 752,70 73 307,6 75 479,8 22 729,7 155 857,4March 14 538,9 36 336,2 9 336,9 1737,4 73 788,2 75 982,6 21 256,7 157 451,2
April 13 908,5 35 401,1 8 349,7 1509,5 74 392,7 76 284,0 22 953,6 156 896,9May 11 805,3 37 372,6 13 259,0 1501,3 76 604,4 78 387,5 20 393,0 161 217,4
June 14 567,5 40 702,7 10 479,7 1571,5 78 833,1 80 717,3 20 348,9 166 816,1July 16 606,2 38 142,3 10 635,3 1848,6 78 499,6 80 567,1 25 697,4 171 648,4
August 14 712,1 38 783,6 11 040,2 2825,3 78 762,8 81 836,5 27 578,4 173 950,7September 15 613,7 37 243,1 12 810,6 1993,4 78 741,8 80 965,5 23 527,3 170 160,1
October 15 997,1 39 321,3 14 067,2 2499,3 79 181,1 82 045,8 23 048,3 174 479,6November 14 816,0 38 363,0 13 654,1 2635,1 80 135,0 83 130,0 22 069,6 172 032,7December 12 517,9 39 168,9 14 407,5 3403 82 976,9 86 989,2 22 265,1 175 348,5
2003January 14 020,4 39 755,6 13 782,7 2349,7 81 950,6 84 777,9 23 765,0 176 101,6
February 14 918,1 40 028,2 14 008,0 1575,52 82 499,9 84 585,6 25 247,4 178 787,4March 14 435,4 38 780,8 13 565,3 2297,96 79 254,8 81 949,8 26 815,5 175 546,8
April 17 290,8 41 423,4 16 638,4 1809,88 78 193,6 80 302,0 25 371,6 181 026,3May 13 514,2 43 997,1 16 783,6 1774,24 80 298,5 82 609,5 27 973,7 184 878,1
June 10 807,8 44 916,3 20 243,7 3203,19 85 789,5 89 344,3 29 202,9 194 514,9July 16 072,5 45 532,8 17 109,6 4326,57 86 055,6 90 699,3 27 859,9 197 274,0
August 14 345,5 45 138,9 16 877,1 4697,43 88 563,9 93 618,9 25 674,2 195 654,6September 14 443,1 42 251,5 16 309,8 4625,62 93 354,0 98 331,2 25 841,2 197 176,8
October 15 492,8 45 499,0 15 742,8 4522,53 93 281,7 98 199,3 26 291,0 201 224,8November 13 885,9 41 284,1 15 665,1 4 781,4 94 587,6 99 716,3 24 346,7 194 898,0December 13 054,7 49 779,7 14 861,8 4 772,1 94 728,9 99 872,6 24 866,6 202 435,4
2004January 18 547,0 49 763,4 11 838,3 5 384,3 108 436,8 113 821,1 23 275,6 217 245,4
February 17 683,7 51 252,3 12 987,9 5 171,4 107 209,5 112 380,9 21 754,9 216 059,7March 17 104,7 50 110,6 11 708,2 4 042,9 109 736,6 113 779,5 22 349,0 215 052,0
April 17 667,5 52 311,1 12 273,9 3 960,7 106 383,2 110 343,9 24 115,5 216 711,9May 15 415,8 52 249,7 14 422,2 3 946,9 108 965,2 112 912,1 24 699,2 219 699,0
June 14 283,6 51 918,3 14 795,2 5 062,7 107 082,0 112 144,7 26 558,4 219 700,2July 18 471,2 49 646,9 14 216,9 4 836,4 114 103,3 118 939,7 26 040,8 227 315,5
August 18 748,7 50 209,8 14 471,2 4 822,4 110 776,9 115 599,3 25 873,0 224 902,0September 16 475,9 49 913,7 13 322,3 4 918,1 117 355,4 122 273,5 27 750,5 229 735,9
October 18 503,0 49 807,0 14 561,8 4 608,1 119 202,9 123 811,0 26 457,6 233 140,4November 19 209,6 53 543,5 15 351,3 4 732,3 121 696,1 126 428,4 27 328,1 241 860,9December 16 221,7 60 758,7 21 015,0 4 631,7 133 168,8 137 800,5 25 598,0 261 393,9
2005January 24 810,1 59 560,2 24 109,8 4 616,9 123 620,8 128 237,7 24 838,5 261 556,3
February 24 203,2 56 386,5 19 831,1 4 260,3 133 721,8 137 982,1 25 426,0 263 828,9March 21 154,9 54 172,2 26 058,1 3 298,2 141 151,0 144 449,2 25 681,6 271 516,0
April 23 681,8 49 837,5 26 226,4 2 068,2 139 945,1 142 013,3 26 474,3 268 233,3May 24 163,3 53 069,6 26 034,1 2 709,8 145 012,4 147 722,2 27 284,5 278 273,7
June 15 308,3 54 404,7 30 976,0 2 849,0 149 439,3 152 288,3 30 150,4 283 127,7July 20 988,6 52 624,8 26 883,8 2 473,4 159 168,7 161 642,1 27 937,5 290 076,8
August 24 049,9 52 179,6 24 616,8 1 970,7 157 719,3 159 690,0 28 217,0 288 753,3September 18 164,9 51 608,3 18 139,2 2 070,8 164 279,3 166 350,1 27 281,0 281 543,5
October 25 345,9 53 493,5 18 294,8 1 748,2 160 032,3 161 780,5 27 091,4 286 006,1November 18 963,6 52 318,2 19 093,2 1 775,5 176 257,3 178 032,8 27 360,3 295 768,1December 15 136,5 52 617,6 24 760,0 2 119,0 182 550,4 184 669,4 27 665,9 304 849,4
2006January 24 496,8 56 659,6 23 612,0 1 411,8 168 945,1 170 356,9 31 601,0 306 726,2
February 19 401,3 55 107,3 19 064,6 3 316,7 179 324,7 182 641,5 31 196,3 307 410,9March 19 475,0 50 709,1 17 630,1 2 744,6 189 826,3 192 570,9 31 847,8 312 232,9
April 23 390,7 57 258,6 17 030,1 2 087,7 193 773,3 195 861,0 33 338,4 326 878,7May 19 880,6 53 521,0 13 810,0 2 311,6 214 577,3 216 888,9 32 304,3 336 404,9
June 18 268,3 54 748,3 15 608,4 2 282,7 208 824,3 211 106,9 34 207,6 333 939,5July 22 808,8 67 341,9 14 593,1 1 510,9 208 689,1 210 200,0 35 178,1 350 121,9
August 24 470,2 69 617,0 13 826,8 1 495,0 214 935,0 216 430,0 33 940,2 358 284,2September 22 595,7 65 871,3 13 787,2 1 381,3 220 786,4 222 167,7 34 507,5 358 929,5
October 23 639,8 64 251,7 13 934,6 1 420,3 226 299,1 227 719,4 36 263,8 365 809,4November 28 542,1 62 236,3 15 090,5 1 377,1 236 557,7 237 934,8 35 904,6 379 708,3December 17 017,1 70 998,1 26 367,9 2 381,6 234 103,5 236 485,1 34 490,2 385 358,4
Source : NBR, Research Department
CREDIT TO ECONOMY
189
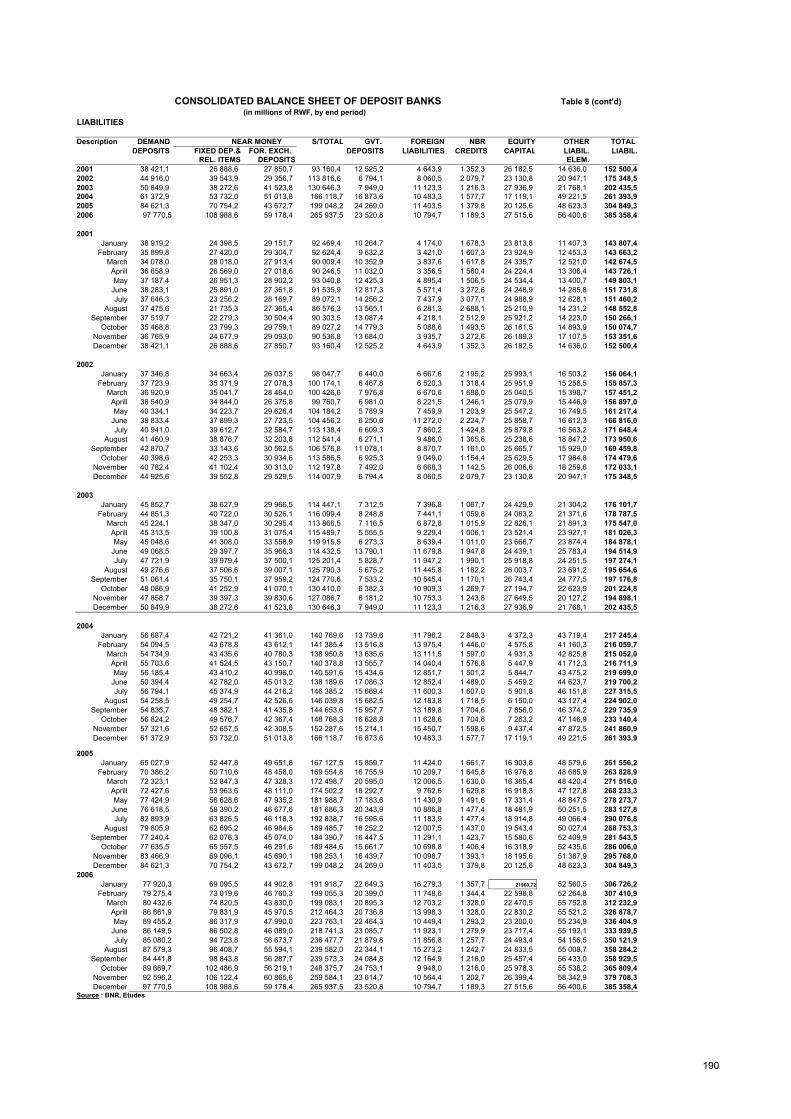
CONSOLIDATED BALANCE SHEET OF DEPOSIT BANKS Table 8 (cont'd)(in millions of RWF, by end period)
LIABILITIES
Description DEMAND S/TOTAL GVT. FOREIGN NBR EQUITY OTHER TOTAL DEPOSITS FIXED DEP.& FOR. EXCH. DEPOSITS LIABILITIES CREDITS CAPITAL LIABIL. LIABIL.
REL. ITEMS DEPOSITS ELEM.2001 38 421,1 26 888,6 27 850,7 93 160,4 12 525,2 4 643,9 1 352,3 26 182,5 14 636,0 152 500,42002 44 916,0 39 543,9 29 356,7 113 816,6 6 794,1 8 060,5 2 079,7 23 130,8 20 947,1 175 348,52003 50 849,9 38 272,6 41 523,8 130 646,3 7 949,0 11 123,3 1 216,3 27 936,9 21 768,1 202 435,52004 61 372,9 53 732,0 51 013,8 166 118,7 16 873,6 10 483,3 1 577,7 17 119,1 49 221,5 261 393,92005 84 621,3 70 754,2 43 672,7 199 048,2 24 269,0 11 403,5 1 379,8 20 125,6 48 623,3 304 849,32006 97 770,5 108 988,6 59 178,4 265 937,5 23 520,8 10 794,7 1 189,3 27 515,6 56 400,6 385 358,4
2001January 38 919,2 24 398,5 29 151,7 92 469,4 10 264,7 4 174,0 1 678,3 23 813,8 11 407,3 143 807,4
February 35 899,8 27 420,0 29 304,7 92 624,4 9 632,2 3 421,0 1 607,3 23 924,9 12 453,3 143 663,2March 34 078,0 28 018,0 27 913,4 90 009,4 10 352,9 3 837,6 1 617,8 24 335,7 12 521,0 142 674,5Aprill 36 658,9 26 569,0 27 018,6 90 246,5 11 032,0 3 356,5 1 560,4 24 224,4 13 306,4 143 726,1May 37 187,4 26 951,3 28 902,2 93 040,8 12 425,3 4 895,4 1 506,5 24 534,4 13 400,7 149 803,1
June 38 283,1 25 891,0 27 361,8 91 535,9 12 817,3 5 571,4 3 272,6 24 248,9 14 285,8 151 731,8July 37 646,3 23 256,2 28 169,7 89 072,1 14 256,2 7 437,9 3 077,1 24 988,9 12 628,1 151 460,2
August 37 475,6 21 735,3 27 365,4 86 576,3 13 565,1 6 281,3 2 688,1 25 210,9 14 231,2 148 552,8September 37 519,7 22 279,3 30 504,4 90 303,5 13 087,4 4 218,1 2 512,9 25 921,2 14 223,0 150 266,1
October 35 468,8 23 799,3 29 759,1 89 027,2 14 779,3 5 088,6 1 493,5 26 161,5 14 893,9 150 074,7November 36 765,9 24 677,9 29 093,0 90 536,8 13 684,0 3 935,7 3 272,6 26 189,3 17 107,5 153 351,6December 38 421,1 26 888,6 27 850,7 93 160,4 12 525,2 4 643,9 1 352,3 26 182,5 14 636,0 152 500,4
2002January 37 346,8 34 663,4 26 037,5 98 047,7 6 440,0 6 667,6 2 195,2 25 993,1 16 503,2 156 064,1
February 37 723,9 35 371,9 27 078,3 100 174,1 6 467,8 6 520,3 1 318,4 25 951,9 15 258,5 155 857,3March 36 920,9 35 041,7 28 464,0 100 426,6 7 976,8 6 670,6 1 688,0 25 040,5 15 398,7 157 451,2Aprill 38 540,9 34 844,0 26 375,8 99 760,7 6 981,0 8 221,5 1 246,1 25 079,9 15 446,9 156 897,0May 40 334,1 34 223,7 29 626,4 104 184,2 5 789,9 7 459,9 1 203,9 25 547,2 16 749,5 161 217,4
June 38 833,4 37 899,3 27 723,5 104 456,2 6 250,6 11 272,0 2 224,7 25 858,7 16 612,3 166 816,0July 40 941,0 39 612,7 32 584,7 113 138,4 6 609,3 7 860,2 1 424,8 25 879,8 16 563,2 171 648,4
August 41 460,9 38 876,7 32 203,8 112 541,4 6 271,1 9 486,0 1 365,6 25 238,6 18 847,2 173 950,6September 42 870,7 33 143,6 30 562,5 106 576,8 11 078,1 8 870,7 1 161,0 25 665,7 15 929,0 169 459,8
October 40 398,6 42 253,3 30 934,6 113 586,5 6 925,3 9 049,0 1 154,4 25 629,5 17 984,8 174 479,6November 40 782,4 41 102,4 30 313,0 112 197,8 7 492,0 6 668,3 1 142,5 26 006,6 18 259,6 172 033,1December 44 925,6 39 552,8 29 529,5 114 007,9 6 794,4 8 060,5 2 079,7 23 130,8 20 947,1 175 348,5
2003January 45 852,7 38 627,9 29 966,5 114 447,1 7 312,5 7 396,8 1 067,7 24 429,9 21 304,2 176 101,7
February 44 851,3 40 722,0 30 526,1 116 099,4 8 248,8 7 441,1 1 059,8 24 083,2 21 371,6 178 787,5March 45 224,1 38 347,0 30 295,4 113 866,5 7 116,5 6 872,8 1 015,9 22 826,1 21 891,3 175 547,0Aprill 45 313,5 39 100,8 31 075,4 115 489,7 5 555,5 9 229,4 1 006,1 23 521,4 23 927,1 181 026,3May 45 048,6 41 308,0 33 558,9 119 915,5 6 273,3 8 639,4 1 011,0 23 666,7 23 874,4 184 878,1
June 49 068,5 29 397,7 35 966,3 114 432,5 13 790,1 11 679,8 1 947,8 24 439,1 25 783,4 194 514,9July 47 721,9 39 979,4 37 500,1 125 201,4 5 828,7 11 947,2 1 990,1 25 918,8 24 251,5 197 274,1
August 49 276,6 37 506,6 39 007,1 125 790,3 5 675,2 11 445,8 1 182,2 26 003,7 23 691,2 195 654,6September 51 061,4 35 750,1 37 959,2 124 770,6 7 533,2 10 545,4 1 170,1 26 743,4 24 777,5 197 176,8
October 48 086,9 41 252,9 41 070,1 130 410,0 6 382,3 10 909,3 1 269,7 27 194,7 22 623,9 201 224,8November 47 858,7 39 397,3 39 830,6 127 086,7 6 181,2 10 753,3 1 243,8 27 649,5 20 127,2 194 898,1December 50 849,9 38 272,6 41 523,8 130 646,3 7 949,0 11 123,3 1 216,3 27 936,9 21 768,1 202 435,5
2004January 56 687,4 42 721,2 41 361,0 140 769,6 13 739,6 11 796,2 2 848,3 4 372,3 43 719,4 217 245,4
February 54 094,5 43 678,8 43 612,1 141 385,4 13 516,8 13 975,4 1 446,0 4 575,8 41 160,3 216 059,7March 54 734,9 43 435,6 40 780,3 138 950,8 13 635,6 13 111,5 1 597,0 4 931,3 42 825,8 215 052,0Aprill 55 703,6 41 524,5 43 150,7 140 378,8 13 555,7 14 040,4 1 576,8 5 447,9 41 712,3 216 711,9May 56 185,4 43 410,2 40 996,0 140 591,6 15 434,6 12 851,7 1 501,2 5 844,7 43 475,2 219 699,0
June 50 394,4 42 782,0 45 013,2 138 189,6 17 086,3 12 852,4 1 489,0 5 459,2 44 623,7 219 700,2July 56 794,1 45 374,9 44 216,2 146 385,2 15 669,4 11 600,3 1 607,0 5 901,8 46 151,8 227 315,5
August 54 258,5 49 254,7 42 526,6 146 039,8 15 682,5 12 183,8 1 718,5 6 150,0 43 127,4 224 902,0September 54 835,7 48 382,1 41 435,8 144 653,6 15 957,7 13 189,8 1 704,6 7 856,0 46 374,2 229 735,9
October 56 824,2 49 576,7 42 367,4 148 768,3 16 628,8 11 628,6 1 704,6 7 263,2 47 146,9 233 140,4November 57 321,6 52 657,5 42 308,5 152 287,6 15 214,1 15 450,7 1 598,6 9 437,4 47 872,5 241 860,9December 61 372,9 53 732,0 51 013,8 166 118,7 16 873,6 10 483,3 1 577,7 17 119,1 49 221,5 261 393,9
2005January 65 027,9 52 447,8 49 651,8 167 127,5 15 859,7 11 424,0 1 661,7 16 903,8 48 579,6 261 556,2
February 70 386,2 50 710,6 48 458,0 169 554,8 16 755,9 10 209,7 1 645,8 16 976,8 48 685,9 263 828,9March 72 323,1 52 847,3 47 328,3 172 498,7 20 595,0 12 006,5 1 630,0 16 365,4 48 420,4 271 516,0Aprill 72 427,6 53 963,6 48 111,0 174 502,2 18 292,7 9 762,6 1 629,8 16 918,3 47 127,8 268 233,3May 77 424,9 56 628,6 47 935,2 181 988,7 17 183,6 11 430,9 1 491,6 17 331,4 48 847,5 278 273,7
June 76 618,5 58 390,2 46 677,6 181 686,3 20 343,9 10 886,8 1 477,4 18 481,9 50 251,5 283 127,8July 82 893,9 63 826,5 46 118,3 192 838,7 16 595,6 11 183,9 1 477,4 18 914,8 49 066,4 290 076,8
August 79 805,9 62 695,2 46 984,6 189 485,7 16 252,2 12 007,5 1 437,0 19 543,4 50 027,4 288 753,3September 77 240,4 62 076,3 45 074,0 184 390,7 16 447,5 11 291,1 1 423,7 15 580,6 52 409,9 281 543,5
October 77 635,5 65 557,5 46 291,6 189 484,6 15 661,7 10 698,8 1 406,4 16 318,9 52 435,6 286 006,0November 83 466,9 69 096,1 45 690,1 198 253,1 16 439,7 10 098,7 1 393,1 18 195,6 51 387,9 295 768,0December 84 621,3 70 754,2 43 672,7 199 048,2 24 269,0 11 403,5 1 379,8 20 125,6 48 623,3 304 849,3
2006January 77 920,3 69 095,5 44 902,8 191 918,7 22 649,3 16 279,3 1 357,7 21960,72 52 560,5 306 726,2
February 79 275,4 73 019,6 46 760,3 199 055,3 20 399,0 11 748,6 1 344,4 22 598,8 52 264,8 307 410,9March 80 432,6 74 820,5 43 830,0 199 083,1 20 895,3 12 703,2 1 328,0 22 470,5 55 752,8 312 232,9Aprill 86 661,9 79 831,9 45 970,5 212 464,3 20 736,8 13 998,3 1 328,0 22 830,2 55 521,2 326 878,7May 89 455,2 86 317,9 47 990,0 223 763,1 22 464,3 10 449,4 1 293,2 23 200,0 55 234,9 336 404,9
June 86 149,5 86 502,8 46 089,0 218 741,3 23 085,7 11 923,1 1 279,9 23 717,4 55 192,1 333 939,5July 85 080,2 94 723,8 56 673,7 236 477,7 21 879,8 11 856,8 1 257,7 24 493,4 54 156,5 350 121,9
August 87 579,3 96 408,7 55 594,1 239 582,0 22 344,1 15 273,2 1 242,7 24 833,5 55 008,7 358 284,2September 84 441,8 98 843,8 56 287,7 239 573,3 24 084,8 12 164,9 1 216,0 25 457,4 56 433,0 358 929,5
October 89 669,7 102 486,9 56 219,1 248 375,7 24 753,1 9 948,0 1 216,0 25 978,3 55 538,2 365 809,4November 92 596,2 106 122,4 60 865,6 259 584,1 23 614,7 10 564,4 1 202,7 26 399,4 58 342,9 379 708,3December 97 770,5 108 988,6 59 178,4 265 937,5 23 520,8 10 794,7 1 189,3 27 515,6 56 400,6 385 358,4
Source : BNR, Etudes
NEAR MONEY
190
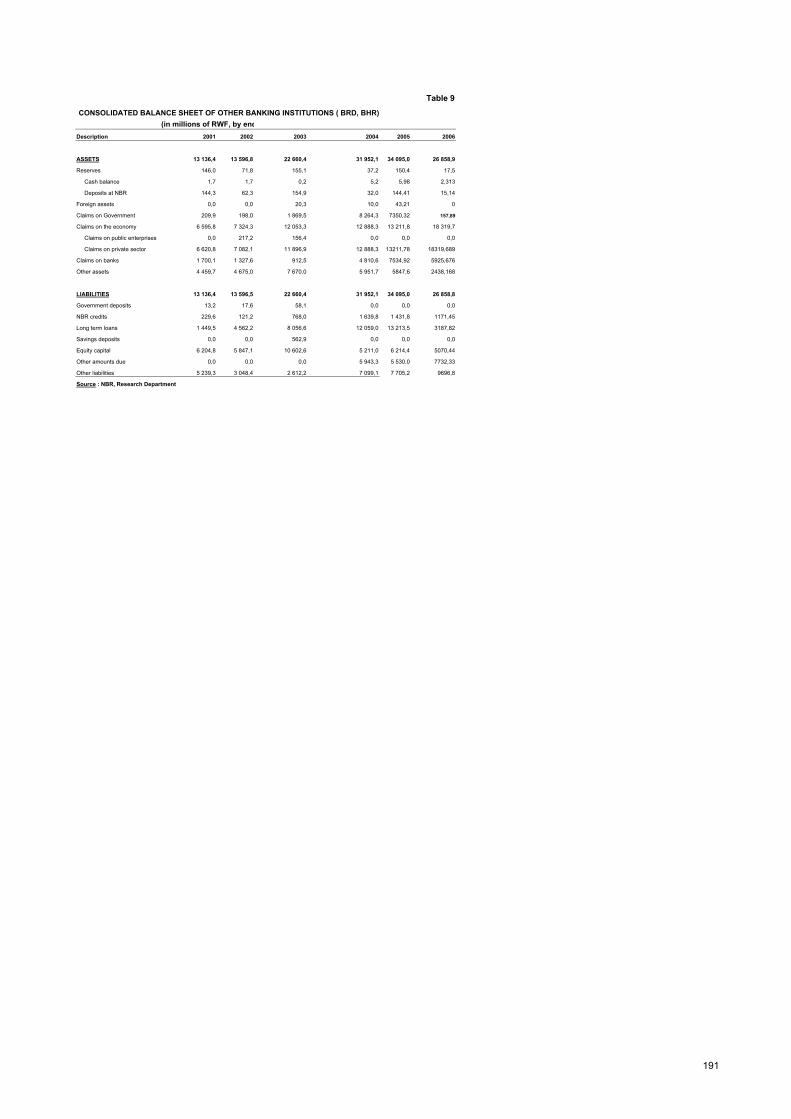
Table 9
CONSOLIDATED BALANCE SHEET OF OTHER BANKING INSTITUTIONS ( BRD, BHR)
Description 2001 2002 2003 2004 2005 2006
ASSETS 13 136,4 13 596,8 22 660,4 31 952,1 34 095,0 26 858,9
Reserves 146,0 71,8 155,1 37,2 150,4 17,5
Cash balance 1,7 1,7 0,2 5,2 5,98 2,313
Deposits at NBR 144,3 62,3 154,9 32,0 144,41 15,14
Foreign assets 0,0 0,0 20,3 10,0 43,21 0
Claims on Government 209,9 198,0 1 869,5 8 264,3 7350,32 157,89
Claims on the economy 6 595,8 7 324,3 12 053,3 12 888,3 13 211,8 18 319,7
Claims on public enterprises 0,0 217,2 156,4 0,0 0,0 0,0
Claims on private sector 6 620,8 7 082,1 11 896,9 12 888,3 13211,78 18319,689
Claims on banks 1 700,1 1 327,6 912,5 4 810,6 7534,92 5925,676
Other assets 4 459,7 4 675,0 7 670,0 5 951,7 5847,6 2438,168
LIABILITIES 13 136,4 13 596,5 22 660,4 31 952,1 34 095,0 26 858,8
Government deposits 13,2 17,6 58,1 0,0 0,0 0,0
NBR credits 229,6 121,2 768,0 1 639,8 1 431,8 1171,45
Long term loans 1 449,5 4 562,2 8 056,6 12 059,0 13 213,5 3187,82
Savings deposits 0,0 0,0 562,9 0,0 0,0 0,0
Equity capital 6 204,8 5 847,1 10 602,6 5 211,0 6 214,4 5070,44
Other amounts due 0,0 0,0 0,0 5 943,3 5 530,0 7732,33
Other liabilities 5 239,3 3 048,4 2 612,2 7 099,1 7 705,2 9696,8
Source : NBR, Research Department
(in millions of RWF, by end
191

BANKING SURVEY* Table 10 (in millions of RWF, outstanding by end period)Désignation 2001 2002 2003 2004 2005 2006
I. NET FOREIGN ASSETS 80 431,4 103 641,6 104 157,9 172 804,5 222 522,7 285 141,0 Assets: NBR 97 099,2 124 700,0 124 320,8 178 272,6 224 673,0 241 195,9 BANKS 33 763,9 39 106,0 49 800,0 60 758,7 52 617,6 70 998,1 less liabilities: NBR 45 787,9 52 209,1 58 839,6 55 743,5 43 364,4 16 258,3 BANKS 4 643,9 7 955,3 11 123,3 10 483,3 11 403,5 10 794,7
II. NET DOMESTIC CREDIT 93 762,2 99 280,5 151 681,4 127 619,8 122 471,3 162 667,3 Net claims on Government 8 848,8 2 759,2 26 168,6 -21 539,9 -56 059,8 -69 365,6 Claims: NBR 43 469,2 42 911,9 43 916,8 42 125,7 42 125,7 41 792,9 BANKS 7 605,8 14 409,8 14 861,8 21 015,0 24 760,0 26 367,9 OFIs 195,4 198,0 5 891,9 8 264,3 5 064,9 157,89 less deposits: NBR 29 885,1 47 949,3 30 486,2 76 071,3 103 741,4 114 163,6 BANKS 12 525,2 6 794,1 7 949,0 16 873,6 24 269,0 23 520,8 OFIs 11,2 17,0 66,7 0,0 0,0 0,0 Claims on public enterprises 960,8 3 847,9 5 056,7 4 747,9 2 180,2 2 406,0 NBR 129,4 267,9 128,2 116,2 61,2 24,4 BANKS 831,4 3 362,8 4 772,2 4 631,7 2 119,0 2 381,6 OFIs 0,0 217,2 156,4 0,0 0,0 0,0 Claims on private sector 83 952,6 92 039,1 119 959,5 144 411,8 176 350,8 229 627,0 NBR 1 682,4 2 090,8 2 305,5 3 307,1 3 367,6 3 509,9 BANKS 75 691,4 82 866,2 94 535,7 128 216,4 162 367,2 207 797,4 OFIs 6 578,9 7 082,1 23 118,3 12 888,3 10 616,0 18 319,7
ASSETS = LIABILITIES 174 193,6 202 922,1 255 839,3 300 424,3 344 994,0 447 808,4
MONEY SUPPLY 121 110,8 136 283,7 186 292,5 206 247,8 247 865,0 316 246,4I. CURRENCY 64 742,0 72 406,0 85 000,5 101 502,0 133 438,1 152 313,4 Banknotes and coins outside banks and 25 810,1 28 044,4 33 507,1 37 897,9 47 028,1 52 730,9 Demand deposits at NBR 510,9 1 490,3 1 706,4 2 231,2 1 788,7 1 812,1 Public enterprises 318,3 387,3 363,4 636,0 246,6 180,8 Private sector 192,6 1 103,0 1 343,0 1 595,2 1 542,0 1 631,3 Demand deposits in BANKS 38 421,1 42 871,3 49 786,9 61 372,9 84 621,3 97 770,5II. NEAR MONEY 56 368,8 63 877,7 101 292,0 104 745,8 114 426,9 163 933,0 Fixed term deposits and related items 28 518,0 33 935,8 30 699,3 53 732,0 70 754,2 104 754,6 NBR 1 629,5 - 0,0 0,0 0,0 0,0 BANKS 26 888,6 29 941,9 30 699,3 53 732,0 70 754,2 104 754,6 Foreign exchange deposits 27 850,7 29 043,3 41 496,0 51 013,8 43 672,7 59 178,4
OTHER ITEMS NET 53 082,9 63 781,3 65 633,8 94 176,5 97 128,9 131 561,9I. NBR 38 756,9 37 094,4 43 332,7 50 797,7 68 416,5 99 110,8 Cash in banks 2 772,0 2 673,3 2 364,1 2 406,7 2 832,1 5 694,2 Cash in OFIs 1,7 1,7 596,0 5,2 6,0 2,3 Deposits in banks 7 894,9 10 507,8 11 014,6 12 414,3 10 895,8 11 322,9 Deposits in OFIs 305,7 81,0 252,8 132,1 213,1 173,57 Borrowings money market 6 472,3 1 058,3 0,0 11 339,9 40 273,0 50 538,2 Equity capital 18 080,3 20 416,1 29 060,4 27 483,5 23 526,4 30 262,9 Unclassified liabilities 61 313,6 64 807,8 78 139,5 82 107,4 73 049,4 82 518,6 Loans money market 0,0 -1 000,0 0,0 0,0 0,0 0,0 Claims on banks -1 521,8 -2 235,8 -1 368,6 -1 577,7 -1 379,8 -1 189,3 Claims on OFIs -207,0 -121,1 -72,1 -551,4 -424,0 -277,99 Unclassified assets -56 355,1 -60 551,2 -76 764,5 -82 962,3 -80 575,4 -79 934,6II. BANKS 7 562,9 24 097,0 22 175,3 24 520,9 25 946,5 32 574,2 NBR credit 1 352,3 2 079,7 1 216,3 1 577,7 1 379,8 1 189,3 Equity capital 26 182,5 23 830,1 27 936,8 17 119,1 20 125,6 27 533,6 Banks deposits 810,5 990,8 732,1 0,0 0,0 0,0 Reserves -15 235,2 -12 536,7 -13 054,7 -16 221,7 -15 136,5 -17 017,1 Claims on banks -991,7 -1 177,5 -1 368,6 -1 577,7 -1 379,8 -1 189,3 Claims on OFIs -175,7 -139,1 -193,1 0,0 0,0 0,0 Other items net -4 379,9 -1 774,6 -3 098,5 23 623,5 20 957,4 22 057,7III. OFIs 6 763,1 2 590,0 125,7 18 857,9 2 766,0 -123,0 Reserves -146,1 -71,8 -817,0 -37,2 -24,2 -17,46 Claims on banks -1 700,1 -1 327,6 -9 390,1 -4 810,6 -4 063,0 -5 925,7 Claims on OFIs -25,0 0,0 -2 034,7 0,0 0,0 0,0 Long term loan 1 449,5 325,6 0,0 12 059,0 4 906,3 7 732,3 Other amounts due 0,0 0,0 0,0 5 943,3 0,0 0,0 NBR credit 229,6 121,2 768,0 1 639,8 1 431,8 1 171,5 Equity capital 6 204,8 5 847,1 18 573,6 5 211,0 4 744,3 5 070,4 Other items net 750,4 -2 304,4 -6 974,1 -1 147,4 -4 229,21 -8154,1
*Made of monetary standing and integrated standing of other banking institutions Source: NBR, Research Department
192
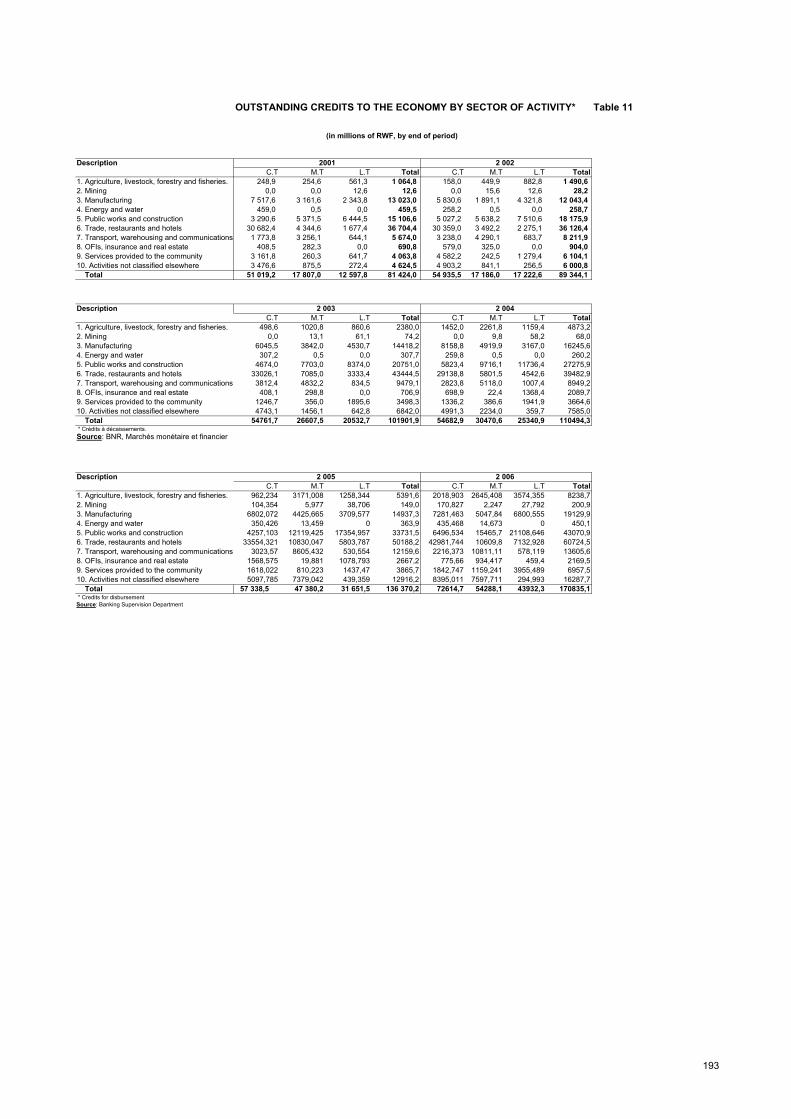
OUTSTANDING CREDITS TO THE ECONOMY BY SECTOR OF ACTIVITY* Table 11
(in millions of RWF, by end of period)
Description C.T M.T L.T Total C.T M.T L.T Total
1. Agriculture, livestock, forestry and fisheries. 248,9 254,6 561,3 1 064,8 158,0 449,9 882,8 1 490,62. Mining 0,0 0,0 12,6 12,6 0,0 15,6 12,6 28,23. Manufacturing 7 517,6 3 161,6 2 343,8 13 023,0 5 830,6 1 891,1 4 321,8 12 043,44. Energy and water 459,0 0,5 0,0 459,5 258,2 0,5 0,0 258,75. Public works and construction 3 290,6 5 371,5 6 444,5 15 106,6 5 027,2 5 638,2 7 510,6 18 175,96. Trade, restaurants and hotels 30 682,4 4 344,6 1 677,4 36 704,4 30 359,0 3 492,2 2 275,1 36 126,47. Transport, warehousing and communications 1 773,8 3 256,1 644,1 5 674,0 3 238,0 4 290,1 683,7 8 211,98. OFIs, insurance and real estate 408,5 282,3 0,0 690,8 579,0 325,0 0,0 904,09. Services provided to the community 3 161,8 260,3 641,7 4 063,8 4 582,2 242,5 1 279,4 6 104,110. Activities not classified elsewhere 3 476,6 875,5 272,4 4 624,5 4 903,2 841,1 256,5 6 000,8 Total 51 019,2 17 807,0 12 597,8 81 424,0 54 935,5 17 186,0 17 222,6 89 344,1
Description C.T M.T L.T Total C.T M.T L.T Total
1. Agriculture, livestock, forestry and fisheries. 498,6 1020,8 860,6 2380,0 1452,0 2261,8 1159,4 4873,22. Mining 0,0 13,1 61,1 74,2 0,0 9,8 58,2 68,03. Manufacturing 6045,5 3842,0 4530,7 14418,2 8158,8 4919,9 3167,0 16245,64. Energy and water 307,2 0,5 0,0 307,7 259,8 0,5 0,0 260,25. Public works and construction 4674,0 7703,0 8374,0 20751,0 5823,4 9716,1 11736,4 27275,96. Trade, restaurants and hotels 33026,1 7085,0 3333,4 43444,5 29138,8 5801,5 4542,6 39482,97. Transport, warehousing and communications 3812,4 4832,2 834,5 9479,1 2823,8 5118,0 1007,4 8949,28. OFIs, insurance and real estate 408,1 298,8 0,0 706,9 698,9 22,4 1368,4 2089,79. Services provided to the community 1246,7 356,0 1895,6 3498,3 1336,2 386,6 1941,9 3664,610. Activities not classified elsewhere 4743,1 1456,1 642,8 6842,0 4991,3 2234,0 359,7 7585,0 Total 54761,7 26607,5 20532,7 101901,9 54682,9 30470,6 25340,9 110494,3 * Crédits à décaissements.Source: BNR, Marchés monétaire et financier
Description C.T M.T L.T Total C.T M.T L.T Total
1. Agriculture, livestock, forestry and fisheries. 962,234 3171,008 1258,344 5391,6 2018,903 2645,408 3574,355 8238,72. Mining 104,354 5,977 38,706 149,0 170,827 2,247 27,792 200,93. Manufacturing 6802,072 4425,665 3709,577 14937,3 7281,463 5047,84 6800,555 19129,94. Energy and water 350,426 13,459 0 363,9 435,468 14,673 0 450,15. Public works and construction 4257,103 12119,425 17354,957 33731,5 6496,534 15465,7 21108,646 43070,96. Trade, restaurants and hotels 33554,321 10830,047 5803,787 50188,2 42981,744 10609,8 7132,928 60724,57. Transport, warehousing and communications 3023,57 8605,432 530,554 12159,6 2216,373 10811,11 578,119 13605,68. OFIs, insurance and real estate 1568,575 19,881 1078,793 2667,2 775,66 934,417 459,4 2169,59. Services provided to the community 1618,022 810,223 1437,47 3865,7 1842,747 1159,241 3955,489 6957,510. Activities not classified elsewhere 5097,785 7379,042 439,359 12916,2 8395,011 7597,711 294,993 16287,7 Total 57 338,5 47 380,2 31 651,5 136 370,2 72614,7 54288,1 43932,3 170835,1 * Credits for disbursementSource: Banking Supervision Department
2 005 2 006
2001 2 002
2 003 2 004
193

NEW CREDITS BY SECTOR OF ACTIVITY * Table 12
(in millions of RWF)
DescriptionC.T M.T L.T Total C.T M.T L.T Total
1. Agriculture, livestock, forestry and fisheries 248,9 254,6 561,3 1 064,8 158,0 449,9 882,8 1 490,62. Mining 0,0 0,0 12,6 12,6 0,0 15,6 12,6 28,23. Manufacturing 7 517,6 3 161,6 2 343,8 13 023,0 5 830,6 1 891,1 4 321,8 12 043,44. Energy and water 459,0 0,5 0,0 459,5 258,2 0,5 0,0 258,75. Public works and construction 3 290,6 5 371,5 6 444,5 15 106,6 5 027,2 5 638,2 7 510,6 18 175,96. Trade, restaurants and hotels 30 682,4 4 344,6 1 677,4 36 704,4 30 359,0 3 492,2 2 275,1 36 126,47. Transport, warehousing and communications 1 773,8 3 256,1 644,1 5 674,0 3 238,0 4 290,1 683,7 8 211,98. OFIs, insurance and real estate 408,5 282,3 0,0 690,8 579,0 325,0 0,0 904,09. Services provided to the community 3 161,8 260,3 641,7 4 063,8 4 582,2 242,5 1 279,4 6 104,110. Activities not classified elsewhere 3 476,6 875,5 272,4 4 624,5 4 903,2 841,1 256,5 6 000,8 Total 51 019,2 17 807,0 12 597,8 81 424,0 54 935,5 17 186,0 17 222,6 89 344,1
DescriptionC.T M.T L.T Total C.T M.T L.T Total
1. Agriculture, livestock, forestry and fisheries 498,6 1020,8 860,6 2380,0 1452,0 2261,8 1159,4 4873,22. Mining 0,0 13,1 61,1 74,2 0,0 9,8 58,2 68,03. Manufacturing 6045,5 3842,0 4530,7 14418,2 8158,8 4919,9 3167,0 16245,64. Energy and water 307,2 0,5 0,0 307,7 259,8 0,5 0,0 260,25. Public works and construction 4674,0 7703,0 8374,0 20751,0 5823,4 9716,1 11736,4 27275,96. Trade, restaurants and hotels 33026,1 7085,0 3333,4 43444,5 29138,8 5801,5 4542,6 39482,97. Transport, warehousing and communications 3812,4 4832,2 834,5 9479,1 2823,8 5118,0 1007,4 8949,28. OFIs, insurance and real estate 408,1 298,8 0,0 706,9 698,9 22,4 1368,4 2089,79. Services provided to the community 1246,7 356,0 1895,6 3498,3 1336,2 386,6 1941,9 3664,610. Activities not classified elsewhere 4743,1 1456,1 642,8 6842,0 4991,3 2234,0 359,7 7585,0 Total 54761,7 26607,5 20532,7 101901,9 54682,9 30470,6 25340,9 110494,3
DescriptionC.T M.T L.T Total C.T M.T L.T Total
1. Agriculture, livestock, forestry and fisheries 962,234 3171,008 1258,344 5391,6 2018,903 2645,408 3574,355 8238,72. Mining 104,354 5,977 38,706 149,0 170,827 2,247 27,792 200,93. Manufacturing 6802,072 4425,665 3709,577 14937,3 7281,463 5047,84 6800,555 19129,94. Energy and water 350,426 13,459 0 363,9 435,468 14,673 0 450,15. Public works and construction 4257,103 12119,425 17354,957 33731,5 6496,534 15465,696 21108,646 43070,96. Trade, restaurants and hotels 33554,321 10830,047 5803,787 50188,2 42981,744 10609,8 7132,928 60724,57. Transport, warehousing and communications 3023,57 8605,432 530,554 12159,6 2216,373 10811,105 578,119 13605,68. OFIs, insurance and real estate 1568,575 19,881 1078,793 2667,2 775,66 934,417 459,4 2169,59. Services provided to the community 1618,022 810,223 1437,47 3865,7 1842,747 1159,241 3955,489 6957,510. Activities not classified elsewhere 5097,785 7379,042 439,359 12916,2 8395,011 7597,711 294,993 16287,7 Total 57 338,5 47 380,2 31 651,5 136 370,2 72614,7 54288,1 43932,3 170835,1*Credits for disbursement.Source: Banking Supervision Department
2 005 2 006
2001 2 002
2 003 2 004
194

Table 13Interest rates (in %)Description 2003 2004 2005 2006
March June Sept Dec March June Sept Dec March June Sept Dec March June Sept Dec March June Sept Dec March June Sept Dec
Borrowing rate 9,69 10,16 9,91 10,18 10,15 10,05 8,96 9,02 8,88 9,19 9,30 9,43 9,07 9,39 9,39 9,39 9,08 8,65 8,55 8,01 8,13 8,27 8,36 8,29
Lending rate 16,93 15,79 18,21 17,29 16,75 16,67 17,25 16,37 14,87 16,85 16,35 16,45 16,26 15,12 15,29 16,48 16,41 15,29 15,33 16,08 15,70 16,26 16,35 nd
Interbank market rate 9,97 10,15 10,00 11,14 9,73 10,19 10,04 9,91 9,10 9,52 10,80 10,38 10,16 11,10 11,07 11,25 2,28 10,41 9,58 9,64 8,29 8,41 7,43 7,43
Money market rate
- excess liquidity 9,94 7,63 7,63 9,50 8,44 7,51 9,82 10,50 10,24 9,29 11,01 11,63 11,88 11,40 12,27 10,64 0,72 9,41 9,00 9,00 9,00 9,00 8,93 7,39
- injection - - - - - - - - - - - - - - - - - - - - - - - -
Discount rate 11,94 9,63 13,00 13,00 13,00 12,02 13,20 13,00 13,00 13,50 14,50 14,50 14,50 14,50 14,50 14,50 13,50 13,50 12,50 12,50 12,50 12,50 12,50 12,50
Weighted average on Treasury bills rate - - 8,75 9,25 8,50 8,30 9,84 10,49 10,52 10,69 11,50 12,68 12,26 12,68 12,85 12,26 5,30 9,69 10,77 10,24 10,15 10,26 9,91 8,08Source: NBR, Department of Money and Financial Market
2001 2002
195
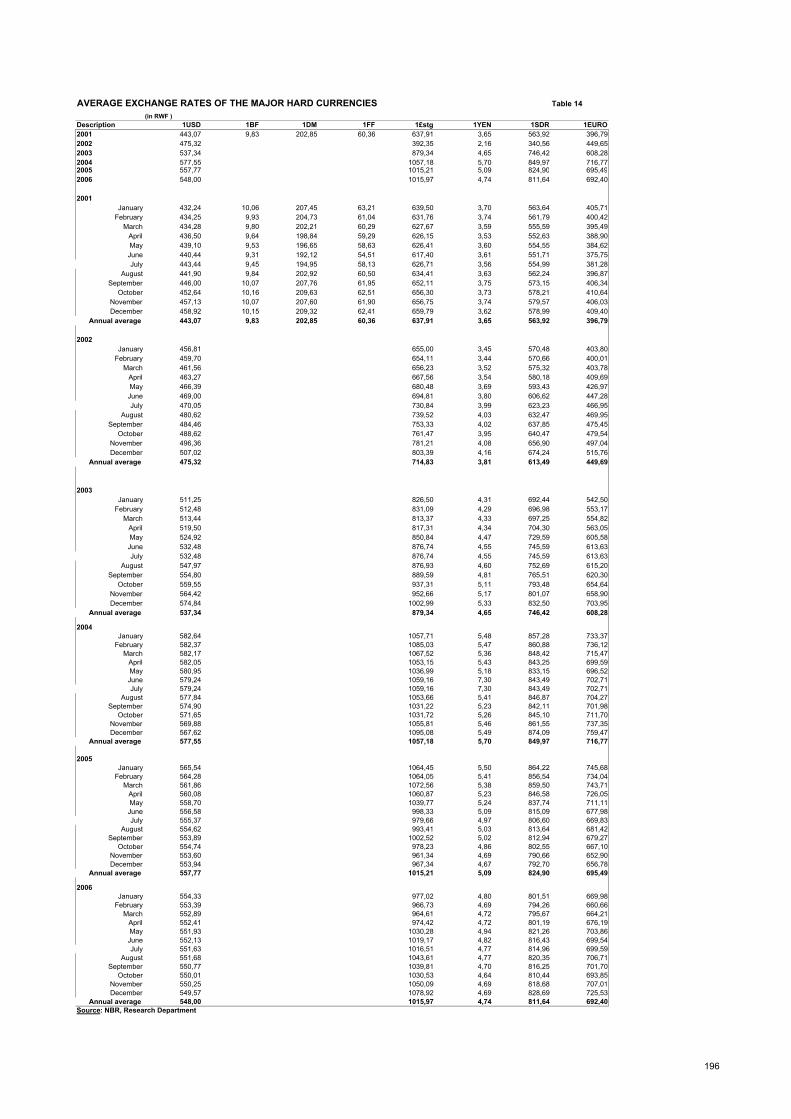
AVERAGE EXCHANGE RATES OF THE MAJOR HARD CURRENCIES Table 14(in RWF )
Description 1USD 1BF 1DM 1FF 1£stg 1YEN 1SDR 1EURO2001 443,07 9,83 202,85 60,36 637,91 3,65 563,92 396,792002 475,32 392,35 2,16 340,56 449,652003 537,34 879,34 4,65 746,42 608,282004 577,55 1057,18 5,70 849,97 716,772005 557,77 1015,21 5,09 824,90 695,492006 548,00 1015,97 4,74 811,64 692,40
2001January 432,24 10,06 207,45 63,21 639,50 3,70 563,64 405,71
February 434,25 9,93 204,73 61,04 631,76 3,74 561,79 400,42March 434,28 9,80 202,21 60,29 627,67 3,59 555,59 395,49
April 436,50 9,64 198,84 59,29 626,15 3,53 552,63 388,90May 439,10 9,53 196,65 58,63 626,41 3,60 554,55 384,62June 440,44 9,31 192,12 54,51 617,40 3,61 551,71 375,75July 443,44 9,45 194,95 58,13 626,71 3,56 554,99 381,28
August 441,90 9,84 202,92 60,50 634,41 3,63 562,24 396,87September 446,00 10,07 207,76 61,95 652,11 3,75 573,15 406,34
October 452,64 10,16 209,63 62,51 656,30 3,73 578,21 410,64November 457,13 10,07 207,60 61,90 656,75 3,74 579,57 406,03December 458,92 10,15 209,32 62,41 659,79 3,62 578,99 409,40
Annual average 443,07 9,83 202,85 60,36 637,91 3,65 563,92 396,79
2002January 456,81 655,00 3,45 570,48 403,80
February 459,70 654,11 3,44 570,66 400,01March 461,56 656,23 3,52 575,32 403,78
April 463,27 667,56 3,54 580,18 409,69May 466,39 680,48 3,69 593,43 426,97June 469,00 694,81 3,80 606,62 447,28July 470,05 730,84 3,99 623,23 466,95
August 480,62 739,52 4,03 632,47 469,95September 484,46 753,33 4,02 637,85 475,45
October 488,62 761,47 3,95 640,47 479,54November 496,36 781,21 4,08 656,90 497,04December 507,02 803,39 4,16 674,24 515,76
Annual average 475,32 714,83 3,81 613,49 449,69
2003January 511,25 826,50 4,31 692,44 542,50
February 512,48 831,09 4,29 696,98 553,17March 513,44 813,37 4,33 697,25 554,82
April 519,50 817,31 4,34 704,30 563,05May 524,92 850,84 4,47 729,59 605,58June 532,48 876,74 4,55 745,59 613,63July 532,48 876,74 4,55 745,59 613,63
August 547,97 876,93 4,60 752,69 615,20September 554,80 889,59 4,81 765,51 620,30
October 559,55 937,31 5,11 793,48 654,64November 564,42 952,66 5,17 801,07 658,90December 574,84 1002,99 5,33 832,50 703,95
Annual average 537,34 879,34 4,65 746,42 608,28
2004January 582,64 1057,71 5,48 857,28 733,37
February 582,37 1085,03 5,47 860,88 736,12March 582,17 1067,52 5,36 848,42 715,47
April 582,05 1053,15 5,43 843,25 699,59May 580,95 1036,99 5,18 833,15 696,52June 579,24 1059,16 7,30 843,49 702,71July 579,24 1059,16 7,30 843,49 702,71
August 577,84 1053,66 5,41 846,87 704,27September 574,90 1031,22 5,23 842,11 701,98
October 571,65 1031,72 5,26 845,10 711,70November 569,88 1055,81 5,46 861,55 737,35December 567,62 1095,08 5,49 874,09 759,47
Annual average 577,55 1057,18 5,70 849,97 716,77
2005January 565,54 1064,45 5,50 864,22 745,68
February 564,28 1064,05 5,41 856,54 734,04March 561,86 1072,56 5,38 859,50 743,71
April 560,08 1060,87 5,23 846,58 726,05May 558,70 1039,77 5,24 837,74 711,11June 556,58 998,33 5,09 815,09 677,98July 555,37 979,66 4,97 806,60 669,83
August 554,62 993,41 5,03 813,64 681,42September 553,89 1002,52 5,02 812,94 679,27
October 554,74 978,23 4,86 802,55 667,10November 553,60 961,34 4,69 790,66 652,90December 553,94 967,34 4,67 792,70 656,78
Annual average 557,77 1015,21 5,09 824,90 695,49
2006January 554,33 977,02 4,80 801,51 669,98
February 553,39 966,73 4,69 794,26 660,66March 552,89 964,61 4,72 795,67 664,21
April 552,41 974,42 4,72 801,19 676,19May 551,93 1030,28 4,94 821,26 703,86June 552,13 1019,17 4,82 816,43 699,54July 551,63 1016,51 4,77 814,96 699,59
August 551,68 1043,61 4,77 820,35 706,71September 550,77 1039,81 4,70 816,25 701,70
October 550,01 1030,53 4,64 810,44 693,85November 550,25 1050,09 4,69 818,68 707,01December 549,57 1078,92 4,69 828,69 725,53
Annual average 548,00 1015,97 4,74 811,64 692,40Source: NBR, Research Department
196
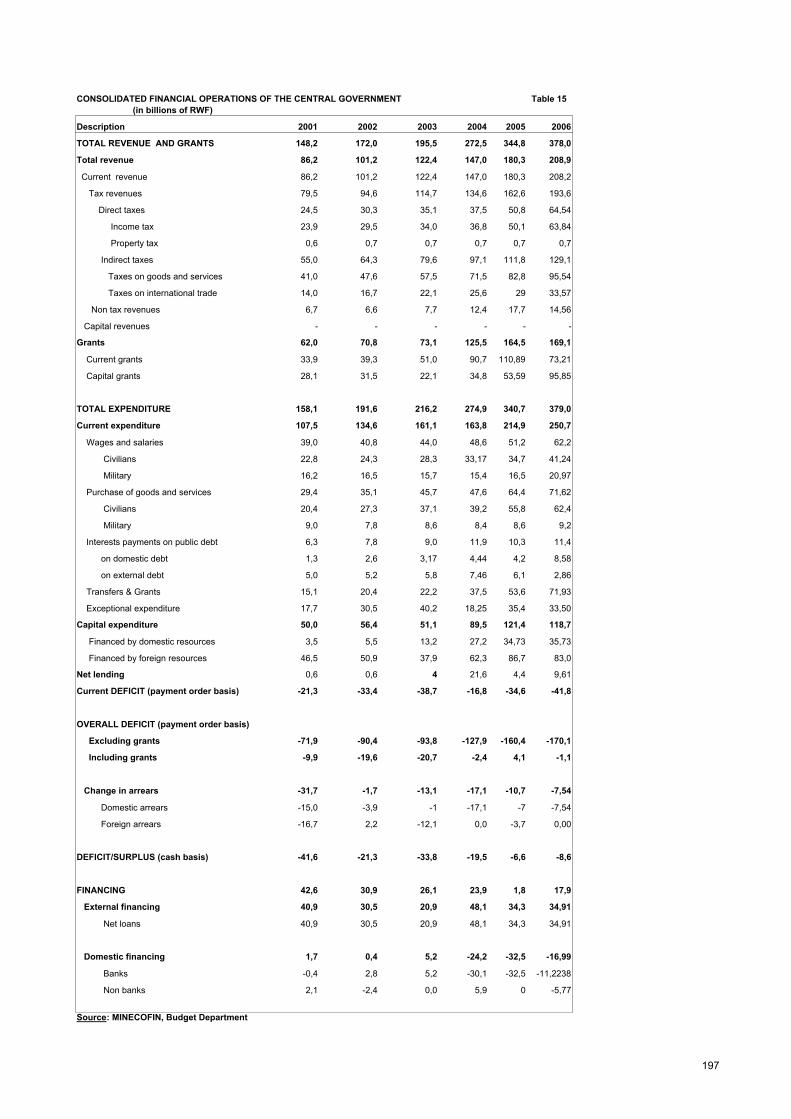
CONSOLIDATED FINANCIAL OPERATIONS OF THE CENTRAL GOVERNMENT Table 15 (in billions of RWF)
Description 2001 2002 2003 2004 2005 2006
TOTAL REVENUE AND GRANTS 148,2 172,0 195,5 272,5 344,8 378,0
Total revenue 86,2 101,2 122,4 147,0 180,3 208,9
Current revenue 86,2 101,2 122,4 147,0 180,3 208,2
Tax revenues 79,5 94,6 114,7 134,6 162,6 193,6
Direct taxes 24,5 30,3 35,1 37,5 50,8 64,54
Income tax 23,9 29,5 34,0 36,8 50,1 63,84
Property tax 0,6 0,7 0,7 0,7 0,7 0,7
Indirect taxes 55,0 64,3 79,6 97,1 111,8 129,1
Taxes on goods and services 41,0 47,6 57,5 71,5 82,8 95,54
Taxes on international trade 14,0 16,7 22,1 25,6 29 33,57
Non tax revenues 6,7 6,6 7,7 12,4 17,7 14,56
Capital revenues - - - - - -
Grants 62,0 70,8 73,1 125,5 164,5 169,1
Current grants 33,9 39,3 51,0 90,7 110,89 73,21
Capital grants 28,1 31,5 22,1 34,8 53,59 95,85
TOTAL EXPENDITURE 158,1 191,6 216,2 274,9 340,7 379,0
Current expenditure 107,5 134,6 161,1 163,8 214,9 250,7
Wages and salaries 39,0 40,8 44,0 48,6 51,2 62,2
Civilians 22,8 24,3 28,3 33,17 34,7 41,24
Military 16,2 16,5 15,7 15,4 16,5 20,97
Purchase of goods and services 29,4 35,1 45,7 47,6 64,4 71,62
Civilians 20,4 27,3 37,1 39,2 55,8 62,4
Military 9,0 7,8 8,6 8,4 8,6 9,2
Interests payments on public debt 6,3 7,8 9,0 11,9 10,3 11,4
on domestic debt 1,3 2,6 3,17 4,44 4,2 8,58
on external debt 5,0 5,2 5,8 7,46 6,1 2,86
Transfers & Grants 15,1 20,4 22,2 37,5 53,6 71,93
Exceptional expenditure 17,7 30,5 40,2 18,25 35,4 33,50
Capital expenditure 50,0 56,4 51,1 89,5 121,4 118,7
Financed by domestic resources 3,5 5,5 13,2 27,2 34,73 35,73
Financed by foreign resources 46,5 50,9 37,9 62,3 86,7 83,0
Net lending 0,6 0,6 4 21,6 4,4 9,61
Current DEFICIT (payment order basis) -21,3 -33,4 -38,7 -16,8 -34,6 -41,8
OVERALL DEFICIT (payment order basis)
Excluding grants -71,9 -90,4 -93,8 -127,9 -160,4 -170,1
Including grants -9,9 -19,6 -20,7 -2,4 4,1 -1,1
Change in arrears -31,7 -1,7 -13,1 -17,1 -10,7 -7,54
Domestic arrears -15,0 -3,9 -1 -17,1 -7 -7,54
Foreign arrears -16,7 2,2 -12,1 0,0 -3,7 0,00
DEFICIT/SURPLUS (cash basis) -41,6 -21,3 -33,8 -19,5 -6,6 -8,6
FINANCING 42,6 30,9 26,1 23,9 1,8 17,9
External financing 40,9 30,5 20,9 48,1 34,3 34,91
Net loans 40,9 30,5 20,9 48,1 34,3 34,91
Domestic financing 1,7 0,4 5,2 -24,2 -32,5 -16,99
Banks -0,4 2,8 5,2 -30,1 -32,5 -11,2238
Non banks 2,1 -2,4 0,0 5,9 0 -5,77
Source: MINECOFIN, Budget Department
197
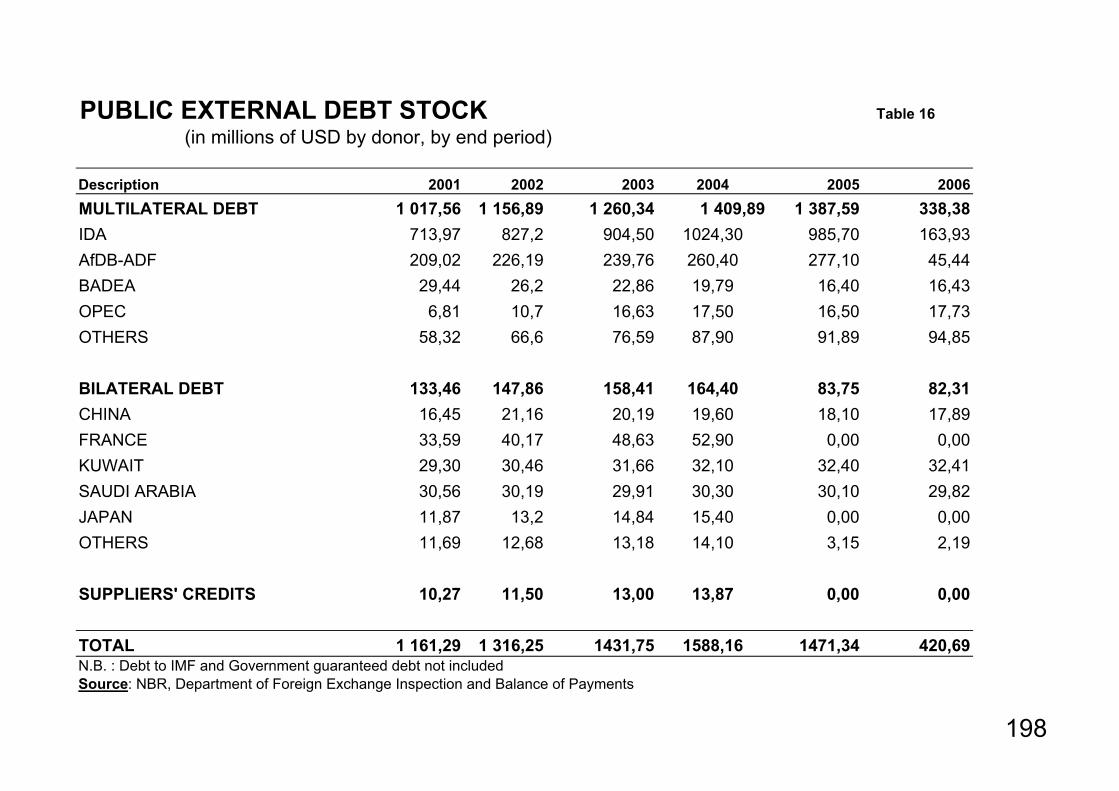
PUBLIC EXTERNAL DEBT STOCK Table 16 (in millions of USD by donor, by end period)
Description 2001 2002 2003 2004 2005 2006MULTILATERAL DEBT 1 017,56 1 156,89 1 260,34 1 409,89 1 387,59 338,38IDA 713,97 827,2 904,50 1024,30 985,70 163,93AfDB-ADF 209,02 226,19 239,76 260,40 277,10 45,44BADEA 29,44 26,2 22,86 19,79 16,40 16,43OPEC 6,81 10,7 16,63 17,50 16,50 17,73OTHERS 58,32 66,6 76,59 87,90 91,89 94,85
BILATERAL DEBT 133,46 147,86 158,41 164,40 83,75 82,31CHINA 16,45 21,16 20,19 19,60 18,10 17,89FRANCE 33,59 40,17 48,63 52,90 0,00 0,00KUWAIT 29,30 30,46 31,66 32,10 32,40 32,41SAUDI ARABIA 30,56 30,19 29,91 30,30 30,10 29,82JAPAN 11,87 13,2 14,84 15,40 0,00 0,00OTHERS 11,69 12,68 13,18 14,10 3,15 2,19
SUPPLIERS' CREDITS 10,27 11,50 13,00 13,87 0,00 0,00
TOTAL 1 161,29 1 316,25 1431,75 1588,16 1471,34 420,69N.B. : Debt to IMF and Government guaranteed debt not includedSource: NBR, Department of Foreign Exchange Inspection and Balance of Payments
198

Table 17Development of debt stock by donors
( in millions of RWF )
Description 2001 2002 2003 2004 2005 2006
MULTILATERAL DEBT 463 826,21 587 313,33 676 839,79 793 604,00 768 334,53 185 652,97
IDA 328 541,63 423 304,12 485 430,33 581 031,50 545 800,52 89 940,57
AfDB-ADF 92 203,53 111 736,15 128 968,99 144 322,56 153 435,45 24 930,76
BADEA 13 630,02 13 399,31 12 296,63 11 218,16 9 080,99 9 014,36
OPEC 3 133,92 5 463,02 8 945,42 9 835,02 9 136,36 9 727,61
EIB 1 152,79 1 339,01 4 222,58 4 517,87 8 970,24 9 228,33
EU (EEC) 9 958,60 13 051,76 13 254,07 14 908,42 12 563,88 12 306,27
IFAD 15 205,73 19 019,98 23 721,77 27 770,47 29 347,09 30 505,07
BILATERAL DEBT 60 303,35 75 682,70 85 210,12 93 021,73 46 373,94 45 159,57
CHINA 6 458,82 10 831,34 10 860,38 11 093,45 10 022,31 9 815,39
FRANCE 15 456,99 20 560,66 26 142,36 29 992,56 0,00 0,00
KUWAIT 13 482,76 15 590,04 17 030,19 18 167,86 17 940,49 17 781,82
SAUDI ARABIA 14 064,91 15 452,87 16 088,85 17 034,14 16 666,93 16 360,81
JAPAN 5 462,04 6 754,93 7 982,57 8 729,64 0,00 0,00
Austria 3 807,64 4 909,19 5 432,88 6 207,12 0,00 0,00
Abu Dhabi (FADEA) 1 198,34 1 358,46 1 452,35 1 547,53 1 517,19 976,60
Libya 371,84 225,22 220,54 249,42 227,02 224,95
SUPPLIERS' CREDITS 4 726,65 5 888,88 6 992,81 7 460,79 0,00 0,00
GRAND TOTAL 528 856,21 668 884,92 769 042,72 894 086,52 814 708,47 230 812,54
( in millions of USD)Description 2001 2002 2003 2004 2005 2006
MULTILATERAL DEBT 1 017,47 1 156,89 1 260,34 1 409,90 1387,6 338,38
IDA 713,92 827,20 904,50 1 024,30 985,70 163,93 AfDB-ADF 209,00 226,19 239,76 260,40 277,10 45,44
BADEA 29,40 26,20 22,86 19,80 16,40 16,43
OPEC 6,81 10,70 16,63 17,50 16,50 17,73
EIB 5,00 5,50 7,85 11,10 16,20 16,82
EU (EEC) 20,30 23,90 24,64 26,30 22,69 22,43
IFAD 33,04 37,20 44,10 50,50 53,00 55,60
BILATERAL DEBT 133,45 147,86 158,41 164,40 83,75 82,31
CHINA 16,45 21,16 20,19 19,57 18,10 17,89
FRANCE 33,59 40,17 48,60 52,91 0,00 0,00
KUWAIT 29,30 30,46 31,66 32,05 32,40 32,41
SAUDI ARABIA 30,56 30,19 29,91 30,30 30,10 29,82
JAPAN 11,87 13,20 14,84 15,40 0,00 0,00
Austria 8,27 9,59 10,10 11,00 0,00 0,00
Abu Dhabi (FADEA) 2,60 2,65 2,70 2,73 2,74 1,78
Libya 0,81 0,44 0,41 0,44 0,41 0,41
SUPPLIERS' CREDITS 10,27 11,51 13,00 13,87 0,00 0,00
GRAND TOTAL 1 161,29 1 316,26 1 431,75 1 588,17 1 471,34 420,69
N.B. : Debt to IMF and guaranteed debt not includedSource: NBR, Department of Foreign Exchange Inspection and Balance of Payments
199
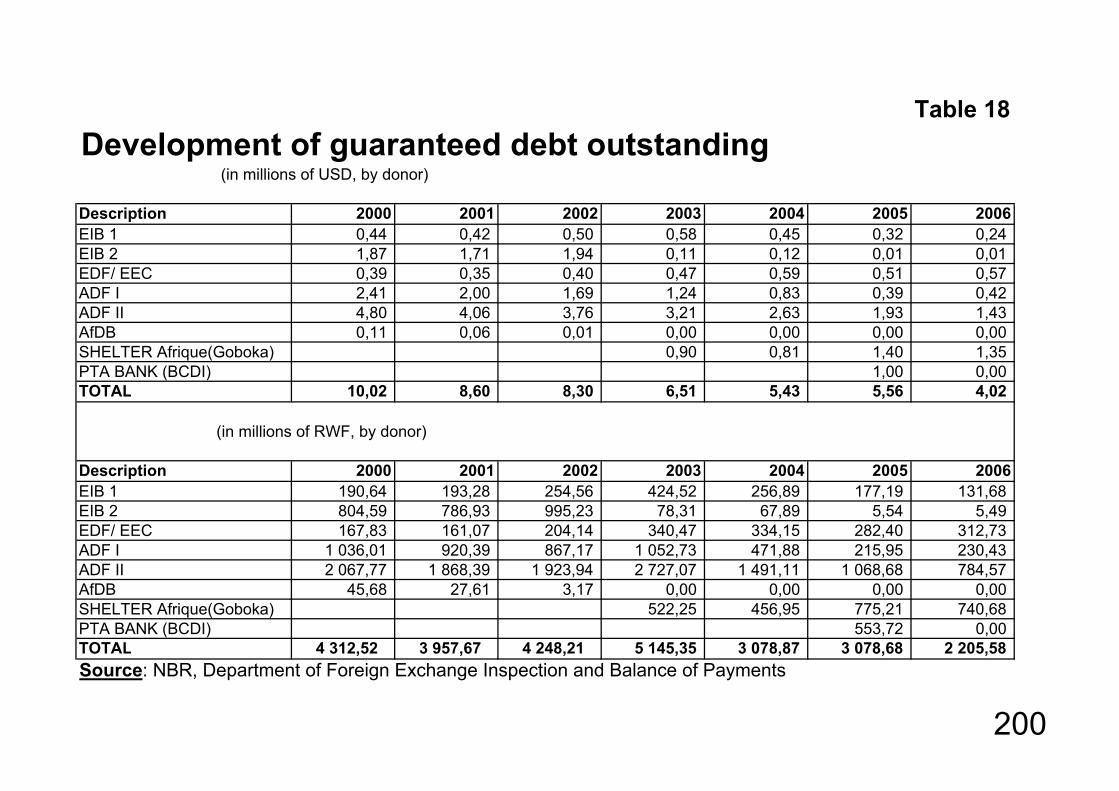
Table 18Development of guaranteed debt outstanding (in millions of USD, by donor)
Description 2000 2001 2002 2003 2004 2005 2006EIB 1 0,44 0,42 0,50 0,58 0,45 0,32 0,24EIB 2 1,87 1,71 1,94 0,11 0,12 0,01 0,01EDF/ EEC 0,39 0,35 0,40 0,47 0,59 0,51 0,57ADF I 2,41 2,00 1,69 1,24 0,83 0,39 0,42ADF II 4,80 4,06 3,76 3,21 2,63 1,93 1,43AfDB 0,11 0,06 0,01 0,00 0,00 0,00 0,00SHELTER Afrique(Goboka) 0,90 0,81 1,40 1,35PTA BANK (BCDI) 1,00 0,00TOTAL 10,02 8,60 8,30 6,51 5,43 5,56 4,02
(in millions of RWF, by donor)
Description 2000 2001 2002 2003 2004 2005 2006EIB 1 190,64 193,28 254,56 424,52 256,89 177,19 131,68EIB 2 804,59 786,93 995,23 78,31 67,89 5,54 5,49EDF/ EEC 167,83 161,07 204,14 340,47 334,15 282,40 312,73ADF I 1 036,01 920,39 867,17 1 052,73 471,88 215,95 230,43ADF II 2 067,77 1 868,39 1 923,94 2 727,07 1 491,11 1 068,68 784,57AfDB 45,68 27,61 3,17 0,00 0,00 0,00 0,00SHELTER Afrique(Goboka) 522,25 456,95 775,21 740,68PTA BANK (BCDI) 553,72 0,00TOTAL 4 312,52 3 957,67 4 248,21 5 145,35 3 078,87 3 078,68 2 205,58Source: NBR, Department of Foreign Exchange Inspection and Balance of Payments
200
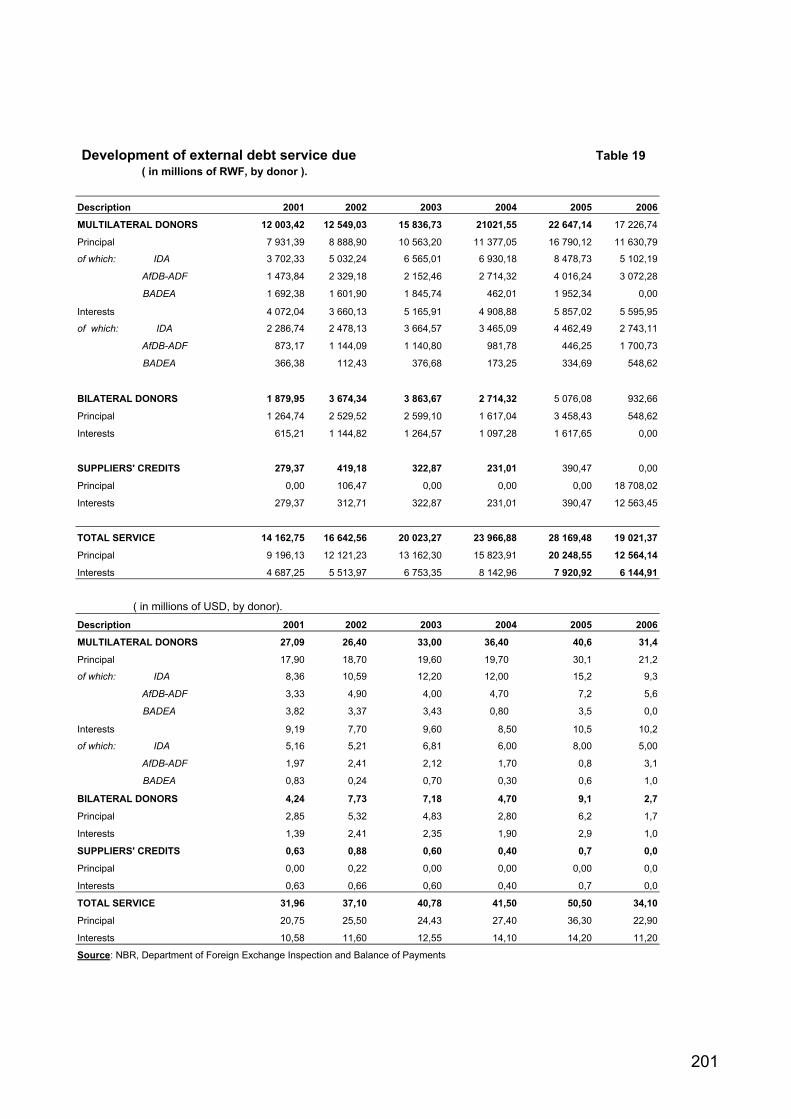
Development of external debt service due Table 19 ( in millions of RWF, by donor ).
Description 2001 2002 2003 2004 2005 2006
MULTILATERAL DONORS 12 003,42 12 549,03 15 836,73 21021,55 22 647,14 17 226,74
Principal 7 931,39 8 888,90 10 563,20 11 377,05 16 790,12 11 630,79
of which: IDA 3 702,33 5 032,24 6 565,01 6 930,18 8 478,73 5 102,19
AfDB-ADF 1 473,84 2 329,18 2 152,46 2 714,32 4 016,24 3 072,28
BADEA 1 692,38 1 601,90 1 845,74 462,01 1 952,34 0,00
Interests 4 072,04 3 660,13 5 165,91 4 908,88 5 857,02 5 595,95
of which: IDA 2 286,74 2 478,13 3 664,57 3 465,09 4 462,49 2 743,11
AfDB-ADF 873,17 1 144,09 1 140,80 981,78 446,25 1 700,73
BADEA 366,38 112,43 376,68 173,25 334,69 548,62
BILATERAL DONORS 1 879,95 3 674,34 3 863,67 2 714,32 5 076,08 932,66
Principal 1 264,74 2 529,52 2 599,10 1 617,04 3 458,43 548,62
Interests 615,21 1 144,82 1 264,57 1 097,28 1 617,65 0,00
SUPPLIERS' CREDITS 279,37 419,18 322,87 231,01 390,47 0,00
Principal 0,00 106,47 0,00 0,00 0,00 18 708,02
Interests 279,37 312,71 322,87 231,01 390,47 12 563,45
TOTAL SERVICE 14 162,75 16 642,56 20 023,27 23 966,88 28 169,48 19 021,37
Principal 9 196,13 12 121,23 13 162,30 15 823,91 20 248,55 12 564,14
Interests 4 687,25 5 513,97 6 753,35 8 142,96 7 920,92 6 144,91
( in millions of USD, by donor).Description 2001 2002 2003 2004 2005 2006
MULTILATERAL DONORS 27,09 26,40 33,00 36,40 40,6 31,4
Principal 17,90 18,70 19,60 19,70 30,1 21,2
of which: IDA 8,36 10,59 12,20 12,00 15,2 9,3
AfDB-ADF 3,33 4,90 4,00 4,70 7,2 5,6
BADEA 3,82 3,37 3,43 0,80 3,5 0,0
Interests 9,19 7,70 9,60 8,50 10,5 10,2
of which: IDA 5,16 5,21 6,81 6,00 8,00 5,00
AfDB-ADF 1,97 2,41 2,12 1,70 0,8 3,1
BADEA 0,83 0,24 0,70 0,30 0,6 1,0
BILATERAL DONORS 4,24 7,73 7,18 4,70 9,1 2,7
Principal 2,85 5,32 4,83 2,80 6,2 1,7
Interests 1,39 2,41 2,35 1,90 2,9 1,0
SUPPLIERS' CREDITS 0,63 0,88 0,60 0,40 0,7 0,0
Principal 0,00 0,22 0,00 0,00 0,00 0,0
Interests 0,63 0,66 0,60 0,40 0,7 0,0
TOTAL SERVICE 31,96 37,10 40,78 41,50 50,50 34,10
Principal 20,75 25,50 24,43 27,40 36,30 22,90
Interests 10,58 11,60 12,55 14,10 14,20 11,20
Source: NBR, Department of Foreign Exchange Inspection and Balance of Payments
201

Table 20 Development of drawings by donors (in millions of RWF)Description 2001 2002 2003 2004 2005 2006MULTILATERAL LOANS 39 455,89 41 810,13 19 714,10 61 620,86 56 282,30 42 337,89
IDA 23 720,98 34 859,22 13 070,45 48 043,48 26 624,34 21 074,11
AfDB-ADF 5 183,33 4 330,35 2 972,88 7 808,00 20 521,88 15 390,02
IFAD 2 482,11 1 146,20 1 497,09 2 662,34 3 770,81 1 522,83
BADEA 0,00 52,55 0,00 0,00 55,78 0,00
OPEC 2 658,57 2 106,82 3 241,80 542,86 266,88 1 796,15
OTHERS 5 347,49 360,51 429,47 2 564,17 5 042,62 2 554,78
BILATERAL LOANS 503,27 695,76 0,00 0,00 0,00 0,00
CHINA 503,27 695,76 0,00 0,00 0,00 0,00
CFD 0,00 0,00 0,00 0,00 0,00 0,00
KUWAIT FUND 0,00 0,00 0,00 0,00 0,00 0,00
SAUDI ARABIA FUND 0,00 0,00 0,00 0,00 0,00 0,00
OECF JAPAN 0,00 0,00 0,00 0,00 0,00 0,00
OTHERS 0,00 0,00 0,00 0,00 0,00 0,00
SUPPLIERS' CREDITS 0,00 0,00 0,00 0,00 0,00 0,00
of which :
BNP-AMSTERD. 0,00 0,00 0,00 0,00 0,00 0,00
SEE-CANADA 0,00 0,00 0,00 0,00 0,00 0,00
COFACE 0,00 0,00 0,00 0,00 0,00 0,00
BNP-PARIS 0,00 0,00 0,00 0,00 0,00 0,00
GRAND TOTAL 39 959,15 42 505,89 19 714,10 61 620,86 56 282,30 42 337,89
(in millions of USD)Description 2001 2002 2003 2004 2005 2006
MULTILATERAL LOANS 89,07 91,49 43,46 106,70 100,90 75,90
IDA 53,70 73,34 25,42 83,19 47,73 37,78
AfDB-ADF 11,70 9,11 5,97 13,52 36,79 27,59
IFAD 5,60 3,74 4,75 4,61 6,76 2,73
BADEA 0,00 0,11 0,00 0,00 0,10 0,00
OPEC 6,00 4,43 6,51 0,94 0,48 3,22
OTHERS 12,07 0,76 0,81 4,44 9,04 4,58
BILATERAL LOANS 1,14 1,46 0,00 0,00 0,00 0,00
CHINA 1,14 1,46 0,00 0,00 0,00 0,00
CFD 0,00 0,00 0,00 0,00 0,00 0,00
KUWAIT FUND 0,00 0,00 0,00 0,00 0,00 0,00
SAUDI ARABIA FUND 0,00 0,00 0,00 0,00 0,00 0,00
OECF JAPAN 0,00 0,00 0,00 0,00 0,00 0,00
OTHERS 0,00 0,00 0,00 0,00 0,00 0,00
SUPPLIERS' CREDITS 0,00 0,00 0,00 0,00 0,00 0,00
of which :
BNP-AMSTERD. 0,00 0,00 0,00 0,00 0,00 0,00
SEE-CANADA 0,00 0,00 0,00 0,00 0,00 0,00
COFACE 0,00 0,00 0,00 0,00 0,00 0,00
BNP-PARIS 0,00 0,00 0,00 0,00 0,00 0,00
GRAND TOTAL 90,21 92,95 43,46 106,70 100,90 75,90
Source: NBR, Department of Foreign Exchange Inspection and Balance of Payments
202
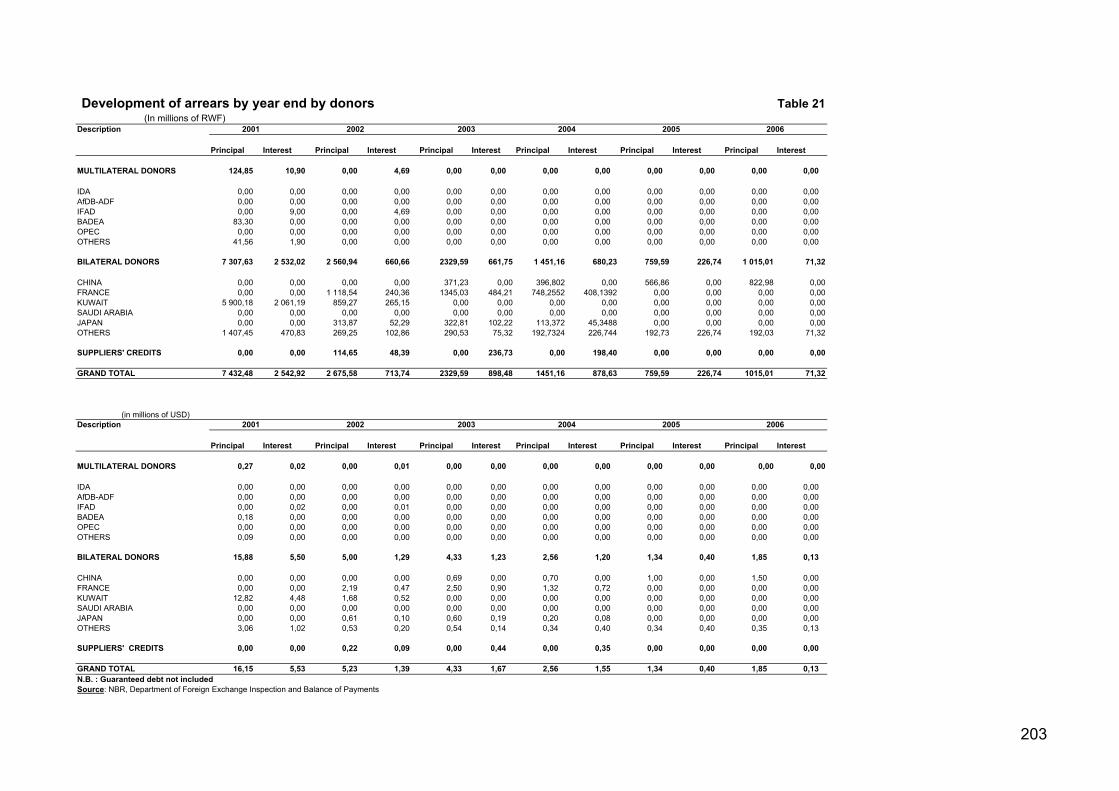
Development of arrears by year end by donors Table 21 (In millions of RWF)Description 2001 2002
Principal Interest Principal Interest Principal Interest Principal Interest Principal Interest Principal Interest
MULTILATERAL DONORS 124,85 10,90 0,00 4,69 0,00 0,00 0,00 0,00 0,00 0,00 0,00 0,00
IDA 0,00 0,00 0,00 0,00 0,00 0,00 0,00 0,00 0,00 0,00 0,00 0,00 AfDB-ADF 0,00 0,00 0,00 0,00 0,00 0,00 0,00 0,00 0,00 0,00 0,00 0,00 IFAD 0,00 9,00 0,00 4,69 0,00 0,00 0,00 0,00 0,00 0,00 0,00 0,00 BADEA 83,30 0,00 0,00 0,00 0,00 0,00 0,00 0,00 0,00 0,00 0,00 0,00 OPEC 0,00 0,00 0,00 0,00 0,00 0,00 0,00 0,00 0,00 0,00 0,00 0,00 OTHERS 41,56 1,90 0,00 0,00 0,00 0,00 0,00 0,00 0,00 0,00 0,00 0,00
BILATERAL DONORS 7 307,63 2 532,02 2 560,94 660,66 2329,59 661,75 1 451,16 680,23 759,59 226,74 1 015,01 71,32
CHINA 0,00 0,00 0,00 0,00 371,23 0,00 396,802 0,00 566,86 0,00 822,98 0,00FRANCE 0,00 0,00 1 118,54 240,36 1345,03 484,21 748,2552 408,1392 0,00 0,00 0,00 0,00KUWAIT 5 900,18 2 061,19 859,27 265,15 0,00 0,00 0,00 0,00 0,00 0,00 0,00 0,00SAUDI ARABIA 0,00 0,00 0,00 0,00 0,00 0,00 0,00 0,00 0,00 0,00 0,00 0,00JAPAN 0,00 0,00 313,87 52,29 322,81 102,22 113,372 45,3488 0,00 0,00 0,00 0,00OTHERS 1 407,45 470,83 269,25 102,86 290,53 75,32 192,7324 226,744 192,73 226,74 192,03 71,32
SUPPLIERS' CREDITS 0,00 0,00 114,65 48,39 0,00 236,73 0,00 198,40 0,00 0,00 0,00 0,00
GRAND TOTAL 7 432,48 2 542,92 2 675,58 713,74 2329,59 898,48 1451,16 878,63 759,59 226,74 1015,01 71,32
(in millions of USD)Description 2001 2002
Principal Interest Principal Interest Principal Interest Principal Interest Principal Interest Principal Interest
MULTILATERAL DONORS 0,27 0,02 0,00 0,01 0,00 0,00 0,00 0,00 0,00 0,00 0,00 0,00
IDA 0,00 0,00 0,00 0,00 0,00 0,00 0,00 0,00 0,00 0,00 0,00 0,00 AfDB-ADF 0,00 0,00 0,00 0,00 0,00 0,00 0,00 0,00 0,00 0,00 0,00 0,00 IFAD 0,00 0,02 0,00 0,01 0,00 0,00 0,00 0,00 0,00 0,00 0,00 0,00 BADEA 0,18 0,00 0,00 0,00 0,00 0,00 0,00 0,00 0,00 0,00 0,00 0,00 OPEC 0,00 0,00 0,00 0,00 0,00 0,00 0,00 0,00 0,00 0,00 0,00 0,00 OTHERS 0,09 0,00 0,00 0,00 0,00 0,00 0,00 0,00 0,00 0,00 0,00 0,00
BILATERAL DONORS 15,88 5,50 5,00 1,29 4,33 1,23 2,56 1,20 1,34 0,40 1,85 0,13
CHINA 0,00 0,00 0,00 0,00 0,69 0,00 0,70 0,00 1,00 0,00 1,50 0,00 FRANCE 0,00 0,00 2,19 0,47 2,50 0,90 1,32 0,72 0,00 0,00 0,00 0,00 KUWAIT 12,82 4,48 1,68 0,52 0,00 0,00 0,00 0,00 0,00 0,00 0,00 0,00 SAUDI ARABIA 0,00 0,00 0,00 0,00 0,00 0,00 0,00 0,00 0,00 0,00 0,00 0,00 JAPAN 0,00 0,00 0,61 0,10 0,60 0,19 0,20 0,08 0,00 0,00 0,00 0,00 OTHERS 3,06 1,02 0,53 0,20 0,54 0,14 0,34 0,40 0,34 0,40 0,35 0,13
SUPPLIERS' CREDITS 0,00 0,00 0,22 0,09 0,00 0,44 0,00 0,35 0,00 0,00 0,00 0,00
GRAND TOTAL 16,15 5,53 5,23 1,39 4,33 1,67 2,56 1,55 1,34 0,40 1,85 0,13 N.B. : Guaranteed debt not includedSource: NBR, Department of Foreign Exchange Inspection and Balance of Payments
2003 2004 2005 2006
2003 2004 2005 2006
203

RWANDA'S BALANCE OF PAYMENTS ( in millions of USD) Table 22
2001 2002 2003 2004 2005 2006
Trade balance -132,4 -140,6 -165,4 -177,9 -228,7 -296,69 1. Exports (fob) 93,6 67,4 63,3 98,1 125,0 142,71 of which - coffee 19,4 14,6 15,0 32,2 38,3 54,04 - tea 22,7 22,0 22,5 21,6 24,4 32,10 2. Imports (fob) -226,0 -207,9 -228,7 -275,9 -353,6 -439,40Net services -158,1 -160,7 -157,7 -170,7 -193,7 -243,94 Net non factor services -135,7 -141,6 -127,2 -137,1 -166,5 -225,27 Net factor services -22,5 -19,1 -30,5 -33,7 -27,2 -18,67Balance of goods and services -290,6 -301,2 -323,2 -348,6 -422,3 -540,63Net current transfers 192,6 195,3 226,4 313,9 364,5 323,82 Net private transfers 21,7 24,5 31,3 35,1 46,7 74,48 Net official transfers 170,9 170,8 195,0 278,9 317,8 249,35Current balance (+net current transfers) -98,0 -105,9 -96,8 -34,7 -57,82 -216,80Capital and financial transactions account 146,7 110,9 71,3 134,9 175,9 291,3 Capital account 68,7 41,7 41,1 60,6 93,5 1400,08 Capital transfers 68,7 41,7 41,1 60,6 93,5 1400,08 Debt cancellation 18,5 0,0 0,0 0,0 0,0 1226,60 Migrants' transfers 0,0 0,0 0,0 0,0 0,0 0,00 Other capital transfers (of which support grants to PIP) 50,2 41,7 41,1 60,6 93,5 173,48 Financial transactions account 78,0 69,2 30,2 74,4 82,5 -1108,77 Official capital (net) 57,1 53,1 7,7 71,3 53,7 -1104,83 Long term private capital (net) 4,6 2,6 3,6 -2,0 -4,6 -5,61 Other capital 16,4 13,5 18,9 5,1 33,4 1,67 Short term capital 12,6 10,9 14,3 -2,6 22,9 -15,13 Direct investments 3,8 2,6 4,7 7,7 10,5 16,80 Portfolio investmentsErrors and Omissions -35,5 7,87 -10,23 7,65 1,03 5,63
Overall balance 13,3 12,8 -35,7 107,9 119,2 80,13Available financing (- incr.) -13,3 -12,8 35,7 -107,9 -119,2 -80,13
Change of net foreign assets of NBR -25,2 -29,6 27,2 -106,8 -120,2 -80,13 a. Net credits of IMF 1,5 -6,0 -0,9 -3,6 -6,7 2,52 b. Changes of other gross official reserves of NBR (- incr.) -21,4 -31,6 28,8 -100,3 -93,5 -33,81 c.Change of other gross foreign liabilities (+ incr.) -5,3 7,9 -0,7 -2,9 -20,0 -48,84Change of arrears -20,6 5,6 -16,2 -3,5 1,1 0,00Exceptional financing 32,6 11,2 24,7 2,4 0,0 0,00 Rescheduling 26,3 10,6 22,2 2,4 0,0 Debt cancellation 6,3 0,6 2,5 0,0 0,0
ALM (+ indicates need) 0,0 0,0 0,0 0,0 0,0 0,00
For the recordGross reserves NBR (millions of USD) 212,05 243,00 214,2 314,5 406,9 440,73Foreign liabilities (millions of USD) 100,00 101,85 101,3 98,4 78,3 29,63Gross reserves in months of imports GSNF 5,7 8,2 6,2 7,3 7,3 7,2Gross reserves in months of imports GS 8,7 10,3 8,4 10,3 10,4 9,09Gross reserves in months of cif imports of goods 11,3 14,0 11,2 13,7 13,8 12,04Gross reserves in months of fob. imports of goods -7,91 -8,55 -9,32 -8,98 -9,58 -10,03Trade balance in % of GDP -17,35 -18,32 -18,20 -17,60 -17,69 -18,28Current balance (without grants)/GDP -5,85 -6,44 -5,45 -1,75 -2,42 -7,33Current balance ( +transfers)/GDP 0,79 0,78 -2,01 5,45 4,99 2,71GDP ($US, Current) 1 674 1 644 1 776 1 980 2 387 2957,06GDP (millions of RWF, Current) 741 871,9 781 468,4 955 164,1 1 137 905,7 1 331 603,6 1 631 587,5 Exchange rate 1 USD ( FRW/1 USD) by end period 457,90 511,85 580,28 566,86 553,83 548,65Imports of Goods and Services (349,55) (355,93) (412,99) (520,11) (664,67)Average exchange rate 1 USD ( FRW/1 USD) 443,09 475,37 537,91 574,63 557,81 551,76SOURCE : NBR, Department of Foreign Exchange Inspection and Balance of Payments
204
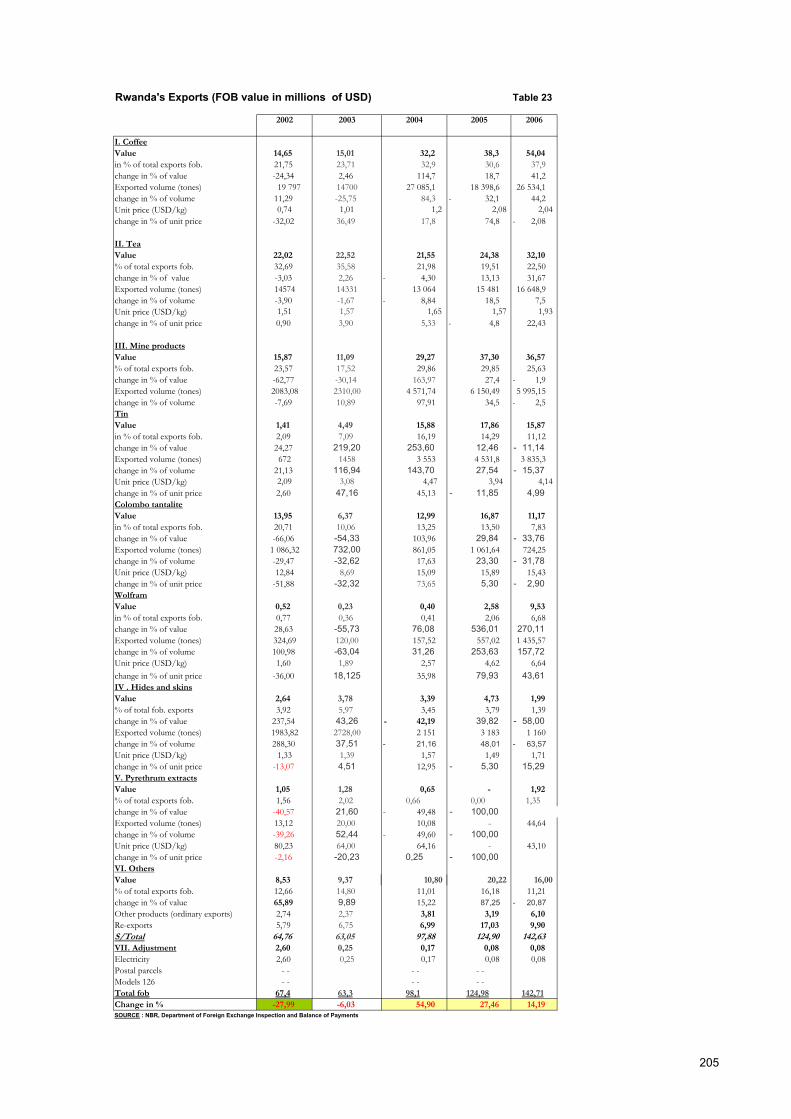
Rwanda's Exports (FOB value in millions of USD) Table 23
2002 2003 2004 2005 2006
I. CoffeeValue 14,65 15,01 32,2 38,3 54,04 in % of total exports fob. 21,75 23,71 32,9 30,6 37,9 change in % of value -24,34 2,46 114,7 18,7 41,2 Exported volume (tones) 19 797 14700 27 085,1 18 398,6 26 534,1 change in % of volume 11,29 -25,75 84,3 32,1 - 44,2 Unit price (USD/kg) 0,74 1,01 1,2 2,08 2,04 change in % of unit price -32,02 36,49 17,8 74,8 2,08 -
II. TeaValue 22,02 22,52 21,55 24,38 32,10 % of total exports fob. 32,69 35,58 21,98 19,51 22,50 change in % of value -3,03 2,26 4,30 - 13,13 31,67 Exported volume (tones) 14574 14331 13 064 15 481 16 648,9 change in % of volume -3,90 -1,67 8,84 - 18,5 7,5 Unit price (USD/kg) 1,51 1,57 1,65 1,57 1,93 change in % of unit price 0,90 3,90 5,33 4,8 - 22,43
III. Mine productsValue 15,87 11,09 29,27 37,30 36,57 % of total exports fob. 23,57 17,52 29,86 29,85 25,63 change in % of value -62,77 -30,14 163,97 27,4 1,9 - Exported volume (tones) 2083,08 2310,00 4 571,74 6 150,49 5 995,15 change in % of volume -7,69 10,89 97,91 34,5 2,5 - TinValue 1,41 4,49 15,88 17,86 15,87 in % of total exports fob. 2,09 7,09 16,19 14,29 11,12 change in % of value 24,27 219,20 253,60 12,46 11,14 - Exported volume (tones) 672 1458 3 553 4 531,8 3 835,3 change in % of volume 21,13 116,94 143,70 27,54 15,37 - Unit price (USD/kg) 2,09 3,08 4,47 3,94 4,14 change in % of unit price 2,60 47,16 45,13 11,85 - 4,99 Colombo tantaliteValue 13,95 6,37 12,99 16,87 11,17 in % of total exports fob. 20,71 10,06 13,25 13,50 7,83 change in % of value -66,06 -54,33 103,96 29,84 33,76 - Exported volume (tones) 1 086,32 732,00 861,05 1 061,64 724,25 change in % of volume -29,47 -32,62 17,63 23,30 31,78 - Unit price (USD/kg) 12,84 8,69 15,09 15,89 15,43 change in % of unit price -51,88 -32,32 73,65 5,30 2,90 - WolframValue 0,52 0,23 0,40 2,58 9,53 in % of total exports fob. 0,77 0,36 0,41 2,06 6,68 change in % of value 28,63 -55,73 76,08 536,01 270,11 Exported volume (tones) 324,69 120,00 157,52 557,02 1 435,57 change in % of volume 100,98 -63,04 31,26 253,63 157,72 Unit price (USD/kg) 1,60 1,89 2,57 4,62 6,64 change in % of unit price -36,00 18,125 35,98 79,93 43,61 IV . Hides and skinsValue 2,64 3,78 3,39 4,73 1,99 % of total fob. exports 3,92 5,97 3,45 3,79 1,39 change in % of value 237,54 43,26 42,19 - 39,82 58,00 - Exported volume (tones) 1983,82 2728,00 2 151 3 183 1 160 change in % of volume 288,30 37,51 21,16 - 48,01 63,57 - Unit price (USD/kg) 1,33 1,39 1,57 1,49 1,71 change in % of unit price -13,07 4,51 12,95 5,30 - 15,29 V. Pyrethrum extractsValue 1,05 1,28 0,65 - 1,92 % of total exports fob. 1,56 2,02 0,66 0,00 1,35change in % of value -40,57 21,60 49,48 - 100,00 - Exported volume (tones) 13,12 20,00 10,08 - 44,64 change in % of volume -39,26 52,44 49,60 - 100,00 - Unit price (USD/kg) 80,23 64,00 64,16 - 43,10 change in % of unit price -2,16 -20,23 0,25 100,00 - VI. OthersValue 8,53 9,37 10,80 20,22 16,00% of total exports fob. 12,66 14,80 11,01 16,18 11,21 change in % of value 65,89 9,89 15,22 87,25 20,87 - Other products (ordinary exports) 2,74 2,37 3,81 3,19 6,10 Re-exports 5,79 6,75 6,99 17,03 9,90 S/Total 64,76 63,05 97,88 124,90 142,63 VII. Adjustment 2,60 0,25 0,17 0,08 0,08 Electricity 2,60 0,25 0,17 0,08 0,08 Postal parcels - - - - - -Models 126 - - - - - -Total fob 67,4 63,3 98,1 124,98 142,71Change in % -27,99 -6,03 54,90 27,46 14,19 SOURCE : NBR, Department of Foreign Exchange Inspection and Balance of Payments
205
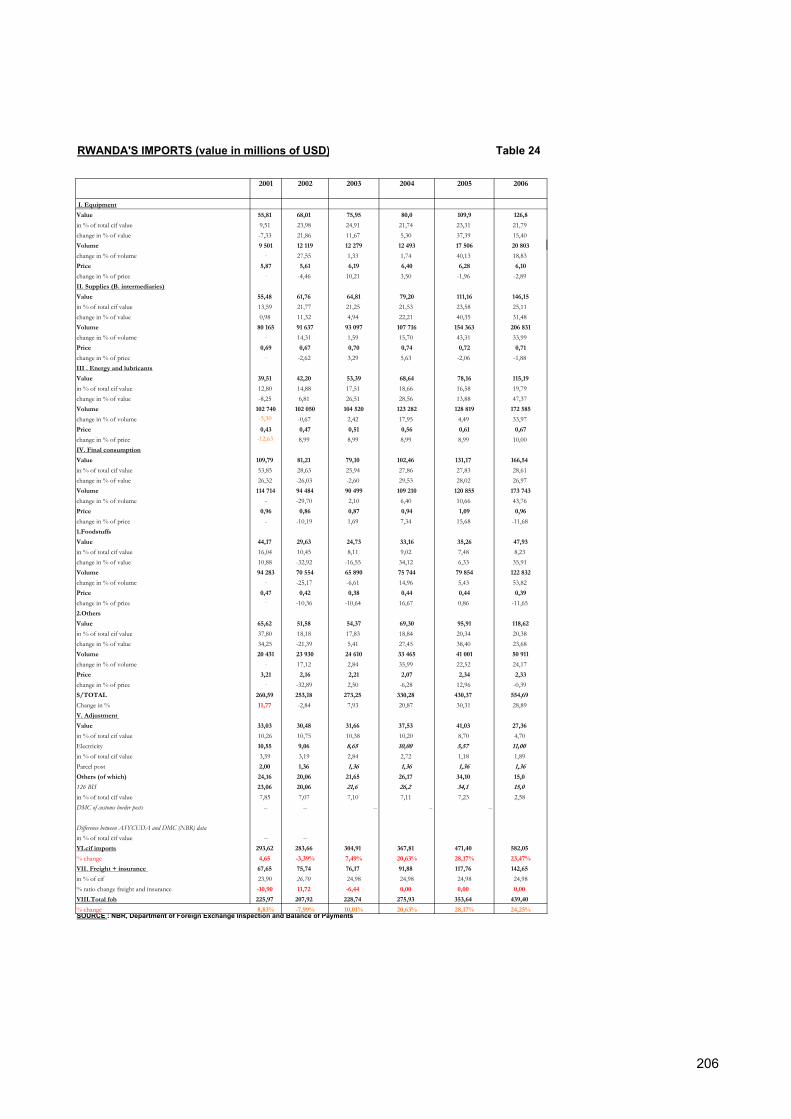
RWANDA'S IMPORTS (value in millions of USD) Table 24
2001 2002 2003 2004 2005 2006
I. Equipment
Value 55,81 68,01 75,95 80,0 109,9 126,8
in % of total cif value 9,51 23,98 24,91 21,74 23,31 21,79change in % of value -7,33 21,86 11,67 5,30 37,39 15,40Volume 9 501 12 119 12 279 12 493 17 506 20 803
change in % of volume - 27,55 1,33 1,74 40,13 18,83Price 5,87 5,61 6,19 6,40 6,28 6,10
change in % of price - -4,46 10,21 3,50 -1,96 -2,89II. Supplies (B. intermediaries)
Value 55,48 61,76 64,81 79,20 111,16 146,15
in % of total cif value 13,59 21,77 21,25 21,53 23,58 25,11change in % of value 0,98 11,32 4,94 22,21 40,35 31,48Volume 80 165 91 637 93 097 107 716 154 363 206 831
change in % of volume - 14,31 1,59 15,70 43,31 33,99Price 0,69 0,67 0,70 0,74 0,72 0,71
change in % of price - -2,62 3,29 5,63 -2,06 -1,88III . Energy and lubricants
Value 39,51 42,20 53,39 68,64 78,16 115,19
in % of total cif value 12,80 14,88 17,51 18,66 16,58 19,79change in % of value -8,25 6,81 26,51 28,56 13,88 47,37Volume 102 740 102 050 104 520 123 282 128 819 172 585
change in % of volume -5,30 -0,67 2,42 17,95 4,49 33,97Price 0,43 0,47 0,51 0,56 0,61 0,67
change in % of price -12,63 8,99 8,99 8,99 8,99 10,00IV. Final consumption
Value 109,79 81,21 79,10 102,46 131,17 166,54
in % of total cif value 53,85 28,63 25,94 27,86 27,83 28,61change in % of value 26,32 -26,03 -2,60 29,53 28,02 26,97Volume 114 714 94 484 90 499 109 210 120 855 173 743
change in % of volume - -29,70 2,10 6,40 10,66 43,76Price 0,96 0,86 0,87 0,94 1,09 0,96
change in % of price - -10,19 1,69 7,34 15,68 -11,681.Foodstuffs
Value 44,17 29,63 24,73 33,16 35,26 47,93
in % of total cif value 16,04 10,45 8,11 9,02 7,48 8,23change in % of value 10,88 -32,92 -16,55 34,12 6,33 35,91Volume 94 283 70 554 65 890 75 744 79 854 122 832
change in % of volume - -25,17 -6,61 14,96 5,43 53,82Price 0,47 0,42 0,38 0,44 0,44 0,39
change in % of price - -10,36 -10,64 16,67 0,86 -11,652.Others
Value 65,62 51,58 54,37 69,30 95,91 118,62
in % of total cif value 37,80 18,18 17,83 18,84 20,34 20,38change in % of value 34,25 -21,39 5,41 27,45 38,40 23,68Volume 20 431 23 930 24 610 33 465 41 001 50 911
change in % of volume - 17,12 2,84 35,99 22,52 24,17Price 3,21 2,16 2,21 2,07 2,34 2,33
change in % of price - -32,89 2,50 -6,28 12,96 -0,39S/TOTAL 260,59 253,18 273,25 330,28 430,37 554,69
Change in % 11,77 -2,84 7,93 20,87 30,31 28,89V. Adjustment
Value 33,03 30,48 31,66 37,53 41,03 27,36
in % of total cif value 10,26 10,75 10,38 10,20 8,70 4,70Electricity 10,55 9,06 8,65 10,00 5,57 11,00
in % of total cif value 3,59 3,19 2,84 2,72 1,18 1,89Parcel post 2,00 1,36 1,36 1,36 1,36 1,36
Others (of which) 24,16 20,06 21,65 26,17 34,10 15,0
126 BIS 23,06 20,06 21,6 26,2 34,1 15,0
in % of total cif value 7,85 7,07 7,10 7,11 7,23 2,58DMC of customs border posts -- -- -- -- --
Difference between ASYCUDA and DMC (NBR) datain % of total cif value -- --VI.cif imports 293,62 283,66 304,91 367,81 471,40 582,05
% change 4,65 -3,39% 7,49% 20,63% 28,17% 23,47%
VII. Freight + insurance 67,65 75,74 76,17 91,88 117,76 142,65
in % of cif 23,90 26,70 24,98 24,98 24,98 24,98% ratio change freight and insurance -10,90 11,72 -6,44 0,00 0,00 0,00
VIII.Total fob 225,97 207,92 228,74 275,93 353,64 439,40
% change 8,83% -7,99% 10,01% 20,63% 28,17% 24,25%SOURCE : NBR, Department of Foreign Exchange Inspection and Balance of Payments
206
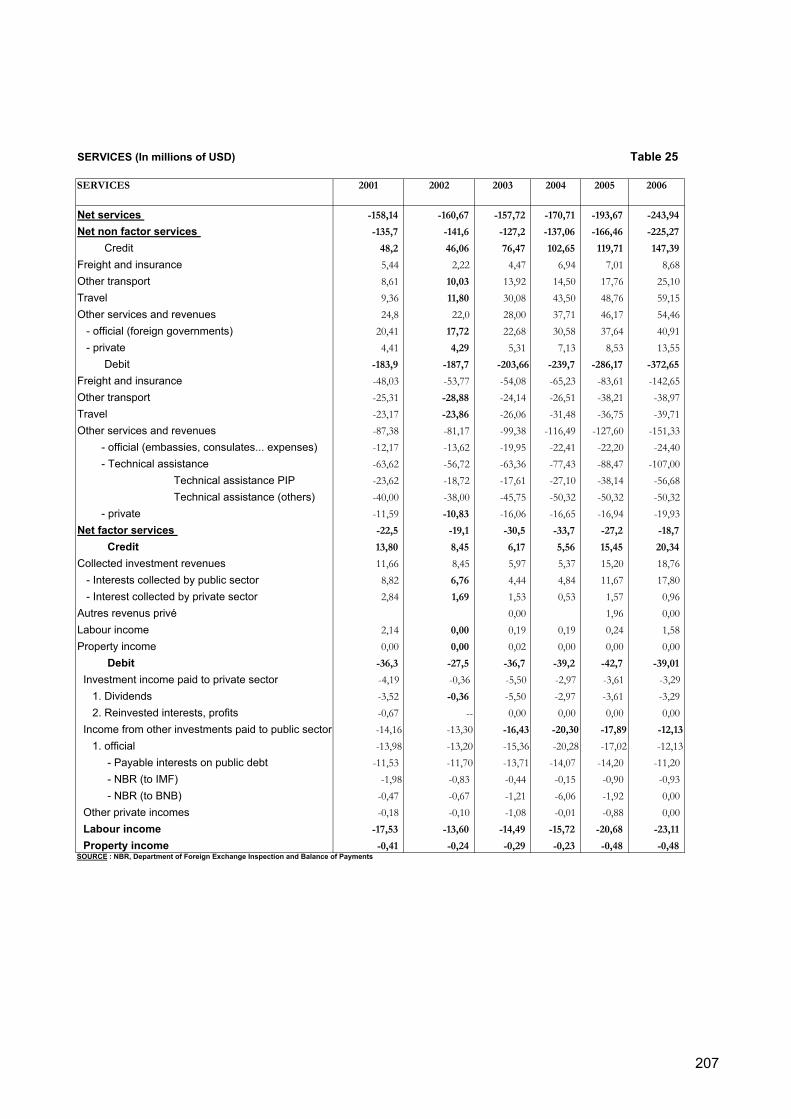
SERVICES (In millions of USD) Table 25
SERVICES 2001 2002 2003 2004 2005 2006
Net services -158,14 -160,67 -157,72 -170,71 -193,67 -243,94
Net non factor services -135,7 -141,6 -127,2 -137,06 -166,46 -225,27
Credit 48,2 46,06 76,47 102,65 119,71 147,39
Freight and insurance 5,44 2,22 4,47 6,94 7,01 8,68Other transport 8,61 10,03 13,92 14,50 17,76 25,10Travel 9,36 11,80 30,08 43,50 48,76 59,15Other services and revenues 24,8 22,0 28,00 37,71 46,17 54,46 - official (foreign governments) 20,41 17,72 22,68 30,58 37,64 40,91 - private 4,41 4,29 5,31 7,13 8,53 13,55 Debit -183,9 -187,7 -203,66 -239,7 -286,17 -372,65
Freight and insurance -48,03 -53,77 -54,08 -65,23 -83,61 -142,65Other transport -25,31 -28,88 -24,14 -26,51 -38,21 -38,97Travel -23,17 -23,86 -26,06 -31,48 -36,75 -39,71Other services and revenues -87,38 -81,17 -99,38 -116,49 -127,60 -151,33 - official (embassies, consulates... expenses) -12,17 -13,62 -19,95 -22,41 -22,20 -24,40 - Technical assistance -63,62 -56,72 -63,36 -77,43 -88,47 -107,00 Technical assistance PIP -23,62 -18,72 -17,61 -27,10 -38,14 -56,68 Technical assistance (others) -40,00 -38,00 -45,75 -50,32 -50,32 -50,32 - private -11,59 -10,83 -16,06 -16,65 -16,94 -19,93Net factor services -22,5 -19,1 -30,5 -33,7 -27,2 -18,7
Credit 13,80 8,45 6,17 5,56 15,45 20,34
Collected investment revenues 11,66 8,45 5,97 5,37 15,20 18,76 - Interests collected by public sector 8,82 6,76 4,44 4,84 11,67 17,80 - Interest collected by private sector 2,84 1,69 1,53 0,53 1,57 0,96Autres revenus privé 0,00 1,96 0,00Labour income 2,14 0,00 0,19 0,19 0,24 1,58Property income 0,00 0,00 0,02 0,00 0,00 0,00 Debit -36,3 -27,5 -36,7 -39,2 -42,7 -39,01
Investment income paid to private sector -4,19 -0,36 -5,50 -2,97 -3,61 -3,29 1. Dividends -3,52 -0,36 -5,50 -2,97 -3,61 -3,29 2. Reinvested interests, profits -0,67 -- 0,00 0,00 0,00 0,00 Income from other investments paid to public sector -14,16 -13,30 -16,43 -20,30 -17,89 -12,13
1. official -13,98 -13,20 -15,36 -20,28 -17,02 -12,13 - Payable interests on public debt -11,53 -11,70 -13,71 -14,07 -14,20 -11,20 - NBR (to IMF) -1,98 -0,83 -0,44 -0,15 -0,90 -0,93 - NBR (to BNB) -0,47 -0,67 -1,21 -6,06 -1,92 0,00 Other private incomes -0,18 -0,10 -1,08 -0,01 -0,88 0,00 Labour income -17,53 -13,60 -14,49 -15,72 -20,68 -23,11
Property income -0,41 -0,24 -0,29 -0,23 -0,48 -0,48SOURCE : NBR, Department of Foreign Exchange Inspection and Balance of Payments
207
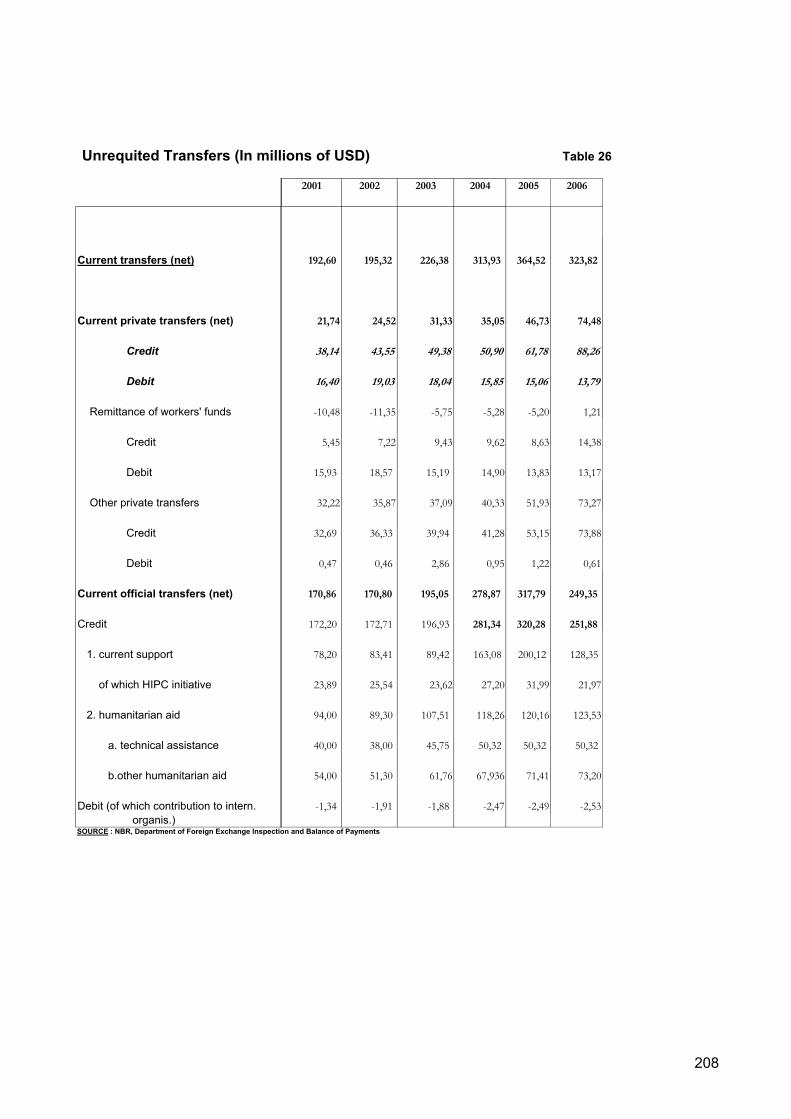
Unrequited Transfers (In millions of USD) Table 26
2001 2002 2003 2004 2005 2006
Current transfers (net) 192,60 195,32 226,38 313,93 364,52 323,82
Current private transfers (net) 21,74 24,52 31,33 35,05 46,73 74,48
Credit 38,14 43,55 49,38 50,90 61,78 88,26
Debit 16,40 19,03 18,04 15,85 15,06 13,79
Remittance of workers' funds -10,48 -11,35 -5,75 -5,28 -5,20 1,21
Credit 5,45 7,22 9,43 9,62 8,63 14,38
Debit 15,93 18,57 15,19 14,90 13,83 13,17
Other private transfers 32,22 35,87 37,09 40,33 51,93 73,27
Credit 32,69 36,33 39,94 41,28 53,15 73,88
Debit 0,47 0,46 2,86 0,95 1,22 0,61
Current official transfers (net) 170,86 170,80 195,05 278,87 317,79 249,35
Credit 172,20 172,71 196,93 281,34 320,28 251,88
1. current support 78,20 83,41 89,42 163,08 200,12 128,35
of which HIPC initiative 23,89 25,54 23,62 27,20 31,99 21,97
2. humanitarian aid 94,00 89,30 107,51 118,26 120,16 123,53
a. technical assistance 40,00 38,00 45,75 50,32 50,32 50,32
b.other humanitarian aid 54,00 51,30 61,76 67,936 71,41 73,20
Debit (of which contribution to intern. -1,34 -1,91 -1,88 -2,47 -2,49 -2,53 organis.)SOURCE : NBR, Department of Foreign Exchange Inspection and Balance of Payments
208

Capital and financial transactions account (In millions of USD) Table 27
2001 2002 2003 2004 2005 2006
Capital and financial transactions account 146,72 110,86 71,32 134,95 82,48 291,31
Capital account 68,70 41,70 41,09 60,56 0,00 1400,08
Capital transfers 68,70 41,70 41,09 60,56 0,00 1400,08
Debt cancellation (arrears+current service +debt not yet due) 18,50 0,00 0,00 0,00 0,00 1 226,60
a. Arrears (principal+interests) 4,50 0,00 0,00
b. Current service (principal + interests) 1,80 0,00 0,00 0,70 0,00
c. Debt not yet due (principal) 12,20 0,00 0,00 1226,60
Migrants' transfers
Other capital transfers (support grants to PIP) 50,20 41,70 41,09 60,56 93,47 173,48
a. Capital (projects) 36,10 31,28 30,81 45,42 70,10 130,11
b. Technical assistance 12,55 10,43 10,27 15,14 23,37 43,37
Acquisitions and assignments of non financial assets Financial transactions account 78,02 69,16 30,23 74,39 82,48 -1108,77
Long term capital 61,64 55,70 11,33 69,31 49,12 -1110,43
I. Official (net) 57,09 53,10 7,71 71,31 53,68 -1104,83
Credit 107,39 83,90 39,91 108,61 89,98 68,07
Current support 36,83 50,73 10,54 60,75 30,88 14,83
Project support (PIP) 44,26 33,17 29,37 47,86 59,10 53,24
- capital 33,20 24,88 22,03 35,89 44,33 39,93
- technical assistance 11,07 8,29 7,34 11,96 14,78 13,31 Drawings on new loans 26,30 0,00 0,00 0,00 0,00 a. Rescheduling of debt due 2,10 0,00 0,00 0,00 0,00 b. Rescheduling of arrears 12,70 0,00 0,00
c. Rescheduling of debt not yet due 11,50 0,00 0,00
Debit -50,30 -30,80 -32,20 -37,30 -36,30 -1172,90
Repayment of loans -22,90 -30,80 -32,20 -37,30 -36,30 -22,90
of which a. Cancelled due principal 1,60 0,00 0,00
b. Rescheduled due principal 2,07 0,00 0,00
Resch. Principal not yet due -13,60 0,00 0,00
Cancelled principal not yet due -13,80 0,00 0,00
Capital subscr. of non monetary intern. org. 0,00 0,00 0,00 0,00 0,00
-1150,0
II. Private (net) 4,55 2,60 3,61 -2,00 -4,56 -5,61
Borrowings 7,67 3,67 5,59 1,42 0,69 0,4
Repayment of loans -3,12 -1,07 -1,98 -3,42 -5,25 -6,0
Others
Other capital 16,38 13,46 18,91 5,08 33,36 1,67
I.Short term capital 12,62 10,85 14,25 -2,58 22,86 -15,13
a. trade credits 3,83 5,87 5,36 5,36 8,50 4,3
b. change of for. assets of commercial banks (-incr.) 4,85 1,40 6,42 -7,94 14,36 -19,38
c. others 3,94 3,58 2,47 0,00 0,00
II.Investments 3,76 2,61 4,66 7,66 10,50 16,80
a. direct investments 3,76 2,61 4,66 7,66 10,50 16,80
b. portfolio investments 0,00 0,00 0,00 0,00 0,00 0,00Source : BNR, Département de l'Inspection du Change et de la Balance des Paiements
209

AVAILABLE FINANCING (In millions of USD) Table 28
2002 2003 2004 2005 2006
Available financing (- increase) -12,8 35,7 -107,9 -119,2 -80,1
Change of net foreign assets of NBR -29,6 27,2 -106,8 -120,2 -80,1
a.Net credit to IMF (purchases-repurchases) -6,0 -0,9 -3,6 -6,7 2,5
1. purchases 0,7 0,8 1,7 1,7 2,5
2. repurchases -6,7 -1,7 -5,3 -8,4 0,00
b.Changes of other gross official reserves of NBR (- incr..) -31,6 28,8 -100,3 -93,5 -33,81
c.Change of other gross foreign liabilities (+ incr.) 7,9 -0,7 -2,9 -20,0 -48,84
Change of arrears 5,6 -16,2 -3,5 1,1 0,0
Accumulation 6,6 6,0 1,8 1,1 0,0
Reduction (Kuwait Fund and other bilateral donors) -1,0 -22,2 -5,3 0,0 0,0
: other bilateral donors 0,0 -2,2 0,0 0,0 0,0
Exceptional financing 11,2 24,7 2,4 0,0 0,0
Rescheduling 10,6 22,2 2,4 0,0 0,0
arrears (Kuwait Fund) 0,0 20,0 0,0 0,0 0,0
of which OPEC 0,0 0,0 0,0 0,0
SFD 0,0 0,0 0,0 0,0
current service (bilateral:Paris club and Kuwait Fund): 5,3 2,3 2,4 0,0 0,0
current service OPEC 5,3 0,0 2,4 0,0 0,0
Debt cancellation 0,6 2,5 0,0 0,0 0,0
arrears (bilateral donors) 0,6 2,0 0,0 0,0 0,0
current service (bilateral donors) 0,0 0,5 0,0 0,0 0,0
-
SOURCE : NBR, Department of Foreign Exchange Inspection and Balance of Payments
210