nbfc company comparables & valuation_v1
DESCRIPTION
hiiTRANSCRIPT
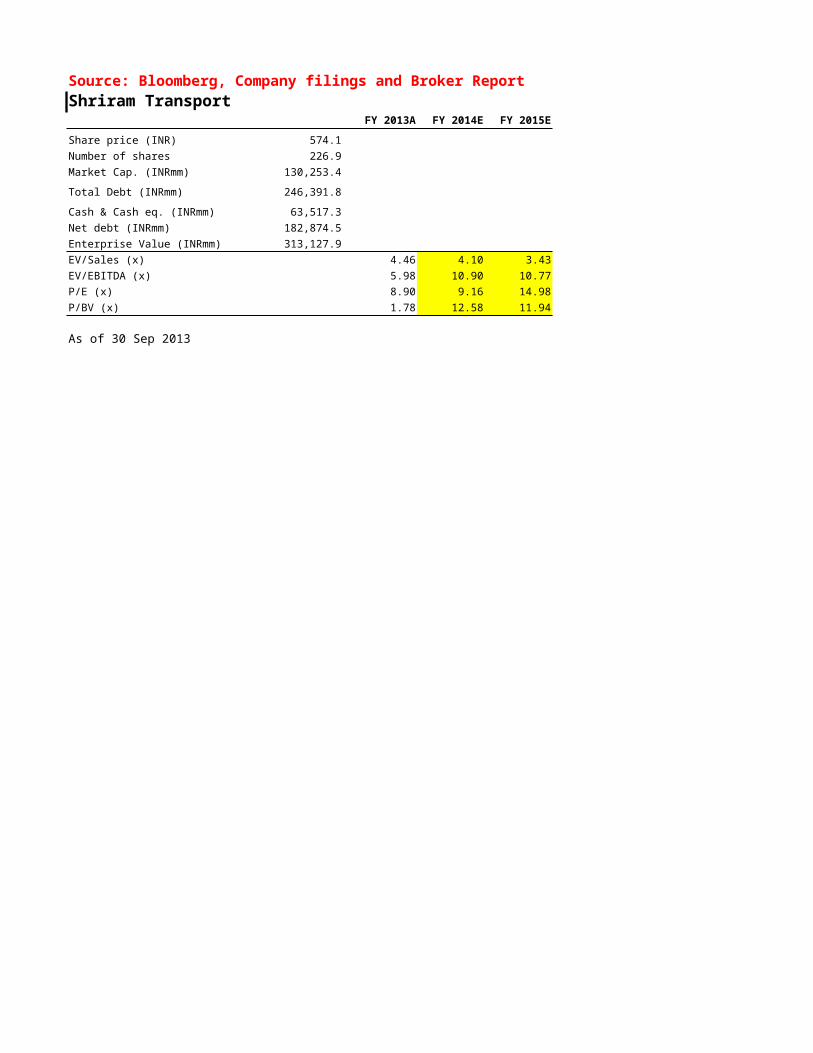
Source: Bloomberg, Company filings and Broker ReportShriram Transport M&M Financial
FY 2013A FY 2014E FY 2015E
Share price (INR) 574.1 Share price (INR)
Number of shares 226.9 Number of shares
Market Cap. (INRmm) 130,253.4 Market Cap. (INRmm)
Total Debt (INRmm) 246,391.8 Total Debt (INRmm)
Cash & Cash eq. (INRmm) 63,517.3 Cash & Cash eq. (INRmm)
Net debt (INRmm) 182,874.5 Net debt (INRmm)
Enterprise Value (INRmm) 313,127.9 Enterprise Value (INRmm)
EV/Sales (x) 4.46 4.10 3.43 EV/Sales (x)
EV/EBITDA (x) 5.98 10.90 10.77 EV/EBITDA (x)
P/E (x) 8.90 9.16 14.98 P/E (x)
P/BV (x) 1.78 12.58 11.94 P/BV (x)
As of 30 Sep 2013 As of 30 Sep 2013

Sundaram FinanceFY 2013A FY 2014E FY 2015E FY 2013A
257.4 Share price (INR) 503.8
568.8 Number of shares 111.1
146,371.7 Market Cap. (INRmm) 55,974.1
191,011.6 Total Debt (INRmm) 91,889.8
3,362.3 Cash & Cash eq. (INRmm) 4,708.6
187,649.3 Net debt (INRmm) 87,181.1
334,325.4 Enterprise Value (INRmm) 145,935.7
8.16 1.97 1.97 EV/Sales (x) 7.07
11.15 10.90 10.77 EV/EBITDA (x) 8.65
14.94 15.50 14.98 P/E (x) 13.65
3.20 12.58 11.94 P/BV (x) 2.68
As of 30 Sep 2013

CholamandalamFY 2014E FY 2015E FY 2013A FY 2014E FY 2015E
Share price (INR) 219.1
Number of shares 143.2
Market Cap. (INRmm) 31,365.3
Total Debt (INRmm) 184,257.1
Cash & Cash eq. (INRmm) 10,023.5
Net debt (INRmm) 174,233.6
Enterprise Value (INRmm) 205,598.9
1.97 1.97 EV/Sales (x) 8.01 1.97 1.97
10.90 10.77 EV/EBITDA (x) 10.94 10.90 10.77
15.50 14.98 P/E (x) 9.56 15.50 14.98
12.58 11.94 P/BV (x) 1.61 12.58 11.94
As of 30 Sep 2013

Shriram CityFY 2013A FY 2014E FY 2015E
Share price (INR) 1,066.2
Number of shares 59.3
Market Cap. (INRmm) 63,201.2
Total Debt (INRmm) 87,011.7
Cash & Cash eq. (INRmm) 2,740.3
Net debt (INRmm) 84,271.4
Enterprise Value (INRmm) 147,472.6
EV/Sales (x) 4.80 1.97 1.97
EV/EBITDA (x) 7.02 10.90 10.77
P/E (x) 12.85 15.50 14.98
P/BV (x) 2.37 12.58 11.94
As of 30 Sep 2013

Bajaj Finance SREI InfrastructureFY 2013A FY 2014E FY 2015E
Share price (INR) 1,172.0 Share price (INR)
Number of shares 49.8 Number of shares
Market Cap. (INRmm) 58,340.2 Market Cap. (INRmm)
Total Debt (INRmm) 129,430.4 Total Debt (INRmm)
Cash & Cash eq. (INRmm) 1,114.8 Cash & Cash eq. (INRmm)
Net debt (INRmm) 128,315.6 Net debt (INRmm)
Enterprise Value (INRmm) 186,655.8 Enterprise Value (INRmm)
EV/Sales (x) 6.03 1.97 1.97 EV/Sales (x)
EV/EBITDA (x) 8.92 10.90 10.77 EV/EBITDA (x)
P/E (x) 8.70 15.50 14.98 P/E (x)
P/BV (x) 1.73 12.58 11.94 P/BV (x)
As of 30 Sep 2013 As of 30 Sep 2013

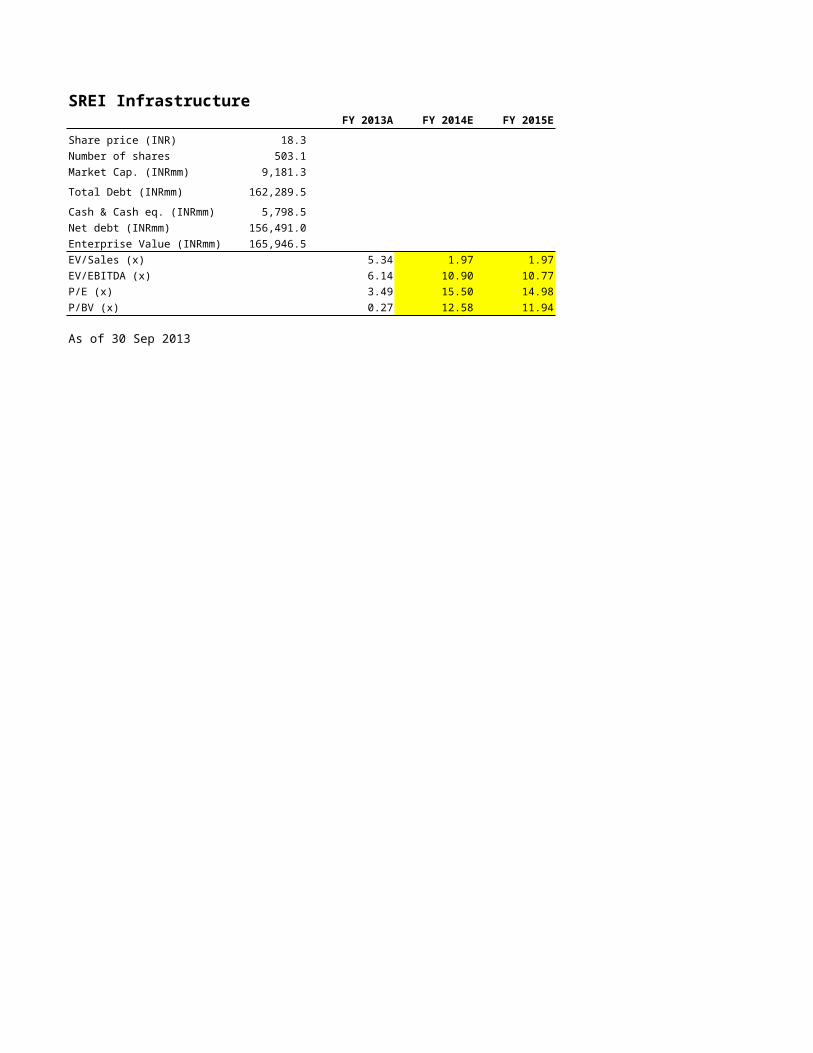
SREI Infrastructure Manappuram FinFY 2013A FY 2014E FY 2015E FY 2013A
18.3 Share price (INR) 14.7
503.1 Number of shares 841.2
9,181.3 Market Cap. (INRmm) 12,323.7
162,289.5 Total Debt (INRmm) 81,864.2
5,798.5 Cash & Cash eq. (INRmm) 8,836.1
156,491.0 Net debt (INRmm) 73,028.2
165,946.5 Enterprise Value (INRmm) 85,626.0
5.34 1.97 1.97 EV/Sales (x) 3.78
6.14 10.90 10.77 EV/EBITDA (x) 5.50
3.49 15.50 14.98 P/E (x) 5.91
0.27 12.58 11.94 P/BV (x) 0.50
As of 30 Sep 2013
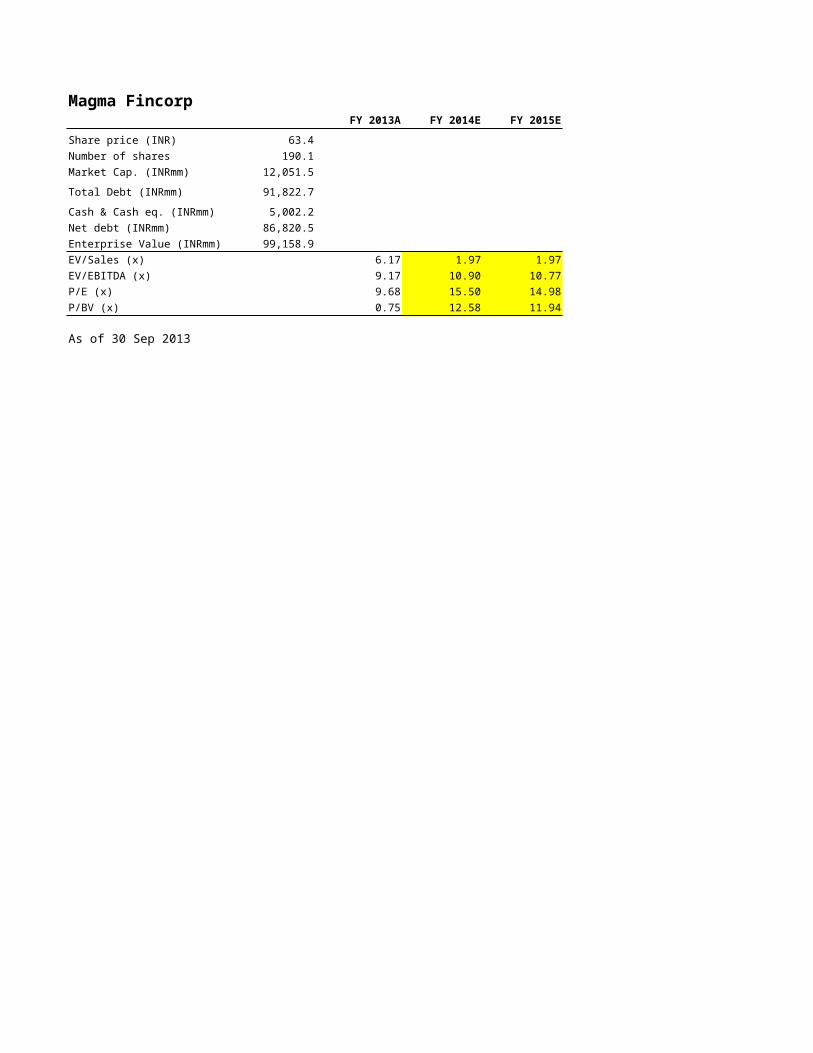
Magma FincorpFY 2014E FY 2015E FY 2013A FY 2014E FY 2015E
Share price (INR) 63.4
Number of shares 190.1
Market Cap. (INRmm) 12,051.5
Total Debt (INRmm) 91,822.7
Cash & Cash eq. (INRmm) 5,002.2
Net debt (INRmm) 86,820.5
Enterprise Value (INRmm) 99,158.9
1.97 1.97 EV/Sales (x) 6.17 1.97 1.97
10.90 10.77 EV/EBITDA (x) 9.17 10.90 10.77
15.50 14.98 P/E (x) 9.68 15.50 14.98
12.58 11.94 P/BV (x) 0.75 12.58 11.94
As of 30 Sep 2013

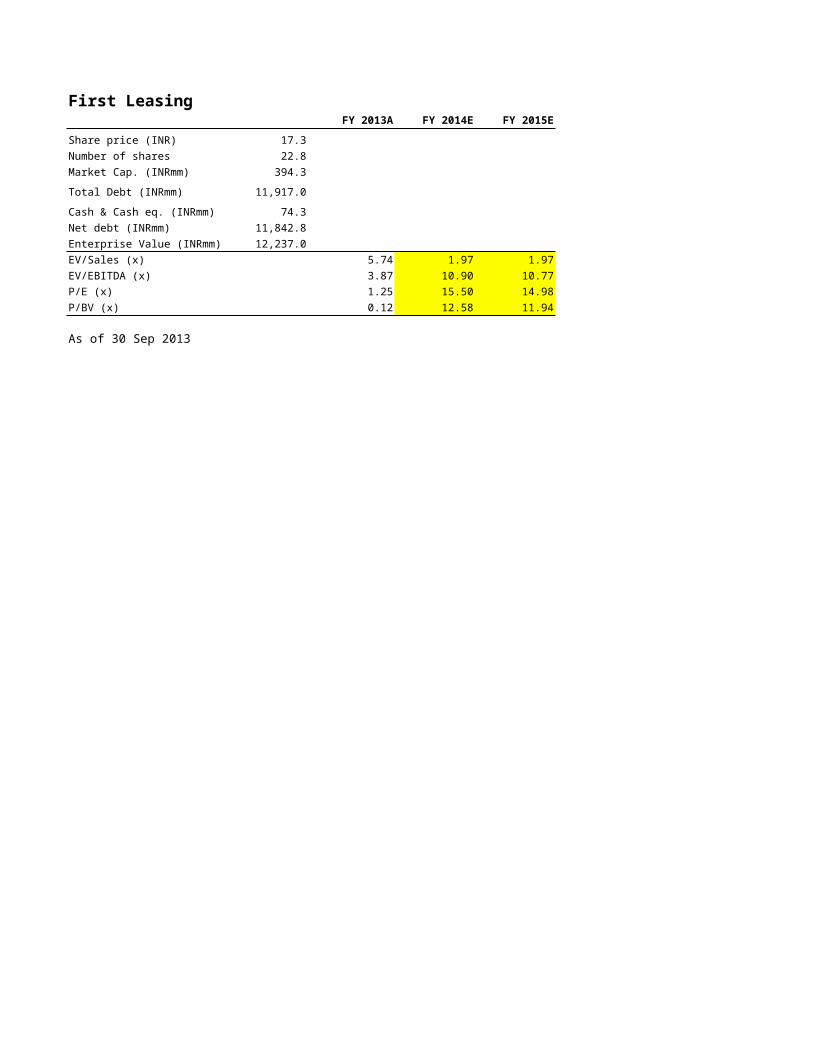
First LeasingFY 2013A FY 2014E FY 2015E
Share price (INR) 17.3
Number of shares 22.8
Market Cap. (INRmm) 394.3
Total Debt (INRmm) 11,917.0
Cash & Cash eq. (INRmm) 74.3
Net debt (INRmm) 11,842.8
Enterprise Value (INRmm) 12,237.0
EV/Sales (x) 5.74 1.97 1.97
EV/EBITDA (x) 3.87 10.90 10.77
P/E (x) 1.25 15.50 14.98
P/BV (x) 0.12 12.58 11.94
As of 30 Sep 2013
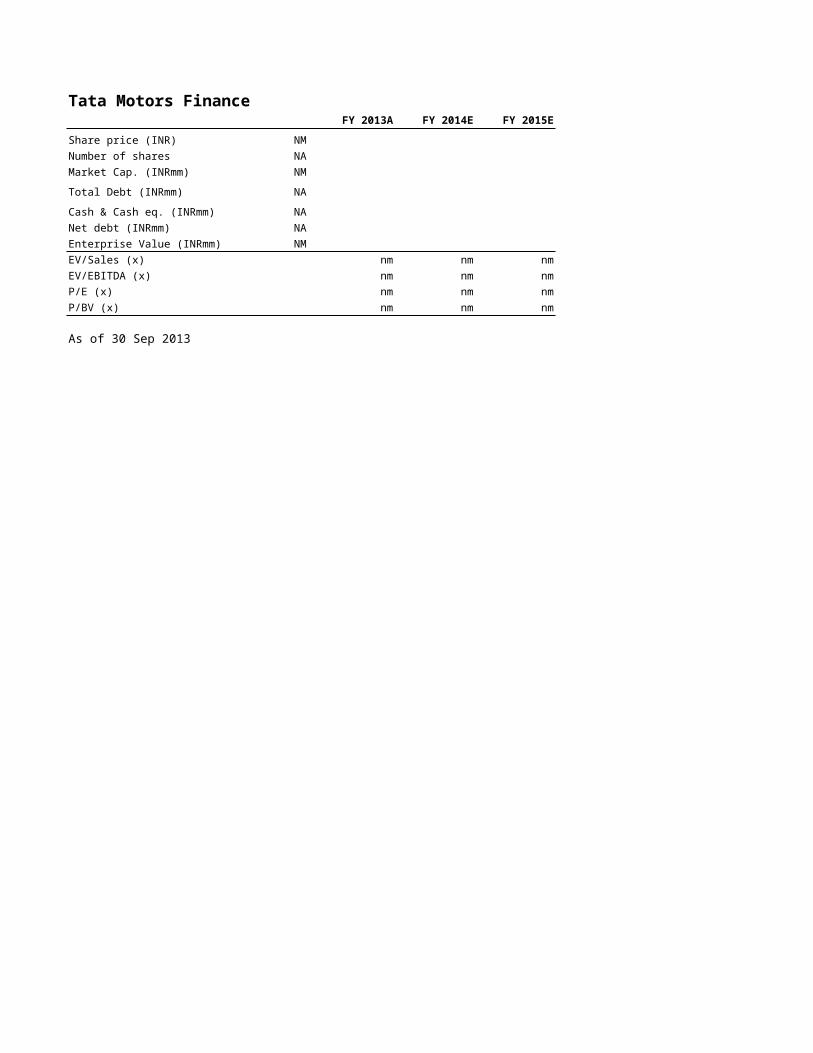
Religare Finvest Tata Motors FinanceFY 2013A FY 2014E FY 2015E
Share price (INR) NM Share price (INR)
Number of shares 173.3 Number of shares
Market Cap. (INRmm) NM Market Cap. (INRmm)
Total Debt (INRmm) 713.7 Total Debt (INRmm)
Cash & Cash eq. (INRmm) 56.7 Cash & Cash eq. (INRmm)
Net debt (INRmm) 657.0 Net debt (INRmm)
Enterprise Value (INRmm) NM Enterprise Value (INRmm)
EV/Sales (x) nm nm nm EV/Sales (x)
EV/EBITDA (x) nm nm nm EV/EBITDA (x)
P/E (x) nm nm nm P/E (x)
P/BV (x) nm nm nm P/BV (x)
As of 30 Sep 2013 As of 30 Sep 2013
Tata Motors FinanceFY 2013A FY 2014E FY 2015E
NM
NA
NM
NA
NA
NA
NM
nm nm nm
nm nm nm
nm nm nm
nm nm nm

Source: Bloomberg, Company filings and Broker Report
NBFCs Company Comparables
Price Market Cap. Enterprise Val.Company (INR) (INRmm) (INRmm)NBFCs Shriram Transport 574.1 130,253 313,128M&M Financial 257.4 146,372 334,325Sundaram Fin 503.8 55,974 145,936Cholamandalam 219.1 31,365 205,599Shriram City 1066.2 63,201 147,473Bajaj Finance 1172.0 58,340 186,656SREI Infra 18.3 9,181 165,947Mannapuram Fin 14.7 12,324 85,626Magma Fincorp 63.4 12,051 99,159First Leasing 17.3 394 12,237Religare Finvest NM NM NMTata Motors Finance NM NM NMMeanMedian
As of 30 Sep 2013
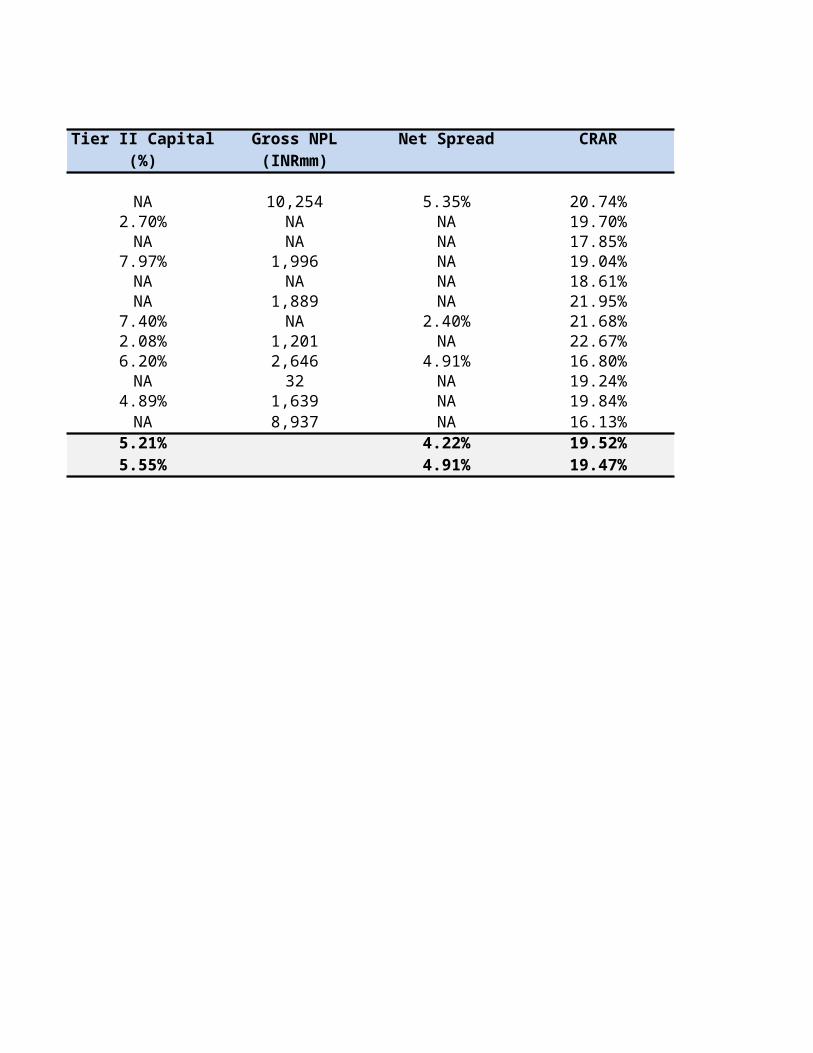
Assets Public Deposits Tier I Capital Tier II Capital Gross NPL(INRmm) (INRmm) (%) (%) (INRmm)
539,057 55,804 NA NA 10,254270,708 22,875 17.00% 2.70% NA158,227 14,684 NA NA NA215,707 5 11.07% 7.97% 1,996155,886 4 NA NA NA203,207 7 NA NA 1,889226,591 4 14.28% 7.40% NA127,278 1 20.59% 2.08% 1,20150,963 0 10.60% 6.20% 2,64617,696 0 NA NA 322,234 0 14.95% 4.89% 1,639
NA NA NA NA 8,93714.75% 5.21%14.62% 5.55%

Net Spread CRAR Ratings Gross NPA to Gross Advance& Outlook FY 2013A
5.35% 20.74% IND AA/Stable 3.20%NA 19.70% IND AA+/Stable 3.00%NA 17.85% IND AA+/Stable 1.04%NA 19.04% IND AA-/Stable 1.05%NA 18.61% IND AA-/Stable 2.19%NA 21.95% NA NA
2.40% 21.68% AA- 2.77%NA 22.67% NA NA
4.91% 16.80% AA+ 1.60%NA 19.24% AA 0.18%NA 19.84% IND AA-/Negative 1.33%NA 16.13% AA-/Positive 4.64%
4.22% 19.52% 2.10%4.91% 19.47% 1.90%

Net NPA to Net Advance Operating ProfitFY 2013A FY 2013A FY 2014E FY 2015E
0.80% 52,1641.00% 29,9270.45% 23,2210.23% 18,6220.81% 20,7620.19% 20,7732.30% 25,0740.77% 14,960
NA 10,6660.12% 1,9870.76% 3152.79% 23,1450.93%0.77%
Net Profit EV/Revenue FY 2013A FY 2014E FY 2015E FY 2013A FY 2014E
14,634 4.46x 4.10x9,270 8.16x 1.97x5,640 7.07x 1.97x3,079 8.01x 1.97x4,494 4.80x 1.97x5,913 6.03x 1.97x2,601 5.34x 1.97x2,084 3.78x 1.97x1,228 6.17x 1.97x316 5.74x 1.97x136 nm nm
4,496 nm nm5.96x 2.18x5.88x 1.97x

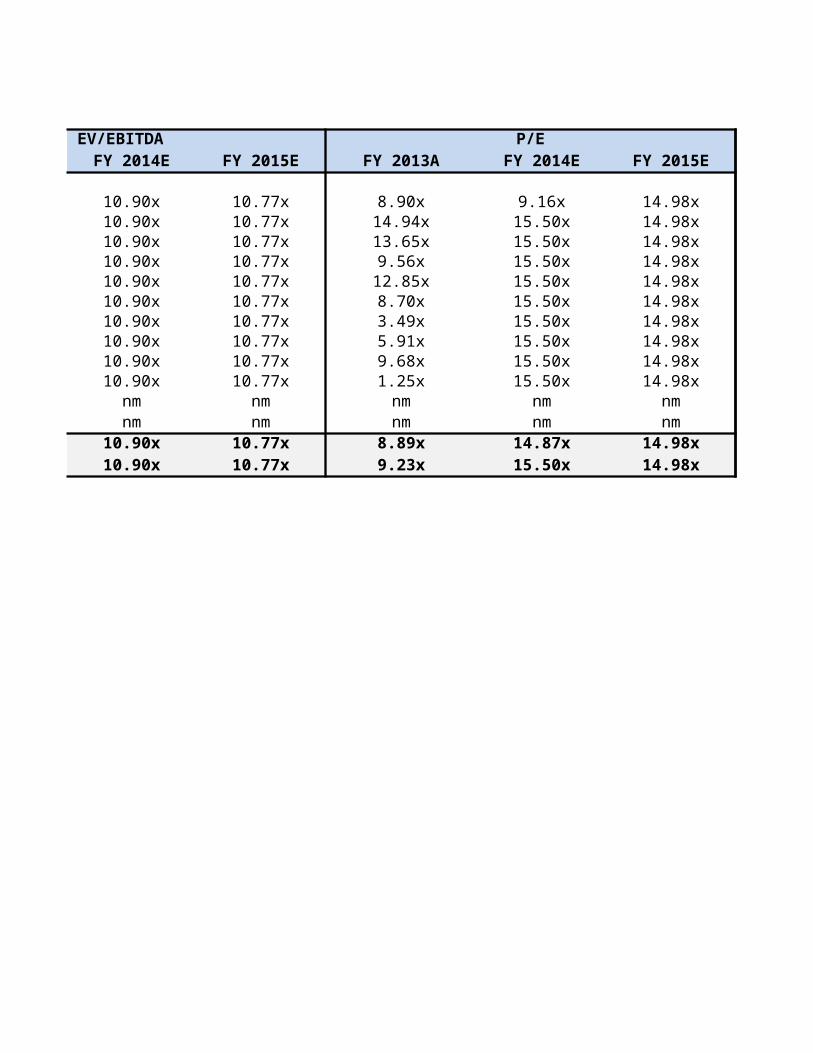
EV/Revenue EV/EBITDA P/EFY 2015E FY 2013A FY 2014E FY 2015E FY 2013A
3.43x 5.98x 10.90x 10.77x 8.90x1.97x 11.15x 10.90x 10.77x 14.94x1.97x 8.65x 10.90x 10.77x 13.65x1.97x 10.94x 10.90x 10.77x 9.56x1.97x 7.02x 10.90x 10.77x 12.85x1.97x 8.92x 10.90x 10.77x 8.70x1.97x 6.14x 10.90x 10.77x 3.49x1.97x 5.50x 10.90x 10.77x 5.91x1.97x 9.17x 10.90x 10.77x 9.68x1.97x 3.87x 10.90x 10.77x 1.25xnm nm nm nm nmnm nm nm nm nm
2.12x 7.73x 10.90x 10.77x 8.89x1.97x 7.83x 10.90x 10.77x 9.23x

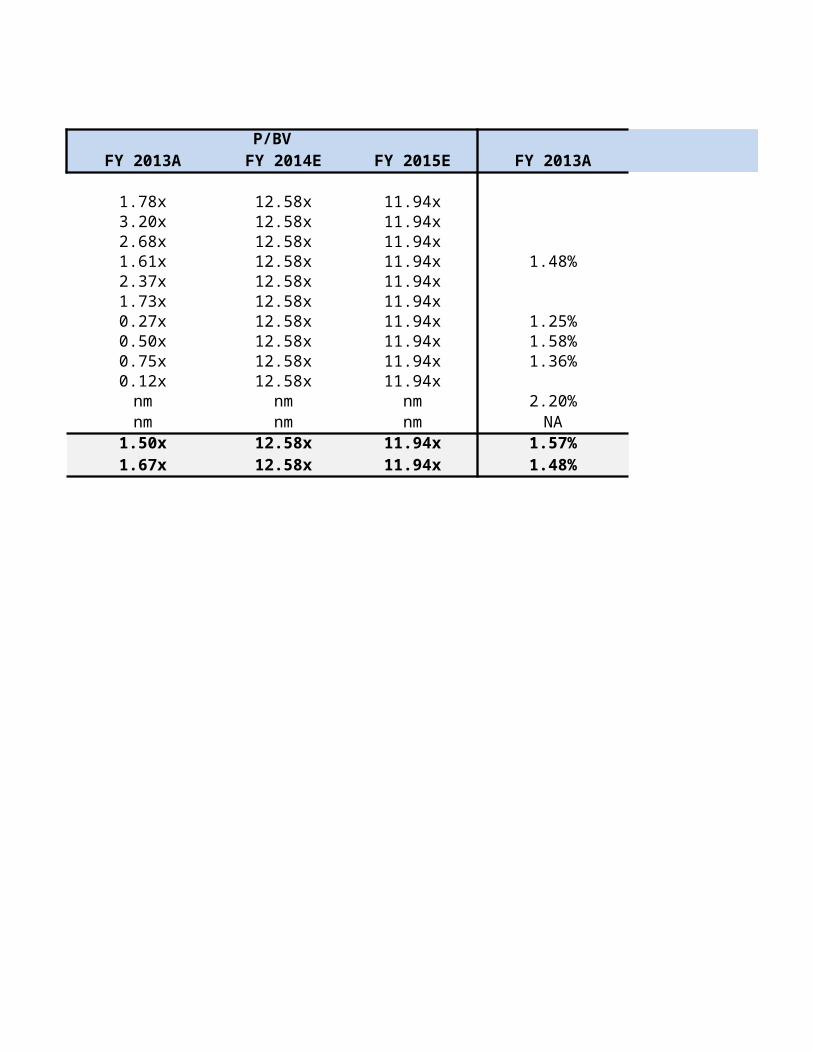
P/E P/BVFY 2014E FY 2015E FY 2013A FY 2014E FY 2015E
9.16x 14.98x 1.78x 12.58x 11.94x15.50x 14.98x 3.20x 12.58x 11.94x15.50x 14.98x 2.68x 12.58x 11.94x15.50x 14.98x 1.61x 12.58x 11.94x15.50x 14.98x 2.37x 12.58x 11.94x15.50x 14.98x 1.73x 12.58x 11.94x15.50x 14.98x 0.27x 12.58x 11.94x15.50x 14.98x 0.50x 12.58x 11.94x15.50x 14.98x 0.75x 12.58x 11.94x15.50x 14.98x 0.12x 12.58x 11.94x
nm nm nm nm nmnm nm nm nm nm
14.87x 14.98x 1.50x 12.58x 11.94x15.50x 14.98x 1.67x 12.58x 11.94x

RoA RoEFY 2013A FY 2014E FY 2015E FY 2013A FY 2014E
23.90%
1.48% 18.13%
1.25% 10.07%1.58% 7.91%1.36% 9.97%
2.20% 13.40%NA 1.63%
1.57% #DIV/0! #DIV/0! 12.14% #DIV/0!1.48% #VALUE! #VALUE! 10.07% #VALUE!

RoE Sector wise comparisonFY 2015E Commercial Vehicles Construction Equipments
Yes YesYes YesYes YesYes NoYes NoYes YesNo YesNo NoYes YesNo NoNo NoYes No
#DIV/0!#VALUE!
Sector wise comparisonAgricultural equipments Loans/Insurance/Mutual Funds
No NoNo YesNo YesNo YesNo YesNo YesNo YesNo YesYes YesNo YesNo YesNo No
Sector wise comparisonSME, Small Business Loan Property, Housing etc
No NoYes YesNo YesNo YesYes YesYes NoNo NoNo NoYes YesNo NoYes NoNo No

Shriram Transport
http://www.bloomberg.com/news/2013-02-21/tpg-said-to-sell-shriram-transport-stake-for-about-303-million.htmlhttp://www.livemint.com/Companies/RxVScRbk37yFcaGSyoQImL/TPG-raises-305-million-from-Shriram-Transport-share-sale-s.html
Transaction Date 22-Feb-13Stake Sold 10.0%Transaction value (INR mm) 16,620.0
Company valuation (INR mm) 166,200.0

http://www.bloomberg.com/news/2013-02-21/tpg-said-to-sell-shriram-transport-stake-for-about-303-million.htmlhttp://www.livemint.com/Companies/RxVScRbk37yFcaGSyoQImL/TPG-raises-305-million-from-Shriram-Transport-share-sale-s.html