nber working paper series thinking, fast and slow? … · pratt, julia quinn, kelsey reid,...
TRANSCRIPT
NBER WORKING PAPER SERIES
THINKING, FAST AND SLOW? SOME FIELD EXPERIMENTS TO REDUCE CRIME AND DROPOUT IN CHICAGO
Sara B. Heller Anuj K. Shah
Jonathan Guryan Jens Ludwig
Sendhil Mullainathan Harold A. Pollack
Working Paper 21178 http://www.nber.org/papers/w21178
NATIONAL BUREAU OF ECONOMIC RESEARCH 1050 Massachusetts Avenue
Cambridge, MA 02138 May 2015
The title is, of course, a reference to the 2011 book by Daniel Kahneman, Thinking, Fast and Slow. This project was supported by the University of Chicago’s Office of the Provost, Center for Health Administration Studies, and School of Social Service Administration, the city of Chicago, the Chicago Public Schools, the Illinois Criminal Justice Information Authority, the Eunice Kennedy Shriver National Institute of Child Health and Human Development of the National Institutes of Health (R21-HD061757 and P01-HD076816), CDC grant 5U01CE001949- 02 to the University of Chicago Center for Youth Violence Prevention, Office of Juvenile Justice and Delinquency Prevention of the U.S. Department of Justice (2012-JU-FX-0019), and grants from the Laura and John Arnold Foundation, the Chicago Community Trust, the Edna McConnell Clark Foundation, the Crown Family, the Exelon corporation, the Joyce Foundation, J-PAL, the Reva and David Logan Foundation, the John D. and Catherine T. MacArthur Foundation, the McCormick Foundation, the Polk Bros Foundation, the Smith Richardson Foundation, the Spencer Foundation, the University of Chicago Women’s Board, a pre-doctoral fellowship to Heller from the U.S. Department of Education’s Institute for Education Sciences, and visiting scholar awards to Ludwig from the Russell Sage Foundation and LIEPP at Sciences Po. For making this work possible we are grateful to the staff of Youth
Guidance, World Sport Chicago, the Chicago Public Schools, and the Cook County Juvenile Temporary Detention Center, and to Ellen Alberding, Roseanna Ander, Mayor Richard M. Daley, Anthony Ramirez- DiVittorio, Earl Dunlap, Mayor Rahm Emanuel, Wendy Fine, Hon. Curtis Heaston, Michelle Morrison, Dave Roush, and Robert Tracy. For helpful comments we thank Larry Katz, Andrei Shleifer, four anonymous referees, Stefano DellaVigna, Dan Gilbert, John Rickford, and seminar participants at Case Western, Columbia, Duke, Erasmus, Harvard, MDRC, Notre Dame, Northwestern, Sciences Po, Stanford, University of Chicago, University of Miami, University of Michigan, University of Pennsylvania, University of Toronto, University of Virginia, University of Wisconsin, Yale, the MacArthur Foundation, NBER, New York City Department of Probation, and the joint New York Federal Reserve / NYU education workshop. For help accessing administrative data we thank the Chicago Public Schools, the Chicago Police Department, and ICJIA, for providing Illinois Criminal History Record Information through an agreement with the Illinois State Police. For invaluable help with monitoring, data collection, and analysis we thank Nour Abdul-Razzak, Sam Canas, Brice Cooke, Stephen Coussens, Gretchen Cusick, Jonathan Davis, Nathan Hess, Anindya Kundu, Heather Sophia Lee, Duff Morton, Kyle Pratt, Julia Quinn, Kelsey Reid, Catherine Schwarz, David Showalter, Maitreyi Sistla, Matthew Veldman, Robert Webber, David Welgus, John Wolf, and Sabrina Yusuf. The findings and opinions expressed here are those of the authors and do not necessarily reflect those of the Department of Justice, National Institutes of Health, the Centers for Disease Control, any other funder or data provider, or the National Bureau of Economic Research.
NBER working papers are circulated for discussion and comment purposes. They have not been peer-reviewed or been subject to the review by the NBER Board of Directors that accompanies official NBER publications.
© 2016 by Sara B. Heller, Anuj K. Shah, Jonathan Guryan, Jens Ludwig, Sendhil Mullainathan, and Harold A. Pollack. All rights reserved. Short sections of text, not to exceed two paragraphs, may be quoted without explicit permission.
Thinking, Fast and Slow? Some Field Experiments to Reduce Crime and Dropout in Chicago Sara B. Heller, Anuj K. Shah, Jonathan Guryan, Jens Ludwig, Sendhil Mullainathan, and Harold A. PollackNBER Working Paper No. 21178May 2015, Revised June 2016JEL No. C91,C93,D03,D1,I24,I3,I32,K42
ABSTRACT
We present the results of three large-scale randomized controlled trials (RCTs) carried out in Chicago, testing interventions to reduce crime and dropout by changing the decision-making of economically disadvantaged youth. We study a program called Becoming a Man (BAM), developed by the non-profit Youth Guidance, in two RCTs implemented in 2009–10 and 2013– 15. In the two studies participation in the program reduced total arrests during the interventionperiod by 28–35%, reduced violent-crime arrests by 45–50%, improved school engagement, andin the first study where we have follow-up data, increased graduation rates by 12–19%. The thirdRCT tested a program with partially overlapping components carried out in the Cook CountyJuvenile Temporary Detention Center (JTDC), which reduced readmission rates to the facility by21%. These large behavioral responses combined with modest program costs imply benefit-costratios for these interventions from 5-to-1 up to 30-to-1 or more. Our data on mechanisms are notideal, but we find no positive evidence that these effects are due to changes in emotionalintelligence or social skills, self-control or “grit,” or a generic mentoring effect. We findsuggestive support for the hypothesis that the programs work by helping youth slow down andreflect on whether their automatic thoughts and behaviors are well suited to the situation they arein, or whether the situation could be construed differently.
Sara B. HellerDepartment of Criminology University of Pennsylvania McNeil Building, Suite 571 3718 Locust Walk Philadelphia, PA 19104 [email protected]
Anuj K. ShahBooth School of Business University of Chicago5807 South Woodlawn Avenue Chicago, IL [email protected]
Jonathan Guryan Northwestern UniversityInstitute for Policy Research2040 Sheridan RoadEvanston, IL 60208and [email protected]
Jens LudwigUniversity of Chicago1155 East 60th StreetChicago, IL 60637and [email protected]
Sendhil MullainathanDepartment of EconomicsLittauer M-18Harvard UniversityCambridge, MA 02138and Consumer Financial Protection Bureau and also [email protected]
Harold A. PollackUniversity of ChicagoSchool of Social Service Administration969 East 60th StreetChicago, IL [email protected]
A online appendix is available at http://www.nber.org/data-appendix/w21178

3
I. INTRODUCTION
Disparities in youth outcomes in the United States are striking. For example, for 15–24
year olds, the male homicide rate in 2013 was 18 times higher for blacks than whites (71 versus
4 per 100,000).1 Black males lose more years of potential life before age 65 to homicide than to
America’s leading overall killer—heart disease.2 A large body of research emphasizes that—
beyond institutional factors—choices and behavior also contribute to these outcomes, including
decisions around dropping out of high school, involvement with drugs or gangs, or responses to
confrontations that could escalate to serious violence. In this paper we present the results of three
large-scale randomized controlled trials (RCTs) that seek to reduce crime and dropout by
changing the decision-making of disadvantaged youth at elevated risk for these outcomes.
Given the current focus of US social policies aimed at changing these behaviors, one
noteworthy feature of the interventions we study is what they are not. They do not involve early
childhood education, or academic skill development, or vocational or technical training, or
subsidized jobs or internships, or cash transfers, or in-kind supports, or efforts to change
parenting or the home environment, or any sort of incentive scheme for children, parents, or
teachers. Another noteworthy feature is that, unlike most previous interventions for low-income
youth, those we study here seem to generate large impacts on important behavioral outcomes.
To provide some concrete sense of what the programs are, we describe the first activity
youth do in one of the programs we study: the Becoming a Man (BAM) program developed by
the Chicago non-profit Youth Guidance (YG). Students are divided into pairs and one is given a
ball, which the other student is told he has 30 seconds to get from his partner. Almost all youth
use physical force to try to take the ball out of the other’s fist. During the debrief, the group
1 Our calculations compare non-Hispanic blacks to whites, and focus on homicides (excluding fatalities from legal intervention); see WISQARS (http://webappa.cdc.gov/sasweb/ncipc/mortrate10_us.html). 2 WISQARS (http://webappa.cdc.gov/sasweb/ncipc/ypll10.html)
4
leader points out that no one simply asked for the ball. When prompted about why they did not
simply ask, most respond with some version of “he wouldn’t have given it,” or “he would have
thought I was a punk.” The leader then asks the other youth, “How would you have reacted if
asked nicely for the ball?” The answer typically is something like, “I would have given it; it’s
just a stupid ball.” This exercise, like many in the program, teaches youth to think more carefully
about the situations they are in.
The interventions we study here were carried out in very disadvantaged neighborhoods on
the south and west sides of Chicago. Our first two RCTs tested BAM, first randomizing 2,740
youth to a one-year program in the 2009–10 academic year (AY), with the second RCT
stretching the curriculum out over two years in AYs 2013–14 and 2014–15 with 2,064 youth.3
We measure outcomes with longitudinal government administrative data. In both studies the
effect on program participants during the program period were similar, reducing total arrests by
28–35%, violent-crime arrests by 45–50%, and arrests for other crimes by 37–43%. While these
impacts on arrests did not persist beyond the program period in the first BAM study (we do not
have post-program data for the second BAM study), we did find persistent impacts on schooling
outcomes—including gains in high school graduation rates of 6 to 9 percentage points (12–19%).
Our third RCT was carried out in a very different setting—the Cook County, Illinois
Juvenile Temporary Detention Center (JTDC), where high-risk juvenile arrestees in the Chicago
area are taken for pre-trial detention. The intervention, carried out in some residential units in the
JTDC but not others, consisted of a package of reforms that included a token economy for good
behavior inside the facility, increased educational requirements for staff, and a daily program
delivered by the detention center’s staff that had many elements similar in spirit to BAM. We
3 The program is also abbreviated as “B.A.M.” but for consistency we use a common style for all acronyms. Some youth also received after-school programming developed to reinforce the BAM curriculum by a non-profit called World Sport Chicago. We argue below that our results are not due simply to incapacitation of youth during after-school hours when sports were held, nor to sports more generally.

5
focus on the 2,693 male admissions to the JTDC from 2009–11 who were randomly assigned to
units with or without the reforms, and for whom we have at least 18 months of follow-up data.
Receipt of programming reduced re-admission rates by 16 percentage points (21%) and had
impacts on the number of readmissions or readmissions plus arrests that were similarly large but
sometimes less precisely estimated.
What is striking about these interventions is not just that they generated such large
behavioral responses, but also that they were able to do so at relatively low cost—less than
$2,000 per participant (and sometimes much less). In our first BAM RCT, for which we have the
most complete data on outcomes, we estimate that the value of crime reduction alone yields
benefit-cost ratios that range from 5-to-1 up to 30-to-1. These are likely to be lower-bound
estimates, given our findings that BAM increases high school graduation rates as well.
Why do these programs work so well? Existing theories of what (beyond academic skills)
determines people’s life outcomes suggest a few possible channels such as self-control,
conscientiousness, “grit,” emotional intelligence, social skills, support from pro-social adults
(“social capital”), or an understanding of the returns to education. To measure these candidate
mechanisms we have surveys administered throughout the Chicago Public School (CPS) system,
including to youth in our first BAM study. These data are not totally ideal, partly because they
captured responses from just under half of the youth in our study and partly because they did not
capture measures related to every possibly-relevant theory from the prior literature. With these
caveats in mind, we find no positive evidence that any of the candidate mechanisms suggested by
prior research for which we have measures explain much of the treatment effect. Our estimates
of treatment effects on these potential mediators, and the relationship between mediators and
outcomes, suggest these mechanisms are unlikely to account for more than a modest share of the
program effects on behavioral outcomes. Using arrest records with exact date of arrest, we can
6
also rule out that the effects were due merely to keeping youth busy (voluntary incapacitation) on
days when after-school activities occurred.
When we look at the curricula for the programs we study here we can see why commonly
discussed mechanisms do not seem so important for these interventions. Consider, for example,
BAM’s “fist” exercise described above. This does not seem to act on commonly discussed
mechanisms like self-control or social skills or grit. The exercise does not help youth learn how
to either recognize or stifle feelings of anger, or learn the most polite way to request the ball, or
how to persist in trying to get the ball. Many other BAM activities are similar in that regard.
Another noteworthy aspect of the fist exercise (and the BAM program as a whole) is that
it does not tell youth the “right” thing to do. BAM providers recognize that these youth live in
distressed neighborhoods where being aggressive or even fighting may—unfortunately—
sometimes be necessary to avoid developing a reputation as someone who is an easy victim. It is
not hard to see how someone navigating that sort of neighborhood environment could develop a
tendency to reflexively push back against being challenged. That response can lead to trouble if
it is over-generalized and sometimes applied in settings where it is not helpful—such as school.
This illustrates our own hypothesis for why these programs change youth behavior, based
on the psychology of automaticity.4 Because conscious deliberation is mentally costly, all of us
develop a series of automatic responses that are usually adaptive to situations that we commonly
face—such as youth in distressed urban neighborhoods fighting back aggressively when
challenged. Why might a teenager over-generalize and deploy this response in a setting where it
is not adaptive, such as in school? Behavioral science shows that we all make automatic
assumptions about what situation we are in and that these assumptions can sometimes be wrong
4 Within psychology automaticity is most notably associated with dual systems models, which are well summarized in Kahneman (2011). Other economic models of dual systems thinking include Cunningham (2015) and for impulse control Fudenberg and Levine (2006).
7
(Ross and Nisbett 2011). Being yelled at by a teacher in school to stop talking so class can begin
may at first glance feel like one’s reputation is being challenged, just as on the street. We
hypothesize that these interventions improve youth outcomes in substantial part because they
help youth slow down in high-stakes settings, examine their automatic assumptions about what
situation they are in, and ask whether the situation could be construed differently. That is, the
programs help youth have a greater sense of occasion.5
The difference between this theory and other commonly discussed mechanisms is
highlighted by the fact that the BAM providers say some of their youth have the problem of not
being aggressive enough. That is, rather than having the problem of taking the automatic
response adaptive for the neighborhood and over-generalizing to the school setting, some youth
have the opposite problem of over-generalizing the response that is adaptive for school—which
in turn gets them into trouble in the neighborhood. For these youth, BAM can have the effect of
increasing the frequency with which they assert themselves—ideally only in the right situations.
To test this theory, we administered a decision-making exercise (an iterated dictator
game) to about half of the youth in our second BAM study. This exercise made youth think they
had been provoked by a classmate and then gave them a chance to retaliate. Our theory predicts
BAM youth should slow down and spend more time thinking about how to respond. Our theory
does not predict how they will respond, since that depends on what situation they construe
themselves to be in. Consistent with our theory, BAM increased decision-making time in
response to the provocation by 80%. In terms of the amount of retaliation administered, we
found few differences between BAM youth and controls, which does not seem consistent with
mechanisms that emphasize changes in factors that would make youth uniformly more “pro-
social” across all situations.
5 We thank our colleague Dan Gilbert for suggesting this wonderful phrase.

8
This hypothesis gives us a way to understand why these interventions are more successful
than so many previous efforts. Many social policies intended to help disadvantaged youth try to
change behavior by changing the long-term returns to pro- or anti-social behavior, usually with
disappointing results. More promising may be to directly help youth recognize their automatic
assumptions and responses and make better decisions in high-stakes situations. As one JTDC
staff member told us, “20% of our residents are criminals; they will harm other people if they are
not locked up. But the other 80%, I always tell them—if I could give you back just 10 minutes of
your lives, you wouldn’t be here.”6
II. INTERVENTION STRATEGY
This section describes the two interventions we study, key parts of which may be lumped
together under the broad heading of what psychologists call cognitive behavioral therapy (CBT).
CBT is designed to get youth to “think about their thinking,” or engage in “meta-cognition”
(Beck 2011).7 There are other elements of the two programs we study that only partially overlap.
This provides us with one source of leverage for learning more about underlying mechanisms.
A. BECOMING A MAN (BAM)
The Becoming a Man program was developed by Youth Guidance about a decade before
our first RCT of the program in AY 2009–10. The program was operating in a single Chicago
high school and a few elementary schools before being taken to scale for our RCT. In the first
experiment, BAM offered youth the opportunity to participate in 27 one-hour, once-per-week
6 Personal communication, Darrien McKinney to Jens Ludwig, Sendhil Mullainathan, and Anuj Shah, 10/18/2012. 7 CBT programs vary in their focus, including the degree to which they try to reduce automaticity, and not all interventions to reduce automaticity will necessarily be called CBT. Since the 1970s, CBT has been used to address mental health disorders such as substance abuse, anxiety, and depression, and can be more effective than anti-depressant drugs (Rush, et al. 1977). Since then, there has been growing practitioner interest in using different versions of CBT as a social policy tool to address socially costly behaviors. Yet there is little good evidence currently about effects on those behaviors of greatest policy concern such as youth delinquency, violence, and dropout. This is discussed in detail in the appendix materials that are available online; specifically see Appendix A and Tables A.1 and A.2). One recent exception is Blattman, Jamison and Sheridan (2015) who found a CBT program for adults in Liberia was successful, especially when combined with cash grants. That program had a variety of behavioral components, including teaching anger management and self-discipline.

9
group sessions held during the school day over a single school year. The intervention is delivered
in groups, which helps control costs, with groups kept small (assigned groups of no more than 15
students and average realized groups of about 8) to help develop relationships. Students skip a
class to participate, which is a draw for some youth. In our first BAM RCT some youth were also
offered the chance to participate in after-school sports programming delivered by World Sport
Chicago, to increase participation and (because coaches were trained in parts of the BAM
curriculum) to reinforce the program.8 The second BAM RCT was carried out in AYs 2013–14
and 2014–15, with the curriculum stretched out over two years (up to 45 sessions) so providers
could go into more depth on each topic as well as cover more advanced material (particularly
related to self-reflection and skill-building). In this second study sports were also offered in the
first year but very little in the second year, which helps us isolate the effect of BAM from sports.
Table I illustrates a few of the key types of activities included in the BAM curriculum
and provides a brief description of each selected activity. The program is manualized and can be
delivered by college-educated men without specialized training in psychology or social work,
although YG had a preference for such training in selecting program providers. YG also
prioritized hiring counselors who were able to keep youth engaged, and often hired people from
neighborhoods similar to those in which they would be working.
The curriculum includes standard elements of CBT (Beck 2011), such as a common
structure to most sessions that starts with a “check-in.” Youth sit in a circle with the counselor,
who reflects on how things in his life are going in various domains. The youth then follow suit.
This is an example of what we call “retrospective / introspective” activities, which include
various efforts to get youth to talk about the things they are doing well and areas in which they
still need to still improve, and also share what others are doing well and need to improve.
8 The sessions were one to two hours each, and included non-traditional sports like archery, boxing, wrestling, weightlifting, handball, and martial arts.
10
Another type of activity in the BAM curriculum we call “immersive or experiential,” of
which the fist exercise described above is one example. Another example is called the stick.
Youth are divided into two groups and lined up facing each other. They are told to put their arms
out chest high and extend their index fingers, and the counselor then lays a 10- or 15-foot plastic
pipe across everyone’s fingers. The group is then told that they must lower the pipe to the floor
but their fingers must be touching the pipe at all times. This leads everyone to put upward
pressure on the pipe, which makes it go up rather than down. As youth become immersed in the
activity, they can lose themselves in the moment and become frustrated, blaming each other
rather than recognizing that each of them contributes to the problem (and that they could help
solve the problem themselves by trying to coordinate and lead the group).
Other types of activities included in the BAM curriculum are what we call “role-playing”
and “stories and discussions.” For example, in the $10 role-play activity, students act out a scene
in which one of them has borrowed money from another but then never paid it back. The youth
act out how they would respond and then the group discusses what happened and why, and what
might have led to a better outcome. Stories include the elephant and the rhino, in which two large
animals are very persistent in their refusal to make way for the other, to both their detriments.
The program also does some “skill-building.” This includes lessons in muscle relaxation,
deep breathing, and channeling anger productively. It also includes cognitive thought
replacement, a CBT element that asks youth to identify and replace problematic or false beliefs.
Finally, the curriculum includes a discussion of different conceptions of masculinity and some
general values like the importance of integrity and personal accountability. It also takes youth on
field trips to local colleges to highlight the value of education, and, by putting youth in regular
contact with a pro-social adult, has a mentoring component as well.
B. JUVENILE DETENTION

11
The setting for our third RCT is the Cook County Juvenile Temporary Detention Center,
which is where the highest-risk juvenile arrestees in Cook County are taken after they are
arrested. Youth are held for an average of three to four weeks until their cases are adjudicated in
court, although youth whose cases are being heard in the adult court system can be detained
much longer. In May 2007 the JTDC began to implement a series of reforms that included the
use of a token economy system to help maintain order and twice-daily participation in group
CBT sessions when youth were not attending the school inside the JTDC, replacing time that had
typically been spent watching TV. The CBT program used a manualized curriculum9 and was
delivered by trained JTDC staff. Partly to help implement these reforms, the JTDC also required
increased educational requirements for staff working in the newly reformed centers.
Table II summarizes a few key types of activities and specific activities included in the
JTDC curriculum. While BAM uses “check-ins” at the start of most sessions to get youth to
engage in reflection or introspection, the JTDC program requires youth to carry out “thinking
reports” every time their misbehavior causes detention staff to give them a “time out” (a certain
amount of time alone in their cell). Examples of other activities in the reflective / introspective
category in the JTDC include retrospectively talking through experiences and focusing on what
an outside, objective observer would have seen (or, taking a “camera view”). The program in the
JTDC also continually emphasizes the importance of learning to “stop, look, and listen.”
While BAM emphasizes youth engagement and seeks to “show, not tell,” the JTDC
program in comparison is much more “tell, not show.” In the JTDC curriculum there are no
immersive / experiential activities (like the stick or the fist) or even any physical activities
(including no sports). In addition to reflective / introspective activities, “skill-building” activities
9 The specific intervention studied here was developed by Dr. Bernie Glos and his associates from the DuPage County, Illinois Juvenile Detention Center. The curriculum is adapted from the best material from several prior CBT models that had been used in detention and is based in part on the cognitive behavioral training ideas from Maultsby (1975, 1990) (see also Ellis 1957; Ellis and Harper 1975).

12
are common in the JTDC curriculum. As in BAM, the “skill-building” curriculum focuses on
helping youth “keep cool when they are angry” (using anger expression and relaxation
techniques), as well as on things like setting goals, interpersonal problem solving, and paying
attention to one’s feelings. The token economy is often used to reinforce the CBT curriculum by
rewarding positive behaviors or thoughts consistent with these lessons.
III. EVIDENCE FROM THREE RANDOMIZED CONTROLLED TRIALS
This section presents the results of our three large-scale RCTs, two of which tested BAM
and the third of which tested a related program implemented inside the Cook County Juvenile
Temporary Detention Center. The exact outcome measures and time horizons we examine are
not identical across all three studies, but the results are qualitatively consistent in showing
sizable youth responses on different measures of criminal behavior or schooling.
A. STUDIES 1 AND 2: BECOMING A MAN
1. Samples and randomization
For our first RCT of BAM (hereafter “study 1”), during the summer of 2009 we recruited
18 elementary and high schools in the Chicago Public Schools (CPS) located on Chicago’s low-
income, racially segregated south and west sides, where the city’s violent crime is
disproportionately concentrated (see Appendix Figure A.1). Our sample was essentially the
2,740 7th- to 10th-grade male students at highest risk of failure in these schools, after excluding
students who rarely attended school (and so would not benefit from a school-based intervention)
or had serious disabilities. This sample represented around 75% of all males in grades 7 through
10 in the study schools (see Appendix B). Our second BAM RCT (“study 2”) was carried out in
13
2013–15 with 2,064 male 9th and 10th graders attending nine CPS high schools. Similar sample
eligibility and randomization procedures were used for study 2, though the larger number of
BAM slots per school meant study 2 covered a broader risk spectrum than did study 1.
Both studies were block-randomized experiments, where students were the unit of
randomization and were randomly assigned within schools (study 1) or school-by-grade “blocks”
(study 2). In study 1 youth were randomized to one of three treatment arms (in-school BAM,
after-school sports programming that incorporated BAM elements, or both) or the control
group.10 Unfortunately, due in part to treatment-arm crossover, study 1 does not have adequate
statistical power to disentangle the separate effects of BAM from the after-school program; in
our main analyses, we pool the treatment arms together (results separately by treatment arm and
details about crossover are in Appendix C, Figure A.2 and Table A.11). In study 2 youth were
randomly assigned to either be offered BAM for two years (2013–14 and 2014–15) or to the
control group. There were some sports sessions offered in five of the nine schools in study 2, but
sports participation was low in the first year and then declined by 80% from the first to second
year. We return to this below.
Table III shows that both studies enrolled very disadvantaged samples of youth, and that
random assignment appears to have been carried out correctly. In both studies youth were about
15-years-old at baseline,11 with one-third to one-half being old for grade. They missed on
average eight weeks of school in study 1 (when the school year was 170 days) and six weeks in
study 2 (when the school year was 180 days); many had been arrested before. Reflecting the
composition of their neighborhoods, around 70% of youth are black and the remainder Hispanic.
In neither study can we reject the null hypothesis that the set of baseline characteristics is the
10 Three of our 18 schools could not offer after-school programming because of logistical or space reasons. Eight schools offered both in- and after-school treatment arms in some combination, but not all three treatment arms. 11 Even though study 1 covers youth in grades 7–10 and study 2 covers youth in high school grades only (9–10), the average age is slightly higher in study 1 because of a larger number of youth 17- or 18-years-old at baseline.
14
same for treatment and control groups (F(18,2543)=1.04, p=0.409 and F(18,1752)=0.38, p=0.99,
respectively).12 We also find that the youth in study 1 were more disadvantaged on average than
those in study 2; we can reject the null hypothesis that the difference in study 1 versus study 2
baseline means are jointly zero, F(18,4348)=329.31, p<.001.13 At least part of the difference in
baseline schooling characteristics across studies may be due to general improvements in reported
schooling outcomes throughout CPS over time.14
In both BAM studies about half of those randomized to treatment actually participated
(defined as attending at least one program session). This take-up rate is consistent with many
other social experiments despite the fact that we randomized (using administrative data) prior to
seeking consent for program participation, in contrast to the more common practice of
consenting and then randomizing.15 We suspect participation rates for the after-school
programming in study 1 are understated because of record keeping issues; Appendix C and Table
A.4 discuss how we handle this issue. Participants attended on average 13 sessions the first year
of study 1, and for study 2 an average of 17 and 21 sessions during the first and second years,
respectively (see Appendix Table A.3). A small share of controls also received program services
in both studies.
2. Data and outcome measures
Our main schooling outcomes come from longitudinal student-level CPS records. We
have these data through AY 2014–15, which for study 1 covers the program year plus five
12 The baseline variables in the joint test are: age; grade; number of in-school suspensions; number of out-of-school suspensions; number of each type of arrest (violent, property, drug, and other); number of each type of grade earned (A through F); and indicator variables for being black, Hispanic, old-for-grade, and having a learning disability. 13 The difference is not just because of age or school differences in the sample; when we hold age constant and compare youth in 9th and 10th grade in just the three schools that are common to both BAM studies, we still see that the study 1 youth are more disadvantaged on average than those in study 2. 14 For example, reported graduation rates have increased from 57% in 2010–11 to 70% for 2014–15, while the reported CPS 9th grade indicator for being “on track” for graduation (Allensworth and Easton 2005) increased from 69% to 84% over that period (http://cps.edu/News/Press_releases/Pages/PR1_10_02_2015.aspx). 15 Consent was for program participation only; outcome data are available for all youth who were randomized.
15
follow-up years, and for study 2 covers only the two program years. We create a summary index
of three schooling outcomes in Z-score form (GPA, days present, and enrollment status at the
end of the year), which we call “school engagement.” Use of an index reduces the number of
hypothesis tests, which reduces the risk of false positives (Westfall and Young 1993; Kling,
Liebman and Katz 2007; Anderson 2008), and improves statistical power to detect effects for
outcomes within a given “family” of outcomes that are expected to move in a similar direction.
We impute group means for missing outcomes, which assumes data are missing completely at
random. Our results are similar when we relax this assumption and use multiple imputation or
other approaches to handling missing data (Appendix Table A.10). For study 1, where we have
longer-term follow-up data, we are also able to examine impacts on high school graduation rates.
To measure effects on criminal behavior, for study 1 we use electronic arrest records
(“rap sheets”) from the Illinois State Police (ISP). For study 2 we use arrest data from the
Chicago Police Department (CPD). Both datasets are linked to our samples using probabilistic
matching on first and last name and date of birth. Arrest records avoid the problem of under-
reporting of criminal involvement in survey data (Kling, Liebman and Katz 2007) but require the
assumption that the intervention does not change the chances a crime results in arrest. Because
intervention impacts can vary by crime type, we present results separately for violent, property,
drug, and “other” crimes.16 We cannot distinguish “missing data” from “no arrests,” so we
cannot explore how the arrest impacts change when we change how we handle missing data.
3. Estimation approach
Given our randomized experimental design, our analysis plan is quite straightforward. Let
Yist denote some post-program outcome for individual i at school s during post-randomization
period t, which is a function of treatment group assignment (Zis) and data from government
16 We exclude arrests for motor vehicle violations, but results are similar including them (Appendix Table A.12).

16
records measured at or before baseline (Xis(t-1)) as in equation (1) below. We control for baseline
characteristics to improve precision by accounting for residual variation in the outcomes (results
without baseline covariates are similar).17 We also control for the “randomization block” with
school (study 1) or school-by-grade (study 2) fixed effects (γs). The intention to treat effect (ITT)
captures the effect of being offered the chance to participate in the program, and is given by the
estimate of π1 in equation (1). We present robust standard errors but do not cluster by school,
partly because the fixed effects account for within-school or within-school-and-grade
correlations across students in mean outcomes. As a sensitivity analysis we also calculate p-
values that come from a permutation test, which randomly re-assigns the treatment-offer
indicator Zis and does not rely on distributional assumptions or any asymptotic theory,18 as well
as p-values that account for multiple comparisons (discussed below).
(1) Yist = Zisπ1 + Xis(t-1)β1 + γ1s + ε1ist
In addition we present the effects of participating in the program (defined as having
attended ≥ 1 session) for those who participate, which we estimate using two-stage least squares
with random assignment (Zis) as an instrumental variable (IV) for participation (Pist), as in
equations (2) and (3) (Bloom 1984; Angrist, Imbens and Rubin 1996). This assumes treatment
assignment has no effect on the outcomes of youth who do not participate in the intervention.
(2) Pist = Zisπ2 + Xis(t-1)β2 + γ2s + ε2ist
(3) Yist = Pistπ3 + Xis(t-1)β3 + γ3s + ε3ist
Since a small share of controls gets the program, π3 is technically a local average
treatment effect (LATE). But given the low rate of crossover this should be close to the effect of
17 We control for: days present; number of in-school suspensions; number of out-of-school suspensions; number of each type of grade received (A, B, C, D, F); dummies for ages 14–15, 15–16, and 17+; and indicators for having a learning disability, being in 9th or 10th grades, being old-for-grade, being black, being Hispanic, and having one, two, or three and over arrests of each type. For missing baseline covariates, we assign a value of zero and include an indicator that the variable is missing. 18 See, for example, Young (2015) for how the use of re-randomization tests can matter in practice.

17
treatment on the treated (TOT). We benchmark the size of these effects with the control complier
mean (CCM) (see Katz, Kling and Liebman 2001), but given the treatment crossover we estimate
this using the formula from Heller, et al. (2013) . If C indicates being a “complier” and Z
indicates treatment assignment, we calculate this as CCM = E(Y|C=1, Z=1) – [E(Y|C=1, Z=1) –
E(Y|C=1, Z=0)]. The term in brackets is our LATE estimate. However, we must recover the first
right-hand-side term, E(Y|C=1, Z=1), since what we observe in the data is the mean outcome for
all treatment group participants—a weighted average of the mean outcomes for compliers and
always-takers. Let P indicate actual participation and A be an indicator for always-takers. Then:
(4)
To recover E(Y|Z=1, C=1), we can estimate the left-hand side and E(P|Z=1) directly from
the data, and use random assignment to replace E(A|Z=1) with E(A|Z=0) and E(Y|Z=1, A=1)
with E(Y|Z=0,A=1). That is, we assume treatment- and control-group always-takers are
equivalent on average. In our case, block randomization means these equalities should also be
conditional on block. In practice, calculating them conditionally makes a trivial difference.
It is possible that there may be some spillover effects of the BAM treatment to other
youth within the school, through peer influences or other mechanisms. We have tried to learn
more about this using non-experimental variation across schools in the share of male youth who
were randomized to treatment. But with relatively few schools in the study sample our statistical
power is quite limited. If peer spillovers from BAM lead to improved control-group outcomes
(or if negative spillovers from interacting with “untreated” control youth undermine effects of
the BAM treatment), then our estimates would understate the effects of offering BAM at larger
scale (for example, to all youth within a school rather than just some youth).
4. Results
E(Y | Z =1,P =1) = E(Y | Z =1,C =1) 1−E(A | Z =1)E(P | Z =1)
+ E(Y | Z =1, A =1)
E(A | Z =1)E(P | Z =1)
18
Table IV shows that school engagement increased in both studies by the end of the
program period. In study 1, where we have post-program data, the effect seems to have persisted.
We initially focus on showing as much of the data as possible, focusing on separate estimates by
study and program year and simple pair-wise p-values without any adjustment for multiple
comparisons, but return to these other issues below. During the program year in study 1,
participation in BAM improved schooling outcomes by 0.14SD, and by 0.19SD in the follow-up
year. In study 2 there was no statistically detectable impact on school engagement in year one
but an effect of about 0.10SD in year two (which as a reminder, was a program year in study 2).
Permutation tests lead to qualitatively similar inferences for BAM study 1, although for study 2
the p-value for the year 2 schooling effect is now p = .11 vs. p<.05 (see Appendix Table A.6).
Table IV shows impacts on arrests that look quite similar across the two studies when
measured at the end of the program period. By the end of the first (and only) program year in
study 1, participation reduced total arrests by 28% of the CCM, violent-crime arrests by 45%,
and “other” arrests by 37% (with reduced weapons offenses, trespassing, and vandalism each
accounting for about one-quarter of the effect).19 By the end of the program period in study 2
(that is, during year two), participation reduced total arrests by 35% of the CCM, violent-crime
arrests by 50%, and other arrests by 43% (driven by reductions in reckless conduct and
trespassing). These effects translate into large numbers of arrests averted, given that the control
groups’ rates of arrests were 40 to 70 arrests per 100 youth per year. (The rate was somewhat
lower in year two of study 2 because those arrest data cover only 8 months). Some of these
impacts are not very precisely estimated and are sometimes not statistically significant even
19 Disorderly conduct and disobeying a police officer—the offenses where we might expect being able to interact constructively with police could have the biggest effect on the chance of being arrested conditional on engaging in a given behavior—do not change in either study.

19
when the effects are proportionally large. But the consistency in the pattern of arrest impacts
across the studies is striking.
Table V reports the results of pooling together the data from the program periods in these
two RCTs (year one for study 1 and years one and two for study 2). The final column shows that
we cannot reject the null hypothesis that the effects were the same across the two studies.20 In
this case pooling data from the two studies can also improve statistical power. The p-values for
pairwise treatment-control comparisons are statistically significant at the 5% cutoff for school
engagement, total arrests, and arrests for violent and other crimes, calculated from either robust
standard errors or a permutation test. These results basically remain statistically significant (p-
values range from 0.010 to 0.055) when we control for multiple comparisons—either the fairly
conservative family-wise error rate, or FWER (defined as the chance that at least one of our
outcomes in the “family” of outcomes is significant when the null hypothesis of no effect is
true),21 or the false discovery rate, or FDR (the share of significant estimates that are expected to
be false positives).22 In Table V we do not include total arrests in the “family” of outcomes since
that is just a linear combination of the crime-specific measures (Appendix Table A.5 shows the
results from using different ways of defining “families” of outcomes).
The appendix shows that the results are robust to adjusting for the possibility of under-
reporting of sports participation in the first BAM study (Appendix Table A.4), using multiple
20 Since the arrest data for year two of BAM study 2 do not cover a full year, we upweight these to 12-month equivalents for calculating the final column’s p-values for the test of comparability of study 1 and 2 effects. The point estimates shown in the table come from summing the arrests over the 19-month period covered by study 2 years one and two, and then dividing by two. 21 We use a bootstrap resampling technique that simulates data under the null hypothesis (Westfall and Young 1993). Within each permutation, we randomly re-assign the treatment indicator with replacement and estimate program impacts on all five of our main outcomes (the schooling index and our four arrest categories). By repeating this procedure 100,000 times, we create an empirical distribution of t-statistics that allows us to compare the actual set of t-statistics we find to what we would have found by chance under the null; see Appendix C and Table A.5 for details. 22 We find the smallest FDR q-value at which we could reject the null for each outcome using the method from Benjamini and Hochberg (1995); Appendix Table A.5 shows similar results if we use the method from Benjamini, Krieger and Yekutieli (2006).

20
imputation or other methods to deal with missing values for school outcomes (Table A.10), and
using different thresholds for deciding what counts as a “match” to the arrest data in our
probabilistic matching algorithms (Table A.7).
Finally Table VI shows that there seem to have been gains in high school graduation in
the first BAM study (we do not yet have follow-up data for study 2). While the size and p-values
of the estimated impacts vary somewhat depending on the graduation measure, all estimates are
in the direction of sizable gains in graduation rates. The narrowest definition of graduation is
obtaining a diploma on time (no delays relative to the grade level during the program year),
which BAM participation increased by 7 percentage points (p<.10). Given a CCM of 38%, this is
an increase of 19%. The broadest definition is ever having received a diploma from CPS. This
measure requires an assumption about how to treat youth who leave the school district, since for
them we do not observe graduation or dropout. The program effect was slightly smaller (6
percentage points, versus a CCM of 47%, for a 12% increase) and not quite statistically
significant if we count transfers out of CPS as dropouts, but larger and statistically significant if
transfers are counted as graduates (nearly 9 percentage points, p<0.05, versus CCM of 59%, for a
15% increase). Increased graduation rates should lead to gains in lifetime earnings and improved
health. We discuss this in the conclusion in the context of our rough benefit-cost analysis.
B. STUDY 3: COOK COUNTY JUVENILE TEMPORARY DETENTION CENTER
1. Sample and randomization
Our third RCT capitalizes on a natural experiment resulting from the May 2007 take-over
of the JTDC by a federal judge as the result of an ACLU lawsuit (Doe v. Cook County). One of
the first acts of Earl Dunlap, the temporary administrator who was appointed by the federal court
to run the 500-bed facility, was to divide the facility into 10 essentially separate residential
centers of around 50 beds each, and to enact the reforms described in Section II in each of these

21
centers one by one. The rollout of the reforms across centers was halted halfway through due to
litigation initiated by the union representing the JTDC staff. The result was that for an extended
period, half the JTDC centers operated using the reforms (“treatment centers”) while the rest
used the previous standard operating procedures (“control centers”).
Our research team worked with the JTDC staff to implement a randomization algorithm
that assigned all incoming male youth to treatment or control centers from November 10, 2009
through March 2, 2011. The randomization ended when the litigation was resolved, at which
point the entire facility began implementing the new reforms. (Girls were not randomized
because all girls were housed in a single residential center.) In our main analyses we focus on the
2,693 male admissions to the JTDC during our study period for which we have at least 18
months of follow-up data, so that we have a balanced panel for the full follow-up period. Results
for all 5,728 male admissions to the JTDC during our study period are in the appendix (see
Appendix Tables A.17 through A.20).
2. Estimation approach
While random assignment was not binding for some youth because of safety or
operational reasons, or because they had been assigned to a treatment unit inside the JTDC
previously (see Appendix B), randomization greatly increased the likelihood of placement in a
treatment unit. The ITT effect of random assignment on placement is about 25 percentage points
(39.5% in spells where youth are assigned to treatment, 14.4% for controls); the first stage F-
statistic is 241. We thus have an “encouragement design,” where randomization is a valid
instrument for estimating the effect of participation on compliers as in equations (2) and (3)
above. To avoid mis-measurement of treatment caused by temporary relocation of small-group

22
living facilities,23 we define participation as spending at least 5% of a JTDC stay in a treatment
center. The first-stage ITT changes little (from 25 to 24 points) if participation is instead counted
as “ever” in a treatment center in a given spell. In addition to controlling for baseline
characteristics, because randomization occurred for youth by day of admission we also control
for day-of-admit fixed effects. These help control for any slight differences across days in
treatment assignment probabilities, and may also help with precision (see Appendix C).
3. Data and outcome measures
The data we have on these youth include intake forms that provide basic demographics
and addresses; admissions logs, which the admissions staff use to record who enters the facility
each day; and the JTDC’s housing roster, which captures the residential unit in which a youth is
located on each day and so lets us measure receipt of treatment. We have these data through
December 2011. Our main results focus on a common measure of recidivism—re-admission into
the JTDC facility itself. We have also linked these youth to the CPD and ISP arrest databases
using the same probabilistic matching algorithms described above.
Table VII makes clear that this is a very criminally-involved population: the average
youth has been arrested eight times in the past. The average JTDC spell in our sample is the
youth’s third entry into detention.24 Consistent with national patterns of incarceration, the large
majority of detainees is black despite the fact that just one-quarter of the county’s population is
23 In general we observe whether a youth participated in CBT by observing whether he lived in an area of the JTDC that offered CBT at the time of his stay. Occasionally, the youth and staff in a small-group living facility, or “pod,” temporarily moved to other areas of the building due to maintenance, cleaning, or other facilities issues. We have imperfect records on these temporary moves, which introduces some error in our measurement of CBT receipt. 24 Among the 1,862 individuals who make up these 2,693 spells, each visits the JTDC an average of 4.4 times before the end of our data (the maximum total spells per individual over the 7 years of our housing roster data is 23).

23
black.25 As we would expect with successful randomization, we cannot reject the null hypothesis
that the treatment-control differences are jointly zero (F(24, 1835) = 0.87, p = 0.65).26
4. Results
Figure I shows the effect of being in a treatment center on the probability of re-admission
to the JTDC.27 We measure re-admission at different points in time since release from the JTDC.
The first panel shows that two months after release, the ITT effect was a decline in readmission
rates of about three percentage points. Through 18 months the effect was about four percentage
points. The figure also shows our estimates are not very sensitive to inclusion of day-of-JTDC-
admission fixed effects.
The bottom panel of Figure I shows that the effect of being in a treatment unit on the
compliers (the local average treatment effect) was about 13 percentage points two months after
release and grew slightly to 16 percentage points by 18 months following exit from the JTDC
(equal to 39% and 21% of the CCMs, respectively). A different way to gauge the size of this
effect is to note that about a fifth of the control compliers had not been re-admitted to the JTDC
within 18 months; the treatment increased the chances of avoiding readmission by fully 80%.
Table VIII shows results for the effect of receiving the intervention (LATE) on the re-
admission outcome reported in Figure I and several other outcomes as well (ITT results are in
Appendix Tables A.13 through A.20). The second panel of the table shows that receipt of the
25 http://quickfacts.census.gov/qfd/states/17/17031.html 26 Baseline covariates in the joint test are: spell number; age; number of each type of baseline arrest (violent, property, drug, other); indicators for race (white, Hispanic, other); type of admitting offense (violent, property, drug, or other arrest, or direct admission with no arrest); and neighborhood characteristics from the ACS (unemployment, median income, % below poverty, % white, % black, % Hispanic, % receiving SNAP, % owning their own home, % on welfare, and % with at least a high school degree). Only non-missing covariates are used in the joint test. For outcome regressions, we impute zeros for missing values and include indicator variables for missing-ness. Outcome baseline covariates are: dummies for ages 14–15, 15–16, and over 17; race / ethnicity; having one, two, or three-plus prior arrests of each type; neighborhood characteristics (% with at least a high school degree, % black, % unemployed); indicators for spell number (2, 3, 4, and 5 or over); and admission reason (violent, property, drug, or other arrest, with no arrest as the left-out category). 27 Aizer and Doyle (2015) find large negative effects of a similar form of juvenile incarceration on high school completion and large positive effects on subsequent adult incarceration.

24
JTDC intervention reduced the number of re-admissions through 18 months by 0.7 admissions
per youth, equal to 32% of the CCM. The bottom panel shows that when we combine re-
admissions and arrests as our outcome, the point estimate is of about the same magnitude (0.66),
but less precisely estimated. The appendix presents various sensitivity analyses, such as what
happens when we use the full sample, not just those for whom we have a full 18 months of
follow-up data (Appendix Tables A.17 through A.20).
While the outcome measures we have available are not perfectly consistent across all
three studies, to the extent to which we can pool data the impacts on the one outcome we can
examine in all three RCTs (any criminal behavior) seem to be generally consistent. We find a
statistically significant effect when averaging all three studies together and cannot reject the null
hypothesis that the effects are the same across the three studies (see Appendix Table A.21).
IV. MECHANISMS
Why do these interventions have such large behavioral impacts? In this section we first
discuss which specific components of the programs may be most important in generating
behavioral responses, and then turn to a discussion of what specific channels or mechanisms the
program components may be working through to change youth outcomes. Existing theories of
the determinants (beyond academic skills) of people’s life outcomes suggest a number of
candidate channels. Partly because these candidate mechanisms map only imperfectly to the
specific activities included in the BAM and JTDC interventions, we also develop an alternative
hypothesis (automaticity) for why these programs may change youth outcomes. While the data
we have to test these mechanisms are not totally ideal, we find no positive evidence in support of
some commonly discussed determinants of youth behavior and social-program success. We do
find some evidence to support our automaticity theory.
A. PROGRAM COMPONENTS

25
Because both the BAM and JTDC programs we study are bundled interventions, we
begin by considering which elements of these interventions may be most important in changing
youth outcomes. One natural question is whether these results are simply driven by the after-
school sports programming. Since some programs try to reduce delinquency by keeping youth
busy and off the streets, to what degree are the impacts we observe here due only to “voluntary
incapacitation” of youth during the after-school hours? We can rule out this sort of explanation
by using exact date of arrest in the rap sheet data we have; the estimated effect of BAM on
arrests was not concentrated on days when after-school programming was held.28
In principle the sports programming could change youth outcomes through other means,
such as physical exercise, increased self-discipline, or delivery of BAM principles in a different
format (coaches were trained in BAM principles). But this seems very unlikely to be the main
driver behind our estimated program impacts. In the second BAM study, sports participation
declined by 80% from the first to second year of the program29 while the impact on violent-crime
arrests increased from year one to year two by over 50%. Perhaps more telling, the JTDC study
generated sizable changes in behavior despite including no sports component at all.
The JTDC intervention was a different bundle of services that involved other program
elements beyond CBT such as use of a token economy inside the facility’s treatment units and
exposure to staff with somewhat higher educational qualifications. While we cannot cleanly
distinguish between these elements, the fact that our behavioral impacts in the JTDC study are all
measured during the time period after youth left the facility does not seem consistent with the
idea that changes in incentives inside the facility (like the token economy) are driving our results.
28 In BAM study 1 the ITT effect on an indicator for any violent-crime arrest on days when after-school programming was not offered was β = -0.0224 (se=0.0103), p = 0.030, CM = 0.094, versus on days when after-school programming was offered, β = -0.0061 (0.0076), p = 0.423, CM = 0.046). These estimates do not adjust for the larger number of non-programming days. 29 Controlling for randomization block effects in an ITT model of sport session attendance, the treatment-control difference in number of sessions attended decreased from 1.92 in year one to 0.35 in year two, a decline of 82%.

26
B. CANDIDATE MECHANISMS
1. Candidates from existing research
Table IX describes the different candidate mechanisms through which the programming
elements of BAM and the JTDC interventions may change youth behavior. For example, there is
a large literature that documents statistically significant correlations of behavioral outcomes with
self-control, conscientiousness, and persistence or “grit” (Duckworth, et al. 2007; Moffitt, et al.
2011; Heckman and Kautz 2013). These are distinct concepts in principle but yield measures that
are often highly correlated with one another in practice.30 While the size of the correlations
between these mechanisms and outcomes like schooling can vary substantially across study
samples,31 there is a growing sense that these and related skills are important determinants of
youth outcomes (Tough 2013). BAM includes several activities that might help develop these
skills, for example, the trust walk or the focus mitt drill.
Similarly, BAM activities like the human knot might help develop improved emotional
intelligence or social skills, which have been shown to be correlated with long-term outcomes
like wages (for example, Deming 2015). Some of the BAM stories could in principle change
social norms or moral values, which recent work by Seroczynski, et al. (2015) among others
suggests could be quite important for youth outcomes. BAM took youth on a field trip to a local
college, which might change perceptions of the returns to schooling. The possibility that youth
growing up in high-poverty neighborhoods may lack role models who can demonstrate the
returns to schooling has been of long-standing concern to social scientists (Wilson 1987; Manski
1993; Jensen 2010). All three of our RCTs also involve an adult interacting with a group of 30 For example Duckworth, et al. (2007) found a correlation between grit and self-control of 0.63 to 0.66, and grit with conscientiousness of 0.77. In practice in our dataset we have only a measure of grit, and so cannot distinguish between the three correlated mechanisms. 31 Duckworth, et al. (2007) found a correlation between grit and GPA of 0.25 in a sample of undergraduates and 0.06 in a sample of West Point students. The correlation was 0.3 in a sample of middle-school students in Duckworth and Quinn (2009), while Duckworth and Seligman (2005) found a correlation of self-discipline with GPA in two separate samples of 8th graders to equal between 0.55 and 0.67.
27
youth. This could create a “mentoring” or “social capital” effect, which has been viewed, dating
back to at least Coleman (1988), as an important determinant of youth outcomes.
Despite the abundance of theories about the non-academic determinants of people’s life
chances, it is noteworthy that many of the activities in the programs we study do not seem to
relate to any of these theories. For example, at the start of most BAM sessions the youth sit in a
circle and do check-ins, which involve reflecting on what is going on in their lives and how they
have handled various situations. These account for a sizable share of BAM program hours yet do
not seem to be about building anything like self-control, grit, social skills, or moral values. The
fist exercise described above might be teaching some social skills, but also seems to be doing
more than that. In any case, the fist exercise does not seem to be doing much that could be
interpreted as developing self-control or grit. In most BAM activities, counselors avoid telling
youth what is the “right” and “wrong” thing to do, which is different from many moral values
programs. For that matter, BAM never teaches youth not to get angry, or even that they should
never fight—because the program providers realize youth are growing up in difficult
neighborhood environments where they will be challenged and sometimes need to fight back.
Providers tell youth “if you fight be sure it’s only when you have to,” and report that while most
youth wind up fighting less, some stand up to challenges more often due to BAM.
Another way to see how imperfectly existing theories seem to fully describe our
programs is to note how many blank cells there are in Table IX’s mapping between the program
activities and theories emphasized by so much of the previous research (the last three columns).
This seems to be particularly true of the JTDC intervention. This apparent incompleteness of
existing theories in helping us understand what the BAM and JTDC interventions might be doing
helped motivate our new theory about a different type of mechanism, which we discuss below.
2. Automaticity
28
In this section we develop our own hypothesis for why these programs change youth
behavior: automaticity. This is essentially our theory for what the CBT components of these
programs are doing to help change youth behavior. Our theory is based on previous research in
psychology, which shows that people often respond to situations automatically and without
deliberation (see, for example, Kahneman 2011). These automatic responses are often adaptive
to situations that people commonly face. However, problems can arise when people misconstrue
their situation or deploy an inappropriate automatic response.
Consider two of the kinds of situations youth face: “school life” and (for lack of a better
term) “street life.” In both situations, youth have to deal with assertions of authority. Teachers
assert authority in school life by asking them to sit down or be quiet. In street life, someone
much larger than they are could assert authority by demanding their money or their phone.
The adaptive response to an assertion of authority by the teacher in school is to comply.
The youth should do what the teacher says. But street life is different. In places where formal
social control is weak, it can be adaptive to develop a reputation as someone who will fight back
when provoked to deter future victimization. For example, as Papachristos (2009, p. 79) notes:
“One of the street code’s most pervasive norms is that of retribution, a perversion of the ‘golden
rule’ stipulating that personal attacks (verbal or physical) should be avenged… Failure to act
in—or win—a given context not only diminishes one’s social standing vis-à-vis one’s opponent
but also makes one appear weak, a potential target for future street interactions” (see also
Anderson 1999). Because school life and street life differ, youth have to consider whether the
code of the street or the code of the classroom applies to a given conflict. When the teacher
asserts authority, youth have to think about whether that is a situation where it is important to
develop a reputation as someone who will fight back, or whether the conflict does not involve a
threat to reputation. If they do not distinguish between these situations, then they will always

29
comply (and risk being terrorized on the street) or they will always resist (and do poorly in
school). Youth are often able to successfully distinguish these situations, but not always. One of
the key lessons from behavioral science is that people can misconstrue what situation they are in
and deploy the wrong automatic response (Griffin and Ross 1991; Nisbett and Ross 1991).
This example illustrates our automaticity hypothesis. Automatic responses are effortless,
but not necessarily fine-tuned to a particular situation if there is variability across similar-looking
situations in what response is adaptive. And because the consequences of misconstruing the
situation may be particularly severe in highly violent, distressed urban areas, youth from
disadvantaged circumstances may face a high cost of getting an automatic assumption wrong.32
This explanation is intriguing because it has implications for intervention. It suggests that
we may be able to improve the lives of youth in distressed urban areas simply by teaching them
to be less automatic—a key component of both interventions we study here. Notice these
interventions are not about uniformly changing what the automatic responses are. Teaching
youth to always comply might help in school, but could lead to problems out of school. Instead
the programs help youth learn when they should not be automatic, and to identify situations (like
when they feel anger) where they ought to slow down and consider whether their interpretations
of the situation are correct and whether their automatic assumptions and responses are useful.
For example, the BAM program does not tell youth that they should never fight, but
rather helps them learn to distinguish between when they should versus should not fight. The
program includes a variety of exercises that teach youth how to carry out what CBT programs
call behavioral experiments, designed to help youth test their beliefs or perceptions about the
32 A similar idea in the field of linguistics refers to “code-switching” among people who speak more than one language or language variety, where the language they use helps convey group membership in a given setting (see, for example, Toribio and Bullock 2012). This requires speakers to devote more conscious attention to identification of what social or linguistic setting they are in relative to what is required of monolingual speakers. Some evidence that this type of linguistic code-switching responds to changes in the social environment comes from Rickford, et al. (2015). A sociological discussion of code-switching with respect to other behaviors is in Anderson (1999).
30
situation they face. The fist exercise helps youth recognize that their assumptions of the negative
intentions of others are not always correct—there is more situational variability than they realize.
The stick exercise helps youth recognize that situations with problems that initially look like they
are driven by other people are sometimes due to the youth’s own actions as well.
C. TESTING MECHANISMS
1. Testing existing theories from the literature
Table X explores the potential role of many commonly discussed theories in explaining
our observed intervention impacts. Our data on these candidate mechanisms come from ongoing,
bi-annual online surveys conducted in all Chicago Public Schools by the Consortium on Chicago
School Research (CCSR), designed to measure students’ perceptions of themselves and their
school environments.33 We use CCSR survey data from spring 2011, the end of the year after
the 2009–10 BAM intervention that we examined in study 1 (CCSR did not do a spring 2010
survey). The response rate on this survey among our sample is not ideal and is a few percentage
points higher for the treatment versus control groups (42% versus 38%, p<.05).
The surveys capture measures relevant to several of the most commonly discussed
theories from previous literature about non-academic determinants of life outcomes. These
include social capital, perceived importance of schooling for futures outcomes, social skills or
emotional intelligence, and two items from Duckworth and Quinn’s (2009) eight-item grit
scale.34 However, as noted above, measures of grit are highly correlated with self-control and
conscientiousness, so we cannot disentangle the influence of these different factors.
33 The 30-minute survey is designed to address a number of questions regarding school culture and climate. In spring 2011, surveys were received from around 146,000 students in the roughly 400,000 student school system, who responded online during school hours with each response registered on a Likert scale. CCSR used Rasch analysis on groups of survey items to create different aggregate measures, but here for “grit” we use the average of two Likert-scale responses and for social capital we use a single Likert scale response. We standardized all of these measures into SD units based on the observed distribution within the control group. 34 The specific survey questions for each measure are: social capital (“I have at least one teacher or adult in school that I can talk to if I have a problem”); perceived returns to education (“Classes are useful preparation for the

31
The first column of results in Table X presents experimental IV estimates of BAM
participation’s effects on these different candidate mechanisms of action (M), given by π6 in (6).
(5) Pist = Zisπ5 + Xis(t-1)β5 + γs + εist5
(6) Mist = Pistπ6 + Xis(t-1)β6 + γs + εist6
The second column reports the coefficients from using data just from the control group to
run a non-experimental regression of one of our outcomes, Y (the school engagement index
measured at the end of AY 2009–10) against each candidate mediator M in turn, controlling for
the standard set of baseline covariates and school fixed effects included in all previous models.
(7) Yist = Mistπ7 + Xis(t-1)β7 + γs + εist7 for all (i) with Zis=0
The third column reports the share of the total BAM participation effect on the schooling
outcome that could be explained by each candidate mechanism, which comes from multiplying
the (experimentally estimated) BAM → M link reported in column 1 (π6) by the (non-
experimentally estimated) M → Y link in column 2 (π7), and then dividing by the
(experimentally estimated) BAM participation effect on the schooling outcome, BAM → Y from
Table IV (π3). We obtain confidence intervals by bootstrapping. We draw 1,999 samples with
replacement, estimate each of our three key parameters, calculate the value (π6 ×π7) / π3, and then
report the 2.5th and 97.5th percentiles of the distribution from these bootstrap replications.35 The
last two columns of the table repeat this exercise for our measure of violent-crime arrests, while
results for additional outcomes are in Appendix Tables A.22 and A.23.
future,” “High school teaches valuable skills,” “Working hard in school matters for the future work force,” and “What we learn in class is useful for the future”); social skills or emotional intelligence (“I can always find a way to help end arguments,” “I am very good at working with other students,” and “I am good at helping people”); and grit / self-control / conscientiousness (“I finish whatever I begin” and “I am a hard worker”). 35 We report percentiles of the distribution rather than the standard deviation of the distribution because our estimates of π3 can be close to zero in some replications, which can cause the ratio of parameters to be very large in some cases. The percentile-based confidence interval is less susceptible to the influence of a small number of replications like this.
32
The results presented in Table X suggest that these commonly discussed mechanisms are
unlikely to explain much of the BAM impact on behavior reported in study 1. BAM participation
has the largest effects on our measures of social skills and grit, with effect sizes of 0.13 and 0.11
SD respectively, but neither is quite statistically significant. None of these estimates are very
large, however, in the sense that at most a small share of the BAM → Y effect could be
explained by the BAM → M → Y chain for each candidate mechanism in Table X.
One might wonder about the strength of our measures for M: the non-experimental
associations between the mediators and outcomes (M → Y) are modest in size, despite a growing
literature arguing for the importance of such skills. It is always possible that these survey
measures do not adequately capture the key underlying constructs. Yet, in some cases we are
using essentially the exact same measures that others have argued capture key determinants of
youth outcomes. For example, our grit measure consists of two of the eight items in Duckworth
and Quinn’s (2009) short grit scale. Using data from Cook, et al. (2015), we regress our two-item
grit measure against the eight-item grit scale from Duckworth and Quinn. The regression
coefficient is 1.02 (the correlation is 0.74), suggesting our measure is very similar to theirs.36
Moreover, the sizes of the M → Y associations in Table X are similar to those reported in
many other papers. The raw correlation in our study 1 sample between grit and GPA in 2010–11
(one element of our schooling-outcomes index) equals about 0.20, versus 0.30 in Duckworth and
Quinn’s (2009) analysis of a more diverse sample of youth (Table 7, p. 170). The modest
relationship of social capital to outcomes in our sample of minority males is consistent with the
mixed treatment effects found in previous studies of Big Brothers / Big Sisters mentoring.37
36 CCSR also provides a four-item grit scale that includes two other items that are not in the Duckworth and Quinn short grit scale; our results are qualitatively similar using that index. 37 The closest measure to violent-crime arrests in the RCT of BB / BS delivered outside of school (Grossman and Tierney 1998) is “number of times hit someone,” which showed no detectable effect in their sample of N=326 minority males (the significant impact for the overall sample is driven entirely by white males). Nor did they find a detectable impact on academic outcomes for minority males (Table 7). A study of BB / BS delivered within (rather
33
It is not obvious whether remaining measurement problems would lead our estimates to
overstate or understate the importance of these mechanisms for explaining program impacts in
our sample. On one hand, equation (7) is estimated using non-experimental (within-control-
group) variation. The mechanism measures are presumably correlated with other determinants of
youth outcomes, leading to omitted variables bias in the direction of overstating the importance
of these candidate mechanisms. On the other hand, classical measurement error would lead us to
understate the impact of the mechanism. If we reproduce our estimates averaging together social
skills and grit to reduce measurement error, our conclusions are similar. Even if we inflated our
estimates to account for measurement error and ignore omitted variables bias, these mechanisms
seem unlikely to account for much of the BAM effect on outcomes.
2. Testing the automaticity hypothesis
Finally, we present the results of testing our automaticity hypothesis, which suggest this
mechanism may be an important determinant of BAM’s impacts on youth outcomes.38 From the
sample of youth randomized to BAM versus control in 2013–14 (study 2), we recruited 490
participants (266 who had been assigned to BAM, 224 assigned to control) from nine schools in
which 1,551 youth (775 treatment, 776 control) were eligible to participate. One reason for non-
participation was that many youth in study 2 never showed up at the school CPS thought they
would attend; the response rate for youth attending study schools was 44%.
To examine how BAM changes decision-making in confrontational situations where
youth are provoked and retaliation is a possibility, and specifically whether BAM causes youth
to “slow down,” we had participants play a modified version of a real-stakes iterated dictator
game. Students were informed during lunch periods that a brief study would be conducted giving
than outside of) school found small impacts on school outcomes after 9 months, with no detectable impacts on out-of-school problem behaviors, and no significant impacts on any outcome after 15 months (Herrera, et al. 2011). 38 This experimental design was adapted from VanderMeer, et al. (2015).
34
them the chance to earn about $10. Because parental consent was required, consent forms were
handed out and made available in the school several days before we began conducting the
studies. Students could return the consent forms anytime during the duration of the study
(approximately three weeks in each school). Students who returned consent forms could
participate during their lunch period. Studies were conducted in available quiet spaces in the
schools, such as hallways and empty classrooms. Youth were told that they would be playing
with a “partner” who was another student in their school for multiple rounds (they were not told
how many rounds). Participants were led through the study by a research assistant (RA) who was
blinded to youth treatment status. RAs told participants that they would be communicating over
walkie-talkie with another RA who was standing with their “partner.” However, there was no
partner; the other RA was actually a confederate who followed a script.
Experimental economists normally, and understandably, seek to avoid use of deception in
experiments. But the design of our experiment had to account for the context: public high
schools located in some of Chicago’s highest-crime areas. In discussions with the CPS Research
Review Board (RRB) one overarching concern was that we not contribute to antagonism
between students, which might be easy to create. If we carried out the iterated dictator game task
with two actual students playing against each other and taking money from each other, there
would be the risk that not only would students ask their peers about who might have participated
in the study with them (“Who came out of the lunch room with me?”), they might also brag
about having taken money from fellow students (with those youth at the highest risk of violence
perhaps being the ones most eager to “prove something”). The first risk could have been
mitigated with modifications to the design, but the second risk would have been difficult to
mitigate. Given the RRB’s human subjects concerns, we decided with some regret that deception
was necessary.

35
In the first round, participants were given $10 in one-dollar bills in an envelope. Their
“partner” was given the chance to take some money away from the participant. The participants
heard the confederate say over the walkie-talkie that the “partner” was taking $6 from the
participant. The participant was then asked how much money they would like to take from their
partner. (So for participating in the decision-making exercise each participant received $4 from
the first round plus whatever they took in the second round.)
We expected that participants who had previously been assigned to BAM would make
slower, more deliberate decisions than participants who had been assigned to the control
conditions. We were also interested in testing whether actively trying to reduce automaticity
during the decision-making exercise itself could attenuate the BAM-control difference in
decision-making. So we randomized participants to four different versions of the task:
• A “no delay” condition, in which youth could say how much they wanted to take from
their partner as soon as they wished after the partner’s take amount was announced.
• A “distraction” condition, which was intended to get all youth (including controls) to do
part of what we believe BAM gets youth to initiate on their own—which is to slow down.
In this condition, after round 1 the participants were told to first spend 30 seconds
completing a word-search puzzle and to then state how much money they wished to take.
• A “reflection” condition, where they were told to first take 30 seconds to rate their
partner’s action on a scale from -5 (extremely selfish) to +5 (extremely generous) before
deciding how much to take from the partner.
• A “rumination” condition that got youth to slow down but then, instead of reflecting and
taking a different perspective on the event, they were given an exercise intended to
promote unhelpful thinking (rumination). Specifically they were told to take 30 seconds

36
to read over a list of adjectives and to circle the ones that represented their feelings in that
moment, with the word list including terms like rude, unfriendly, mean, and unkind.
Our automaticity hypothesis implies that under all conditions, BAM should get youth to
slow down on their own and reflect on what their optimal response would be. We should see this
most clearly in condition 1 (“no delay”). We expected to see a smaller BAM-control difference
when we externally induced both groups to slow down (as in condition 2), and a still smaller
difference when we induced youth in both groups to both slow down and reflect on the nature of
their partner’s decision (as in condition 3). We also expected condition 4 to attenuate the BAM-
control difference by prompting both groups to ruminate on how they feel, which may divert the
BAM youth from the tendency to reflect on the situation.
Unfortunately randomization across conditions did not work quite as well as we had
hoped, yielding some imbalance in baseline attributes. But within conditions there was baseline
balance for BAM versus control. So we can learn about the role of the conditions from the
difference-in-difference (how outcomes for BAM versus control differed across conditions).
Table XI shows that BAM did indeed get youth to slow down before they made a
decision. We had the RAs who were working with participants subtly time how long it took
youth to respond.39 The RAs were instructed to begin the timer immediately after asking the
participant how much of the $10 they would like to take from their partner and to stop the timer
immediately after they declared an amount. The variable is very skewed, so we report results for
the log of the time it took youth to respond (Appendix Figure A.5 shows the full distributions for
the treatment and control groups; Appendix Table A.25 presents additional results). The second
39 The RAs had stopwatches that measured time to the hundredth of a second and were asked in the data logs to write down all the digits that were displayed. RAs said to the participant, “Now, we’re giving the other player a new $10. How much of that would you like to take?” The RA was instructed to start the stopwatch immediately after they said the word “take?” and stop timing as soon as the respondent reported their preferred take amount. We have time data for 302 of the 493 total youth who participated in our decision-making exercise because during the first phase of our field work the RAs were only timing youth who were randomized to condition 1.
37
row shows that in condition 1 (where our automaticity theory makes a clean prediction that BAM
should generate more “slowing down” versus controls) the average control complier took 1.1
seconds to decide. The coefficient on BAM in our log-linear specification is 0.60, which implies
a statistically significant increase of roughly 80% in the time that youth took to decide.
If our automaticity theory is correct, and CBT causes participants to slow down their
thinking and be more reflective, then in conditions 2–4 (which try to even out the difference in
those tendencies between BAM and control groups) we should see smaller BAM effects on
response times compared to what we see in the first condition. In fact, that is what we find—the
effect of BAM was about half as large in conditions 2–4 as in condition 1. The other rows of the
table show that by prompting all youth to do what we believe BAM gets youth to do on their
own (slow down and reflect), the distraction, reflection, and even rumination conditions
succeeded in narrowing the BAM-control difference in the tendency to slow down and be less
automatic when deciding by how much to retaliate.
One potential concern is the possibility that these results are somehow an artifact of
response rates that are substantially less than 100%, but in Appendix Figure A.6 we show that
the school-specific BAM effect on response times was not systematically related to school-
specific participation rates in our decision-making exercise (that is, the effect was not driven by
schools with particularly low response rates or smaller in schools with higher response rates).
In addition, Figure II provides suggestive evidence that the schools and grades
(randomization blocks) where BAM participation was the highest may also be those where BAM
had the largest behavioral impacts and caused the most slowing down. We use interactions of
treatment assignment with randomization block as instruments to estimate the relationship
between number of BAM sessions attended (“dose”) on total arrests, as in Panel A, and in Panel
B on automaticity, or slowing down (see Kling, Liebman and Katz 2007). While the estimates
38
are somewhat imprecise, the figure suggests that the schools and grades where treatment-group
youth participated in the most BAM sessions are the same ones in which we saw the largest
increase in slowing down and reduction in criminal behavior.
How much of the total BAM effect might be explained by automaticity? We can assess
this as we did with the other mechanisms above, by calculating (π6 ×π7) / π3.40 Table XI reports
that the program’s effect on the mechanism (π6) is 0.33. The coefficient on log decision time in a
non-experimental regression using total arrests as the outcome (with data only from our control
group, controlling for block fixed effects, baseline covariates, and decision-making condition), or
π7, is -0.17 (with a 95% confidence interval of -0.37 to 0.03). With an overall BAM effect on
total arrests in year two of the study period equal to -0.17 (π3), our estimates suggest reduced
automaticity could account for a decline in arrests of (0.33×-0.17/-0.17), or about one third of the
total effect, with a 95% confidence interval that allows for this mechanism to account for up to
the entire BAM effect on arrests. This is much larger than any of the other candidate mechanisms
considered in Table X.
Our automaticity theory does not make any clear prediction about whether BAM youth
should actually retaliate less than controls in this iterated dictator game. BAM never tells youth
not to fight or retaliate when provoked, since the program recognizes that in the neighborhoods
where these youth are growing up there are indeed circumstances in which fighting and an
aggressive response may be (unfortunately) necessary and adaptive. The focus of the program
instead is to get youth to slow down and reflect on what sort of response is most adaptive for the
circumstance they are facing. Our sample thought they were playing with others in their school
and that they would play multiple rounds; it may well be they thought retaliation was adaptive.
40 The exercise here is slightly different due to the timing of our measurements. In study 1 we measured the mechanism at the end of the year after the program ended; in study 2 we measured the mechanism concurrent with the program (from April to October 2014, which spans part of each of the first and second year of BAM study 2 programming).

39
Consistent with this focus of the program, Table XI shows that we found no evidence that
BAM reduces the retaliation amount. Moreover the point estimates are generally much smaller as
a share of the CCMs compared to what we see for the estimated BAM effect on the degree to
which youth slow-down in their decision-making. And to the degree to which there are any
statistically significant relationships, they are in the direction of BAM participants, if anything,
perhaps retaliating more than controls (in condition 2). This finding would also seem to argue
against any explanation for why BAM works that emphasizes a more general or non-contingent
shift towards more pro-social or “self-controlled” behavior.
V. CONCLUSION
This paper presents results from three large-scale randomized experiments carried out in
Chicago with economically disadvantaged male youth. While the exact sets of outcomes and
patterns of results are not totally identical across all three studies, each shows sizable behavioral
responses to fairly short-duration interventions that among other things get youth to slow down
and behave less automatically in high-stakes situations. We also present some evidence
suggesting that reduced automaticity may be a key mechanism behind these results.
Our results tell us something about the effects of these specific interventions, and also
raise the possibility that automaticity might be an important explanation for elevated rates of
dropout and crime in distressed urban areas. Youth from such areas may not be responding to the
need for reduced automaticity demanded in their neighborhoods by (sufficiently) reducing
automaticity on their own. It is possible that they would develop reduced automaticity as a
natural byproduct of aging, and that the interventions we study simply accelerate this process, or
it could be that youth would never develop reduced automaticity absent the intervention. Our
study cannot answer that question, but it is an important one for future research.

40
As with all randomized experiments, there is always some question about the degree to
which these impacts generalize to other samples and settings. Because each of our three studies
was carried out with large numbers of disadvantaged male youth from distressed areas of
Chicago, they are closer to what medical researchers call “effectiveness trials” (testing
interventions at scale) than to “efficacy trials” of a model (or “hothouse”) program. Each
intervention is manualized and so in principle can be scaled up further, although further research
is needed to determine how much social context, particular staff qualities, or other factors that
might be specific to these study settings matter.
The ratios of benefits to costs from these interventions also seem to be favorable for
scaling up. The costs of these interventions are modest; our best administrative cost estimates are
$1,100 and $1,850 per participant per year in study 1 and 2, respectively, and about $60 per
juvenile detention spell in study 3 (all in 2010 dollars).41 We focus on calculating benefits for
BAM study 1, where we have the most complete (and long-term) data on outcomes. Appendix
Table A.26 reports a range of IV estimates for the effects of BAM participation using the sum of
the social costs of crime during the program year as the dependent variable. The results imply
benefit-cost ratios that range from 5-to-1 up to 30-to-1, depending on how we monetize the
societal costs of crime and what measure we use for program participation. If the improvements
in participants’ high school graduation lead to other future benefits such as increased earnings or
longer life expectancies, these estimates may understate the full value of the program’s social
benefits (see Appendix C Section V for more detailed discussion).
Traditionally, social policy interventions for youth have tried to improve outcomes by
investing (often substantial) resources in improving the academic or vocational skills of young
41 The difference in the cost per youth for BAM in study 1 and study 2 is driven by Youth Guidance’s efforts to provide additional training and supervision of counselors to help with implementation fidelity. The JTDC curriculum is much cheaper because the building, youth, and staff are already there; the only program-specific costs are for staff training and a small increase in salaries from hiring better educated staff (see Appendix B).

41
people or changing the long-term benefits or costs associated with crime or schooling, with
impacts that have typically been quite limited. By comparison, the rate of return to investing in
helping youth make better judgments and decisions in high-stakes moments seems promising.
UNIVERSITY OF PENNSYLVANIA UNIVERSITY OF CHICAGO NORTHWESTERN UNIVERSITY AND NBER UNIVERSITY OF CHICAGO AND NBER HARVARD UNIVERSITY AND NBER UNIVERSITY OF CHICAGO
42
REFERENCES
"Doe V. Cook County," in F.3d, (United States Court of Appeals, Seventh Circuit, 2015).
Aizer, Anna, and Joseph J Doyle, "Juvenile Incarceration and Adult Outcomes: Evidence from Randomly Assigned Judgest," Quarterly Journal of Economics, 130 (2015), 759-803.
Allensworth, Elaine Marie, and John Q Easton, The On-Track Indicator as a Predictor of High School Graduation (Consortium on Chicago School Research, University of Chicago, 2005).
Anderson, Elijah, Code of the Street (New York: Norton, 1999).
Anderson, Michael L, "Multiple Inference and Gender Differences in the Effects of Early Intervention: A Reevaluation of the Abecedarian, Perry Preschool, and Early Training Projects," Journal of the American Statistical Association, 103 (2008).
Angrist, Joshua D, Guido W Imbens, and Donald B Rubin, "Identification of Causal Effects Using Instrumental Variables," Journal of the American Statistical Association, 91 (1996), 444-455.
Beck, Judith S, Cognitive Therapy: Basics and Beyond (The Guilford Press, 2011).
Benjamini, Yoav, and Yosef Hochberg, "Controlling the False Discovery Rate: A Practical and Powerful Approach to Multiple Testing," Journal of the Royal Statistical Society, Series B, Methodological, (1995), 289-300.
Benjamini, Yoav, Abba M Krieger, and Daniel Yekutieli, "Adaptive Linear Step-up Procedures That Control the False Discovery Rate," Biometrika, 93 (2006), 491-507.
Blattman, Christopher, Julian C Jamison, and Margaret Sheridan, "Reducing Crime and Violence: Experimental Evidence on Adult Noncognitive Investments in Liberia," (Cambridge, MA: National Bureau of Economic Research, Working Paper No. 21204, 2015).
Bloom, Howard S, "Accounting for No-Shows in Experimental Evaluation Designs," Evaluation Review, 8 (1984), 225-246.
Coleman, James S, "Social Capital in the Creation of Human Capital," American Journal of Sociology, (1988), S95-S120.
Cook, Philip J, Kenneth Dodge, George Farkas, Roland G Fryer, Jonathan Guryan, Jens Ludwig, and Susan Mayer, "Not Too Late: Improving Academic Outcomes for Disadvantaged Youth," (Evanston, IL: Northwestern University Institute for Policy Research, Working Paper Series, 2015).
Cunningham, Tom, "Hierarchical Aggregation of Information and Decision-Making," Unpublished Manuscript, (2015).
Deming, David J, "The Growing Importance of Social Skills in the Labor Market," (Cambridge, MA: National Bureau of Economic Research, Working Paper No. 21473, 2015).

43
Duckworth, Angela L, Christopher Peterson, Michael D Matthews, and Dennis R Kelly, "Grit: Perseverance and Passion for Long-Term Goals," Journal of Personality and Social Psychology, 92 (2007), 1087.
Duckworth, Angela L, and Patrick D Quinn, "Development and Validation of the Short Grit Scale (Grit–S)," Journal of Personality Assessment, 91 (2009), 166-174.
Duckworth, Angela L, and Martin EP Seligman, "Self-Discipline Outdoes Iq in Predicting Academic Performance of Adolescents," Psychological Science, 16 (2005), 939-944.
Ellis, Albert, "Outcome of Employing Three Techniques of Psychotherapy," Journal of Clinical Psychology, (1957).
Ellis, Albert, and Robert A Harper, A New Guide to Rational Living (Prentice-Hall, 1975).
Fudenberg, Drew, and David K Levine, "A Dual-Self Model of Impulse Control," The American Economic Review, (2006), 1449-1476.
Griffin, Dale W, and Lee Ross, "Subjective Construal, Social Inference, and Human Misunderstanding," Advances in Experimental Social Psychology, 24 (1991), 319-359.
Grossman, Jean Baldwin, and Joseph P Tierney, "Does Mentoring Work? An Impact Study of the Big Brothers Big Sisters Program," Evaluation Review, 22 (1998), 403-426.
Heckman, James J, and Tim Kautz, "Fostering and Measuring Skills: Interventions That Improve Character and Cognition," (Cambridge, MA: National Bureau of Economic Research, Working Paper No. 19656, 2013).
Heller, Sara, Harold A Pollack, Roseanna Ander, and Jens Ludwig, "Preventing Youth Violence and Dropout: A Randomized Field Experiment," (Cambridge, MA: National Bureau of Economic Research, Working Paper No. 19014, 2013).
Herrera, Carla, Jean Baldwin Grossman, Tina J Kauh, and Jennifer McMaken, "Mentoring in Schools: An Impact Study of Big Brothers Big Sisters School Based Mentoring," Child Development, 82 (2011), 346-361.
Jensen, Robert, "The (Perceived) Returns to Education and the Demand for Schooling," The Quarterly Journal of Economics, 125 (2010), 515-548.
Kahneman, Daniel, Thinking, Fast and Slow (Macmillan, 2011).
Katz, Lawrence F, Jeffrey R Kling, and Jeffrey B Liebman, "Moving to Opportunity in Boston: Early Results of a Randomized Mobility Experiment," Quarterly Journal of Economics, (2001), 607-654.
Kling, Jeffrey R, Jeffrey B Liebman, and Lawrence F Katz, "Experimental Analysis of Neighborhood Effects," Econometrica, 75 (2007), 83-119.
Manski, Charles F, "Dynamic Choice in Social Settings: Learning from the Experiences of Others," Journal of Econometrics, 58 (1993), 121-136.
44
Maultsby, Maxie C. Jr., Help Yourself to Happiness through Rational Self-Counseling (New York, New York: Institute for Rational-Emotive Therapy, 1975).
---, Coping Better, Anytime, Anywhere: The Handbook of Rational Self-Counseling (Alexandria, VA: RBT Center LLC, 1990).
Moffitt, Terrie E, Louise Arseneault, Daniel Belsky, Nigel Dickson, Robert J Hancox, HonaLee Harrington, Renate Houts, Richie Poulton, Brent W Roberts, and Stephen Ross, "A Gradient of Childhood Self-Control Predicts Health, Wealth, and Public Safety," Proceedings of the National Academy of Sciences, (2011), 201010076.
Nisbett, Richard E, and Lee Ross, The Person and the Situation (New York: McGraw Hill, 1991).
Papachristos, Andrew V, "Murder by Structure: Dominance Relations and the Social Structure of Gang Homicide1," American Journal of Sociology, 115 (2009), 74-128.
Rickford, John R, Greg J Duncan, Lisa A Gennetian, Ray Yun Gou, Rebecca Greene, Lawrence F Katz, Ronald C Kessler, Jeffrey R Kling, Lisa Sanbonmatsu, Andres E Sanchez-Ordoñez, Matthew Sciandra, Ewart Thomas, and Jens Ludwig, "Neighborhood Effects on Use of African-American Vernacular English," Proceedings of the National Academy of Sciences, 112 (2015), 11817-11822.
Ross, Lee, and Richard E Nisbett, The Person and the Situation: Perspectives of Social Psychology (Pinter & Martin Publishers, 2011).
Rush, Augustus J, Aaron T Beck, Maria Kovacs, and Steven Hollon, "Comparative Efficacy of Cognitive Therapy and Pharmacotherapy in the Treatment of Depressed Outpatients," Cognitive Therapy and Research, 1 (1977), 17-37.
Seroczynski, A. D., William N Evans, Amy D Jobst, Luke Horvath, and Giuliana Carozza, "Reading for Life and Adolescent Re-Arrest: Evaluating a Unique Juvenile Diversion Program," in 2015 Fall Conference: The Golden Age of Evidence-Based Policy, (APPAM, 2015).
Toribio, Almeida Jacqueline, and Barbara E Bullock, The Cambridge Handbook of Linguistic Code-Switching (Cambridge University Press, 2012).
Tough, Paul, How Children Succeed (Random House, 2013).
VanderMeer, James, Christine Hosey, Nicholas Epley, and Boaz Keysar, "Striking Back with a Heavier Hand: Reflexive Escalation in Negative Reciprocity," University of Chicago, Unpublished Manuscript, (2015).
Westfall, Peter H, and Stanley S Young, Resampling-Based Multiple Testing: Examples and Methods for P-Value Adjustment (New York: John Wiley & Sons, 1993).
Wilson, William Julius, The Truly Disadvantaged: The Inner City, the Underclass, and Public Policy (1987).

45
Young, Alwyn, "Channeling Fisher: Randomization Tests and the Statistical Insignificance of Seemingly Significant Experimental Results," (London, UK: London School of Economics, Working Paper, 2015).
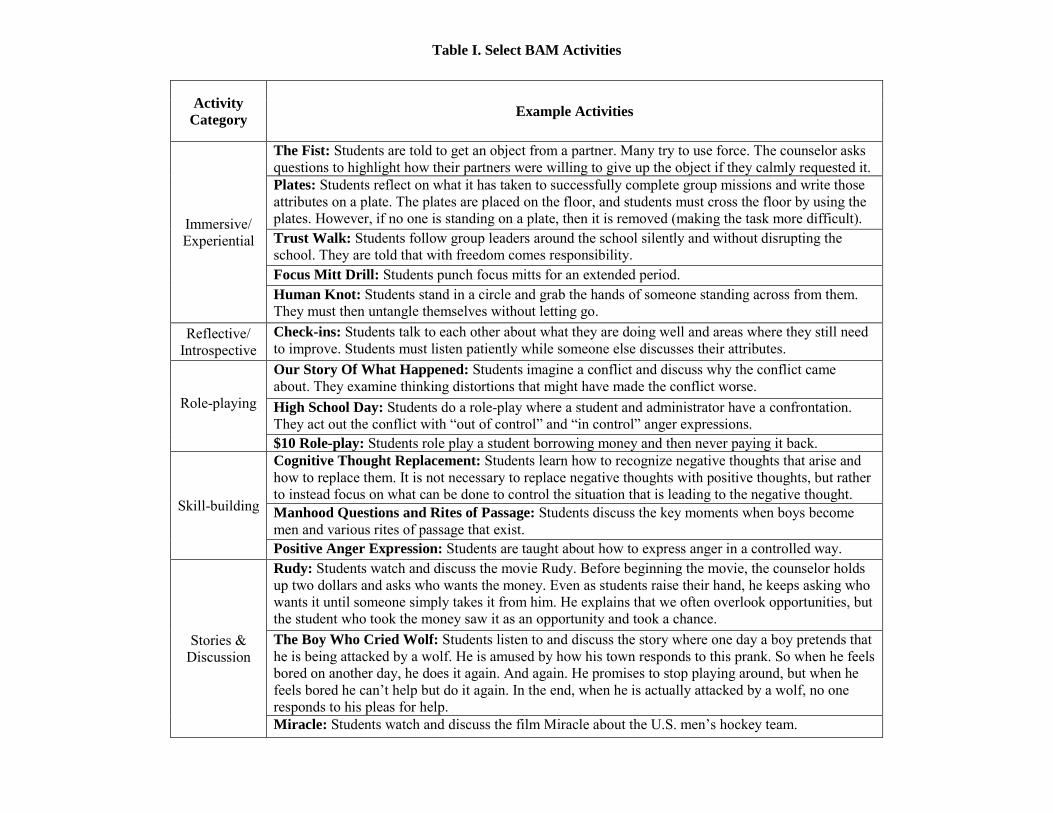
Table I. Select BAM Activities
Activity Category Example Activities
Immersive/ Experiential
The Fist: Students are told to get an object from a partner. Many try to use force. The counselor asks questions to highlight how their partners were willing to give up the object if they calmly requested it. Plates: Students reflect on what it has taken to successfully complete group missions and write those attributes on a plate. The plates are placed on the floor, and students must cross the floor by using the plates. However, if no one is standing on a plate, then it is removed (making the task more difficult). Trust Walk: Students follow group leaders around the school silently and without disrupting the school. They are told that with freedom comes responsibility. Focus Mitt Drill: Students punch focus mitts for an extended period. Human Knot: Students stand in a circle and grab the hands of someone standing across from them. They must then untangle themselves without letting go.
Reflective/ Introspective
Check-ins: Students talk to each other about what they are doing well and areas where they still need to improve. Students must listen patiently while someone else discusses their attributes.
Role-playing
Our Story Of What Happened: Students imagine a conflict and discuss why the conflict came about. They examine thinking distortions that might have made the conflict worse. High School Day: Students do a role-play where a student and administrator have a confrontation. They act out the conflict with “out of control” and “in control” anger expressions. $10 Role-play: Students role play a student borrowing money and then never paying it back.
Skill-building
Cognitive Thought Replacement: Students learn how to recognize negative thoughts that arise and how to replace them. It is not necessary to replace negative thoughts with positive thoughts, but rather to instead focus on what can be done to control the situation that is leading to the negative thought. Manhood Questions and Rites of Passage: Students discuss the key moments when boys become men and various rites of passage that exist. Positive Anger Expression: Students are taught about how to express anger in a controlled way.
Stories & Discussion
Rudy: Students watch and discuss the movie Rudy. Before beginning the movie, the counselor holds up two dollars and asks who wants the money. Even as students raise their hand, he keeps asking who wants it until someone simply takes it from him. He explains that we often overlook opportunities, but the student who took the money saw it as an opportunity and took a chance. The Boy Who Cried Wolf: Students listen to and discuss the story where one day a boy pretends that he is being attacked by a wolf. He is amused by how his town responds to this prank. So when he feels bored on another day, he does it again. And again. He promises to stop playing around, but when he feels bored he can’t help but do it again. In the end, when he is actually attacked by a wolf, no one responds to his pleas for help. Miracle: Students watch and discuss the film Miracle about the U.S. men’s hockey team.

Table II. Select JTDC Activities
Activity Category Example Activities
Reflective/ Introspective
Self-talk: Students are taught about how the mind always tries to make sense of what is going on and how these thoughts drive our behavior. For example, the counselor might hold out his hand and see how people respond. He then explains how the students’ minds have an automatic interpretation of and reaction to his outstretched hand. Hot Button Situations: Students talk about situations that make them upset. They describe the situation and their thoughts in that situation. They identify elements of “hot” self-talk that leads to negative consequences and they identify hot button situations that trigger these thoughts. Camera Check: Students imagine a hot button situation and then describe how they would navigate it. They then imagine the situation again from a neutral outsider perspective. Rational Self Analysis (RSA): After anti-social behavior, students complete an RSA, writing down the facts of the incident, identifying what self-talk/feelings led to the behavior, reporting what a camera would have seen, and brainstorming alternative/more adaptive self-talk. Youth then process their RSA with staff and discuss the new self-talk options they have developed.
Skill-building
Goal Setting: Students are encouraged to make one concrete statement about something they want to do better or differently. Goals and Choices: Students discuss what they want versus what they need. And they discuss how goals, wants, and needs are always set internally. No one else can set them for you. Students talk about “big wins” that they want to achieve and think about how they can break down long-term goals into shorter, more manageable pieces to help them achieve their goals. Keeping Cool When You Get Angry: Students discuss how situations can drive angry self-talk, which leads to negative outcomes. They are taught about various cognitive distortions. They then learn techniques to physically calm down and to replace negative or angry thoughts. Me Mode and We Mode: Students discuss elements of self-talk that are focused only on one’s own needs instead of other people’s needs. Problem Solving: Students are given a 6-step approach for solving problems that involves identifying the problem, thinking about several solutions, and picking the best solution.
Stories & Discussion
Thinking Patterns: Students are shown several optical illusions that can be seen in two ways. A lesson follows about how the mind sometimes only sees one interpretation or how it only sees what it expects to see. Students fill out a sheet on their expectations about their lives and basic rules for their lives. Moral Development Groups: Students are presented with morally ambiguous situations, and are asked to identify various potential outcomes for themselves and others based on different responses.
Other Drugs and Alcohol: Students use the framework they’ve developed to specifically focus on situations involving drugs and alcohol.
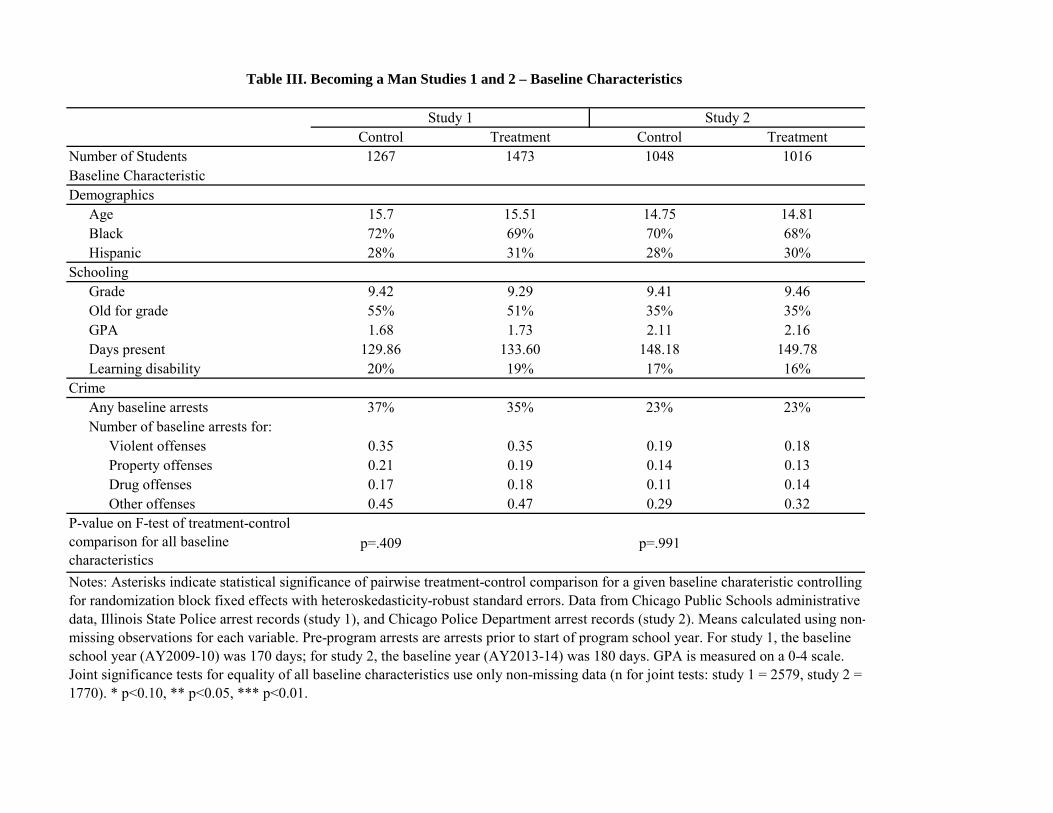
Control Treatment Control TreatmentNumber of Students 1267 1473 1048 1016Baseline CharacteristicDemographics
Age 15.7 15.51 14.75 14.81Black 72% 69% 70% 68%Hispanic 28% 31% 28% 30%
SchoolingGrade 9.42 9.29 9.41 9.46Old for grade 55% 51% 35% 35%GPA 1.68 1.73 2.11 2.16Days present 129.86 133.60 148.18 149.78Learning disability 20% 19% 17% 16%
CrimeAny baseline arrests 37% 35% 23% 23%Number of baseline arrests for:
Violent offenses 0.35 0.35 0.19 0.18Property offenses 0.21 0.19 0.14 0.13Drug offenses 0.17 0.18 0.11 0.14Other offenses 0.45 0.47 0.29 0.32
P-value on F-test of treatment-control comparison for all baseline characteristics
p=.409 p=.991
Notes: Asterisks indicate statistical significance of pairwise treatment-control comparison for a given baseline charateristic controlling for randomization block fixed effects with heteroskedasticity-robust standard errors. Data from Chicago Public Schools administrative data, Illinois State Police arrest records (study 1), and Chicago Police Department arrest records (study 2). Means calculated using non-missing observations for each variable. Pre-program arrests are arrests prior to start of program school year. For study 1, the baseline school year (AY2009-10) was 170 days; for study 2, the baseline year (AY2013-14) was 180 days. GPA is measured on a 0-4 scale. Joint significance tests for equality of all baseline characteristics use only non-missing data (n for joint tests: study 1 = 2579, study 2 = 1770). * p<0.10, ** p<0.05, *** p<0.01.
Study 1 Study 2
Table III. Becoming a Man Studies 1 and 2 – Baseline Characteristics

Control Mean Intention to Treat Effect of Participation (IV) Control Complier Mean
School Engagement Index 0 0.0569*** 0.1367*** 0.222(0.0215) (0.0511)
Total arrests per youth per year 0.699 -0.0778* -0.1869* 0.672(0.0456) (0.1087)
Violent 0.167 -0.0345** -0.0829** 0.186(0.0165) (0.0394)
Property 0.077 0.0048 0.0116 0.066(0.0127) (0.0303)
Drug 0.151 0.0013 0.0032 0.097(0.0177) (0.0422)
Other 0.305 -0.0495* -0.1188* 0.323(0.0272) (0.0648)
School Engagement Index 0 0.0782*** 0.1878*** 0.040(0.0215) (0.0514)
Total arrests per youth per year 0.595 -0.0643 -0.1543 0.606(0.0420) (0.1000)
Violent 0.11 0.0006 0.0013 0.092(0.0143) (0.0340)
Property 0.057 -0.0034 -0.0082 0.052(0.0103) (0.0245)
Drug 0.164 -0.0196 -0.0471 0.173(0.0194) (0.0461)
Other 0.264 -0.0418 -0.1004 0.288(0.0259) (0.0617)
School Engagement Index 0 0.0058 0.0117 0.221(0.0248) (0.0488)
Total arrests per youth per year 0.591 -0.0806 -0.1614 0.630(0.0506) (0.0999)
Violent 0.119 -0.0180 -0.0361 0.121(0.0161) (0.0318)
Property 0.073 -0.0078 -0.0157 0.075(0.0129) (0.0253)
Drug 0.126 -0.0153 -0.0307 0.168(0.0233) (0.0459)
Other 0.273 -0.0394 -0.0789 0.266(0.0293) (0.0579)
School Engagement Index 0 0.0501** 0.0993** 0.081(0.0252) (0.0490)
Total arrests per youth per year 0.383 -0.0841** -0.1670** 0.471(0.0392) (0.0771)
Violent 0.079 -0.0276* -0.0549* 0.110(0.0155) (0.0303)
Property 0.046 -0.0018 -0.0036 0.062(0.0101) (0.0197)
Drug 0.094 -0.0147 -0.0292 0.115(0.0171) (0.0335)
Other 0.163 -0.0400* -0.0793* 0.183(0.0221) (0.0434)
Table IV. Becoming a Man Studies 1 and 2 – Effects on Youth Outcomes
BAM Study 1 (Program Year 2009-10, n = 2,740)
BAM Study 2 (Program Years 2013-14 & 2014-15, n = 2,064)
Notes: Baseline covariates and randomization block fixed effects included in all model specifications (see text). Heteroskedasticity-robust standard errors in parentheses. School engagement index is equal to an unweighted average of days present, GPA, and enrollment status at end of school year, all normalized to Z-score form using control group's distribution. Year 1 arrest data from start of program school year until start of following school year for both studies. For study 1, the year 2 arrest data runs through July 18 (capturing a ~10 month window) while for study 2, year 2 arrest data run through March 31st (~8 months). * p<0.10, ** p<0.05, *** p<0.01.
Year 1 (program offered)
Year 1 (program offered)
Year 2 (program not offered)
Year 2 (program offered)
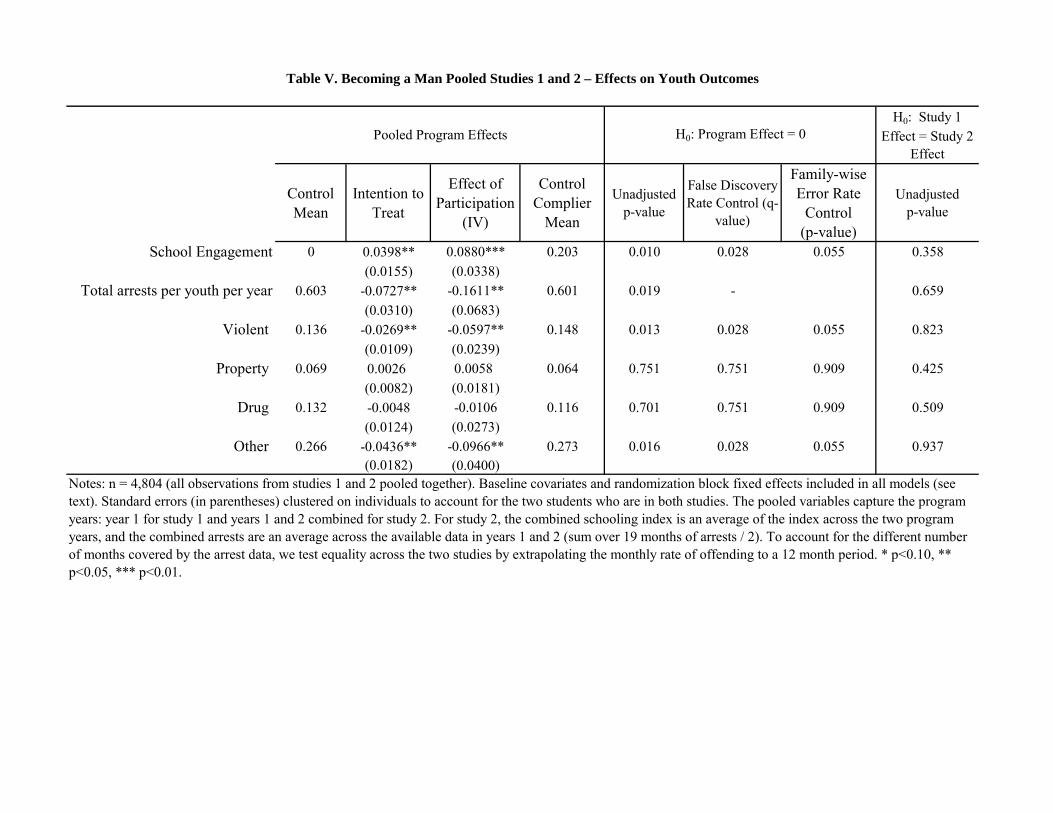
H0: Study 1 Effect = Study 2
Effect
Control Mean
Intention to Treat
Effect of Participation
(IV)
Control Complier
Mean
Unadjusted p-value
False Discovery Rate Control (q-
value)
Family-wise Error Rate
Control(p-value)
Unadjusted p-value
School Engagement 0 0.0398** 0.0880*** 0.203 0.010 0.028 0.055 0.358(0.0155) (0.0338)
Total arrests per youth per year 0.603 -0.0727** -0.1611** 0.601 0.019 - 0.659(0.0310) (0.0683)
Violent 0.136 -0.0269** -0.0597** 0.148 0.013 0.028 0.055 0.823(0.0109) (0.0239)
Property 0.069 0.0026 0.0058 0.064 0.751 0.751 0.909 0.425(0.0082) (0.0181)
Drug 0.132 -0.0048 -0.0106 0.116 0.701 0.751 0.909 0.509(0.0124) (0.0273)
Other 0.266 -0.0436** -0.0966** 0.273 0.016 0.028 0.055 0.937(0.0182) (0.0400)
Pooled Program Effects H0: Program Effect = 0
Table V. Becoming a Man Pooled Studies 1 and 2 – Effects on Youth Outcomes
Notes: n = 4,804 (all observations from studies 1 and 2 pooled together). Baseline covariates and randomization block fixed effects included in all models (see text). Standard errors (in parentheses) clustered on individuals to account for the two students who are in both studies. The pooled variables capture the program years: year 1 for study 1 and years 1 and 2 combined for study 2. For study 2, the combined schooling index is an average of the index across the two program years, and the combined arrests are an average across the available data in years 1 and 2 (sum over 19 months of arrests / 2). To account for the different number of months covered by the arrest data, we test equality across the two studies by extrapolating the monthly rate of offending to a 12 month period. * p<0.10, ** p<0.05, *** p<0.01.

High School Graduation Measures Control Mean Intention to Treat Effect of
Participation (IV) Control Complier
Mean0.339 0.0297* 0.0714* 0.382
(0.0161) (0.0383)
0.414 0.0240 0.0577 0.467(0.0167) (0.0397)
0.582 0.0355** 0.0853** 0.587(0.0170) (0.0406)
Table VI. Becoming a Man Study 1 – Effects on High School Graduation
Notes: n = 2,740. Table measures graduation from Chicago Public Schools (CPS). First row counts graduation as receipt of diploma on time relative to grade at time of randomization, second and third rows measure graduation status by end of our study period (spring 2015), first assuming anyone who left the district did not graduate (second row) then assuming all 474 verified out-of-district transfers did graduate (third row). Baseline covariates and randomization block fixed effects included in all models (see text). Heteroskedasticity-robust standard errors in parentheses. * p<0.10, ** p<0.05, *** p<0.01.
Graduated on time
Ever graduated (transfers = dropouts)
Ever graduated (transfers = graduates)
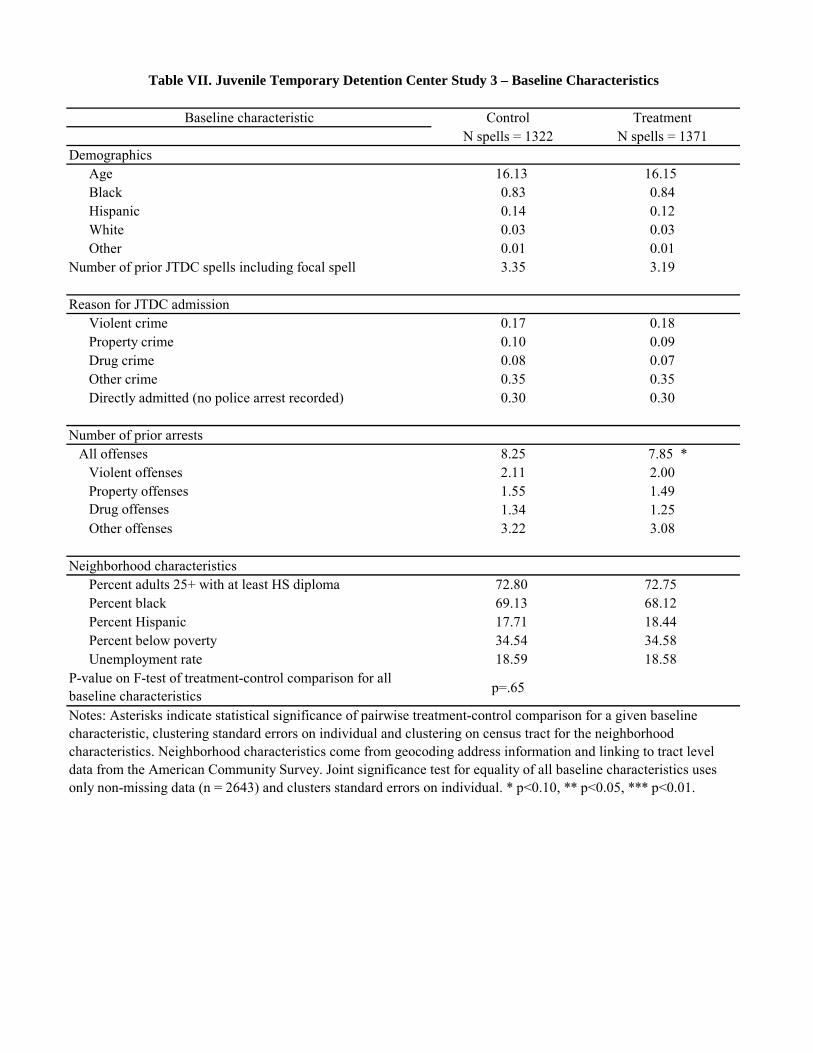
Baseline characteristic Control TreatmentN spells = 1322 N spells = 1371
DemographicsAge 16.13 16.15 Black 0.83 0.84 Hispanic 0.14 0.12 White 0.03 0.03 Other 0.01 0.01
Number of prior JTDC spells including focal spell 3.35 3.19
Reason for JTDC admissionViolent crime 0.17 0.18 Property crime 0.10 0.09 Drug crime 0.08 0.07 Other crime 0.35 0.35 Directly admitted (no police arrest recorded) 0.30 0.30
Number of prior arrestsAll offenses 8.25 7.85 *
Violent offenses 2.11 2.00 Property offenses 1.55 1.49 Drug offenses 1.34 1.25 Other offenses 3.22 3.08
Neighborhood characteristicsPercent adults 25+ with at least HS diploma 72.80 72.75 Percent black 69.13 68.12 Percent Hispanic 17.71 18.44 Percent below poverty 34.54 34.58 Unemployment rate 18.59 18.58
P-value on F-test of treatment-control comparison for all baseline characteristics p=.65
Notes: Asterisks indicate statistical significance of pairwise treatment-control comparison for a given baseline characteristic, clustering standard errors on individual and clustering on census tract for the neighborhood characteristics. Neighborhood characteristics come from geocoding address information and linking to tract level data from the American Community Survey. Joint significance test for equality of all baseline characteristics uses only non-missing data (n = 2643) and clusters standard errors on individual. * p<0.10, ** p<0.05, *** p<0.01.
Table VII. Juvenile Temporary Detention Center Study 3 – Baseline Characteristics

Months Since Release 2 4 6 8 10 12 14 16 18
Effect of Participation (IV) -0.1342** -0.1893*** -0.1984*** -0.2010*** -0.1764** -0.1689** -0.1911*** -0.1598** -0.1643**(0.0682) (0.0734) (0.0735) (0.0722) (0.0704) (0.0690) (0.0683) (0.0673) (0.0669)
Control Complier Mean 0.345 0.563 0.681 0.738 0.733 0.768 0.793 0.790 0.795
Effect of Participation (IV) -0.1633* -0.3295*** -0.3411** -0.4739*** -0.5353*** -0.5286** -0.6911*** -0.7031*** -0.7045***(0.0835) (0.1235) (0.1493) (0.1746) (0.1956) (0.2148) (0.2331) (0.2464) (0.2522)
Control Complier Mean 0.387 0.816 1.041 1.386 1.578 1.734 1.995 2.117 2.196
Effect of Participation (IV) -0.1819 -0.3323* -0.2656 -0.4036 -0.5434* -0.5681 -0.6757* -0.6610 -0.6595(0.1168) (0.1803) (0.2247) (0.2702) (0.3191) (0.3574) (0.4019) (0.4382) (0.4615)
Control Complier Mean 0.653 1.346 1.855 2.486 3.063 3.497 3.998 4.420 4.803
Panel A: Effect on probability of re-admission by X months
Table VIII. JTDC Study 3 – Treatment Effect on Measures of Recidivism within Given Number of Months since ReleaseSample of Youth With Complete 18-Month Follow-Up Data
Notes: n = 2,693. Top panel presents results from linear probability model with dependent variable indicating whether youth returned to JTDC within X months; average marginal effects from probit model are similar. Some individuals have multiple spells and provide multiple data points in the sample. We present robust standard errors clustered on the individual. LATE operationalizes participation as spending more than 5% of a stay in a CBT unit. All regressions include baseline covariates and day-of-admission fixed effects. * p<0.1, ** p<0.05, *** p<0.01.
Panel C: Effect on number of times youth readmitted or rearrested within X months
Panel B: Effect on number of times youth readmitted within X months
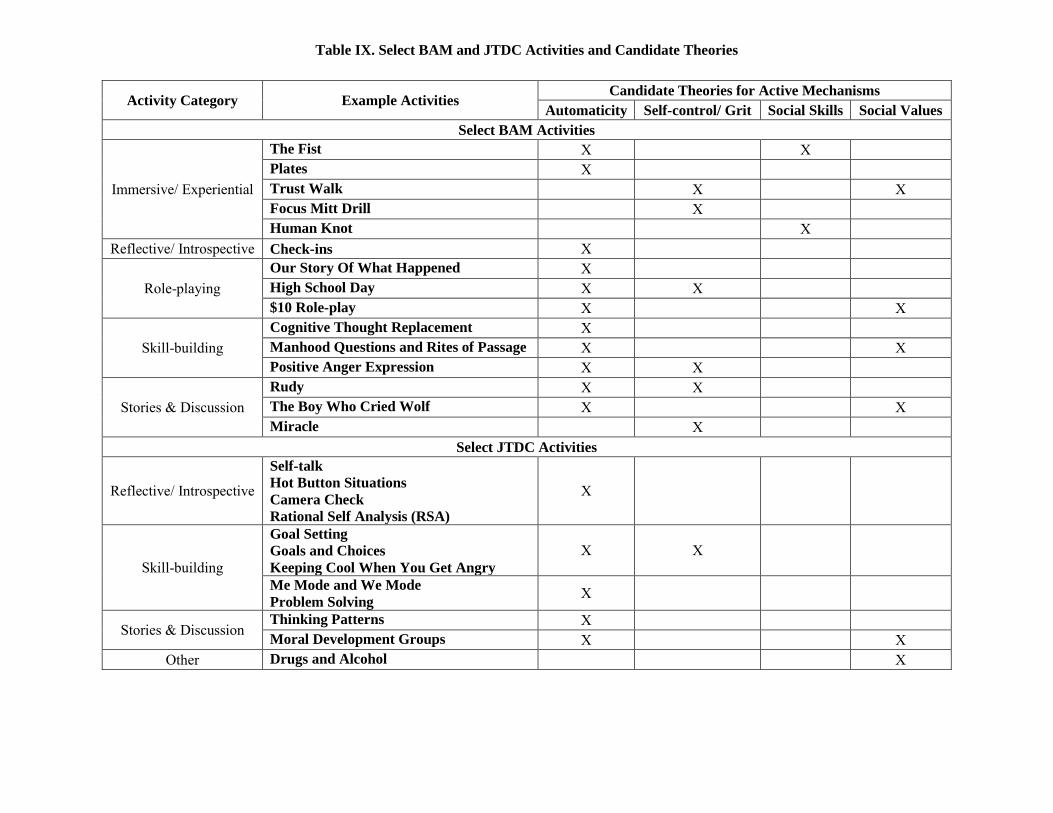
Table IX. Select BAM and JTDC Activities and Candidate Theories
Activity Category Example Activities Candidate Theories for Active Mechanisms
Automaticity Self-control/ Grit Social Skills Social Values Select BAM Activities
Immersive/ Experiential
The Fist X X Plates X Trust Walk X X Focus Mitt Drill X Human Knot X
Reflective/ Introspective Check-ins X
Role-playing Our Story Of What Happened X High School Day X X $10 Role-play X X
Skill-building Cognitive Thought Replacement X Manhood Questions and Rites of Passage X X Positive Anger Expression X X
Stories & Discussion Rudy X X The Boy Who Cried Wolf X X Miracle X
Select JTDC Activities
Reflective/ Introspective
Self-talk Hot Button Situations Camera Check Rational Self Analysis (RSA)
X
Skill-building
Goal Setting Goals and Choices Keeping Cool When You Get Angry
X X
Me Mode and We Mode Problem Solving X
Stories & Discussion Thinking Patterns X Moral Development Groups X X
Other Drugs and Alcohol X
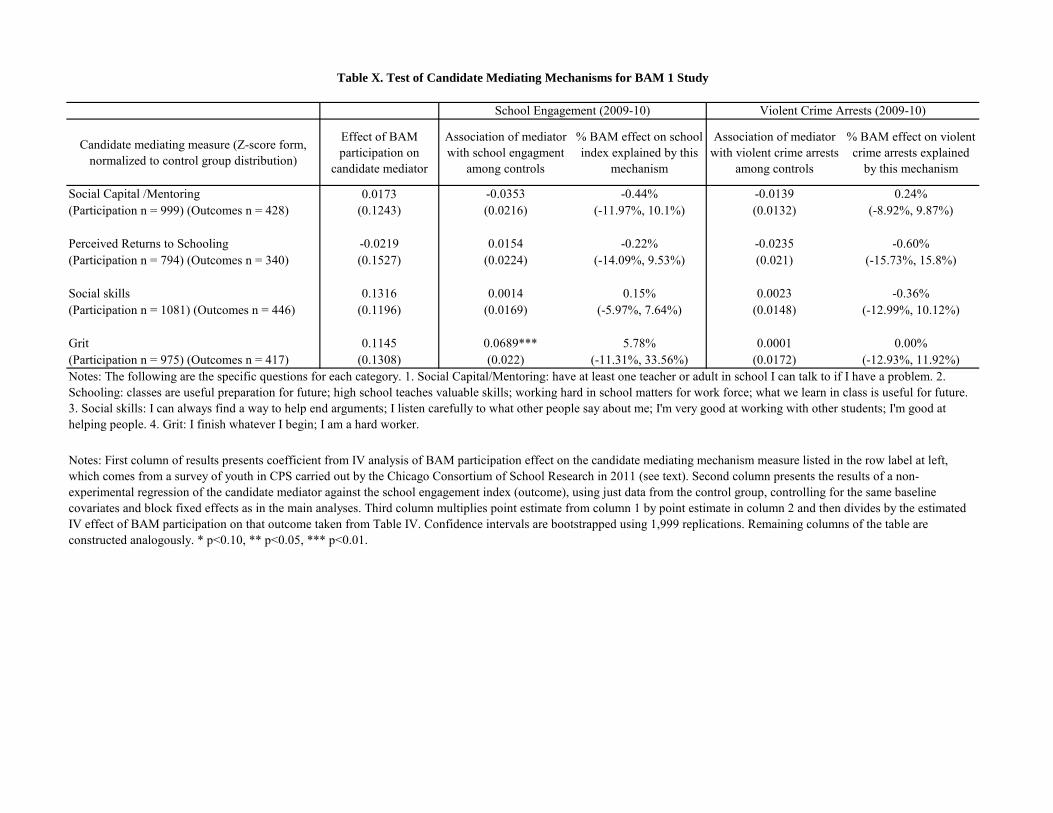
Candidate mediating measure (Z-score form, normalized to control group distribution)
Effect of BAM participation on
candidate mediator
Association of mediator with school engagment
among controls
% BAM effect on school index explained by this
mechanism
Association of mediator with violent crime arrests
among controls
% BAM effect on violent crime arrests explained
by this mechanism
Social Capital /Mentoring 0.0173 -0.0353 -0.44% -0.0139 0.24%(Participation n = 999) (Outcomes n = 428) (0.1243) (0.0216) (-11.97%, 10.1%) (0.0132) (-8.92%, 9.87%)
Perceived Returns to Schooling -0.0219 0.0154 -0.22% -0.0235 -0.60%(Participation n = 794) (Outcomes n = 340) (0.1527) (0.0224) (-14.09%, 9.53%) (0.021) (-15.73%, 15.8%)
Social skills 0.1316 0.0014 0.15% 0.0023 -0.36%(Participation n = 1081) (Outcomes n = 446) (0.1196) (0.0169) (-5.97%, 7.64%) (0.0148) (-12.99%, 10.12%)
Grit 0.1145 0.0689*** 5.78% 0.0001 0.00%(Participation n = 975) (Outcomes n = 417) (0.1308) (0.022) (-11.31%, 33.56%) (0.0172) (-12.93%, 11.92%)
Table X. Test of Candidate Mediating Mechanisms for BAM 1 Study
Notes: First column of results presents coefficient from IV analysis of BAM participation effect on the candidate mediating mechanism measure listed in the row label at left, which comes from a survey of youth in CPS carried out by the Chicago Consortium of School Research in 2011 (see text). Second column presents the results of a non-experimental regression of the candidate mediator against the school engagement index (outcome), using just data from the control group, controlling for the same baseline covariates and block fixed effects as in the main analyses. Third column multiplies point estimate from column 1 by point estimate in column 2 and then divides by the estimated IV effect of BAM participation on that outcome taken from Table IV. Confidence intervals are bootstrapped using 1,999 replications. Remaining columns of the table are constructed analogously. * p<0.10, ** p<0.05, *** p<0.01.
School Engagement (2009-10) Violent Crime Arrests (2009-10)
Notes: The following are the specific questions for each category. 1. Social Capital/Mentoring: have at least one teacher or adult in school I can talk to if I have a problem. 2. Schooling: classes are useful preparation for future; high school teaches valuable skills; working hard in school matters for work force; what we learn in class is useful for future. 3. Social skills: I can always find a way to help end arguments; I listen carefully to what other people say about me; I'm very good at working with other students; I'm good at helping people. 4. Grit: I finish whatever I begin; I am a hard worker.
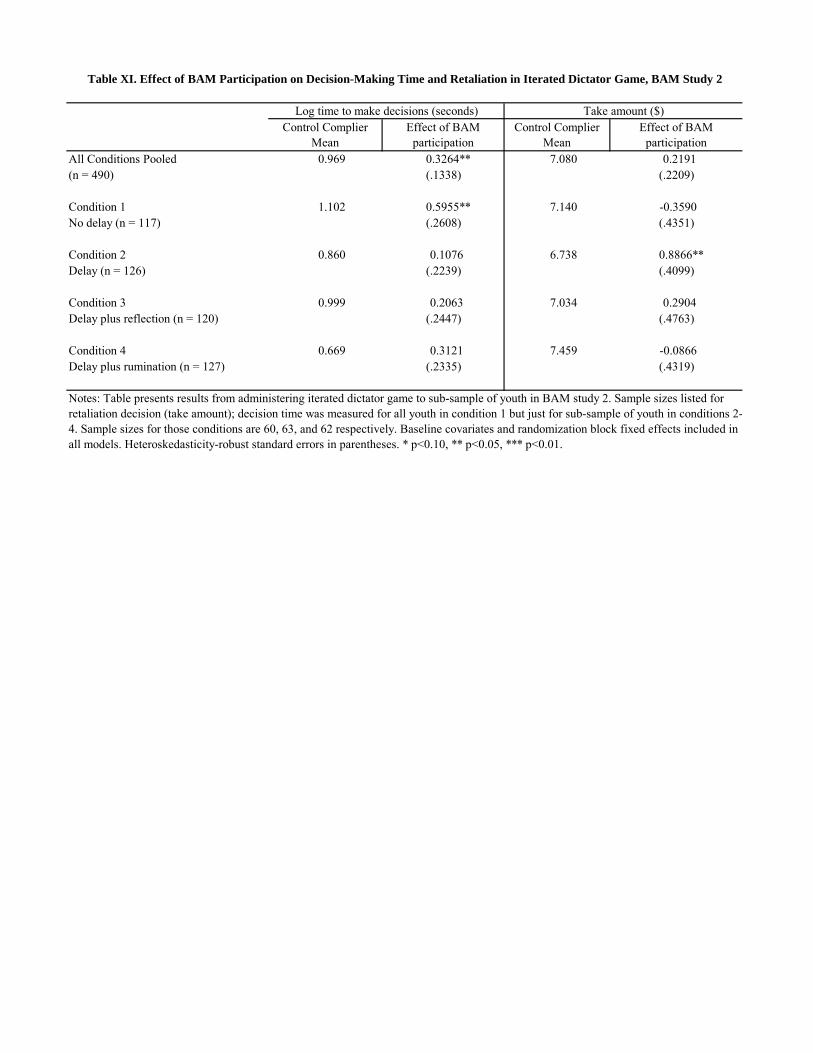
Control Complier Mean
Effect of BAM participation
Control Complier Mean
Effect of BAM participation
All Conditions Pooled 0.969 0.3264** 7.080 0.2191 (n = 490) (.1338) (.2209)
Condition 1 1.102 0.5955** 7.140 -0.3590 No delay (n = 117) (.2608) (.4351)
Condition 2 0.860 0.1076 6.738 0.8866**Delay (n = 126) (.2239) (.4099)
Condition 3 0.999 0.2063 7.034 0.2904 Delay plus reflection (n = 120) (.2447) (.4763)
Condition 4 0.669 0.3121 7.459 -0.0866 Delay plus rumination (n = 127) (.2335) (.4319)
Table XI. Effect of BAM Participation on Decision-Making Time and Retaliation in Iterated Dictator Game, BAM Study 2
Log time to make decisions (seconds) Take amount ($)
Notes: Table presents results from administering iterated dictator game to sub-sample of youth in BAM study 2. Sample sizes listed for retaliation decision (take amount); decision time was measured for all youth in condition 1 but just for sub-sample of youth in conditions 2-4. Sample sizes for those conditions are 60, 63, and 62 respectively. Baseline covariates and randomization block fixed effects included in all models. Heteroskedasticity-robust standard errors in parentheses. * p<0.10, ** p<0.05, *** p<0.01.
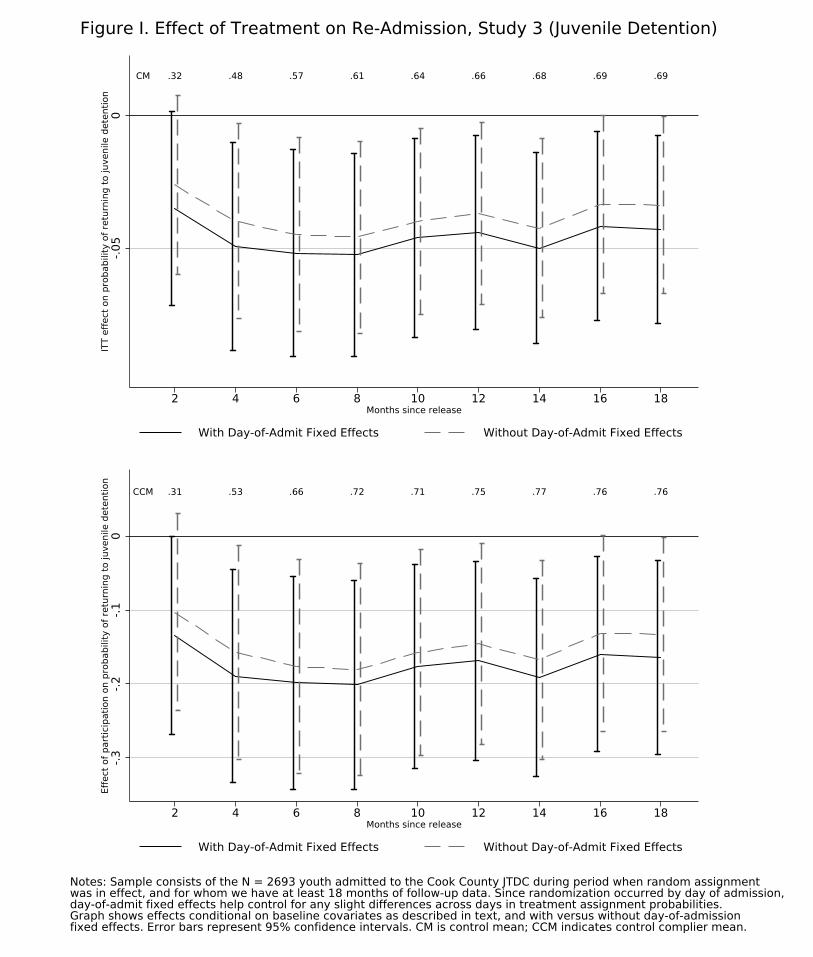
.32 .48 .57 .61 .64 .66 .68 .69 .69CM
-.05
0IT
T ef
fect
on
prob
abili
ty o
f ret
urni
ng to
juve
nile
det
entio
n
2 4 6 8 10 12 14 16 18Months since release
With Day-of-Admit Fixed Effects Without Day-of-Admit Fixed Effects
.31 .53 .66 .72 .71 .75 .77 .76 .76CCM
-.3-.2
-.10
Effe
ct o
f par
ticip
atio
n on
pro
babi
lity
of re
turn
ing
to ju
veni
le d
eten
tion
2 4 6 8 10 12 14 16 18Months since release
With Day-of-Admit Fixed Effects Without Day-of-Admit Fixed Effects
Notes: Sample consists of the N = 2693 youth admitted to the Cook County JTDC during period when random assignment was in effect, and for whom we have at least 18 months of follow-up data. Since randomization occurred by day of admission, day-of-admit fixed effects help control for any slight differences across days in treatment assignment probabilities. Graph shows effects conditional on baseline covariates as described in text, and with versus without day-of-admission fixed effects. Error bars represent 95% confidence intervals. CM is control mean; CCM indicates control complier mean.
Figure I. Effect of Treatment on Re-Admission, Study 3 (Juvenile Detention)
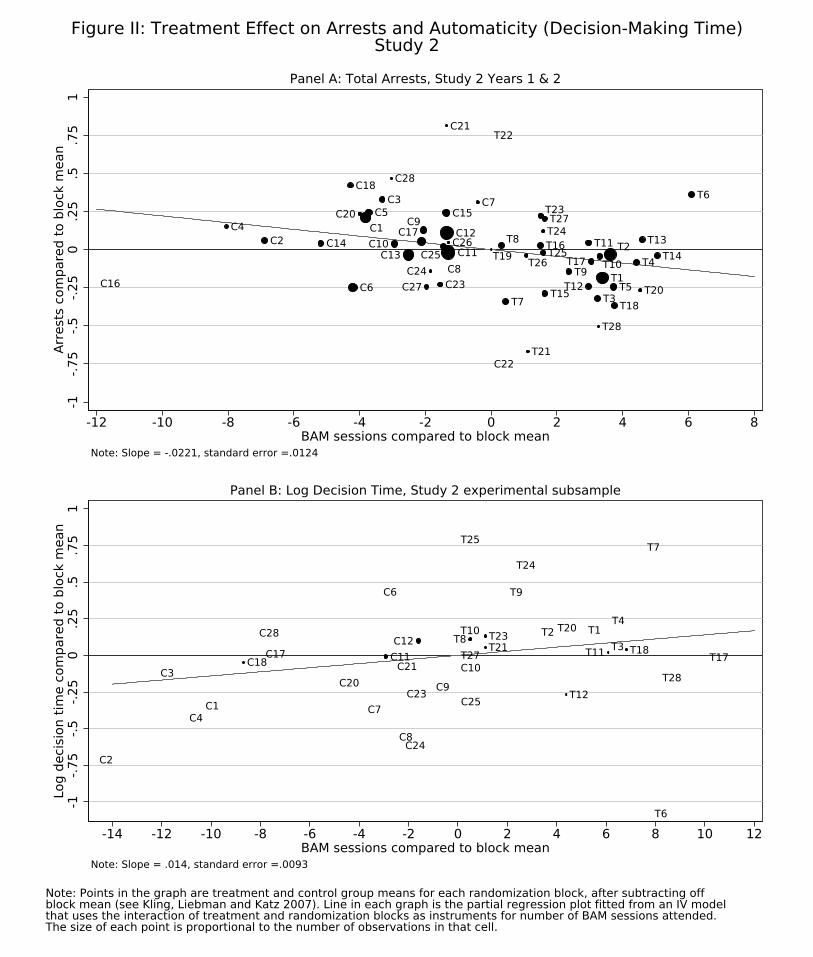
C1C2
C3
C4C5
C6
C7
C8
C9
C10C11
C12
C13C14
C15
C16
C17
C18
C20
C21
C22
C23C24
C25C26
C27
C28
T1
T2
T3
T4
T5
T6
T7
T8
T9T10
T11
T12
T13T14
T15
T16T17
T18
T19
T20
T21
T22
T23
T24
T25T26
T27
T28
-1-.7
5-.5
-.25
0.2
5.5
.75
1Ar
rest
s co
mpa
red
to b
lock
mea
n
-12 -10 -8 -6 -4 -2 0 2 4 6 8BAM sessions compared to block mean
Note: Slope = -.0221, standard error =.0124
Panel A: Total Arrests, Study 2 Years 1 & 2
C1
C2
C3
C4
C6
C7
C8
C9
C10C11C12
C17C18
C20C21
C23
C24
C25
C28 T1T2T3
T4
T6
T7
T8
T9
T10
T11
T12
T17T18
T20
T21T23
T24
T25
T27
T28
-1-.7
5-.5
-.25
0.2
5.5
.75
1Lo
g de
cisi
on ti
me
com
pare
d to
blo
ck m
ean
-14 -12 -10 -8 -6 -4 -2 0 2 4 6 8 10 12BAM sessions compared to block mean
Note: Slope = .014, standard error =.0093
Panel B: Log Decision Time, Study 2 experimental subsample
Note: Points in the graph are treatment and control group means for each randomization block, after subtracting off block mean (see Kling, Liebman and Katz 2007). Line in each graph is the partial regression plot fitted from an IV model that uses the interaction of treatment and randomization blocks as instruments for number of BAM sessions attended. The size of each point is proportional to the number of observations in that cell.
Figure II: Treatment Effect on Arrests and Automaticity (Decision-Making Time)Study 2