nber working paper series the stock market … · the stock market valuation of research and...
TRANSCRIPT
NBER WORKING PAPER SERIES
THE STOCK MARKET VALUATION OFRESEARCH AND DEVELOPMENT
EXPENDITURES
Louis K.C. ChanJosef Lakonishok
Theodore Sougiannis
Working Paper 7223http://www.nber.org/papers/w7223
NATIONAL BUREAU OF ECONOMIC RESEARCH1050 Massachusetts Avenue
Cambridge, MA 02138July 1999
We thank Werner DeBondt, Baruch Lev, Andrei Shleifer, and participants at seminars at Michigan StateUniversity, Ohio State University, University of Michigan, and the NBER Behavioral Finance - Asset PricingFall 1998 meetings for comments, and Konan Chan for research assistance. All opinions expressed are thoseof the authors and not those of the National Bureau of Economic Research.
© 1999 by Louis K.C. Chan, Josef Lakonishok, and Theodore Sougiannis. All rights reserved. Short sectionsof text, not to exceed two paragraphs, may be quoted without explicit permission provided that full credit,including © notice, is given to the source.The Stock Market Valuation of Research

and Development ExpendituresLouis K.C. Chan, Josef Lakonishok, and Theodore SougiannisNBER Working Paper No. 7223July 1999JEL No. G12, G14
ABSTRACT
We examine whether stock prices fully reflect the value of firms’ intangible assets, focusingon research and development (R&D). Since intangible assets are not reported on financial statementsunder current U.S. accounting standards and R&D spending is expensed, the valuation problem maybe especially challenging. Nonetheless we find that historically the stock returns of firms doing R&Don average matches the returns on firms with no R&D. For companies engaged in R&D, high R&Dintensity has a distinctive effect on returns for two groups of stocks. Within the set of growth stocks,R&D-intensive stocks tend to out-perform stocks with little or no R&D. Companies with high R&Drelative to equity market value (who tend to have poor past returns) show strong signs of mis-pricing.In both cases the market apparently fails to give sufficient credit for firms’ R&D investments. Ourexploratory investigation of the effects of advertising on returns yields similar results. We alsoprovide evidence that R&D intensity is positively associated with return volatility, everything elseequal. Insofar as the association reflects investors’ lack of information about firms’ R&D activity,increased accounting disclosure may be beneficial.
Louis K.C. Chan Josef LakonishokDepartment of Finance Department of FinanceCollege of Commerce College of CommerceUniversity of Illinois Urbana-Champaign University of Illinois Urbana-Champaign1206 South Sixth Street 1206 South Sixth StreetChampaign, IL 62820 Champaign, IL [email protected] and NBER
Theodore SougiannisDepartment of AccountancyCollege of CommerceUniversity of Illinois Urbana-Champaign1206 South Sixth StreetChampaign, IL [email protected]

The market value of a firm's shares ultimately reflects the value of all its net assets. When most
of the assets are physical, such as plant and equipment, inventories, or oil reserves underground,
the link between asset values and stock prices is relatively apparent. Moreover, the book value of
physical assets is recorded on firms' financial statements, so investors have at least such accounting
values to go by. In modern economies, however, a large part of the assets of many firms is less
tangible. For example, a company whose market share depends on consumer perceptions of quality
or fashion may derive more of its value from its brand name or image than from its physical plant.
A firm with negligible physical assets may have value that stems from a skilled work force, superior
methods of production, assembly, or distribution. In such cases the intangible assets represent
important sources of firm value, and yet, under generally accepted U.S. accounting principles, they
are not reported in firms' financial statements. When a firm has large amounts of intangible assets,
the lack of accounting information generally complicates the task of equity valuation.
One type of intangible asset, business research and development (R&D) activity, has lately been
the subject of much attention. In part, the interest reflects recent, widespread technological change,
together with the dazzling growth of science- and knowledge-based industries, who are especially
active in R&I). The Russell 1000 growth index, for instance, is a widely followed stock market
index. As recently as 1990, technology industries accounted for only 5 percent of the value of the
index, but their proportion jumped to 20 percent by 1998. Equally strikingly, the amount of R&D
spending in some major technology industries is larger than their earnings.
The rise in the importance of technology-oriented companies raises the question whether their
stock market values reflect the large intangible assets associated with R&D spending. In an efficient
market, investors recognize sources of firm value beyond what is on the books and the stock price
includes an unbiased estimate of a firm's intangible assets (such as its R&D capital). On the other
hand, several factors make the valuation of R&D-intensive firms especially challenging. Many firms
engaged in R&]) have few tangible assets. Instead, their prospects may be tied to the success
of new, untested technologies and hence are highly unpredictable. Large expenditures are usually
required at the outset, and the outcome of many research projects is far from assured. The benefits,
if any, are likely to materialize only much later, while the life-cycles of resulting products may be
quite short. Finally, accounting information about a firm's R&D activity is generally of limited
informativeness. Firms have some leeway in identifying what counts as an R&D cost. All of a firm's
R&D spending is reported as one aggregate item, conveying very little information as to the nature
of such activity. More importantly, U.S. generally accepted accounting principles require a firm to
deduct all its R&D expenditure as a current expense against income. This is the case even though
the benefits are long-lived, and hence at least part of the spending is more appropriately treated
as a capital expenditure. As a result of the expensing convention, some yardsticks commonly used
by investors, such as price-earnings ratios and market-to-book ratios, are misstated. In particular,
many R&D-intensive companies may appear to be priced at unjustifiably high multiples, so they
appear to be "expensive" by such criteria.
In light of these difficulties, the link between a firm's R&D spending and its stock price perfor-
mance is not likely to be clearcut. Many market commentators have argued that R&D-intensive
firms are most likely to benefit from technological innovation and therefore represent superior in-
vestments. Given the uncertainties surrounding the results of R&D, however, it is also possible
that the market may simply ignore any future benefits. This view would be consistent with the
"functional fixation hypothesis," whereby investors mechanically accept firms' financial statements
at face value, without adjusting for the long-term benefits of R&D. If, for example, investors value
a firm at a fixed multiple of earnings, the distortionary effects of R&D expensing may lead to
mispricing. Similarly, some have argued that stock market investors are myopic and fail to reward
businesses for long-term investments (see, for example, Hall and Hall (1993)). In contrast, many
observers have suggested that the valuations attached to R&D-intensive technology stocks are ex-
cessive, amid niay reflect investors' over-optimism about the effect of R&D on future profits. It
is perhaps the case that investors are, for instance, too easily seduced by a biotechnology firm's
2

promise to deliver a cure for cancer or an anti-aging drug.1
Many technology-oriented, R&D-intensive stocks tend to have low book-to-market ratios. Ex-
amining the stock price performance of R&D-intensive stocks would provide further evidence on a
central issue in the empirical asset-pricing literature. Fama and French (1992), Lakonishok, Shleifer
and Vishny (1994) find that stocks which currently have low book-to-market ratios (or "glamour"
stocks) generally have poor stock price performance in the future. Evidence that R&D-intensive
stocks are mispriced would mesh with one explanation that has been offered for the poor returns
on glamour stocks itt general. Specifically it has been argued that investors tend to have too favor-
able views about the future growth prospects of glamour stocks. In this regard, investors may be
excessively optimistic about the technological breakthroughs that are promised by R&D-intensive
firms
This paper investigates whether the stock market appropriately accounts for firms' expenditures
on R&D. We do this by relating R&D spending to subsequent stock price performance. Section 1
of the paper begins by documenting the importance of R&D spending, arid gauges the impact of
expensing R&D on standard valuation measures such as earnings yields and book-to-market ratios.
We also provide measures of the stock of R&D capital, as well as the R&D flow expense (capital
amortization). Section 2 of the paper sees if measures of R&D intensity are related to future stock
returns as well as to future growth in earnings and sales. Section 3 of the paper takes a closer look
at the link between returns and R&D intensity by using a factor-based model to control for size
and book-to-market effects, and by looking at the inipact of R&D for different categories of firm
size. Also in this section we extend our analysis to another important form of intangible capital,
'A recent news story (Hansell (1998)), for example, discusses the market response to merger activity between
Internet companies (who generally tend to be involved in R&D). The article notes that "But with all the irrationally
exuberant trading in Internet companies, it was difficult to read such reasoning —or any rationale at all — into
stock prices." Instead, "the most likely explanation for yesterday's pricing, several analysts said, was iiot that sonic
investors knew too much but that many knew too little." An analyst is quoted as saying, "1 think retail investors
have gotten enthusiastic and haven't quite figured out what is going on here and done the math."
3

advertising expenditures. The lack of accounting disclosure about firms' R&D, in addition to having
possible effects on stock prices, may also influence the level of investors' uncertainty. Accordingly,
in section 4 we explore whether the volatility of stock returns is related to R&D. A final section
contains the summary and conclusions.
The evidence does not indicate that firms engaged in R&D experience superior stock price
performance, compared to firms with no R&D. Rather, the average return on the two sets of stocks
is comparable. Stocks in the R&D sample have an average annual return of 19.65 percent over the
three-year period after portfolio formation, compared to 19.50 percent for firms with zero R&D. The
absence of any differences is consistent with the notion that the market price on average incorporates
fully the benefits of R&D spending. Further, in many industries continued R&D investment, in the
form of technological enhancements and new product development, is as much of a basic input as
labor and capital. Accordingly, continued R&D expenditures are vital to maintaining competitive
position and so are not associated with superior stock price performance.
Although on average market prices fairly account for firms' R&D spending, a closer look at
the cross-sectional relation between R&D spending and stock returns uncovers additional patterns.
Stocks who have high levels of R&D relative to sales tend to he glamour stocks, but they earn larger
average returns than other glamour stocks. The excess return (after adjusting for size and hook-to-
market) for R&D-intensive glamour stocks is 2.45 percent per year over the three post-formation
years. In addition, stocks with high R&D relative to market value of equity (who tend to have
experienced poor returns in the past) have higher average returns in the future. Excess returns for
this category of stocks average 6.12 percent pei year over the post-formation period. The common
element in these cases is the market's failure to recognize fully the value of these firnis' investments
in R&D. Two glamour stocks, one with high R&D spending and the other with un R&D, may
appear to be equally expensive under standard criteria such as price-to-earnings and price-to-book
ratios. However, the unarket seems to underestimate the future opportunities associated with the
first firm's R&D spending, relative to the growth opportunities of the second. Similarly tiLe market
4

gives insufficient credit to past losers who continue to invest heavily in R&D. Given the pressures
such firms face to cut costs and raise earnings, a high level of R&D spending is an indicator of
managers' confidence that future prospects are likely to improve. Nonetheless, the market tends to
overlook such signals (just as it tends to discount other indicators of managers' optimism such as
stock repurchases and insider trades).2
A variety of extensions to our analysis confirm the robustness of our main findings. Our results
are not sensitive to how we adjust for size and book-to-market effects on returns. While the results
are not driven solely by the behavior of small firms, the excess returns for R&D-intensive growth
stocks and R&D-intensive past losers are larger for small firms. Since information about small firms
is less readily available and they receive less coverage, the market may have a harder time tracing
through the implications of R&D spending in the case of small firms. Notably, our exploratory in-
vestigation of the effects on stock returns of another important tangible asset, advertising, uncovers
very similar patterns as with R&D.
The similarity in the average returns of stocks doing R&D and those without R&D is consistent
with the idea that investors manage to overcome the deficiencies in the current accounting treatnient
of intangibles and recognize the future benefits of R&D. This does not mean, however, that the
current accounting treatment of R&D is fully informative and that there are no costs from the
limited disclosure of such activity. In particular we provide some evidence that R&D intensity is
positively associated with return volatility, everything else equal. Insofar as the association reflects
investors' lack of information about tlìe nature and outcomes of firms' R&D activity, there may be
benefits from more detailed disclosure about R&D in accounting statements.
2See, for example, Ikenberry, Lakonishok and Vermaelen (1995) for evidence on the stock price effects of share
repurchases, and Lakoiiishok and Lee (1998) for evidence on insider trading.
5
1. The importance of R&D spending
1.1. Measures of R&D intensity
As background for our discussion of the market valuation of R&D, this section documents the
magnitude of R&D outlays by U.S. firms. Table 1 provides summary statistics on three measures
of R&D spending: current expenditures (total outlays, representing the amount charged against
income under current U.S. accounting procedures); estimated R&D economic expense, representing
the periodic amortization of the stock of R&D capital; and lastly the estimated stock of R&D
capital. Each of the two flow measures are expressed relative to either total sales, earnings (net
income), total dividends, or book value of equity. The stock of R&D capital is compared to the
book value of equity. In each of these ratios, we aggregate separately the items in the numerator
and denominator. For instance, the ratio of R&D expenditures to earnings is given by the total
amount of R&D expenditures summed across all eligible firms, divided by the total amount of
earnings summed across the same firms. The virtue of this procedure (compared to calculating the
average of the ratios across firms) is that it is insensitive to outlier cases where a firm has very low
or no earnings. An added advantage is that the calculation corresponds directly to the result of a
capitalization-weighted portfolio investment strategy.3
For each firm we construct measures of R&D expense as well as R&D capital from its reported
history of R&D expenditures as follows. The existing literature suggests numerous methods for
measuring the stock of R&D capital, with a wide range of estimates for the useful life of expenditures
and the amortization rate. For example, estimated amortization rates range from 6 percent (Baily
(1972)) to 25 percent (Flirschey (1982)). Lev and Sougiannis (1996) estimate the impact of current
and pa.st R&D spending on earnings across a variety of industries. These estimates thereby measure
3A11 financial information is taken from the Compustat Active and Research files. R&I) expenditure is annual
data item 46; sales is annual data item 12; net income is annual data iteni 172; dividends to common equity are
measured as annual data item 21; book value of comnmmmon equity is annual data item,, 60. Market value of common
equity (price per share times number of shares outstanding) is frommm the CRSP Stock Return files.
6

the proportion of past spending that is still productive in a given year. Based on their estimates,
we adopt the following tractable approximation of the stock of R&D capital, RDC for firm i in
year t based on current and past R&D expenditure (RDt):
RDC = RD + 0.8 * RD_1 + 0.6 * RD,_2 + 0.4 * RD_3 + 0.2 * RD_4. (1)
Effectively we assume that the productivity of each dollar of spending declines linearly by twenty
percent a year. Equivalently, the R&D expense (the periodic amortization of the capital), is
given by:
RE = 0.2 * (RD1_j + RD_2 + RD_3 + RD_4 + RD2_5). (2)
Our assumed capital amortization rate turns out to be quite close to the one used (fifteen percent)
in a highly influential database compiled on R&D activity by the National Bureau of Economic
Research (see Hall et al. (1988)).
Concentrating only on firms engaged in R&D (panel A), R&D spending has grown sharply in
importance. As a percentage of sales, R&D expenditures stood at 1.70 percent in 1975 and more
than doubled by 1995 to 3.75 percent. As R&D intensive firms tend to pay little or no dividends,
R&D expenditures are as much as 1.65 times cash dividends to shareholders. Finally, R&D capital
represents an important intangible asset that is not represented on firms' balance sheets. This
type of intangible asset accounts for fully 29 percent of the book value of common ecuity in 1995.
If the amortization rate is assumed to be 10 percent (a not unreasonable estimate given that
patent protection covers seventeen years), R&D capital is 47 perCent of book equity in 1995. These
numbers suggest that many technology-oriented glamour stocks would appear less expensive if their
intangible R&D assets were added to their book values. Not all firms carry out R&D however, so
panel B of the table provides the same comparisons relative to the entire set of U.S. firms. Even
41n additional unreported work, we assumed a teil percent amortization rate. The results are qualitatively
unaffected.5Note that the estimated capital stock is based on the actual outlays incurred, so tile capital is valued at cost..
Assuming some rate of return on R&D over the cost of capital would lead to an even largei intangible asset.
7

here, the importance of R&D outlays is impressive: 1995 expenditures are about 81 percent of all
firms' dividends.
Business research spending is heavily concentrated in technology and science-oriented industries.
As an illustration, Table 2 breaks out several industries (defined by 2-digit or 3-digit SIC codes)
of particular interest and ranks them by 1995 R&D spending relative to industry sales. By far the
highest ratio of spending is found in industry 737 (Computer programming, software and services).6
R&D costs in this industry represent about seventeen percent of sales and two times earnings. Next
in the industry ranking is the drugs and pharmaceuticals industry (SIC codes beginning with 283),
where R&D is about 12 percent of industry sales. Perhaps the recent popular impression that
heavy R&D spending is associated with superior stock price performance sterns in large part from
the success of a few large, well-known companies drawn from these industries, such as Merck and
Microsoft. Other relatively "glamorous" industries on the list include industries 357 (Computers
and office equipment), 36 (Electronics and other electrical equipment excluding computers) and 48
(Communications). Another, perhaps less glamorous industry, that is also heavily involved in R&D
activity is industry 37 (Transportation equipment).
As a percentage of earnings, R&D expenditures vary from 58 percent in industry 36 to 207
percent in industry 737. The stock of R&D capital is also large relative to the accounting book
value of equity. In industry 36, for example, R&D capital is about 26 percent of book equity while
in industry 737 R&D capital is particularly large (more than half of book value). The magnitude
6Under current accounting rules software research costs are expensed, as in other industries, but the costs of
development for software are capitalized. Development refers to the translation of research findings into plans or
designs for new products or processes. In general firms are not required to report separately their expenses for
research and for development. A brief perusal of the financial statements of several large, well-known software
companies suggests, however, that in itiany cases effectively all their software R&D costs are expensed as incurred (at
least over our sample period). For example, Microsoft's balance sheet indicates that all R&D costs are expensed and
that the development, portion is not material. Netscape and Symantec report similarly. For 1994 Lotus charged $159
million of R&D costs to operations and capitalized $36 million of development costs, It reported that capitalized
software costs were aniortized on a straight-line l,asis over the specific product's ecollolnic life, generally three years.
8

of these figures suggests that expensing R&D costs may distort conventional valuation yardsticks
such as price-earnings or price-to-book ratios.
1.2. The impact of expensing R&D costs: Is there value beneath the glamour?
To explore further the impact on commonly-used valuation measures, we compare earnings under
the current practice of immediately expensing R&D spending with "adjusted earnings" calculated
using our estimate of R&D expense (equation 2). Similarly we compare the book value of common
equity with a measure of book value ("adjusted book value") which adds to the accounting book
value the value of R&D capital (calculated using equation 1). The results for all firms engaged
in R&D activity are presented in panel A of Table 3. Not charging the entire aniount of R&D
spending raises earnings substantially. Annual adjusted earnings are higher by about 17 percent
on average over this period. In 1995, for example, the dollar difference is rough]y 21 billion dollars
or fifteen percent of earnings. Put another way, immediately expensing all R&D yields a price-
earnings multiple in the aggregate of 20.6 in 1995, while amortizing the capital over time yields a
price-earnings ratio of 17.9. Adding the value of the intangible R&D capital raises book value oii
average by 20 percent over the sample period. In 1995, for example, the increase is 8.38 percent of
the market value of equity, yielding a change in the price-to-book ratio from 3.43 to 2.67.
Turning to individual R&D—intensive industries highlights even more the potential distortions
from immediately expensing R&D. Panels B and C of Table 3 provide results for the same industries
analyzed earlier. The amortization adjustment is especially striking for industry 737 (computer
programming and software). The 1995 price-earnings ratio using reported earnings for this industry
is 51.8 while the ratio based on adjusted earnings is less than half this amount (23.4). Similarly, the
industry's price-to-book ratio moves from 6.9 to 4.4 when R&D capital is accounted for. Arguably,
our assumption of a five-year life for R&D expenditures may be too long, given the short product-
cycles in tIme software industry. In the drugs amid! I)llarnlaceuticals industry (industry 283), on the
other hand, five years may not be long enough. Even in this industry, however, the arnortizatioim
9
adjustments to earnings and book value are quite dramatic. With the adjustment, the price-earnings
ratio comes down from 27.2 to 20.9, while the price-to-book ratio changes from 6.2 to 4.1.
Finally, comparisons of the adjusted and unadjusted ratios are provided in panel D for selected
individual firms in 1995. For the sake of exposition, each of the selected firms has market capital-
ization above the median NYSE firm. Panel D shows that there are quite a few large, well-known
companies whose R&D make up a significant portion of their recorded book values or earnings. Sun
Microsystems, for instance, is priced at 13.4 times unadjusted earnings but only 9.8 times adjusted
earnings; its price is 2.3 times its unadjusted book value but only 1.4 times its book value including
R&D capital. In these cases ignoring the value of R&D capital may lead to serious undervaluation
of these companies.
In summary, R&D activity represents a significant and growing portion of firm resources. Several
industries in particular are highly R&D intensive. For many firms in these industries, the practice
of immediately expensing R&D outlays can have a substantial distortionary effect on earnings.
By the same token, the accumulated stock of R&D capital can represent a major intangible asset
relative to the reported book value of equity. If investors mechanically arrive at valuations based
on such reported earnings or book values, the degree of mispricing can be substantial.
2. R&D activity and stock returns
To see if the stock market correctly recognizes the expected future benefits from R&D spending, this
section implements an investment strategy based on R&D intensity. There should be no abnormal
returns from such a strategy if the market is informationally efficient and fully accounts for these
future benefits. On the other hand, if the market is myopic and ignores such benefits, R&D-intensive
firms wi]l tend to be undervalued and hence earn future abnormal returns. Conversely, if investors
arc overly optimistic about the prospects of firms engaged in R&D, the stocks will he overvalued
and hence investors are more likely to experience a correction in the future.
We report results using two measures of R&D intensity: R&D expenditures relative to sales and
10

relative to market value of equity. The measure of R&D intensity relative to sales is widely used in
practice as an indicator of how much resources a firm devotes to R&D (see, for example, the Value
Line Investment Survey). Our second indicator measures R&D intensity relative to the market
value of equity, and is in the same spirit as variables such as the earnings or book to price ratios
which are commonly used in financial economics. We take all domestic common stocks listed on the
New York, American stock exchanges and on Nasdaq. Portfolios are formed at the end of April each
year, based on the most recently available accounting information (assuming a four-month delay
between the end of a firm's fiscal year and the release of its financial statements). All eligible stocks
are ranked by a measure of R&D intensity and assigned to one of five portfolios. Equally-weighted
annual buy-and-hold returns are then calculated over each of the three years following portfolio
formation.7
In addition, the tables report the following characteristics of each portfolio: the returns in years
prior to portfolio formation; the average number of firms in the portfolio; its R&D intensity; book-
to-market ratio; sales-to-market ratio; earnings-to-price ratio; dividend yield; the average return
on equity (earnings relative to the book value of equity from the prior year); and the logarithm of
firm size (in millions of dollars).
2.1. Portfolio results based on R&D relative to sales
Table 4 provides results for portfolios sorted by R&D intensity relative to sales. In what may be
a blow against the conventional wisdom that R&D produces superior stock returns, the return
performance (panel A) of firms who carry out R&D is on average no different from those of firms
without R&D. Averaging over all the five groups of stocks doing R&D, for example, the mean
annual return in the three years following portfolio formation is 19.65 percent, compared to 19.50
percent for firms without R&D. Put another way, run-of-the-mill cement and utility stocks on
7When a stock is clelistecl in the course of a year after portfolio formation, we pick UJ) the CRSP clelisting return
if it is available. Tliereaftei we splice the stock's return with the return on the value—weighted market index until the
next portfolio formation date.
11

average did as well as highly-touted technology stocks.
The similarity between the average returns of stocks with and without R&D may be due to
several reasons. One explanation is that the market already takes into account the impact of
R&D on future profitability, so that returns on average do not vary with R&D spending. In other
words, the market on average correctly values any future benefits arising from research spending.
Moreover, in many science- and technology-based industries, innovation may be the competitive
norm, so that there may not be any long-term rents accruing to R&D activity. Another explanation
is that while R&D spending produced above-normal profits, they may have been offset by initial
overpricing due to investors' over-optimism. A final possibility is that different sets of investors
have offsetting impacts on initial stock prices. There may be myopic investors who fail to make
the amortization adjustments to the earnings of R&D-intensive firms but there may also be other
investors who are overly optimistic about the prospects of such stocks. The net effect is an average
rate of return no different from those of non-R&D firms.
When we look within the group of firms engaged in research activity, there is little if any
relation between R&D relative to sales and future returns in panel A. Raw returns are roughly
the same across the five portfolios. Over the three post-formation years, for example, the most
R&D-intensive portfolio, quintile 5, earns an average annual return of 19.52 percent, compared to
the overall average of 19.65 percent per year for all R&D firms. This is so eveii though the stocks
in the highest-ranked portfolio are much more heavily engaged in research and development than
other firms (panel C). Their R&D activity averages roughly 23 percent of sales, far larger than the
corresponding ratio for the next highest-ranked portfolio (only 6 percent for quintile portfolio 4).
Firms with a high rank by R&D relative to sales tend to be glamour stocks, with lower ratios
of book-to-market equity, sales-to-price, dividends and earnings-to-price (panel C). Ba,sed on the
earlier literature, such stocks are expected to have lower average returns. Yet, as panel A indicates,
their average returns are similar to those of the other portfolios. It would appear that one set
of glamour stocks, namely highly R&D-intensive stocks, (10 not have the low average returns that
12

usually accompany glamour investing.
Panel B takes the differences across portfolios in their value-glamour orientation into account.
We follow the general approach in the literature and control for size and book-to-market effects.8
Specifically, each stock in a portfolio is assigned a control portfolio based on its ranking by size and
by book-to-market.9 There are a total of thirty control portfolios, corresponding to five possible
ranks by book-to-market and six possible ranks by size. The ranking by book-to-market is based on
quintile breakpoints over all stocks. The breakpoints for size are based on NYSE issues only. The
size categories are: groups 1 to 4 correspond to the largest four quintiles, respectively, of market
capitalization; group 5 is the next-to-smallest decile of market capitalization and group 6 is the
bottom decile of market capitalization. The additional breakdown of the bottom quintile of firms
reflects the fact that many of the stocks who are active in R&D are generally very small. Further,
since the breakpoints for the size classification are based on NYSE stocks only, the bottom quintile
comprises a large number of firms. Each stock's return is measured net of the buy-and-hold return
ott its control portfolio.
The adjusted returns display larger differences across the R&D portfolios. The average spread
in excess returns between the highest- and lowest-ranked quiritile portfolios is 3.25 percent per year
over the three post-formation years. In particular, the ittean excess return on the highest-ranked
portfolio is 2.45 percent per year over the three post-formation years. On average, therefore, a
stock which is heavily involved in R&D relative to sales tends to do better tItan its peer with
similar size arid book-to-market ratio. Although the two stocks look equally expensive in terms of
price-to-book, the market seems to overlook the benefits accruing to the stock which is investing
in R&D. In relative terms, the market appears to overestimate the prospects of the glamour stock
5For evidence that size and book-to-niarket are important factors for stock returns, see Fama and French (992)
and Chan, Karceski and Lakonishok (1998).
9j order to niaintain comparability with earlier research we do not include the value of R&D capital in finns'
book values of equity. In a subsequent section we use an alternative procedure for return-adjustment that is l,asccl
on a three—factor model for returns. This circumvents the issuc of how to measure the value of R&I) capital.
13

with little or no R&D and gives less consideration to the fact that the company is not investing in
future opportunities.
Panel D of Table 4 looks directly at the future operating performance of the different portfolios.
The details behind the calculations of growth rates in earnings and sales of the different portfolios
are provided in the appendix. In terms of sales, stocks doing R&D tend to have growth rates that
are slightly higher than those of stocks with no R&D. Over the five post-formation years the sales
growth rate averages 17.35 percent per year across all stocks with R&D, versus 15.92 percent across
all stocks without R&D. However, the higher growth in sales does not translate into higher growth
for earnings. The average annual growth rate in earnings over the five post-formation years is
virtually the same for stocks with R&D and without R&D (the means across all stocks with R&D
and all stocks without R&D are 10.18 percent and 10.15 percent, respectively).10 The growth rates
of sales and earnings are notably higher oniy in the case of the most R&D-intensive stocks (quintile
portfolio 5). For this quintile the average growth rates are 14.24 percent for earnings and 21.13
percent for sales. The high growth rates are partly due to the fact that these stocks on average
have the lowest base-year earnings and sales (relative to price) of all the portfolios.
One important lesson from Table 4 thus seems to be that simply doing R&D by itself does not on
average give rise to differential stock price performance. Instead, if R&l) activity has a distinctive
impact on stock returns, it appears to break out growth stocks that do R&D from other growth
stocks in general. In particular, on average a glamour stock which is highly active in R&D tends
to do better thaii other glamour stocks. Earlier evidence indicates that glamour stocks generally
yield lower returns. One possible explanation is that they tend to be overpriced due to investors'
optimism about their future growth prospects. Within the set of such glamour stocks, Table 4 says
10Note, however, that our (;alculat]on of growth rates differs from the usual measure of growth in earnings per
share. In particular our calculated growth rates reflect how much earnings or sales that an investor is entitled to per
dollar of initial investment. Further we assume a buy—and—hold investment strategy, so the growth rates include the
reinvestment of dividends. The average dividend yield is 1.84 percent. for R&D stocks and 2.57 percent for stocks
with no R&D. The so]ncwhat higher yield for stocks without R&D allects the comparison of growth rates.
14

that there are some stocks with large R&D spending whose returns are not lower than average. In
pricing such stocks it appears that the market does not fully give credit for firms' investments in
R&D.
2.2. Separating R&D hype from R&D reality
The results from Table 4 suggest a distinction between two sets of glamour stocks. There are
glamour stocks who spend on R&D and are thus investing in future growth opportunities, as
opposed to glamour stocks who have captured investors' imaginations while not doing R&D and
whose growth prospects may be less sustainable (such as "concept" stocks). Since the amount
spent on R&D is not necessarily indicative of the productivity of such expenditures, the distinction
can be sharpened. In particular, one way to judge the output of a firm's R&D program is to see if
it translates into sales revenues. We use a firm's ratio of sales to market value of equity (so that
revenues are scaled by shareholders' investment) as a proxy for the productivity of R&D spending.
Our idea here is that when an R&D-intensive company has a large base of sales in place, it has an
established track record of successfully translating past R&D into revenues.11 On the other hand,
when a firm has low current sales, it has no such record so R&D offers primarily tIme allure of profits
to come. Since investor sentiment ma play a larger role in inflating valuations for such untested
companies, they more closely resemble other "concept" glamour stocks with no R&D.
Table 5 explores this intuition by separating each R&D ciuintile portfolio (from Table 4) into
two equally-sized groups, based on the ratio of sales to equity market value. Ecually-weighted
returns on each group are reported. As earlier studies have found, sales-to-market helps to predict
future stock returns, even after controlling for size anti book-to-market (Lakonishok, Shleifer and
Vishny (1994). As a baseline, over the three post-formation years stocks with rio R&D and low
sales-to-market ratios earn aim average excess return of -1.14 percent per year while stocks with no
'1Deng, Lev and Narin (1999) use patent citations as another measure of R&J) output to predict stock returns.
However, data on patents are not widely accessible, and cover oniy a relatively small set of companies over a short
period.
15

R&D but high sales-to-market ratios earn 1.70 percent per year. The largest mean excess return
(5.29 percent per year) is earned by stocks in the top quintile of R&D-intensity and with high
sales-to-market. This group's excess return is not driven by the sales-to-market variable, since the
portfolio's sales-to-market ratio is far from the highest in the table. As well, stocks in the next-
highest R&D quintile and with high sales-to-market also have large excess returns (4.63 percent)
while their sales-to-market ratios are not outstanding.
Stocks with high R&D intensity but with low sales-to-market, on the other hand, do not earn
high mean returns. Excess returns for stocks in the top two quintiles and with low sales-to-market
are close to zero. The evidence thus indicates that the returns on R&D-intensive stocks with low
sales-to-market on average match the returns on similarly-sized glamour stocks who do no R&D.
Table 4 says that an investor choosing glamour stocks generally does better by selecting R&D-
intensive stocks; Table 5 narrows the list further to R&D-intensive stocks with an established track
record in terms of sales. Conversely, firms spending on R&D but with no proven ability to generate
revenues share some similarity with "concept" glamour stocks, in that they may be more prone to
inflated investor expectations. Future returns for such over-hyped glamour stocks are on average
disappointing.
2.3. Portfolio results based on R&D relative to market value
Table 6 reports results for R&D intensity measured as expenditures relative to market value of
equity. This indicator parallels many financial measures which express a firm's characteristics per
dollar invested in the stock. Hence this measure of R&D intensity is in the spirit of evaluating
investments from a shareholder's standpoint.
In general the two measures of R&D intensity are correlated (panel C). Unlike Table 4, however,
tIme portfolio of stocks ranked highest by R&D relative to market tends to he populated by stocks
with poor past returns (or "losers"). Over the five years prior to l)ortfohio formation, the average
annual return of stocks ranked in the top quintile by R&D relative to market is only 9.89 percent
16
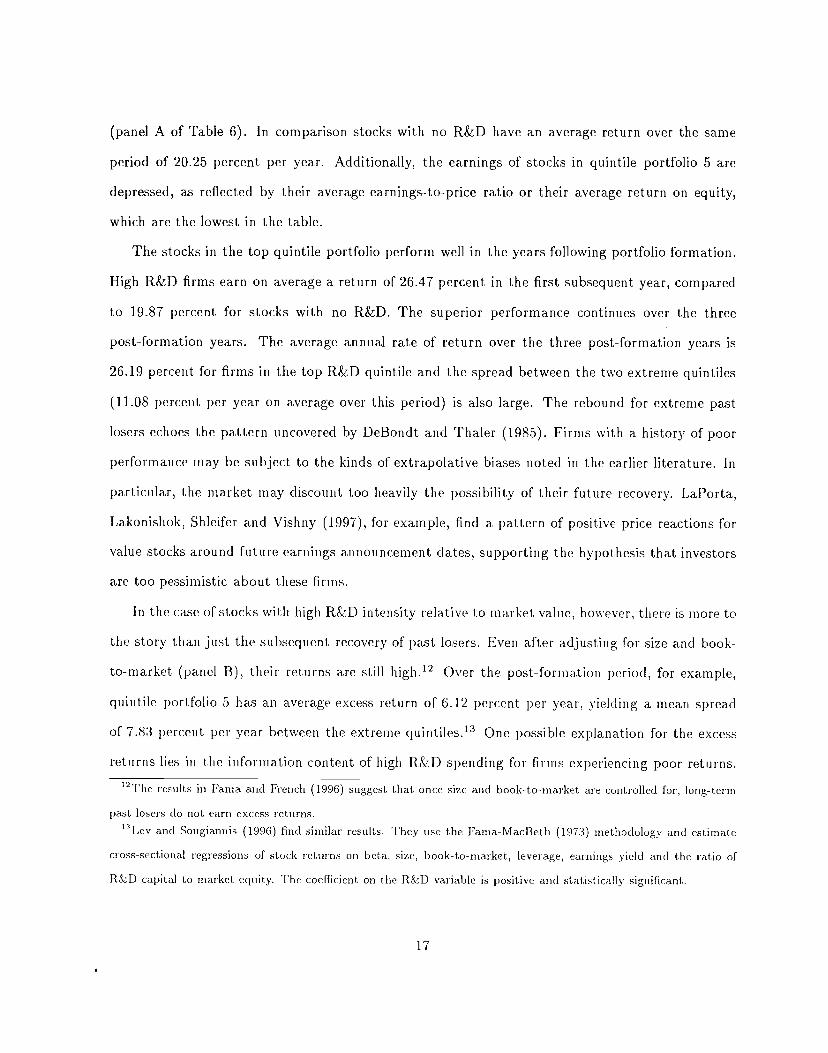
(panel A of Table 6). In comparison stocks with no R&D have an average return over the same
period of 20.25 percent per year. Additionally, the earnings of stocks in quintile portfolio 5 are
depressed, as reflected by their average earnings-to-price ratio or their average return on equity,
which are the lowest in the table.
The stocks in the top quintile portfolio perform well in the years following portfolio formation.
High R&D firms earn on average a return of 26.47 percent in the first subsequent year, compared
to 19.87 percent for stocks with no R&D. The superior performance continues over the three
post-formation years. The average annual rate of return over the three post-formation years is
26.19 percent for firms in the top R&D quintile and the spread between the two extreme quintiles
(11.08 percent per year on average over this period) is also large. The rebound for extreme past
losers echoes the pattern uncovered by DeBondt and Thaler (1985). Firms with a history of poor
performance may be subject to the kinds of extrapolative biases noted in the earlier literature. In
particular, the market may discount too heavily the possibility of their future recovery. LaPorta,
Lakonishok, Shleifer and Vishny (1997), for example, find a pattern of positive price reactions for
value stocks around future earnings announcement dates, supporting the hypothesis that investors
are too pessimistic about these firms.
In the case of stocks with high R&D intensity relative to market value, however, there is more to
the story than just the subsequent recovery of past losers. Even after adjusting for size and book-
to-market (panel B), their returns are still high.12 Over the post-formation period, for example,
quintile portfolio 5 has an average excess return of 6.12 percent per year, yielding a mean spread
of 7.83 percent per year between the extreme quintiles.13 One possible explanation for the excess
returns lies in the information content of high R&D spending for firms experiencing poor returns.
'2The results in Fama and French (1996) suggest that once size and book-to-market are controlled for, long-term
past losers do not earn excess returns.'3Lev and Sougiannis (1996) tInt! similar results. They use the Fama-MacBeth (1973) methodology anti estimate
cross-sectional regressions of stock returns on beta, size, book-to-market, leverage, earnings yield anti the ratio of
R&D capital to market equity. The coefficient on the R&D variable is posit]ve and statistically significant.
17

Despite their poor performance, the firms in the top quintile portfolio spend a large portion of
sales revenue (in excess of eleven percent) on R&D. Their managers' willingness to maintain R&D
spending represents a vote of confidence that the firms' future opportunities will improve. Their
beliefs are all the more credible because R&D spending directly depresses earnings, so their choice is
not without pain. Moreover, there are likely to be strong pressures both internally and externally
for firms with poor past returns to cut spending (including R&D) and limit costs. As a result,
the commitment of managers to long-lived investments such as R&D suggests that these stocks'
prospects may not be as bleak as investors think. Related evidence on the market under-reaction
to managers' signals is found in Ikenberry, Lakonishok and Verrnaelen (1995), Loughran and Ritter
(1995), and Lakonishok and Lee (1998).
On a more speculative note, the nature of the investor base for R&D-intensive technology
companies may be an additional factor in determining stock j)rices. In particular, R&D-intensive
firms who are past losers become "orphaned" stocks with no natural underlying investor clientele.
Growth investors are inclined to desert stocks once they start to perform poorly. Many value
investors, on the other hand, stay away from technology stocks in general because they do not
view such stocks as part of their natural investment domain. Additionally value investors may not
be drawn to technology stocks because they tend to look expensive under conventional criteria.
The upshot is that there may be potentially more severe underpricing when R&D-intensive stocks
experience poor performance.
To put it in terms that parallel our results in Table 4, two value stocks, one with large R&1)
spending and the other without, may look equally "cheap" by book-to-market ratios. The stock
with high R&D intensity relative to market equity, however, comes with a vote of confidence from
firm managels. In the latter case the market nonetheless appears to discount the favorable signal.
As the outlook eventually improves and investors revise their valuations, returns on the portfolios
with high R&D relative to market undergo a marked recovery. The growth rates in panel C of the
table support the extent of the regained profitability for the top quintile of RD-interisive stocks.
18

For this group earnings over the five years following portfolio formation grow by 17.13 percent,
compared to 10.15 percent for firms with no R&D.
3. Additional results
3.1. Return adjustment using factors
In the previous sections we adjust for size and book-to-market effects on returns by using control
portfolios matched on those two characteristics. One drawback to this approach is its reliance
on measured book values, which do not include the value of intangible assets. Additionally, if
technology stocks always behave like growth stocks regardless of their book-to-market ratios, the
adjustment based on matching portfolios may be misleading. As a check that our results are robust
to the return adjustment method, in this section we use the Fama-French (1993, 1996) procedure,
which adjusts for the sensitivities of stock returns to market, size and book-to-market factors.
Specifically, time series regressions of the form
—R11 0p + bp[RMt — Rid + sSMB1 + hHML1 + (3)
are estimated for each quintile portfolio p. here R1 — Rft 5 tile monthly return on the portfolio
in excess of tile Treasury bill rate in month t, R1 — Rj is the excess return on the value-weighted
market index, 8MB1 and I-11V1L1 are the returns on the Fama-French (1993) factor-mimicking
portfolios for size and book-to-market, respectively. The model is estimated using monthly returns
from each of the first three years following portfolio formation.
Table 7 reports the results for each measure of R&D intensity. In panel A, portfolios are formed
by the R&D-to-sales ratio. In each year after portfolio formation the average alpha across all the
R&D portfolios is positive. In the first year the abnormal performance is 0.11 percent per month
(or 1.32 percent on an an miual basis) and in the second and third years it is 0.13 pei'cent per month
(or 1.56 pem'cent per year). As in Table 4, holding fixed size and book-to-market effects, firms who
carry out R&I) earn slightly positive excess returns.
19

Panel A confirms that highly R&D-intensive stocks (measured relative to sales) generally behave
like glamour stocks. The returns on the top two quintile portfolios load negatively on the book-
to-market factor HML (that is, they tend to covary more strongly with stocks which have low
book-to-market ratios). The popular impression is that R&D stocks tend to be more volatile than
others. In line with this notion, the R&D portfolios' market sensitivities are generally larger than
those of the portfolio comprising stocks with no R&D. To illustrate, the top R&D quintile portfolio
has a market beta of 1.07 in the first post-formation year, compared to a beta of 0.94 for the
portfolio with no R&D.
In panel B, the sort by R&D relative to market value of equity produces notable differences in
alphas across the quintile portfolios. In particular, the alpha for the top quiiitile portfolio is large
and statistically significant in each of the three post-formation years. Over the first post-formation
year, the excess performance for the top quintile is 0.44 percent per month."1 The spread between
the extreme quintiles' alphas is 0.60 percent per month in the first year (or an annualized spread
of 7.2 percent). The spread continues to be large in the second and third post-formation years as
well (they are 7.44 percent and 7.56 percent per year, respectively). To sum up, our earlier findings
are not sensitive to how we adjust for size and book-to-market effects.
3.2. R&D intensity and firm size
Many firnis who are active in R&D are relatively small, young firms. Earlier research suggests
that anomalous patterns in returns are typically more pronounced for small stocks. To address
this possibility, Table S reports returns from each of our sorts for sepa rate categories of firni size
(equity market capitalization). The breakpoints for the size classification are based on NYSE issues
only. In particular, large stocks fall in the top 3 deciles by market value of equity; mid-sized stocks
belong to the next 4 deciles; small stocks are from the second and third deciles; and the last category14 In comparison the alpha for R&[) quintile portfolio 4 is lower. Note, however, that in the top quintile portfolio
f{&I) spending as a fraction of market. value is much higher than iii the other groups, averaging hG.55 percent (see
panel C of Table 6).
20

comprises firms in the bottom decile of market capitalization. We report the average annual return,
both unadjusted and after the adjustment using matching control portfolios, over the three years
following portfolio formation.
Within each size category, there is generally little to differentiate the raw returns of firms with
R&D from those of firms without R&D. The average return on large firms who do R&D is about
16.60 percent per year over the three post-formation years, while the corresponding return for large
firms with zero R&D is 16.36 percent. In the case of the smallest ten percent of firms, returns for
stocks with R&D are somewhat higher than for stocks without R&D. The average returns are 22.80
percent and 21.0 percent, respectively.
Considering firms engaged in R&D, the sort by R&D relative to market value (panel B) produces
differences in excess returns in all the size categories. In the group of large firms, the top R&D
quintile has a mean excess return of 1.76 percent. As earlier studies on other return anomalies
have found, the excess returns are notably larger for small stocks. In the smallest decile of firms,
for instance, the top R&D quintile has an average excess return of 9.89 percent per year over the
post-formation period. There are generally multiple sources of information about large firms' R&D
activity. On the other hand the smallest companies tend to he less covered by analysts and overall
there is less information available on them. As a result, investors may have a harder time tracing
through the effects of R&D for the smallest stocks.15
3.3. Advertising and stock returns
While the l)romise of technological breakthroughs has pushed R&D capital into the limelight, there
are other forms of intangible capital as well. In this section we provide an exploratory analysis
15Tlie Fama—French regressions applied to the R&D portfolios witlun each size category provide similar results as
the return adjustment procedure using matching control portfolios. For example, the difference between the intercepts
for the top and bottomim quintile portfolios by R&D to sales is 0.22 percent per month for the smallest firms and 0.06
percent per month for the largest firms. Time corresponding clifferemices for the sort by Rkl) to market equity are .01
Percent for the sniahlest firms and 0.02 percent for the largest firms.
21

of another common form of investment in intangible capital, namely, advertising. Like research
and development spending, advertising expenditures have some elements of long-term investment
(although the effective lifetime of advertising expenditures may be comparatively shorter). Adver-
tising expenditures are also expensed. Empirically, advertising represents a smaller component of
aggregate sales or earnings compared to R&D. Advertising makes up about 0.9 percent of total
1995 sales of all firms, while R&D accounts for almost twice as much (1.7 percent). Our objective
here is to see if the patterns uncovered in our analysis of R&D extend to advertising.
Table 9 provides results for portfolios sorted by advertising expenditures relative to market
value of equity.'6 The number of firms who do advertising is roughly the same as those doing R&D
(about 1200 firms on average each year report non-zero expense for either advertising or R&D).
For the firms engaged in advertising their average return over the three post-formation years (20.46
percent) is slightly higher than that of firms without advertising (18.95 percent). The difference
may reflect the fact that firms who do advertising tend to be concentrated in certain industries.
Firms with high advertising relative to market equity have larger future returns than firms
with low or no advertising. One characteristic of the highest-ranked firms under this measure of
advertising intensity is their relatively poor past returns (14.02 percent per year on average over the
prior five years, compared to an average of 19.81 percent for firms with no advertising). However
they invest heavily in advertising. Echoing our jesuits for R&D relative to marlet, the returns of
the advertising-intensive past losers subsequently improve. Over the three years following portfolio
formation, the firiis in quintile portfolio 5 have an average return of 23.63 percent (compared to
18.95 percent for firms doing no advertising). The superior performance of the portfolios with
high advertising relative to market value survives the adjustment for size and book-to-market. For
instance the top (luintile earns an average excess return of 3.10 percent per year over the post-
16As is the case with R&D relative to sales, the sort by advertising to sales does not produce notable differences
in future returns across portfo]ios. Accordingly, for the sake of brevity these i-esults are omitted. Unlike the sort
by RS.D, however, the quintile portfolios have sinular size and 1)00k—to—market characteristics. Accordingly, excess
returns are also not ielaied to the advertising to sales ratio.
22

formation period. These results for advertising expenditures relative to market essentially agree
with our findings for R&D relative to market. In particular, advertising-intensive firms with poor
past performance are under strong pressures to cut costs. When such firms keep investing in their
franchise value through advertising despite these pressures, they are more likely to represent cases
of relative undervaluation. Nonetheless, these cases are overlooked by the market.
4. R&D and return volatility
Our results suggest that on average a firm which does R&D earns a rate of return that is no different
from a firm with no R&D. Nonetheless R&D may have effects on firms' financial performance beyond
average stock returns. Given the large portion of firm resources that is devoted to research and
development, it is fair to suspect that a firm's fortunes may rise or fall depending on the outcomes
of its R&D activity. Despite its importance, however, the amount of R&D is disclosed as a single
aggregate item in a firm's financial statements. While there are other sources of information about
R&D activity beyond firms' financial statements, the lack of accounting disclosure suggests that
investors may not be fully informed about this vital activity. One consequence may he a high degree
of uncertainty surrounding an R&D-intensive firm's future prospects. As a result, the volatility of
returns may rise with R&D spending. Even if there is little or no impact on average stock returns,
then, the lack of accounting disclosure about R&D may impose real costs on investors in the form
of higher volatility. Further, higher volatility may affect the cost of capital faced by R&D-intensive
firms.
The empirical issue is whether there is any association between R&D and return volatility.
Fligher volatility may he a consequence of the nature of the business in technology-based industries
(where R&D spending is mainly concentrated). In addition, many R&D-intensive firms tend to be
smaller, younger firms so thieie may be an association on this account. With these considerations
23
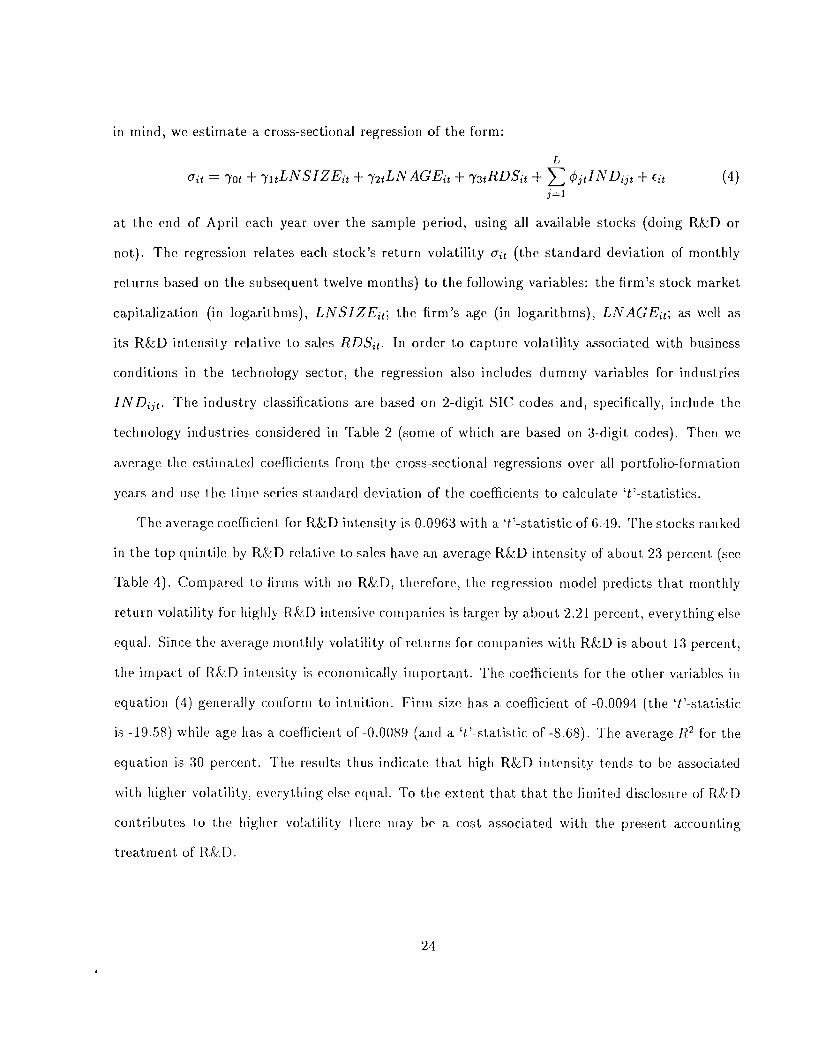
in mind, we estimate a cross-sectional regression of the form:
= ot + 1LNSIZE + y2LNAGE + 7atRDS +L
+ qj (4)
at the end of April each year over the sample period, using all available stocks (doing R&D or
not). The regression relates each stock's return volatility oj (the standard deviation of monthly
returns based on the subsequent twelve months) to the following variables: the firm's stock market
capitalization (in logarithms), LNSIZEt; the firm's age (in logarithms), LNAGEj; as well as
its R&D intensity relative to sales RDS1. In order to capture volatility associated with business
conditions in the technology sector, the regression also includes dummy variables for industries
IND2. The industry classifications are based on 2-digit SIC codes and, specifically, include the
technology industries considered in Table 2 (some of which are based on 3-digit codes). Then we
average the estimated coefficients from the cross-sectional regressions over all portfolio-formation
years and use the time series standard deviation of the coefficients to calculate 't'-statistics.
The average coefficient for R&D intensity is 0.0963 with a 't'-statistic of 6.49. The stocks ranked
in the top quintile by R&D relative to sales have an average R&D intensity of about 23 percent (see
Table 4). Compared to firms with no R&D, therefore, the regression model predicts that monthly
return volatility for highly R&D intensive companies is largei by about 2.21 percent, everything else
equal. Since the average monthly volatility of returns for companies with R&D is about 13 percent,
the impact of R&D intensity is economically important. The coefficients for the other variables in
equation (4) generally conform to intuition. Firm size has a coefficient of -0.0094 (the '['-statistic
is -19.58) while age has a coefficient of -0.0089 (and a 't'-statistic of -8.68). The average R2 for the
equation is 30 percent. The results thus indicate that high R&D intensity tends to be associated
with higher volatility, everything else equal. To the extent that that the limited disclosure of R&l)
contributes to the higher volatility there may be a cost associated with the present accounting
treatment of R&D.
24

5. Summary and conclusions
In modern economies many firms have large amounts of intangible assets such as brand names,
patents or employees' expertise. Such intangible assets can represent a substantial portion of the
market value of a firm's shares. Under U.S. generally accepted principles, however, such sources
of value are not recorded on financial statements. Instead, the spending devoted to building up
intangible assets is treated as a current expense. Consequently, there can be potentially large effects
on many firms' reported earnings or book values of equity. These consequences raise the question
whether stock prices fully incorporate the value of intangible assets.
This question is addressed in depth in this paper, with a focus on the market valuation of R&D
capital. The rapid spread of technology, together with shifts in the structure of industry toward
the science- and knowledge-based sector, have highlighted the importance of spending on R&D.
We document that R&D expenditures are a large and growing portion of sales and earnings.
For firms engaged in R&D, for example, the level of R&D spending doubled from 1.70 percent
of sales in 1975 to 3.75 percent in 1995. Similarly, we estimate that in 1995 the value of R&D
capital accounts for about 29 percent of the book value of common equity for firms doing R&D.
The high level of spending suggests that large distortions can arise from expensing rather than
capitalizing R&D costs. As an illustration, immediately expensing all R&D yields an aggregate
price-earnings multiple for all R&D flims of 20.65 in 1995, while amortizing R&D capital results in
a price-earnings multiple of 17.9. In the case of R&D-intensive industries such as computer software
or pharmaceuticals, the impact of expensing can be even more dramatic. If investors fail to adjust
standard valuation measures such as price-to-earnings or price-to-book ratios for the long-term
benefits of R&D, potentially severe mnispricing may arise.
Our evidence does not support a direct link between R&D spending and future stock returns.
Indeed the average return over all firms engaged in R&D activity does not differ markedly from
firms who (10 not perform R&D. In the three—year period following portfolio formation, stocks doing
R&1) have an average return of 19.65 percent per year, and stocks doing no R&D have an average
25

return of 19.50 percent. Thus it does not appear that historically a highly-touted technology stock
on average outperformed a more mundane cement company. This finding is consistent with the
hypothesis that the stock price fully incorporates any net benefits from R&D. At the same time, it
is also possible that the impact of different investor types may offset each other in the aggregate.
Some investors may be overly optimistic about the prospects of R&D-intensive stocks while other
myopic investors may accept firms' financial statements at face value and ignore the benefits from
R&D.
The clearest evidence that high R&D plays a distinctive role arises from two sets of stocks.
Stocks with high R&D relative to sales tend to be glamour stocks but they do not have the
disappointing returns that glamour stocks in general earn. In particular their returns are higher by
2.45 percent per year on average over the following three years, compared to similarly-sized glamour
stocks. Stocks with high R&D relative to the market value of equity tend to have notably higher
average future returns. Their average excess return over the following three years is 6.12 percent
per year. Our findings ale not sensitive to how returns are adjusted for size and book-to-market
effects.
Although two glamour stocks one with high R&D and the other without Irlay look equally
expensive in terms of book-to-market ratios, the stock which (lOes R&D appears to be relatively
undervalued by the market. Moreover, we find that the excess returns precloininanti occur for
R&D intensive stocks with relatively high sales-to-market ratios. Put another way, an investor
selecting glamour stocks should prefer R&D intensive glamour stocks (everything else eciual), and
can (10 eveii better with R&D intensive glamour stocks which have an established track record of
translating R&D into revenues. We conjecture that R&1) stocks that lack such a record resemble
other glamour stocks with no R&D in that they are more prone to inflated investor expectations.
Similarly, two stocks with high book-to-market ratios (which typically have poor past perfor-
matice) where one spends heavily on R&D and the other has little or no R&D, may look equally
cheap under coiiventiona.l valuation yardsticks. However, the market fails to give enough credit to
26
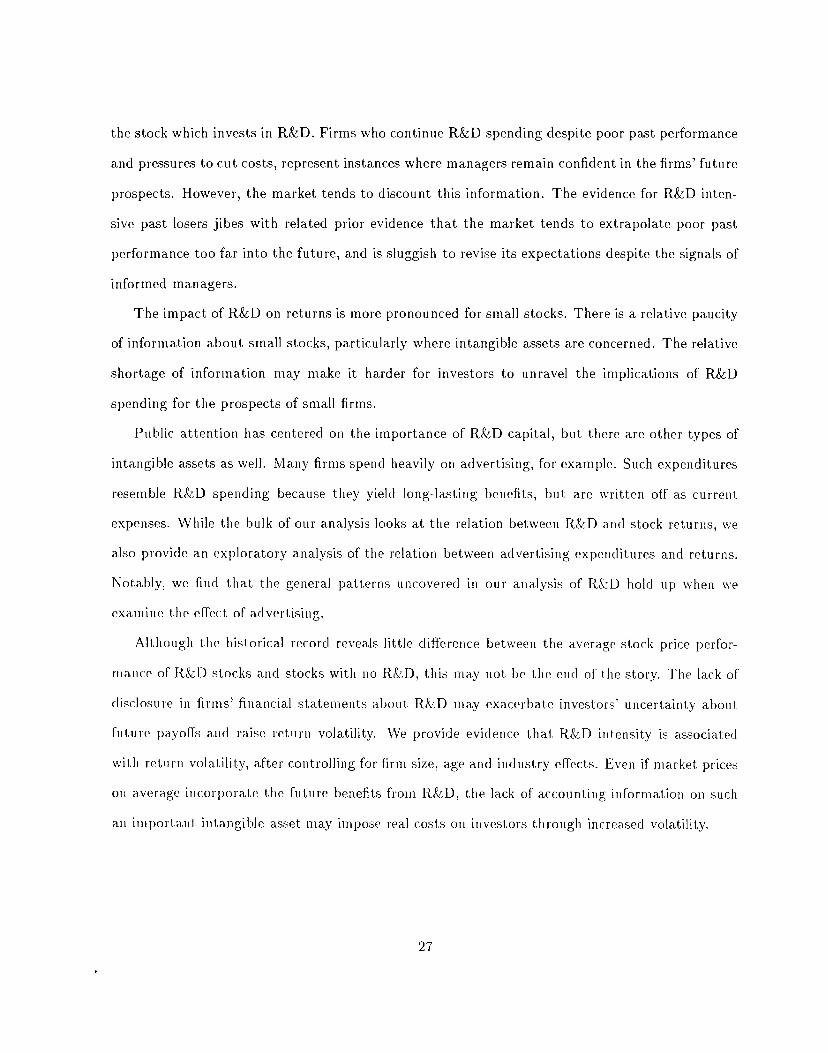
the stock which invests in R&D. Firms who continue R&D spending despite poor past performance
and pressures to cut costs, represent instances where managers remain confident in the firms' future
prospects. However, the market tends to discount this information. The evidence for R&D inten-
sive past losers jibes with related prior evidence that the market tends to extrapolate poor past
performance too far into the future, and is sluggish to revise its expectations despite the signals of
informed managers.
The impact of R&D on returns is more pronounced for small stocks. There is a relative paucity
of information about small stocks, particularly where intangible assets are concerned. The relative
shortage of information may make it harder for investors to unravel the implications of R&D
spending for the prospects of small firms.
Public attention has centered on the importance of R&D capital, but there are other types of
intangible assets as well. Many firms spend heavily on advertising, for example. Such expenditures
resemble R&D spending because they yield long-lasting benefits, but are written off as curreiit
expenses. While the bulk of our analysis looks at the relation between R&D and stock returns, we
also provide an exploratory analysis of the relation between advertising expetiditures and returns.
Notably, we find that the general patterns uncovered iii our analysis of R&D hold up when we
examine the effect of advertising.
Although the historical record reveals little difference between the average stock price perfor
maiice of R&I) stocks and stocks with no R&D, this may not be the end of the story. The lack of
disclosure in firms' financial statements about R&D may exacerbate investors' uncertainty about
future payoffs arid raise return volatility. We provide evidence that R&D intensity is associated
with return volatility, after controlling for firm size, age and industry effects. Even if market prices
on average incorporate the future benefits from R&D, the lack of accounting information on such
an important intangible asset may impose real costs on investors through increased volatility.
27

Appendix
Measures of growth rates of portfolio earnings and sales
This appendix describes how we construct measures of operating performance for the individual
portfolios in the analysis. Specifically, we measure each portfolio's growth rate of earnings and
sales. Conventional measures of growth rates (either simple averages of individual firms' percentage
growth rates, or growth rates fitted from estimated regression lines) suffer from several serious
drawbacks. In the case of earnings, the level of earnings in the base period can be negative or close
to zero (producing large outliers). More seriously, the conventional growth rate measures bear little
if any resemblance to the underlying investment strategy which is used to generate the returns
reported on the portfolios. As a result, it is not possible to make any direct comparisons between
the portfolio returns earned by an investment strategy and the underlying operating performance
of the portfolios.
In our case we report returns based on a buy-and-hold strategy, where the composition of the
portfolios is revised each year. in parallel with this strategy we calculate growth rates in portfolio
earnings (or sales), based on the ideas in Givoly and Lakonishok (1993), as well as Ikenberry and
Lakonishok (1993). The procedure is as follows, using earnings growth as an example. In year I,
we select stocks for a portfolio and we track the earnings on tins portfolio from years t — 5 to 1. + 5.
In the base year t — 5 we invest one dollar in each of the selected stocks. For the i-th firm in the
base year we are entitled to the proportion of its earnings, where 1',t5 is the market value of
firm i's equity in yea! t — 5 a.nd E,_5 is its total earnings available to common shareholders that
year. Accordingly, the base level (at year I —5) of portfolio p's earnings, per dollar invested,
is given bN,_5 ,I I'j t—5
ep,t_5 N5where N_5 is the number of firms in the portfolio available for investment.
hi each subsequent year r, where I — 5 < i < t + 5, the earnings on the buy—and—hold portfolio,
28

per dollar originally invested in the base period, is given by
i; flt—r1(1 +r4t— 1,t— 1+ 1])E,—N_5
The amount held in stock i in year r is given by its compound return fJ1(1+r[t—l,t—l+1])
from the base year to the given year, where r[t —1, t —1 + 1] is the return on the stock between years
t—l and t—l+1. For each year r relative to the portfolio formation year this procedure gives a time
series of annual portfolio earnings per dollar originally invested. Finally we average each time series
to yield eleven average values for portfolio earnings; these serve as the inputs for calculating the
geometric average growth rates over the years preceding and following portfolio formation. These
directly measure the operating performance of portfolios obtained from a buy-and-hold strategy
and hence correspond to the returns reported in the text. Additionally the earnings for the portfolio
as a whole are much less likely to be negative or very low in any given year.
Since firms entering a portfolio in a formation year t are not required to exist through the entire
period from years t — 5 to t + 5, one further modification to the above procedure is necessary.
As new firms enter the portfolio in year r leading up to the formation year (t — 5 < < t) thetotal amount held in the Portfolio F(1 + r[t — 1, t — 1 + 1]) is equally divided across the
new number of stocks. Thereafter the dollar value held in each stock is calculated based on this
revised amount. Similarly as a stock drops out of the portfolio in year T following the portfolio
formation year (t < T < t + 5) we liquidate the J)OSitiOn in the stock and eciually prorate the
proceeds across the remaining stocks. The subsequent value of each holding is compounded from
this revised amount.
29
References
Baily, Martin N., 1972, Research and development costs and returns: The U.S. pharmaceutical
industry, Journal of Political Economy 80, 70—85.
Chan, Louis K. C., Yasushi Hamao, and Josef Lakonishok, 1991, Fundamentals and stock returns
in Japan, Journal of Finance 46, 1739—1764.
Chan, Louis K. C., Narasimhan Jegadeesh, and Josef Lakonishok, 1996, Momentum strategies,
Journal of Finance 51, 1681—1713.
Chan, Louis K. C., Jason Karceski, and Josef Lakonishok, 1998, The risk and return from factors,
Journal of Financial and Quantitative Analysis 33, 159—188.
DeBondt, Werner F. M., and Richard Thaler, 1985, Does the stock market overreact?, Journal of
Finance 40, 793—805.
Deng, Zhen, Baruch Lev, and Francis Narin, 1999, Science antI technology as predictors of stock
performance, Financial Analysts Journal, forthcoming.
Fama, Eugene F., and Kenneth R. French, 1992, The cross section of expected stock returns,
Journal of Finance 47, 427—465.
Farna, Eugene F., and Kenneth R. French, 1993, Common risk factors in the returns on stocks and
bonds, Journal of Financial Economics 33, 3—56.
Fama, Eugene F., and Kenneth R. French, 1996, Multifactor explanations of asset pricing anomalies,
Journal of Finance 51, 55—84.
Farna, Eugene F., and James MacBeth, 1973, Risk, return and equilibrium: Empirical tests, Journal
of Political Economy 81, 607—636.
Givoly, Dan, and Josef Lakonishok, 1993, Earning growth and the firm-size anomaly, in: Guerard,
John B.,Jr. antI Cultekin, Mustafa N. (Eds.), Handbook of Security Analyst Forecasting and
Asset Allocation, JAI Press, Greenwich CT, 163—183.
30
Hall, Bronwyn H., and Robert E. Hall, 1993, The value and performance of U.S. corporations,
Brookings Papers on Economic Activity 1:1993, 1—34.
Hall, Bronwyn H., Clint Cummins, Elizabeth S. Laderman, and Joy Mundy, 1988, The R&D master
file documentation, NBER Technical Working Paper no. 72.
Hansell, Saul 1998, Investor response shows quirks of Internet deals, New York Times, 24 November
1998.
Hirschey, M., 1982, Intangible aspects of advertising and R&D expenditures, Journal of Industrial
Economics 30, 375—390.
Ikenberry, David, and Josef Lakonishok, 1993, Corporate governance through the proxy contest:
Evidence and implications, Journal of Business 66, 405—435.
Ikenberry, David, Josef Lakonishok, and Theo Vermaelen, 1995, Market underreaction to opeti
market share repurchases, Journal of Financitl Economics 39, 181—208.
Jensen, Michael C., 1993, The modern industrial revolution, exit, and the failure of internal control
systems, Journal of Finance 48, 831—880.
Lakonishok, Josef, and Inmoo Lee, 1998, Are insiders' trades informative?, NBER working paper
6656, University of 1111 nois at Urbana-Champaign.
Lakonishok, Josef, Andrei Shleifer, and Robert W. Vishny, 1994, Contrarian investment, extrapo-
lation, and risk, Journal of Finance 49, 1541—1578.
LaPorta, Rafael, Josef Lakonishok, Andrei Shleifer, and Robert Vishny, 1997, Good news for value
stocks: Further evidence on market efficiency, Journal of Finance 52, 859-874.
Lev, Baruch, and Theodore Sougiannis, 1996, rrhe capitalization, amortization, and value-relevance
of R&D, Journal of Accounting Economics 21, 107—138.
Loughran, Tim, and Jay R. Ritter, 1995, The new issues puzzle, Journal of Financc 50, 23—51.
31

</ref_section>

Tab
le I
In
tens
ity o
f res
earc
h an
d de
velo
pmen
t act
ivity
re
lativ
e to
fir
ms
doin
g R
&D
and
rel
ativ
e to
all
firm
s
For
sele
cted
fis
cal
year
s fr
om 1
975
to 1
995
tota
l R
&D
exp
endi
ture
, R&
D e
xpen
se a
nd R
&D
cap
ital
are
calc
ulat
ed fo
r al
l do
mes
tic fi
rms l
iste
d on
NY
SE,
Am
ex a
nd N
asda
q w
ith d
ata
on th
e C
ompu
stat
file
s. T
he R
&D
tota
ls a
re e
xpre
ssed
as
a pe
rcen
tage
of:
sal
es, e
arni
ngs,
div
iden
ds,
hook
val
ue o
f eq
uity
and
mar
ket
valu
e of
equ
ity.
The
bas
e in
eac
h pe
rcen
tage
cal
cula
tion
is a
ggre
gate
d ov
er t
wo
sets
of f
irm
s: f
irm
s do
ing
R&
D (
pane
l A).
and
all
firm
s (p
anel
B).
Pane
l A:
Rel
ativ
e to
fir
ms
doin
g R
&D
Pane
l B:
Rel
ativ
e to
all
firm
s
Yea
r
R&
D e
xpen
ditu
res a
s pe
rcen
t of:
Sa
les
Ear
ning
s D
ivid
ends
B
ook
valu
e
R&
D e
xpen
se a
s pe
rcen
t of:
Sa
les
Ear
ning
s D
ivid
ends
B
ook
valu
e
R&
D c
apita
l as
pe
rcen
t of
book
val
ue
75
80
85
90
95
0.93
20
.5
48.2
2.
27
0.96
19
.3
49.7
2.
73
1.42
37
.3
69.0
3.
72
1.62
45
.1
73.1
4.
57
1.70
31
.8
80.5
4.
33
0.47
10
.28
24.2
1.
14
0.62
12
.39
31.9
1.
76
1.02
26
.61
49.2
2.
66
1.24
31
.59
56.1
3.
50
1.31
24
.53
62.2
3.
35
5.81
6.
74
9.75
12
.27
11.4
4
Yea
r
R&
D e
xpen
ditu
res
as
perc
ent o
f:
Sale
s E
arni
ngs
Div
iden
ds
Boo
k va
lue
R&
D e
xpen
se a
s pe
rcen
t of:
Sa
les
Ear
ning
s D
ivid
ends
B
ook
valu
e
R&
D c
apita
l as
pe
rcen
t of
bo
ok v
alue
75
80
85
90
95
1.70
36
.1
84.1
4.
13
1.78
34
.4
87.6
5.
08
3.01
83
.7
145.
8 8.
11
3.40
79
.4
148.
9 9.
59
3.75
65
.3
165.
2 10
.88
0.86
18
.14
42.3
2.
08
1.15
22
.13
56.2
3.
27
2.14
59
.71
104.
0 5.
79
2.61
60
.86
114.
2 7.
35
2.90
50
.42
127.
6 8.
41
10.5
5 12
.55
21.2
5 25
.76
28.7
3

Table IISelected industries ranked by 1995 research and development expenditure
as percent of sales
All domestic firms listed on NYSE, Amex and Nasdaq with data on the Compustat files are grouped into industryclassifications based on SIC codes. For each industry total R&D expenditure, R&D expense and R&D capital arecalculated and expressed as a percentage of: sales, earnings, dividends, and book value of equity, for the industry.Based on data for fiscal year 1995, results are reported for selected industries, ranked by their R&D expenditurerelative to sales, and comprising at least ten firms.
Panel A: R&D expenditures
SIC Industry Sales
R&D expenditure aspercent of:
Earnings DividendsBookvalue
737 Computer programming, software &services
16.6 207.1 2833.0 27.5
283 Drugs & pharmaceuticals 11.9 92.2 192.0 21.1357 Computers & office equipment .7.1 159.3 1242.4 21.038 Measuring instruments 5.6 89.8 276.9 13.036 Electrical equipment excluding computers 4.9 58.2 242.2 10.348 Communications 3.7 98.1 80.2 13.7
37 Transportation equipment
Panel B: R&D e
3.6
xpense
125.5 297.5 16.6
R&D expense aspercent of:
SIC Industry Sales Earnings DividendsBookvalue
737 Corriputer programming, software &services
6.8 85.2 1165.2 11.3
283 Drugs & pharmaceuticals 7.9 61.7 128.5 14.1357 Computers & office equipment 5.8 130.7 1019. .8 17.338 Measuring instruments 4.9 79.5 24.5.0 11.536 Electrical equipment excluding computers 3.4 40.0 166.5 7.148 Communications 2.9 78.3 64.0 10.937 Transportation equipment. 3.0 105.1 249.1 13.9
Panel C: R&D capital
SIC Industry
R&D capital aspercent ofbook value
73728335738364837
Computer programming software & servicesDrugs & pharmaceuticalsCoiriputers & office equipmentMeasuring instrumentsElectrical equipment excluding compu tersCornriiunicationsTransportation eciuipirient
54.953.355.936.625.636.446.1
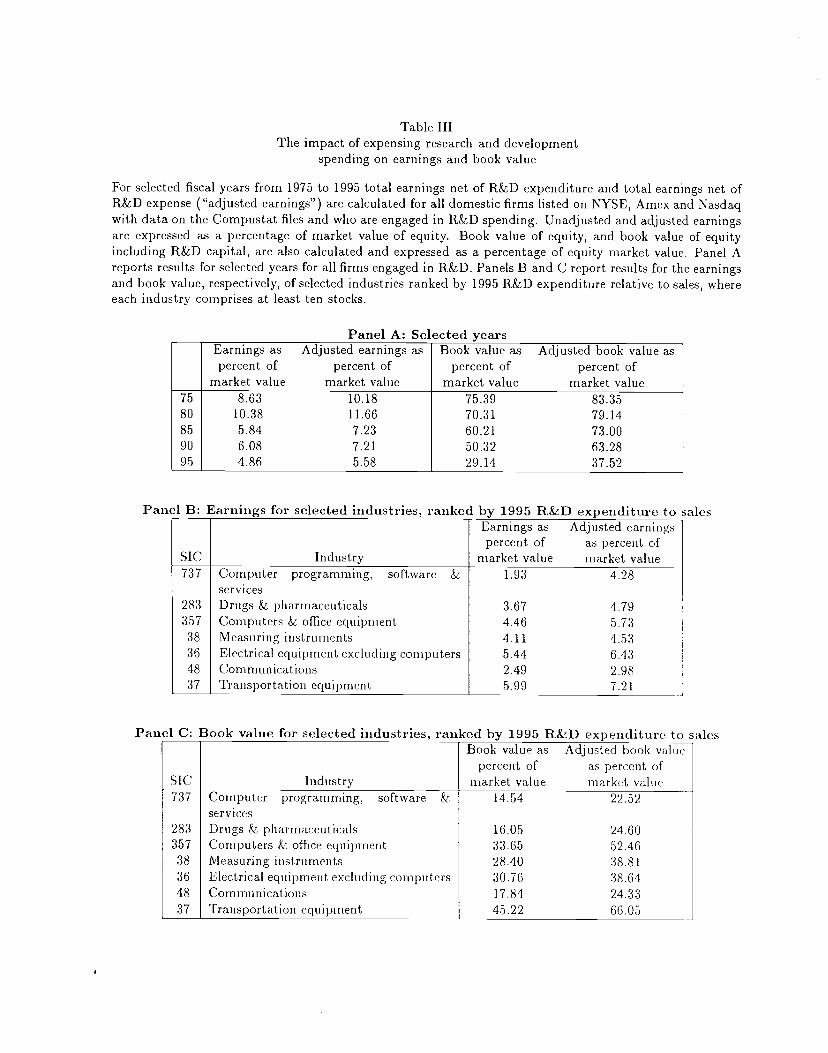
Table IIIThe impact of expensing research and development
spending on earnings and book value
For selected fiscal years from 1975 to 1995 total earnings net of R&D expenditure and total earnings net ofR&D expense ("adjusted earnings") are calculated for all domestic firms listed on NYSE, Amex and Nasdaqwith data on the Compustat files and who are engaged in R&D spending. Unadjusted and adjusted earningsare expressed as a percentage of market value of equity. Book value of equity, and book value of equityincluding R&D capital, are also calculated and expressed as a percentage of equity market value. Panel Areports results for selected years for all firms engaged in R&D. Panels B and C report results for the earningsand book value, respectively, of selected industries ranked by 1995 R&D expenditure relative to sales, whereeach industry comprises at least ten stocks.
Panel A: Selected years
Panel B: Earnings for selected industries, ranked by 1995 R&D expenditure to ;ales
SIC Industry
Earnings as Adjusted earningspercent of as percent of
market value market value737
283357
38364837
Computer programming, software &servicesDrugs & pharmaceuticalsComputers & oflice equipmentMeasuring instrumentsElectrical equipment excluding computersCommunicationsTransportation equipment
1.93 4.28
3.67 4.794.46 5.734.11 4.535.44 6.432.49 2.985.99 7.21
Panel C: Book value for selected industries, ranked by 1995 R&D expenditure to sales
SIC Industry
Book value as Adjusted book valuepercent of as percent of
market value market value737
28335738364837
Computer programming, software &servicesDrugs & pharmaceuticalsComputers & office equipmentMeasuring instrumentsElectrical equipment excluding computersCommunicationsTransportation equipment
14.54 22.52
16.05 24.6033.65 .52.4628.40 38.8130.76 38.6117.84 24.3345.22 66.05
Earnings as Adjusted earnings aspercent of percent of
market value market value
Book value as Adjusted book value aspercent of percent of
market value market value7580859095
8.63 10.1810.38 11.665.84 7.236.08 7.214.86 5.58
75.39 83.3570.31 79.1460.21 73.0050.32 63.2829.14 37.52
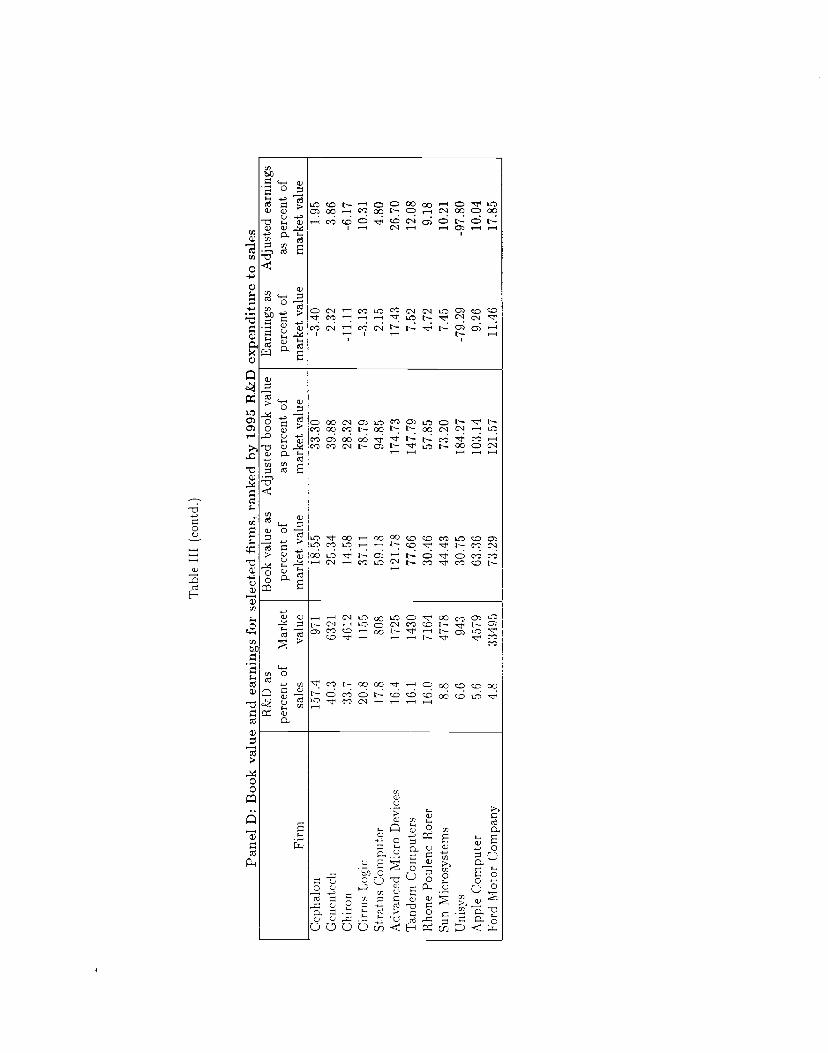
Tab
le II
I (c
ontd
.)
Pane
l D
: B
ook
valu
e an
d ea
rnin
gs f
or s
elec
ted
firm
s, r
anke
d by
199
5 R
&D
exp
endi
ture
to s
ales
Firm
RD
as
perc
ent
of
sale
s M
arke
t va
lue
Boo
k va
lue
as
perc
ent
of
mar
ket
valu
e
Adj
uste
d bo
ok v
alue
as
per
cent
of
mar
ket v
alue
Ear
ning
s as
pe
rcen
t of
mar
ket v
alue
Adj
uste
d ea
rnin
gs
as p
erce
nt o
f m
arke
t va
lue
Cep
halo
n 15
7.4
971
18.5
5 33
.30
-3.4
0 1.
95
Gen
ente
ch
40.3
63
21
25.3
4 39
.88
2.32
3.
86
Chi
ron
33.7
46
12
14.5
8 28
.32
-11.
11
-6.1
7 C
irru
s L
ogic
20
.8
1155
37
.11
78.7
9 -3
.13
10.3
1 St
ratu
s C
ompu
ter
17.8
80
8 59
.18
94.8
5 2.
15
4.80
A
dvan
ced
Mic
ro D
evic
es
16.4
17
25
121.
78
174.
73
17.4
3 26
.70
Tan
dem
Com
pute
rs
16.1
14
30
77.6
6 14
7.79
7.
52
12.0
8 R
hone
Pou
lenc
Ror
er
16.0
71
64
30.4
6 57
.85
4.72
9.
18
Sun
Mic
rosy
stem
s 8.
8 47
78
44.4
3 73
.20
7.45
10
.21
Uni
sys
6.6
943
30.7
5 18
4.27
-7
9.29
-9
7.80
A
pple
Com
pute
r 5.
6 45
79
63.3
6 10
3.14
9.
26
10.0
4 Fo
rd M
otor
Com
pany
4.
8 33
495
73.2
9 12
1.57
11
.46
17.8
5
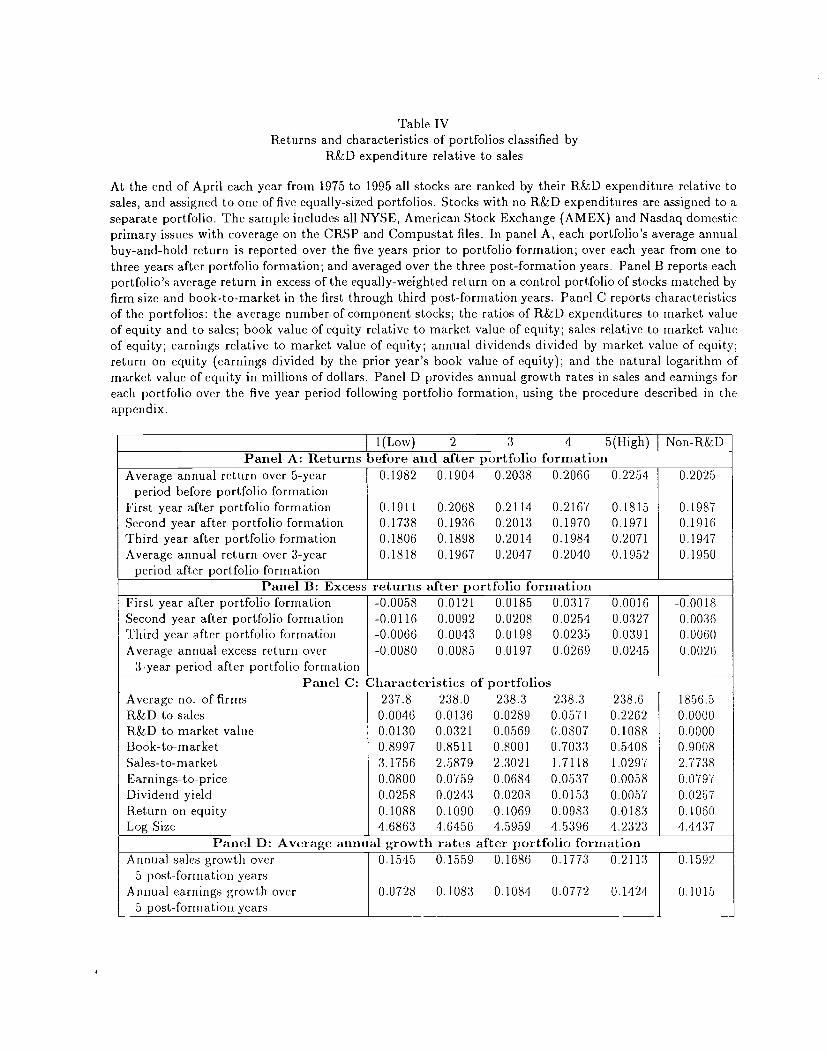
Table IVReturns and characteristics of portfolios classified by
R&D expenditure relative to sales
At the end of April each year from 1975 to 1995 all stocks are ranked by their R&D expenditure relative tosales, and assigned to one of five equally-sized portfolios. Stocks with no R&D expenditures are assigned to aseparate portfolio. The sample includes all NYSE, American Stock Exchange (AMEX) and Nasdaq domesticprimary issues with coverage on the CRSP and Compustat files. In panel A, each portfolio's average annualbuy-and-hold return is reported over the five years prior to portfolio formation; over each year from one tothree years after portfolio formation; and averaged over the three post-formation years. Panel B reports eachportfolio's average return in excess of the equally-weighted return on a control portfolio of stocks matched byfirm size and book-to-market in the first through third post-formation years. Panel C reports characteristicsof the portfolios: the average number of component stocks; the ratios of R&D expenditures to market valueof equity and to sales; book value of equity relative to market value of equity; sales relative to market valueof equity; earnings relative to market value of equity; annual dividends divided by market value of equity;return on equity (earnings divided by the prior year's book value of equity); and the natural logarithm ofmarket value of equity in millions of dollars. Panel D provides annual growth rates in sales and earnings foreach portfolio over the five year period following portfolio formation, using the procedure described in theappendix.
I 1(Low) 2 3 4 5(High) Non-R&DPanel A: Returns before and after portfolio forHiation
Average annual return over 5-yearperiod before portfolio formation
First year after portfolio formationSecond year after portfolio formationThird year after portfolio formationAverage annual return over 3-year
period after portfolio formation
0.1982 0.1904 0.2038 0.2066 0.2254
0.1911 0.2068 0.2114 0.2167 0.18150.1738 0.1936 0.2013 0.1970 0.19710.1806 0.1898 0.2014 0.1984 0.20710.1818 0.1967 0.2047 0.2040 0.1952
0.2025
0.19870.19160.19470.1950
Panel B: Excess returns after portfolio formationFirst year after portfolio formationSecond year after portfolio formationThird year after portfolio formationAverage annual excess return over
3-year period after portfolio formation
-0.0058 0.0121 0.0185 0.0317 0.0016-0.0116 0.0092 0.0208 0.0254 0.0327-0.0066 0.0043 0.0 198 0.0235 0.039 1-0.0080 0.0085 0.0197 0.0269 0.0245
-0.00180.00360.00600.0026
Panel C: Characteristics of portfoliosAverage no. of firmsR&D to salesR&D to market valueBook-to-marketSales-to-marketEarnings-to-priceDividend yieldReturn on equityLog Size
237.8 238.0 238.3 238.3 238.60.0046 0.0 136 0.0289 0.057] 0.22620.0130 0.0321 0.0569 0.0807 0.10880.8997 0.8511 0.8001 0.7033 0.54083.1756 2.5879 2.3021 1.7118 1.02970.0800 0.0759 0.0684 0.0537 0.00580.0258 0.0243 0.0208 0.0153 0.00570.1088 0.1090 0.1069 0.0983 0.01834.6863 4.6456 4.5959 4.5396 4.2323
1856.50.00000.00000.90082.77380.07970.02570.10604.4437
Panel D: Average annual growth rates after portfolio formationAnnual sales growth over
5 post-formation yearsAnnual earnings growth over
5 post-formation years
0.1545 0.1559 0.1686 0.1773 0.2113
0.0728 0.1083 0.1084 0.0772 0.1424
0.1592
0.1015
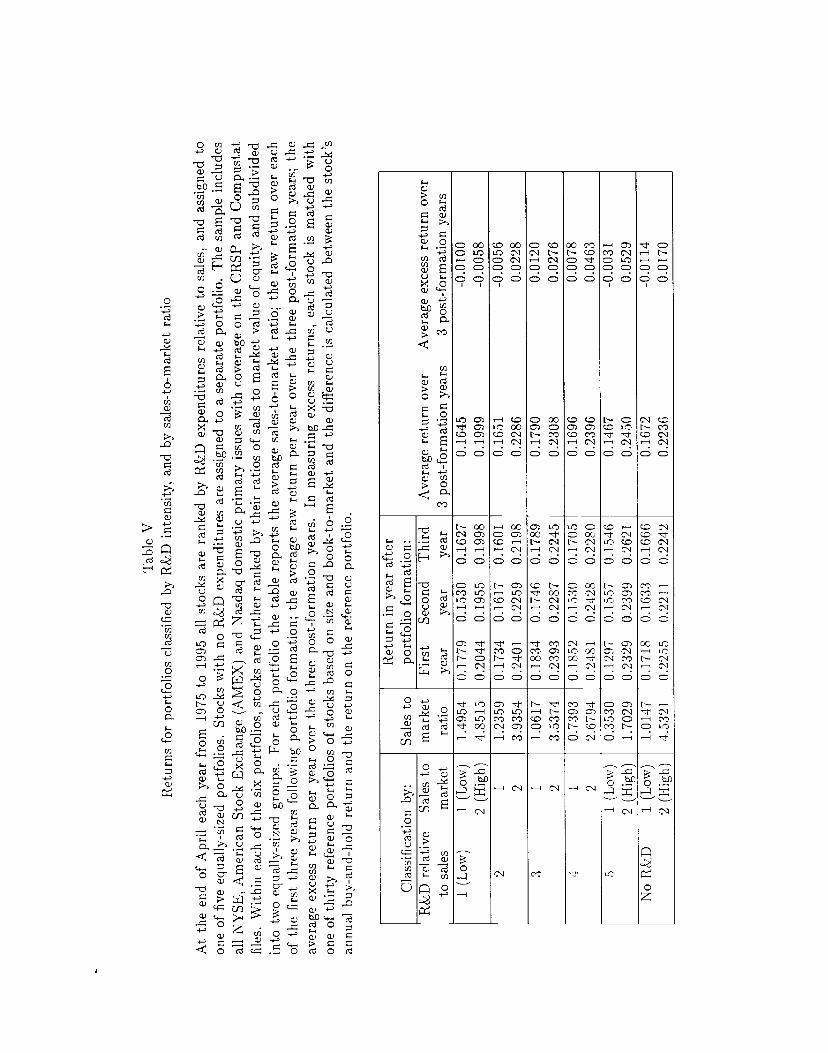
Tab
le V
Ret
urns
for
por
tfol
ios
clas
sifi
ed b
y R
&D
int
ensi
ty,
and
by s
ales
-to-
mar
ket r
atio
At
the
end
of A
pril
each
yea
r fr
om 1
975
to 1
995
all
stoc
ks a
re r
anke
d by
R&
D e
xpen
ditu
res
rela
tive
to s
ales
, an
d as
sign
ed t
o on
e of
five
equ
ally
-siz
ed
port
folio
s.
Stoc
ks w
ith n
o R
&D
exp
endi
ture
s ar
e as
sign
ed t
o a
sepa
rate
por
tfol
io.
The
sam
ple
incl
udes
al
l N
YSE
, A
mer
ican
Sto
ck E
xcha
nge
(AM
EX
) an
d N
asda
q do
mes
tic p
rim
ary
issu
es w
ith c
over
age
on th
e C
RSP
and
Com
pust
at
file
s. W
ithin
eac
h of
the
six
port
folio
s, s
tock
s ar
e fu
rthe
r ra
nked
by
thei
r ra
tios
of s
ales
to
mar
ket
valu
e of
equ
ity a
nd s
ubdi
vide
d in
to t
wo
equa
lly-s
ized
gr
oups
. Fo
r ea
ch p
ortf
olio
the
tabl
e re
port
s th
e av
erag
e sa
les-
to-m
arke
t rat
io;
the
raw
ret
urn
over
eac
h of
the
firs
t th
ree
year
s fo
llow
ing
port
folio
form
atio
n; t
he a
vera
ge ra
w r
etur
n pe
r ye
ar o
ver
the
thre
e po
st-f
orm
atio
n ye
ars;
the
av
erag
e ex
cess
ret
urn
per
year
ove
r th
e th
ree
post
-for
mat
ion
year
s.
In m
easu
ring
exc
ess
retu
rns,
eac
h st
ock
is m
atch
ed w
ith
one
of th
irty
refe
renc
e po
rtfo
lios
of st
ocks
bas
ed o
n si
ze a
nd b
ook-
to-m
arke
t and
the
dif
fere
nce
is c
alcu
late
d be
twee
n th
e st
ock'
s an
nual
buy
-and
-hol
d re
turn
and
the
ret
urn
on t
he r
efer
ence
por
tfol
io.
Cla
ssif
icat
ion
by:
Sale
s to
m
arke
t ra
tio
Ret
urn
in y
ear
afte
r po
rtfo
lio fo
rmat
ion:
A
vera
ge re
turn
ove
r A
vera
ge e
xces
s re
turn
ove
r 3
post
-for
mat
ion
year
s 3
post
-for
mat
ion
year
s R
&D
rel
ativ
e Sa
les
to
to sa
les
mar
ket
Firs
t Se
cond
T
hird
ye
ar
year
ye
ar
1 (L
ow)
1 (L
ow)
2 (H
igh)
1.49
54
4.85
15
0.17
79
0.15
30
0.16
27
0.20
44
0.19
55
0.19
98
0.16
45
-0.0
100
0.19
99
-0.0
058
2 1 2
1.23
59
3.93
54
0.17
34
0.16
17
0.16
01
0.24
01
0.22
59
0.21
98
0.16
51
-0.0
056
0.22
86
0.02
28
3 1 2
1.06
17
3.53
74
0.18
34
0.17
46
0.17
89
0.23
93
0.22
87
0.22
45
0.17
90
0.01
20
0.23
08
0.02
76
4 1 2
0.73
93
2.67
94
0.18
52
0.15
30
0.17
05
0.24
81
0.24
28
0.22
80
0.16
96
0.00
78
0.23
96
0.04
63
5 1
(Low
) 2
(Hig
h)
0.35
30
1.70
29
0.12
97
0.15
57
0.15
46
0.23
29
0.23
99
0.26
21
0.14
67
-0.0
031
0.24
50
0.05
29
No
R&
D
1 (L
ow)
2 (I
-Ugh
)
1.01
47
4.53
21
0.17
18
0.16
33
0.16
66
0.22
55
0.22
11
0.22
42
0.16
72
-0.0
114
0.22
36
0.01
70
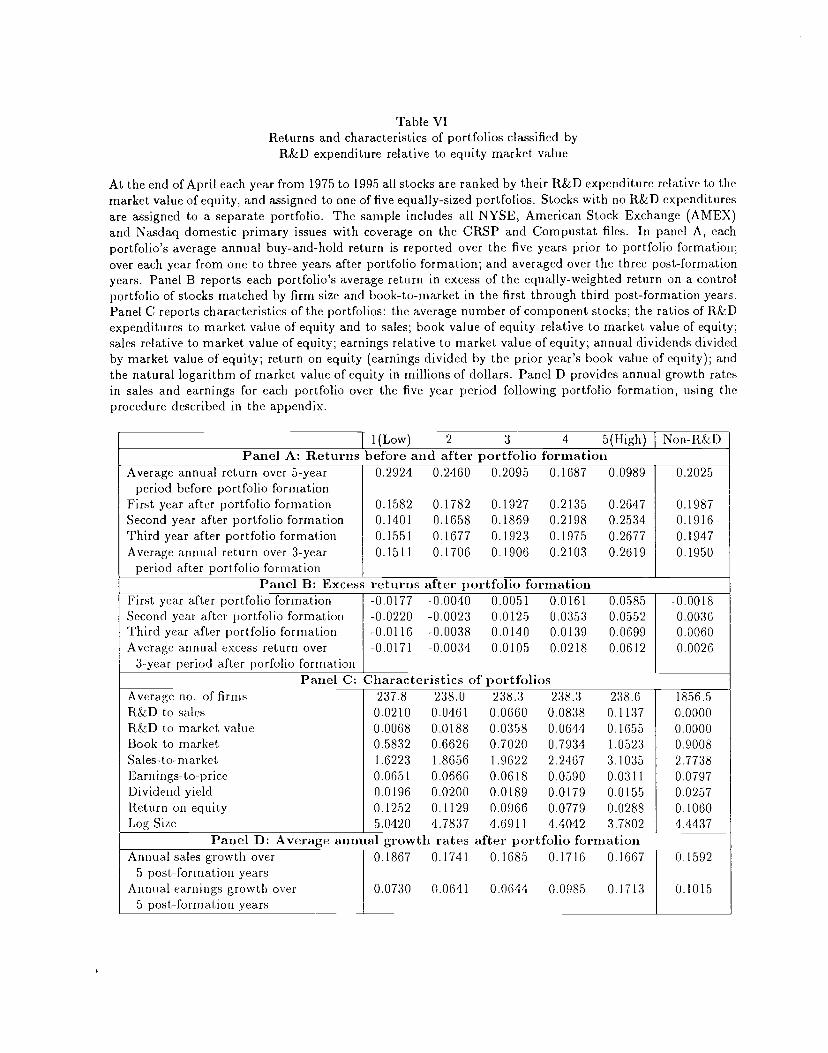
Table VIReturns and characteristics of portfolios classified by
R&D expenditure relative to equity market value
At the end of April each year from 1975 to 1995 all stocks are ranked by their R&D expenditure relative to themarket value of equity, and assigned to one of five equally-sized portfolios. Stocks with no R&D expendituresare assigned to a separate portfolio. The sample includes all NYSE, American Stock Exchange (AMEX)and Nasdaq domestic primary issues with coverage on the CRSP and Compustat files. In panel A, eachportfolio's average annual buy-and-hold return is reported over the five years prior to portfolio formation;over each year from one to three years after portfolio formation; and averaged over the three post-formationyears. Panel B reports each portfolio's average return in excess of the equally-weighted return on a controlportfolio of stocks matched by firm size and book-to-market in the first through third post-formation years.Panel C reports characteristics of the portfolios: the average number of component stocks; the ratios of R&Dexpenditures to market value of equity and to sales; book value of equity relative to market value of equity;sales relative to market value of equity; earnings relative to market value of equity; annual dividends dividedby market value of equity; return on equity (earnings divided by the prior year's book value of equity); andthe natural logarithm of market value of equity in millions of dollars. Panel D provides annual growth ratesin sales and earnings for each portfolio over the five year period following portfolio formation, using theprocedure described in the appendix.
l(Low) 2 3 4 5(High) I Non-R&DPanel A: Returns before and after portfolio formation
Average annual return over 5-yearperiod before portfolio formation
First year after portfolio formationSecond year after portfolio formationThird year after portfolio formationAverage annual return over 3-year
period after portfolio formation
0.2924 0.2460 0.2095 0.1687 0.0989
0.1582 0.1782 0.1927 0.2135 0.26470.1401 0.1658 0.1869 0.2198 0.25340.1551 0.1677 0.1923 0.1975 0.26770.1511 0.1706 0.1906 0.2103 0.2619
0.2025
0.19870.19160.19470.1950
Panel B: Excess returns after portfolio formationFirst year after portfolio formationSecond year after portfolio formationThird year after portfolio formationAverage annual excess return over
3-year period after porfolio forrnatioii
-0.0177 -0.0040 0.0051 0.0161 0.0.585-0.0220 -0.0023 0.0125 0.0353 0.0552-0.0116 -0.0038 0.0140 0.0139 0.0699-0.0171 -0.0034 0.0105 0.0218 0.0612
-0.00180.00360.00600.0026
Panel C: Characteristics of portfoliosAverage no. of firmsR&D to salesR&D to market valueBook-to-marketSales-to-marketEarnings-to-priceDividend yieldReturn on equityLog Size
237.8 238.0 238.3 238.3 238.60.02 10 0.046 1 0.0660 0.0838 0.11370.0068 0.0188 0.0358 0.0644 0.16550.5832 0.6626 0.7020 0.7934 1.05231.6223 1.8656 1.9622 2.2467 3.10350.0651 0.0666 0.0618 0.0590 0.03110.0196 0.0200 0.0189 0.0179 0.01550.1252 0.1129 0.0966 0.0779 0.02885.0420 4.7837 4.6911 4.4042 3.7802
1856.50.00000.00000.90082.77380.07970.02570.10604.4437
Panel D: Average annual growth rates after portfolio formationAnnual sales growth over
5 post-formation yearsAnnual earnings growth over
5 post-formation_years
0.1867 0.1741 0.1685 0.1716 0.1667
0.0730 0.0641 0.0644 0.0985 0.1713
0.1592
0.1015
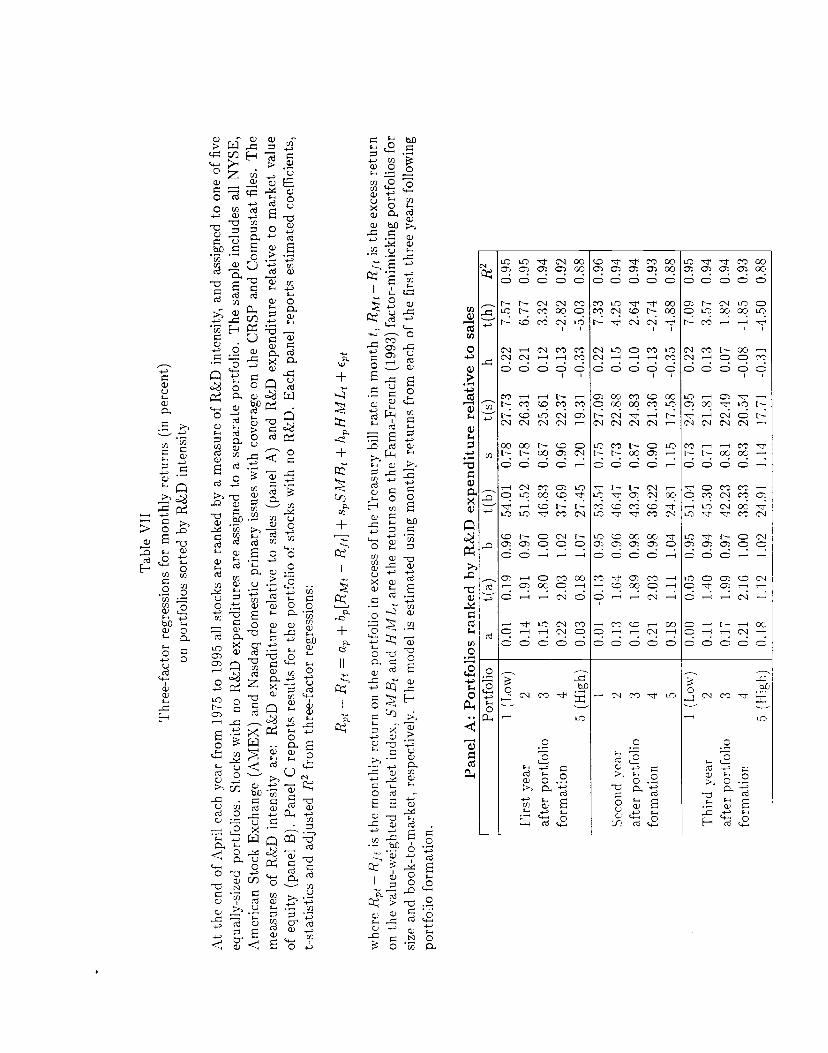
Tab
le V
II
Thr
ee-f
acto
r re
gres
sion
s fo
r m
onth
ly r
etur
ns (
in p
erce
nt)
on p
ortf
olio
s so
rted
by
R&
D i
nten
sity
At
the
end
of A
pril
each
yea
r fr
om 1
975
to 1
995
all
stoc
ks a
re r
anke
d by
a m
easu
re o
f R
&D
int
ensi
ty,
and
assi
gned
to
one
of fi
ve
equa
lly-s
ized
po
rtfo
lios.
St
ocks
with
no
R&
D e
xpen
ditu
res
are
assi
gned
to
a se
para
te p
ortf
olio
. T
he s
ampl
e in
clud
es a
ll N
YSE
, A
mer
ican
Sto
ck E
xcha
nge
(AM
EX
) an
d N
asda
q do
mes
tic p
rim
ary
issu
es w
ith c
over
age
on t
he C
RSP
and
Com
pust
at fi
les.
The
m
easu
res
of R
&D
int
ensi
ty a
re:
R&
D e
xpen
ditu
re r
elat
ive
to s
ales
(pa
nel
A)
and
R&
D e
xpen
ditu
re r
elat
ive
to m
arke
t va
lue
of e
quity
(pa
nel B
). P
anel
C r
epor
ts r
esul
ts fo
r th
e po
rtfo
lio o
f sto
cks
with
no
R&
D.
Eac
h pa
nel
repo
rts
estim
ated
coe
ffic
ient
s,
t-st
atis
tics
and
adju
sted
R2
from
thr
ee-f
acto
r re
gres
sion
s:
— R
f = a
+ b[
RM
j —
R
j] +
sSM
B +
hH
ML
+
whe
re
— R
j is
the
mon
thly
retu
rn o
n th
e po
rtfo
lio in
exc
ess
of th
e T
reas
ury
bill
rate
in m
onth
t, R
M —
Rj i
s th
e ex
cess
ret
urn
on t
he v
alue
-wei
ghte
d m
arke
t ind
ex,
SMB
and
IJi
VIL
are
the
retu
rns
on th
e Fa
ma-
Fren
ch (1
993)
fact
or-m
imic
king
port
folio
s for
si
ze a
nd b
ook-
to-m
arke
t, re
spec
tivel
y.
The
mod
el i
s es
timat
ed u
sing
mon
thly
ret
urns
fro
m e
ach
of th
e fi
rst t
hree
yea
rs fo
llow
ing
port
folio
form
atio
n.
Pane
l A:
Port
folio
s ra
nked
by
R&
D e
xpen
ditu
re r
elat
ive
to s
ales
Po
rtfo
lio
a t(
a)
b t(
b)
s t(
s)
h t(
h)
R2
1 (L
ow)
Firs
t yea
r 2
afte
r po
rtfo
lio
3
form
atio
n 4
5 (H
igh)
0.01
0.
19
0.96
54
.01
0.78
27
.73
0.22
7.
57
0.95
0.
14
1.91
0.
97
51.5
2 0.
78
26.3
1 0.
21
6.77
0.
95
0.15
1.
80
1.00
46
.83
0.87
25
.61
0.12
3.
32
0.94
0.
22
2.03
1.
02
37.6
9 0.
96
22.3
7 -0
.13
-2.8
2 0.
92
0.03
0.
18
1.07
27
.45
1.20
19
.31
-0.3
3 -5
.03
0.88
1
Seco
nd y
ear
2
afte
r po
rtfo
lio
3
form
atio
n 4 5
-0.0
1 -0
.13
0.95
53
.54
0.75
27
.09
0.22
7.
33
0.96
0.
13
1.64
0.
96
46.4
7 0.
73
22.8
8 0.
15
4.25
0.
94
0.16
1.
89
0.98
43
.97
0.87
24
.83
0.10
2.
64
0.94
0.
21
2.03
0.
98
36.2
2 0.
90
21.3
6 -0
.13
-2.7
4 0.
93
0.18
1.
11
1.04
24
.81
1.15
17
.58
-0.3
5 -4
.88
0.88
1
(Low
) 0.
00
0.05
0.
95
51.0
4 0.
73
24.9
5 0.
22
7.09
0.
95
Thi
rd y
ear
2 0.
11
1.40
0.
94
45.3
0 0.
71
21.8
1 0.
13
3.57
0.
94
afte
r po
rtfo
lio
3 0.
17
1.99
0.
97
42.2
3 0.
81
22.4
9 0.
07
1.82
0.
94
form
atio
n 4
0.21
2.
16
1.00
38
.33
0.83
20
.54
-0.0
8 -1
.85
0.93
5
(Hig
h)
0.18
1.
12
1.02
24
.91
1.14
17
.71
-0.3
1 -4
.50
0.88
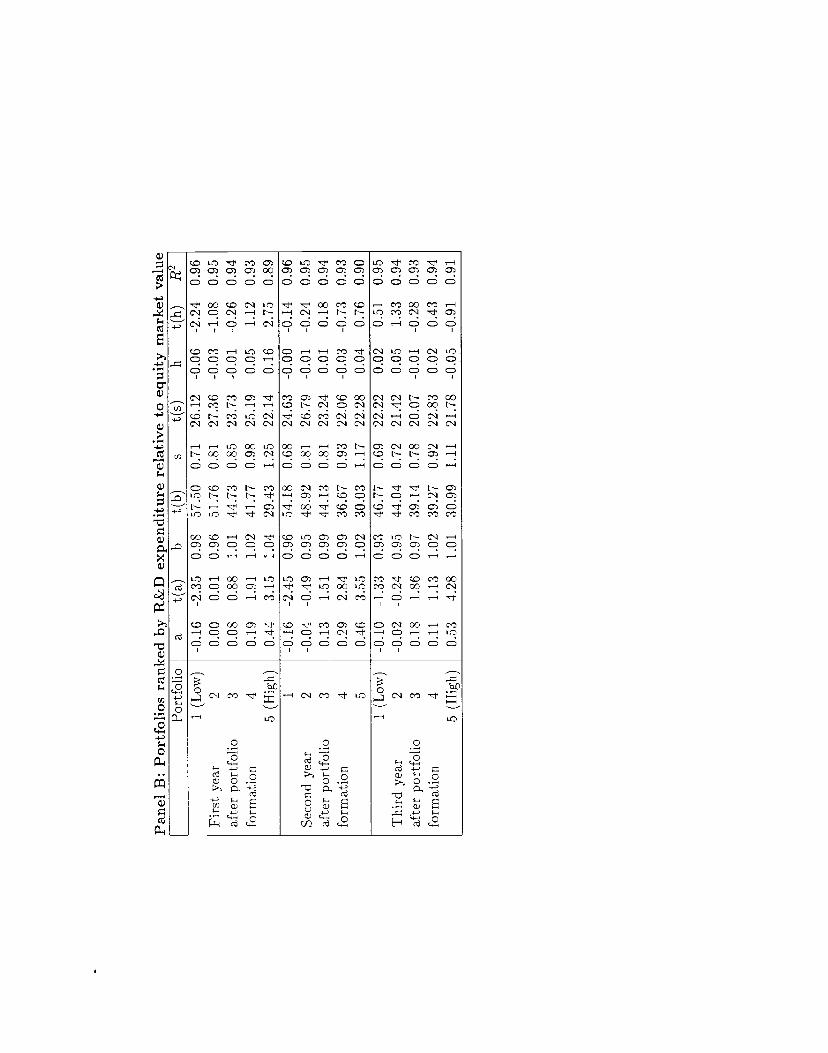
Pane
l B:
Port
folio
s ra
nked
by
R&
D e
xpen
ditu
re r
elat
ive
to e
quity
mar
ket v
alue
Po
rtfo
lio
a t(
a)
b t(
b)
s t(
s)
h t(
h)
R2
1 (L
ow)
Firs
t yea
r 2
afte
r po
rtfo
lio
3
form
atio
n 4
5 (H
igh)
-0.1
6 -2
.35
0.98
57
.50
0.71
26
.12
-0.0
6 -2
.24
0.96
0.
00
0.01
0.
96
51.7
6 0.
81
27.3
6 -0
.03
-1.0
8 0.
95
0.08
0.
88
1.01
44
.73
0.85
23
.73
-0.0
1 -0
.26
0.94
0.
19
1.91
1.
02
41.7
7 0.
98
25.1
9 0.
05
1.12
0.
93
0.44
3.
15
1.04
29
.43
1.25
22
.14
0.16
2.
75
0.89
1
Seco
nd y
ear
2 af
ter
port
folio
3
form
atio
n 4 5
-0.1
6 -2
.45
0.96
54
.18
0.68
24
.63
-0.0
0 -0
.14
0.96
-0
.04
-0.4
9 0.
95
48.9
2 0.
81
26.7
9 -0
.01
-0.2
4 0.
95
0.13
1.
51
0.99
44
.13
0.81
23
.24
0.01
0.
18
0.94
0.
29
2.84
0.
99
36.6
7 0.
93
22.0
6 -0
.03
-0.7
3 0.
93
0.46
3.
55
1.02
30
.03
1.17
22
.28
0.04
0.
76
0.90
1
(Low
) T
hird
yea
r 2
afte
r por
tfol
io
3
form
atio
n 4
5 (H
igh)
-0.1
0 -1
.33
0.93
46
.77
0.69
22
.22
0.02
0.
51
0.95
-0
.02
-0.2
4 0.
95
44.0
4 0.
72
21.4
2 0.
05
1.33
0.
94
0.18
1.
86
0.97
39
.14
0.78
20
.07
-0.0
1 -0
.28
0.93
0.
11
1.13
1.
02
39.2
7 0.
92
22.8
3 0.
02
0.43
0.
94
0.53
4.
28
1.01
30
.99
1.11
21
.78
-0.0
5 -0
.91
0.91
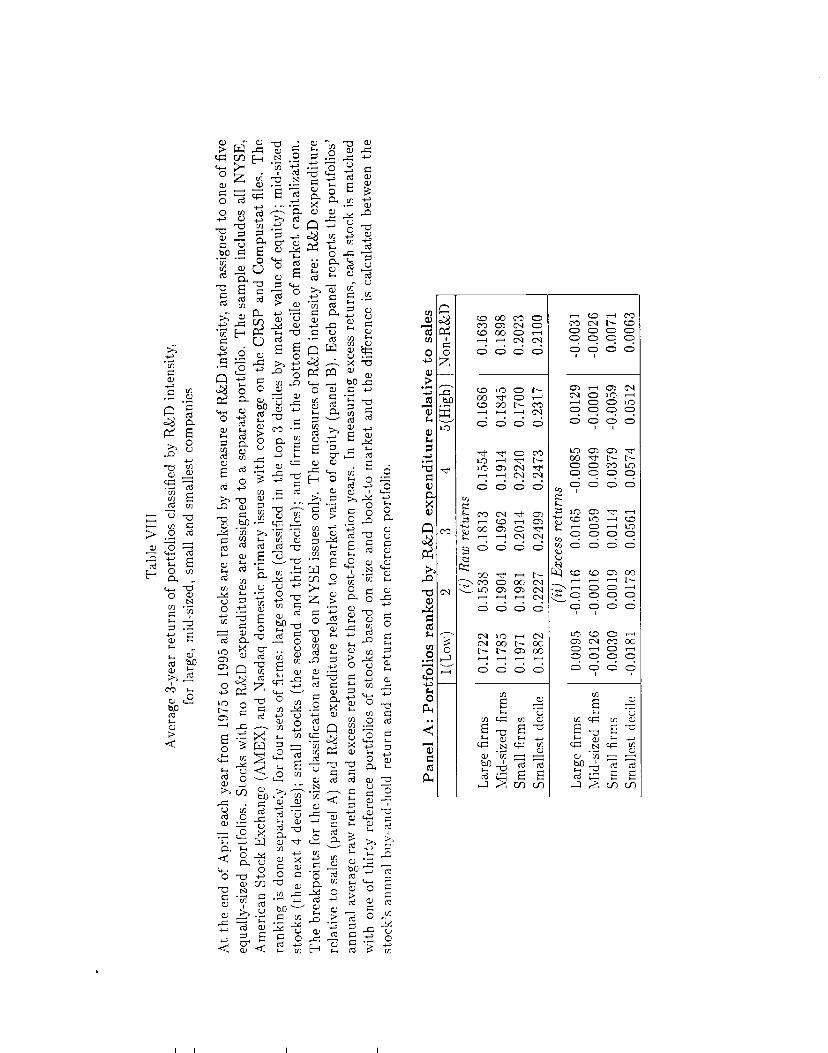
Tab
le V
III
Ave
rage
3-y
ear r
etur
ns o
f por
tfol
ios c
lass
ifie
d by
R&
D in
tens
ity,
for
larg
e, m
id-s
ized
, sm
all
and
smal
lest
com
pani
es
At t
he e
nd o
f Apr
il ea
ch y
ear
from
197
5 to
199
5 al
l st
ocks
are
ran
ked
by a
mea
sure
of R
&D
inte
nsity
, an
d as
sign
ed t
o on
e of
five
equa
lly-s
ized
por
tfol
ios.
St
ocks
with
no
R&
D e
xpen
ditu
res
are
assi
gned
to
a se
para
te p
ortf
olio
. T
he s
ampl
e in
clud
es a
ll N
YSE
, A
mer
ican
Sto
ck E
xcha
nge
(AM
EX
) an
d N
asda
q do
mes
tic p
rim
ary
issu
es w
ith c
over
age
on th
e C
RSP
and
Com
pust
at f
iles.
The
rank
ing
is d
one
sepa
rate
ly f
or f
our s
ets
of fi
rms:
la
rge
stoc
ks (c
lass
ifie
d in
the
top
3 d
ecile
s by
mar
ket
valu
e of
equ
ity);
mid
-siz
ed
stoc
ks (
the
next
4 d
ecile
s);
smal
l sto
cks
(the
sec
ond
and
thir
d de
cile
s);
and
firm
s in
the
bot
tom
dec
ile o
f m
arke
t ca
pita
lizat
ion.
T
he b
reak
poin
ts fo
r th
e si
ze c
lass
ific
atio
n ar
e ba
sed
on N
YSE
issu
es o
nly.
The
mea
sure
s of
R&
D in
tens
ity a
re:
R&
D e
xpen
ditu
re
rela
tive
to sa
les
(pan
el A
) an
d R
&D
exp
endi
ture
rel
ativ
e to
mar
ket
valu
e of
equ
ity (
pane
l B).
Eac
h pa
nel r
epor
ts t
he p
ortf
olio
s'
annu
al a
vera
ge ra
w r
etur
n an
d ex
cess
ret
urn
over
thr
ee p
ost-
form
atio
n ye
ars.
In
mea
suri
ng e
xces
s re
turn
s, e
ach
stoc
k is
mat
ched
w
ith o
ne o
f th
irty
ref
eren
ce p
ortf
olio
s of
sto
cks
base
d on
siz
e an
d bo
ok-t
o-m
arke
t and
the
dif
fere
nce
is c
alcu
late
d be
twee
n th
e st
ock'
s an
nual
buy
-and
-hol
d re
turn
and
the
ret
urn
on t
he r
efer
ence
por
tfol
io.
Pane
l A:
Port
folio
s ra
nked
by
R&
D e
xpen
ditu
re r
elat
ive
to s
ales
1(
Low
) 2
3 4
5(H
igh)
N
on-R
&D
(i)
Raw
ret
urns
Lar
ge fi
rms
0.17
22
0.15
38
0.18
13
0.15
54
0.16
86
0.16
36
Mid
-siz
ed f
irm
s 0.
1785
0.
1904
0.
1962
0.
1914
0.
1845
0.
1898
Sm
all f
irm
s 0.
1971
0.
1981
0.
2014
0.
2240
0.
1700
0.
2023
Sm
alle
st d
ecile
0.
1882
0.
2227
0.
2499
0.
2473
0.
2317
0.
2100
Lar
ge fi
rms
Mid
-siz
ed f
irm
s Sm
all
firm
s Sm
alle
st d
ecile
(ii)
Exc
ess
retu
rns
0.00
95
-0.0
116
0.01
65
-0.0
085
0.01
29
-0.0
126
-0.0
016
0.00
59
0.00
49
-0.0
001
0.00
30
0.00
19
0.01
14
0.03
79
-0.0
059
-0.0
181
0.01
78
0.05
61
0.05
74
0.05
12
-0.0
031
-0.0
026
0.00
71
0.00
63
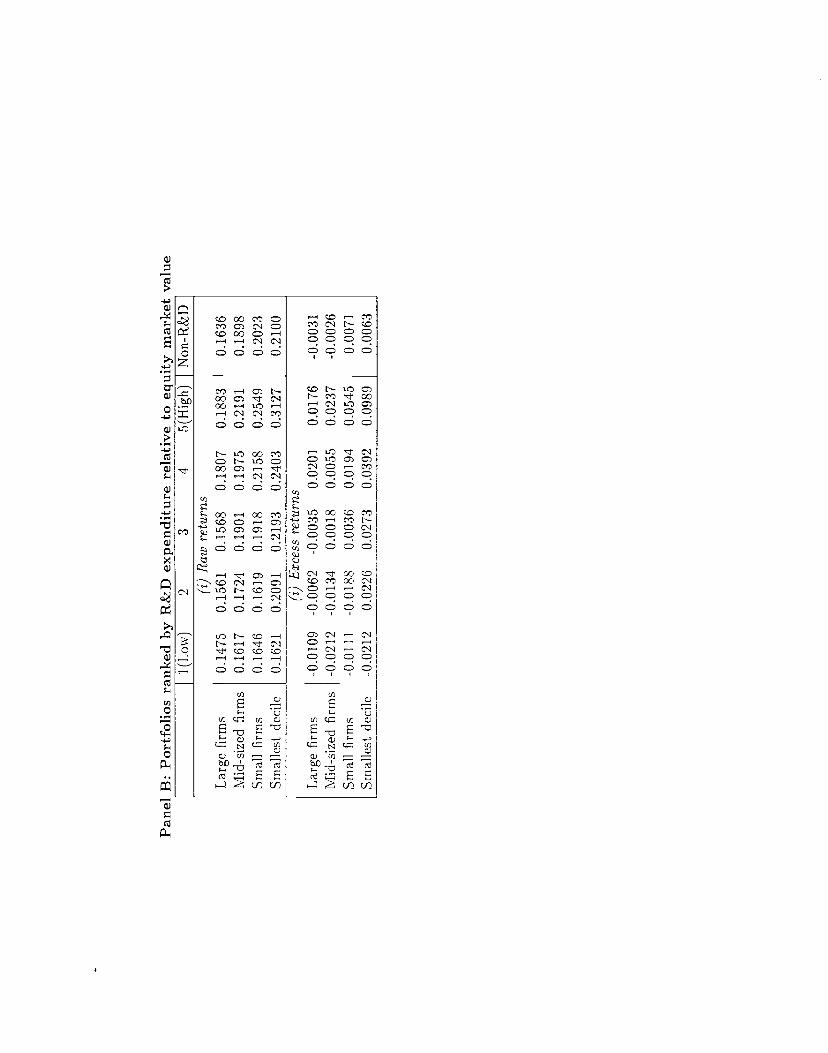
Pane
l B:
Port
folio
s ra
nked
by
R&
D e
xpen
ditu
re r
elat
ive
to e
quity
mar
ket v
alue
1(
Low
) 2
3 4
5(H
igh)
N
on-R
&D
(i)
Raw
retu
rns
Lar
ge f
irm
s 0.
1475
0.
1561
0.
1568
0.
1807
0.
1883
0.
1636
M
id-s
ized
fir
ms
0.16
17
0.17
24
0.19
01
0.19
75
0.21
91
0.18
98
Smal
l fir
ms
0.16
46
0.16
19
0.19
18
0.21
58
0.25
49
0.20
23
Smal
lest
dec
ile
0.16
21
0.20
91
0.21
93
0.24
03
0.31
27
0.21
00
Lar
ge f
irm
s M
id-s
ized
fir
ms
Smal
l fi
rms
Smal
lest
dec
ile
(i)
Exc
ess
retu
rns
-0.0
109
-0.0
062
-0.0
035
0.02
01
0.01
76
-0.0
212
-0.0
134
0.00
18
0.00
55
0.02
37
-0.0
111
-0.0
188
0.00
36
0.01
94
0.05
45
-0.0
212
0.02
26
0.02
73
0.03
92
0.09
89
-0.0
031
-0.0
026
0.00
71
0.00
63
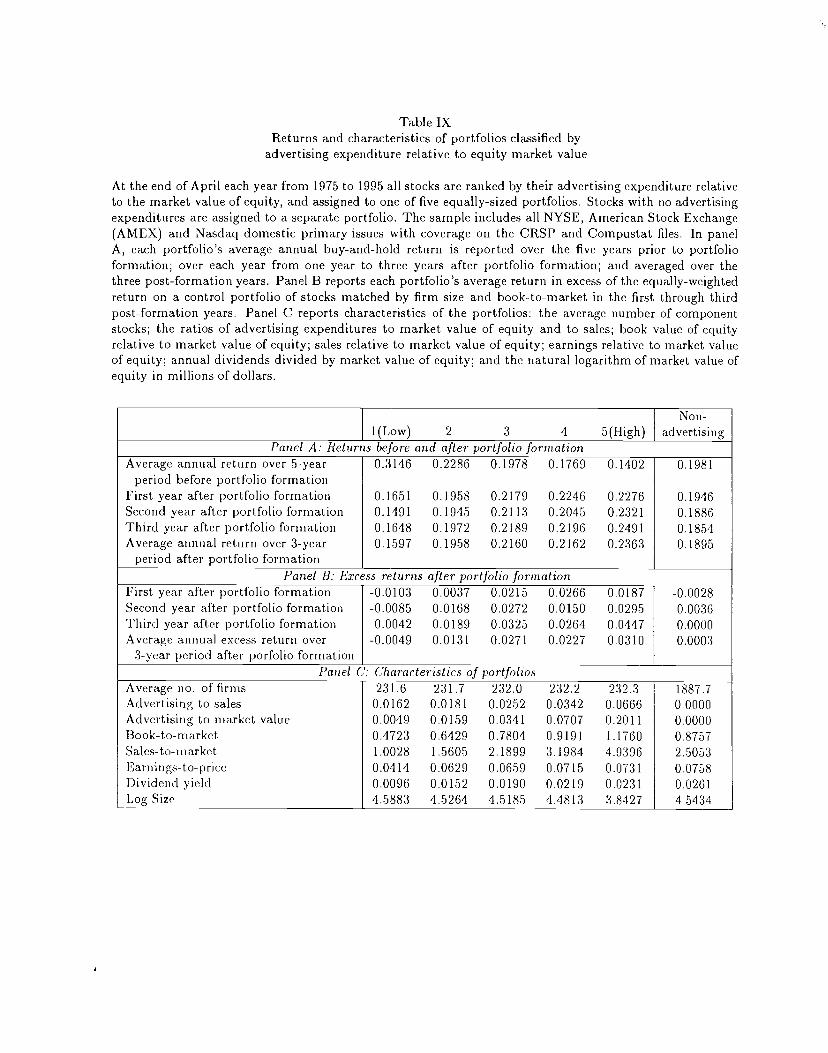
Table IXReturns and characteristics of portfolios classified by
advertising expenditure relative to equity market value
At the end of April each year from 1975 to 1995 all stocks are ranked by their advertising expenditure relativeto the market value of equity, and assigned to one of five equally-sized portfolios. Stocks with no advertisingexpenditures are assigned to a separate portfolio. The sample includes all NYSE, American Stock Exchange(AMEX) and Nasdaq domestic primary issues with coverage on the CRSP and Compustat files. In panelA, each portfolio's average annual buy-and-hold return is reported over the five years prior to portfolioformation; over each year from one year to three years after portfolio formation; and averaged over thethree post-formation years. Panel B reports each portfolio's average return in excess of the equally-weightedreturn on a control portfolio of stocks matched by firm size and book-to-market in the first through thirdpost-formation years. Panel C reports characteristics of the portfolios: the average number of componentstocks; the ratios of advertising expenditures to market value of equity and to sales; book value of equityrelative to market value of equity; sales relative to market value of equity; earnings relative to market valueof equity; annual dividends divided by market value of equity; and the natural logarithm of market value ofequity in millions of dollars.
Non-1(Low) 2 3 4 5(High) advertising
Panel A: Returns before and after portfolw forinatwnAverage annual return over 5-year
period before portfolio formationFirst year after portfolio formationSecond year after portfolio formationThird year after portfolio formationAverage annual return over 3-year
period after portfolio formation
0.3146 0.2286 0.1978 0.1769 0.1402
0.1651 0.1958 0.2179 0.2246 0.22760.1491 0.1945 0.2113 0.2045 0.23210.1648 0.1972 0.2189 0.2196 0.24910.1597 0.1958 0.2160 0.2162 0.2363
0.1981
0.19460.18860.18540.1895
Panel B: Excess returns after portfolio formatzonFirst year after portfolio formationSecond year after portfolio formationThird year after portfolio formationAverage annual excess return over
3-year period after porfolio forrriation
-0.0103 0.0037 0.0215 0.0266 0.0187-0.0085 0.0 168 0.0272 0.0150 0.02950.0042 0.0 189 0.0325 0.0264 0.0447
-0.0049 0.0131 0.0271 0.0227 0.0310
-0.00280.00360.00000.0003
Panel C: Characteristics of portfolwsAverage no. of firmsAdvertising to salesAdvertising to rriarket valueBook-to-marketSales-to-marketEarnings-to-priceDividend yieldLog Size
231.6 231.7 232.0 232.2 232.30.0162 0.0181 0.0252 0.0342 0.06660.0049 0.0159 0.0341 0.0707 0.20110.4723 0.6429 0.7804 0.9191 1.17601.0028 1.5605 2.1899 3.1984 4.93960.0414 0.0629 0.0659 0.0715 0.07310.0096 0.0152 0.0190 0.0219 0.02314.5883 4.5264 4.5 185 4.48 13 3.8427
1887.70.00000.00000.87572.50530.07580.02614.5434