nber working paper series pricing fha mortgage default insurance
TRANSCRIPT

NBER WORKING PAPER SERIES
PRICING FHA MORTGAGE DEFAULT INSURANCE
Donald F. Cunningham
Patric F. Hendershott
Working Paper No. 1382
NATIONAL BUREAU OF ECONOMIC RESEARCH1050 Massachusetts Avenue
Cambridge, MA 02138June l981
This research has been supported by the U.S. Department of Housingand Urban Development (HC—5'88, Task Order #5). The researchreported here is part of the NBERtS research program in FinancialMarkets and Monetary Economics. Any opinions expressed are thoseof the authors and not those of the National Bureau of EconomicResearch.

NBER Working Paper #1382June 1984
Pricing FHA Mortgage Default Insurance
ABSTRACT
The fair premia on FHA mortgage default insurance contracts are computed
under alternative assumptions regarding the expected house price inflation rate
and its variance and homeowner's default costs. The contracts considered vary
by amortization schedule (15 and 30 year level—payment mortgages and two
graduated—payment mortgages) and initial loan—to—value ratio (80 to 95.8
percent) . The results indicate a wide variation in fair insurance premia.
Because FHA charges all borrowers the same premia, large cross—subsidies exist
within the program, with borrower's obtaining low loan—to—value or rapidly
amortizing loans subsidizing borrowers with high loan—to—value or negative
amortizing loans. Moreover, the movement toward insuring riskier loans ——
graduated payment, price—level adjusted and adjustable rate —— without
increasing insurance premia seems almost certain to lead to significant overall
losses for the program.
Donald F. CunninghamFederal Home Loan Mortgage Corporation1776 G ST. N.W.P.O. Box 37248Washington, D.C. 20013(202) 789—5013
Patric H. Hendershott321 Hagerty Hall1775 College RoadOhio State UniversityColumbus, OH 43210(614) 422—0552

June 1984
Pricing FHA Mortgage Default Insurance
Donald F. Cunningham and Patric H. Hendershott
In late 1976, FHA introduced the graduated—payment mortgage (GPM) under
Section 245(a) of the National Housing Act. In an effort to offer this
program to potential homebuyers who would not otherwise qualify, authority was
extended in 1980 to loans with lower down payments under Section 245(b) of the
act. In early 1983, FHA began insuring 15—year level—payment mortgages.
Obviously these three mortgages amortize at different rates than each other
and than the standard 30—year level payment mortgage and thus likely have
different default risk. Nonetheless, the FHA fee for default insurance on
these new instruments has been the same half percentage point charged on the
standard 30—year mortgage.1
This study compares default risk on the FHA 245(b) GPM loan program and
the new 15—year level—payment mortgage with the standard 30—year level—payment
mortgage. The study provides measures of the appropriate FHA default
insurance premia in a competitive market under various assumptions regarding
the expected house price inflation rate and its variance. Our methodology is
an application of the Black and Scholes (1973) option pricing model as
modified by Brennan and Schwartz (1977) . In this procedure the insurance
premium is conceptualized as a put option sold by FHA and purchased by the
homebuyer for the default protection of the lender.2 Unlike private mortgage
1Legislation passed in late 1983 allows FHA to insure PLANs, SANs and ARNs.Alternatives to the half point fee structure are also available, but none ofthe possible structures differentiates between mortgage instruments. SeePesando and Turnbull (1983) for a simulation analysis suggesting that all
non—level payment mortgages, except the SAN, are subject to greater defaultrisk than the level payment mortgage.
2For an instructive disussion of the pricing of default insurance, includingboth references to the 'literature on the determinants of foreclosure andthoughtful comments on the use of option models, see Swan (1982)

—2—
insurance, there is no residual default risk retained by the lender.
This paper is divided into four sections. The first discusses household
default behavior, and the second describes the model for pricing default
insurance and procedures for obtaining price estimates. The third presents
and interprets the estimates and draws some implications for yields on
alternative fixed—rate conventional mortgages. A summary concludes the paper.
I. The Household Default Decision
This section states the condition for borrower default and discusses
default or moving costs.
The Critical House Price and Default
A household will default if its house price falls sufficiently that the
gains from default exceed the costs. The gains are the recapture of the
negative equity (Mt — H) and the free rent earned between default and
foreclosure, Rt. We assume this foreclosure period is one year. The costs of
default for the ith household are C. Thus default will occur in period t+1
if
—Ht + P. > C.
We assume that the costs of default are a fraction, 0, of the house value (see
below) and that the free rent at the time of default is 10 percent of the
value of the house at that time. Then
3For recent explanations of actual default behavior, see Campbell and Dietrich(1983) and Foster and Van Order (1984)

—3—
Mt Ht + O.lHt > ØH,
and the critical house price below which the ith household will default is
Ft o. + (1)
All new mortgages are assumed to be priced two points below par. The
outstanding mortgage balance over time is easily computed from the initial
house price and loan—to—value ratio and standard outstanding balance formulae.
The uncertain variable is the house price. Changes in house prices are
assumed to be normally distributed with mean q and standard deviation o. The
level of house prices is then lognormally distributed with mean in period t of
HetP, where H is the initial house price and t = q + The lognormal
probability density function is
f (H) =
The fraction of households that will have defaulted by time t is the
integral of the lognormal probability density function from 0 to
F(t/H)
24 2ti tcyThe variance of house prices is e (e — 1).

—4—
plus the fraction of households that defaulted in earlier periods (had Ht.<
Ht.) but would now have house prices greater than Ht.
Household Costs of Default
The costs of default vary widely across households depending on the best
housing alternatives available to them, the laws of the jurisdiction in which
they reside, and their 'psychological aversion" to default. Say that the
psychic costs are zero, the jurisdiction does not allow recourse to other
assets the household has, and the optimal housing choice is renting a unit in
the same geographical area. The costs are then only those of locating the
rental unit and moving the family belongings. At most, these costs might be 5
percent of the house sold.
Costs will be greater if the optimal housing choice is purchasing
another house. Say that due to the default the household will be unable to
obtain mortgage credit for ten years. The costs of default increase by the
present value of the advantage of owning over renting for the next ten years.
Even if a mortgage can be obtained, costs are greater than in the rental—
optimum case. First, the house must be purchased and thus brokerage fees must
be paid. On the assumption that the house purchased is the same value as that
sold, these costs might be 7 percent of the house sold. Second, the household
must pay for insurance on a new mortgage, if one is obtained, and must put
some equity down, equity that is at risk. Because the former house had less
value than the outstanding mortgage, the household had complete protection
against house price declines; that protection does not exist on repurchases
after default.

—5—
The costs of default, when owning another house is the best housing
alternative, can be modeled conceptually. If owning would provide an after—
tax advantage of a1I-1÷. for each year the ith household is forced to forego
ownership and there are m such years, then this component of default costs is
a1He = Htai2eJ =(ADVi)Ht, (2a)
j=l
where r is the borrower's after—tax discount rate.5 If, on the other hand,
the purchase of another house is viable, an estimate of the cost of accepting
downside house—price risk is needed. Assume that the household equity
finances the house and expects to hold it for n years. The cost of downside
risk is the present value of the difference in the expected house price in
period t+n where the house price distribution is truncated at Ht (guaranteeing
against price decline) and the expected price without truncation. This value
is
Ht Ht
[Ht f
f(H)dH — fHf(H)dH]ern
=(PRO)Ht. (2b)
5The ADV term is also affected by the tax consequences of default (as C.F.Sirmans reminded us) . If the potential defaulter is a first—time buyer, thenhe would receive rg(H — M ) from the Treasury upon default, where ig is thehomeowner's capital gins ax rate. That is, tax consequences mitigate thecost of foregoing homeownership. On the other hand, if the potential defaulterhad earned a substantial deferred capital gain on an earlier house purchase, atax payment could be due.
—6—
This might appear to be an underestimate of the cost if some risky debt
finance is employed because lenders/insurers will have to charge a greater fee
than the cost of the house value declining below the mortgage owing to both
the lost interest and maintenance during the foreclosure period and the costs
of selling the house. However, households gain the possibility of receiving
rent—free housing for a year in return for the higher cost.
Finally, households with attachable assets and/or psychological aversion
to default will have higher costs than other households regardless of the
optimal housing choice.
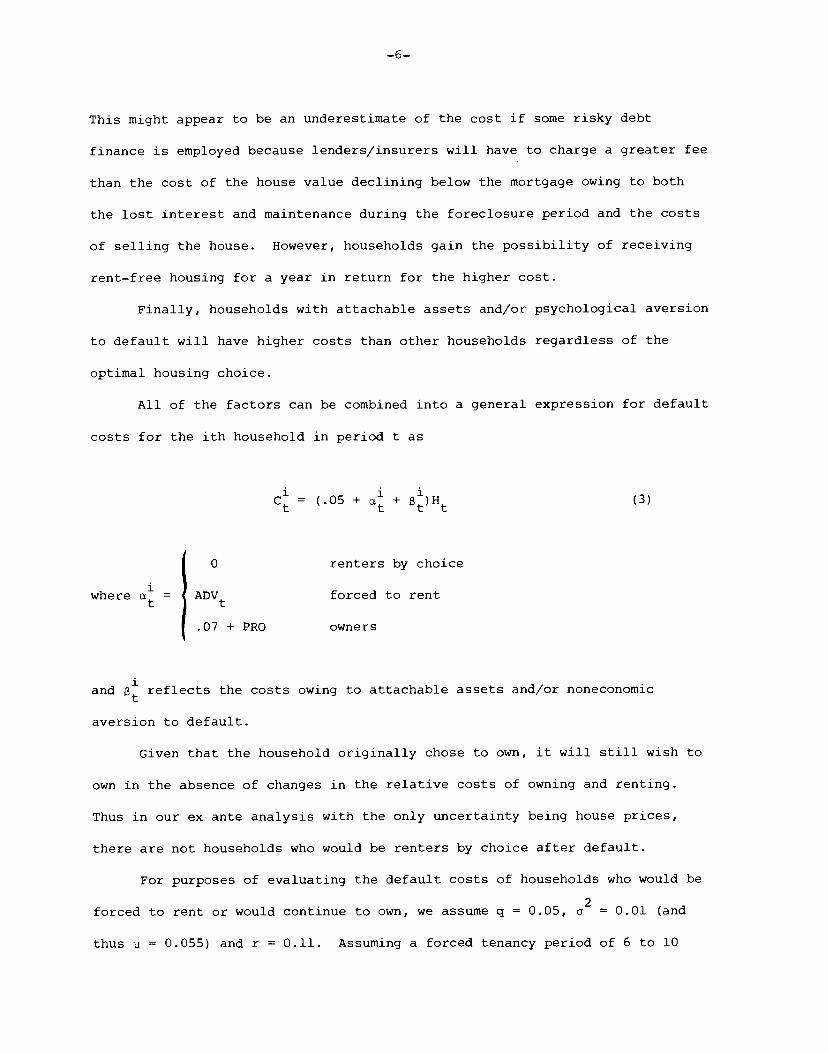
All of the factors can be combined into a general expression for default
costs for the ith household in period t as
C = (.05 + ÷ )Ht (3)
0 renters by choice
where =ADVt
forced to rent
.07 + PRO owners
and reflects the costs owing to attachable assets and/or noneconomic
aversion to default.
Given that the household originally chose to own, it will still wish to
own in the absence of changes in the relative costs of owning and renting.
Thus in our ex ante analysis with the only uncertainty being house prices,
there are not households who would be renters by choice after default.
For purposes of evaluating the default costs of households who would be
forced to rent or would continue to own, we assume q = 0.05, a2 = 0.01 (and
thus i = 0.055) and r = 0.11. Assuming a forced tenancy period of 6 to 10
—7—
years [evaluating (2a) for m6 and 10 and a1=0.01], those forced to rent give
up 0.05 to 0.075 of the house price for each percentage point advantage owning
gives over renting. For households using FHA financing in a period of high
real interest rates, a one to two percentage point advantage seems reasonable.
For the higher tax—bracket households that utilize conventional financing, the
advantage could be greater. Adding the 0.05 basic default cost and letting
range from 0.05 to 0.10, the cost of default for these households would range
from roughly 15 to 30 percent of the value of the house.6 The cost of
downside risk (PRO) for households that can continue ownership is only 1 to 2
percent of the value of the house, looking 4 to 8 periods into the future
[evaluating (7b) for n = 4 and 8]. Allowing for risk aversion and possible
difficulties in coming up with the new downpayment might make the effective
cost 3 percent. The sum of the basic default cost of 0.05, the 0.07 broker's
fee, the 0.03 and a ranging from 0.05 to 0.10 gives a cost of default for
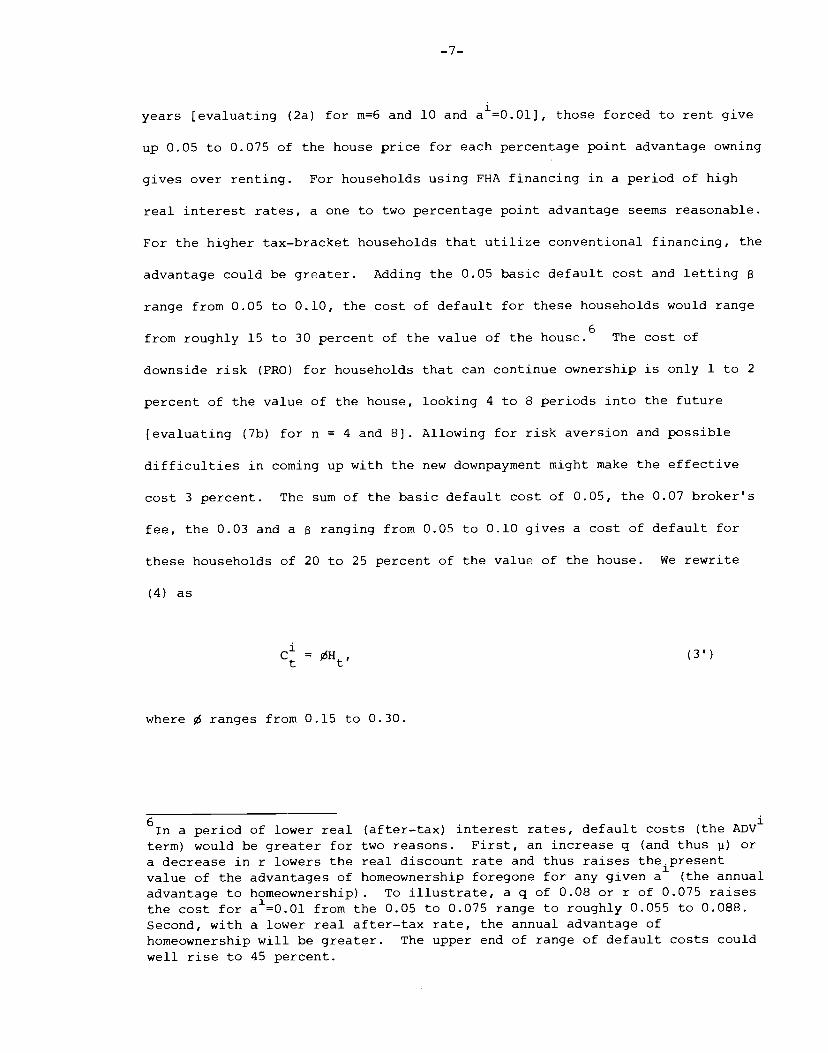
these households of 20 to 25 percent of the value of the house. We rewrite
(4) as
C = ØHt (3')
where 0 ranges from 0.15 to 0.30.
a period of lower real (after—tax) interest rates, default costs (the ADV'term) would be greater for two reasons. First, an increase q (and thus p) ora decrease in r lowers the real discount rate and thus raises the.presentvalue of the advantages of homeownership foregone for any given a1 (the annualadvantage to homeownership). To illustrate, a q of 0.08 or r of 0.075 raisesthe cost for a0.01 from the 0.05 to 0.075 range to roughly 0.055 to 0.088.Second, with a lower real after—tax rate, the annual advantage ofhomeownership will be greater. The upper end of range of default costs couldwell rise to 45 percent.

—8—
In the above evaluation of default costs (0), households have been
assumed to have the option of remaining in their houses in the absence of
default. If households should have to move, then the moving costs attribu-
table to default are reduced. Most obviously, the O.O5Ht costs of locating a
rental unit and moving the family belongings do not deter default. In
addition, many of these households will be 'forced' to rent temporarily until
their finances are again in order. Thus, only part of the ADV loss is
attributable to default. Finally, the costs of selling their existing houses
adds an incentive to default because these costs are avoided by default. With
these costs equal to O.O7Ht and the reduction in ADV attributable to default
equal to O.O3HtI default costs for those who have to move are reduced by
O.lSHt. Thus 0 would range between 0 and 0.15 for such households.7
II. The Simulation Model and Procedures
FHA or mortgage insurers/lenders can charge for expected default losses
in a one—time up front fee, a higher mortgage coupon rate, or some combination
of the two. From the above analysis, expected losses on any mortgage contract
depend on both the likelihood of default and the expected loss associated with
it, i.e., on the "known" mortgage path and the probabilities of alternative
house price paths, as well as household default costs. Let the fair price for
a mortgage insurance contract be denoted by I. Initially, I is the price of
a contract that would be offered to borrowers under specific assumptions
regarding the mean and variance of house price inflation, the interest rate,
7Default risk on ARMs is thus higher than on FRMs because a jump in interestrates might force households with ARMs to move. For another reason, alsorelated to the differential impact of increases in interest rates, why defaultrisk is greater on ARMs, see note 12.

—9—
the initial loan—to—value ratio, the mortgage amortization schedule and
household default costs. Over time, reflects the price an insurer would
have to pay another insurer to take over the default contract.
In competitive markets, insurance contracts can only be sold for a fair
premium. That is, arbitrage profits could not be earned by simultaneously
taking an equivalent position (either long or short) in the house against
which the insurance is written. In what follows, we hypothesize that FHA
desires to charge this fair premium. Our task, then, is to derive a pricing
equation for I that is consistent with zero arbitrage profits. The technique
is to have a household form a riskiess hedge consisting of the purchase of a
partially debt—financed house and the appropriate number of insurance
contracts on the mortgage. The investment in this hedge —— the downpayment on
the house plus the outlay for mortgage insurance contracts —— must then earn
the riskiess rate of return (r).
Borrowing from the logic of Black and Scholes, the hedged position
consists of the purchase of a house and ''H insurance contracts, where the
subscript denotes a partial derivative. 'H is negative —— the amount one
would have to pay another insurer to assume the contract rises as the house
value falls —— and is more negative the greater is the loan—to—value ratio.
Thus fewer contracts are purchased if a lower downpayment is made. The hedge
requires an equity investment of H — M — ''H' where M is the book value of
the mortgage.
We assume the hedge could be continuously adjusted according to the
changes in the ratio 1'H' making it a perfect hedge. In the absence of
taxes, the return on the housing purchase consists of the change in the house

—10—
price (dH) plus net operating income (denoted by sH). The cost of the fully
insured mortgage is simply the risk—free rate under the assumption of constant
interest rates, and the return on the insurance is just dl. Thus we can write
the total return to the equity position as
dH + sHdt — rMdt — dI/IH = (H — M — I/IH)rdt. (4)
Note that the terms in M cancel.
The risk of investing in the house (or in insuring it) is assumed to lie
solely in uncertainty regarding future house prices. Changes in the price of
the house are assumed to follow the diffusion process:
qdt + xiz, (5)
where q is the drift term, dz is a Weiner process, and a2 is the instantaneous
variance of the house price. If I is a smooth function of H, it then follows
from Ito's lemma that I is also an Ito process and can be expanded in the
following form:
dl = 1H' + Idt + (6)
Substituting (6) into (4) , simplifying and replacing r—s with q results in:
= rI — HI — (4')
the partial differential equation governing equilibrium insurance premia in a
world without taxes. It is shown in the appendix that q = r—s in a taxiess

—11—
world and that (4') also holds in a world with taxes. We confirm that the
hedge is perfect because the stochastic term (IHdH) in (6) is successfully
eliminated, leaving the insurance premium a function of only observable
parameters.
We utilize the Brennan and Schwartz (1977) finite difference procedure
to approximate a solution to equation (4'). For each partial derivative, we
substitute a central difference approximation, and the algorithm is taken over
discrete increments in the house price for months between the present and the
date the insurance contract expires. The key boundary condition for the
solution is that if the house price hits the critical value defined in (1)
the household defaults and the insurance contract takes on the value of the
insurer's loss.8 This loss is the mortgage balance plus accrued interest
during the foreclosure period less the house value at the time of default
(adjusted for the absence of maintenance during this period and for sellingF'
costs). We take the loss, and thus the value of I upon default (I), in period
t to be
= (1.15 Mt — .85 Ht)er = [1.15 — .85/(.9 + Ø)JMter. (7)
The loss is discounted by one period owing to the assumed one year foreclosure
lag.
8Other obvious boundary conditions are that I is nonnegative and equals zeroas Ht approaches infinity.

—12—
III. Price Estimates
Three sets of price estimates are reported below. All provide one—time
prices as a percent of the initial mortgage balance and (approximate) annual
equivalent fees as a percent of the outstanding mortgage balance. Estimates
are provided for four types of mortgages (15 and 30 year level payment and the
two 245b GPM programs) and four loan—to—value ratios (80, 88, 92 and 95.8
percent). The highest of these ratios is based upon the minimum downpayment a
household could make on a $60,000 house in early l983.
Section A provides results for the basic parameterization. This
includes an expected inflation rate (q) of 0.05 and a house price variance
(a2) of 0.01.10 The mortgage rate is taken to be 13 percent, and the risk—
free rate to be 11½ percent. This difference reflects the existence of
prepayment risk.11 The sensitivity of the insurance prices to alternative
parameter values is considered in Section B, and an extension to the
conventional mortgage market is given in Section C.
Before getting to the actual estimates, a few caveats are in order.
Because we have not modeled interest rate uncertainty, the one—time estimates
of fair default fees are on the high side. If interest rates should rise
significantly, the market value of the mortgage debt declines and households,
9At that time the minimum downpayment on the first $25,000 of house financedby FHA was 3 percent; on larger amounts the minimum was 5 percent. Thus themaximum loan on a $60,000 house was .97($25,000) + .95($60,000 — 25,000).Under new legislation the required 5 percent downpayment will not go intoeffect until $50,000.
10Asay (1978) estimated a house price variance rate of 0.0142 for the period1966 to 1977 in southern California. Recently, Foster and Van Order (1984)found a house price variance of 0.0081 to provide the best fit for theirdefault model using FHA data from the 1960s and l970s.
11Buser and Hendershott (1984) show that the price of this risk, when chargedfor in the mortgage coupon rate, is virtually identical for the four differentmortgage instruments covered.

—13—
being reluctant to give up what would then be below—market financing, are less
likely to default.12 This gain in reduced default probability is not fully
offset by the cost of increased default probability if interest rates should
decline because, if the decline is sufficient, households will avoid the
higher market value debt by refinancing. There is an offsetting factor at
work in the calculation of the annualized default fees, however. The fees are
computed assuming payment over a full 12 year period. Should the loan be
terminated (called or defaulted upon) prior to the twelve year, then the fees
earned are insufficient to cover the present value of expected losses. Thus
there is not reason to believe that the annualized fees are necessarily too
high.
A. The Basic Results
Table 1 contains the prices for three different values of the default
cost parameter, 0. Of course, the fees, both one—time and annualized, are
higher the greater the loan—to—value ratio, the less rapidly the mortgage
amortizes, and the lower the default costs. In general, raising the default
costs from 0.15 to 0.225 cuts the fair insurance fee by 65 percent for the
15—year mortgage, 50 percent for the 30—year level—payment mortgage and 40
percent for the graduated—payment mortgages. For the specific parameter
values assumed, FHA's half point fee on the 30—year level—payment mortgage
seems to be roughly correct for a 95 percent loan—to—value ratio.
12For this reason, default risk on FRMs is less than that on ARMs (the amountless being greater the shorter the adjustment period and the less restrictivethe caps on the ARM) . See note 7 for another reason related to differentialimpacts of interest rate increases.

—14—
To facilitate an understanding of how insurance premia ought to vary
across loan—to—value ratios, the data in Table 1 have been standardized around
the 92 percent ratio in Table 2. That is, all one—time fees for each type
mortgage have been divided by the fee for the 92 percent loan. These data are
consistent with von Furstenburg's early (1970) discussion of cross—subsidies
within the 30—year level—payment FHA program. More specifically, if the 50
basis point fee were correct for a 92 percent loan—to—value ratio, then only
30 basis points should be charged on a 88 percent loan and 10 basis points on
an 80 percent loan. In contrast, at least 80 basis points should be charged
on a 95.8 percent loan. These differences are smaller for less rapidly
amortizing loans (GPMs) and larger on more rapid ones (the 15—year level
payment) . Note, finally, that the variation in the fair premia across loan—
to—value ratios is independent of the costs of default.
Analysis of how insurance fees ought to vary across mortgage instruments
is facilitated by standardizing the data in Table 1 around the 30—year level—
payment mortgage (all one—time fees for a given loan—to—value ratio are
divided by the fee for the 30—year level—payment mortgage). The variation in
fair premia is enormous. Except for very high loan—to—value ratios and low
default costs, the premia on graduated—payment mortgages are twice those on
the 30—year level—payment mortgage. For 80 percent GPMs, fair premia are
three to five times as large. The far greater proportional difference is due
to the fact that the default option on the 80 percent 30—year level payment
mortgage is virtually "out of the money," while GPMs, especially that with
rising payments for 10 years, is still in the money. The premia on the 15—
year mortgage, in contrast, is less than half that on the 30—year level—
payment mortgage and, for lower loan—to—value ratios and high default costs,
is less than a quarter as large.

—15—
B. Alternative Inflation Senarios
The premia in Table 4 indicate the sensitivity of the fair premia to the
assumed expected inflation senario. Because the variance of inflation is
known to be positively associated with its level, the variance parameter is
changed along with the inflation rate.'3 Premia are reported for q = 0.02
(c = 0.006) and q = 0.08 (= 0.014) , as well as the base case of q = 0.05
= 0.01). With the standard 30—year mortgage, premia are marginally lower
at higher inflation (and variance) rates and higher at lower inflation rates.
Tables 5 and 6 are similar to Tables 2 and 3 in that they illustrate the
sensitivity of the premia for different parameters (inflation and its variance
now, rather than default costs) across loan—to—value ratios and mortgage
instruments by standardizing the premia on the 92 percent loan—to—value ratio
and the standard 30 year mortgage, respectively. As can be seen in Table 5,
the premia across loan—to—value ratios are insensitive to the level of
inflation. In contrast, the data in Table 6 indicate considerable mortgage—
instrument sensitivity to inflation changes. More specifically, the faster
the mortgage amortization, the more declines in expected inflation raise
default premia and increases in expected inflation lower them. In fact, while
the premium on the standard 30—year mortgage is negatively related to the
level of expected inflation (see Table 4), the premium on the 15—year mortgage
is positively related to inflation.
The data in Table 7 provide another example of the importance of the
amortization path. Table 7 contains the fair premia for all the mortgages and
all the loan—to—value ratios for both 9 and 13 percent mortgage rates. In
each case, the risk—free rate is 1½ percentage points below the mortgage rate,
13Parks (1978) documents a positive relationship between the variance of theinflation rates of the 12 major consumption expenditures categories in theU.S. NIPA and the square of the aggregate consumption inflation rate.

—16—
the expected inflation and variance rates are 0.05 and 0.012, and default
costs are set at the high 0.3 value. Even though the inflation rate is
identical, the insurance fees are uniformly lower for all instruments at the 9
percent rate because of the increased principal amortization. Fees on the
15—year mortgage are reduced the most, approximately 30 percent, followed by
the fees on the GPMs which are reduced by about 20 percent. Fees on the
standard 30—year mortgage are lowered by only about 5%. These results
correspond directly to the effect on principal amortization over time for each
instrument. To illustrate, after five years the decreases in the outstanding
principals on the three mortgages when the coupon rate is 9 percent, relative
to when the rate is 13 percent, are 6 percent, 5 percent and 2 percent
respectively.
C. An Extension to the Conventional Mortgage Market
In the conventional mortgage market, default risk is absorbed by lenders
or shared by them and private mortgage insurers. All residential mortgages
with initial loan—to—value ratios above 90 percent must carry private mortgage
insurance, and, in practice, mortgages with loan—to—value ratios above 80
percent are so insured. This insurance typically covers the top 12% to 20% of
mortgage claims; any residual risk is borne by the lenders. For initial
loan—to—value ratios of 80 percent or less, lenders typically bear all default
risk and pass the cost on to borrowers in the form of higher effective
mortgage coupon rates.
The price (cost) of default risk that borrowers should be charged on 80%
conventional loans is precisely the same fee that FHA should charge for a 80%
loan—to—value ratio mortgage. Thus, computation of the fair default premium
that should be built into 80% conventional mortgage rates is the same as

—17—
computation of the fair FHA fee on such loans.14 These premia were reported
in Tables 1 and 4 and are summarized as ranges in Table 8 for the different
mortgage instruments. The "reasonable range" data in the far right column
indicate that the default risk on 80% loan—to—value loans is negligible for
the 15—year mortgage, is minor for the standard 30—year mortgage and is
significant for the GPMs. That is, coupon rates on the standard mortgage
should contain only a 10 basis point premium, while those on the GPMs should
have a premium of a quarter to a half percentage point.15 Of course, these
calculations assume accurate house price appraisals, an assumption that might
be tenuous in a period dominated by builder buy—downs and other creative
financing techniques.
IV. Summary
An occupant of a house financed by mortgage debt will default on the
debt if the gains from doing so exceed the perceived costs. There are two
gains from default: the recapture of the negative equity in the house (the
difference between the value of the mortgage and the value of the house) and
the free rent that can be obtained between the time of default and actual
foreclosure. The costs of default, covered by the term "moving costs,"
include dollar and psychic costs of moving, as well as losses of attachable
assets and credit rating, to the extent they are relevant. Of course, if the
household has to move (owing to an inability to make the mortgage payments or
14Further, the difference between the fair fee on 95.8% FHA loans and the feeon 80% loans is a close approximation to the fee private mortgage insurersshould change for 16% coverage on 95% loan—to—value loans. That is, the sumof the fee for coverage from 95% to 80% (16 percent of 95) and the residualfee on the remaining 80% is the same (approximately) as the fee on a 95.8%loan.
15Note from Table 7 that the premium on GPMs would be lowered by a quarter toa third if the market mortgage rate were to decline from 13 to 9 percent.

—18—
a shift to a job in another location), then the costs of default are greatly
reduced because many of the moving costs must be paid whether or not default
occurs. Our analysis of moving costs suggest that they are proportional to
the value of the house at the time default is being considered and that the
factor of proportionality ranges between 0.15 and 0.3 for most households.
Expected default losses on any mortgage contract depend on the
likelihood of default and the expected losses associated with its occurrence.
Both are functions of the known mortgage path, the probabilities of
alternative house price paths, and household moving costs. Mortgage insurance
premia should cover the expected default losses. Following the logic of Black
and Scholes, we derived a partial differential equation governing this premia.
The critical issue to evaluation of the equation is determining when default
occurs. If the insurance were a pure put option, then default would occur
when the value of the insurance equaled the negative equity in the house.
However, we have shown that the borrower's default decision is driven by his
moving costs. As a result, default will not occur until significant negative
equity occurs.
Insurance premia were calculated for four mortgages —— 30 and 15 year
level payment (LPMs) and 30 year graduated payment (GPMs) with 5 and 10 year
graduation at 7.5 and 4.9 percent per annum, respectively —— and for four
loan—to—value (LV) ratios —— 95.8 (very high ), 92 (high) , 88 (moderate) and
80 (low) percent. While FHA charges the same premium for all mortgages and
LV5, our calculated fair premia vary widely, suggesting substantial cross—
subsidies in the FHA program. In a 5 percent expected inflation environment,
very high LV 30 year LPMs are 65 percent riskier than high LV loans. Moderate
and low LV loans are 40 and 80 percent less risky, respectively. To
illustrate, the 95.8 percent loan is nearly four times as risky as the 88

—19—
percent loan and thus should have four times as large an insurance premium.
(These differences are up to twice as great for the 15 year mortgage and
somewhat smaller for GPMs.) All differences are quite insensitive to the
assumed level of default costs and to changes in the inflation (and variance)
rates. The cross—subsidies among 30—year LPM borrowers are substantial
because there is, in fact, wide variance in loan—to—value ratios of FHA
borrowers. In the 1980—82 period, for example, 40 percent of borrowers had
loan—to—value ratios below 90 percent (nearly 20 percent had ratios of 80
percent or less) , while 30 percent had ratios of 95 percent or higher. Our
estimates suggest that half of the premia of the former are, on average, used
to subsidize the latter.
Looking across mortgage instruments, at moderate and very high LVs, GPMs
are generally 2 to 3 times as risky as the 30 year LPM. Moderate and high LV
10 year GPMs are even riskier for households with high default costs, and low
LV 10 year GPMs are 4 to 6 times as risky. On the other hand, the 15 year LPM
is 50 to 80 percent less risky than the 30 year LPM, with the differences in
riskiness being greater for lower LV loans and for households with high
default costs. Thus expanding the mortgage menu further increases the
possible magnitude of cross—subsidies. This expansion, particularly when it
includes riskier PLAM and ARM loans, could also lead to substantial net FHA
losses.
The default risk on 80 percent LV loans is roughly the residual risk of
lenders in conventional loan markets (the greater risk on higher LV losses is
borne by private mortgage insurers). These expected default losses must be
recovered via higher mortgage coupon rates. Our analysis suggests that an
extra 5 to 15 basis point charge is sufficient on the standard 30 year LPM.

—20—
For the 15 year LPM, the charge is less than 5 basis points, but for the GPMs,
the appropriate charge is 15 to 60 basis points, with the 10 year GPM
requiring the largest fee.
—2 IL—
Appendix:
Taxes, Service Flows and the Equilibrium Insurance Premium
In a world of taxes, the formation of the hedge position in houses and
insurance contracts will generate an aggregate after—tax return. If we
decompose this return, we see that each component will be taxed at a different
rate and will depend on who forms the hedge. Gains and losses from the house
appreciation would be taxed at the capital gains rate of Tq changes in the
value of the insurance contracts would be taxed at the ordinary rate of T, and
the after—tax service flow from the house, which now includes the depreciation
tax shield, will reflect the tax rate on ordinary income of the marginal
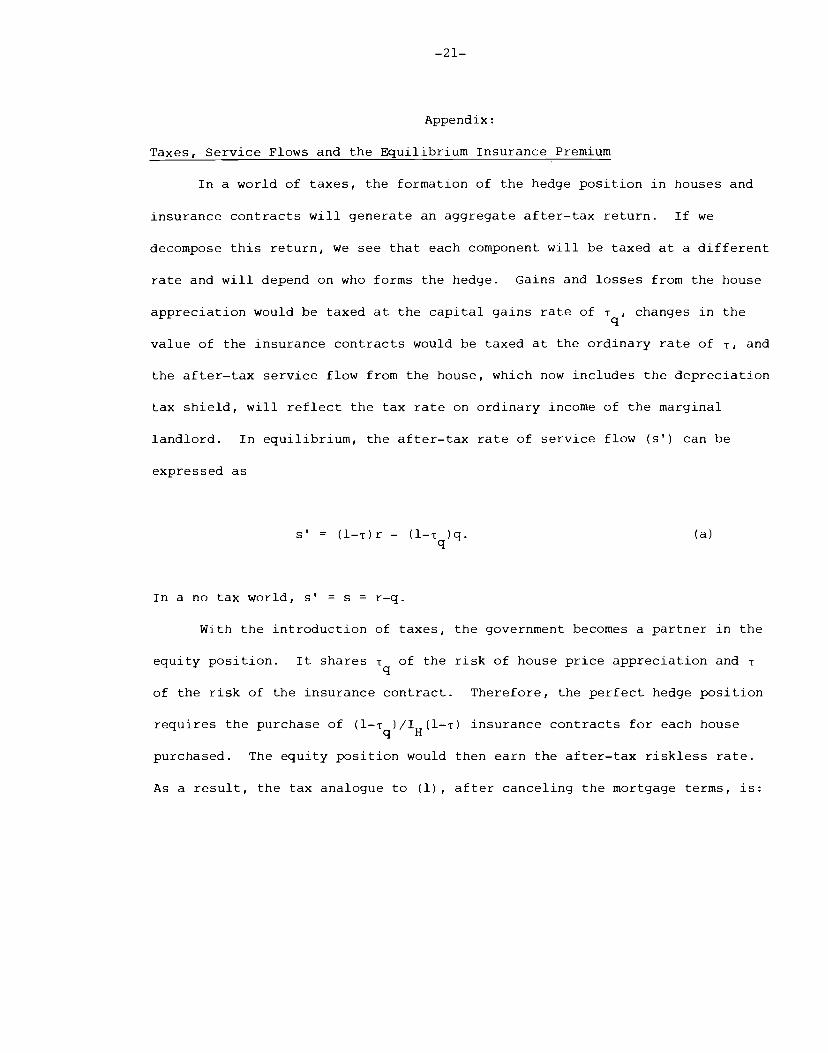
landlord. In equilibrium, the after—tax rate of service flow (s') can be
expressed as
s' (l—i)r — (l—T )q. (a)q
In a no tax world, s' = s = r—q.
With the introduction of taxes, the government becomes a partner in the
equity position. It shares Tq of the risk of house price appreciation and T
of the risk of the insurance contract. Therefore, the perfect hedge position
requires the purchase of (l_Tq)/IH(l_T) insurance contracts for each house
purchased. The equity position would then earn the after—tax riskless rate.
As a result, the tax analogue to (1) , after canceling the mortgage terms, is:

—22—
dH(lTq) + s'Hdt — dI(lT) (l_Tq)/IH(lt) = [H_I(l_Tq)/IH(l_T)]r(lT)dt. (b)
Substituting (3) into (b) and simplifying results in:
= rI [(1_i) - (l_T)]HIH-
If we now substitute the expression for the equilibrium service flow (a) into
(b') , we discover that all the tax variables are eliminated and the partial
differential equation governing the equilibrium insurance premium is simply:
= rI - HI - (b)
This is the same expression as the no-tax model (1'). s long as the marginal
real estate investor forms the hedge position, the specific tax rate of this
investor is irrelevant owing to the adjustment of the equilibrium service flow
and the hedge ratio to this investor's tax bracket.

—23—
Ref erences
Asay, M. R., Rational Mortgage Pricing, unpublished manuscript, December 1978.
Black, F. and M. Scholes, "The Pricing of Options and Corporate Liabilities,"
Journal of Political Economy, May/June 1973.
Brennan, M. J. and E. S. Schwartz, "The Valuation of American Put Options,"
The Journal of Finance, May 1977.
Buser, S. A. and Hendershott, P. H., "The Pricing of Default—Free Mortgages,"
paper presented to the Midyear Meetings of the AREUEA, May 1984.
Campbell, T. S. and J. K. Dietrich, "The Determinants of Default on Insured
Conventional Residential Mortgage Loans," The Journal of Finance,
December 1983.
Foster, C. and R. Van Order, "An Option—Based Model of Mortgage Default,"
mimeo, U.S. Department of Housing and Urban Development, March 1984.
Parks, R. W., "Inflation and Relative Price Variablility," Journal of
Political Economy, February 1978.
Pesando, J. E. and S. M. Turnbull, "Default Risk of Alternative Mortgage
Instruments: A Simulation Study," mimeo, January 1983.
Swan, C., "Pricing Private Mortgage Insurance," Journal of American Real
Estate and Urban Economics Association, Fall 1982.
von Furstenburg, G., "Risk Structures and the Distribution of Benefits within
the FHA Home Mortgage Insurance Program," Journal of Money Credit and
Banking, August 1970.

Loan-To-
Table 1:
The Price of Full Coverage
Under Alternative Costs of Default
*Assptions: H =
$60,000, c2 =
.010, q =
.05, r
0
m
=
.013 and r =
.0115.
Mortgage
Value
Ratio
=
.15 =
.225
Fee
Fee
Fee
(%ofM)
0
(%ofM)
(%ofM)
=
. 30
15—year
80
.17
.05
.06
.01
.02
.01
level
88
.91
.19
.31
.07
.11
.03
92
1.93
.40
.67
.14
.24
.07
95.8
3.82
.78
1.36
.28
.49
.10
30—year
80
.78
.13
.38
.07
.19
.04
level
88
2.49
.44
1.23
.21
.62
.11
92
4.21
.73
2.09
.37
1.06
.18
95.8
6.88
1.23
3.43
.60
1.75
.31
245b——5
80
2.20
.35
1.20
.20
.66
.11
year gradu—
88
5.58
.90
3.25
.52
1.86
.30
ated at
92
8.32
1.37
5.00
.81
2.93
.47
7.5% rate
95.8
11.89
2.04
7.36
1.20
4.42
.70
245b——lO
80
3.16
.49
1.94
.29
1.19
.18
year gradu—
88
6.88
1.07
4.44
.68
2.82
.43
ated at
92
9.69
1.57
6.38
.99
4.13
.63
4.9% rate
95.8
13.20
2.17
8.86
1.41
5.83
.90

Table 2:
Relative Prices of One-Time Full-Coverage Fees for Diferent
Default Costs Standardized on the 92% Loan-to-Value Ratio
LOAN
TO VALUE RATIO
Mortgage
80%
88%
92%
95.8%
15
.15
.09
.47
1.00
1.98
.225
.09
.46
1.00
2.03
.30
.08
.46
1.00
2.04
30
.15
.19
.59
1.00
1.63
.225
.18
.59
1.00
1.64
.30
.18
.58
1.00
1.65
245b5 yr.
.15
.26
.67
1.00
1.43
.225
.24
.65
1.00
1.47
.30
.23
.63
1.00
1.51
245b——10 yr.
.15
.33
.71
1.00
1.36
.225
.30
.70
1.00
1.39
.30
.29
.68
1.00
1.41
* T
hese ratios are calculated from the prices appearing in Table 1.

Table 3:
Relative Prices of OneTime Full—Coverage Fees for Different
Default Costs Standardized on the 30-Year Level Payment Mortgage
LOAN TO VALUE RATIO
Mortgage
88%
92%
95.8%
15
.15
.22
.37
.46
.56
.225
.16
.25
.32
.40
.30
.11
.18
.23
.28
30
.15
1.00
1.00
1.00
1.00
.225
1.00
1.00
1.00
1.00
.30
1.00
1.00
1.00
1.00
245b——5 yr.
.15
2.82
2.24
1.98
1.72
.225
3.15
2.64
2.39
2.14
.30
3.47
3.00
2.76
2.53
245b"l0 yr.
.15
4.05
2.76
2.30
1.92
.225
5.10
3.61
3.05
2.58
.30
6.26
4.55
3.90
3.33
* T
hese ratios are calculated from the prices appearing in Table 1.

Table 4:
The Price o
f Full
Coverage
Under System
atic Increases in Inflation and
Rouse P
rice Volatilityi
2%2lnflatjon
5%
8%2lnflation
o= 006
a
=
.010 a
=
.014 Loan-To-
One—Time
Annual Coupon(%)
One—Time
Annual Coupon(%)
One—Time
Annual Coupon(%)
Value
Fee
Fee
Fee
Mortgage
Ratio
(% of M
)
(% of M )
(% of M
0
0
0
15—year
80
.02
.00
.06
.01
.08
.01
level
88
.18
.04
.31
.07
.38
.08
92
.44
.10
.67
.14
.78
.17
95.8
1.00
.21
1.36
.28
1.51
.33
30—year
80
.47
.09
.38
.07
.32
.06
level
88
1.57
.27
1.23
.21
1.04
.18
92
2.63
.46
2.09
.37
1.79
.31
95.8
4.24
.74
3.43
.60
2.97
.52
245b——5
80
1.75
.28
1.20
.20
.91
.15
year gradu-
88
4.68
.76
3.25
.52
2.49
.40
ated at
92
7.06
1.15
5.00
.81
3.89
.62
7.5% rate
95.8
10.09
1.70
7.36
1.20
5.85
.95
245b——10
80
3.36
.52
1.94
.29
1.32
.20
year gradu—
88
7.21
1.13
4.44
.68
3.13
.48
ated at
92
9.89
1.60
6.38
.99
4.65
.71
4.9% rate
95.8
13.03
2.15
8.86
1.41
6.70
1.04
Assumptions:
H =
$60,000, r =
.13, r = .115, a
nd= .225

Table 5:
Relative Prices of OneTime Full-Coverage Fees for Different House
Price Parameters Standardized on the 92% Loan-to-Value Ratio*
LOAN TO VALUE RATIO
Mortgage
Inflation Rate
80%
88%
92%
95.8%
15
2%(ci.OO6)
.05
.41
1.00
2.27
5%(g2Ol-)
.09
.46
1.00
2.03
8%(a
.014)
.10
.49
1.00
1.94
30
2%(c=.OO6)
.18
.60
1.00
1.61
5%20])
.18
.59
1.00
1.64
8%(a
.0l4)
.18
.58
1.00
1.66
245b——5 yr.
2%(c.006)
.25
.66
1.00
1.43
5%(a
.0l0)
.24
.65
1.00
1.47
8%(c2.014)
.23
.64
1.00
1.50
245b10 yr.
2%(a.006)
.34
.73
1.00
1.31
5%(c2OlO)
.30
.70
1.00
1.39
8%(G =
.0l4) .28
.67
1.00
1.44
* T
hese ratios are calculated from the prices appearing in Table 1.

Table 6:
Relative Prices of One-Time Full-Coverage Fees for Different Iouse Price
Parameters Standardized on the 3OYear Level-Payment Mortgage
2
LOAN TO VALUE RATIO
Mortgage
Inflation and
80%
88%
92%
95.8%
15
2%(o.O06)
.04
.11
.17
.24
5%(cy2=.010)
.16
.25
.32
.40
8%(c
.014)
.25
.37
.44
.51
30
2%(cy=.0O6)
1.00
1.00
1.00
1.00
52010)
1.00
1.00
1.00
1.00
8%(a
.014)
1.00
1.00
1.00
1.00
245b--5 yr.
2%(G.006)
3.72
2.98
2.68
2.40
5%(a2r.010)
3.16
2.64
2.39
2.15
8%(a
.014)
2.84
2.39
2.17
1.97
245b10 yr.
2%(a2.006)
7.15
4.59
3.76
3.07
5%(c=.010)
5.11
3.61
3.05
2.58
8%(c
.014)
4.13
3.01
2.58
2.26
* T
hese ratios are calculated from the prices appearing in Table 4.

* T
able 7:
The Price of Full Coverage Under Alternative Mortgage Rates
Mortgage
Loan-to-Value
Rate
9% Mortgage Rate
One-time Fee
Annual Coupon (%)
(% of M 0
13% Mortgage Rate
One-time Fee
Annual Coupon(%)
(% of M 0
* A
ssumptions:
H
= $60,000,
a2 = 0012
q = 0.05,
r = rm
- 0.015,
and 4
= 0.3.
15-year level
80
88
.04
.18
.01
.05
.06
.27
.01
.06
92
.36
.08
.52
.11
95.8
.70
.14
.96
.20
30-year level
80
88
.39
1.08
.07
.16
.43
1.16
.08
.20
92
1.73
.26
1.83
.32
95.8
2.67
.40
2.80
.49
245b—-5 year
graduated at
7.5% rate
80
88
92
.90
2.28
3.43
.15
.32
.47
1.22
2.92
4.28
.20
.47
.68
95.8
4.99
.69
6.05
.98
245b-10 year
graduated at
4.9% rate
80
88
92
1.42
3.18
4.54
.21
.42
.60
1.99
4.11
5.67
.30
.63
.88
95.8
6.29
.85
7.61
1.20

Thble 8:
Estimates of the Fair Default Premia in Mortgage Rates on 80 Percent Loans
(basis points)
5% Inflation (q)
*
0 =0.225
**
Reasonable
Instrument
(0 ranges
from 0.15 to 0.3)
(q ranges from 0.02 to 0.08)
Range
15—Year Level
1-5
1
1 to 5
30-Year Level
4 to 13
6 to 9
5 to 15
245b—-five year
11 to 35
15 to 28
15 to 40
245b——ten year
18 to 49
20 to 52
20 to 60
* F
rom Table 1.
** F
rom
Table
4.