nber working paper series physical and … · nber working paper series physical and human capital...
TRANSCRIPT

NBER WORKING PAPER SERIES
PHYSICAL AND HUMAN CAPITAL DEEPENINGAND NEW TRADE PATTERNS IN JAPAN
Keiko ItoKyoji Fukao
Working Paper 10209http://www.nber.org/papers/w10209
NATIONAL BUREAU OF ECONOMIC RESEARCH1050 Massachusetts Avenue
Cambridge, MA 02138January 2004
The authors would like to thank the editors of this volume and the discussants, Chin Hee Hahn and Ji Chou,and participants of the Fourteenth NBER Annual East Asian Seminar on Economics for their helpfulcomments. The authors are also grateful to Yoshimasa Yoshiike and Tangjun Yuan for undertakingmeticulous data calculations.The views expressed herein are those of the authors and not necessarily those of the National Bureau ofEconomic Research.
©2003 by Keiko Ito and Kyoji Fukao. All rights reserved. Short sections of text, not to exceed twoparagraphs, may be quoted without explicit permission provided that full credit, including © notice, is givento the source.

Physical and Human Capital Depening and New Trade Patterns in JapanKeiko Ito and Kyoji FukaoNBER Working Paper No. 10209January 2004JEL No. C23, F14, F16
ABSTRACT
This paper investigates the deepening of the international division of labor and its effect on factor
intensities in Japan, mainly focusing on the manufacturing sector. In the first half of the paper, we
analyze the factor contents of trade and find that Japan’s factor content net-exports of capital and
non-production labor grew rapidly while net-exports of production workers fell by a large amount
during the period from 1980-2000. Interestingly, the decline in the factor content of net-exports of
production workers was almost entirely caused by Japan’s trade with China and Hong Kong.
According to our decomposition analysis, however, most of the macro-economic change in the
capital-labor ratio and the change in the skilled-labor ratio is attributable to a “within-industry”shift
rather than a “between-industry” shift. Although we clearly see a drastic increase in VIIT and
outsourcing to foreign countries, particularly to Asian countries, our empirical analysis provides
only weak evidence that the deepening international division of labor contributes to changes in
factor intensities in each industry. Our results suggest that specialization in the export of skilled-
labor-intensive products may have contributed to the increase in the relative demand for skilled
(professional, technical, managerial, and administrative) labor within industry. However, our results
suggest that changes in trade patterns (specialization in capital-intensive production) cannot explain
the rapid growth of capital-labor ratios in Japan.
Keiko ItoThe International Centre for the Study of EastAsian Development11-4 Otemachi, KokurakitaKitakyushu, Fukuoka [email protected]
Kyoji Fukao
Institute of Economic ResearchHitotsubashi University2-1 Naka, KunitachiTokyo [email protected]

2
1. Introduction
Until the beginning of the 1990s, Japan accomplished comparatively high economic growth
through an exceptionally rapid accumulation of physical and human capital. Table 1.1 compares
growth accounting results for the US economy (by Jorgenson, Ho, and Stiroh, 2002) with those for
the Japanese economy (Fukao, Inui, Kawai, and Miyagawa, 2003). We can see that, compared with
the US, Japan’s economic growth until 1990 was relatively more dependent on labor quality growth
and increases in physical capital per capita. However, as is well-known, high economic growth based
on rapid capital accumulation is not sustainable in the long-run because of the diminishing rate of
return to physical and human capital.
INSERT Table 1.1
Evidence suggests that Japan is caught in this trap of diminishing rates of return. Figure 1.1
shows that as the physical capital-output ratio increased over the past three decades in Japan, the rate
of return to physical capital declined continuously. Comparing South Korea and Japan with other
OECD economies, Pyo and Nam (1999), showed that the two countries both enjoyed a more rapid
rise in their capital output ratios but also suffered a faster decline in the rate of return to capital.
Turning from physical to human capital, Katz and Revenga (1989) found that while educational
earnings differentials expanded drastically in the US in the 1980s, the college wage premium in
Japan increased only slightly. As Genda (1997) showed, the underlying reason is that the
employment of skilled workers such as older college graduate males expanded rapidly in Japan,
resulting in an excess supply of skilled workers relative to the limited availability of management
positions that contributed to the stagnation of earnings for older college graduates. Probably partly as
a result of these declines in the rate of return, the accumulation of physical and human capital has

3
slowed down over the past decade (Table 1.1).1
INSERT Figure 1.1
We should note that according to standard international trade theory, rapid growth based on
capital accumulation will be sustainable if the economy gradually specializes in physical and human
capital intensive products. Under such a specialization process, the factor price equalization
mechanism will work to offset the diminish rate of return to physical and human capital. For Japan,
the 1990s were an age of “globalization”: the country has expanded its international division of labor
with other East Asian countries through international trade and direct investment. The purpose of
this paper is to examine this deepening of the international division of labor and evaluate how much
of the diminishing rate of return mechanism was cancelled out by the international division of labor.
Several recent studies, such as Feenstra and Hanson (1996b, 1999, 2001), Kimura (2001), and
Fukao, Ishido, and Ito (2003), have shown that the fragmentation of the production process and
vertical intra-industry trade between developed and developing economies may have enhanced the
vertical division of labor within each industry. This type of international division of labor would
cause a deepening of the physical and human capital within each industry in developed economies.
However, since the resulting capital deepening will occur within each industry, we cannot correctly
analyze this type of division of labor by using inter-industry trade data. Consequently, we study the
international division of labor by looking at both inter-industry trade and intra-industry trade.
The remainder of the paper is organized as follows. In section 2, we examine physical and
human capital deepening in Japan. In section 3, we take a broad look at Japan’s inter-industry trade
and factor contents in order to measure to what extent Japan’s capital deepening is offset by
1 Godo (2001) found that the speed of catch-up of Japan’s average schooling years to the US level slowed
down during the 1980s because of the decline in the Japan/US ratio in average schooling years for tertiary
education.

4
international trade. In section 4, after providing an overview of the changes in Japan’s intra-industry
trade and vertical division of labor, we conduct econometric analyses to investigate the determinants
of the changes in factor intensities using industry-level data. Section 5, finally, presents our
conclusions.
2. Physical and Human Capital Deepening in the Japanese Economy
In this section, we look at the trends of physical and human capital deepening in Japan and
examine the macro-economic change in the capital-labor ratio and the change in the skilled-labor
ratio (the percentage of skilled labor in total labor) by decomposing these changes into the
contribution of the increase in the capital-labor ratio or the share of non-production workers within
each industry (the “within effect”) and the contribution of the reallocation between industries (the
“between effect”).
First, we consider the increase in the capital-labor ratio and the share of non-production (or
skilled) workers in the manufacturing sector as well as the Japanese economy as a whole. As Figure
2.1 shows, the capital-labor ratio measured as real capital stock (in 1990 price) divided by the
number of workers has increased considerably over the last three decades: the capital-labor ratio for
both the economy as a whole and manufacturing industry grew five-fold from three million yen per
person in 1970 to 15 million yen per person in 1998.
INSERT Figure 2.1
In order to examine the human-capital deepening in Japan, we compiled data on the number of
non-production or skilled workers using the data of the Population Census. “Skilled workers” are
persons whose profession is classified either as “professional and technical” or as “managerial and
administrative.” We define “non-production workers” here as persons whose profession falls into
one of the following categories: professional and technical occupations, managers and administrators,
5
clerical and secretarial occupations, sales occupations, services occupations, protective occupations,
occupations in agriculture, forestry and fishing, occupations in transportation and
telecommunications, and other occupations. The definition of “non-production workers” is much
broader than the definition of “skilled workers” and includes not-highly educated workers. The share
of non-production (or skilled) workers in the total number of workers has been increasing, as shown
in Figure 2.2, though the growth rate is much more moderate than that of the capital-labor ratio. In
the period from 1980–2000, the share of non-production workers in manufacturing increased from
27.7% in 1980 to 30.7% in 2000.2 The share of skilled workers also grew during 1980-2000: in the
manufacturing sector, it rose from 9.0% to 10.5%, while in the economy as a whole it expanded from
9.8% to 13.9%.3
INSERT Figure 2.2
The increase in the capital-labor ratio and in the share of non-production (or skilled) workers can
be decomposed into the contribution of the increase within each industry (“within effect”) and the
contribution of the reallocation between industries (“between effect”) using the following
decomposition formula:
∑∑==
∆+∆=∆n
iii
n
iii SPPSP
11
i: industry (i=1, 2, ..., n)
∑∑==
=n
ii
n
ii LKP
11
/ , or ∑∑==
n
ii
n
iis LL
11, /
Pi=Ki/Li: Capital-labor ratio in industry i, or
2 This latter value, though, is substantially below the peak of 32.3% reached in 1997. The decline in the
share of non-production workers since 1998 is most likely the result of firms’ restructuring efforts – the
dismissal of managers, sales personnel, etc. – following the further deterioration of the Japanese
economy. 3 For details on the compilation of the skilled/non-production workers data, see Appendix.
6
=Lsi/Li: Share of non-production (or skilled) workers in total number of workers in
industry i
Si= Li/L: Share of workers in industry i in total number of workers in the economy as
a whole or in the manufacturing sector
Variables with an upper bar denote the average value of the period. ∆ denotes the change in the
variable overtime. The first term of the right hand side represents the increase in the factor intensity
within each industry (“within effect”) while the second term represents the reallocation between
industries (“between effect”).
Ideally, we should use the most disaggregated cross-industry data available for our
decomposition analysis. However, because of the data limitation, we had to use the relatively
aggregated data of the JIP database for our decomposition analysis.4 We should note that our
estimates of the within effect might suffer from upward biases as a consequence of this aggregation
problem.
The results of our decomposition analysis are reported in Tables 2.1 and 2.2. Table 2.1, which
summarizes the decomposition of capital-labor ratio growth, shows that there was a negative
between effect for most periods of 1970-1998, indicating the decline of the capital-intensive sectors
of the economy. Moreover, the magnitude of the between effect is very small throughout the entire
1970-1998 period and most part of the growth of capital-labor ratio is attributable to the within effect.
On the other hand, Table 2.2, which summarizes the decomposition of the growth of the share of
skilled or non-production workers, shows that here the between effect was positive in all cases,
showing that the share of human capital intensive industries has continuously increased both in the
manufacturing sector and in the economy as a whole. The within effect was also positive with the
4 In the following decomposition, we used data of 35 manufacturing industries and 43 non-manufacturing
industries.

7
exception of two cases in the period of 1990-2000, and it was always greater than the between effect
except for these two cases. The major implication of our results is that the within effect is very large.
Some part of the within effect may have been caused by the international division of labor within
each industry. We analyze this issue in section 4.
INSERT Tables 2.1 and 2.2
Our decomposition analysis thus suggests that physical and human capital deepening in the
Japanese economy is mostly attributable to the within-industry shift, not to the between-industry
shift, though we could see a negative between effect during the period 1990-2000 for the share of
non-production workers in the manufacturing sector and the share of skilled workers in the whole
economy. In the last two decades, and particularly in the 1990s, the age of “globalization,” both the
within-industry capital deepening and the between-industry allocation may have been caused by
expanding international trade. The between-industry shift may be partly explained by the change in
patterns of inter-industry trade which affects the size of each industry in Japan, while the
within-industry shift may be explained by the change in patterns of intra-industry trade which affects
the mixes of factor inputs in each industry. In the following sections, we will examine the change in
Japan’s trade patterns and analyze the determinants of the changes in factor intensities in Japan.
3. Japan’s Inter-industry Trade and Factor Contents
In this section, we take a general look at the pattern of Japan’s inter-industry trade in the last
two decades. Next, we estimate how factor contents in Japan’s international trade changed during
this period.
3.1 Overview of Japan’s International Trade
Although Japan’s overall import-GDP ratio has gradually declined over the last two decades,

8
imports of manufactured products have actually grown faster than the economy as a whole (Table
3.1). As Figure 3.1.B shows, the increase in imports mainly concentrated on electrical machinery and
labor intensive goods, such as apparel and wooden products, which in this figure are classified as
“other manufacturing products.” Since the share of the manufacturing sector in GDP declined during
this period, the ratio of imports of manufactured products to gross value added in the manufacturing
sector increased rapidly: by 11.5 percentage-points from 15.2% in 1985 to 26.7% in 2000 (Table 3.1).
The United States experienced a similar trend during the 1980s, when this ratio jumped by 12.4
percentage-points from 18.3% in 1978 to 30.7% in 1990 (Sachs and Shatz 1994). We would expect
an impact of a similar scale on Japan’s manufacturing sector as a result of the recent surge in
imports..5
INSERT Table 3.1 and Figure 3.1
On the other hand, the commodity composition of Japan’s exports at the two-digit level has
remained relatively stable over the last fifteen years (Figure 3.1.A). Nevertheless, looking at trade
patterns at a more detailed commodity classification level, it becomes clear that Japan’s
specialization has changed: the country is increasingly specializing in the export of capital goods and
key parts and components in the automobile and electrical machinery sector, while it has become a
net importer of many household electrical goods.6
Japan’s new imports of electrical machinery and labor intensive products are mainly provided
by East Asian economies. Figure 3.2 shows that nine East Asian economies (China, Hong Kong,
5 Comparing export shares and import penetration in the US, Canada, UK and Japan during the period
from 1974-93, Campa and Goldberg (1997) found import penetration to be extremely stable and
significantly lower in Japan than in the other countries. However, if we were to conduct a similar analysis
using more recent data, it seems probable that this conclusion no longer holds. 6 The share of machine parts in Japan’s total exports to East Asia increased from 31.7 % in 1990 to
40.2 % in 1998, while the share of capital goods, which include some machine parts, increased from
53.2 % to 56.8 % during the same period (MITI 1999).
9
Taiwan, Korea, Singapore, Indonesia, Thailand, the Philippines, and Malaysia) provided 64.2% of
Japan’s electrical machinery imports and 49.2% of Japan’s imports of “other manufacturing
products” in 2000. The East Asian economies’ share in Japan’s total imports of machinery and
intermediate products such as metal products and chemical products has also increased rapidly.
INSERT Figure 3.2
As a result of these trends, East Asia during the 1990s became the most important destination
for and origin of Japan’s international trade. As Figure 3.3 shows, trade with the nine East Asian
economies accounted for 48.5% of Japan’s total manufactured imports and 41.0% of total
manufactured exports in 2000.
INSERT Figure 3.3
This rise in Japan’s imports of labor intensive products and exports of capital and technology
intensive products (such as machinery and advanced intermediate products) can be easily recognized
as a deepening of the international division of labor with the relatively unskilled-labor abundant East
Asian economies. But how can we interpret the rapid increase in the two-way trade in electrical
machinery? Table 3.2, presenting Japan’s bilateral trade in electrical machinery with China and Hong
Kong in 1999 at the 3-digit level, provides a clue.
INSERT Table 3.2
This table shows two important facts. First, at the detailed commodity level, there seems to be
a division of labor within the electrical machinery industry. With China and Hong Kong, Japan is a
net importer of relatively labor-intensive products (such as television and radio-broadcast receivers
and electrical household goods) and a net exporter of technology-intensive other products. This
means that in order to correctly understand the division of labor and factor contents in trade between
Japan and East Asia, we need to analyze trade patterns at the detailed commodity level; otherwise,
the analysis will suffer from aggregation bias problems (Feenstra and Hanson 2000).

10
The second important fact this table shows is the existence of huge intra-industry trade
between Japan and China plus Hong Kong. For example, in the case of television receivers, the total
trade value is 37 times greater than the trade balance. It seems that we need to analyze intra-industry
trade in order to correctly evaluate the impact of trade on Japanese economy.
3.2 Factor Contents in Japan’s Trade of Manufacturing Products
In this subsection, we analyze the changes in factor contents in Japan’s trade. In order to avoid
aggregation bias, we should calculate factor contents at the most disaggregated level possible.7 The
most disaggregated data on direct factor requirements are those available in the Report on Industrial
Statistics of the Ministry of International Trade and Industry, which is based on the Census of
Manufactures. The data is classified by the 4-digit Standard Industrial Classification for Japan,
which listed 540 manufacturing industries in 1990.
There is no direct converter between this industry classification and the 9-digit HS
classification used by the Ministry of Finance for the compilation of Japan’s international trade
statistics. In order to link the two sets of data – factor requirements and international trade – we used
the basic industry classification of the Japan Input-Output Tables 1990 by the Management and
Coordination Agency, which lists 341 manufacturing industries, as our benchmark classification.
Using supplementary converter tables of the I-O statistics, we converted both the factor requirement
data and the international trade data into the basic I-O classification. As a result, we obtain factor
requirement and international trade data for 246 manufacturing industries.8 In order to estimate
7 Using Management and Coordination Agency, Japanese Government “1980-85-90 Linked Input-Output
Tables,” Sakurai (2001) estimated factor contents in Japan’s trade for the years 1980, 85, and 90. 8 The factor requirement data of the Census of Manufactures is on an establishment basis and each
establishment is classified by its most important product. Since many establishments produce various
commodities simultaneously, this classification method is problematic. The I-O converter from the

11
indirect factor requirements, we used the corresponding I-O table.
Ideally, we would use up-to-date factor requirement data and I-O tables in order to take
account of technology change in Japan. Unfortunately, the factor requirement data is available only
until 1990, because the Census of Manufactures after that year does not cover headquarter activities.
Because of this constraint, we used constant factor requirement and I-O data of 1990 for our analysis
of the entire 1980-2000 period.9
Factor content in Japan’s trade in year t (t = 1980, 1990, 2000) is calculated by
tt TAIDX 1)( −−=
where (K × 1) vector Xt =[xk,t] denotes the total contents of factor k in Japan’s trade of year t. (K × J)
matrix D =[dk,j] denotes the quantity of primary factor k directly used per unit of output in industry j
in year 1990. (J × J) matrix A is the input-output matrix of year 1990.10 (J × 1) vector Tt is the
net-export vector of year t in 1990 prices. In order to derive trade data in 1990 prices, we used the
deflators of the Management and Coordination Agency’s Japan Linked Input-Output Table (various
years) and the Wholesale Price Index of the Bank of Japan at the 3-digit level.11
We analyzed factor content in terms of the following four primary factors: physical capital (in
Census of Manufactures to the basic I-O classification takes account of this problem and converts
establishment-based data into activity-based data. We used the I-O converter in order to construct the
factor requirement data for each I-O classification-based industry. Therefore, our factor requirement data
were also transformed into the activity-based data. 9 Because of this methodology, there is a risk of overestimating factor contents in recent trade in the case
of industries where total factor productivity has grown rapidly. 10 The input-output matrix here covers only manufacturing industries. Therefore, our analysis does not
include indirect factor requirements through changes in production in non-manufacturing industries. 11 The conversion of trade statistics at the HS 9-digit level into trade data at classified at the basic
industry level of the I-O tables in 1990 price was conducted by H. Nosaka, T. Inui, K. Ito and K. Fukao as
part of the Japan Industrial Productivity (JIP) database project. The result is included in the JIP database.
For more detail on this database see Fukao, Inui, Kawai, and Miyagawa (2003).
12
1990 prices, book value), production labor (number of workers), non-production labor (number of
workers), and land (in 1990 prices, book value). In order to analyze how the increase in Japan’s trade
with the East Asian economies affected Japan’s factor markets, we subdivided Japan’s total net
exports in each industry into gross exports and gross imports by six regions, namely, (1) China and
Hong Kong, (2) the NIEs-3 (Taiwan, South Korea, and Singapore), (3) the ASEAN-4 (Indonesia,
Thailand, Malaysia, and The Philippines), (4) the US, (5) the EU, and (6) all other economies.
The results of the factor content analysis for the years 1980, 1990, and 2000 are reported in
Table 3.3. Reflecting Japan’s huge trade surplus, Japan is a net exporter of all the four primary
factors. For example, according to our calculations, in the year 2000, Japan recorded factor-content
net exports of 363,000 production workers, which represents 4.7 % of the total of production
workers (7,717,000) in manufacturing in 1990. Compared with the trade pattern observed in 1990,
the 2000 figure for factor content net-exports of production labor represents a decline of 42%. This
decline was almost entirely caused by Japan’s trade with China and Hong Kong (Table 3.4). In the
year 2000, about one-third of factor content gross-imports of production workers came from China
and Hong Kong (Table 3.3).
INSERT Table 3.3 and Table 3.4
In the case of non-production workers, there were factor content net-exports of 378,000
production workers in the year 2000, which represents 10.9% of the total of non-production workers
(3,456,000) in manufacturing in 1990. Compared with trade patterns in 1980, net-exports of
non-production workers have increased by 89,000, which is equivalent to 2.6% of the total of
non-production workers in 1990. The major increase in this factor content occurred in Japan’s trade
with the US (Table 3.4).
In the case of land, factor content net-exports in 2000 amounted to 1.36 trillion yen (in 1990
prices), which is equivalent to 10.5 % of the total land value (12.9 trillion yen) used in

13
manufacturing in 1990. Net exports of land have gradually declined over the last twenty years (Table
3.4).
Capital stock factor content net-exports in 2000, meanwhile, stood at 9.12 trillion yen (in 1990
prices), which represents 16.5% of the total capital stock (55.4 trillion yen) in manufacturing in 1990.
Compared with 1980, this represent an increase in net-exports of capital stock by 1.1 trillion yen or
2.0% of the total capital stock in 1990 (Table 3.4).
Relative to the total amount of each of the four primary input factors used in manufacturing,
Japan exported a large amount of capital and non-production labor but only a small amount of
production labor in 2000. Since non-production workers on average are more educated than
production workers and Japan is a country abundant in physical and human capital, the above results
are consistent with the Heckscher-Ohlin theory.
As Table 3.3 shows, in the period from 1980-2000, Japan’s factor content net-exports of
production workers fell by 3.3%, while net-exports of non-production workers rose by 2.6%. This
change in trade patterns has the effect of increasing the implied supply-ratio of
production/non-production workers available to the manufacturing sector for other use by about
5.9%. More than one-half of this change (3.2%) was caused by Japan’s trade with China and Hong
Kong.
During 1980-2000, Japan’s factor content net-exports of capital stock grew by 2.0%, while
net-exports of workers overall (production and non-production) decreased by 1.5%. This change in
the trade pattern has the effect of reducing the implied supply of capital stock per worker available to
the manufacturing sector for other use by 3.5%. Thus, compared with the impact on the implied
supply ratio of production/non-production workers, the effect of recent changes in trade patterns on
the implied supply of capital stock per worker has been small.
By a similar calculation using the results of the factor content analysis at the 4-digit level

14
carried out by Feenstra and Hanson (2000), we can evaluate the impact of US trade on its factor
markets. This shows that in the period of 1982-94, changes in US trade patterns had the effect of
increasing the implied supply ratio of production/non-production workers available to the
manufacturing sector for other use by 1.0%, while the implied supply of capital stock per worker
available to the manufacturing sector for other use fell by 2.3%.12 Thus, compared with the US,
Japan experienced a much more drastic change in factor content net-exports over the last two
decades in terms of its implied supply ratio of production/non-production workers available to the
manufacturing sector for other use.
The trends shown here mean that, Japan’s factor content net-exports have changed in a
direction that offsets the effect of the accumulation of physical and human capital per capita. Japan
has come to export more physical and human capital intensive products over the past two decades.
However, compared with the rapid deepening of physical and human capital in the macro-economy
described in Section 2, the offsetting effect of international trade seems to be small. Table 3.5
compares physical and human capital deepening in the Japanese manufacturing sector as a whole
with that purely attributable to changes in factor contents of trade. Although the average annual
growth rate of capital-labor ratio for the manufacturing sector total is 7.60% for the 1980-1998
period, the growth rate becomes very small at 0.18 % when we only take account of change in factor
contents of trade. As for the growth rate of the share of non-production workers, the offsetting effect
of international trade is also small for the 1980-1990 period and throughout the 1980-2000 period.
However, in the 1990s, the contribution of international trade to the growth of the share of
non-production workers in the Japanese manufacturing sector is much larger, which implies a
12 In the period of 1982-94, the United States saw an increase in its factor content net-imports of
production (non-production) workers in manufacturing of 8.2% (7.2%). It also experienced a rise in factor
content net-imports of capital stock in manufacturing of 5.5% and a decline in net-exports of (production
plus non-production) workers of 7.8% of total workers in manufacturing.

15
significant effect of international trade on Japan’s human capital deepening.
INSERT Table 3.5
4. Japan’s Intra-Industry Trade and Determinants of Factor Intensity within Industry
So far, we have found that the macro-level capital-labor ratio has been increasing over the last
two decades, and that most of the increase is attributable to the within-industry shift and not the
between-industry shift. Moreover, most of the macro-level increase in the skilled or
non-production labor share in the total number of workers has also been induced by the
within-industry shift. As has been argued in previous studies, the international division of labor
through the fragmentation of production processes and the import of unskilled labor-intensive
intermediate inputs may have contributed to an increase in the relative demand for skilled labor in
each industry. That is, if firms fragment their production into discrete activities and move
non-skill-intensive activities abroad, then trade will shift employment toward skilled workers within
those industries. This type of international division of labor has been referred to as “outsourcing” in
the recent literature. Feenstra and Hanson (1996a, 1996b, 1999) and Hijzen, Görg and Hine (2003),
for example, provide econometric evidence of a positive relationship between outsourcing and the
demand for skilled labor. Although the international fragmentation of production has been increasing
rapidly in Japan in recent years, too, contributing to changes in trade patterns, studies analyzing the
impact of fragmentation on labor and capital are very limited.13
Moreover, vertical intra-industry trade (VIIT), i.e. intra-industry trade where goods are
differentiated by quality, may have a large impact on factor demands within each manufacturing
industry in Japan. As Falvey (1981) pointed out in his seminal theoretical paper, commodities of the
13 An exception is Sakurai (2000), who conducts a similar analysis for Japan. See section 4.2 for the
details.

16
same statistical group but of different quality may be produced using different mixes of factor inputs.
Therefore, developed economies like Japan may export physical and human capital-intensive
products of high-quality and import unskilled labor-intensive products of low quality from
developing economies. As a result, an increase in VIIT may also raise the physical and human
capital intensity in Japan.
In the following subsections, we briefly outline the changes in outsourcing and VIIT patterns
by industry in Japan for the period from 1988–2000.14 We also discuss the relationship between
changes in factor demand and trade patterns by industry. Using industry-level as well as firm-level
data, we conduct econometric analyses to investigate the determinants of the observed growth in the
skilled-labor share in total workers and in the capital-labor ratio. We should note that following
analyses are limited to the manufacturing sector due to data constraints.
4.1 Industry-Level Overview of Fragmentation and Factor Intensity
Japan’s trade patterns have undergone various changes over time: in particular, the share of
trade with Asian countries in overall trade has increased markedly. In this subsection, utilizing
Japan’s customs data and the JIP database, we investigate VIIT and outsourcing from foreign
countries by industry, and analyze the impacts of these trends on shift in factor demand in Japan.
Figure 4.1 shows the share of VIIT, a broad outsourcing measure, and a narrow outsourcing
measure by industry for the year 2000, while Figure 4.2 presents the average annual growth rates of
these values from 1988–2000 by industry.15 Following major preceding studies such as Greenaway,
Hine, and Milner (1995) and Fontagné, Freudenberg, and Péridy (1997), our VIIT measure is
14 As for the capital-labor ratio, due to data constraints, our analysis focuses only on the period from
1988-98. 15 For the definition of VIIT and broad and narrow outsourcing measures, see Appendix. For more
detailed analyses on VIIT in Japan and East Asia, see Fukao, Ishido, and Ito (2003).

17
calculated based on the assumption that the gap between the unit value of imports and the unit value
of exports for each commodity reveals the qualitative differences of the products exported and
imported between the two countries. Our measures of broad and narrow outsourcing are constructed
following Feenstra and Hanson (1999). The broad outsourcing measure expresses imported
intermediate inputs relative to total expenditure on non-energy intermediate inputs in each industry.
The narrow outsourcing measure is expressed by the imported intermediate inputs purchased from
the same JIP industry as the good being produced divided by the total expenditure on non-energy
intermediate inputs in each industry. Figure 4.1 shows that the level of the VIIT share in the year
2000 was relatively high (more than 30 percent) in publishing and printing, other chemicals, metal
products, electrical machinery, other electrical machinery, and precision machinery and equipment.
On the other hand, the broad outsourcing measure was high (more than 15 percent) in food products
(livestock products and processed marine products), apparel and accessories, lumber and wood
products, leather and leather products, basic chemicals, chemical fibers, non-ferrous metals, other
electrical machinery, and precision machinery and equipment. The narrow outsourcing measure was
high (more than 5 percent) in food products (livestock products and processed marine products),
lumber and wood products, pulp, paper, and paper products, leather and leather products, basic
chemicals, petroleum products, steel manufacturing, non-ferrous metals, other electrical machinery,
other transportation equipment, and precision machinery and equipment. Figure 4.2 shows that the
VIIT share and outsourcing measures increased in most manufacturing sectors during the period
from 1988–2000. In particular, we find that the outsourcing measures increased relatively more in
food products, textile products, and machineries, while the VIIT share increased relatively more in
food products, textile products, petroleum and coal products, non-ferrous metals and motor vehicles.
INSERT Figure 4.1 and Figure 4.2
Next, let us look at the correlations between changes in factor intensities, the VIIT share, and

18
the outsourcing measures. Table 4.1 summarizes the correlation coefficients between the annual
growth rates of the shares of skilled workers, non-production workers, the VIIT share, and the broad
and narrow outsourcing measures for the period from 1988–2000. Although we can see a positive
correlation between skilled workers’ share and the VIIT share, the correlation coefficient is not
statistically significant. Moreover, the correlation coefficients between the capital-labor ratio and the
VIIT share and between non-production workers’ share and the VIIT share are negative, though not
significant. As for changes in the outsourcing measures and factor intensities, a significantly positive
correlation can be seen only in the case of skilled workers’ share. Therefore, the simple correlation
coefficient analysis does not provide strong support for the conjecture that outsourcing or VIIT may
have contributed to physical and human capital deepening in each industry.
INSERT Table 4.1
4.2 Econometric Analysis
In this section, we conduct a statistical analysis of the determinants of factor intensities using
the industry-level data from 1988–2000. Several previous studies have analyzed the impact of
fragmentation on skill upgrading (human capital deepening). Using detailed industry-level data for
the US, Feenstra and Hanson (1996a, 1996b, 1999) estimate the effect of international outsourcing
on wage inequality. Hijzen, Görg and Hine (2003) conduct a similar analysis using UK data for 53
manufacturing industries for the period from 1982–1997. As for Japan, Sakurai (2000) analyzes this
issue using data for 39 manufacturing industries for the period from 1987–1990. While the studies
on the US and the UK found a strong positive relationship between outsourcing and wage inequality,
Sakurai’s (2000) study on Japan did not produce such clear-cut evidence. Sakurai explains that his
ambiguous result might be due to the short estimation period. The present paper aims at applying
and extending the Feenstra and Hanson approach by using JIP industry-level data (35 manufacturing

19
industries) for the period from 1988–2000. In addition, we take account of the role of skill-biased
technological change (SBTC) in the increase in skilled (non-production) worker intensity, utilizing
the JIP IT (Information Technology) database.16 As Hijzen, Görg and Hine (2003) mention, the
inclusion of the 1990s in the analysis is thought to be crucial as international fragmentation and
information technology progressed rapidly in the past decade. However, one drawback of our
analysis is that we cannot calculate wage bills for skilled (non-production) and unskilled
(production) workers due to data constraints. Therefore, we assume that the relative wage rates of
skilled (non-production) and unskilled (production) workers have not changed over time, and we use
the ratio of the number of skilled (non-production) workers to the total number of workers as a proxy
for the share of skilled (non-production) workers’ wage bill in the total wage bill.
A translog cost function approach, based on the work of Berman, Bound and Griliches (1994)
and Feenstra and Hanson (1996b), is usually employed in the literature to estimate skill upgrading
and we follow this approach here. Similarly, following previous studies, we consider capital as a
fixed input in the short-run, while skilled and unskilled (non-production and production) workers are
variable factors of production. Therefore, the short-run translog cost function can be presented as:
ikij
J
j
K
kjkilik
K
k
K
lkl
isij
J
j
J
sjsik
K
kk
J
jijji
xwxx
wwxwC
lnlnlnln21
lnln21lnlnln
1 11 1
1 1110
∑∑∑∑
∑∑∑∑
= == =
= ===
++
+++=
ϕδ
γβαα
(4.1)
where Ci is the variable cost for industry i, wij denotes the wages of workers in skill group j, and xik
denotes the fixed inputs or outputs k. Differentiating the translog cost function with respect to wages
16 According to the argument put forward by Feenstra and Hanson (1999), both skill-biased technological
change and outsourcing can be considered to be associated with within-industry changes in skill intensity
as a result of their effect on the relative productivity of different skill groups. That is, as fragmentation or
outsourcing take the form of moving unskilled labor-intensive processes from a developed country to a
developing country, they have a similar effect as technological change.

20
yields the factor payments to skill group j over the total wage bill.
∑∑==
++=K
kikjkij
J
sjsjij xwS
11lnln ϕγα
(4.2)
Assuming that quality-adjusted wages will be identical across industries, the wage terms can be
dropped from the right-hand-side of the equation (4.2). We consider technological change, VIIT, and
outsourcing as structural variables and assume there are three kinds of capital, i.e., IT hardware, IT
software, and non-IT capital. A full set of year dummies is included in order to capture
economy-wide skill upgrading as well as year-to-year changes in the wage levels faced by all
industries. Therefore, we estimate the following equation:
( ) ( ) ( )( )
iti
tjitjitjitjitj
itjitjitjjijt
DgOutsourcinVIITVARDVAVANonITVAITsoftVAIThardS
ενϕϕϕϕϕ
ϕϕϕϕ
+++++++
+++=
87654
3210
exp/ln/ln/ln/ln
(4.3)
where IThard, ITsoft, and NonIT denote IT hardware stock, IT software stock, and non-IT capital
stock, respectively; VA is value added in industry i, RDexp/VA is a proxy for technological change
calculated as expenditure on research and development over value added, VIIT represents the VIIT
value over industry i’s shipment, Outsourcing reflects either broad or narrow outsourcing, and D is a
full set of year dummies. Subscript t represents time. In order to examine different effects of VIIT
with Asian countries and VIIT with other countries, we prepare three variables representing VIIT:
first, Japan’s VIIT with all countries in the world divided by the industry’s shipment; second, Japan’s
VIIT with nine Asian countries divided by the industry’s shipment; and third, Japan’s VIIT with all
the countries except for the nine Asian countries divided by the industry’s shipment.17
In addition, using the industry-level data, we examine whether the international division of
17 For more details on the definition of the variables and data sources, see Appendix.

21
labor contributed to physical capital deepening in Japan. We use the capital-labor ratio (physical
capital stock divided by number of workers, KL) as the dependent variable and regress it on the
logarithm of the wage rate relative to the rental price of capital (ln(wage/rental price)) and variables
representing the degree of the international division of labor.
The results of the GLS estimation are presented in Table 4.2. This shows that the estimated
coefficients on ln(IThard/VA), ln (VA), and RDexp/VA are significantly positive in all cases where
skilled workers’ share (SKILLED) or non-production workers’ share (NONPROD) in the total
number of workers is used as the dependent variable (columns (1) to (4)). The results imply that: 1)
IT hardware intensity has a positive impact on skill upgrading, and skill-biased technological change
may have increased the share of skilled (non-production) workers; 2) the scale-effect is positive and
greater value-added is associated with a higher skilled (non-production) workers’ share; and 3) R&D
intensity which is a proxy for technological change, has a positive impact on skill upgrading. On the
other hand, a significantly negative coefficient is obtained for ln(NonIT/VA) in all the cases but one
for columns (1) to (4), which suggests that increases in non-IT capital intensity favor unskilled
(production workers) in Japan. As for IT software intensity, the estimated coefficients are positive in
columns (1) and (2) but negative in columns (3) and (4), though they are not statistically significant
in any of the cases.
As for the VIIT share, the estimated coefficients are significantly positive in columns (1) and
(2) but statistically insignificant in columns (3) and (4), suggesting that VIIT raises the skill-intensity
calculated as the share of workers whose occupation is classified as professional and technical or
managerial and administrative. Moreover, looking at the magnitude of the coefficients in column (2),
VIITasia9/shipment has a much larger coefficient than VIITnon-asia9/Shipment. This may reflect the
fact that vertical FDI in the Asian countries tends to consist of the transfer of low-skill production
work to these countries while high-skilled employees remain at home. We can confirm that Japanese
22
manufacturing industries realized skill upgrading as a result of the international division of labor
with the nine Asian countries. When the skill-intensity is calculated as the share of non-production
workers, however, VIIT does not have a significant impact on skill upgrading though the estimated
coefficient on VIIT is positive in columns (3) and (4). This result might be a reflection of the fact
that Japanese firms reduced the share of non-production and non-professional workers (such as sales
persons) in the course of the restructuring efforts during the 1990s.
Although narrow outsourcing has a positive coefficient and the difference between broad and
narrow outsourcing has a negative coefficient in columns (1) to (4), none of coefficients are
significant. We could not find strong evidence that outsourcing to foreign countries contributed to
skill upgrading in Japan, which is not consistent with the results of previous studies on the United
States and the United Kingdom.
As for the capital-labor ratio (column (5)), none of the explanatory variables except for the
VIIT variable have statistically significant coefficients. Although VIITworld/shipment has a
significantly positive coefficient, the small value of the Wald-statistics indicates the weak
explanatory power of the equation. Again, we could not obtain strong evidence that VIIT and
outsourcing contributed to physical capital deepening in Japan, suggesting that capital deepening
was caused by other factors.
INSERT Table 4.2
5. Conclusion
Our goal in this paper has been to investigate the changing trade patterns and their effect on
factor intensities in Japan, mainly focusing on the manufacturing sector. Given the observation that
the capital-labor ratio and the share of skilled workers in the total number of workers have been
growing for the last couple of decades, we first conducted decomposition analyses and found that

23
most of the macro-economic change in the capital-labor ratio and the change in the skilled-labor
ratio were attributable to a within-industry shift rather than a between-industry shift. The
between-industry shift can be partly explained by the change in patterns of inter-industry trade which
affects the size of each industry. However, the large within-industry effect led us to suspect that the
division of labor and intra-industry trade between Japan and Asian countries may have contributed to
the within-industry increase in capital intensity and skilled-labor intensity. Therefore, we first
analyzed factor contents of trade from the aspect of inter-industry trade, and then analyzed whether
the deepening of the international division of labor and vertical intra-industry trade contributed to the
within-industry change in factor intensities in Japan.
We found that Japan’s factor content net-exports of capital and non-production labor grew
rapidly while net-exports of production workers fell by a large amount. Interestingly, the decline in
the factor content of net-exports of production workers was almost entirely caused by Japan’s trade
with China and Hong Kong. Although international trade to a considerable extent contributed to the
growth in the share of non-production workers in the Japanese manufacturing sector as a whole,
most of the macro-level accumulation of physical capital was not offset by the growth in factor
content net-exports of physical capital.
Although we clearly saw a drastic increase in VIIT and outsourcing to foreign countries,
particularly to Asian countries, our empirical analysis provided only weak evidence that the
deepening international division of labor contributed to the change in factor intensities in Japan. We
did not find a significant and robust positive relationship between fragmentation and capital-labor
ratios. As for skill intensity, we found that VIIT had a strong positive effect on the increase in the
share of skilled workers when these were defined as those holding professional and technical or
managerial and administrative occupations. However, we did not find such a relationship when the
skill-intensity was calculated as the share of non-production workers. We should note that the skilled

24
(professional, technical, managerial, and administrative) labor share in the total number of workers is
only around 10% and is much lower than the share of non-production workers which is around 30%.
According to our results, specialization in the export of skilled-labor-intensive products may have
contributed to the increase in the relative demand for skilled (professional, technical, managerial,
and administrative) labor within industry. However at the same time, our results could also imply
that changes in trade patterns (specialization in capital-intensive production) did not offset the excess
supply of capital in Japan. Probably one plausible explanation for this small offsetting effect might
be that VIIT or fragmentation patterns are not determined by the abundance of capital endowments,
but by other factors such as endowments with skilled labor, the agglomeration of industries,
highly-developed supporting industries, etc. Davis and Weinstein (2003), who empirically tested the
determinants of the firm-level trade patterns, conclude that after controlling for national factor
accumulation, firm level export decisions seem to have little correlation with the capital intensity of
their production process. We do not know yet whether this story applies to the case of industry-level
trade patterns and which factors matter for trade patterns. This is, however, an issue that deserves
closer scrutiny in future investigations.

25
Appendix. Definition of Variables Used in the Econometric Analysis and Data Sources
1. Labor data
Data on skilled and unskilled labor were constructed mainly using the Population Census of
Japan, published by Statistics Bureau, Ministry of Public Management, Home Affairs, Posts, and
Telecommunications. The Population Census is the most fundamental and reliable survey and is
conducted every five years, covering all permanent and temporary residents in Japan. The survey
report provides data on employment by detailed occupational classification (3-digit-level) and by
industry. We used the 1980, 1985, 1990, and 1995 employment data as benchmarks and interpolated
the data for years between the benchmarks. As for the years after 1995, we utilized the Employment
Status Survey data, published by Statistics Bureau, Ministry of Public Management, Home Affairs,
Posts, and Telecommunications, because the results of the 2000 Population Census have not been
released yet. The Employment Status Survey is based on a series of surveys that cover approximately
one percent of the working population. We first calculated the skilled labor share for 1992, 1997, and
2002 based on the Employment Status Survey. Then, for the 1996 and 1997 data on skilled labor, we
extended the 1995 employment data by occupation and industry using the growth rate of the skilled
labor share from 1992 to 1997. For the 1998, 1999 and 2000 data, we extended the 1997 data using
the growth rate of the skilled labor share from 1997 to 2002. The Population Census and the
Employment Status Survey allow us to construct a measure of skill that is more accurate than the one
based on production and non-production labor generally used in preceding studies. In the Population
Census and the Employment Status Survey, workers are basically classified according to 10 Major
Groups as shown in Appendix Table 1. We distinguished two skill groups (skilled or unskilled) as
well as production/non-production classifications. Skilled workers are those classified in Major
Groups 1 (Professional and Technical Occupations) and 2 (Managers and Administrators). Otherwise,

26
workers are classified as unskilled. Moreover, production workers are those classified in Major
Group 9 (Plant and Machine Occupations, Craft and Related Occupations, and Occupations in
Mining and Construction). Workers classified in all the other Major Groups are categorized as
non-production workers.
INSERT Appendix Table 1
2. Measurement method and data source for vertical intra-industry trade
In order to identify vertical and horizontal IIT we adopt a methodology used by major
preceding studies on vertical IIT such as Greenaway, Hine, and Milner (1995) and Fontagné,
Freudenberg, and Péridy (1997). The methodology is based on the assumption that the gap between
the unit value of imports and the unit value of exports for each commodity reveals the qualitative
differences in the products exported and imported between the two economies.
We break down the bilateral trade flows of each detailed commodity category into the
following three patterns: (a) inter-industry trade (one-way trade), (b) intra-industry trade (IIT) in
horizontally differentiated products (products differentiated by attributes), and (c) IIT in vertically
differentiated products (products differentiated by quality). Then the share of each trade type is
defined as:
∑∑
+
+
jkjkjkk
j
Zkjk
Zjkk
MM
MM
)(
)(
''
''
(A1)
where the variables are defined as
M kk'j: value of economy k’s imports of product j from economy k';
Mk'kj: value of economy k'’s imports of product j from economy k;
UVkk'j: average unit value of economy k’s imports of product j from economy k';
UVk'kj: average unit value of economy k'’s imports of product j from economy k.
27
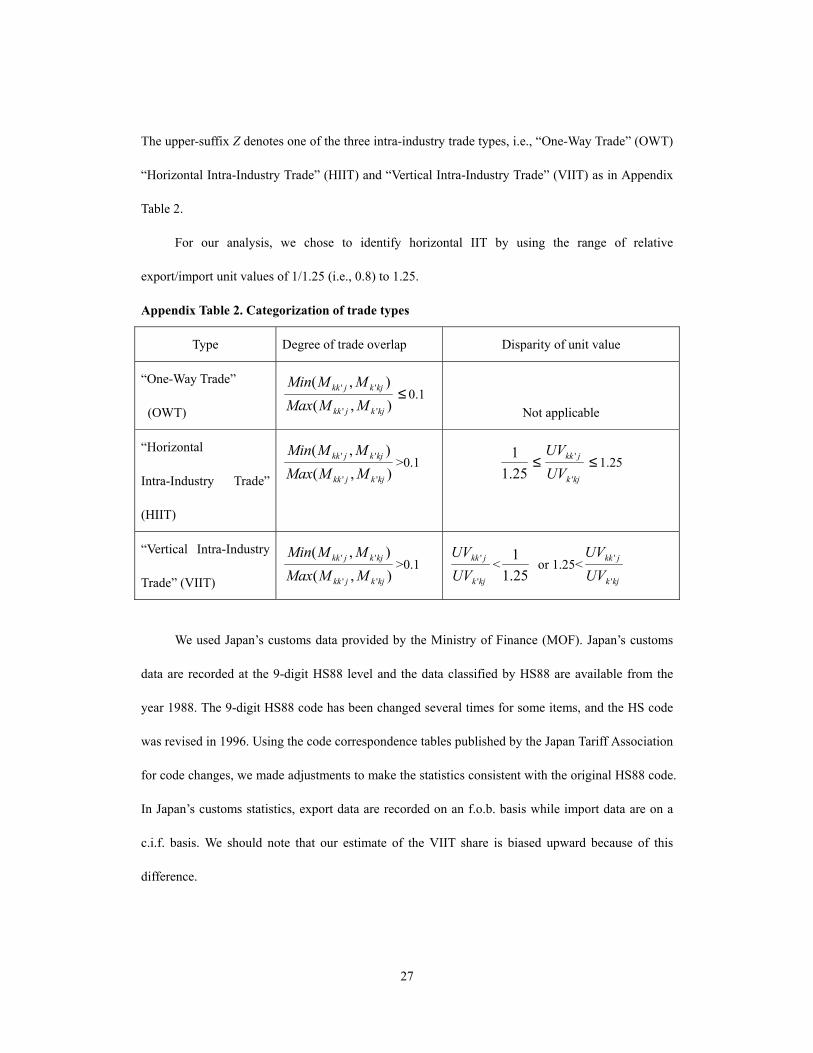
The upper-suffix Z denotes one of the three intra-industry trade types, i.e., “One-Way Trade” (OWT)
“Horizontal Intra-Industry Trade” (HIIT) and “Vertical Intra-Industry Trade” (VIIT) as in Appendix
Table 2.
For our analysis, we chose to identify horizontal IIT by using the range of relative
export/import unit values of 1/1.25 (i.e., 0.8) to 1.25.
Appendix Table 2. Categorization of trade types
Type Degree of trade overlap Disparity of unit value
“One-Way Trade”
(OWT) ),(),(
''
''
kjkjkk
kjkjkk
MMMaxMMMin
≤ 0.1
Not applicable
“Horizontal
Intra-Industry Trade”
(HIIT)
),(),(
''
''
kjkjkk
kjkjkk
MMMaxMMMin
>0.1 25.11 ≤
kjk
jkk
UVUV
'
' ≤ 1.25
“Vertical Intra-Industry
Trade” (VIIT) ),(),(
''
''
kjkjkk
kjkjkk
MMMaxMMMin
>0.1 kjk
jkk
UVUV
'
' <25.11
or 1.25<kjk
jkk
UVUV
'
'
We used Japan’s customs data provided by the Ministry of Finance (MOF). Japan’s customs
data are recorded at the 9-digit HS88 level and the data classified by HS88 are available from the
year 1988. The 9-digit HS88 code has been changed several times for some items, and the HS code
was revised in 1996. Using the code correspondence tables published by the Japan Tariff Association
for code changes, we made adjustments to make the statistics consistent with the original HS88 code.
In Japan’s customs statistics, export data are recorded on an f.o.b. basis while import data are on a
c.i.f. basis. We should note that our estimate of the VIIT share is biased upward because of this
difference.
28
3. Outsourcing measures
Following Feenstra and Hanson (1999) and other previous studies, we constructed outsourcing
measures as follows:
For each industry i, we measure imported intermediate inputs as
Σj[input purchases of good j by industry i]*[(imports of good j)/(consumption of good j)]
(A2)
where consumption of good j is measured as (shipments + imports - exports). The broad measure of
foreign outsourcing is obtained by dividing imported intermediate inputs by total expenditure on
non-energy intermediate inputs in each industry. The narrow measure of outsourcing is obtained by
restricting attention to those inputs that are purchased from the same JIP industry as the good being
produced. Using Japan’s customs data, Hiromi Nosaka, Tomohiko Inui, Keiko Ito, and Kyoji Fukao
compiled trade data at the basic industry classification of the I-O tables in 1990 prices as part of the
Japan Industrial Productivity (JIP) database project at the Economic and Social Research Institute,
Cabinet Office, Government of Japan. The correspondence between the Fukao-Ito industry
classification and the 1980-85-90 Japan Linked Input-Output standard classification for
manufacturing industries is presented in Appendix Table 3. The correspondence between the JIP
classification and the Fukao-Ito classification for manufacturing industries is presented in Appendix
Table 4. When calculating the outsourcing measures, we first calculated the input coefficients by
Fukao-Ito industry and aggregated the imported intermediate inputs in each Fukao-Ito industry into
the corresponding JIP industry. As for the narrow outsourcing measure, we restricted the Fukao-Ito
industry subscripts i and j in equation (A2) to be within the same JIP industry. We should note that
we only took account of intermediate inputs from manufacturing industries.
INSERT Appendix Tables 3 and 4
29
4. Other variables used in the industry-level econometric analyses
IT hardware (million yen, 1990 prices)
We mainly used IT hardware stock data in the JIP database. For details on the JIP database,
see Fukao, Inui, Kawai, and Miyagawa (2003). Tangible IT assets (hardware) include office
machines, computers, computer peripherals, communications equipment, optical instruments and
medical instruments. As only data until 1998 are available in the JIP database, we extended the IT
hardware stock until 2000 by using the annual growth rate of real IT hardware stock from 1998 to
2000 in JCER (Japan Center for Economic Research) IT data.18
IT software (million yen, 1990 prices)
We constructed industry-level software stock data using the JIP database, the JCER IT data,
and software investment data underlying Motohashi (2002) and Jorgenson and Motohashi (2003).19
The JCER data provide real software stock by 2-digit industry but include only order-made software.
In the JIP database, real software stock data which cover in-house software and general application
software as well as order-made software are available until 1999. Therefore, we first divided the JIP
software stock value at the macro-level into each 2-digit industry using the distribution ratios in the
JCER IT data. Then, we further divided it into the JIP industry classification, using the distribution
ratios of IT hardware by JIP industry. Since the JIP software stock data are available only until 1999,
for the year 2000, we calculated the macro-level real software stock, using Motohashi’s software
investment data and software deflators.
Non-IT physical capital stock (million yen, 1990 prices)
Physical capital stock data including IT hardware stock by industry are available in the JIP
18 We wish to thank Professor Tsutomu Miyagawa at Gakushuin University and Ms. Yukiko Ito at the
Japan Center for Economic Research for providing the JCER IT data. 19 We are also grateful to Dr. Kazuyuki Motohashi at Hitotsubashi University for providing the data.

30
database until 1998. We extended the data up to 2000 by using the investment data in METI’s Report
on Industry Statistics, which is based on the Census of Manufactures. First, we aggregated the data
on investment in fixed assets in the Report on Industry Statistics into the JIP industry-level and then
deflated them using the gross domestic capital formation deflator (plant and equipment) in the
Annual Report on National Accounts released by the Cabinet Office, Government of Japan. We
assumed a depreciation rate of 10 percent and estimated the real physical capital stock for 1999 and
2000. Non-IT physical stock is defined as physical capital stock minus IT hardware stock.
Value added (million yen, 1990 prices)
We used value added data in the JIP database up to 1998. The data for 1999 and 2000 were
constructed using the SNA Input-Output Tables released by the Cabinet Office, Government of
Japan.
R&D expenditure (million yen, 1990 prices)
We used R&D expenditure data in the JIP database up to 1998. We extended the data up to
2000 using the Report on the Survey of Research and Development, Ministry of Public Management,
Home Affairs, Posts and Telecommunications. The deflators were taken from the Annual Report on
the Promotion of Science and Technology, Ministry of Education, Science, Sports and Culture.
VIIT (%)
The variable VIIT is defined as the share of vertical intra-industry trade in total trade values.
For our definition of vertical intra-industry trade and data sources, see Appendix 2.
VIITworld/Shipment (%)
This variable is calculated as (VIIT*(exports+imports)/2/domestic shipment). VIITworld takes
account of Japan’s trade with all countries in the world. Data on domestic shipments were taken
from the JIP database up to 1998 and from the SNA Input-Output Tables for 1999 and 2000.
VIITasia9/Shipment (%)
31
This variable is calculated in the same way as VIITworld/Shipment. VIITasia9 takes account of
Japan’s trade with the following nine Asian countries: China, Korea, Taiwan, Hong Kong, Singapore,
Indonesia, Malaysia, the Philippines, and Thailand.
VIITnon-asia/Shipment (%)
This variable is calculated in the same way as VIITworld/Shipment. VIITnon-asia takes
account of Japan’s trade with all countries other than the nine Asian countries.
KL (million yen per person, 1990 prices)
The capital-labor ratio was calculated using physical capital stock data and data on number of
workers taken from the JIP database for 1988–1998.
Wage (1990=1.0)
The labor quality-adjusted wage index was taken from the JIP database for 1988–1998.
Rental price (1990=1.0)
The rental price index of capital was taken from the JIP database for 1988–1998.

32
References
Berman, Eli, John Bound, and Zvi Griliches (1994) “Changes in the Demand for Skilled Labor
within U.S. Manufacturing: Evidence from the Annual Survey of Manufactures,”
Quarterly Journal of Economics, Vol. 109, pp. 367–98.
Campa, Jose and Linda S. Goldberg (1997) “The Evolving External Orientation of Manufacturing: A
Profile of Four Countries,” Economic Policy Review, Volume 3, Number 2, pp. 53–81.
Davis, Donald R. and David E. Weinstein (2003) “Why Country Trade: Insights from Firm-Level
Data,” forthcoming in Journal of the Japanese and International Economies, December
2003.
Falvey, Rodney E. (1981) “Commercial Policy and Intra-Industry Trade,” Journal of International
Economics, 11, pp. 495–511.
Feenstra, Robert C. and Gordon H. Hanson (1996a) “Foreign Investment, Outsourcing, and Relative
Wages,” in Robert C. Feenstra, Gene M. Grossman, and Douglas A. Irwin, eds., The
Political Economy of Trade Policy, pp. 89–127, Cambridge, Mass. and London: The MIT
Press.
Feenstra, Robert C. and Gordon H. Hanson (1996b) “Globalization, Outsourcing, and Wage
Inequality,” American Economic Review, Vol. 86, pp. 240–245.
Feenstra, Robert C. and Gordon H. Hanson (1999) “The Impact of Outsourcing and
High-Technology Capital on Wages: Estimates for the United States, 1979–1990,” The
Quarterly Journal of Economics, Vol. 114, Issue 3, pp. 907–940.
Feenstra, Robert C. and Gordon H. Hanson (2000) “Aggregation Bias in the Factor Content of
Trade: Evidence from U.S. Manufacturing,” AEA Papers and Proceedings, vol. 90, no. 2,
pp. 155–160..
Feenstra, Robert C. and Gordon H. Hanson (2001) “Global Production Sharing and Rising
33
Inequality: A Survey of Trade and Wages,” NBER Working Paper No. 8372, July, National
Bureau of Economic Research.
Fontagné, Lionel, Michael Freudenberg, and Nicholas Péridy (1997) “Trade Patterns Inside the
Single Market,” CEPII Working Paper No. 1997-07, April, Centre D’Etudes Prospectives
et D’Informations Internationales.
Fukao, Kyoji, Tomohiko Inui, Hiroki Kawai, and Tsutomu Miyagawa (2003) "Sectoral Productivity
and Economic Growth in Japan, 1970–98: An Empirical Analysis Based on the JIP
Database," forthcoming in Takatoshi Ito and Andrew Rose, eds., Productivity and Growth,
East Asia Seminar on Economics Volume 13, The University of Chicago Press.
Fukao, Kyoji, Hikari Ishido, and Keiko Ito (2003) “Vertical Intra-Industry Trade and Foreign Direct
Investment in East Asia,” forthcoming in Journal of the Japanese and International
Economies, December 2003.
Genda, Yuji (1997) “Japan: Wage Differentials and Changes since the 1980s,” in Toshiaki
Tachibanali ed. Wage Differentials: An International Comparison, Macmillan Press:
London.
Godo, Yoshihisa (2001) “Estimation of Average Years of Schooling by Levels of Education for Japan
and the United States, 1890–1990,” mimeo, Tokyo: FASID.
Greenaway, David, Robert Hine, and Chris Milner (1995) “Vertical and Horizontal Intra-Industry
Trade: A Cross Industry Analysis for the United Kingdom,” Economic Journal, Vol.105,
November, pp.1505–1518.
Hijzen, Alexander, Holger Görg and Robert C. Hine (2003) “International Fragmentation and
Relative Wages in the UK,” IZA Discussion Paper Series No. 717, February, Bonn:
Institute for the Study of Labor (available at www.iza.org).
Jorgenson, Dale W. and Kazuyuki Motohashi (2003) “Economic Growth of Japan and the United
States in the Information Age,” RIETI Discussion Paper Series 03-E-015, Tokyo:

34
Research Institute of Economy, Trade and Industry.
Jorgenson, Dale W., Mun S. Ho, and Kevin J. Stiroh (2002) “Growth in U.S. Industries and
Investments in Information Technology and Higher Education,” paper prepared for
NBER/CRIW Conference on Measurement of Capital in the New Economy, April 2002.
Katz, Lawrence F., and Ana L. Revenga (1989) “Changes in the Structure of Wages: The United
States vs. Japan,” Journal of the Japanese and International Economies, vol. 3, pp.
522–553.
Kimura, Fukunari (2001) “Fragmentation, Internalization, and Inter-firm Linkages: Evidence from
the Micro Data of Japanese Manufacturing Firms,” in Leonard K. Cheng and Henryk
Kiezkowski, eds., Global Production and Trade in East Asia, Norwell: Kluwer Academic
Publishers.
MITI (Ministry of International Trade and Industry, Government of Japan) (1999) Keizai Hakusho
(White Paper on International Trade), Tokyo: MITI.
Motohashi, Kazuyuki (2002) “IT Investment and Productivity Growth in the Japanese Economy and
a Comparison to the United States” RIETI Discussion Paper Series 02-J-018, Tokyo:
Research Institute of Economy, Trade and Industry (in Japanese).
Pyo, Hak K., and Kwang-Hee Nam (1999) “A Test of the Convergence Hypothesis by Rates of
Return to Capital: Evidence from OECD Countries,” mimeo, Seoul National University.
Sachs, J. D., and H. J. Shatz (1994) “Trade and Jobs in U.S. Manufacturing,” Brookings Papers on
Economic Activity, vol. 19, pp. 1–84.
Sakurai, Kojiro (2000) “Gurobaru-ka to Rodo Shijo: Nihon no Seizogyo no Keisu [Globalization and
Labor Market: The Case of Japanese Manufacturing],” Keizai Keiei Kenkyu [Economics
Today], Vol.21-2, November, Tokyo: Research Institute of Capital Formation,
Development Bank of Japan.

35
Sakurai, Kojiro (2001) “How Does Trade Affect the Labor Market? Evidence from Japanese
Manufacturing,” paper presented at the Semi-annual Conference of the Japan Economic
Association, October 7–8th, 2001, Hitotsubashi University.
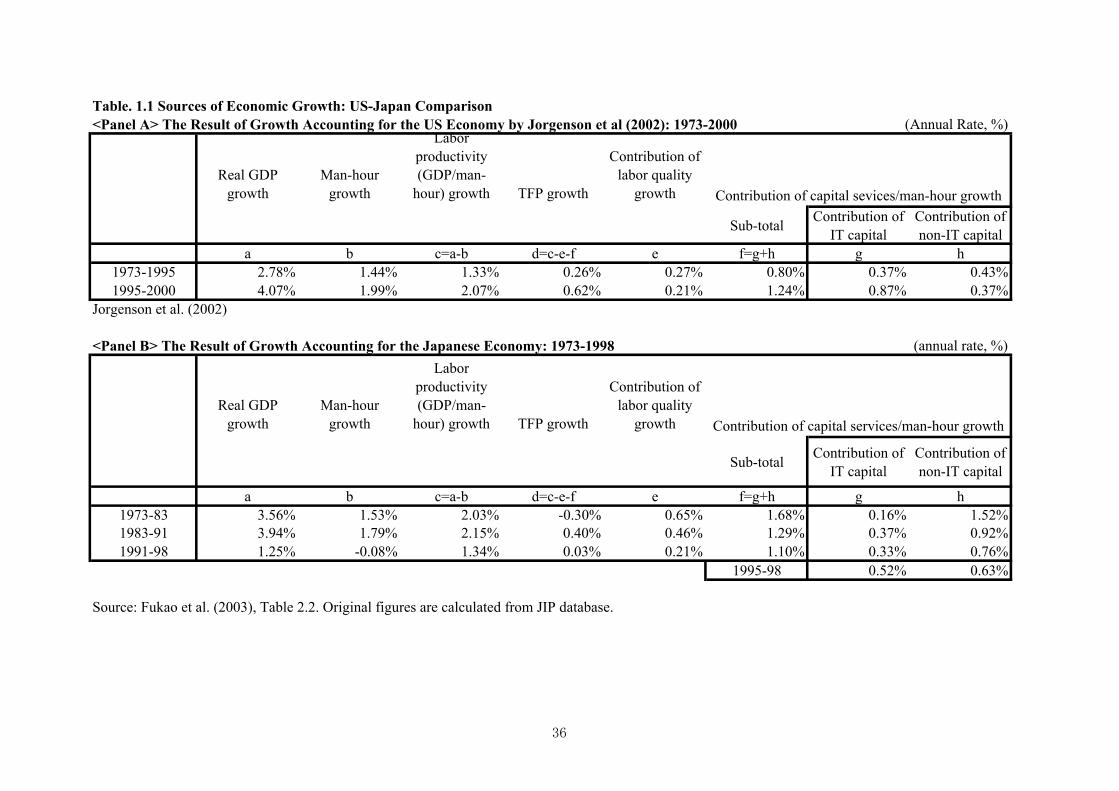
Table. 1.1 Sources of Economic Growth: US-Japan Comparison<Panel A> The Result of Growth Accounting for the US Economy by Jorgenson et al (2002): 1973-2000 (Annual Rate, %)
Real GDP growth
Man-hour growth
Labor productivity (GDP/man-
hour) growth TFP growth
Contribution of labor quality
growth
Sub-total Contribution of IT capital
Contribution of non-IT capital
a b c=a-b d=c-e-f e f=g+h g h1973-1995 2.78% 1.44% 1.33% 0.26% 0.27% 0.80% 0.37% 0.43%1995-2000 4.07% 1.99% 2.07% 0.62% 0.21% 1.24% 0.87% 0.37%
Jorgenson et al. (2002)
<Panel B> The Result of Growth Accounting for the Japanese Economy: 1973-1998 (annual rate, %)
Real GDP growth
Man-hour growth
Labor productivity (GDP/man-
hour) growth TFP growth
Contribution of labor quality
growth
Sub-total Contribution of IT capital
Contribution of non-IT capital
a b c=a-b d=c-e-f e f=g+h g h1973-83 3.56% 1.53% 2.03% -0.30% 0.65% 1.68% 0.16% 1.52%1983-91 3.94% 1.79% 2.15% 0.40% 0.46% 1.29% 0.37% 0.92%1991-98 1.25% -0.08% 1.34% 0.03% 0.21% 1.10% 0.33% 0.76%
1995-98 0.52% 0.63%
Source: Fukao et al. (2003), Table 2.2. Original figures are calculated from JIP database.
Contribution of capital sevices/man-hour growth
Contribution of capital services/man-hour growth
36
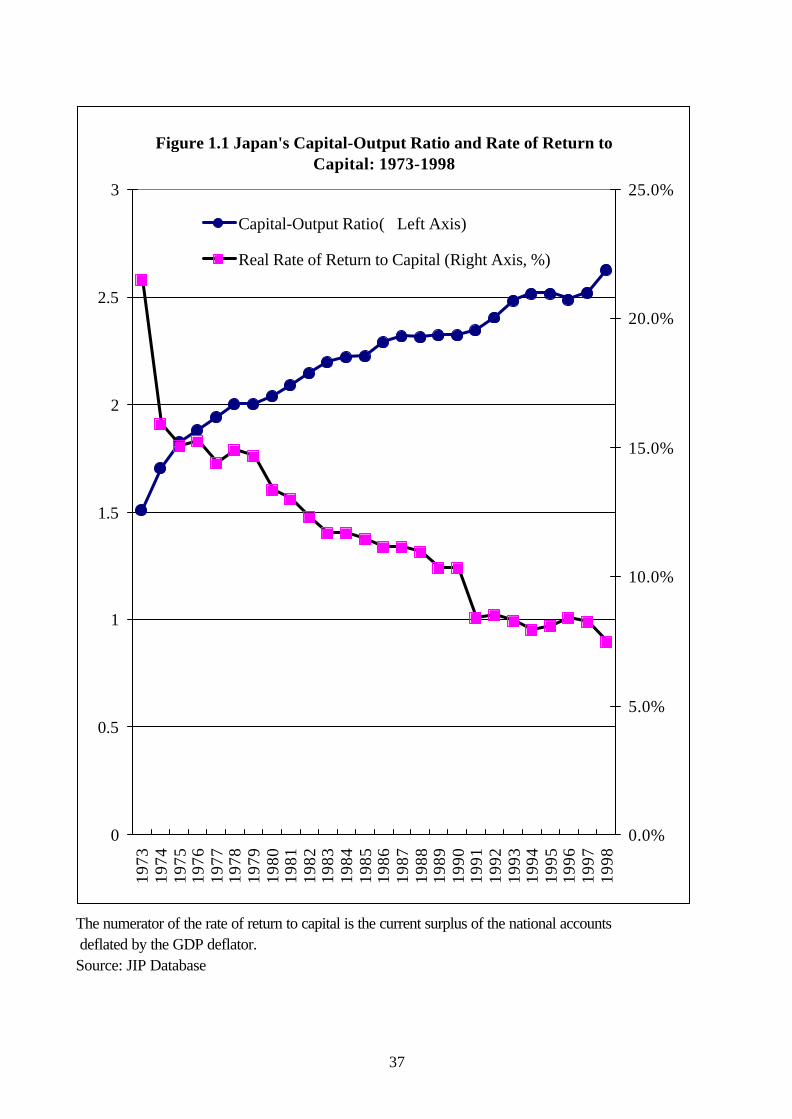
The numerator of the rate of return to capital is the current surplus of the national accounts deflated by the GDP deflator.Source: JIP Database
Figure 1.1 Japan's Capital-Output Ratio and Rate of Return to Capital: 1973-1998
0
0.5
1
1.5
2
2.5
3
1973
1974
1975
1976
1977
1978
1979
1980
1981
1982
1983
1984
1985
1986
1987
1988
1989
1990
1991
1992
1993
1994
1995
1996
1997
1998
0.0%
5.0%
10.0%
15.0%
20.0%
25.0%
Capital-Output Ratio( Left Axis)
Real Rate of Return to Capital (Right Axis, %)
37

Source: Authors' calculation based on JIP Database.
Figure 2.1 Trend of Capital-Labor in Japan
0
2
4
6
8
10
12
14
16
18
1970
1972
1974
1976
1978
1980
1982
1984
1986
1988
1990
1992
1994
1996
1998
2000
Real capital stock / Number of totalworkers in Japan
Real capital stock / Number of totalmanufacturing workers
(mil.yen / person)
38

Source: Authors' calculation based on Population Census data.
Figure 2.2 Share of Skilled and Non-production Workers in Total Workers
0
0.05
0.1
0.15
0.2
0.25
0.3
0.3519
8019
8119
8219
8319
8419
8519
8619
8719
8819
8919
9019
9119
9219
9319
9419
9519
9619
9719
9819
9920
00
Share of non-production workers intotal manufacturing workers
Share of skilled workers in Japan's totalworkers
Share of skilled workers in totalmanufacturing workers
39
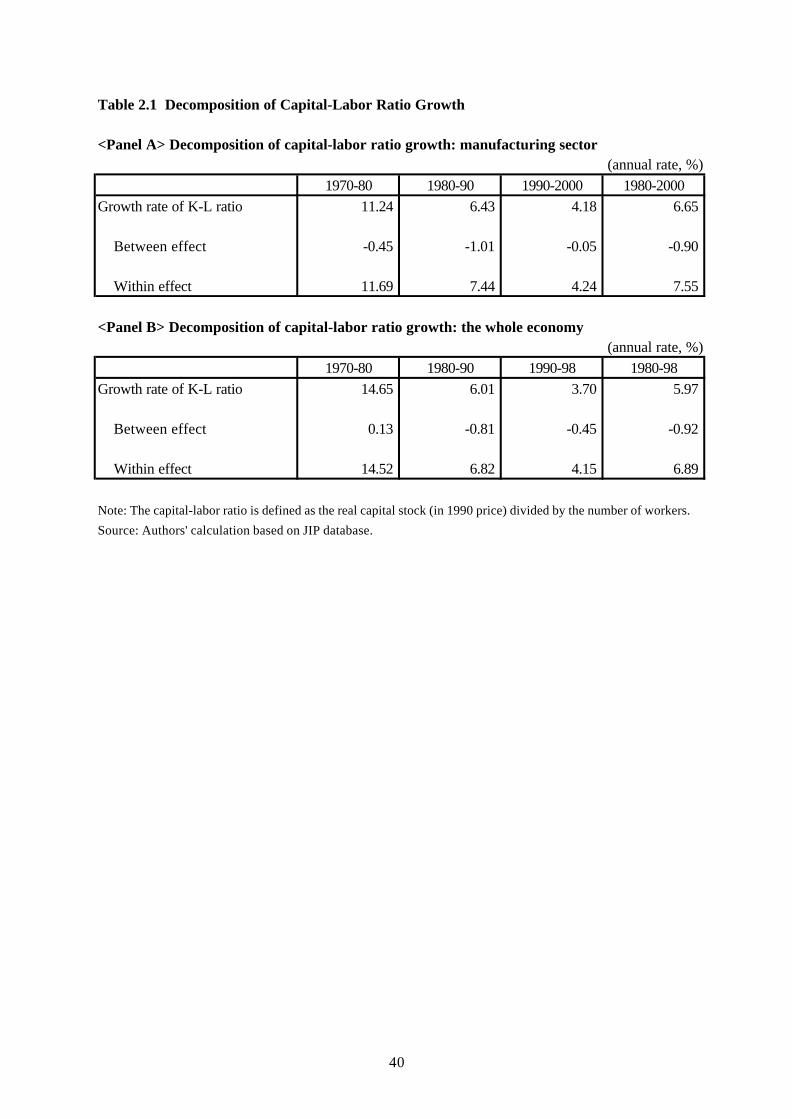
Table 2.1 Decomposition of Capital-Labor Ratio Growth
<Panel A> Decomposition of capital-labor ratio growth: manufacturing sector(annual rate, %)
1970-80 1980-90 1990-2000 1980-2000Growth rate of K-L ratio 11.24 6.43 4.18 6.65
Between effect -0.45 -1.01 -0.05 -0.90
Within effect 11.69 7.44 4.24 7.55
<Panel B> Decomposition of capital-labor ratio growth: the whole economy (annual rate, %)
1970-80 1980-90 1990-98 1980-98Growth rate of K-L ratio 14.65 6.01 3.70 5.97
Between effect 0.13 -0.81 -0.45 -0.92
Within effect 14.52 6.82 4.15 6.89
Note: The capital-labor ratio is defined as the real capital stock (in 1990 price) divided by the number of workers.
Source: Authors' calculation based on JIP database.
40

Table 2.2 Decomposition of the Growth of the Share of Skilled or Non-Production Workers
<Panel A> Decomposition of the growth of the share of non-production workers: manufacturing sector(annual rate, %)
1980-90 1990-2000 1980-2000Growth rate of the share 1.00 0.08 0.55
Between effect 0.12 0.16 0.14
Within effect 0.88 -0.07 0.41
<Panel B> Decomposition of the growth of the share of skilled workers: manufacturing sector(annual rate, %)
1980-90 1990-2000 1980-2000Growth rate of the share 0.65 0.97 0.84
Between effect 0.29 0.25 0.27
Within effect 0.36 0.71 0.57
<Panel C> Decomposition of the growth of the share of skilled workers: the whole economy (annual rate, %)
1980-90 1990-2000 1980-2000Growth rate of the share 2.88 1.03 2.10
Between effect 1.02 1.06 1.02
Within effect 1.86 -0.02 1.08
Source: Authors' calculation based on Population Census data and the JIP database.
41
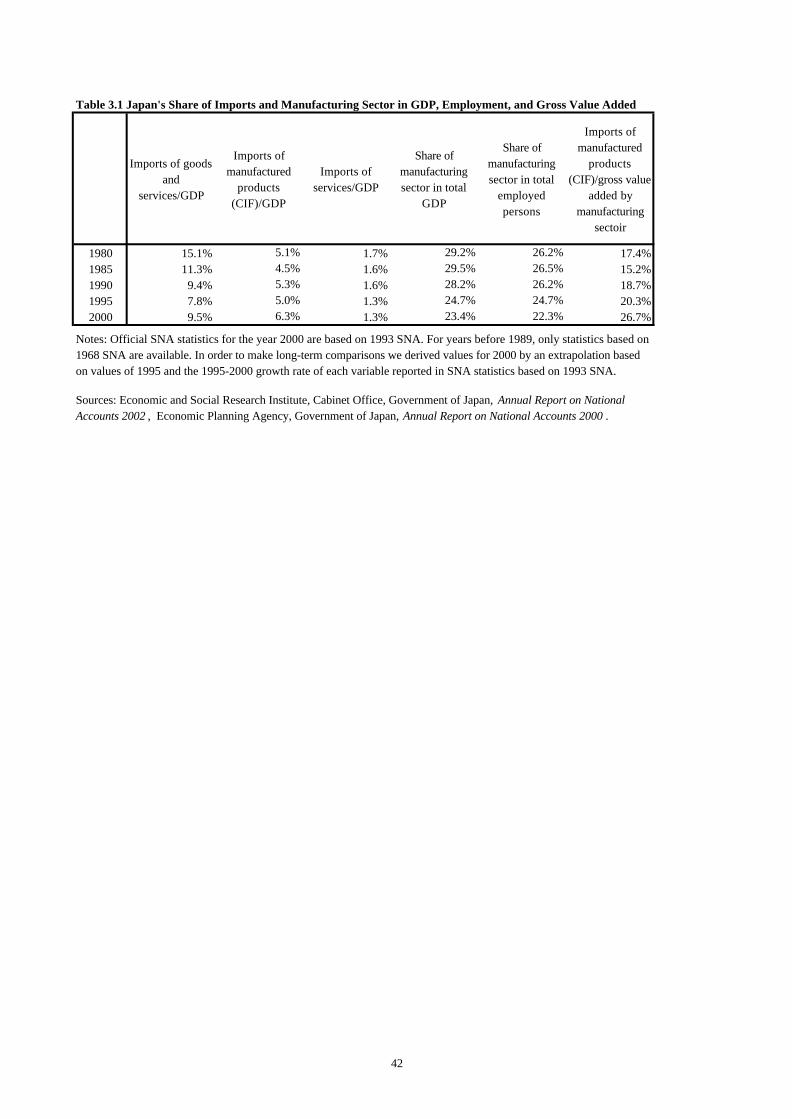
Table 3.1 Japan's Share of Imports and Manufacturing Sector in GDP, Employment, and Gross Value Added
Imports of goods and
services/GDP
Imports of manufactured
products (CIF)/GDP
Imports of services/GDP
Share of manufacturing sector in total
GDP
Share of manufacturing sector in total
employed persons
Imports of manufactured
products (CIF)/gross value
added by manufacturing
sectoir
1980 15.1% 5.1% 1.7% 29.2% 26.2% 17.4%1985 11.3% 4.5% 1.6% 29.5% 26.5% 15.2%1990 9.4% 5.3% 1.6% 28.2% 26.2% 18.7%1995 7.8% 5.0% 1.3% 24.7% 24.7% 20.3%2000 9.5% 6.3% 1.3% 23.4% 22.3% 26.7%
Notes: Official SNA statistics for the year 2000 are based on 1993 SNA. For years before 1989, only statistics based on 1968 SNA are available. In order to make long-term comparisons we derived values for 2000 by an extrapolation based on values of 1995 and the 1995-2000 growth rate of each variable reported in SNA statistics based on 1993 SNA.
Sources: Economic and Social Research Institute, Cabinet Office, Government of Japan, Annual Report on National Accounts 2002 , Economic Planning Agency, Government of Japan, Annual Report on National Accounts 2000 .
42

Sources: Economic and Social Research Institute, Cabinet Office, Government of Japan, Annual Report on National Accounts 2002 , Economic Planning Agency, Government of Japan, Annual Report on National Accounts 2000 .
Figure 3.1.A Commodity Composition of Japan's Exports: 1980-2000
0%
10%
20%
30%
40%
50%
60%
70%
80%
90%
100%19
80
1982
1984
1986
1988
1990
1992
1994
1996
1998
2000
Other manufactured products
Precision machinery
Transportation equipment
Electrical machinery
General machinery
Metal products
Metal
Pottery
Petroleum and coal products
Chemical products
Pulp
Textiles
Food
Minerals
Agricultural products
43

Sources: Economic and Social Research Institute, Cabinet Office, Government of Japan, Annual Report on National Accounts 2002 , Economic Planning Agency, Government of Japan, Annual Report on National Accounts 2000 .
Figure 3.1.B Commodity Composition of Japan's Imports: 1980-2000
0%
10%
20%
30%
40%
50%
60%
70%
80%
90%
100%19
80
1982
1984
1986
1988
1990
1992
1994
1996
1998
2000
Other manufactured products
Precision machinery
Transportation equipment
Electrical machinery
General machinery
Metal products
Metal
Pottery
Petroleum and coal products
Chemical products
Pulp
Textiles
Food
Minerals
Agricultural products
44

Source: Ministry of Finance, Trade Statistics
Figure 3.2 Share of Nine East Asian Economies in Japan's Trade in Manufacturing Products: 1980-2000, by Commodity
Figure 3.2.B Share of Nine East Asian Economies in Japan's Imports
0102030405060708090
Food
Textile
sPulp
Chemica
l prod
ucts
Petrole
um an
d coa
l prod
ucts
Pottery
Iron a
nd Stee
l
Non-fe
rrous
metal
Metal P
roduc
ts
Genera
l mach
inery
Electric
al mach
inery
Transpo
rtatio
n equ
ipmen
t
Precisi
on m
achine
ry
Other m
anufa
ctured
prod
ucts
198019902000
Figure 3.2.A Share of Nine East Asian Economies in Japan's Exports
01020304050607080
Food
Textile
sPulp
Chemica
l prod
ucts
Petrole
um an
d coa
l prod
ucts
Pottery
Iron a
nd Stee
l
Non-fe
rrous
metal
Metal P
roduc
ts
Genera
l mach
inery
Electric
al mach
inery
Transpo
rtatio
n equ
ipmen
t
Precisi
on m
achine
ry
Other m
anufa
ctured
prod
ucts
198019902000
45

Source: Ministry of Finance, Trade Statistics
Figure 3.3 Japan's Major Trade Partners: Manufacturing Products, 1980-2000
(A) Share of Major Trade Partners in Japan's Exports of Manufactured Products
0%10%20%30%40%50%60%70%80%90%
100%
1980 1985 1990 1995 2000
Other EconomiesEUNAFTAASEAN 4NIEs 3China and Hong Kong
(B) Share of Major Trade Partners in Japan's Imports of Manufactured Products
0%10%20%30%40%50%60%70%80%90%
100%
1980 1985 1990 1995 2000
Other EconomiesEUNAFTAASEAN 4NIEs 3China and Hong Kong
46
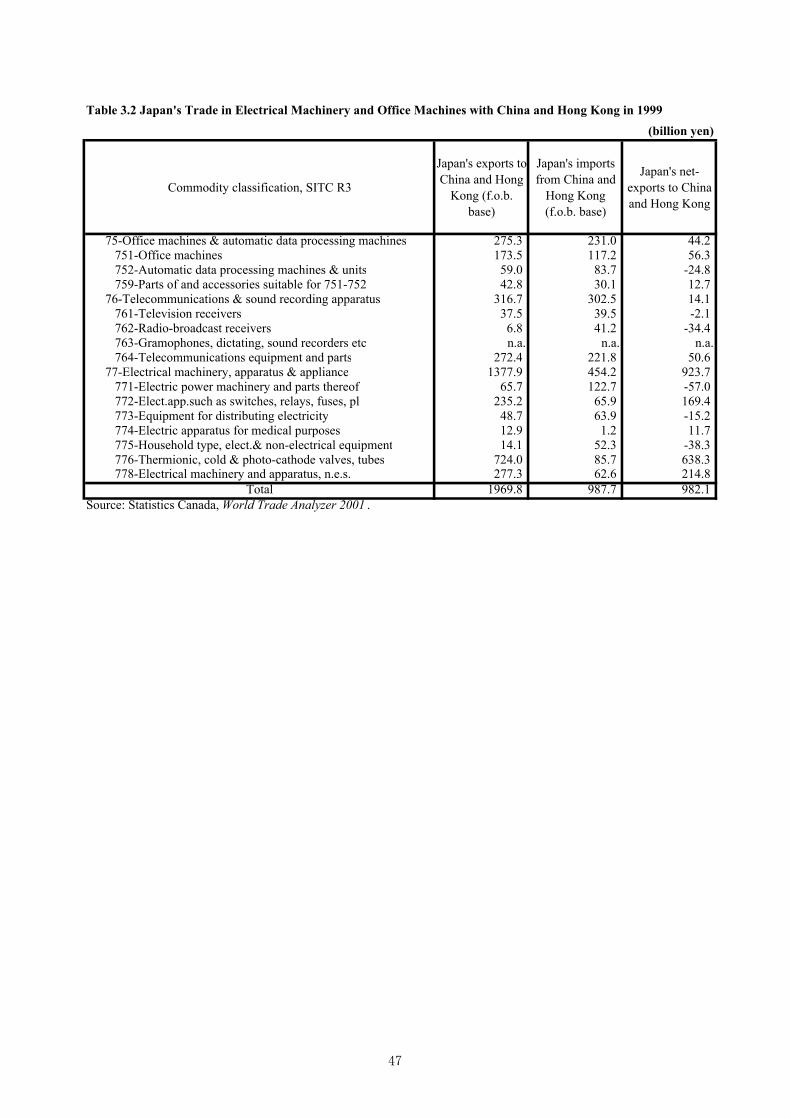
(billion yen)
Commodity classification, SITC R3
Japan's exports to China and Hong
Kong (f.o.b. base)
Japan's imports from China and
Hong Kong (f.o.b. base)
Japan's net-exports to China and Hong Kong
75-Office machines & automatic data processing machines 275.3 231.0 44.2 751-Office machines 173.5 117.2 56.3 752-Automatic data processing machines & units 59.0 83.7 -24.8 759-Parts of and accessories suitable for 751-752 42.8 30.1 12.7 76-Telecommunications & sound recording apparatus 316.7 302.5 14.1 761-Television receivers 37.5 39.5 -2.1 762-Radio-broadcast receivers 6.8 41.2 -34.4 763-Gramophones, dictating, sound recorders etc n.a. n.a. n.a. 764-Telecommunications equipment and parts 272.4 221.8 50.6 77-Electrical machinery, apparatus & appliance 1377.9 454.2 923.7 771-Electric power machinery and parts thereof 65.7 122.7 -57.0 772-Elect.app.such as switches, relays, fuses, pl 235.2 65.9 169.4 773-Equipment for distributing electricity 48.7 63.9 -15.2 774-Electric apparatus for medical purposes 12.9 1.2 11.7 775-Household type, elect.& non-electrical equipment 14.1 52.3 -38.3 776-Thermionic, cold & photo-cathode valves, tubes 724.0 85.7 638.3 778-Electrical machinery and apparatus, n.e.s. 277.3 62.6 214.8
Total 1969.8 987.7 982.1Source: Statistics Canada, World Trade Analyzer 2001 .
Table 3.2 Japan's Trade in Electrical Machinery and Office Machines with China and Hong Kong in 1999
47

Table 3.3 Factor Contents (Direct plus Indirect) of Trade for Japan's Manufacturing Sector: 1980-2000, by Region
Production labor1980 1990 2000 1980 1990 2000 1980 1990 2000
World total 923,474 1,388,633 1,941,421 306,751 761,507 1,578,368 616,723 627,125 363,053China and Hong Kong 73,317 97,278 242,423 22,976 87,209 513,402 50,341 10,070 -270,979NIEs 3 99,132 198,831 353,213 54,302 138,387 218,617 44,830 60,444 134,596ASEAN 4 61,937 103,502 189,007 10,060 51,945 177,053 51,877 51,557 11,953US 223,380 440,972 583,364 90,578 178,069 273,127 132,801 262,903 310,237EU 133,426 286,382 324,457 61,872 174,314 208,738 71,554 112,068 115,719Other economies 332,281 261,667 248,957 66,963 131,583 187,430 265,318 130,084 61,527
Non-production labor1980 1990 2000 1980 1990 2000 1980 1990 2000
World total 408,313 675,630 985,796 118,829 291,902 607,572 289,484 383,728 378,224China and Hong Kong 31,756 44,161 119,781 5,861 21,364 127,705 25,895 22,797 -7,924NIEs 3 46,089 100,185 186,061 15,805 44,569 106,804 30,285 55,617 79,257ASEAN 4 28,616 50,583 96,495 3,679 16,693 79,591 24,937 33,890 16,904US 96,813 215,813 294,537 87,408 136,926 54,537 128,405 157,610EU 60,203 141,939 169,484 26,359 70,748 90,007 33,844 71,191 79,477Other economies 144,836 122,948 119,439 24,850 51,119 66,540 119,986 71,829 52,900
1980 1990 2000 1980 1990 2000 1980 1990 2000World total 2,367,285 3,154,935 4,251,546 782,374 1,777,449 2,895,281 1,584,911 1,377,486 1,356,265
China and Hong Kong 202,601 223,700 557,028 39,703 128,046 621,391 162,899 95,654 -64,362NIEs 3 282,507 502,354 807,407 107,479 275,660 437,886 175,028 226,694 369,521ASEAN 4 183,807 271,144 428,155 34,754 124,603 337,695 149,052 146,541 90,460US 522,355 931,945 1,195,965 228,689 418,488 565,778 293,666 513,457 630,186EU 297,871 591,223 655,089 149,588 397,799 457,527 148,284 193,424 197,562Other economies 878,144 634,570 607,902 222,161 432,854 475,004 655,982 201,716 132,898
1980 1990 2000 1980 1990 2000 1980 1990 2000World total 11,087,602 15,378,504 21,701,611 3,068,328 7,169,480 12,586,585 8,019,274 8,209,024 9,115,026
China and Hong Kong 944,937 1,111,021 2,901,756 145,135 469,155 2,313,326 799,802 641,866 588,430NIEs 3 1,327,911 2,442,986 4,195,098 403,842 1,113,916 2,263,765 924,069 1,329,070 1,931,333ASEAN 4 878,622 1,312,625 2,286,969 114,037 401,754 1,552,102 764,585 910,871 734,867US 2,479,216 4,629,732 6,052,100 975,571 1,879,475 2,710,964 1,503,645 2,750,257 3,341,137EU 1,372,409 2,903,521 3,353,937 629,500 1,691,120 2,012,755 742,909 1,212,401 1,341,182Other economies 4,084,507 2,978,619 2,911,750 800,244 1,614,061 1,733,673 3,284,263 1,364,559 1,178,077
Gross exports Gross imports Net exports
Gross exports Gross imports Net exports
Gross exports Gross imports Net exports
Capital stock (million yen, in 1990 prices)
Gross exports Gross imports Net exports
Land (million yen, in 1990 prices)
48

Production labor
World total 10,403 (0.1%) -264,073 (-3.4%) -253,670 (-3.3%)China and Hong Kong -40,272 (-0.5%) -281,049 (-3.6%) -321,321 (-4.2%)NIEs 3 15,614 (0.2%) 74,152 (1.0%) 89,766 (1.2%)ASEAN 4 -320 (-0.0%) -39,603 (-0.5%) -39,924 (-0.5%)US 130,101 (1.7%) 47,335 (0.6%) 177,436 (2.3%)EU 40,513 (0.5%) 3,651 (0.0%) 44,164 (0.6%)Other economies -135,234 (-1.8%) -68,557 (-0.9%) -203,792 (-2.6%)
Non-production labor
World total 94,244 (2.7%) -5,505 (-0.2%) 88,739 (2.6%)China and Hong Kong -3,098 (-0.1%) -30,721 (-0.9%) -33,819 (-1.0%)NIEs 3 25,332 (0.7%) 23,641 (0.7%) 48,973 (1.4%)ASEAN 4 8,953 (0.3%) -16,986 (-0.5%) -8,033 (-0.2%)US 73,868 (2.1%) 29,205 (0.8%) 103,073 (3.0%)EU 37,347 (1.1%) 8,286 (0.2%) 45,632 (1.3%)Other economies -48,157 (-1.4%) -18,929 (-0.5%) -67,087 (-1.9%)
Land (million yen, in 1990 prices)
World total -207,425 (-1.6%) -21,221 (-0.2%) -228,646 (-1.8%)China and Hong Kong -67,244 (-0.5%) -160,017 (-1.2%) -227,261 (-1.8%)NIEs 3 51,666 (0.4%) 142,826 (1.1%) 194,492 (1.5%)ASEAN 4 -2,512 (-0.0%) -56,080 (-0.4%) -58,592 (-0.5%)US 219,791 (1.7%) 116,729 (0.9%) 336,521 (2.6%)EU 45,140 (0.3%) 4,138 (0.0%) 49,278 (0.4%)Other economies -454,267 (-3.5%) -68,818 (-0.5%) -523,085 (-4.1%)
Capital stock (million yen, in 1990 prices)
World total 189,751 (0.3%) 906,001 (1.6%) 1,095,752 (2.0%)China and Hong Kong -157,936 (-0.3%) -53,436 (-0.1%) -211,372 (-0.4%)NIEs 3 405,001 (0.7%) 602,262 (1.1%) 1,007,263 (1.8%)ASEAN 4 146,286 (0.3%) -176,004 (-0.3%) -29,718 (-0.1%)US 1,246,611 (2.2%) 590,880 (1.1%) 1,837,492 (3.3%)EU 469,492 (0.8%) 128,781 (0.2%) 598,273 (1.1%)Other economies -1,919,705 (-3.5%) -186,482 (-0.3%) -2,106,186 (-3.8%)
Net exports1980-90
1980-90 1990-2000
1980-90 1990-2000
1990-2000 1980-2000
Table 3.4 Changes in Factor Contents (Direct plus Indirect) of Net Exports for Japan's Manufacturing Sector: 1980-2000, by Region
Notes: Data in parentheses denote the ratio of factor contents to total input in Japan's manufacturing sector in 1990. The data on total input are taken from the Ministry of International Trade and Industry, Census of Manufactures 1990 .
Net exports
Net exports1980-90 1990-2000 1980-2000
Net exports
1980-2000
1980-2000
49

Table 3.5 Physical and Human Capital Deepening in the Japanese Manufacturing Sector
(annual rate, %)1970-80 1980-90 1990-2000 1980-2000
Growth rate of capital-labor ratioManufacturing sector total 11.24 6.43 5.51* 7.60**
Changes in factor contents of trade n.a. -0.06 0.41 0.18
Growth rate of the share of non-production workersManufacturing sector total n.a. 1.00 0.08 0.55Changes in factor contents of trade n.a. 0.18 0.23 0.21
*The growth rate of the capital-labor ratio denotes the average annual growth rate from 1990 to 1998.**The growth rate of the capital-labor ratio denotes the average annual growth rate from 1980 to 1998.Source: Authors' calculation based on the results of Tables 2.1, 2.2, and 3.4.
50

Source: Authors' calculation.
Figure 4.1 Vertical Intra-Industry Trade Share and Outsourcing Share by Industry: 2000
0
5
10
15
20
25
30
35
40
45
50
Livesto
ck pro
ducts
Proces
sed m
arine p
roduct
s
Rice po
lishing
, flour m
illing
Other fo
ods
Beverag
es
Tobac
co Silk
Spinni
ng
Fabrics
and o
ther te
xtile p
roduct
s
Apparel
and ac
cessor
ies
Lumber
and w
ood pro
ducts
Furnitu
re
Pulp,
paper,
paper p
roduct
s
Publish
ing an
d print
ing
Leathe
r and le
ather p
roduct
s
Rubber p
roduct
s
Basic ch
emica
ls
Chemical
fibers
Other ch
emica
ls
Petrole
um pro
ducts
Coal pr
oducts
Stone,
clay &
glass p
roduct
s
Steel m
anufac
turing
Other st
eel
Non-ferr
ous m
etals
Metal pro
ducts
General
machine
ry equi
pment
Electri
cal mach
inery
Equip
ment an
d supp
lies for
house
hold u
se
Other el
ectrica
l mach
inery
Motor ve
hicles Shi
ps
Other tr
anspor
tation
equipm
ent
Precisi
on mach
inery &
equip
ment
Other m
anufac
turing
Manufac
turing
total
VIIT Share
Broad Outsourcing
Narrow Outsourcing
(%)
51

Growth rate of VIIT share: ? ln (VIIT/Total trade)
Growth rate of broad outsourcing share: ? ln (Broad outsourcing/Total intermediate inputs)
Growth rate of narrow outsourcing share: ? ln (Narrow outsourcing/Total intermediate inputs)
Figure 4.2 Annual Growth Rate of Vertical Intra-Industry Trade Share and Outsourcing Share by Industry: 1988-2000
-20 -15 -10 -5 0 5 10 15 20
Livestock products
Rice polishing, flour milling
Beverages
Silk
Fabrics and other textile products
Lumber and wood products
Pulp, paper, paper products
Leather and leather products
Basic chemicals
Other chemicals
Coal products
Steel manufacturing
Non-ferrous metals
General machinery equipment
Equipment and supplies for household use
Motor vehicles
Other transportation equipment
Other manufacturing
VIIT ShareBroad OutsourcingNarrow Outsourcing
(%)
(-32.7)
52

Table 4.1 Correlation Coefficient Matrix
(a) 1
(b) 0.435 *** 1
(c) 0.471 *** 0.592 *** 1
(d) -0.059 0.262 -0.050 1
(e) -0.017 0.292 * 0.210 -0.147 1
(f) 0.146 0.299 * 0.203 0.009 0.554 *** 1
Note: Each variable denotes the average annual growth rate for the period from 1988 to 2000. * significant at 10% level, *** significant at 1% level.Source: Authors' calculation.
Broad Outsourcing
Narrow Outsourcing
(e) (f)
Capital-Labor Ratio
Skilled Worker Share
(a) (b) (c) (d)
Non-production Worker Share
VIIT Share
53

Table 4.2 GLS Estimation Results
Dependent variable: Skilled workers' share in total number of workers (SKILLED) Non-production workers' share in total number of workers (NONPROD) Capital-labor ratio (KL)
ln (IThard/VA) 1.4988 *** 1.3981 *** 1.7536 *** 2.0452 ***(7.30) (7.07) (5.49) (6.32)
ln (ITsoft/VA) 0.0364 0.0348 -0.0509 -0.0401(0.43) (0.45) (-0.46) (-0.33)
ln (NonIT/VA) -0.7162 ** -0.5542 ** -0.5864 -0.9365 **(-2.58) (-2.02) (-1.26) (-2.02)
ln VA 1.0596 *** 1.0844 *** 1.4477 *** 1.4978 ***(7.20) (6.92) (5.17) (6.04)
RDexp/VA 3.0787 ** 2.4287 * 3.8564 * 5.5175 **(2.18) (1.85) (1.79) (2.38)
ln (wage/rental price)
VIITworld/Shipment 0.1521 *** 0.0351(3.68) (0.84)
VIITasia9/Shipment 0.2241 *** 0.0370(3.10) (0.24)
VIITnon-asia/Shipment 0.0009 * 0.0005(1.78) (0.92)
outsourcing (narrow) 0.0061 0.0033 0.0075 0.0099(0.73) (0.44) (0.68) (0.83)
outsourcing (difference) -0.0320 -0.0189 -0.0315 -0.0718(-1.14) (-0.72) (-0.70) (-1.45)
_cons -1.6644 -2.4111 14.4863 *** 14.8355 ***(-0.67) (-0.94) (3.22) (3.61)
N 439 439 439 439Wald 325.60 *** 271.41 *** 187.69 *** 221.39 ***
2) The numbers in parentheses are z-statistics.
*significant at 10% level, ** significant at 5% level, ***significant at 1% level (two-tailed test).Source: Authors' calculations.
SKILLEDSKILLED NONPROD NONPROD
3) All equations include year dummies which are suppressed here. The estimation period for equations (1) to (4) is 1988-2000, and the estimation period for equation (5) is 1988-1998.
(1) (2) (3) (4)
Note: 1) Presence of AR(1) autocorrelation within panels and heteroskedasticity across panels is assumed.
54

Appendix Table 1. Occupational Classification in the Population Census
Major Groups1 Professional and Technical Occupations2 Managers and Administrators3 Clerical and Secretarial Occupations4 Sales Occupations5 Services Occupations6 Protective Service Occupations7 Occupations in Agriculture, Forestry and Fishing8 Occupations in Transportation and Telecommunication9
10 Other Occupations
Skilled workers: Groups 1 and 2Production workers: Group 9
Plant and Machine Occupations, Craft and Related Occupations, and Occupations in Mining and Construction
55
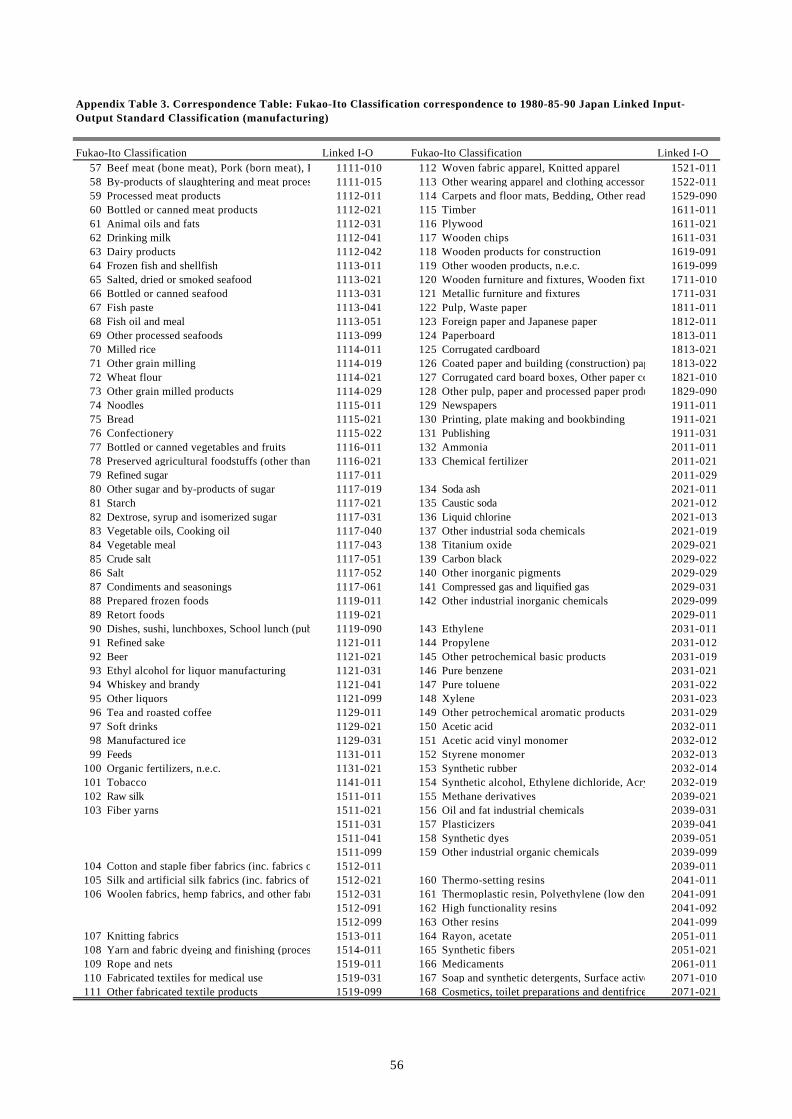
Fukao-Ito Classification Linked I-O Fukao-Ito Classification Linked I-O57 Beef meat (bone meat), Pork (born meat), Poultry meat, other meat (bone meat)1111-010 112 Woven fabric apparel, Knitted apparel 1521-01158 By-products of slaughtering and meat processing 1111-015 113 Other wearing apparel and clothing accessories 1522-01159 Processed meat products 1112-011 114 Carpets and floor mats, Bedding, Other ready-made textile products1529-09060 Bottled or canned meat products 1112-021 115 Timber 1611-01161 Animal oils and fats 1112-031 116 Plywood 1611-02162 Drinking milk 1112-041 117 Wooden chips 1611-03163 Dairy products 1112-042 118 Wooden products for construction 1619-09164 Frozen fish and shellfish 1113-011 119 Other wooden products, n.e.c. 1619-09965 Salted, dried or smoked seafood 1113-021 120 Wooden furniture and fixtures, Wooden fixtures 1711-01066 Bottled or canned seafood 1113-031 121 Metallic furniture and fixtures 1711-03167 Fish paste 1113-041 122 Pulp, Waste paper 1811-01168 Fish oil and meal 1113-051 123 Foreign paper and Japanese paper 1812-01169 Other processed seafoods 1113-099 124 Paperboard 1813-01170 Milled rice 1114-011 125 Corrugated cardboard 1813-02171 Other grain milling 1114-019 126 Coated paper and building (construction) paper 1813-02272 Wheat flour 1114-021 127 Corrugated card board boxes, Other paper containers, Paper textile for medical use1821-01073 Other grain milled products 1114-029 128 Other pulp, paper and processed paper products 1829-09074 Noodles 1115-011 129 Newspapers 1911-01175 Bread 1115-021 130 Printing, plate making and bookbinding 1911-02176 Confectionery 1115-022 131 Publishing 1911-03177 Bottled or canned vegetables and fruits 1116-011 132 Ammonia 2011-01178 Preserved agricultural foodstuffs (other than bottled or canned)1116-021 133 Chemical fertilizer 2011-02179 Refined sugar 1117-011 2011-02980 Other sugar and by-products of sugar 1117-019 134 Soda ash 2021-01181 Starch 1117-021 135 Caustic soda 2021-01282 Dextrose, syrup and isomerized sugar 1117-031 136 Liquid chlorine 2021-01383 Vegetable oils, Cooking oil 1117-040 137 Other industrial soda chemicals 2021-01984 Vegetable meal 1117-043 138 Titanium oxide 2029-02185 Crude salt 1117-051 139 Carbon black 2029-02286 Salt 1117-052 140 Other inorganic pigments 2029-02987 Condiments and seasonings 1117-061 141 Compressed gas and liquified gas 2029-03188 Prepared frozen foods 1119-011 142 Other industrial inorganic chemicals 2029-09989 Retort foods 1119-021 2029-01190 Dishes, sushi, lunchboxes, School lunch (public), School lunch (private), Other foods 1119-090 143 Ethylene 2031-01191 Refined sake 1121-011 144 Propylene 2031-01292 Beer 1121-021 145 Other petrochemical basic products 2031-01993 Ethyl alcohol for liquor manufacturing 1121-031 146 Pure benzene 2031-02194 Whiskey and brandy 1121-041 147 Pure toluene 2031-02295 Other liquors 1121-099 148 Xylene 2031-02396 Tea and roasted coffee 1129-011 149 Other petrochemical aromatic products 2031-02997 Soft drinks 1129-021 150 Acetic acid 2032-01198 Manufactured ice 1129-031 151 Acetic acid vinyl monomer 2032-01299 Feeds 1131-011 152 Styrene monomer 2032-013
100 Organic fertilizers, n.e.c. 1131-021 153 Synthetic rubber 2032-014101 Tobacco 1141-011 154 Synthetic alcohol, Ethylene dichloride, Acrylonitrile, Ethylene glycol, Other aliphatic intermediates, Synthetic phenol, Terephthalic acid (high purity), Capro Lactam, Other cyclic intermediates2032-019102 Raw silk 1511-011 155 Methane derivatives 2039-021103 Fiber yarns 1511-021 156 Oil and fat industrial chemicals 2039-031
1511-031 157 Plasticizers 2039-0411511-041 158 Synthetic dyes 2039-0511511-099 159 Other industrial organic chemicals 2039-099
104 Cotton and staple fiber fabrics (inc. fabrics of synthetic spun fibers)1512-011 2039-011105 Silk and artificial silk fabrics (inc. fabrics of synthetic filament fibers)1512-021 160 Thermo-setting resins 2041-011106 Woolen fabrics, hemp fabrics, and other fabrics 1512-031 161 Thermoplastic resin, Polyethylene (low density), Polyethylene (high density), Polystyrene, Vinyl chloride resins2041-091
1512-091 162 High functionality resins 2041-0921512-099 163 Other resins 2041-099
107 Knitting fabrics 1513-011 164 Rayon, acetate 2051-011108 Yarn and fabric dyeing and finishing (processing on commission only)1514-011 165 Synthetic fibers 2051-021109 Rope and nets 1519-011 166 Medicaments 2061-011110 Fabricated textiles for medical use 1519-031 167 Soap and synthetic detergents, Surface active 2071-010111 Other fabricated textile products 1519-099 168 Cosmetics, toilet preparations and dentifrices 2071-021
Appendix Table 3. Correspondence Table: Fukao-Ito Classification correspondence to 1980-85-90 Japan Linked Input-Output Standard Classification (manufacturing)
56

(continued)169 Paints and varnishes 2072-011 228 Electric wires and cables, Optical fiber cables 2721-010170 Printing ink 2072-021 2721-012171 Photographic sensitive materials 2073-011 229 Rolled and drawn copper and copper alloys 2722-011172 Agricultural chemicals 2074-011 230 Rolled and drawn aluminum 2722-021173 Gelatin and adhesives, Other final chemical products, Catalyzer, Petroleum refinery products (inc. greases)2079-011 231 Non-ferrous metal castings and forgings 2722-031
2079-090 232 Nuclear fuels 2722-041174 Gasoline 2111-011 233 Other non-ferrous metal products 2722-099175 Jet fuel oils 2111-012 234 Metal Products for Construction 2811-011176 Kerosene 2111-013 235 Metal Products for Architecture 2812-011177 Light oils 2111-014 236 Other metal Products, n.e.c. 2899-090178 Heavy oil A 2111-015 237 Boilers, Turbines, Engines 3011-010179 Heavy oils B and C 2111-016 238 Conveyors 3012-011180 Naphtha 2111-017 239 Refrigerators and Air Conditioning Apparatus 3013-011181 LPG (Liquified Petroleum gas) 2111-018 240 Pumps and Compressors 3019-011182 Other petroleum refinery products 2111-019 241 Other General industrial machinery and equipment, Industrial Robots3019-090183 Coke 2121-011 242 Mining, Civil engineering and Construction Machinery3021-011184 Other coal products 2121-019 243 Chemical machinery 3022-011185 Paving materials 2121-021 244 Metal Machine Tools 3024-011186 Plastic films and sheets, Plastic plates, pipe and bars, Foamed plastic products, Industrial plastic products, Reinforced plastic products, Plastic containers, Plastic table ware, Kitchen ware and other household articles, other plastic products2211-010 245 Metal Processing Machinery 3024-021187 Tires and inner tubes 2311-011 246 Agricultural machinery 3029-011188 Other rubber products 2311-019 247 Textile Machinery 3029-021189 Rubber footwear 2319-011 248 Food Processing Machinery 3029-031190 Plastic footwear 2319-021 249 Sawmill, Wood Working, Veneer and Plywood 3029-091191 Leather footwear 2411-011 250 Pulp, Equipment and Paper Machinery 3029-092192 Leather and fur skins 2412-011 251 Printing, Bookbinding and Paper Processing 3029-093193 Miscellaneous leather products 2412-021 252 Casting Equipment 3029-094194 Sheet glass, Safety glass and multilayered glass, Glass Fiber and Glass Fiber products, n.e.c.2511-010 253 Plastic Processing Machinery 3029-095195 Glass processing materials, Other glass products 2519-090 254 Semiconductor Making Equipment, Other Special Industrial Machinery, n.e.c.3029-099196 Cement 2521-011 255 Machinists' precision tools, Metal molds, Bearing, Other general Machines and Parts3019-021197 Ready mixed concrete 2522-011 3031-090198 Cement products 2523-011 256 Copy Machine, Electronic Calculator, Word Processing Machine, Other Office Machine, n.e.c.3111-010199 Pottery, china and earthenware for construction 2531-011 257 Vending Machines 3112-011200 Pottery, china and earthenware for industry 2531-012 258 Amusement Machinery 3112-012201 Pottery, china and earthenware for home use 2531-013 259 Other Machinery for Service Industry 3112-019202 Clay refactories 2599-011 260 Electric Audio Equipment, Magnetic Tapes and Discs3211-010203 Other structural clay products 2599-021 261 Radio and Television sets 3211-021204 Carbon and graphite products 2599-031 262 Household Electric Appliance 3211-099205 Abrasive 2599-041 263 Electric Computing Equipment (Main Parts, Accessory Equipment)3311-010206 Miscellaneous ceramic, stone and clay products 2599-091 264 Wired Communication Equipment, Radio Communication Equipment, Other Communication3321-010
2599-099 265 Video Recording and Playback Equipment 3331-010207 Pig iron 2611-011 266 Electric Measuring Instruments 3332-011208 Ferroalloys 2611-021 267 Semiconductor Devices, Integrated Circuits 3341-010209 Crude steel (converters), Crude steel (electric furnaces)2611-030 268 Electron Tubes 3359-011210 Scrap iron 2612-011 269 Generators 3411-011211 Steel, Steel strip (ordinary steel), Steel bar (ordinary steel, Other hot rolled steel (ordinary steel)2621-010 270 Electric Motors 3411-012212 Hot rolled steel (special steel) 2621-016 271 Relay Switches and Switchboards, Transformers and reactors, Other Industrial Heavy Electrical3411-020213 Steel pipes and tubes (ordinary steel) 2622-011 272 Electric Lighting Fixtures and Apparatus 3421-011214 Steel pipes and tubes (special steel) 2622-012 273 Electric Bulbs 3421-031215 Cold-finished steel 2623-011 274 Batteries, Wiring Devices and Supplies, Electrical Equipment for Internal Combustion Engines, Other Electrical Devices and Parts3421-090216 Coasted steel 2623-012 275 Passenger Motor Cars 3511-011217 Forged steel 2631-011 276 Trucks, Buses and Other Cars, Motor Vehicle Parts and Accessories3511-019218 Cast steel 2631-012 277 Two-wheel Motor Vehicles 3531-011219 Case iron pipes and tubes 2631-021 278 Internal Combustion Engines for Motor Vehicles and Parts3541-021220 Case materials (iron) 2631-031 279 Steel Ships 3611-011221 Forged materials (iron) 2631-032 280 Ships Except Steel Ships 3611-021222 Iron and steel shearing and slitting, other iron or steel products2649-090 281 Internal Combustion Engines for Vessels 3611-031223 Copper 2711-011 282 Repair of Ships 3611-101224 Lead and Zinc (inc. regenerated lead) 2711-021 283 Rolling Stock 3621-011
2711-031 284 Repair of Rolling Stock 3621-101225 Aluminum (inc. regenerated lead) 2711-041 285 Aircrafts 3622-011226 Other non-ferrous metals 2711-099 286 Repair of Aircrafts 3622-101227 Non-ferrous metal scrap 2712-011 287 Bicycles 3629-011
57
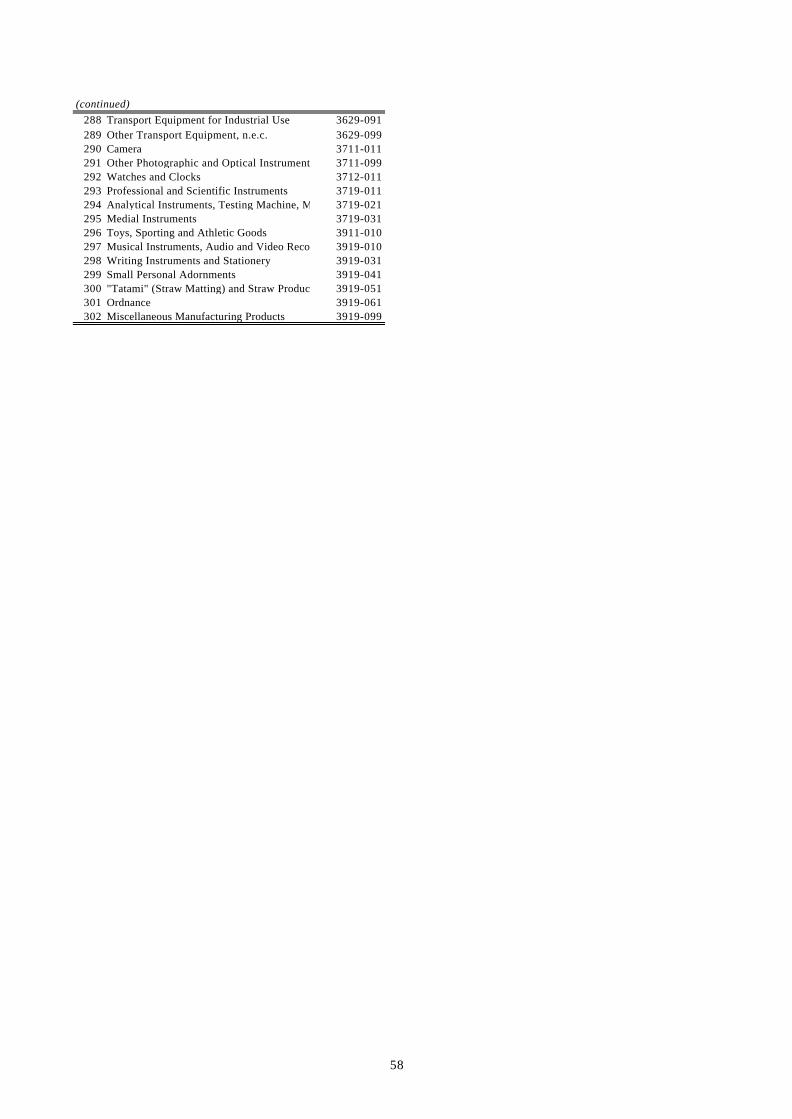
(continued)288 Transport Equipment for Industrial Use 3629-091289 Other Transport Equipment, n.e.c. 3629-099290 Camera 3711-011291 Other Photographic and Optical Instruments 3711-099292 Watches and Clocks 3712-011293 Professional and Scientific Instruments 3719-011294 Analytical Instruments, Testing Machine, Measuring Instruments3719-021295 Medial Instruments 3719-031296 Toys, Sporting and Athletic Goods 3911-010297 Musical Instruments, Audio and Video Records, other Information Recording Materials3919-010298 Writing Instruments and Stationery 3919-031299 Small Personal Adornments 3919-041300 "Tatami" (Straw Matting) and Straw Products 3919-051301 Ordnance 3919-061302 Miscellaneous Manufacturing Products 3919-099
58
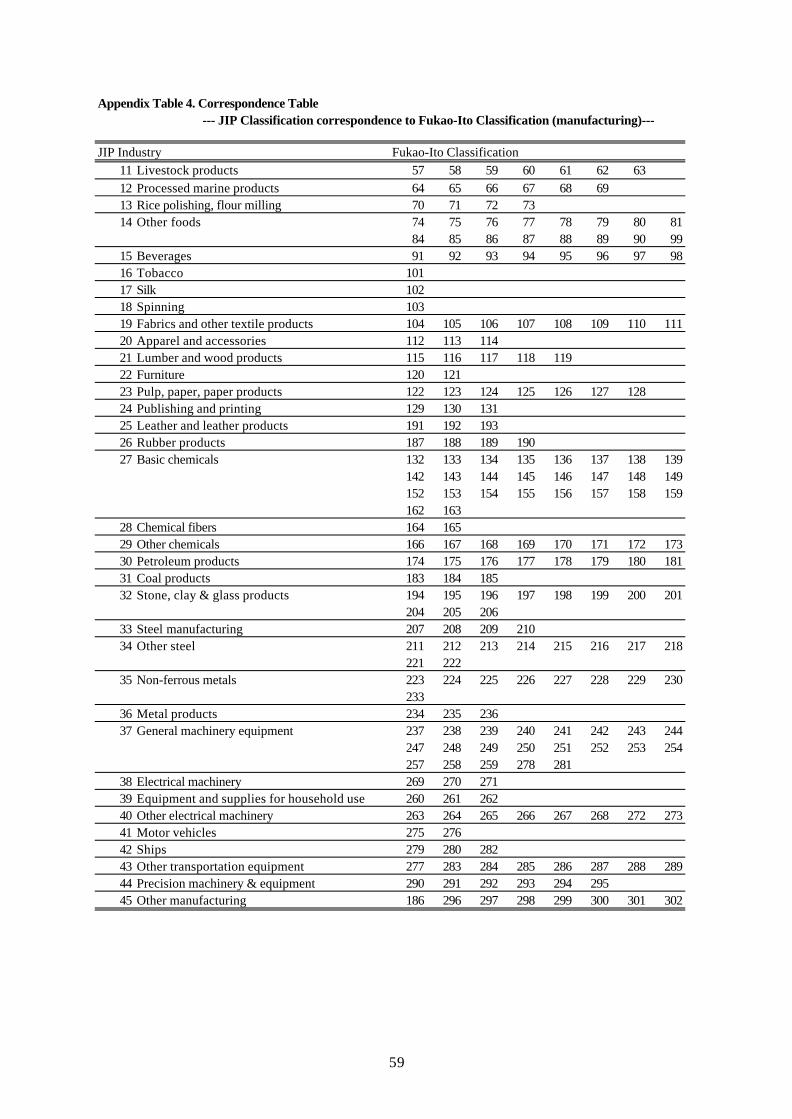
Appendix Table 4. Correspondence Table
JIP Industry Fukao-Ito Classification11 Livestock products 57 58 59 60 61 62 6312 Processed marine products 64 65 66 67 68 6913 Rice polishing, flour milling 70 71 72 7314 Other foods 74 75 76 77 78 79 80 81
84 85 86 87 88 89 90 9915 Beverages 91 92 93 94 95 96 97 9816 Tobacco 10117 Silk 10218 Spinning 10319 Fabrics and other textile products 104 105 106 107 108 109 110 11120 Apparel and accessories 112 113 11421 Lumber and wood products 115 116 117 118 11922 Furniture 120 12123 Pulp, paper, paper products 122 123 124 125 126 127 12824 Publishing and printing 129 130 13125 Leather and leather products 191 192 19326 Rubber products 187 188 189 19027 Basic chemicals 132 133 134 135 136 137 138 139
142 143 144 145 146 147 148 149152 153 154 155 156 157 158 159162 163
28 Chemical fibers 164 16529 Other chemicals 166 167 168 169 170 171 172 17330 Petroleum products 174 175 176 177 178 179 180 18131 Coal products 183 184 18532 Stone, clay & glass products 194 195 196 197 198 199 200 201
204 205 20633 Steel manufacturing 207 208 209 21034 Other steel 211 212 213 214 215 216 217 218
221 22235 Non-ferrous metals 223 224 225 226 227 228 229 230
23336 Metal products 234 235 23637 General machinery equipment 237 238 239 240 241 242 243 244
247 248 249 250 251 252 253 254257 258 259 278 281
38 Electrical machinery 269 270 27139 Equipment and supplies for household use 260 261 26240 Other electrical machinery 263 264 265 266 267 268 272 27341 Motor vehicles 275 27642 Ships 279 280 28243 Other transportation equipment 277 283 284 285 286 287 288 28944 Precision machinery & equipment 290 291 292 293 294 29545 Other manufacturing 186 296 297 298 299 300 301 302
--- JIP Classification correspondence to Fukao-Ito Classification (manufacturing)---
59