nber working paper series educational debt burden …
TRANSCRIPT

NBER WORKING PAPER SERIES
EDUCATIONAL DEBT BURDEN AND CAREER CHOICE:EVIDENCE FROM A FINANCIAL AID EXPERIMENT AT
NYU LAW SCHOOL
Erica Field
Working Paper 12282http://www.nber.org/papers/w12282
NATIONAL BUREAU OF ECONOMIC RESEARCH1050 Massachusetts Avenue
Cambridge, MA 02138May 2006
I thank Lewis Kornhauser for sharing the data from this experiment in addition to many useful comments,and Hetty Dekker for assistance compiling the dataset. I am also grateful for helpful suggestions from AttilaAmbrus, David Card, Anne Case, Hank Farber, Sheila Ketcham, Jeff Kling, Wolfgang Pesendorfer andworkshop participants at Princeton, Stanford GSB, Harvard and MIT. Please direct correspondence to:<[email protected]>. The views expressed herein are those of the author(s) and do not necessarilyreflect the views of the National Bureau of Economic Research.
©2006 by Erica Field. All rights reserved. Short sections of text, not to exceed two paragraphs, may bequoted without explicit permission provided that full credit, including © notice, is given to the source.
Educational Debt Burden and Career Choice: Evidence from a Financial Aid Experiment at NYULaw SchoolErica FieldNBER Working Paper No. 12282May 2006JEL No. I22, J24, D11, D12, H24
ABSTRACT
This paper examines the influence of educational debt aversion on the career choice of law schoolstudents, including the decision to attend law school and the decision to work in public interest law.To isolate the role of debt aversion, I analyze experimental data from NYU Law School’s InnovativeFinancial Aid Study in which two career-contingent financial aid packages were randomly assignedto participating admits. Because the packages had equivalent monetary value and differed only inthe duration of indebtedness, differences in career choices associated with financial aid assignmentcan be attributed to psychological debt aversion. The results indicate that debt aversion matters: Inclasses for which the lottery was announced prior to enrollment, participants randomly assigned tothe low-debt package are nearly twice as likely to enroll. In classes without selective matriculation,lottery winners have a 36-45% higher rate of first job placement in public interest law. Both resultsare consistent with a simple model of debt aversion in which psychic costs of holding debt duringand after school generate differences in the discounted lifetime utility of the financial aid packagesand, hence, in the value of attending law school and of working in public interest law.
Erica M. FieldDepartment of GovernmentHarvard UniversityLittauer 206Cambridge, MA 02138and [email protected]
1
1 Introduction
Financing higher education increasingly requires a large amount of debt, a trend which
has the potential to alter schooling and career decisions. Access to financial aid mitigates the
degree to which tuition hikes constrain investment choices, but may be insufficient to entirely
remove labor market distortions. In particular, previous studies suggest that individuals
experience disutility from debt beyond borrowing costs.1 If there are psychic costs of debt, even
if individuals face no borrowing constraints, the need to finance higher education with debt may
discourage individuals from making optimal human capital investments and divert them towards
careers with high monetary rather than social returns.
This paper examines the role of educational debt burden on career choices of law school
graduates. To isolate the influence of debt aversion, I compare schooling and job decisions of
law school students that participated in a randomized allocation of two distinct financial aid
packages conducted at New York University’s (NYU) School of Law. The key feature of the
experiment is that the two financial aid packages were designed to be equivalent in monetary
value and differ only in terms of the amount and duration of educational debt. In simple terms,
members of the treatment group who took jobs as public interest lawyers received tuition waivers
without having to borrow, while lottery losers employed in public interest law took out loans for
tuition that were fully repaid by the school over ten years, a standard loan repayment assistance
program. This experiment provides a unique opportunity to isolate the influence of non-financial
costs of debt on career choice and thereby quantify the degree to which psychological debt
burden influences high-stakes decisions. According to standard economic models, interest-
compensated debt should have no influence on behavior. However, if there is debt aversion, or
psychic disutility of debt beyond borrowing costs, even educational loans that are repaid by a
third party could influence career decisions.
Not only is this an interesting behavioral question, but one with potentially important
policy implications. In particular, as educational debt levels rise, a growing number of
professional schools are offering loan repayment assistance to graduates who pursue low-paying
public interest work. Depending on the nature of debt aversion, career-contingent tuition
subsidies of equivalent value may be more effective in encouraging students to take low-paying
1 There is substantial empirical evidence of debt aversion in many settings. For instance, payoff rates of mortgages and student loans are “irrationally” rapid. See Loewenstein and Thaler (1989) and Thaler (1992) for a discussion.

2
jobs with high social value than are loan repayment programs which fail to alleviate debt burden.
This policy question is relevant in many educational settings in which career-contingent financial
aid is designed to steer people towards public interest work. For instance, British public
universities recently adopted a universal program of income-contingent educational loans and
Canada is now considering the same (Barr, 2004; Barr et. al., 2005).
The first section of the paper describes the NYU financial aid experiment in detail. The
second section derives three predictions regarding the influence of debt on experimental
subjects’ career choices from a simple model of debt aversion. I then present experimental
results indicating that graduates career choices are indeed sensitive to receiving career-
contingent tuition subsidies in place of debt relief of equivalent value. In particular, law school
graduates who receive tuition waivers have a significantly higher rate of first job placement in
public interest law as well as a substantially higher rate of clerkships. Furthermore, when lottery
outcomes are announced prior to enrollment, debt timing appears to influence the matriculation
decisions of law school admits, such that recipients of tuition waivers are more likely to enroll,
particularly those with a high initial interest in public service.
I disentangle the role of anticipated educational debt on enrollment decisions from the
effect of early debt on first job choice by looking separately at job choices of students in the two
classes for which matriculation decisions were independent of lottery outcomes. Importantly, the
enrollment effects do not account for the entire difference in job placement. Differences in public
sector placement according to debt timing are identical in magnitude among students in classes
without selection problems, indicating an independent post-enrollment influence of debt aversion
on career decisions. Meanwhile, differences in rates of clerkship are only present among students
in the classes with selective matriculation, indicating that the effect of financial aid package on
clerkships is driven by the type of students that are drawn to NYU to avoid law school debt.
2 Project Background
2.1 Career-contingent Financial Aid
At the country's premier law schools, students are graduating with average educational
debt between $70,000 and $80,000, and the figure is rising. This is primarily driven by the rapid
rise in law school tuition: As Table 1 illustrates, between 1991 and 2001, law school tuition at

3
both private and public law schools nearly doubled (EJW et al., 2002).2 At the same time, wages
in private sector and public interest law jobs have steadily diverged, as can be seen from the
difference in private and public sector average starting salaries for graduates from NYU Law
School in the classes of 1998-2001.3
There is growing concern that educational debts of the current magnitude dissuade even
the most dedicated graduates from taking low-paying public interest jobs. For instance, a recent
survey of 1,622 law school graduates found that 66% did not consider a public interest job on
account of law school debt (EJW et al., 2002). In response, many schools have initiated career-
contingent financial aid policies designed to increase incentives for public interest work by
reducing educational debt burden in the form of loan repayment assistance programs (LRAP).4
Loan repayment assistance defrays or, in some instances, fully covers the educational debt
payments of graduates once they enter qualifying public service jobs. While in 1986 there were
only five law school LRAPs nationwide, today there are 47 law school and four state LRAPs.5
2.2 The New York University Innovative Financial Aid Study
NYU Law School's Weiss LRAP was among the first in the country. A 1993
enhancement of funding made it also one of the most generous LRAPs anywhere. At NYU, for
all graduates who choose careers in the public sector or other low paying fields of law, the
majority of educational loans incurred during law school are forgiven through quarterly
prospective funding for up to ten years following graduation. Full time employees who work 35
hours or more each week in a position that involves law are eligible for the program. For the
class of 2004 the program defines "low-paying" as income of less than $57,651 annually. As
seen in Appendix A, by 1998 NYU Law School had become the second largest LRAP in the
country in terms of total funds dispersed.
2 Kornhauser and Revez (1995) find similar patterns of tuition growth between 1980 and 1990. 3 Here, as throughout the paper, “public interest law” includes all government law jobs as well as non-governmental non-profit law. The growth in the starting salary gap is equally large at the national level. The disparity widens over the ten-year payback period on account of the steeper wage profiles of private sector law jobs (EJW et al., 2002). 4 There are also a handful of LRAP programs sponsored by state governments and employers. 5 LRAP programs vary greatly in the amount of debt assistance offered and the eligibility requirements. See NAPIL (2002) for a comprehensive description of all programs.

4
Additionally, in 1997 NYU Law School announced a $10 million research initiative, the
Innovative Financial Aid Study (IFAS), which further expanded the amount of career-contingent
aid available to graduates. The IFAS was deemed innovative for two primary reasons. First, the
program introduced career-contingent tuition subsidies, called public service scholarships (PSS),
to a subset of students in the NYU Law classes of 1998, 1999, 2000, and 2001. The PSS
provided a grant of two-thirds tuition that converted to a loan in the event that a recipient did not
pursue a public interest law career. Specifically, a legally binding contract stipulated that any
PSS recipient who takes a non-qualifying job during the first ten years of his career had to repay
the amorticized portion of his tuition scholarship corresponding to the portion of time spent in
the private sector according to a repayment schedule matching federal loan terms.
The second innovation of the IFAS was the randomized allocation of all PSS by lottery
across the pool of students who chose to enlist in the study. Lottery winners received PSS grants
covering two-thirds tuition for all three years of law school, while lottery losers received no
subsidy for the following year, but were eligible to apply for two-year and one-year subsidies
during their second and third years of law school, also allocated by lottery. More importantly, at
the end of law school all participants including lottery losers were eligible for LRAP to cover
debt taken out to finance living expenses during school as well as any portion of tuition loans not
covered by subsidy. In total, 141 lottery winners were selected from the pool of 270 applicants,
consisting in 64 three-year (PSS3), 57 two-year (PSS2), and 20 one-year (PSS1) scholarships.6
As part of the IFAS study, data were collected on all members of the four participating
law school classes from six separate university sources: law school applications; financial aid
applications; law school academic records from the registrar’s office; first-year entry surveys on
work experience, personal debt, career goals and job preferences; third-year exit surveys with
data identical to the entry survey but also including school and summer activity information; and
work experience surveys mailed biennially to alumni for ten years following graduation.
3 Conceptual Framework: LRAP versus PSS
The key characteristic of the IFAS lotteries and the most important feature to note in
comparing the two loan options is the fact that the two packages were designed to be equivalent 6 Students who quit or failed to graduate in three years are excluded from these figures and the proceeding analysis.

5
in net present value. Because PSS job eligibility requirements were identical to those of LRAP,
and because PSS recipients were also eligible for LRAP for the portion of expenses financed by
loans, the PSS was essentially loan forgiveness in reverse. Since all applicants in the study
received subsidized interest-free loans covering tuition through the school financial aid office,
there was no difference in the monetary values of the two financial aid packages.
To illustrate, consider the cost of tuition and therefore the monetary value of the two
financial aid programs given an annual tuition expense of $15,000. Lottery losers must take on
$45,000 in debt to cover tuition, while lottery winners take on only $15,000 of debt while in
school. In the case of public interest work, for both groups all tuition debt is repaid by NYU in
quarterly installments for ten years after graduation. In the case of private sector employment,
lottery winners immediately owe an additional $30,000 to NYU at graduation, bringing their
total debt to $45,000, which is exactly what lottery losers owe to the government. As the
expected tuition cost of law school is equivalent for winners and losers under both employment
scenarios, economic theory predicts a Von Neumann-Morgenstern utility-maximizing individual
to be indifferent between winning and losing the financial aid lottery. Similarly, because both
packages offer the same reward for public sector work, an individual should respond identically
to the two forms of aid when choosing whether to take a public interest law job.
Nonetheless, two differences across the programs in the amount and duration of debt
have the potential to generate differences in students’ valuations of the programs and
corresponding differences in their career decisions according to lottery outcome. First, under
PSS, students are in debt for an additional three years during law school regardless of their
eventual career choice. Second, PSS recipients face ten years of debt after graduation even if
they take a public interest job due to the fact that, rather than signing over student loans to NYU
immediately upon graduating, LRAP entails the school paying off loans over ten years, during
which time the declining balance remains in the student’s name. A key intention of the study was
to equate the borrowing costs of the two packages such that longer duration of debt imposes no
additional interest expenses on the student. However, one reason that students’ employment
responses to LRAP and PSS could differ is that individuals are not standard expected utility
maximizers in the sense that their career choices are influenced by the psychological and not just
the financial burden of owing money. If students perceive the state of debt to be costly, they will

6
find it less attractive to enroll in law school and to enter public interest work when offered LRAP
rather than PSS, generating differences in both matriculation and public interest placement rates
according to financial aid timing.
3.1 Debt aversion
To investigate how the type of financial aid offered affects the probability that a
prospective student enters the program and the career choices of students who enter, consider a
simple dynamic utility-maximization problem with debt aversion. Here, an individual’s lifetime
utility is an additive function of discounted lifetime consumption and the discounted lifetime
disutility of holding debt in each period, plus the discounted lifetime utility of the premium she
places on public interest work when employed in that sector. In particular, a law student’s utility
function is assumed to take the following form:
∑∑∑∞
=
∞
=
∞
=
⋅⋅+⋅−⋅=411
)()(t
tt
tt
t
tt
t pdvcuU θδδδ (1)
where period t=0 corresponds to the period preceding law school, periods t=1,..., 3 correspond to
years in law school, and periods t≥4 correspond to years of employment. Here, tc is period t
consumption, dt = etd + c
td is period t total debt (or savings level if negative) which is the sum
of educational dept etd and consumption debt c
td , δ is the constant discount factor, pt=1 (for
t≥4) if the student takes a public interest law job and 0 otherwise, and θ is the utility premium of
working in a public versus a private sector job. Function u is assumed to be increasing, while v is
assumed to be non-decreasing such that v(d)=0 if d≤0. An individual is said to be debt averse if
v(d)>0 for all d>0. To capture law school entrants’ uncertainty regarding the extent to which
they will find public interest law rewarding,θ is a random variable whose distribution is known
to the individual at t=1 and whose value is realized at t=3.
The individual maximizes the expectation of (1) subject to her budget constraint:
∑∑∞
=
∞
= ++≥
+ 14
1 )1(1
)1(1
ttt
e
ttt c
rdi
r (2)

7
where r is the constant interest rate, ed4 is the amount of educational debt the student has after
finishing law school, and ti is period t income. The level of debt in different periods is defined
by the following difference equation:
dt =0; 1 t ))(1( e1 ≥∀++−+=+ ttttt scidrd (3)
where ets is nonnegative for t=0,..,3 and represents the additional educational loan
imposed on the student at the beginning of t+1, and non-positive for t≥4 and represents the
amount of loan repayment by the school at the end of t.
The parameters of the above maximization problem that differ according to whether the
student is under LRAP or PSS and whether she decides to take a public interest or private sector
job are ets (t=1,...,13), ti (t≥4) and tp (t≥4). In particular:
(i) 3/Ds et = for t=0,...,2 and 03 =es under LRAP (at the beginning of each school year
1/3 of the total educational loan D is imposed as a debt), 0=ets for t=0,...,2 and Ds e =3 under
PSS if the student takes a private sector job, while 0=ets for t=0,...,3 under PSS if the student
takes a public interest law job;
(ii) 0=ets for every t≥4 under PSS and under LRAP if the student takes a private sector job,
while 0>ets for t=4,...,13 such that ∑
=−+
13
44)1(
1t
tr ts =D under LRAP if the student takes a public
interest law job;
(iii) ti = ti if the student takes a private sector job and ti = ti if the student takes a public
interest job (t≥4);
(iv) tp =0 if the student takes a private sector job and tp =1 if the student takes a public
interest law job (t≥4).
In this framework, debt aversion has three important implications for an individual’s
response to different forms of financial aid. First, the model implies that debt averse individuals

8
will always prefer PSS over LRAP. This is because for any fixed consumption stream 1d , 2d and
3d (debt during school) are lower under PSS than under LRAP, and for t≥4 td is the same under
the two programs if the individual takes a private sector job, while td is lower under PSS than
LRAP for ten years after school (4≤t<13) if the individual takes a public sector job. Furthermore,
for the same occupational choice the lifetime budget set (and therefore the set of feasible
consumption paths) is the same under the two programs. This implies that the maximal
discounted lifetime utility at time 0 is larger under PSS than under LRAP. Hence, matriculation
rates should differ according to financial aid package, with a higher fraction of students
matriculating when offered tuition subsidies.
Second, career choices made at t=4 might be different under the two types of financial
programs such that a higher fraction of students with tuition subsidies will take public interest
law jobs. To see this, let †U ),( 4 θcd and ††U ),( 4 θcd denote the maximized value of
∑∑∑∞
=
∞
=
∞
=
⋅+−444
)()(t
tt
tt
t
tt
t pdvcu θδδδ given a fixed end of the school consumption debt cd 4 and
realization of θ , under PSS and LRAP if the individual takes a private sector job, and let
*U ),( 4 θcd and **U ),( 4 θcd denote the corresponding maximized continuation utilities if the
individual takes a public sector job. Notice that the value of a private sector career is identical
under the two scenarios, because 4d and ti (t≥4) are identical under the two scenarios, so the
individual solves the same maximization problem. Therefore †U ),( 4 θcd = ††U ),( 4 θcd .
However, the value of a public sector career is higher under PSS than LRAP because the income
streams ti (t≥4) and therefore the consumption possibilities are the same (recall that
∑=
−+
13
44)1(
1t
tre
ts =D), but for the same consumption path debt in the first ten years after school is
higher under LRAP than under PSS. Therefore the value of the maximization problem under PSS
is higher than under LRAP: *U ),( 4 θcd > **U ),( 4 θcd .
The above implies that, for some subset of students, *U ),( 4 θcd > †U ),( 4 θcd but
**U ),( 4 θcd < ††U ),( 4 θcd , so even if the amount of consumption debt at the end of school is
9
the same under the two programs, an individual might choose a public sector job under PSS and
a private sector job under LRAP. This difference is further magnified if individuals foresee
during school that they are more likely to choose a public sector job under PSS, since then their
consumption decisions during school will be closer to the optimal decisions conditional on a
subsequent public sector career.
Finally, the additional value of PSS over LRAP for individual i before school, Vi, is a
function of i’s expectation of iθ , or the likelihood of taking a public sector job. To see the
relationship, for simplicity assume that consumption decisions during school, 1c , 2c , 3c and
therefore cd4 are the same under the two programs.7 Let iθ and iθ~ be the threshold levels of θ
above which i takes a public interest job under PSS and LRAP. Recall that iθ < iθ~ . Let )(θf be
the density function of θ . Then
∫∫ −+−=∞ i
ii
dfdUdUdfdUdUV ci
ci
ci
cii
θ
θθ
θθθθθθθθ~
4††
4~
44 )()),(),(*()()),*(*),(*( +
∫ −+i
dfdUdU ci
ci
θ
θθθθ0
4††
4† )()),(),(( .
Recall from the previous discussion that the last term is zero. Furthermore,
),(*( 4 θci dU > ),(( 4
† θci dU for iθ <θ < iθ
~ . Finally, since the term involving θ is additively
separable in the utility function, ),*(*),(* 44 θθ ci
ci dUdU − is the same positive constant 1k for
every θ > iθ~ and ),(),(* 4
††4 θθ c
ic
i dUdU − is the same positive constant 2k for every iθ <θ < iθ~ ,
and that 1k > 2k . These imply that any change in the distribution of θ such that the new
distribution first order stochastically dominates the old one results in an increase in iV . An
increase in the likelihood of taking a public sector job is associated with an increase in the
additional value of PSS versus LRAP.
7 The argument can be extended to the case when consumption during school depends on which financial program the student got into.

10
3.2 Psychic versus real cost of debt
Aversion to debt could arise from many sources. For instance, stigma and social norms
regarding indebtedness could generate anxiety or impose social costs on borrowers.8 In addition
to psychological costs, disutility of debt may also stem from financial costs of holding debt other
than interest, such as limited access to credit or time costs of debt service. Third, although law
school admits had substantial access to education loans free of interest while in school,
anticipated differences in borrowing constraints could cause applicants to value PSS over LRAP.
In the case of LRAP and PSS, the second and third differences are unlikely for the
following reasons. First, outstanding federal education loans are unlikely to limit access to
consumer, business or housing credit, and a similar amount of annual paperwork is required of
LRAP and PSS participants regardless of career choice. Second, uncertainty about access to
education loans is unlikely to play a role in this experiment since applicants to NYU were
notified of federal loan application results at the same time as admissions decisions. For these
reasons, evidence of debt aversion in this experiment is most likely to reflect psychic costs of
holding debt rather than expectations of financial costs of debt.
3.3 Other differences in the value of the programs
Differential responses to the two forms of aid are attributable to debt aversion only if
other differences in the value of the two programs can be ruled out. Here, it is important to note
that neither LRAP or PSS involved any extra-curricular activities, organized meetings or special
coursework, and both were nothing more than private transactions with the NYU financial aid
office. Hence, lottery outcome should have no influence on a student’s peer interactions or
activities during school. Because neither program is merit-based, there should be no difference
between the two programs in job opportunities. The possibility that PSS increased students’
ability to signal interest in public service work is explored empirically in section 5.4 of the paper.
The only difference in the financial value of the two aid packages is the potential risk
associated with the non-binding nature of the LRAP agreement. In particular, neither the
existence of the LRAP program nor its benefits formula is guaranteed to remain constant for at 8 Negative reactions of parents – who are likely to be co-signers on a loan – are a particularly compelling deterrent.

11
least ten years after law school applicants enter the job market. Thus, uncertainty regarding
program continuation or changes in benefit amount, eligibility requirements, or tax treatment of
loan payments could cause applicants to favor the tuition subsidy and students with debt to
refocus their career towards the private sector.
For two reasons, uncertainty about future support is unlikely in this setting. First, NYU's
LRAP is one of the oldest and most established loan repayment programs in the country and
NYU Law School promotes itself as a school committed to public interest law, so
discontinuation or reduction in LRAP benefits should be deemed highly unlikely by incoming
students. Second, according to program coordinators, the school’s commitment to providing loan
assistance was particularly emphasized to students in IFAS classes, who were made aware of the
fact that they were part of ten-year experimental study.
4 Construction of Control Group
Among the pool of 270 IFAS study participants in the classes of 1998-2001, 141 tuition
subsidies were randomly assigned and 129 participants received the default option of LRAP.
Appendix B presents the distribution of applicant winners and losers by lottery type.
Constructing unbiased experimental groups was complicated by the fact that losers could reapply
for a PSS in their second (PSS2) and third (PSS1) years of law school. To address this
complication, only an individual’s lottery outcome the first time she applied was taken into
account. The treatment group then consists of all first-time applicant winners (N=93), and the
control group comprises all those not awarded a scholarship the first time they apply (N=177).
Characterizing lottery participants by their initial outcome amounts to an intent-to-treat analysis:
Due to the possibility of reapplying, the control group includes 48 lottery losers that receive
scholarships at a later stage, so comparing control and treatment outcomes provides a lower
bound on the treatment effect.9
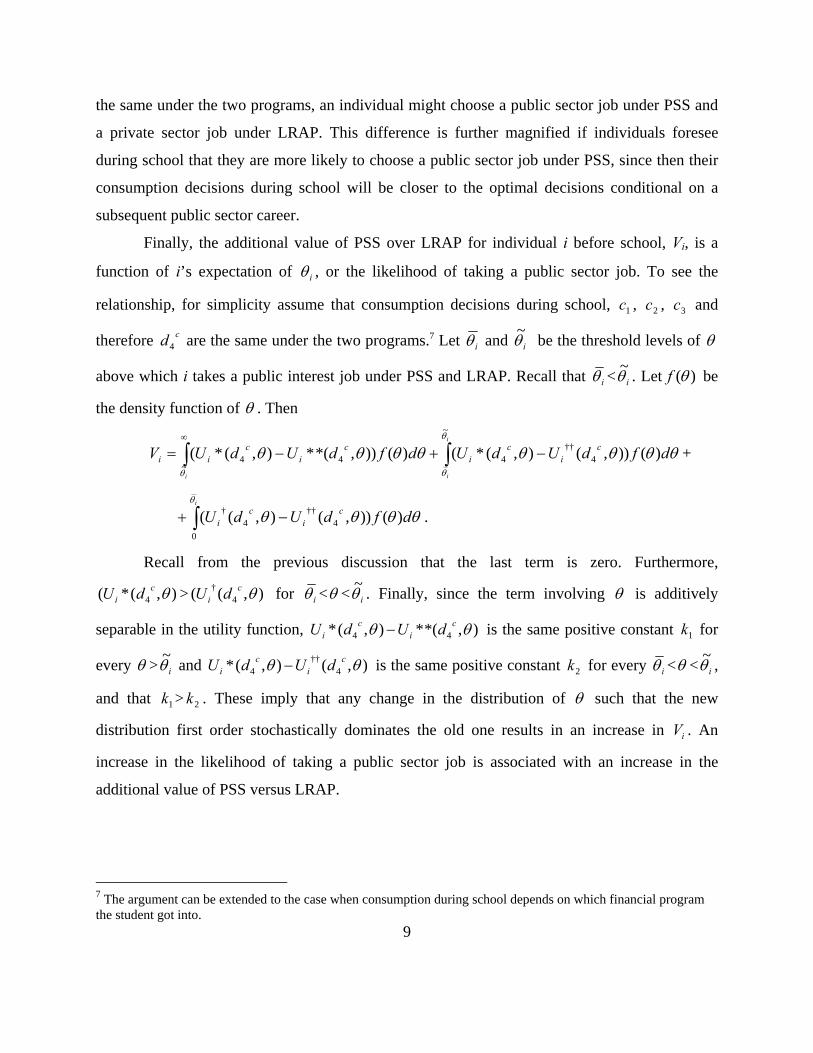
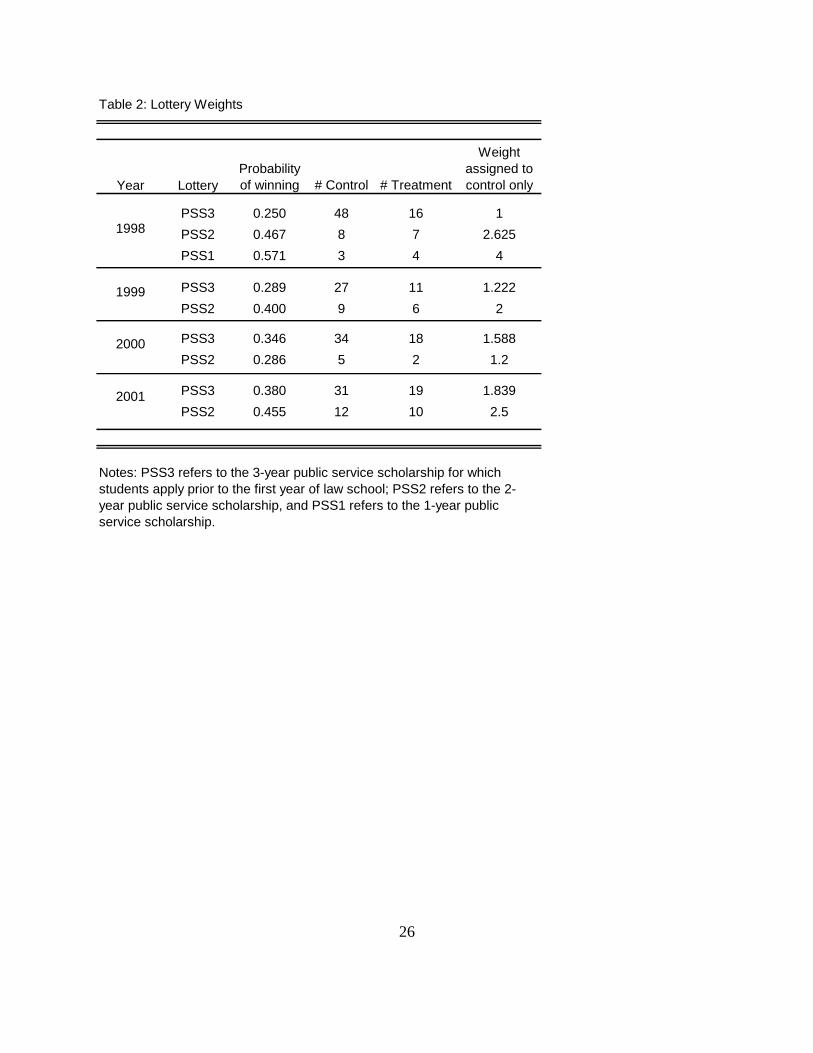
Second, the sample weights had to be adjusted to account for differences in the
probabilities of winning according to the class year and type of lottery to which the student first
applied – PSS3, PSS2 or PSS1. For instance, late applicants had a higher probability of winning 9 In this case, it is impossible to separate the effects of losing the PSS in an early year from winning at a later point, so estimates of scholarship effect are biased downwards This is analogous to the standard problem of control group members seeking outside treatment. See Robins (1998) for a discussion.

12
the lottery, and therefore the unweighted treatment group is composed of a higher percentage of
PSS2 and PSS1 applicants. To account for these composition effects, sample weights were
assigned to control subjects to equate the distribution of lottery types across treatment and
control groups. Table 3 gives the precise sampling weights for each applicant type.10
A third complication in constructing the comparison groups to be used in the analysis
arises from the fact that, in three years of the study, PSS3 lottery outcomes were announced prior
to the enrollment deadline and matriculation rates varied by lottery outcome in two of those
years.11 If enrollment decisions are correlated with lottery outcome as well as individual
characteristics associated with job choices, enrolled lottery winners and losers will not reflect a
random assignment of individuals to experimental groups. According to the predictions of
Section 3.1, if applicants are debt averse, matriculation rates should be higher among lottery
winners, and especially those with strong interest in public service. This implies a higher average
level of debt aversion and preference for public interest law within the treatment group, leading
to a biased estimate of program impact.
The following section on experimental results begins by exploring the effect of lottery
outcome on enrollment decisions. While complicating the analysis of job sector outcomes,
matriculation patterns according to lottery outcome are also a relevant program outcome. Note
that since the only difference between lottery winners and losers in the value of law school is that
lottery losers face a larger amount of (interest-compensated) tuition debt during and after school,
selective matriculation would only occur if applicants are debt averse. In this manner, differences
in matriculation according to experimental assignment provide a sufficient test of whether
individuals’ behavior is independent of non-financial costs of debt. Hence, even if it were
impossible to distinguish program effects on public interest employment from selection bias,
enrollment responses alone can tell us whether career choices are influenced by debt aversion.
10 Aside from using the matriculating lottery losers as a control group, a different option would have been to select a matched sample from the pool of non-applicants, as in Rouse’s (1998) quasi-experimental evaluation of the Milwaukee School Choice Program. In the case of the IFAS experiment, this approach is inappropriate because lottery participation is a decision variable undeniably highly correlated with job outcomes. Non-applicants comparable to applicants would be difficult to convincingly identify in the data. 11 An intent-to-treat analysis that includes all applicants regardless of matriculation would yield unbiased comparison groups. However, since data were only collected for NYU students, it was necessary to exclude from the analysis all lottery applicants that failed to matriculate. For a discussion of non-random non-compliance with missing data, see Tsitsi et al. (1999).

13
5 Experimental Outcomes
5.1 Matriculation Rates
Enrollment data from the NYU Law School admissions office indicate that lottery
outcome influenced matriculation as well as application decisions for two of the four classes of
participants. In aggregate, 39.6% of lottery winners and 32.3% of lottery losers enroll at NYU,
and the difference is statistically significant only at a 10% level. As seen in Table 3, differences
in enrollment are confined to two of the four classes: enrollment rates by lottery outcome and
class reveal substantially lower propensity to enroll among lottery losers in the classes of 1999
and 2000. In 1999, lottery winners were one third more likely to attend NYU, while in 2000
lottery winners enrolled at NYU at twice the rate of lottery losers.
In contrast, the classes of 1998 and 2001 face no such selection problems. In 2001, lottery
outcomes were announced post-enrollment and correspondingly matriculation rates are identical
across experimental groups. In 1998, although winners were announced before matriculation,
tuition subsidies did not influence the decision to apply to NYU since the first public
announcement about the program appeared in letters of admission. In general, individuals on the
extensive margin of applying should all be “conditional matriculators” in the sense of being
willing to attend only if the tuition subsidy becomes available, so announcing the lottery after the
application stage should unambiguously reduce selection.12 Correspondingly, experimental
groups in the class of 1998 had virtually identical matriculation rates, indicating that enrollment
was not influenced by lottery outcome. While it is feasible that winning the lottery could have
also encouraged an unconditional applicant to attend NYU, the data from 1998 do not reflect
this, implying that conditional applicants are the only conditional matriculators. By extension,
large differences in matriculation rates by lottery outcome in 1999 and 2000 suggest that
knowledge of IFAS encouraged applications to NYU.
Importantly, the fact that the selection problem is restricted to two of the four classes
allows me to gauge the effect of the subsidy on career choice among the unaffected subgroup. As
12 In a fully rational model, individuals who would only apply to NYU given the possibility of a tuition subsidy would only attend if that subsidy became available, although the possibility of winning a PSS1 or PSS2 makes the decision slightly more complicated.

14
stated previously, the effect of the subsidy on matriculation is also of interest since it reveals that
the availability of debt relief without explicit monetary value influences professional school
attendance. In terms of magnitude, the numbers suggest that 18.5% of lottery winners in the
classes of 1999 and 2000 would not have attended NYU had they lost the lottery. If the subsidies
are leading individuals to switch from another law school to NYU, this is a relatively minor
impact except from the perspective of the school. In contrast, if subsidies are encouraging
individuals to attend any law school, it is a small intervention with a large consequence on
human capital accumulation. Unfortunately, it is not possible to distinguish between these stories
with available data. Hence, while it may not be true that switching from career-contingent loan
repayment to career-contingent tuition subsidies increases the supply of lawyers, it is
unambiguous that tuition subsidies increased the supply of NYU law graduates.
Examining observable characteristics of those who matriculated according to lottery
outcomes provides information on the type of individuals on the extensive margin of attendance.
Because sample selection is presumed to occur only among first-year scholarship applicants who
are deciding whether and where to attend law school, Table 4 compares pre-law-school
characteristics among first-year lottery applicants in the classes of 1999-2000 only. Any
statistically significant differences in mean characteristics among matriculating winners and
losers can be assumed for incentive reasons to reflect a greater propensity to enroll among
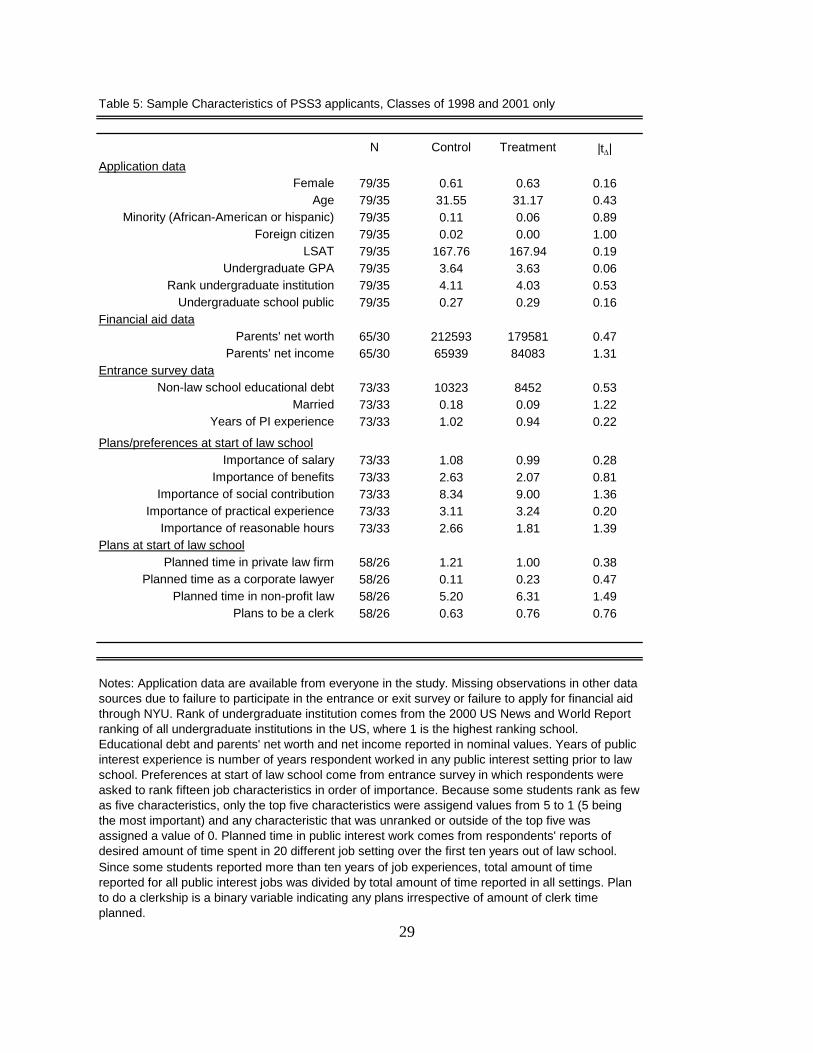
winners. In contrast, Table 5 compares characteristics among PSS3 applicants in the classes of
1998 and 2001 that did not face selection problems, so random assignment should be sufficient
to ensure that pre-law school characteristics are identical across experimental groups.13
In Table 4, one notable difference between lottery winners and losers in the selected
sample is the amount of time students plan to spend working in private sector law or for a private
corporation: In the entry survey, lottery losers reporting planning to spend nearly twice the
amount of career time in a private law firm relative to lottery winners. Unless this difference
reflects immediate changes in plans after learning about lottery outcome, the pattern is consistent
with the theoretical prediction of Section 3.1 that winning the lottery should have a
disproportionate influence on matriculation decisions of students who plan to work in public
13 Appendix C provides the same summary statistics for the full sample of participants without selection problems, which also includes late applicants.

15
service. Other than career plans, the only other detectable differences in observables are that the
selected sample has a lower fraction of minority students and on average places a lower value on
“practical experience” relative to other job characteristics such as salary, benefits and social
contribution. Although it is striking that no minority students in the treatment arms in 1999 and
2000 enrolled in NYU, the comparison could easily reflect random year-to-year variation in
minority applications given the extremely small number of minority participants in any class.
The effect of this matriculation pattern on career paths, explored in the following section,
will depend on the relative propensities of selected types to enter public interest law. However,
an immediate policy implication of the enrollment findings is that schools interested in
increasing yield will benefit from offering tuition subsidies in addition to loan repayment.
Consistent with the theoretical predictions from Section 3.1, students on the margin of attending
appear to be those with relatively high public interest commitment.
5.2 Mean Differences in Job Placement
The empirical analysis of job sector outcomes explores mean differences in career
outcomes between the control and treatment groups. Throughout the analysis, I present separate
estimates from the full set of participants, from the selected sample, and from the non-selected
sample. On account of possible sample selection at the matriculation stage, mean differences
between experimental subjects in all classes capture both the effect of participation during school
and the effect of winning the lottery on the decision to enroll.14 While this comparison is
imperfect for measuring the effect of educational debt on career choice, comparing the
matriculating treatment and control group members does provide an unbiased estimate of the
“total program effect” – that is, the effect of debt burden on career decisions together with the
effect of prospective debt burden on the decision to enroll. By eliminating from the sample the
two classes of participants affected by differential matriculation, the third comparison estimates
the average treatment effect of tuition waivers on job choice.
14 Furthermore, since some degree of “slippage” occurs among treatment members – i.e. some lottery winners fail to renew their three-year tuition waivers in years two or three of law school – the treatment effect accurately measures the impact of the availability of tuition waivers rather than the effect of take-up. Regardless of slippage, all treatment group members received tuition waivers for at least one of the three years.

16
In comparing the impact of the two forms of loan assistance, the fundamental outcome of
interest is the likelihood of pursuing a career in public interest law. To approximate long-range
career paths, I look at the first job placement of graduates as well as job placement two years
after law school. Almost one third of students switch jobs within two years of graduating and 8%
of them move between private and public interest jobs. Qualifying public interest law jobs are
classified according to the LRAP criteria: earning less than a specified salary for a full-time job
in legal services.15 Of those who qualify, 8% working for the public defender’s office, 42% are in
public or private legal aid and service organizations, 14% are in district attorney offices, 4% are
in other government agencies, and 24% work for other non-profit agencies.
The first job placement measure is complicated by the fact that graduates also have a
third option of accepting an intermediate position as a law clerk. I begin by looking at the
allocation of experimental subjects across all three sectors. As shown in Table 6, there is a
significant difference between experimental groups in the distribution of first job placements. In
pair-wise comparisons, treatment group subjects are 14.1 percentage points (34%) less likely to
take a non-qualifying job and 12.2 percentage points (52%) more likely to take a one-to-two year
clerkship after leaving law school. The difference across treatment and control groups in terms of
the likelihood of directly entering the public sector is small and insignificant. Nonetheless, these
results indicate that, despite the equivalent net present value of these two programs, career-
contingent tuition subsidies are associated with a lower rate at which law students with a self-
reported interest in public sector work abandon this pursuit immediately after law school.
The relationship between financial aid timing and the primary outcome of interest, the
long-term (post-clerkship) proportion of public interest lawyers, depends on the rate at which
clerks enter public interest work. Information on the pattern of post-clerkship employment is
available from follow-up surveys mailed to graduates two years out of school. Overall, 55.6% of
clerks transition to public interest jobs by the time of the follow-up survey, and the rate is almost
identical by lottery outcome.16 Table 7 reports the updated job sector distribution two years after
graduation. In addition to those who took clerkships, this outcome incorporates job changes
made by all graduates within the first two years. Here, the same patterns as in Table 6 are
15 Academic positions do not qualify as legal services. 16 Three observations without follow-up data are assumed for incentive reasons to not be working in qualifying jobs.

17
observed. Members of the treatment group are over one-third (36%) more likely to enter public
interest law after two years. Regression-controlled means accounting for year of graduation,
lottery type or demographic characteristics consistently produce an even larger treatment effect,
ranging from 19-20 percentage points.
Unfortunately, the small number of PSS1 and PSS2 applicants (66) does not permit a
dose response analysis of tuition subsidies. However, looking separately at PSS3 applicants
reveals that the difference in public interest law placement is indeed concentrated among
applicants to three-year tuition lotteries among whom the debt difference is the largest. In the
third and fourth rows of Table 7 we observe a 20.8 percentage point differential in the rate of
public interest law between three-year lottery winners and losers. Meanwhile, the public interest
law differential among late applicants is only 6.1 percentage points and insignificant.
Importantly, from the results presented in Table 7, we can also conclude that sample
selection alone is not responsible for the differential rate of placement in public interest law even
under the strongest selection story. In particular, the difference in first job choice persists after
excluding from the estimates the two classes for which there is differential matriculation
according to lottery outcome. Among PSS3 participants in the classes of 1998 and 2001 only, the
public interest placement differential is 21.2%, and is statistically significant at the 5% level. The
placement differential in the classes of 1999 and 2000 is almost identical and significant at the
10% level, suggesting a minimum role of selection on job placement.
In contrast, based on the mean differences in Tables 6 and 8, sample selection appears to
be entirely responsible for the difference in clerkships. When excluding the problematic classes
from the analysis, the difference in rate of clerkships falls from 11.9% to 4.2% and the results
lose significance. In contrast, more than twice as many PSS3 lottery winners in the classes of
1999 and 2000 take clerkships immediately after law school compared to lottery losers, and the
difference is significant. Given the competitive nature of clerkships, the high placement rate
among conditional matriculators provides further evidence that students on the margin of
attending NYU given tuition subsidies are relatively high performers.

18
5.3 Instrumental Variables Estimates
The estimates in Table 9 translate the previous results into changes in behavior per dollar
of student debt. To do so, I instrument actual student debt with PSS3 lottery assignment.17
Although the size of the subsidy was identical for all lottery winners, participants varied in the
degree to which lottery outcome changed total debt since a number of students financed all or
part of their tuition and expenses out of pocket.
In this exercise, educational loans were calculated from three sources. First, NYU
provided data on all public and subsidized loans procured through the office of financial aid
(OFA), which included 85% of study subjects. In addition, students were asked in the entrance
and exit surveys to report total amount of money borrowed for law school. The shortcoming of
the OFA data is that fact that it excludes loans taken from private sources or informal borrowing
from friends and family. In addition to being self-reported, entrance and exit survey data are
limited by the fact that not all students participated in both surveys or responded to debt
questions.
Given the imperfect information on total amount borrowed for law school, I construct
three distinct measures of student debt. In the first measure, I assign zero debt to all students not
included in the OFA database. The second measure assigns zero debt only to those missing from
the OFA database that also report zero debt in the exit survey and treats the remaining
observations as missing. The third measure uses the highest amount of debt reported in either the
exit survey or the OFA database, which may include loans from private banks or informal loans
from friends and family. For students missing from both the OFA and exit survey data, I use total
borrowing reported in the entrance survey unless the student wins a PSS1 or PSS2 lottery.
In these estimates, the difference in schooling debt between lottery winners and losers is
between $29,000 and $31,000, slightly less than the full three year tuition subsidy of
approximately $36,000. This fact alone reveals that students cover some portion of school
expenses out of pocket. According to the IV results, $10,000 in school debt reduces the
likelihood of taking a public interest job two years out of law school by approximately 6%, and
the results are consistent across different measures of borrowing. 17 Since selection (and hence type) of participants and also amount of debt varies across lottery types, I cannot make use of variation in school debt across lottery types, and am forced to restrict the analysis to PSS3 participants.

19
5.4 Job Market Signaling
Before concluding that the results of this analysis reflect a response to debt, it is
important to eliminate the possibility that the relative employment prospects of treatment and
control group members differed on account of differences in signaling ability. Despite the fact
that PSS were distributed by lottery so provide no information on winners and losers, it is
possible that public interest employers perceived career-contingent scholarships as valuable job
market signals of quality or commitment to public interest work. Since lottery losers are
presumably unable to indicate to employers that they applied for a PSS, winning the lottery could
conceivably alter job opportunities in the public sector.
A useful way to test for the signaling effect of scholarships would be to look at
differences according to experimental group in callback rates and salary offers of public interest
employers. If present, this asymmetry should be reflected in higher average wage offers for
scholarship-holders, thereby disproportionately encouraging lottery-winners to enter public
interest law. Unfortunately, job offer data are not available from the IFAS. A much cruder
indicator of any significant job market advantage of PSS subjects is found by looking for relative
wage differences in public interest versus private firms between control and treatment groups
consistent with a premium on scholarship participation. To account for the fact that many
students take clerkships immediately after law school, positions for which salaries are largely
pre-determined, I regress the first post-clerk salary of each graduate on treatment assignment, job
sector, and their interaction.
In this baseline wage regression presented in Table 10, it appears that treatment status is
associated with a 10% wage premium in the public sector only. However, after controlling for
clerk experience and third-year GPA, the result disappears. While not definitive, this suggests
that financial aid package alone is not an important signal to employers. Clearly, these estimates
fail to capture any non-wage job attributes that vary systematically by lottery outcome, so should
be interpreted with caution. Furthermore, they ignore the selection of students into jobs. If tuition
subsidies increase public interest job prospects, average wages among those accepting PI jobs
may still be equal across experimental groups because only the best lottery losers take public
interest jobs. However, in this scenario we would correspondingly expect private sector salaries
to be higher for lottery winners, which does not appear to be the case.

20
6 Influence of Program Participation on Identity and Preferences
The above findings suggest that debt avoidance can have large consequences on high
stakes decisions. Namely, if one accepts the experimental premise that the only difference
between students in the control and treatment groups is the duration and amount of indebtedness,
then debt avoidance acts as a powerful disincentive for private sector employment.
An alternative explanation for the findings is that participation in the program affected
job choices by directly influencing career preferences. Although the program involved no special
activities, it is possible that the Public Service Scholarship label provided by winning the lottery
served to nurture an interest in public interest law. For instance, winning a PSS might have
increased friends’ and family’s awareness of a student’s original intentions, and desire to meet
others’ expectations could deter the individual from changing her mind.18 In this case, individuals
would value tuition subsidies in part because they serve as insurance against changing
preferences, or provide a form of “commitment to type”.
To better understand the mechanism by which tuition subsidies influenced job choice, the
last section explores differences in experiences and changes in career preferences during law
school. Note that diverging career preferences are insufficient to conclude that tuition subsidies
strengthened preferences for public interest law. Students may make choices during law school
with respect to coursework, summer jobs and extra-curricular activities purely in response to
debt. However, an absence of differences indicates that winning the lottery does not directly shift
students’ preferences. Table 11 presents data from the registrar’s office on grades and academic
activities, and data from entrance and exit surveys on career preferences before and after law
school. To facilitate interpretation of differences between experimental groups that may be
driven by sample selection, the analysis is restricted to PSS1 and PSS2 participants and
participants from the classes of 1998 and 2001.
Two interesting facts emerge. First, although academic performance in the first and
second years of law school is nearly identical across experimental groups, during the third year
of school students who receive tuition subsidies achieve a significantly higher grade point
average. Since the rate of clerkships is not significantly higher for these students (Table 7), the 18 At the extreme, others’ awareness of career goals could open up employment opportunities, analogous to the signaling story explored in the previous section.

21
difference is likely driven by greater competition for the limited supply of prestigious and
reasonably paid public interest jobs. Another possibility is that students who take jobs in law
firms are more likely to have received an employment offer at the end of a summer internship, in
which case they would have less incentive to maintain a high GPA in their final year of school.19
Greater competition over public interest jobs is also consistent with changes in students’
personal ranking of job characteristics. Interestingly, while both observed job choices and exit
survey career plans differ substantially according to financial aid package, the pattern of
preferences in job characteristics at the end of law school is remarkably similar across
experimental groups. Only two of 15 job characteristics that students were asked to rank in terms
of importance – salary and benefits – were significantly different at the end of law school.
Students receiving tuition subsidies increased their ranking of the importance of both forms of
compensation relative to students in the control group, and the absolute difference is significantly
higher at exit but not entrance. Concern over salary is likely driven by the same factor as concern
over grades: a higher fraction of lottery winners plan to enter public interest law, and therefore
face more pressure than lottery losers to get a job with a reasonable wage.
The fact that other career preferences, including the relative importance of social
contribution and prestige, are virtually equivalent between control and treatment groups both at
the start and finish of law school suggests that differences in career choices do not operate
through changes in preferences from participating in the program. Student academic activities,
including participation in law journals and moot court, number of clinical credits, available only
for the class of 1998, show further evidence of consistent preferences and experiences during
school. In particular, lottery winners and losers in the class of 1998 are equally likely to
participate in law journals and moot court (arguably more valuable for private sector positions),
and acquire a similar number of clinical credits (arguably more valuable for public sector work).
More strikingly, both in the first and second year of school, students in all classes are equally
likely to take summer positions in public interest law despite the large wage gap between private
and public internships. These patterns of choices suggest that preferences for social contribution
are not influenced by lottery outcome when debt is not a factor of consideration.
19 A final possibility is that students who plan to enter the private sector systematically take more difficult courses during their third year, a pattern that I am unable to explore. However, there is no apparent reason to expect this.

22
In sum, although lottery winners in the IFAS experiment were less likely to be “sucked
into the private sector”, it was not because the premium they placed on social contribution rose.
Rather, choosing a well-paid private sector job appears to be a tradeoff students make in
response to the psychological stress associated with securing a livable wage in public interest
law. Although lottery winners and losers equally value social contribution and financial security
at graduation, for many, debt avoidance tips the scale in favor of public interest law.
7 Conclusions
This study provides evidence that the timing of educational debt influences career
choices. Under a career-contingent financial aid program that offers tuition waivers rather than
an equivalent amount of loan repayment assistance, matriculation rates are nearly twice as high.
Furthermore, rates of first job placement in public interest law are roughly one third higher when
students are offered tuition subsidies rather than loan repayment assistance. Very little of the
influence of debt on career choice appears to be explained by differential matriculation according
to loan package. Thus, the positive effect of tuition subsidies on public interest employment
appears to operate through increasing the attractiveness of public interest work relative to private
sector work by making it free of debt.
The fact that career-contingent tuition subsidies are associated with higher rates of public
interest law than are financially equivalent backward-looking loan repayment schemes provides
strong evidence of the influence of debt aversion on job choice in a high stakes setting. Given
that the program equalized the interest costs of borrowing, this outcome suggests that individuals
experience a psychic cost of debt that is strong enough to influence career choice.
Regardless of the mechanism, the policy implication for a school interested in increasing
its supply of graduates to the public interest sector is straightforward. By distributing career
contingent scholarship funds before rather than after graduation, a law school can increase its
rate of public interest placement. Although retrospective debt relief is currently the
overwhelming form of career-contingent financial aid, these results imply that tuition subsidies
would be a more efficient allocation of institutional funds for this purpose. From a social welfare
perspective, debt reduction has the potential to increase schooling investment in job sectors with
high social returns. While loan repayment encourages some level of this, results from the IFAS

23
experiment suggest that career-contingent subsidies such as those adopted in the British system
would be even more effective in increasing the supply of public interest workers. If other
students mirror law school students in their attitudes towards debt, this relatively costless policy
difference could have significant impact in raising rates of public interest employment.

24
8 References
[1] Barr, Nicholas (2004). Higher education funding. Oxford Review of Economic Policy 20 (2) (Summer): 264-78. [2] Barr, Nicholas and Iain Crawford (2005). Financing Higher Education: Answers from the U.K. (London and New York: Routledge). [3] Equal Justice Works (EJW), NALP and the Partnership for Public Service (2002). “From paper chase to money chase: Law school debt diverts road to public service.” November, 2002. Available on-line at: http://www.napil.org/publications/lrapsurvey.pdf. [4] Kornhauser, Lewis A., personal interview, May 2001, NYU Law School. [5] Kornhauser, Lewis A. and Richard L. Revez, (1995). Legal education and entry into the legal profession. New York University Law Review 70(4): 829-964. [6] Loewenstein, George and Richard Thaler (1989). Anomalies and intertemporal choice. Journal of Economic Perspectives 3: 181-193. [7] Loewenstein, Goerge and Drazen Prelec (1998). The red and the black: Mental accounting of savings and debt. Marketing Science 17(4): 4-28. [8] Meyer, Bruce (1995). Natural and Quasi-Experiments in Economics. Journal of Business and Economic Statistics 13(2). [9] National Association for Public Interest Law (NAPIL) (2002). Financing the Future: NAPIL’s 2000 Report on Law School Loan Repayment Assistance and Public Interest Scholarship Programs. [10] National Association for Public Interest Law (NAPIL) (2002b). From paper chase to money chase: Law school debt diverts road to public service. Available online: http://www.equaljusticeworks.org/publications/lrapsurvey.pdf [11] National Association for Public Interest Law (NAPIL) (2001). “Lawyers priced out of public service.” Online. http://www.napil.org/finance/. March 15, 2001. [12] Nunes, Joseph, Dilip Soman and Klaus Wertenbroch (2001). Debt aversion as self-control: consumer self-management of liquidity constraints. INSEAD working paper 2001/09/MKT, under review, Journal of Consumer Research. [13] Tsitsi, Anastasios A. (1999). Causal inference from a randomized clinical trial when there is noncompliance. Biomedical Statistics Working Group Paper, North Carolina State University. [14] Robins, James M. (1998). Correction for non-compliance in equivalence trials. Statistics in Medicine 17: 269-302. [15] Rouse, Cecilia (1998). Private school vouchers and student achievement: An evaluation of the Milwaukee parental choice program. The Quarterly Journal of Economics 113(2). [16] Henderson, Christopher J. (2001), “The next wave: An analysis of perceptions of prospective university students on the issue of financial accessibility.” Alma Mater Society Academic Affairs Document, Queen’s University. [17] Thaler, Richard (1992). The Winner's Curse: Paradoxes and Anomalies of Economic Life. New York: Free Press.

25
Source: NAPIL (2002). Statistics from ABA Section of Legal Education and Admissions to the Bar. Nominal salaries reported.
Table 1: Median Law School Tu ition
1991 2001
Public School (resident) $3,225 $7,738
Public School (non - resident) $8.006 $17,538
Private School $12,999 $22,870
Annual Mean Starting Salaries
Class of 1998 Class of 1999 Class of 2000 Class of 2001
Public inte rest law $34494 $36006 $36523 $39922
Private sector $95783 $100872 $124355 $123517
26
Table 2: Lottery Weights
Year LotteryProbability of winning # Control # Treatment
Weight assigned to control only
PSS3 0.250 48 16 1PSS2 0.467 8 7 2.625PSS1 0.571 3 4 4
PSS3 0.289 27 11 1.222PSS2 0.400 9 6 2
PSS3 0.346 34 18 1.588PSS2 0.286 5 2 1.2
PSS3 0.380 31 19 1.839PSS2 0.455 12 10 2.5
Notes: PSS3 refers to the 3-year public service scholarship for which students apply prior to the first year of law school; PSS2 refers to the 2-year public service scholarship, and PSS1 refers to the 1-year public service scholarship.
1998
1999
2000
2001

27
Table 3. Enrollment Rates by Lottery Outcome
Class N Winners Losers |pΔ|1998 168 38.46 37.921999 112 42.31 31.522000 187 43.48 23.332001 141 35.56 35.53
Total 39.64 32.29 0.10
Source: NYU Law School Admissions Office
PSS3 Participants

28
Table 4: Sample Characteristics of PSS3 applicants, Classes of 1999 and 2000 only
N Control Treatment |tΔ|Application data
Female 61/29 0.57 0.55 0.18Age 61/29 31.31 31.72 0.49
Minority (African-American or hispanic) 61/29 0.08 0.00 2.28Foreign citizen 61/29 0.00 0.03 1.01
LSAT 61/29 168.20 169.17 0.93Undergraduate GPA 61/29 3.62 3.53 0.72
Rank undergraduate institution 61/29 4.09 4.07 0.13Undergraduate school public 61/29 0.34 0.41 0.70
Financial aid dataParents' net worth 52/25 220110 133432 1.38
Parents' net income 52/25 44790 52992 0.42Entrance survey data
Non-law school educational debt 58/26 6442 6330 0.10Married 58/26 0.14 0.19 0.49
Years of PI experience 58/26 1.08 1.59 0.81
Preferences at start of law schoolImportance of salary 58/26 1.09 1.01 0.19
Importance of benefits 58/26 1.38 0.99 0.99Importance of social contribution 58/26 3.52 4.10 1.31
Importance of practical experience 58/36 2.13 0.80 3.86Importance of reasonable hours 58/26 0.92 1.59 1.54
Plans at start of law schoolPlanned time in private law firm 58/26 1.21 0.46 1.83
Planned time as a corporate lawyer 58/26 0.35 0.00 2.11Planned time in non-profit law 58/26 5.85 6.12 0.29
Plans to be a clerk 58/26 0.86 0.93 0.46
Notes: Application data are available from everyone in the study. Missing observations in other data sources due to failure to participate in the entrance or exit survey or failure to apply for financial aid through NYU. Rank of undergraduate institution comes from the 2000 US News and World Report ranking of all undergraduate institutions in the US, where 1 is the highest ranking school. Educational debt and parents' net worth and net income reported in nominal values. Years of public interest experience is number of years respondent worked in any public interest setting prior to law school. Preferences at start of law school come from entrance survey in which respondents were asked to rank fifteen job characteristics in order of importance. Because some students rank as few as five characteristics, only the top five characteristics were assigend values from 5 to 1 (5 being the most important) and any characteristic that was unranked or outside of the top five was assigned a value of 0. Planned time in public interest work comes from respondents' reports of desired amount of time spent in 20 different job setting over the first ten years out of law school.
Since some students reported more than ten years of job experiences, total amount of time reported for all public interest jobs was divided by total amount of time reported in all settings. Plan to do a clerkship is a binary variable indicating any plans irrespective of amount of clerk time planned.
29
Table 5: Sample Characteristics of PSS3 applicants, Classes of 1998 and 2001 only
N Control Treatment |tΔ|Application data
Female 79/35 0.61 0.63 0.16Age 79/35 31.55 31.17 0.43
Minority (African-American or hispanic) 79/35 0.11 0.06 0.89Foreign citizen 79/35 0.02 0.00 1.00
LSAT 79/35 167.76 167.94 0.19Undergraduate GPA 79/35 3.64 3.63 0.06
Rank undergraduate institution 79/35 4.11 4.03 0.53Undergraduate school public 79/35 0.27 0.29 0.16
Financial aid dataParents' net worth 65/30 212593 179581 0.47
Parents' net income 65/30 65939 84083 1.31Entrance survey data
Non-law school educational debt 73/33 10323 8452 0.53Married 73/33 0.18 0.09 1.22
Years of PI experience 73/33 1.02 0.94 0.22
Plans/preferences at start of law schoolImportance of salary 73/33 1.08 0.99 0.28
Importance of benefits 73/33 2.63 2.07 0.81Importance of social contribution 73/33 8.34 9.00 1.36
Importance of practical experience 73/33 3.11 3.24 0.20Importance of reasonable hours 73/33 2.66 1.81 1.39
Plans at start of law schoolPlanned time in private law firm 58/26 1.21 1.00 0.38
Planned time as a corporate lawyer 58/26 0.11 0.23 0.47Planned time in non-profit law 58/26 5.20 6.31 1.49
Plans to be a clerk 58/26 0.63 0.76 0.76
Notes: Application data are available from everyone in the study. Missing observations in other data sources due to failure to participate in the entrance or exit survey or failure to apply for financial aid through NYU. Rank of undergraduate institution comes from the 2000 US News and World Report ranking of all undergraduate institutions in the US, where 1 is the highest ranking school. Educational debt and parents' net worth and net income reported in nominal values. Years of public interest experience is number of years respondent worked in any public interest setting prior to law school. Preferences at start of law school come from entrance survey in which respondents were asked to rank fifteen job characteristics in order of importance. Because some students rank as few as five characteristics, only the top five characteristics were assigend values from 5 to 1 (5 being the most important) and any characteristic that was unranked or outside of the top five was assigned a value of 0. Planned time in public interest work comes from respondents' reports of desired amount of time spent in 20 different job setting over the first ten years out of law school. Since some students reported more than ten years of job experiences, total amount of time reported for all public interest jobs was divided by total amount of time reported in all settings. Plan to do a clerkship is a binary variable indicating any plans irrespective of amount of clerk time planned.

30
Table 6: First job placement of graduates
All participants
Control Treatment Δ |tΔ|
Public interest law 34.66 36.56 1.90 0.30
Private sector employment 42.06 27.96 -14.10 2.30
Clerkship 23.29 35.48 12.19 2.04
N 193 128χ2=5.5
(p=0.005)
Sub-sample without selection, Late applicants and PSS3 applicants in classes of 1998 and 2001
Control Treatment Δ |tΔ|
Public interest law 35.28 42.19 6.91 0.93
Private sector employment 40.05 32.81 -7.24 0.88
Clerkship 24.67 24.99 0.32 0.05
N 116 64χ2=2.3
(p=0.005)
Sub-sample with selection, PSS3 applicants in classes of 1999 and 2000 only
Control Treatment Δ |tΔ|
Public interest law 33.29 31.03 -2.26 0.21
Private sector employment 46.48 27.58 -18.90 1.78
Clerkship 20.22 41.38 21.16 1.99
N 61 29χ2=4.4
(p=0.005)
Notes: This table shows the weighted distribution of students in the control (LRAP) and treatment (PSS) groups entering each of three position types immediately after graduating. Private sector employment includes any job that does not qualify as public interest law, including non-legal jobs and further schooling.

31
Table 7: Fraction in public interest law after two years
Control Treatment Δ |tΔ| NAll participants:
Mean differences, Intent-to-treat sample 45.10 61.29 16.19 2.51 270
PSS3 participants only:
Mean differences, Intent-to-treat sample 43.28 64.06 20.78 2.80 204
PSS3 participants classes of 1999 & 2000 only:
Mean differences, Intent-to-treat sample 38.34 58.62 20.28 1.81 90
PSS3 participants classes of 1998 & 2001 only:
Mean differences, Intent-to-treat sample 47.37 68.57 21.20 2.14 114
Notes: The intent-to-treat and weighted samples differ with respect to the composition of the control group. In particular, in the intent-to-treat sample, the control group contains all applicants who lost the lottery the first time they applied, regardless of whether they went on to win the lottery at a future date. In contrast, the weighted sample excludes applicants that eventually won a PSS lottery and overweights losing reapplicants to account for sample selection that arises from excluding a non-random subset of original losers.

32
Table 8: Fraction of PSS3 participants taking clerkships after graduation
Control Treatment Δ |tΔ| N
All PSS3 participants:
Mean differences, Intent-to-treat sample 25.60 37.50 11.90 1.66 204
PSS3 participants classes of 1999 & 2000 only:
Mean differences, Intent-to-treat sample 20.22 41.37 21.55 1.99 90
PSS3 participants classes of 1998 & 2001 only:
Mean differences, Intent-to-treat sample 30.05 34.29 4.24 0.43 114
Notes: Only clerkships taken immediately after graduation considered here. The intent-to-treat and weighted samples differ with respect to the composition of the control group. In particular, in the intent-to-treat sample, the control group contains all applicants who lost the lottery the first time they applied, regardless of whether they went on to win the lottery at a future date. In contrast, the weighted sample excludes applicants that eventually won a PSS lottery and overweights losing reapplicants to account for sample selection that arises from excluding a non-random subset of original losers.

33
Table 9: Effect of student debt on public interest job, Instrumental variables estimates
Control Treatment Δ |tΔ| NStudent loans I
1. Effect of winning lottery (mean differences in debt) $86,112.60 $56,077.29 $30,035.31 5.64 204
2 Effect of $10,000 debt on public interest law (IV estimate) -0.059 2.13 204
Student Loans II
3. Effect of winning lottery (mean differences in debt) $92,900.81 $62,111.79 $30,789.02 6.43 190
4. Effect of $10,000 debt on public interest law (IV estimate) -0.066 2.54 190
Total law school debt
5. Effect of winning lottery (mean differences in debt) $102,067.50 $73,079.86 $28,987.64 5.60 204
6. Effect of $10,000 debt on public interest law (IV estimate) -0.061 2.25 204
Notes: PSS3 sample only. In all three IV regressions, debt instrumented with PSS3 lottery assignment. Student loans 1 includes loans procured through NYU office of financial aid (OFA) only, missing observations assumed to be 0. Student loans II also equal to loans procured through OFA, but treats missing OFA data as 0 values only if zero reported debt in exit survey or student absent from exit survey database and zero reported debt in entry survey. Total law school debt is equal to amount of debt reported by students in exit survey, unless: (1) exit survey debt lower than OFA debt; (2) Student has missing exit survey data. In the first case, total debt equal to OFA debt. In second case, total debt equals OFA debt unless anticipated debt reported in entrance survey exceeds debt reported by OFA (including cases in which OFA data are missing), and student is not an eventual lottery winner.

34
Table 10: OLS Regression of mean starting salary
PSS [treatment] 3401.51 1919.11 1844.4(1867.80)* (2599.52) (2685.81)
Private sector 84,161.63 84221.1 85065.9(3315.25)*** (3293.87)*** (3483.92)***
(PSS [treatment]) * Private sector 5644.6 4967.08 3643.76(8017.87) (8140.97 (9200.17)
Clerkship 7556.57 7090.62(3715.04)** (3721.98)*
(PSS [treatment]) * Clerkship 3150.1 3724.2(7046.52) (7834.82)
Third year GPA 240.51(1857.22)
N 230 230 230
Starting salary of first job
Notes: ** denotes significance of correlation coefficient at 5% level; * denotes significance at 10% level. First job is annual starting salary of first non-clerk job after graduation. Third year GPA is averaged across fall and spring semesters unless no data are available from one semester.

35
Table 11: Law school experiences
N Control Treatment |tΔ|GPA Year 1 165/82 3.184 3.193 -0.009 0.00GPA Year 2 168/86 3.382 3.392 -0.010 0.07GPA Year 3 167/86 3.361 3.475 -0.114 1.93
Change in importance of salary 141/75 -0.449 0.503 -0.952 2.52Change in importance of benefits 141/75 -1.234 -0.192 -1.042 2.72
Change in importance of social contribution 141/75 -1.257 -1.612 0.355 0.62Public interest job summer 1 177/93 0.696 0.641 0.055 0.87Public interest job summer 2 177/93 0.437 0.406 0.031 0.37
Class of 1998 only:Journal 59/25 0.594 0.600 -0.006 0.05
Moot court 59/25 0.250 0.240 0.010 0.09Clinical credits 59/25 10.32 8.120 2.200 1.28
Notes: Late applicants and PSS3 participants in classes of 1998 and 2001 only (unselected sample). GPA in each year is average of fall and spring semesters. Change in preferences only available for students who participated in both the entrance and exit surveys. In both surveys, students were asked to rank 15 job attributes in order of importance. Since all students ranked at least 5 attributes, only rankings 1-5 were considered and attributes that were unranked or ranked greater than five were assigned zero value. Hence all attributes are given a value between 0 and 5. Summer work experiences based on reports for all students from the office of career services (OCS). Since students' summer salaries in public interest job are paid by NYU, we assume that any student not in the OCS database did not take a public interest job.

36
Appendix A: Law School Loan Repayment Programs
Total LRAP Funds Disbursed (1998-99)
Yale Law School $1,369,061
New York University Law School $1,091,579
Harvard Law School $1,069,081
Columbia University School of Law $748,179
Stanford University Law School $546,148
Georgetown University Law Center $511,034
Source: “Financing the Future: NAPIL’s 2000 Report on Law School Loan Repayment Assistance and Public Interest Scholarship Programs,” NAPIL(2002)
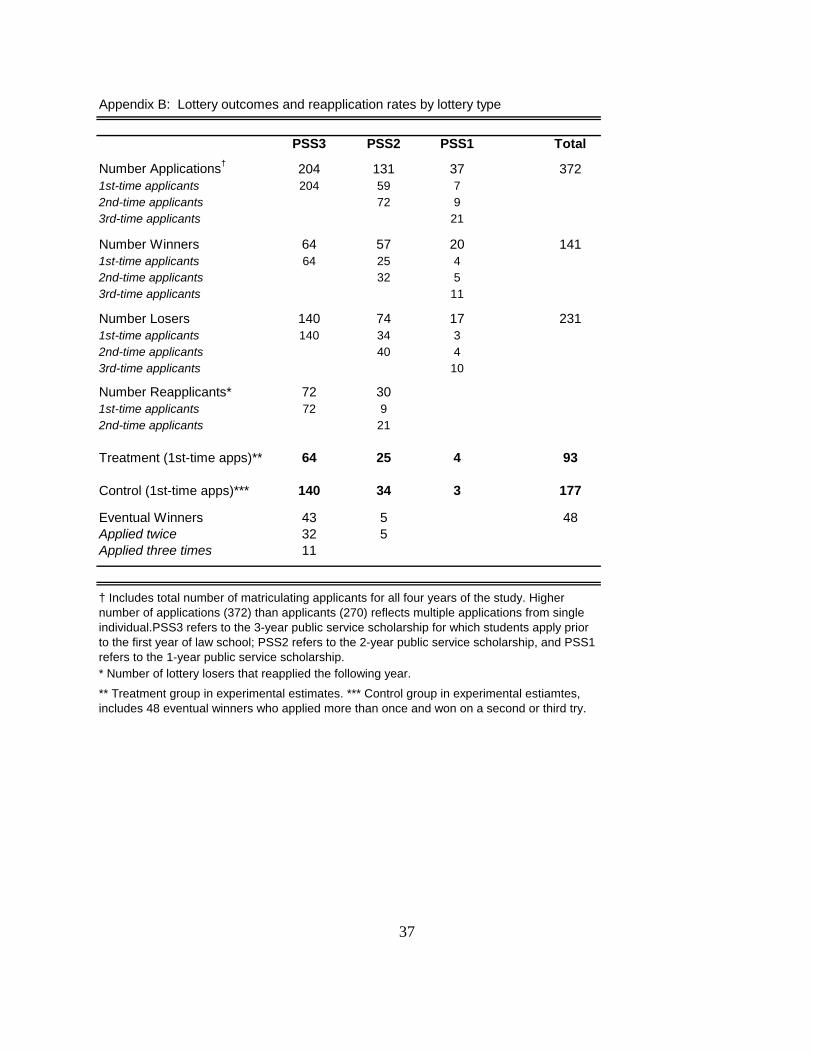
37
Appendix B: Lottery outcomes and reapplication rates by lottery type
PSS3 PSS2 PSS1 Total
Number Applications† 204 131 37 3721st-time applicants 204 59 72nd-time applicants 72 93rd-time applicants 21
Number Winners 64 57 20 1411st-time applicants 64 25 42nd-time applicants 32 53rd-time applicants 11
Number Losers 140 74 17 2311st-time applicants 140 34 32nd-time applicants 40 43rd-time applicants 10
Number Reapplicants* 72 301st-time applicants 72 92nd-time applicants 21
Treatment (1st-time apps)** 64 25 4 93
Control (1st-time apps)*** 140 34 3 177
Eventual Winners 43 5 48Applied twice 32 5Applied three times 11
* Number of lottery losers that reapplied the following year.
† Includes total number of matriculating applicants for all four years of the study. Higher number of applications (372) than applicants (270) reflects multiple applications from single individual.PSS3 refers to the 3-year public service scholarship for which students apply prior to the first year of law school; PSS2 refers to the 2-year public service scholarship, and PSS1 refers to the 1-year public service scholarship.
** Treatment group in experimental estimates. *** Control group in experimental estiamtes, includes 48 eventual winners who applied more than once and won on a second or third try.