nber working paper series 401(k) matching … · nber working paper series 401(k) matching...
TRANSCRIPT
NBER WORKING PAPER SERIES
401(k) MATCHING CONTRIBUTIONS IN COMPANY STOCK:COSTS AND BENEFITS FOR FIRMS AND WORKERS
Jeffrey R. BrownNellie Liang
Scott Weisbenner
Working Paper 10419http://www.nber.org/papers/w10419
NATIONAL BUREAU OF ECONOMIC RESEARCH1050 Massachusetts Avenue
Cambridge, MA 02138April 2004
The views expressed in this paper are those of the authors and not necessarily those of the Federal ReserveBoard. We thank Eric Richards, Thomas McAndrews, and Aldo Rosas for exceptional research assistance,and Annika Sunden and Alicia Munnell for providing the age-earnings profiles used in this paper. We alsothank Bill Even, David Laibson, Olivia Mitchell, Steve Utkus and seminar participants at the University ofIllinois and the Federal Reserve Board for their comments and constructive suggestions. The views expressedherein are those of the author(s) and not necessarily those of the National Bureau of Economic Research.
©2004 by Jeffrey R. Brown, Nellie Liang, and Scott Weisbenner. All rights reserved. Short sections of text,not to exceed two paragraphs, may be quoted without explicit permission provided that full credit, including© notice, is given to the source.
401(k) Matching Contributions in Company Stock: Costs and Benefits for Firms and WorkersJeffrey R. Brown, Nellie Liang, and Scott WeisbennerNBER Working Paper No. 10419April 2004JEL No. G11, J30, J32
ABSTRACT
This paper examines why some employers provide matching contributions to 401(k) plans in
company stock and explores the implications of match policy for employee retirement wealth.
Unlike stock option grants to non-executives, a firm's decision to match in company stock does not
appear to be strongly correlated with cash flow or with measures of the benefits of aligning
incentives of employees and employers. Rather, we find evidence that firms are more likely to
provide the match in company stock if firm risk is low (i.e. lower stock price volatility and lower
bankruptcy risk) and employees are also covered by a defined benefit plan. These findings suggest
that firms consider the retirement security of their workers in making the match decision, either
because firms want to minimize the risk of violating their fiduciary responsibility or because
employees more fully value company stock at companies with lower firm-specific risk. Evidence
also indicates that firms may want to match in company stock to boost employee ownership, perhaps
to help deter takeovers, or because of the tax advantages for dividends on the company stock match.
Simulation results suggest that sufficiently risk-tolerant individuals actually prefer a 401(k) plan at
a company with a company stock match to a plan at a company with an unrestricted match, unless
the equity premium is reduced substantially.
Jeffrey R. Brown340 Wohlers HallUniversity of Illinois at UrbanaChampaignChampaign, IL 61820and [email protected]
Nellie LiangFederal Reserve Board20th and Constitution Ave NWWashington, DC [email protected]
Scott Weisbenner340 Wohlers HallUniversity of Illinois at UrbanaChampaignChampaign, IL 61820and [email protected]

1
I. Introduction
Company stock in 401(k) plans has been the subject of intense scrutiny by policy makers
over the past several years. In the wake of high profile corporate bankruptcies for companies
that had a large fraction of 401(k) plan assets invested in company stock, numerous lawmakers
began calling for new regulations and restrictions on company stock ownership in 401(k) plans.1
In part motivated by these events, a growing number of academic papers have begun to examine
assets in 401(k) plans in general, and the effects of employer match policy in particular. Recent
research papers have examined the relative adequacy of retirement wealth for defined benefit
versus defined contribution plans (Samwick and Skinner, 2003; Even and McPherson, 2003a),
the importance of plan design and employee inertia (Choi, Laibson, Madrian, and Metrick, 2001;
Agnew, Balduzzi, and Sunden, 2003), the effect of 401(k) match policy on employee purchases
of company stock (Bernartzi 2001; Liang and Weisbenner, 2002), and the role of company stock
in 401(k) portfolios (Mitchell and Utkus, 2004; VanderHei, 2002).
Notably absent from this literature is an understanding of why companies choose to
provide their match in company stock in the first place.2 After all, standard portfolio theory
suggests that there are potentially large welfare costs to forcing employees to hold part of their
portfolio in company stock (Meulbroek, 2002). Presumably, there must be some benefits of
providing a match in company stock to offset these potential welfare costs, or else profit-
maximizing companies would not compensate their employees in a form that may not be valued
fully. Indeed, there are a number of potential benefits to a firm from providing a match in
company stock. Specifically, a match in company stock has lower expenses than other
investment options, can free up cash for other uses, boosts employee ownership, and potentially
reduces corporate taxes if the firm pays dividends. Firms that match in company stock may also
be those where the cost to employees of being concentrated in company stock is the lowest. That
is, the costs of matching in company stock could be lower at firms that also provide other
retirement benefits or have lower stock price volatility. We test these alternative hypotheses,
1 For example, Senators Boxer and Corzine introduced legislation that would place a 20 percent cap on the share of 401(k) plan balances that could be invested in company stock. (http://www.kcstar.com/item/pages/business.pat,business/3acd380f.c18,.html) 2 In a paper written concurrently with this one, Even and Macpherson (2003b) examine why company stock is held in defined contribution plans, but do not specifically focus on match policy. Our study focuses on why, conditional on offering company stock as an investment option, firms decide to offer a match in company stock. Most large publicly-traded corporations offer company stock as an investment option while approximately one-third require that the match be held in company stock (Profit Sharing / 401(k) Council of America, 2002).

2
providing the first evidence of how a company’s decision to provide its match in company stock
or to offer an unrestricted match is affected by company characteristics.
Using a sample of all publicly traded companies that filed an 11-k statement from 1994 to
2001,3 we find little evidence that firms provide the employer match in company stock because
of cash flow constraints or to increase employee ownership to better align incentives. This is in
contrast to the literature on stock options to non-executive employees, which finds that these
factors are important determinants of options grants (Core and Guay, 2001).
Instead, we find that less risky firms, in terms of lower stock price volatility and a lower
expected bankruptcy rate, are more likely to provide the employer match in company stock. In
addition, we find that firms that have a defined benefit plan are significantly more likely to
provide the match in company stock, particularly if the match is small relative to employee
contributions and hence employer contributions to the 401(k) plan are a less important source of
wealth for employees. These findings suggest that firms do take into account the effect of match
policy on the retirement security of plan participants, either because firms want to minimize the
chance of being considered in violation of their fiduciary responsibility under the Employee
Retirement Income Security Act (ERISA) or because employees at these firms more fully value
company stock because of the lower firm-specific risk. Our results also suggest that some firms
may match in company stock to put stock in “friendly hands” to help thwart takeovers. Firms
with multiple classes of stock, which confer superior voting rights on management, are less
likely to match with company stock, consistent with Rauh (2003) who found that state takeover
laws and the company stock holdings in defined contribution (DC) plans of companies
incorporated in those states are substitutes. In addition, we find that the likelihood of an
employer match in company stock increases with the dividend yield, likely because of the tax
benefit associated with dividends paid on stock in leveraged ESOP plans.4 However, the relation
with dividends is not robust.
We then confirm the findings of prior work concerning the effect of the 401(k) match on
participant behavior. Consistent with past research (Benartzi, 2001; Liang and Weisbenner,
3 An 11-k statement is an annual report of a firm’s defined contribution plan that details changes in plan assets over the past year such as employee and employer contributions to the various investment options. See Section II for a further description. 4 The firm is allowed to deduct dividends paid on stock contributed to leveraged ESOP plans from taxable income. The match component of a defined contribution plan can be converted to a leveraged ESOP to reap this tax deduction for dividends.

3
2002), we show that having an employer match in company stock leads employees to increase
their own purchases of company stock, resulting in even more concentrated holdings. This
finding has been attributed to a match in company stock being interpreted by employees as
implicit investment advice that company stock is a good investment. Further, we document that
about two-fifths of this boost in company stock purchases comes from a reduction in
contributions to the safest, lowest-return asset in the plan, typically a money market fund.
Using our data on firm characteristics and the effect of employer match on employee
behavior, we then present simulations of the expected distribution of 401(k) account balances at
retirement in order to assess the effect of an employer match in company stock on participant
retirement security. We present a number of alternative simulations to capture both the direct
effect of the match (i.e., the entire match is made in company stock) and the indirect effects of
the match (e.g., individuals contribute more of their own contribution to company stock when the
match is in company stock). Rather than imposing a strictly optimal portfolio selection, we
parameterize the simulations to reflect the available evidence on how 401(k) plan participants
actually behave. In particular, we assume an “average” participant follows a naïve 1/n
diversification heuristic when choosing own contribution allocations (Benartzi and Thaler, 2001;
Liang and Weisbenner, 2002), boosts own allocations to company stock in response to a match
in company stock (Benartzi, 2001; Liang and Weisbenner, 2002), and rarely rebalances assets
(Samuelson and Zeckhauser, 1988; Ameriks and Zeldes, 2001), which leads to a greater share of
assets in equities in company stock match portfolios. These parameterizations result in an asset
composition of the simulated contributions and account balances that correspond well to
observed 401(k) plans. In later simulations, we consider the desirability of a match in company
stock for participants that would otherwise invest all of their own contributions in only one asset.
The simulations demonstrate the dual effect of matching in company stock, namely an
increase in the mean account balance and an increase in the variance of its distribution. Perhaps
surprisingly, the simulated account balances for participants at retirement age indicate that given
the historical equity premium, sufficiently risk-tolerant participants would prefer a plan that
offers a company stock match to a plan that offers an unrestricted match. This preference
increases with the amount of other uncorrelated wealth (e.g., Social Security, home equity, etc.).
The preference for a plan at a firm with a company stock match rather than at a firm with
a choice match primarily reflects two factors. First, firms that match with company stock have

4
lower stock price volatility and lower bankruptcy risk than firms with a choice match. Second,
given participant behavior, the effect of a match in company stock is to increase the share of
assets held in equities and reduce the share in lower-yielding and lower-risk fixed-income
securities (e.g., money market funds and long-term bonds). Naturally, the assumed equity
premium plays a key role in assessing the preference for a match in company stock. Imposing a
four-percentage point reduction in the equity premium, i.e., cutting the historical premium in
half, significantly reduces the risk aversion level at which participants would prefer the
distribution of outcomes under a company stock match to an unrestricted match.
A company stock match is also generally preferred to an unrestricted match if
participants do not diversify their own contributions (i.e., do not adopt the 1/n strategy). For
example, when the match is in company stock, participants who would otherwise concentrate
their own and their employer’s contributions in a fixed-income security (e.g., stick with the
default investment option which is typically a money market fund) obtain equity exposure and
gain from diversification that they would otherwise not receive. On the other hand, if
participants would otherwise concentrate their investments in a small-cap equity fund, then the
company stock match has little to offer in terms of higher expected returns from additional
exposure to equities but exposes the individual to more idiosyncratic risk. In this case, the
distribution of account balances is less favorable to the company stock match.
These simulations provide several interesting insights into the effect of a company stock
match on retirement wealth. Although we find that one reason for the desirability of a company
stock match is the greater holdings of equities that results, this finding is not meant to suggest
that matching with company stock is the best way to increase 401(k) participants’ exposure to
equities. That is, the company stock match does not yield a mean-variance efficient portfolio.
Rather, it improves a participant’s distribution of retirement wealth if his portfolio otherwise
would have had too little invested in stock, either because he followed a 1/n investment rule or
because he concentrated his investments in a single fixed-income security. Neither do our results
indicate that workers would want firms that currently provide an unrestricted match to switch to
requiring that employer contributions be in company stock. Indeed, the significantly higher risk
of firms that offer an unrestricted match would substantially increase the variance of account
balances if these firms were to switch match policy, and only the most risk-tolerant employees
would be better off from such a change. Overall, the results of our simulations suggest that the

5
preference for a plan at a company that matches with company stock depends importantly on the
lower risk of firms that provide such a match. Further, since firms do not have incentives to
guide participants to equities other than company stock, the equity exposure obtained through a
company stock match, while inefficient, may be better than the alternative asset composition
under a choice match, particularly if participants stick with low-yielding default investment
options (Choi, Laibson, Madrian, and Metrick, 2001).
The paper proceeds as follows. In Section II, we provide further details on the data.
Section III presents our empirical analysis of employer match policy. Section IV traces the
effect of employer match policy on employee behavior. We provide simulation results in
Section V. Section VI concludes and discusses policy implications.
II. Data and Sample Characteristics
Our primary data source is the 11-k form filed with the SEC by 401(k) plans for which
the option to invest in company stock is deemed an offering of securities. From these filings we
collect total participant contributions, participant contributions to company stock, participant
contributions to money market funds or GICs, the employer’s match policy (i.e., are employer
contributions restricted to company stock), total employer contributions, employer contributions
in company stock, total plan assets, total company stock holdings, and the number of investment
alternatives. For the few firms with multiple plans, we collect data for the largest plan.
Starting with all U.S. firms listed in Compustat any year from 1993 to 1999, we identify
firms that filed an 11-k at least once during 1994 to 2001.5 We were able to hand-collect data for
946 companies that offered a match to employee contributions, yielding 3,179 firm-year
observations. As reported in table 1, most of the data are in the period 1993 to 1998, with the
largest number of firms, 635, in 1998. On average, there are 3.4 observations per firm, with 42
percent of the firms with 2 observations or less and 58 percent of the firms with 3 or more
observations. The information provided on the 11-k is in accordance with ERISA reporting
guidelines. In 1999, there was a change in ERISA reporting requirements that led to fewer
companies reporting contributions by asset category, leaving us with contribution data for far
fewer plans in 1999 and 2000 than in 1998.
5 11-k filings are available on the SEC’s Edgar website starting in 1994. The 1994 filing reports plan activity during 1993. Some firms will report not only plan activity during the past year, but plan activity over the past three years. Thus, we have 174 observations in 1992 and 49 observations in 1991.

6
Information on stock prices and return variance are from the Center for Research in
Security Prices (CRSP) database. Other firm financial data, including market-to-book ratios,
assets, employees, debt ratings, dividends, and cash flow (operating income before depreciation)
are from Compustat. Details on defined benefit plans are from Department of Labor (DOL)
5500 data and Compustat.
To characterize our sample, we focus on firms in the sample in 1998, one of the more
recent years with the largest number of firms. As shown in table 2a, about one-half of the
sample was a member of the S&P 1500 during 1998.6 Thus, the typical firm in our sample is
smaller, measured by both market value and employees, than the typical S&P 1500 firm, but is
larger than the average of all public companies, as available from Compustat. The sample
represents a broad cross-section of industries. As noted in the table, 15 percent of the sample is
in the technology sector, somewhat less than the overall market.
Companies that issue shares for their retirement plan, rather than purchase shares on the
open market, are required to file an 11-k. This raises the possibility that the sample could be
biased toward firms that do not repurchase stock. While data on plans that exclusively buy
shares on the open market for the plan are not publicly available, we are able to document that
repurchase activity by firms in our sample does not differ from that at other publicly-traded
firms.7 Specifically, we find that roughly half of the firms in the sample repurchased stock in
1998 (just evidently not in conjunction with their retirement plan), and as shown in the bottom
row of table 2a, the share repurchase yield (an estimate of the fraction of shares repurchased) for
the sample was 1.8 percent in 1998, similar to the yield for the S&P 1500 and all firms.
We also compare our sample of plans to those at publicly-traded firms as reported on
Form 5500 filed with the DOL.8 In the aggregate, for our sample of the largest plans at 635
companies in 1998, total plan assets were $264 billion, representing 38 percent of the $698
billion in plan assets at all publicly-traded companies (table 2b). Total contributions by
participant and company for our sample totaled $15.2 billion, just over 30 percent of the $49.2
billion for publicly traded firms. Estimates from the DOL for 1998 for all US companies, public 6 The S&P 1500 consists of the 1500 stocks that comprise the S&P 500 index, the S&P 400 MidCap index, and the S&P 600 SmallCap index. 7 In the uncommon event that the plan does not allow employees to purchase stock but does provide the employer match in company stock , it would generally not be deemed an offer of securities, and the plan would not be required to file. In our discussion with SEC staff, the onus is on the company to determine whether it needs to file an 11-k. 8 Publicly-traded companies in the DOL Form 5500 data set were identified by whether they had a CUSIP, and by matching EINs with those in Compustat.

7
and private, are $1.54 trillion in assets and $135 billion in contributions.
For our sample of 635 companies in 1998, company stock totaled $97 billion,
representing 37 percent of plan assets. One-third of total participant and employer contributions
were allocated to company stock (employees in aggregate contributed one-quarter of participant
contributions to company stock). The DOL 5500 data indicate that at public companies, the
share of defined contribution plan assets held in company stock was 39 percent, similar to the
share for our sample. Thus, our sample represents two-fifths of 401(k)-type plan assets at all
publicly traded companies in 1998, and the fraction of assets invested in company stock is
similar to that of all publicly traded companies.
III. Empirical Analysis of Employer Match Policy
A. Summary Statistics Regarding the Employer Match in Company Stock
As noted in the first row of table 3, 39.3 percent of the 3,179 firm-year observations
required that the entire employer match be in company stock, comparable to the one-third
reported by the Profit Sharing / 401(k) Council of America (2002).9 Such a requirement has
substantial consequences because, for a typical employee who contributes six percent of salary
and receives a match of $0.50 per dollar up to this limit, the match would account for one-third
of the total (employee plus employer) contributions. However, match policy has an even larger
effect because employees respond to a match in company stock by boosting their own voluntary
purchases, perhaps because they interpret the employer match as implicit investment advice that
company stock is a good investment. Rows 2 through 8 of table 3 assess the effect of match
policy upon the concentration of company stock holdings in 401(k) plans.
In row 2 of table 3, we show that, in our sample, participants at firms with the employer
match in company stock allocated 9.5 percentage points more of their own contributions to
company stock. Thus, after factoring in the match, participants at firms with a company stock
match had on average 45.5 percent of their total annual contributions being invested in company
stock, compared to 17 percent at firms with an unrestricted match (row 3). This large share of
contributions allocated to company stock is not simply because of the match requirement, as
required purchases of company stock at these companies are on average 28 percent of total
9 Firms rarely change their match policy, as only 41 of 946 firms switched from an all company stock match to an unrestricted match or vice versa during the sample period.

8
annual contributions, or only three-fifths of the observed company stock purchases.10 The
annual contributions appear to translate into similarly-concentrated asset holdings: as shown in
row 5, the percent of plan assets held in company stock averaged 42 percent at firms that
matched in company stock, versus 18 percent at firms with an unrestricted match.
In addition, the size of the employer match relative to employee contributions does not
differ substantially across firms by match policy. In row 6 of table 3, we see that the ratio of
employer to employee contributions averages 46 percent at firms that match in company stock,
and 53 percent at firms with an unrestricted match, but the difference is not significant. Median
ratios show a similar pattern, 37 and 40 percent respectively, with the difference significant but
not large.
Rows 7 and 8 show that, as expected, firms that match in company stock have a
significantly higher fraction of their total outstanding shares held inside the 401(k) plan. The
amount of company stock held inside the 401(k) plan at company stock match firms averaged 4.5
percent, exceeding that for choice match firms by 2.9 percentage points. The annual purchase of
company stock via employee and employer contributions represented nearly 0.6 percent of the
shares of company stock match firms. Within 401(k) plans of firms that match in company
stock, the number of shares held in the plans is comparable to the number of outstanding
employee stock options held by non-executives, as reported in Core and Guay (2001) and Liang
and Weisbenner (2001). This suggests that when studying stock-based compensation to lower-
level employees, incorporating stock received through the pension plan could be important.
The difference in the amount of stock held in 401(k) plans across match policy is of
sufficient magnitude to help deter hostile takeover attempts. Shivdasani (1993) finds that the
probability of a hostile takeover is significantly lower when a greater share of stock is held by
affiliated stockholders (i.e., family trusts, company retirement plans, etc.); differences in
ownership of affiliated holders amounted to four percentage points, 3.2 percent at firms that
received a hostile takeover bid compared to 7.3 percent at firms that were not subject to a bid.
In row 9 we see that firms that offer a company stock match also tend to offer, on
average, one fewer investment option to their plan participants. To the extent that participants
10 The percent of total contributions required to be in company stock is non-zero for some firms that offer an employer 401(k) match with choice because in addition to the unrestricted 401(k) plan, these firms may also have a small profit sharing plan that when triggered (e.g., company profit targets are met) provides the employee with company stock. Less than 10 percent of choice match firms offer such an additional plan.

9
follow naïve diversification rules (i.e., follow “1/n” behavior), this would lead to a greater
investment of employee contributions in company stock.
In rows 10 though 15, we provide data on the number of participants in the plans, as well
as the size of account balances and the amount of contributions per participant. Data on the
number of plan participants was collected by matching the 11-k sample with the DOL 5500
forms. We were able to obtain participant data for 906 of the 1232 plans for 1997 and 1998.
The plans that match in company stock are typically larger than those that offer an unrestricted
match, as measured by the number of participants (row 10), with the fraction of total firm-wide
employees covered by the 401(k) plan averaging about two-thirds for both types of firms (row
11). Total employee contributions per participant are roughly $300 per year higher at firms that
match in company stock relative to those that do not (average employee contributions of $3100
and $2800, respectively, row 12), while the employer contributions are roughly the same (row
13). Average account balances per participant at company stock match firms are significantly
greater than balances at choice match firms ($60,600 and $43,220, respectively, row 14), and
company stock holdings are higher by nearly $20,000 at company stock match firms (row 15).
B. The Costs and Benefits of Offering a Match in Company Stock
The decision by a firm to provide a match in company stock involves a tradeoff between
a number of costs and benefits. There are two related reasons that providing a match in company
stock may be costly for a firm. First, elementary portfolio theory makes it clear that an
optimizing agent should prefer a diversified portfolio to one that is highly concentrated in a
single asset. Rational employees would recognize that a match in company stock substantially
increases the concentration of assets and therefore the volatility of their future retirement wealth
and, as a result, would value a match in company stock less than a match in cash, which allows
them to diversify their portfolio.11 If the company stock match is not fully valued, companies
might need to provide a larger match than if it were made in cash or increase other
compensation. Second, firms might be concerned that in the case of poor stock price
performance, the plan sponsor could be considered by the courts to be in violation of their
11 It is worth noting that there are some tax advantages to employees for holding company stock versus other stock in 401(k) plans (Iwry, 2003). Company stock withdrawn from a 401(k) plan is not taxed until the stock is sold, and then at long-term capital gains rates. In contrast, other stock holdings are taxed at typically higher ordinary income tax rates at withdrawal.
10
fiduciary responsibilities if they had provided a match in company stock.12
To the extent that these potential costs are important to the firm, one might expect that
less risky firms (i.e., lower stock price volatility and/or a lower bankruptcy rate) would be more
likely to match with company stock because the additional risk imposed on workers is lower. In
addition, a firm might not be as concerned about these costs if it also provides other retirement
benefits, such as a defined benefit (DB) plan, which reduces the importance of 401(k) plan assets
for financial security. In particular, the presence of a DB plan means that the 401(k) plan
participants also have an additional asset that is largely uncorrelated with company stock
performance, because DB plans are prohibited by ERISA to have more than ten percent of plan
assets invested in company stock. In addition, DB plans, unlike 401(k) plans, are insured by the
Pension Benefit Guaranty Corporation (PBGC). While the benefits from DB plans are at some
risk if the company fails because of the fact that DB benefits are back-loaded and the PBGC is
responsible for obligations incurred only up to the time at which the firm fails, the provision of
these benefits mitigates the risk to retirement wealth from a high concentration in company
stock.13 Thus, firms that provide DB plans, as well as firms that have less risky stock, may feel
less constrained in providing the employer match in company stock.
Firms must trade off these costs with several potential benefits to the firm from providing
the employer match to 401(k) plans in company stock. A direct benefit that all firms would
achieve is a cost reduction, because administrative fees for company stock are negligible and
considerably less than fees associated with providing other investment options, such as equity
and bond mutual funds. There are also other potential benefits to matching in company stock
that likely vary across firms, which we now discuss.
First, it may be cheaper for a firm to issue stock to fund its 401(k) match than to raise
funds from outside investors to provide an unrestricted match, perhaps because of asymmetric
information (Myers and Majluf, 1984). This argument would predict that firms with less excess
cash flow and greater asymmetric information would be more likely to offer a match in company
stock, consistent with the use of stock options (Core and Guay, 2001). Low cash flow firms may
also be more likely to match in company stock because of less ability to raise funds via debt. 12 Section 404(c) of ERISA generally relieves employers from liability for fiduciary error when the employer permits participants to exercise control over their retirement plan accounts. If a firm requires the match to be in company stock, however, the safe harbor provisions may no longer apply (Purcell, 2002). 13 There is also a statutory limit on the amount of benefits that the PBGC can guarantee. For plans with a 2004 termination date, the maximum guarantee is just under $45,000 annually for a single life annuity at age 65.

11
Second, for firms that pay dividends, there is a tax advantage to firms that match in
company stock. Any contribution to a 401(k) plan, whether paid in cash or in company stock, is
initially deductible from corporate income taxes. However, by making the contribution in the
form of company stock, a dividend paying firm may be able to “double dip” by receiving a future
tax deduction for all dividends paid on shares held within the plan in addition to the initial
deduction for the value of the shares themselves. Specifically, while dividends paid on stock are
not usually tax deductible, if firms contribute the employer match in company stock to a
leveraged employee stock ownership plan (ESOP), dividends paid on that stock to repay debt
may be tax-deductible (Beatty, 1995; Schultz and Francis, 2002; Iwry, 2003).14 Recent business
press cites that such tax savings may be significant for some firms (Schultz and Francis, 2002).
We test for the importance of this tax advantage by looking at whether a firm’s dividend policy
helps to explain the likelihood of a company stock match.
Third, a company stock match likely leads to a greater share of the firm being held by
employees. Recall that the average percent of total company stock held in the 401(k) plan was
three times higher for firms that match in company stock relative to those that do not (4.5 percent
and 1.6 percent, respectively). There are several potential advantages of this, including having
stock in “friendly hands” to help protect the firm from hostile takeovers (Rauh, 2003). We test
for this motive by examining whether firms that have multiple classes of stock, and thus already
have a mechanism to thwart takeovers or protect managerial wealth in a takeover (DeAngelo and
DeAngelo, 1985), are less likely to have a company stock match. Firms may also encourage or
mandate holdings of company stock because of the perceived benefits from aligning workers and
stakeholders’ interests (Jensen and Meckling, 1976; Demsetz and Lehn, 1985; Smith and Watts,
1992). Firms with greater monitoring difficulties, as measured by number of employees (Lazear,
1979 and 1983), or greater noise in the operating environment, as measured by idiosyncratic risk
(Demsetz and Lehn, 1985), might benefit more from aligning incentives. In addition, firms with
a larger value in growth opportunities and intangible assets may benefit more from employee
stock ownership due to the asymmetric information between insiders (i.e., employees) and
outside shareholders (Holmstrom and Milgrom, 1987). As applied to our question, their model
would predict that firms with higher market-to-book ratios would be more likely to offer a match
14 While this benefit is not likely to encourage dividend payments, since most stock is held outside of ESOP plans and so is subject to double taxation, the benefit could encourage companies that already pay dividends to provide a 401(k) employer match in company stock in order to qualify for this deduction.
12
in company stock (Smith and Watts, 1992).
C. Which Factors Matter? An Empirical Analysis of Match Policy
We are interested in determining empirically which of these potential costs and benefits
are most relevant to the firm’s decision about whether to offer their match in company stock
versus cash. In addition to the general academic interest of this question, knowing the relative
importance of these factors is crucial for guiding public policy in this area.
As shown in appendix table 1, firms that match in company stock generally have less
volatile stock prices and idiosyncratic risk and are considerably more likely to also sponsor a
defined benefit plan, have an investment-grade debt rating, pay dividends, and have multiple
classes of stock. To assess the quantitative importance of these factors and other firm
characteristics in explaining firm match policy, and thus disentangle the alternative hypotheses,
table 4 presents coefficient estimates from a regression of match policy upon these firm attributes
one at a time (columns 1 to 10).15 Because many of these firm characteristics are correlated
(appendix table 2), we then turn to a multivariate analysis (column 11 of table 4).
As shown in column 1, whether the firm already provides retirement benefits through a
defined benefit plan appears to be very important.16 The estimated effect is positive and large,
suggesting that firms that have a defined benefit plan are substantially more likely, by 22
percentage points, to require the match to be in company stock. To put the size of this effect in
perspective, recall that in the sample, 39 percent of firms require the match to be in company
stock. Our interpretation of this result is that the provision of retirement benefits through a DB
plan significantly mitigates the risk to employee retirement wealth of having 401(k) plan assets
concentrated in company stock. In addition, columns 2 and 3 show a significant negative
relationship between stock price volatility and the probability of matching in company stock,
also suggesting that employers consider the effect of match policy on employee retirement
wealth. Similarly, firms with an investment-grade bond rating, as gauged by Standard and
Poor’s, are 18 percentage points more likely to require the match in company stock (column 4).
We find no direct evidence that cash constraints are an important factor in setting
employer match policy (column 5), as there is no direct correlation between cash flow (i.e., 15 We estimate a linear regression to provide an easy-to-interpret estimate of the marginal effects of firm characteristics on the choice of match policy. A Probit model yields very similar results. 16 One could envision a scenario in which firms face the choice of offering a 401(k) plan with a match in employer stock or a defined benefit plan as alternative means to tie the worker to the firm. In our sample, however, DB plans have been in place for some time and so we are not concerned with potential endogeneity of the DB variable.

13
operating income before depreciation) and match policy. To explore this relationship further, we
split the sample into firms by whether cash flow is positive or negative, allowing the coefficient
on cash flow to vary across these two types of firms.17 For the small segment of the sample (3.5
percent) that has negative cash flow, we find that the probability of a match in company stock
increases as cash flow decreases (i.e., the coefficient is negative), suggesting some role for cash
constraints for a select minority of firms. However, because only a small portion of the sample
has negative cash flow, these results should be interpreted cautiously. Moreover, if cash flow is
positive, the coefficient estimate is positive, indicating that higher cash flow increases the
likelihood of a company stock match. The point estimates for these cash flow variables do not
change much when other firm attributes are added, with the coefficient for positive cash flow
firms remaining significantly positive. Ceteris paribus, more profitable firms matching with
company stock runs counter to what we would expect if companies matched with stock because
they were cash constrained and so had no other means to make a match.18
The tax-based motivation to match in company stock if dividends are paid appears to be
somewhat important. Coefficient estimates suggest that a one percentage point increase in the
dividend yield is associated with a 3.3 percentage point increase in the probability that a firm’s
match is all company stock (the sample average is 39 percent). This variable, however, is highly
correlated with measures of firm risk and the presence of a DB plan, and thus the estimate
becomes less precisely measured and actually flips sign once these other variables are included.
The evidence is mixed concerning motivations to boost employee ownership. The
market-to-book ratio, a proxy for the presence of growth opportunities and intangible assets, is
not significant, while the coefficient on log(employees) is only marginally significant on its own,
with the coefficient flipping signs in the multivariate specification. Thus, the desire to align
incentives and/or better monitor employees, as proxied for by these two variables, does not
appear to be important factors in explaining match policy.
Finally, the effect of multiple classes of stock is compelling, decreasing the probability of
a match by 17 percentage points. This result is consistent with the presence of multiple classes
17 We also examined excess cash flow (cash flow less capital expenditures) and found qualitatively similar results. 18 This is not to say that cash flow is not an important determinant of whether a firm offers a 401(k) plan or a match at all, but only that it is not an important determinant of the type of match that is provided. Surveys suggest that cash flow constraints are an important determinant of providing 401(k) benefits to employees (see Department of Labor, 2001), and studies have identified cash flow constraints as an important factor for terminating defined benefit pension plans (see e.g., Petersen, 1992).

14
of shares and boosting stock in “friendly hands” (i.e., through a company stock match) as being
substitutes in preventing unwanted takeover attempts. While the estimated effect of multiple
classes of stock is little changed, the coefficient loses significance in the multivariate regression
(p-value = 0.17).
Because these variables are highly correlated, as discussed earlier, some of these
variables lose significance when all firm characteristics are included simultaneously (column
11). This specification also includes dummy variables for whether the firm went public in the
1970s, 1980s, or 1990s (going public prior to the 1970s is the omitted category), and dummy
variables for the firm’s two-digit SIC industry classification (the sample spans 66 distinct two-
digit industries). The firm age variables are meant to control for differences in pension plan
policy that may depend upon a firm’s age or legacy effects (e.g., DB plans were far more
common 20 years ago, the accounting and tax treatment of ESOP plans has changed over time),
while the industry variables loosely control for differences in worker characteristics across
industries that may influence pension plan design. Only the presence of a DB plan, an
investment-grade rating, and to a lesser extent cash flow (but only for firms with positive cash
flow) remain significant once all the variables are included jointly (column 11). As suggested by
comparing the R2 from the individual regressions to the multivariate regression, the DB and
investment grade variables explain the bulk of the explained variation in match policy. The
increased likelihood of a match in company stock if the firm also has a DB plan is strikingly
robust (point estimate is 22.3 with no other firm attributes in the regression and 21.3 in the full
specification).19 On balance, the coefficients suggest that firms may be concerned about the risk
of company stock in retirement portfolios and provide the match in company stock only when
employees have a fall-back retirement plan or when the firm is less likely to experience financial
distress. It is also consistent with the idea that these firms may view themselves as having a
lower risk of being considered a poor fiduciary, and thus be more willing to restrict the employer
match to company stock.
In summary, our evidence suggests that companies are primarily trading off a greater
19 While the inclusion of the firm age and industry indicator variables does not affect the magnitude of the correlation between the presence of a DB plan and match policy, this is not to say that these variables do not have their own independent effects upon match policy. Both the firm age variables and the industry indicator variables are significant, with p-values of 0.09 and 0.00, respectively. For example, A firm that went public in the 1990s is 18.8 percentage point less likely to match with company stock than is a firm that went public in the 1970s or earlier, and firms in the telecommunications, utilities, and retail trade industries are more apt to match with company stock.
15
share of stock in friendly hands and perhaps the benefits of the dividend tax advantage with the
recognition that a lack of diversification may be costly to employees. Firms for which the
diversification costs to employees are low (i.e., those companies with low bankruptcy risk) and
firms that offer a DB plan are more likely to provide a company stock match. The implications
of the lower risk and other sources of retirement income for employee welfare are examined in
simulations of retirement wealth by match policy presented later in Section V.
D. Further Analysis of Effect of Defined Benefit Plans
Table 5 further explores one of our most robust findings, the role of the DB plan. The left
panel of table 5 documents that firms are more apt to match in company stock within their 401(k)
plan if they also offer a DB plan (column 1, which replicates column 1 of table 4), but even more
so if the match they are offering is less generous as measured by the ratio of employer to
employee contributions (columns 2 and 3). For example, among firms that offer a DB plan, as
the size of the match relative to employee contributions falls from 50 percent to 20 percent of
employee contributions, and thus the share of match contributions in retirement wealth declines,
the probability that the firm matches with company stock rises by about six percentage points.20
In contrast, the generosity of the match has no predictive power for match policy for firms that
do not offer a DB plan. Thus, firms are more apt to match in company stock if they both offer a
defined benefit pension and provide a less generous match, perhaps because firms take into
account the effect of match policy on the retirement security of plan participants, either due to a
lower risk of the plan sponsor being considered in violation if its fiduciary responsibility or due
to simple market forces (i.e., employees at riskier firms without DB plans are less likely to fully
value a match in company stock).
One concern about the interpretation of the DB coefficient is whether the same
employees are covered by both the DB and the 401(k) plan, or if DB benefits apply only to an
earlier cohort of workers, while more recent hires are limited to participation in the 401(k) plan.
Fortunately, in our sample of firms, DB benefits appear to apply largely to the same set of
employees as those that contribute to 401(k) plans. While there are no data available from the
11-k, 5500 form, or Compustat to establish the fraction of employees that are covered by both
types of plans, other data strongly suggest that it is the case. In the aggregate, data from the 1998
Survey of Consumer Finances indicate that of the roughly 40 million households with a member
20 In the sample, the interquartile range for the ratio of employer to employee contributions is 0.28 to 0.58.
16
that works at a firm with more than 500 employees and that is covered by a defined benefit plan,
62 percent of these workers also participate in a defined contribution (DC) plan. Data from the
DOL 5500 data present roughly the same picture – 69 percent of wage and salary workers that
were covered by a DB plan also were covered by a DC plan in 1998.21
In the right panel of table 5 we focus attention on the subsample of firms over 1997 and
1998 that offer broad-based plans where it is likely that workers are covered both by a DC and
DB plan, if the firm offers both. To construct this sample, we first obtain the number of plan
participants from the DOL 5500 form and then compare this number with the number of total
employees from Compustat. If the number of participants in the DC plan and, in the cases when
it is offered as well, DB plan total at least 50 percent of total firm employees, then we define the
plan to be broad-based, and include the firm in the regression.22 Relative to the results for the
full sample (table 5, left panel), the estimated effect of the presence of a defined benefit plan
remains highly significant, with the point estimates little changed. The results obtained with this
subsample of firms with broad-based plans support the conclusion that firms are more likely to
match in company stock when workers have alternative wealth in DB benefits.
E. Survey Evidence on Costs and Benefits of Match Policy
The Vanguard Group (2003) conducted a survey of 76 firms to ascertain employer
attitudes toward company stock in 401(k) plans. The firms were asked whether they agreed or
disagreed with various statements concerning potential costs and benefits of matching with
company stock in 401(k) plans. Table 6 presents the results of the survey, with responses broken
down by whether the firm actually matches with company stock or allows choice. The results of
the survey are quite striking and are very consistent with our empirical findings. Employers
seem to divide into two camps in terms of their beliefs regarding the costs and benefits of a
match in company stock. Those that match in company stock feel less concern for the reduction
in diversification for participant accounts and feel there is less risk that a match in company
stock will be deemed a breach of fiduciary responsibility and result in a lawsuit. These survey
responses are in keeping with the empirical findings that firms that match with company stock
are more apt to provide other sources of retirement income (i.e., a DB plan) and have lower stock
price volatility and bankruptcy risk. 21 Calculations from Table E4b, Private Pension Plan Bulletin, US DOL, Winter 2001-2002. 22 The 50 percent threshold is selected to assure there will be an overlap between workers covered by the DC plan and those covered by the DB plan. Regressions estimated with higher thresholds yield similar results.
17
On the benefits side, those that match with company stock are significantly more apt to
view having stock in friendly hands and promoting employee stock ownership as important
reasons for a company stock match. The first survey response is consistent with our empirical
result that the presence of multiple classes of shares and boosting stock in “friendly hands” (i.e.,
through a company stock match) are substitutes. However, we do not find empirical support for
the notion that employers match in company stock because the company realizes benefits from
greater employee stock ownership. Indeed, the Vanguard Group survey finds no difference in
self-reported motivational levels between surveyed employees that hold company stock in their
401(k) plan and those that do not.
IV. Effects of Match Policy on Employee Purchases
Given that on average the employer match represents about a third of total contributions,
a match in company stock forces employees to hold a substantial share of their retirement
portfolio in company stock. Further, as previously documented in table 3, a company stock
match leads employees to boost their own voluntary purchases of company stock. Previous
research (Benartzi, 2001; Liang and Weisbenner, 2002) have described this result as consistent
with employees viewing a match in company stock as the firm’s implicit endorsement of
company stock as a good investment.
We next estimate the effect of plan characteristics (i.e., match policy and the number of
options), past asset returns, and firm characteristics on the percent of employee contributions
invested in company stock, the firm’s lowest-return asset (a money market fund, or if not
offered, a Guaranteed Investment Contract (GIC)), and all other investment options. The results
are displayed in table 7. When the employer match is in company stock, the percent of
employees’ own contributions allocated to company stock are seven to eight percentage points
higher. This boost in employee contributions to company stock comes disproportionately at the
expense of the safest asset; employees allocate three percentage points less to the money
market/GIC fund if the employer matches in company stock. Thus, about two-fifths of the boost
in company stock purchases comes from a reduction in contributions to the lowest-return asset.
Consistent with Benartzi and Thaler (2001) and Liang and Weisbenner (2002), the
regressions indicate that 1/n is also a significant predictor of purchases across all asset classes,
where n is the number of investment alternatives. Company stock purchases are also greater if

18
stock price volatility is lower and the firm is larger, with the contributions to the money
market/GIC fund increasing with stock price volatility.
The relation between asset returns and contribution decisions is in general fairly weak,
with the minor exception of the effect of past Treasury bill returns. For example, relative to a
firm with a zero stock return, a doubling of stock price over the past five years is associated with
only a 0.5 percentage point increase in the fraction of employee contributions allocated to
company stock. Past five-year Treasury bill returns are strongly positively correlated with the
percent of employee contributions allocated to the money market/GIC fund, while negatively
related to contributions to company stock and all other investment options.
V. Does it Matter? The Effect of Match Policy on Retirement Wealth
Participants in plans that match with company stock end up with a highly undiversified
portfolio. However, our empirical results also indicate that these employees are more likely to
work for firms that have lower idiosyncratic risk, lower bankruptcy risk, and provide other
retirement income through defined benefit plans. While a higher concentration of assets in
company stock entails more risk, company stock has a higher expected return than most other
investment alternatives, especially money market and government bond funds. As mentioned
earlier, past research finds that when making investments, employees invest consistent with
naïve 1/n diversification strategies, rarely rebalance plan assets, and tend to place more of their
own contributions in company stock if the match is provided in company stock. As a result of
these many countervailing forces, the net effect of company match policy on the distribution of
possible retirement wealth levels is complex. In this section, we use simulation methods to
compare the distribution of retirement wealth under alternative assumptions.
A. Key Assumptions and Procedures
We assume that an individual begins contributing to a 401(k) plan at age 27 and
contributes six percent of wages annually until age 62. The company matches this contribution
at a rate of 50 cents on the dollar, meaning that the company contributes an additional three
percent of wages each year. The individual’s lifetime wage path is taken from Munnell and
Sunden (2003).23 In particular, wage growth is a composite of two factors. The first is that the
23 For more details on the calculation of the wage profiles, we refer readers to page 30 of Munnell & Sunden (2003). We are grateful to these authors for providing us with the wage profiles for use in our simulations.

19
growth in real wages across the economy is assumed to be 1.1 percent annually, which is
consistent with projections of the Office of the Actuary of the Social Security Administration.
The second is an age-earnings profile based on career earnings profiles for men and women born
between 1926 and 1965. Salary at age 50 is set to $44,000, which is the median wage for a 50-
year old covered by a pension plan in the 2001 Survey of Consumer Finances.
Consistent with our 11-k data, we assume that firms offer seven investment options (the
median number of options in our sample) – company stock, large-cap equities, money market,
long-term government bond, a balanced fund (which is invested in a monthly rebalanced mix of
50 percent stocks and 50 percent bonds), high-grade long-term corporate bond, and small-cap
equities. Based on our results from table 7 and previous research findings (Benartzi and Thaler,
2001; Liang and Weisbenner, 2002), we assume initially that participants invest their own
contributions using a simple 1/n diversification heuristic.24 We also assume that when the
company matches with cash, the individual invests the employer match in the same manner as
their own contributions. In our base case simulation, we assume that the company’s decision to
match in company stock has no effect on an employee’s own contribution allocation, although
we alter this assumption in later specifications. As such, for many of the simulations presented,
the difference in annual purchases of alternative assets arises solely from a difference in the
employer match. These assumptions approximate the actual contribution data to money market
funds and company stock that we observe for these firms. Consistent with previous research
(Samuelson and Zeckhauser, 1988; Ameriks and Zeldes, 2001), we assume that participants do
not rebalance their accounts. This assumption is also consistent with restrictions that many firms
had in place that did not allow participants to diversify out of employer match contributions until
certain age and service requirements were met.
Specifically, our assumptions of 1/n and seven investment options lead to one-half of
annual employee and employer contributions directed toward equities and one-half toward fixed
income securities at firms that match in cash. For firms that match in company stock, two-thirds
are directed toward equities and one-third toward fixed income. Initially, we assume that
participants do not alter their portfolio allocation when forced to receive a match in company
stock, although we relax this assumption below. As discussed below, these parameterizations
24 In later simulations, we further consider the desirability of a match in company stock for participants that would otherwise invest all of their own contributions in one asset.

20
result in an asset-composition of the simulated contributions and account balances that closely
correspond to observed 401(k) plans.
To estimate retirement wealth, we need to specify processes for asset returns. Monthly
returns to the assets --- large-cap equity, small-cap equity, money market, long-term government
bond, and high-grade long-term corporate bond --- are reported in Ibbotson Associates (2002)
from January 1927 through December 2001. The historical annual returns averaged
approximately 12 percent for large-cap equities, 17 percent for small cap equities, 4 percent for
money market (i.e., Treasury bills), just below 6 percent for long-term government bonds, and
just above 6 percent for high-grade corporate bonds.
We draw randomly with replacement from the historical distributions of monthly returns
from 1927-2001, with the returns for the assets other than company stock and an inflation rate
drawn as a package for a given month in order to retain all within-month, cross-asset
correlations. For company stock returns, we simultaneously draw the returns of four factors (the
three Fama-French (1993) factors that summarize the overall market excess return, the
performance of small stocks relative to big stocks, and the performance of value stocks relative
to growth stocks, and the fourth momentum factor that summarizes the performance of stocks
with recent gains relative to stocks with recent losses) for the same month, and use these to
generate an expected return on company stock using the individual firms’ estimated betas from
the four-factor model proposed by Carhart (1997).25
We estimate the betas for the four-factor model using CRSP stock returns for 1991 to
2001. For each of the 867 firms that had at least 24 months of stock returns over the period
1991-2001 and whose match policy did not change over the sample, we estimate regressions of
monthly stock returns on the four factors.26 Specifically, following a standard approach in the
finance literature, the excess stock return (stock return less the risk-free rate) is related to the
market return (also in excess of the risk-free rate), the return of small capitalization minus big
capitalization stocks (SMB), the return of high book-to-market minus low book-to-market stocks
(HML), and the return of stocks that have risen the past eleven months minus those that have
fallen (UMD). As shown in table 8, average raw returns and excess returns computed from the
25 The four factor returns are taken from http://mba.tuck.dartmouth.edu/pages/faculty/ken.french/data_library.html. 26 Of the original 946 firms in the sample, 41 had a change in match policy over the sample, 23 could not be linked with CRSP, and 15 were successfully merged with CRSP but did not have 24 months of returns, resulting in the final sample of 867 firms.

21
four-factor model do not differ significantly across match policy. With the exception of the size
factor, there is no difference in systematic risk across the two groups of firms. The SMB beta is
significantly smaller for firms with a company stock match, reflecting that firms that match with
company stock tend to be somewhat larger. However, total risk (the standard deviation of
monthly returns) and idiosyncratic risk (the standard deviation of the residual from the four-
factor return model) are both significantly lower for firms with a company stock match, on the
order of 1.5 to 2.1 percentage points per month.
After using the estimated excess return and betas and the monthly draw of the four
factors from the historical return distribution to compute the expected return on company stock,
we then draw randomly from the company stock return error distribution, a normal distribution
with variance based on the estimated idiosyncratic risk of the firm, and apply it to the expected
return to generate the realized return for that month.27 These rates of return are then applied to
existing account balances and new contributions. This process is repeated for each month that
the individual is contributing from age 27 through age 61, a total of 420 months. We then save
the total account balance at age 62, and repeat this process 100,000 times for each of the 867
firms in our sample.28
B. Simulations of 401(k) Account Balances
1. Base case. In the first scenario of table 9, we present results for the base case,
comparing the distribution of retirement account balances when investments are made with the
1/n rule and the employer match is unrestricted or required to be in company stock. To construct
the table, we run the simulation exercise for each of the 574 choice companies and each of the
293 firms that match in company stock based on each firm’s characteristics. For each firm, we
then take the simulated final account balances at age 62 and sort them into a distribution from the
lowest to the highest. In order to make comparisons between the two types of plans, we then
construct the median across firms of each sample statistic. Thus, the reported 1st percentile for
choice firms represents the median of the 1st percentile of the 574 choice companies, and the
reported 1st percentile for the company stock match firms represents the median of the 1st
27 The inclusion of the years 1997 to 2000, when realized stock returns were high, does not materially affect our estimates of expected returns (i.e., excess returns and betas). Estimating excess returns and betas using stock returns over the subsample 1991 to 1996 results in total and idiosyncratic risk that are a bit lower, but the difference in risk across match policy is quite similar to that estimated using the full sample of returns. 28 Through repeated experimentation, we found that 100,000 simulations is sufficient for the distribution of account balances to stabilize.

22
percentile for these 293 companies, and similarly for the reported mean and eight other key
points in the distribution. We also report the percent of times that an individual would have
more wealth with company stock than with choice. This represents the point in the distribution
of 401(k)-plan wealth where balances are the same across match policy (i.e., the crossover point
of the two distributions).
Recognizing that most investors are risk averse, and therefore have a nonlinear valuation
of the possible distribution of outcomes, the bottom panel of the table reports the coefficient of
relative risk aversion (CRRA) such that the individual would be indifferent between the two
distributions. Specifically, we use the standard utility function of the form: ( )
( )γγ
−−
=−
11)(
1WWU
Note that when γ = 0, the individual is risk neutral, and higher values of γ indicate higher
levels of risk aversion. The case of γ=1 corresponds to log utility. We search for the value of γ
such that the expected utility from the two distributions is the same. Note that up to this point we
have made no assumptions about utility maximizing behavior, but rather have focused on
understanding the effect of match policy on retirement wealth, given our empirical estimates of
how plan participants actually respond to match policy. Our use of a utility evaluation here is
meant to provide a summary statistic for a nonlinear valuation of the distribution of outcomes
that places more weight on “bad” events. We report these results conditional on having varying
amounts of additional uncorrelated wealth at retirement.
The results of our base case indicate that retirement-age account balances at choice firms
are larger than the account balances from company stock match firms 31 percent of the time.
Conversely, balances at company stock match firms are larger 69 percent of the time, indicating
that the median balance is larger. The difference in the mean account balance is substantial, with
a company stock match having a mean account balance 27 percent higher than the plan with
choice. An examination of the full distribution illustrates the basic result of having a match in
company stock, namely that the mean is higher but there is substantially greater dispersion. At
the 1st percentile of the distribution, the company stock match results in retirement wealth that is
17 percent lower than under a choice match, whereas at the 99th percentile, the company stock
match outcome is 50 percent greater than that of the choice outcome.
For CRRA utility, what matters is the size of the gains and losses relative to total wealth.
23
In addition to the wealth from the 401(k) plan, we recognize that most retirees have additional
wealth in the form of Social Security, defined benefit plans, home equity, and so forth. If this
other wealth is perfectly correlated with 401(k) wealth, then the results would be identical to the
case in which only 401(k) wealth is considered. To the extent that some of this wealth is
uncorrelated, such as Social Security wealth, it increases one’s tolerance for risk within the
401(k) plan. To illustrate the quantitative importance of additional wealth outside of the 401(k)
plan, we report the risk aversion coefficient assuming the individual has additional uncorrelated
wealth ranging from zero to $1 million. Using the Health and Retirement Study (HRS), Poterba,
Rauh, Venti, and Wise (2003) estimate wealth holdings of households with a male at retirement
age (i.e., between 63 and 67) across education groups. Annuitized wealth (i.e., the present
discounted value of expected Social Security and defined benefit pension wealth) is $240,800 for
the median household with less than a high school education and $375,500 for those with at least
a college degree (the Social Security component of annuitized wealth is $217,000 and $248,800
for the two groups, respectively). Total household wealth excluding DC plan accounts but
including expected Social Security and DB benefits ranges from $362,300 for the median
household with less than a high school education to $1,102,400 for households with at least a
college degree. This suggests that for utility comparisons, assuming $250,000 or $500,000 of
wealth uncorrelated with the 401(k) account balance would be reasonable.
We find that individuals would prefer a company stock match to a choice match if their
risk aversion level (CRRA) was 2.9 or lower, assuming they have $250,000 of additional
uncorrelated wealth. With $1 million of uncorrelated wealth, the CRRA below which the
individual prefers the company stock match is 6.1. With no uncorrelated wealth, individuals
with a risk aversion coefficient below 1.8 prefer the company stock match.
In interpreting these results, it is important to note that the level of uncorrelated wealth
may differ between individuals across match policy assumptions. For example, as shown in the
appendix, individuals in companies whose 401(k) plan matches in company stock are
substantially more likely to also have a defined benefit plan. By comparing our match and
choice assumptions at equivalent levels of uncorrelated wealth, we may in fact be biasing these
calculations against the company stock match.
The outperformance of the retirement portfolio at company stock match firms reflects
two factors. First, more contributions are directed toward higher-yielding assets when the match

24
is provided in company stock, which implies that less is invested in lower-yielding assets.
Second, company stock match firms have lower risk, which, for an equal share in company
stock, reduces the likelihood that the portfolio balance at these firms will fall below the balance
at unrestricted match firms.
To illustrate the effects of these two factors in explaining the desirability of a match in
company stock, we present two counterfactual scenarios. The first counterfactual scenario
compares the distribution of account balances when a firm that actually matches in company
stock provides an unrestricted match to account balances when the firm instead follows its actual
policy of matching with company stock. This scenario holds constant stock characteristics,
while allowing match policy and the share of assets in company stock to vary, thus isolating the
effect of differences in asset holdings on the distribution of account balances. In the second
scenario, we hold match policy constant (i.e., both types of firms are required to match in
company stock), thus isolating the effect of the differences in stock characteristics across choice
match firms and company stock match firms on the distribution in account balances. The results
of these two scenarios are shown in the second and third sets of columns in table 9. Note that in
the base case, “vary match policy”, and “vary firm characteristics” scenarios, the rightmost
column describes the distribution of account balances when a company stock match firm
matches with company stock. Thus, these three columns report identical numbers.
The “vary match policy” simulation indicates that the stock characteristics of company
stock match firms (i.e., their lower idiosyncratic risk) contributes to the desirability of the
company stock match found in the base case. Recall in the base case, when the comparison is a
choice match firm with a choice match versus a company stock match firm with a company stock
match, the company stock match outperforms the choice match 69 percent of the time, and the
distribution of account balances under the company stock match plan is preferred to participants
with a CRRA of 2.9 (assuming $250,000 of uncorrelated wealth). However, when the
comparison is a company stock match firm with a choice match versus a company stock match
firm with a company stock match, the company stock match outperforms the choice match only
59 percent of the time, and the indifference level of risk aversion falls to 2.3. Thus, controlling
for stock characteristics, a match in company stock is still desirable given sufficient risk
tolerance due to the increased exposure to equities. However, the company stock match is more
attractive if stock characteristics are not held constant across match policy, as firms that match

25
with company stock have lower idiosyncratic risk which, ceteris paribus, tightens the distribution
of retirement wealth.
In the “vary firm characteristics” simulation, we isolate the effect of differences in stock
characteristics on retirement wealth by comparing the distribution of account balances when
choice firms match with company stock (the counterfactual situation) to the distribution of
account balances when company stock firms match with company stock. Thus, in both cases,
participants are getting the same exposure to equities, but the employees of choice firms are
getting exposure more inefficiently (i.e., by investments in a single stock with a similar expected
return but more risk). The distribution of account balances at company stock firms is much more
favorable than that at choice firms – the account balances at company stock firms outperforms
those at choice firms 88% of the time, and only risk-neutral participants (i.e., CRRA less than
0.6) would prefer the retirement plan at the choice firms (assuming both choice and company
stock firms match with company stock).
2. Fees, indirect effects of match policy, bankruptcy, and lower equity premium.
Having established that the relative performance of the portfolios depends importantly on both
the share of assets in company stock as well as firm characteristics, we present scenarios in table
10 in which we alter some of our simplifying assumptions to assess whether they affect our result
of a preference for a plan at a company that matches with company stock. In scenario 2, we add
fund management expenses, which make company stock more attractive because it has very low
or zero administrative costs, while other investment options have higher costs. We assume zero
costs for company stock, and make assumptions concerning management expenses of other
assets that are in line with costs at corporate plans reported in a confidential industry study.
Given the assumed asset composition of total contributions (i.e., employee and employer), these
assumed fees translate into a $0.31 reduction per $100 of contributions for company stock match
firms compared to a $0.21 reduction for choice match firms, a difference of ten basis points.29
As illustrated in scenario 2, the difference in costs compounds over time, with the lower
relative fees for company stock making the company stock match more attractive. Despite a
significantly lower average account balance before adding administrative costs, a participant in a
29 Samwick and Skinner (2003) assume expenses of 42, 71, and 92 basis points for money market, bond, and equity funds, respectively, based on Investment Company Institute (ICI) data for funds outside of 401(k) plans. Using these higher expenses would increase the advantage of company stock relative to these alternative assets, roughly doubling the difference in total fees across match policy.

26
plan with a choice match pays on average $23,000 more in fees over the 35-year period than
does a participant in a plan with a match required to be in company stock; the higher fees for the
choice firms thus reduce their average 401(k) account balance by roughly 2 percent. Participants
with $250,000 in uncorrelated wealth and a CRRA up to 3.5 now prefer the company stock
match. The indifference level of risk aversion is 7.6 with $1 million of outside wealth, and 2.0
with no outside wealth.
The next two scenarios incorporate the indirect effects of a company stock match policy
that were discussed in Section IV, on top of the administrative costs. Scenario 3 recognizes that
the employer match in company stock leads participants to increase their own voluntary
purchases of company stock, and scenario 4 makes the additional assumption that firms that
match in company stock typically offer one fewer alternative investment choice in their plan.30
Since we only observe how participants invest given the match policy of their firm, but not under
the counterfactual, an implicit assumption underlying the utility comparisons for scenario 3 is
that employees in a firm with a company stock match would invest their contributions differently
if they switched to an unrestricted match firm, and vice versa. These indirect effects lead to
greater purchases of company stock in company stock match firms, boosting the annual share of
employee contributions invested in company stock from 14 to 24 percent, and the share of total
contributions invested in company stock from 42 to 49 percent.
Not surprisingly, the incorporation of these effects jointly boosts the mean account
balance at company stock match firms by $84,000 (from $1,178,000 in scenario 2 to $1,262,000
in scenario 4) or seven percent. The mean balance under a company stock match is 41 percent
higher than that under a choice match. However, incorporating these indirect effects increases
the dispersion in account balances, slightly raising the risk that the portfolio will underperform
the choice match portfolio (from 28 to 30 percent) and reducing the indifference risk aversion
level from 3.5 to 3.2 (assuming $250,000 of additional wealth).
The result of these parameter choices is a portfolio allocation for both contributions and
account balances that closely match those of actual 401(k) plans. Our assumptions for
30 Under scenario 3, two-fifths of the indirect boost in company stock purchases comes from a reduction in contributions to the safest asset, the money market fund, with the remaining three-fifths of the reduction evenly distributed across the remaining five options. Under scenario 4, the company stock match plan now offers six options, which boosts employee contributions to company stock by approximately 2.4 percentage points (i.e., 16.7 – 14.3 = 2.4). Rather than eliminate fully one of the six non-company stock assets, we reduce employee contributions to these six assets by approximately 0.4 percentage points each, i.e., (16.7–14.3)/6.

27
contributions lead to participants in company stock match (choice match) plans investing 24
percent (14 percent) of employee contributions in company stock, comparable to the observed 25
percent (16 percent) recorded in table 3. Total contributions allocated to company stock are
assumed to be 49 percent for company stock match firms and 14 percent for choice firms, again
very similar to the observed 46 and 17 percent, respectively. The asset composition of our
simulated account balances is also in line with asset holdings in other studies. For example,
Benartzi and Thaler (2001) document that among plans that offer company stock, equities
account for 71 percent of assets (see also Holden and VanDerhei, 2001a). In our simulations,
this corresponds to the average equity allocation across all firms after about nine years of
participation.31 At this same point, plans that match in company stock have, on average, 24
percentage points more of the account balance allocated to company stock than do firms with an
unrestricted match. This is very consistent with the average difference of 24 percentage points in
the 11-k data.
An important omission from our simulations thus far is the possibility of the bankruptcy
of the firm, and the associated wiping out of the company stock holdings in the 401(k) account.
Indeed, it was the bankruptcy of firms like Enron and Worldcom that precipitated much of the
public policy interest in the question of firm match policy in the first place. To address this, we
introduce a bankruptcy probability by designating each firm as being included in one of three
groups – those with investment-grade bonds, speculative-grade bonds, and no rated bonds – and
applying the expected default probability for that group to the firm.32 The expected default
probabilities used for each group represent the median rate for that group during 1997 and 1998,
as estimated by KMV Corporation, a group that implements a method that measures the
likelihood that the market value of a firm’s assets falls short of its liabilities. The expected
default probabilities for the year ahead are 0.15 percent for investment-grade firms, 1.93 percent
for speculative-grade firms, and 1.61 percent for firms with no bond rating. Across the 867
firms, the average expected bankruptcy rate is 1.1 percent per year, roughly in line with realized
bond default rates that averaged about 1.3 percent per year from 1981 to 2000 according to
Standard & Poor’s, and the aggregate business failure rate from 1990 to 1997 reported by Dun & 31 The Vanguard Group (2003) reports an average job tenure of 9.5 years for a sample of 401(k) participants that had access to company stock in their retirement plan. 32 Bond ratings are made by Standard and Poor’s and available in Compustat. A rating of BBB- or better is classified as investment grade. For firms that changed bond rating over the period, we calculated the average rating over the period.

28
Bradstreet.33 These rates imply that a firm has a 32 percent chance of failure over the 35-year
investment horizon.
We implement this bankruptcy procedure by calculating a return cut-off that corresponds
to the bottom 0.15, 1.93, or 1.61 percent of the return distribution for each group. When the
random return draw for a particular company is lower than the bankruptcy return cutoff for that
firm’s group, we set the company stock account balance to zero. Following Poterba, Rauh, Venti
and Wise (2003), we assume that the individual continues to participate in a 401(k) plan after
bankruptcy, with new contributions commencing in the following month.34 Variation in
bankruptcy rates across firms therefore depends both on which default group the firm is in and
the firm’s stock price volatility, as firms with greater volatility are more likely to hit the
bankruptcy return cutoff. For our sample, the expected default probability averages 0.59 percent
for company stock match firms, and 1.41 for choice match firms, substantially higher both
because there are fewer investment-grade firms in the choice match group and because these
firms have higher idiosyncratic risk.
Scenario 5 shows that bankruptcy risk slightly reduces the mean and median account
balances, but the balances for the company stock match plan still exceed the choice match plan
balance two-thirds of the time. It is still the case that sufficiently risk-tolerant individuals
(CRRA of 2.7 with $250,000 of uncorrelated wealth) would prefer the company stock match.
The limited effect of bankruptcy might at first seem somewhat puzzling, but it can be
explained by two factors. First, the firms that match with company stock have a substantially
lower risk of bankruptcy, as reflected in their greater likelihood of being rated investment grade
and lower stock price volatility. Thus, while employees at company stock match firms have
more of their account subject to bankruptcy risk (i.e., invested in company stock), bankruptcy
happens less frequently. Second, bankruptcy, which reduces company stock holdings to zero, is
related to the realization of a very bad outcome, which, in the absence of the forced bankruptcy,
would already have reduced company stock holdings substantially. In our previous simulations,
it was possible to have monthly return realizations at the bottom tail of the distribution as low as
33 See Standard & Poor’s (2001) and Dun & Bradstreet, Table B-96 in the Economic Report of the President, 2002. 34 Incorporating some period of post-bankruptcy unemployment would lower the average account balance for both choice and company stock match firms, and thus the difference in the distributions would not be substantially altered. Indeed, given that choice match firms have higher average bankruptcy rates, due to their higher stock price volatility, including a period of unemployment would increase the relative advantage of participating in a plan at a firm that matches in company stock.

29
-100 percent; our implementation of bankruptcy effectively treats monthly return realizations
beyond -65 to -70 percent as if they were -100 percent. Thus, the marginal effect of this
“imposed” bankruptcy is not that large because the stock would have performed poorly anyway
(i.e., whereas a -80 percent return wipes out four-fifths of the account balance in scenario 4, it
would lead to bankruptcy in scenario 5 and thus wipe out the entire company stock balance).
Another potential concern is that we draw from the distribution of historical returns in
which there was a sizeable equity premium. There are numerous reasons to believe that the
equity premium has fallen and that the equity premium going forward may be lower than it has
been in the past (Fama and French, 2002; Blanchard, 1993; Campbell, 2001; Diamond 2001).
To account for the possibility that the equity premium will be lower in the future, we reduce the
historical gap between the equity return and Treasury bill rate of approximately eight percentage
points to approximately four percentage points for our simulations.35
This four-percentage point cut, implemented in scenario 6, dramatically reduces expected
retirement account balances, more so for company stock match firms since a larger part of their
holdings are in equities. The median balance for the company stock match firms is $243,000
(versus $465,000 before the halving of the equity premium), just about equal to the median
balance for the choice match firms of $244,000. Thus, the company stock match exceeds the
choice match only 49 percent of the time.36 As has been the case, the mean balance for the
company stock match firm still exceeds that for the choice match firm, however it now does so
by only 29 percent, compared to 41 percent before the reduction in the equity premium (scenario
4). When additional uncorrelated wealth of $250,000 is assumed, the reduction of the equity
premium reduces the CRRA at which participants are indifferent to match policy from 3.2 to 2.2.
The final simulation, scenario 7, combines the previous two scenarios – jointly allowing
for bankruptcy and reducing the equity premium. Now the company stock match portfolio
underperforms the choice match 55 percent of the time, and only individuals with CRRA of 2 or
35 The equity premium reduction of 32.5 basis points per month is applied to all equity instruments, including large cap, small cap, company stock, and the equity portion of the balanced fund. We have not altered the return on the money market or bond investments, although in general equilibrium one might expect these returns to change as well if the equity premium is reduced. A reduction in the expected return of fixed-income securities as well would enhance the desirability of a match in company stock. 36 The account balance at the company stock match firms exceeds than at the choice firms 70 percent of the time if there is no reduction in the historical equity premium and 49 percent of the time if there is a four-percentage point reduction in the equity premium. Assuming a two-percentage point reduction in the equity premium, consistent with Samwick and Skinner (2003), results in the company stock match plan accounts outperforming 57 percent of the time.

30
less prefer the company stock match (again assuming $250,000 of additional wealth). The
simulations in scenarios 5 through 7 underscore that a lower equity premium is a greater source
of risk to a match in company stock than firm bankruptcy.
An alternative way to examine the importance of the equity premium is to impose the
restriction that choice firms provide their matching contributions entirely in the large-cap equity
fund. While this scenario is of little real world relevance -- no firms do this because there is no
advantage to restricting match choice except if it is in company stock -- this scenario helps to
further quantify the role of the equity premium. In unreported analyses, we evaluated scenarios
assuming that the “choice” firms actually matched with a large-cap equity fund. Not
surprisingly, this approach reduces the desirability of the company stock match because the
large-cap equity portfolio has less risk. When the choice match is directed into the S&P 500, the
balance at choice plans outperforms the balance at company stock match plans roughly three-
fifths of the time, versus about 30 percent of the time when the choice firm match was distributed
evenly across all seven investment options. Once we incorporate bankruptcy risk and a lower
equity premium, individuals with CRRA of 1.8 or less prefer the match to be in company stock,
even if the “choice” match would all be in the S&P 500 (assuming $250,000 of additional
wealth). As outside wealth rises to $1 million, the indifference level of relative risk aversion
rises to 3.7. These results underscore that from an employees’ perspective, a company stock
match is not the best way to increase the equity exposure of the 401(k) account; however, the
employer has no incentive to restrict the match to an equity fund.
C. Do Firms Choose the Appropriate Match Policy?
Our earlier results suggest that the choice of employer match policy is negatively related
to firm risk and is more likely if the firm also offered additional retirement benefits in the form
of a DB plan. We hypothesized that these effects owed to fewer concerns by these firms that
participants would have inadequate retirement wealth. To explore this hypothesis further, we
consider two counterfactual scenarios that assess whether participants would have been better off
if the firms had chosen the alternative match policy. That is, we test whether account balances at
choice firms are higher with an unrestricted match (their actual policy) than with a company
stock match (the counterfactual policy) for these same firms, and visa versa. The point of these
comparisons is to see if firms appear to choose the employer match that provides the most
favorable distribution of account balances given the firm’s characteristics.

31
We do these counterfactual exercises for the base case and the scenario allowing for
bankruptcy risk and a reduced equity premium (scenario 7 in table 10). For the base case, we
first simulate balances for choice match firms allowing an unrestricted match, their actual policy
(column 1 in table 11), but then require the counterfactual that the employer match is in company
stock (column 2 in table 11). Similarly, we simulate balances for company stock match firms
first allowing these firms to make an unrestricted match (the counterfactual policy, column 3),
and then requiring a match all in company stock (their actual policy, column 4). Results for
scenario 7 are reported similarly in columns 5 to 8.
Comparing columns 1 and 2, we find that the account balance would have been lower just
over half the time (51 percent) if the choice match companies had been forced to match in
company stock. Columns 3 and 4 show that the companies that actually do match in company
stock end up with a higher account balance three-fifths of the time (59 percent) than if they
would have offered an unrestricted match. This evidence is at least consistent with the notion
that companies are selecting their match policy in a manner that takes into account the
risk/reward trade-off for their employees.
Once one jointly considers the substantially reduced equity premium and the risk of
bankruptcy, it is clear that the typical choice firm is making the “right” decision to offer an
unrestricted match since the choice firm is relatively risky (columns 5 and 6). However, the
evidence also suggests that the company stock match firms are forcing employees into an inferior
distribution relative to if they had allowed choice for all but the most risk-tolerant employees.
While forcing employees into company stock is less costly for the firms that actually do it than
for the choice firms, it is nonetheless the case that, once one incorporates a reduced equity
premium and the risk of bankruptcy, the comparison of the distributions is unfavorable to the
company stock match. Naturally, therefore, the appropriateness of the company stock match
policy is sensitive to the equity premium.
On net, the evidence is consistent with the idea that firms are partially sorting themselves
based on how the match policy decision affects the distribution of employee retirement wealth.
In all scenarios, the decision to match in company stock is a better decision for those that
actually do the match in company stock than it would be for those that currently provide choice.
D. What if Employees Do Not Diversify Their Own Contributions?
Up to this point, we have assumed that participants hold somewhat diversified portfolios

32
because of their 1/n allocation rule for contributions. But, empirically, 1/n contribution
allocations apply to the average investor, and we know from participant-level studies that while
some 1/n investors exist, there are many who put all of their funds in a single asset (Agnew,
2002; Benartzi and Thaler, 2001; Holden and VanDerhei, 2001b).
To assess the desirability of a company stock match for participants who would otherwise
not diversify their retirement account holdings, we present simulation results for a company
stock match versus a choice match if employees invested only in a single asset. Table 12
presents statistics for retirement-age account balances for each asset separately, starting with
company stock, allowing for bankruptcy risk and a reduction in the equity premium of four
percentage points per year. It is assumed that when the match is unrestricted (i.e., choice), that
the worker invests both employee and employer contributions in the one asset, and when the
match is required to be in company stock, the employer contribution is invested in company
stock, but the employee contribution is invested in the one asset.
Not surprisingly, an account that is fully concentrated in a single stock exposes the
participant to considerable risk. However, when we compare results when participants put all of
their assets in company stock (first pair of columns in table 12), risk averse employees would
prefer the account at a company stock match firm over that at a choice match firm, reflecting the
lower risk of company stock match firms.
Similarly, if participants concentrate their holdings in one of the other non-company
stock assets, a company stock match will be preferred to a choice match that is invested in the
same undiversified asset, except in the case of small-cap equities. When the match is in
company stock, participants who would otherwise concentrate their and their employer’s
contributions in a fixed-income security (scenarios two through four), obtain exposure to equities
and some diversification gains they otherwise would not receive. For example, although an
inefficient means of obtaining equity exposure, most participants who would otherwise be
concentrated in the money market fund are better off having one-third of total contributions
directed toward company stock. Assuming $250,000 of additional uncorrelated wealth, those
with CRRA less than 11.1 prefer the company stock match.
On the other hand, if participants would otherwise concentrate investments in a small-cap
equity fund, then the company stock match has little to offer in terms of added exposure to
equities, so the distribution of account balances is less favorable to the company stock match.

33
Since the beta on the size factor (small minus big) is substantially less than one (the median for
company stock match firms is 0.28), adding company stock to a portfolio that is otherwise
concentrated in small stocks does provide some diversification value in terms of reducing the
risk associated with the size factor. However, this effect must be balanced against the increased
idiosyncratic risk associated with a company stock match.
The results of our simulations, whether contributions are diversified or concentrated,
suggest that sufficiently risk-tolerant participants generally would prefer a 401(k) plan at a firm
that matches with company stock than a plan at a firm that provides an unrestricted match. This
conclusion reflects two empirical findings. First, firms that match in company stock have lower
idiosyncratic risk and lower bankruptcy risk than firms that allow match choice. Our results do
not indicate that workers would want firms that currently provide an unrestricted match to switch
to requiring that employer contributions be in company stock. Indeed, the significantly higher
risk of firms that offer an unrestricted match would substantially increase the variance of account
balances if the firm were to switch match policy, and only the most risk-tolerant employees
would be better off from such a change.
Second, since firms do not have incentives to guide participants to equities other than
company stock, the equity exposure obtained through a company stock match, while inefficient,
may be better than the alternative asset composition under a choice match, particularly if
participants stick with low-yielding default investment options. Choi, Laibson, Madrian, and
Metrick (2001) report that 80% of participants accept both the default savings rate and the
default investment fund (a money market or stable value fund) at firms that have automatic
enrollment for their 401(k) plan. Further, even after three years, half of the plan participants
subject to automatic enrollment continue to invest all of their contributions in the default fund.
A more efficient means to provide such participants equity exposure would be to provide an
employer match in a well-diversified stock fund. However, given the lack of incentive for
employers to do this, a match in company stock, particularly at firms that provide other sources
of retirement income and have lower risk, can be a second-best means of promoting greater
retirement wealth accumulation.
VI. Conclusion and Policy Implications
The increasing importance of 401(k) plans in providing for retirement has raised concerns

34
about the financial security of future retirees. An especially important part of a 401(k) plan is
whether the employer matching contributions are restricted to company stock or can instead be
invested as the employee chooses. Match policy has a large effect on the amount of company
stock in the retirement account because employer contributions are roughly one-third of total
contributions, employees at firms that match in company stock tend to invest more of their own
contributions into company stock, and participants rarely rebalance their portfolios to reduce the
concentration in company stock. This paper studies why some firms match in company stock
while others do not. Employers must trade off a number of costs and benefits that arise from
requiring that employees hold their 401(k) match in company stock. This paper provides what is
the first evidence on which of these costs and benefits appear to matter most to firms, and then
explores the implications of match policy for employee retirement wealth.
Unlike stock option grants to non-executives, the firm’s decision to match in company
stock does not appear to be correlated with cash flow or with measures of the benefits of aligning
incentives of employees and owners. Rather, consistent with the notion that firms consider the
retirement security of their workers in making the match decision, we find that firms are more
likely to provide the match in company stock if firm risk is low and employees are also covered
by a defined benefit plan. We interpret these findings as consistent with firms considering the
effect of match policy on the retirement security of plan participants, either because firms want
to minimize the chance of being considered in violation of their fiduciary duties under ERISA or
because employees at these firms more fully value company stock because of the lower firm-
specific risk. We also find evidence that a company stock match is more likely if the firm does
not have multiple classes of stock, which is an alternative mechanism to reduce hostile takeover
attempts, and if the firm pays dividends, likely reflecting the potential tax deductions for
dividends paid on match stock (although the dividend result is less robust).
We use simulation methods to assess the effect of match policy on the expected
distribution of account balances at retirement for plan participants, incorporating the behavioral
responses to match policy by participants as well as the characteristics of the firms offering the
plan. Our results suggest that, for sufficiently risk-tolerant individuals, participating in a 401(k)
plan at a company with a company stock match is often preferable to participating in a plan at a
company with an unrestricted match, given the historical equity premium. This result is
attributable to several factors. First, the firms that match in company stock have substantially

35
lower bankruptcy risk and stock price volatility. Second, the match in company stock increases
the equity exposure of participants, often by reducing the share of assets held in lower-return
fixed-income securities. For example, after confirming that an employer match leads to
participants contributing more of their own contributions to company stock, we show that about
two-fifths of this boost in company stock purchases comes from a reduction in contributions to
the safest asset, which is typically a money market fund. Lower administrative costs for
company stock holdings also contribute to the desirability of a company stock match. However,
a lower equity premium reduces the preference for a company stock match.
Disentangling the alternative hypotheses for firms’ choice of match policy is important
for guiding public policy. Our evidence that cash flow constraints are not important suggests
that policy prescriptions to prohibit a match in company stock would be unlikely to lead to a less
generous employer match, which might have been the case if these firms had no other means to
contribute to the plan. However, if a firm matches in company stock to deter a takeover attempt
by increasing the shares held in “friendly hands,” then a cap on company stock may make
offering an employer match less desirable for the firm. The lack of evidence supporting that a
company stock match is provided for traditional equity incentive purposes suggests that a
prohibition on a match in company stock is unlikely to lead firms to increase equity-based
compensation to employees through other means, such as by granting more stock options.
Consistent with our empirical result that less risky firms match in company stock, we find
evidence in our simulations that firms, on average, appear to sort themselves into a match policy
in part based on the implications for participant retirement wealth. That is, the expected
distribution of retirement wealth at firms that require the match in company stock generally
dominates the distribution simulated under the counterfactual assumption that the same firms
instead provided an unrestricted match. Thus while matching in company stock may not be the
most efficient way to increase equity exposure, this result suggests that across-the-board
limitations on a company stock match may not be appropriate for all firms. Only if we assume a
significant cut in the equity premium or assume that the participant is already concentrated in a
small-cap equity fund would a participant not prefer the company stock match.
A promising direction for future research is to consider the role of 401(k) plans in studies
of stock based compensation for non-executives. Within 401(k) plans of firms that match in
company stock, the number of shares held in the plans is comparable to the number of
36
outstanding employee stock options held by non-executives. However, the firms that grant stock
options appear to be very different than the firms that grant stock to their employees through
their 401(k) plan. Moreover, 401(k) plans are more broad-based than stock option programs,
suggesting that a lower-level worker at a profitable, dividend-paying industrial firm may have
more exposure to company stock than a lower-level worker at a non-dividend-paying technology
company. This suggests that it may be important to incorporate stock received through the
401(k) plan when studying stock-based compensation for non-executives.

37
References
Agnew, Julie, 2002, Inefficient choices in 401(k) plans: Evidence from individual level data,
Working paper, The College of William and Mary. Agnew, Julie, Pierluigi Balduzzi, and Annika Sunden, 2003, Portfolio choice and trading in a
large 401(k) plan, American Economic Review 93-1, 193-215. Ameriks, John and Stephen Zeldes, 2001, How do household portfolio shares vary with age?,
Working paper, Columbia University, December. Beatty, Anne, 1995, The cash flow and informational effects of employee stock ownership plans,
Journal of Financial Economics 38, 211-240. Benartzi, Shlomo, 2001, Excessive extrapolation and the allocation of 401(k) accounts to
company stock, Journal of Finance 56, 1747-64. Benartzi, Shlomo and Richard H. Thaler, 2001, Naïve diversification strategies in retirement
savings plans, American Economic Review 91-1, 79-98. Blanchard, O.J., 1993, Movements in the equity premium, Brookings Papers on Economic
Activity 2, 75-138. Campbell, John, 2001, Forecasting US equity returns in the 21st century, in Social Security
Advisory Board, editor, Estimating the real rate of return on stocks over the long term, August, 3-10.
Carhart, Mark M., 1997, On persistence in mutual fund performance, Journal of Finance 52, 57-
82. Choi, James, David Laibson, Brigitte Madrian, and Andrew Metrick, 2001, For better
or for worse: Default effects and 401(K) savings behavior, NBER Working paper 8651, December.
Core, John E. and Wayne R. Guay, 2001, Stock option plans for non-executive employees,
Journal of Financial Economics, 61, 253-287. DeAngelo, H. and L. DeAngelo, 1985, Managerial ownership of voting rights: a study of public
corporations with dual classes of common stock, Journal of Financial Economics 14, 33-69. Demsetz, Harold and Kenneth Lehn, 1985, The structure of corporate ownership: causes and
consequences, Journal of Political Economy 93(6), 1155-77. Department of Labor, Employee Benefits Security Administration, 2001, Report of the working
group on increasing pension coverage, participation and benefits, Nov. 13.

38
Diamond, Peter, 2001, What stock market returns to expect for the future: an update, in Social Security Advisory Board, editor, Estimating the real rate of return on stocks over the long term, August, 11-16.
Even, William and David Macpherson, 2003 (a), The distributional consequences of the shift to
defined contribution plans, Working paper, July. Even, William and David Macpherson, 2003 (b), The causes and consequences of company
stock holdings in pension funds, Working paper presented at Southern Economics meetings, November.
Fama, Eugene and Kenneth French, 2002, The equity premium, The Journal of Finance, 62, 637-
659. Fama, Eugene and Kenneth French, 1993. Common risk factors in the return on bonds and
stocks, Journal of Financial Economics 33, 3-53. Holden, Sarah and VanDerhei, Jack, 2001 (a), 401(k) plan asset allocation, account balances, and
loan activity in 2000, Investment Company Institute Perspective 7(5). Holden, Sarah and VanDerhei, Jack, 2001 (b), The impact of employer-selected investment
options on 401(k) plan participants’ asset allocations: Preliminary findings, Working Paper, Investment Company Institute and Temple University.
Holmstrom, Bengt and Paul Milgrom, 1987, Aggregation and linearity in the provision of
intertemporal incentives, Econometrica 55, 303-328. Ibbotson Associates, 2002, SBBI (Stocks, bonds, bills, and inflation) 2002 yearbook: Market
results for 1926-2001, Chicago, IL: Ibbotson Associates. Iwry, Mark, 2003, Promoting 401(k) security, Tax policy Issues and Options, Urban-Brookings
Tax Policy Center, September, No. 7. Jensen, Michael C. and William H. Meckling, 1976, Theory of the firm: Managerial behavior,
agency costs and ownership structure, Journal of Financial Economics 3(4), 305-360. Lazear, Edward P., 1979, Why is there mandatory retirement? Journal of Political Economy,
Vol. 87, 6 (December), 1261-84. Lazear, Edward P., 1983, Pensions as severance pay, in Zvi Bodie, John B. Shoven, and David
A. Wise, eds., Financial Aspects of the United States Pension System, Chicago: University of Chicago Press, 57-85.
Liang, Nellie and Scott Weisbenner, 2001, Who benefits from a bull market? An analysis of
employee stock option grants and stock prices, Federal Reserve Board working paper 2001-57.
39
Liang, Nellie and Scott Weisbenner, 2002, Investor behavior and the purchase of company stock
in 401(k) plans – The importance of plan design, NBER working paper 9131. Meulbroek, Lisa, 2002, Company stock in pension plans: How costly is it?, Working paper,
Harvard University. Mitchell, Olivia S. and Stephen Utkus, 2004, Lessons from behavioral finance for retirement
plan design, in Olivia S. Mitchell and Stephen Utkus, eds., Pension design and structure: New Lessons from behavioral finance, Oxford, UK: Oxford University Press, forthcoming..
Munnell, Alicia H. and Annika Sunden, 2003, Coming up short: The challenge of 401(k) plans,
Brookings Institution Press: Washington, D.C. Myers, Stewart and Nicholas Majluf, 1984, Corporate financing and investment decisions when
firms have information that investors do not have, Journal of Financial Economics 13(2), 182-221.
Petersen, M.A., 1992, Pension reversions and worker-stockholder wealth transfers, Quarterly
Journal of Economics, Aug., 219-239. Poterba, James, Joshua Rauh, Steven Venti, and David Wise, 2003, Utility evaluation of risk in
retirement saving accounts, NBER working paper 9892. Profit Sharing/401(k) Council of America, 2002, 44th Annual survey of profit sharing and 401(k)
plans. Purcell, Patrick, 2002, Employer stock in retirement plans: Investment risk and retirement
security, CRS report for Congress, June. Rauh, Joshua, 2003, Own company stock in defined contribution pension plans: A takeover
defense?, Working Paper, MIT. Samuelson, William and Richard Zeckhauser, 1988, Status quo bias in decision making, Journal
of Risk and Uncertainty 1 (March), 7-59. Samwick, Andrew and Jonathan Skinner, 2003, How will 401(k) pension plans affect retirement
income?, American Economic Review, forthcoming. Schultz, Ellen E., and Theo Francis, 2002, Hot tax break: 401(k)s – Why firms stuff plans with
stock, Wall Street Journal, January. Shivdasani, Anil, 1993, Board composition, ownership structure, and hostile takeovers, Journal
of Accounting and Economics, 16, 167-198.

40
Smith, Clifford W. and Ross Watts, 1992, The investment opportunity set and corporate financing, dividend and compensation policies, Journal of Financial Economics 32 (3) December, 262-92.
Standard & Poor’s, 2001, Ratings performance 2000: Default, transition, recovery, and spreads,
January. United States Department of Labor, Private Pension Plan Bulletin, Winter 2001-2002. VanderHei, Jack, 2002, The role of company stock in 401(k) plans, Risk Management and
Insurance Review 5 (1), 1-20. Vanguard Group, 2003, Employer and Employee Attitudes Toward Company Stock in 401(k)
Plans, October.

41
Table 1: Sample Composition
Year Number of observations Number of
years in sample Number of firms Number of observations
1991 49 1 195 195
1992 174 2 204 408
1993 288 3 179 537
1994 338 4 113 452
1995 432 5 84 420
1996 537 6 73 438
1997 597 7 63 441
1998 635 8 29 232
1999 89 9 4 36
2000 40 10 2 20
TOTAL 3179 TOTAL 946 3179 Data collected for all U.S. companies listed in Compustat any year from 1993 to 1999 that filed an 11-k at least once during 1994-2001. See text for further details.

42
Table 2a: Characteristics of 1998 Sample, S&P 1500, and Public Firms
1998 Sample S&P 1500 Public Firms
Market Value ($ millions) Mean Median [ 10th % – 90th % ]
5,435 734
[ 69 – 9,574 ]
7,283 1,329
[ 238 – 14,211 ]
2,438 192
[ 26 – 3,260 ] Employees (000s) Mean Median [ 10th % – 90th % ]
13.1 4.3
[ 0.5– 30.3 ]
19.9 6.6
[ 0.9 – 45 ]
5.4 0.5
[ 0.02 – 10.2 ] Member of S&P 1500 (%)
51 100 20 Technology Sector (%)
15 19 24 Repurchase yield (%, mean)
1.76 1.82 1.77 Data are from Compustat. The share repurchase yield is the amount spent to repurchase shares divided by the average of the beginning-and end-of-year market value. Public firms include 7,501 U.S. firms.
Table 2b: Aggregate 401-k Plan Assets and Contributions for 1998 Sample, Public Firms, and All Firms
1998 Sample: 635 firms Public Firms All Firms Total 401-k Assets ($ billions)
264 698 1541 Total 401-k Assets in Company Stock ($ billions)
97 273 273 Employee and Employer Contributions ($ billions)
15.2 49.2 134.7 Contributions in Company Stock ($ billions)
4.9 NA NA Data on 401-k assets for public firms are from 1998 5500 filings with the Department of Labor. Data for all firms (public and private) are estimated by the Department of Labor. Company stock for public firms and all firms excludes stock indirectly held in trusts and pooled accounts. Employer contributions constitute 30 percent of total contributions for the 1998 sample and 31percent for all public firms.
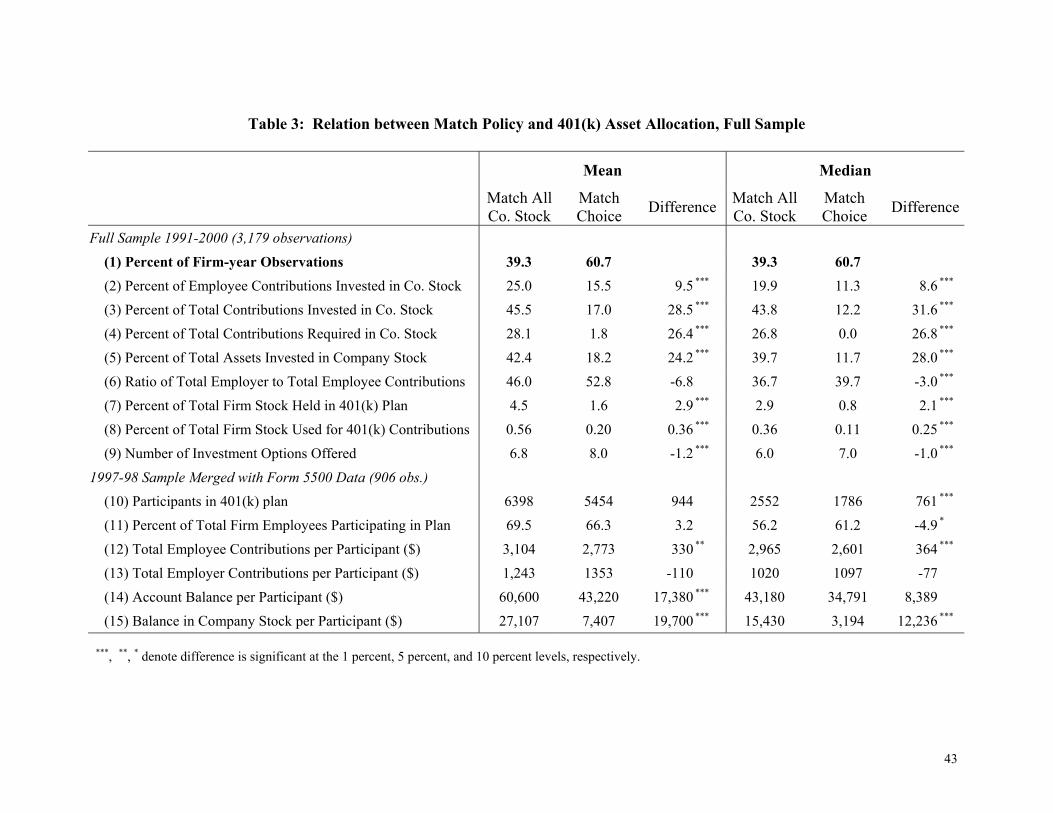
43
Table 3: Relation between Match Policy and 401(k) Asset Allocation, Full Sample
Mean Median
Match All Co. Stock
Match Choice Difference Match All
Co. StockMatch Choice Difference
Full Sample 1991-2000 (3,179 observations)
(1) Percent of Firm-year Observations 39.3 60.7 39.3 60.7
(2) Percent of Employee Contributions Invested in Co. Stock 25.0 15.5 9.5 *** 19.9 11.3 8.6 ***
(3) Percent of Total Contributions Invested in Co. Stock 45.5 17.0 28.5 *** 43.8 12.2 31.6 ***
(4) Percent of Total Contributions Required in Co. Stock 28.1 1.8 26.4 *** 26.8 0.0 26.8 ***
(5) Percent of Total Assets Invested in Company Stock 42.4 18.2 24.2 *** 39.7 11.7 28.0 ***
(6) Ratio of Total Employer to Total Employee Contributions 46.0 52.8 -6.8 36.7 39.7 -3.0 ***
(7) Percent of Total Firm Stock Held in 401(k) Plan 4.5 1.6 2.9 *** 2.9 0.8 2.1 ***
(8) Percent of Total Firm Stock Used for 401(k) Contributions 0.56 0.20 0.36 *** 0.36 0.11 0.25 ***
(9) Number of Investment Options Offered 6.8 8.0 -1.2 *** 6.0 7.0 -1.0 ***
1997-98 Sample Merged with Form 5500 Data (906 obs.)
(10) Participants in 401(k) plan 6398 5454 944 2552 1786 761 ***
(11) Percent of Total Firm Employees Participating in Plan 69.5 66.3 3.2 56.2 61.2 -4.9 *
(12) Total Employee Contributions per Participant ($) 3,104 2,773 330 ** 2,965 2,601 364 ***
(13) Total Employer Contributions per Participant ($) 1,243 1353 -110 1020 1097 -77
(14) Account Balance per Participant ($) 60,600 43,220 17,380 *** 43,180 34,791 8,389
(15) Balance in Company Stock per Participant ($) 27,107 7,407 19,700 *** 15,430 3,194 12,236 ***
***, **, * denote difference is significant at the 1 percent, 5 percent, and 10 percent levels, respectively.

44
Table 4: Regression of Match Policy on Firm Characteristics
(1) (2) (3) (4) (5) (6) (7) (8) (9) (10) (11) Defined Benefit Plan?
22.3 (3.3)
*** 21.3(4.9)
***
Monthly std. dev. of returns
-130.2(48.4)
*** 2.7(69.1)
Monthly idiosyncratic risk
-125.3(48.8)
***
Beta
-1.9(2.7)
Investment grade debt?
18.1(3.6)
*** 11.1(5.6)
**
Cash Flow-to-Assets
8.6(14.3)
Maximum (CF/Assets, 0)
33.1 (18.1)
* 51.4(31.5)
*
Minimum (CF/Assets, 0)
-20.2 (8.0)
*** -10.8(74.1)
Dividend Yield (in %)
3.3(1.0)
*** -1.0(1.4)
Market-to-book ratio
-0.5(1.4)
0.4(1.8)
Log (Employees)
1.9(1.1)
* -1.1(3.0)
Multiple classes of stock?
-17.0(7.0)
** -15.0(11.0)
Past 5-year stock return
-0.3(0.3)
S&P 500?
4.9(6.1)
Log (Assets)
-4.3(3.0)
Dummies for Firm Age No No No No No No No No No No Y, (p=0.09)2-digit Industry effects No No No No No No No No No No Y, (p=0.00)Year effects Yes Yes Yes Yes Yes Yes Yes Yes Yes Yes Y, (p=0.00)R2 0.0708 0.0311 0.0312 0.0521 0.0209 0.0246 0.0359 0.0208 0.0227 0.0261 0.2267 Number of observations 3,179 2,679 2,679 3,179 3,098 3,098 3,170 3,141 2,993 3,179 2,089 ***, **, * denote significance at the 1 percent, 5 percent, and 10 percent levels, respectively.
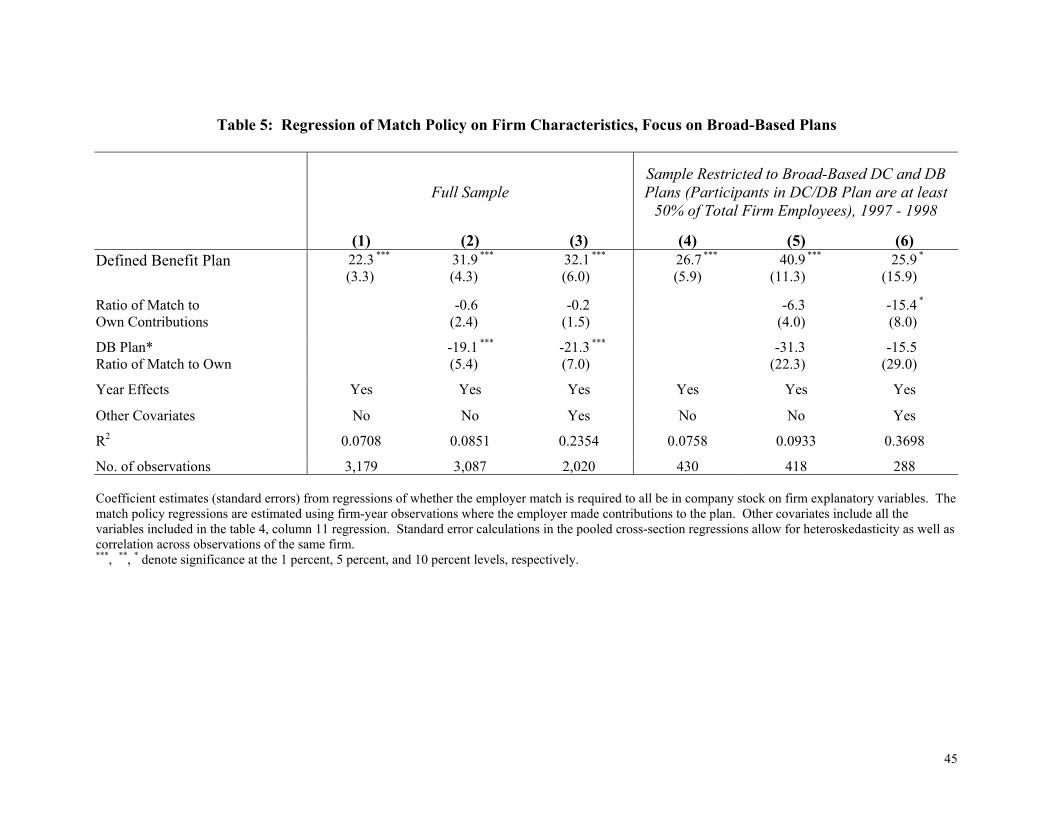
45
Table 5: Regression of Match Policy on Firm Characteristics, Focus on Broad-Based Plans
Full Sample Sample Restricted to Broad-Based DC and DB Plans (Participants in DC/DB Plan are at least
50% of Total Firm Employees), 1997 - 1998
(1) (2) (3) (4) (5) (6) Defined Benefit Plan
22.3(3.3)
*** 31.9(4.3)
*** 32.1(6.0)
*** 26.7(5.9)
*** 40.9(11.3)
*** 25.9(15.9)
*
Ratio of Match to Own Contributions
-0.6(2.4)
-0.2(1.5)
-6.3(4.0)
-15.4(8.0)
*
DB Plan* Ratio of Match to Own
-19.1(5.4)
*** -21.3(7.0)
*** -31.3(22.3)
-15.5(29.0)
Year Effects Yes Yes Yes Yes Yes Yes
Other Covariates
No No Yes No No Yes
R2
0.0708 0.0851 0.2354 0.0758 0.0933 0.3698
No. of observations 3,179 3,087 2,020 430 418 288 Coefficient estimates (standard errors) from regressions of whether the employer match is required to all be in company stock on firm explanatory variables. The match policy regressions are estimated using firm-year observations where the employer made contributions to the plan. Other covariates include all the variables included in the table 4, column 11 regression. Standard error calculations in the pooled cross-section regressions allow for heteroskedasticity as well as correlation across observations of the same firm. ***, **, * denote significance at the 1 percent, 5 percent, and 10 percent levels, respectively.
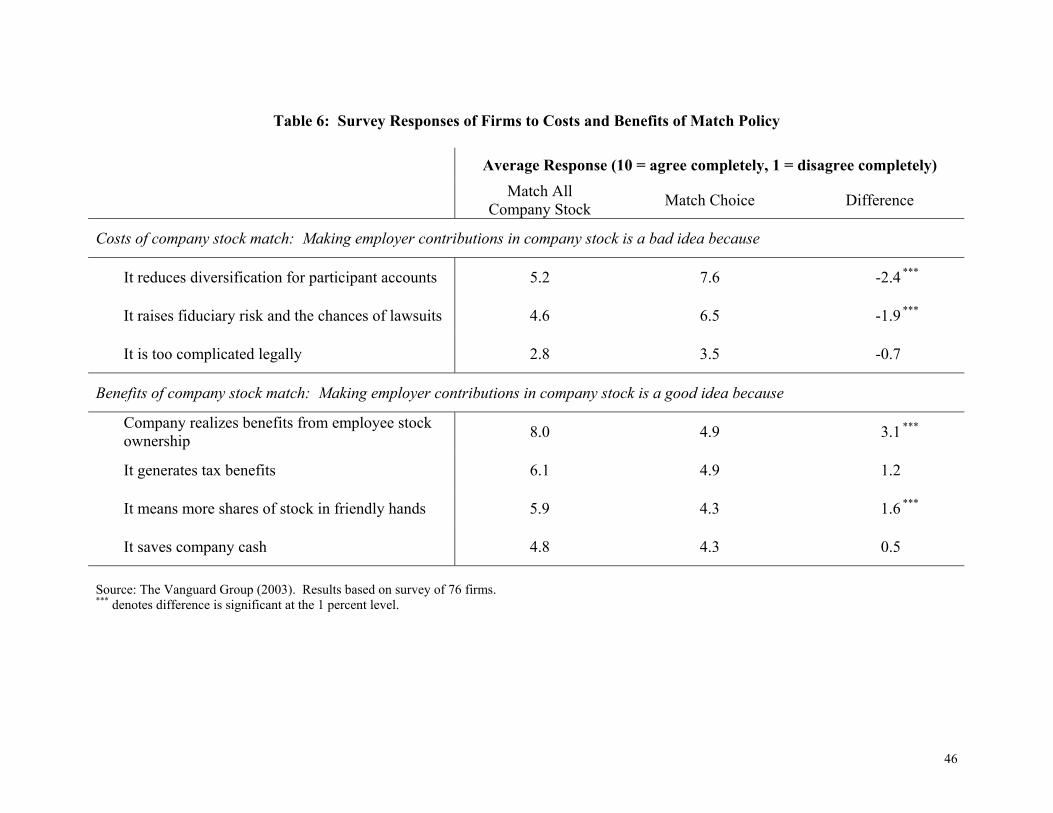
46
Table 6: Survey Responses of Firms to Costs and Benefits of Match Policy
Average Response (10 = agree completely, 1 = disagree completely)
Match All Company Stock Match Choice Difference
Costs of company stock match: Making employer contributions in company stock is a bad idea because
It reduces diversification for participant accounts 5.2 7.6 -2.4 ***
It raises fiduciary risk and the chances of lawsuits 4.6 6.5 -1.9 ***
It is too complicated legally 2.8 3.5 -0.7
Benefits of company stock match: Making employer contributions in company stock is a good idea because
Company realizes benefits from employee stock ownership 8.0 4.9 3.1 ***
It generates tax benefits 6.1 4.9 1.2
It means more shares of stock in friendly hands 5.9 4.3 1.6 ***
It saves company cash 4.8 4.3 0.5
Source: The Vanguard Group (2003). Results based on survey of 76 firms. *** denotes difference is significant at the 1 percent level.

47
Table 7: Regression of Percent of Employee Contributions in Company Stock, Money Market,
and Other Options on Plan Characteristics, Past Asset Returns, and Firm Characteristics
Percent of Employee Contributions in Other OptionsVariable
Percent of Employee Contributions
in Company Stock
Percent of Employee Contributions
in Money Market Average per option Other options in total
Match required to be in company stock?
8.1(1.2)
*** 6.9(1.3)
*** -2.9(0.9)
*** -2.8 (1.1)
*** -1.6(0.4)
*** -1.2(0.4)
*** -5.5(1.2)
*** -4.2(1.3)
***
1 / # of investment options 79.8(8.6)
*** 98.3(12.4)
*** 84.6(7.5)
*** 52.5 (10.7)
*** 82.4(4.3)
*** 77.9(5.2)
*** -177.0(7.5)
*** -167.6(10.0)
***
Safest option is GIC (rather than money market)?
10.3(0.9)
*** 11.2 (1.1)
***
Monthly standard deviation of past stock returns
-33.8(14.5)
** 27.8 (13.2)
** 5.6(5.1)
17.8(15.1)
Own Company Stock return over past five years
0.5(0.3)
-0.1 (0.1)
-0.1(0.1)
-0.4(0.2)
*
Value-Weighted Market return over past five years
-1.1(0.9)
-4.8 (0.9)
*** 0.5(0.3)
* 5.2(1.0)
***
Treasury Bill return over past five years
-24.7(11.6)
** 78.8 (9.5)
*** -12.5(4.3)
*** -49.4(10.5)
***
Gov’t Bond return over past five years
-0.6(1.6)
2.7 (1.4)
* 0.8(0.6)
-2.1(1.7)
Market-to-book ratio
1.3(0.4)
*** -0.1 (0.4)
-0.5(0.2)
*** -1.0(0.5)
**
Log (Assets)
2.6(0.4)
*** 0.8 (0.4)
** -0.8(0.1)
*** -3.4(0.4)
***
Constant
3.1(1.3)
** -9.1(3.9)
** 0.8(1.1)
-21.0 (3.9)
*** 2.0(0.6)
*** 10.9(1.5)
*** 92.9(1.3)
*** 124.3(4.3)
***
R2 0.1830 0.3059 0.2729 0.3707 0.4766 0.5082 0.3339 0.4959 Number of observations 3,133 2,207 3,133 2,207 3,117 2,196 3,117 2,196 Coefficient estimates (standard errors) from regressions of the percent of employee contributions allocated to various investment options on pension plan characteristics, past asset returns, and firm characteristics. Standard error calculations in the pooled cross-section regressions allow for heteroskedasticity as well as correlation across observations of the same firm. ***, **, * denote significance at the 1 percent, 5 percent, and 10 percent levels, respectively.

48
Table 8: Relation between Match Policy and Stock Return/Risk, Full Sample
Mean Median
Match All Co. Stock 293 firms
Match Choice 574 firms Difference
Match All Co. Stock 293 firms
Match Choice 574 firms Difference
Average Monthly Return (in %) 1.58 1.60 -0.02 1.51 1.53 -0.02
Average Monthly Excess Return (in %) 0.32 0.29 0.04 0.32 0.25 0.07
Market (market minus risk-free rate) Beta 0.98 1.04 -0.06 1.01 1.02 -0.01
Size (small minus big) Beta 0.37 0.59 -0.22 *** 0.28 0.50 -0.22 ***
Book-to-Market (high minus low) Beta 0.47 0.53 -0.06 0.55 0.61 -0.06
Momentum (up minus down) Beta -0.17 -0.18 0.01 -0.10 -0.12 0.02
Standard Deviation of Monthly Returns (%) 11.4 13.0 -1.6 *** 9.9 11.9 -2.0 ***
Monthly Idiosyncratic Risk (in %) 10.1 11.6 -1.5 *** 8.6 10.7 -2.1 ***
The average monthly excess return and idiosyncratic risk are calculated from a four-factor (i.e., market, size, book-to-market, and momentum) model proposed by Carhart (1997). ***, **, * denote difference is significant at the 1 percent, 5 percent, and 10 percent levels, respectively.

49
Table 9: Distribution of 401(k) Plan Assets by Match Policy and Firm Characteristics
Base Case Vary Match Policy Vary Firm Characteristics
Choice Firm & Choice Match
Co. Stock Firm & Co. Stock Match
Co. Stock Firm & Choice Match
Co. Stock Firm & Co. Stock Match
Choice Firm & Co. Stock Match
Co. Stock Firm & Co. Stock Match
% higher wealth 31 69 41 59 12 88
Account Balance at Age 62 ($000s) Mean 962 1,223 898 1,223 1,411 1,223 1st % 131 109 135 109 102 109
5th % 172 151 177 151 140 151
10th % 203 186 209 186 169 186
25th % 285 279 296 279 252 279
50th % 464 490 488 490 461 490 75th % 868 1,028 881 1,028 972 1,028 90th % 1,801 2,258 1,713 2,258 2,377 2,258
95th % 2,864 3,767 2,662 3,767 4,272 3,767
99th % 8,073 12,135 7,043 12,135 15,457 12,135
Constant Relative Risk Aversion such that Indifferent Across Firms and/or Match Policy, Additional Uncorrelated Wealth ($000s) Prefer co. stock match if CRRA < X Prefer co. stock match if CRRA < X Prefer co. stock firm if CRRA > X 0 1.8 1.5 0.6 250 2.9 2.3 0.6 500 4.0 3.0 0.7 1000 6.1 4.3 0.8 Source: Authors’ calculations as described in text.

50
Table 10: Distribution of 401(k) Plan Assets by Match Policy Under Alternative Scenarios
(1) (2) (3) (4) (5) (6) (7)
Base case (1) plus
administrative costs
(2) plus match in co. stock boosts own contr. to
company stock
(3) plus firms that match in
co. stock offer one less option
(4) plus risk of firm going bankrupt
(4) plus lower equity premium
by 0.325% per month
(4) plus bankruptcy risk and lower
equity premium
Choice Co. Stock Choice Co.
Stock Choice Co. Stock Choice Co.
Stock Choice Co. Stock Choice Co.
Stock Choice Co. Stock
% times have higher wealth 31 69 28 72 34 66 30 70 34 66 51 49 55 45
Account Balance at Age 62 ($000s) Mean 962 1,223 894 1,178 894 1,242 894 1,262 872 1,229 406 523 399 512 1st % 131 109 124 103 124 98 124 96 123 94 101 74 100 73
5th % 172 151 161 143 161 139 161 137 160 135 122 96 122 95
10th % 203 186 190 176 190 171 190 170 189 167 138 113 137 112
25th % 285 279 267 265 267 263 267 260 263 249 174 155 173 149
50th % 464 490 431 463 431 465 431 465 427 445 244 243 244 235 75th % 868 1,028 798 981 798 1,014 798 1,021 786 1,016 390 454 385 454
90th % 1,801 2,258 1,648 2,165 1,648 2,278 1,648 2,308 1,582 2,253 706 927 679 926
95th % 2,864 3,767 2,647 3,638 2,647 3,855 2,647 3,934 2,548 3,845 1,044 1,492 1,022 1,483
99th % 8,073 12,135 7,502 11,869 7,502 12,828 7,502 13,180 7,157 12,387 2,721 4,703 2,635 4,665
Constant Relative Risk Aversion such that Indifferent Across Match Policy, Additional Uncorrelated Wealth ($000s), Prefer Company Stock Match if CRRA < X
0 1.8 2.0 1.9 1.9 1.7 1.2 1.2 250 2.9 3.5 3.3 3.2 2.7 2.2 2.0 500 4.0 4.9 4.5 4.3 3.7 3.1 2.8 1000 6.1 7.6 7.0 6.7 5.5 4.8 4.3 Source: Authors’ calculations as described in text.

51
Table 11: Distribution of 401(k) Plan Assets Under Firm’s Own Match Policy and Counterfactual Match Policy
Base Case Add Lower Equity Premium and Bankruptcy Choice Firm Company Stock Firm Choice Firm Company Stock Firm
Choice Match Co. Stock Match Choice Match Co. Stock Match Choice Match Co. Stock Match Choice Match Co. Stock Match
% higher wealth 51 49 65 35
% higher wealth 41 59 59 41
% higher wealth 31 69 55 45
Account Balance at Age 62 ($000s) Mean 962 1,411 898 1,223 399 573 380 512 1st % 131 102 135 109 100 69 102 73
5th % 172 140 177 151 122 89 124 95
10th % 203 169 209 186 137 103 140 112
25th % 285 252 296 279 173 139 177 149
50th % 464 461 488 490 244 222 247 235 75th % 868 972 881 1,028 385 430 392 454
90th % 1,801 2,377 1,713 2,258 679 922 666 926
95th % 2,864 4,272 2,662 3,767 1,022 1,625 954 1,483
99th % 8,073 15,457 7,043 12,135 2,635 5,768 2,335 4,665
Constant Relative Risk Aversion such that Indifferent Across Match Policy, Additional Uncorrelated Wealth ($000s), Prefer Company Stock Match if CRRA < X
Choice Firm (choice vs. co. stock)
Co. Stock Firm (choice vs. co. stock)
Co. Stock Firm vs. Choice Firm
Choice Firm (choice vs. co. stock)
Co. Stock Firm (choice vs. co. stock)
Co. Stock Firm vs. Choice Firm
0 1.2 1.5 1.8 0.8 1.0 1.2 250 1.6 2.3 2.9 1.3 1.6 2.2 500 2.0 3.0 4.0 1.7 2.2 3.1 1000 2.7 4.3 6.0 2.4 3.3 4.9 Source: Authors’ calculations as described in text.

52
Table 12: Distribution of 401(k) Plan Assets Assuming Workers Invest All Contributions in a Single Fund, by Match Policy
(1) (2) (3) (4) (5) (6) (7) Company
Stock Money Market
Government Bonds
Corporate Bonds
Balanced Fund
Large-cap Equity Fund
Small-cap Equity Fund
Choice Co. Stock Choice Co.
Stock Choice Co. Stock Choice Co.
Stock Choice Co. Stock Choice Co.
Stock Choice Co. Stock
% times have higher wealth 10 90 42 58 32 68 42 58 48 52 41 59 78 22
Account Balance at Age 62 ($000s) Mean 824 694 150 331 196 362 210 371 247 397 354 467 812 770 1st % 11 17 129 101 101 90 116 100 93 78 59 54 41 43
5th % 22 32 135 109 120 110 136 120 118 103 86 82 70 74
10th % 31 45 138 114 132 124 148 133 135 121 108 104 96 99
25th % 62 85 144 129 155 151 171 161 171 159 160 157 174 174
50th % 153 186 150 163 187 200 203 209 224 226 257 262 359 345 75th % 459 524 156 275 227 315 241 324 297 374 425 479 793 760
90th % 1,319 1,327 162 543 271 582 283 594 387 670 692 885 1,731 1,604
95th % 2,634 2,307 165 871 302 906 312 917 456 1,002 941 1,282 2,809 2,532
99th % 10,478 8,166 172 2,825 373 2,855 378 2,880 625 3,024 1,682 3,423 7,359 6,927 Constant Relative Risk Aversion such that Indifferent Across Match Policy, Additional Uncorrelated Wealth ($000s)
Prefer co.
stock match if CRRA > X
Prefer company stock match if CRRA < X Prefer co.
stock match if CRRA > X
0 0.4 4.4 3.8 3.1 2.2 2.1 1.8 250 0.5 11.1 9.1 6.8 4.5 4.3 4.1 500 0.6 17.8 14.4 10.5 6.7 6.4 6.2 1000 0.7 31.2 24.8 17.7 11 10.5 10.4 Source: Authors’ calculations as described in text. It is assumed that when the match is unrestricted (i.e., choice), that the worker invests both employee and employer contributions in the one asset, and when the match is required to be in company stock, the employer contribution is invested in company stock, but the employee contribution is invested in the one asset. Simulations incorporate a reduction in the equity premium as well as bankruptcy risk.

53
Appendix Table 1: Summary Statistics of Firm Characteristics by Match Policy, Full Sample
Mean Median
Variable (in percent) Match All Co. Stock
Match Choice Difference Match All
Co. Stock Match Choice Difference
Defined Benefit Plan? 68.3 44.0 24.3 *** 100.0 0.0 100.0 ***
Total Monthly Volatility 9.3 10.2 -0.9 *** 8.2 9.5 -1.3 ***
Idiosyncratic Monthly Risk 8.5 9.5 -1.0 *** 7.3 8.8 -1.5 ***
Market Beta 0.86 0.88 -0.02 0.86 0.87 -0.01
Investment Grade Debt? 48.9 30.2 18.8 *** 0.0 0.0 0.0
Cash Flow / Assets 12.6 12.2 0.4 12.5 12.3 0.3
Is Cash Flow/Assets <0? 3.5 3.5 -0.1 0.0 0.0 0.0
Cash Flow / Assets (if > 0) 14.0 13.0 1.0 12.9 12.5 0.4
Cash Flow / Assets (if < 0) -26.7 -11.0 -15.7 -8.8 -6.6 -2.2
Pay Dividends? 70.6 57.5 13.1 *** 100.0 100.0 0.0
Dividend Yield 1.94 1.36 0.58 *** 1.57 0.63 0.94 ***
Market-to-Book Ratio 1.68 1.73 -0.06 1.30 1.33 -0.03
Total Employees (000s) 18.0 13.0 5.0 5.0 4.0 1.0 **
Multiple Classes of Stock? 3.0 6.5 -3.5 ** 0.0 0.0 0.0
Past 5-year stock return 137.4 177.0 -39.5 * 95.0 92.8 2.6
S&P 500? 35.0 21.9 13.1 *** 0.0 0.0 0.0
Firm Market Cap ($ mil) 4191 4258 -67 1068 619 452 ***
Firm Assets ($ mil) 8261 6828 1433 1469 900 570 ***
***, **, * denote difference is significant at the 1 percent, 5 percent, and 10 percent levels, respectively.

54
Appendix Table 2: Correlation of Firm Characteristics, Full Sample
(1) (2) (3) (4) (5) (6) (7) (8) (9) (10) (11) (12) (13) (14) (1) Match in company stock
1.00
(2) Defined Benefit Plan
0.24 *** 1.00
(3) Monthly std. dev. of returns
-0.11 *** -0.41 *** 1.00
(4) Investment grade debt?
0.19 *** 0.39 *** -0.43 *** 1.00
(5) Cash Flow-to-Assets
0.02 0.10 *** -0.07 *** 0.06 *** 1.00
(6) Cash Flow-to-Assets (if > 0)
0.05 *** 0.06 *** 0.06 *** -0.01 1.00 1.00
(7) Cash Flow-to-Assets (if < 0)
-0.19 ** 0.13 -0.20 * 0.07 1.00 NA 1.00
(8) Dividend Yield
0.15 *** 0.33 *** -0.56 *** 0.35 *** -0.02 -0.12 *** 0.11 1.00
(9) Market-to-book ratio
-0.02 -0.08 *** 0.13 *** -0.04 ** 0.31 *** 0.61 *** -0.21 ** -0.21 *** 1.00
(10) Log (Employees)
0.07 *** 0.38 *** -0.34 *** 0.45 *** 0.20 *** 0.04 ** 0.46 *** 0.14 *** -0.01 1.00
(11) Multiple classes of stock?
-0.08 *** -0.07 *** 0.02 -0.06 *** -0.00 -0.03 0.06 -0.08 *** -0.03 0.00 1.00
(12) Past 5-year stock return
-0.05 *** -0.15 *** 0.15 *** 0.00 0.13 *** 0.13 *** 0.02 -0.14 *** 0.30 *** 0.05 ** 0.03 1.00
(13) S&P 500?
0.14 *** 0.35 *** -0.32 *** 0.52 *** 0.12 *** 0.11 *** 0.07 0.21 *** 0.11 *** 0.60 *** -0.07 *** 0.00 1.00
(14) Log (Assets)
0.10 *** 0.42 *** -0.50 *** 0.59 *** 0.01 -0.22 *** 0.53 *** 0.36 *** -0.13 *** 0.72 *** -0.03 ** 0.04 ** 0.60 *** 1.00
***, **, * denote significance at the 1 percent, 5 percent, and 10 percent levels, respectively.