nber - auburn universitydza0013/mike grossman auburn seminar paper 12 … · cornell university and...
TRANSCRIPT

Dhaval Dave Bentley University, NBER, and IZA
Daniel Dench
City University of New York Graduate Center
Michael Grossman City University of New York Graduate Center, NBER, and IZA
Donald S. Kenkel
Cornell University and NBER
Henry Saffer NBER
This paper was presented at the 87th Annual Meetings of the Southern Economic Association in Tampa, FL, November 17-19, 2017; the Eleventh World Congress of the International Health Economics Association in Boston, MA, July 8-11, 2017; and the 43rd Annual Conference of the Eastern Economic Association in New York, NY, February 23-26, 2017. The paper also was presented at a seminar at IZA in Bonn, Germany, November 7, 2017. We are grateful to participants in those forums, especially Hope Corman and Ji Yan, for helpful comments and suggestions. Research for this paper was supported by grant 1R01DA039968A1 from the National Institute on Drug Abuse to the NBER.

1
I. Introduction
Electronic Nicotine Delivery Systems (ENDS), of which electronic cigarettes (e-
cigarettes) constitute the most common sub-product, are a non-combustible alternative to
smoking. As opposed to smoking cigarettes, the use of ENDS, termed vaping, delivers nicotine
to the user without exposing that person to tar—the substance in cigarettes responsible for most
of its harm. In all ENDS products (referred to as e-cigarettes or e-cigs from now on), a liquid
containing nicotine is vaporized by a battery powered heating device. There is no research on
the long-term health effects of e-cig use; however, currently e-cigs are believed to be less
dangerous than cigarettes because the vapor does not contain the toxins contained in the smoke
of conventional cigarettes (Goniewicz; et al. 2013; Czogala et al. 2014 US Federal Drug
Administration 2016b; US National Institute on Drug Abuse 2016). On the other hand,
adolescent nicotine exposure via e-cigarettes may have lasting adverse consequences for
cognitive development (US Surgeon General 2014). A second concern is that accidental
poisoning can result from the damaging of e-cigarette products as reflected by the large increase
in the number of calls to poison centers involving e-liquids (Richtel 2014). The greatest danger
may be that these products may induce adolescents to begin nicotine addiction first by using e-
cigs and then transitioning into smoking (Marcus 2014).
Current prevalence of the use of e-cigarettes by adults has increased dramatically since
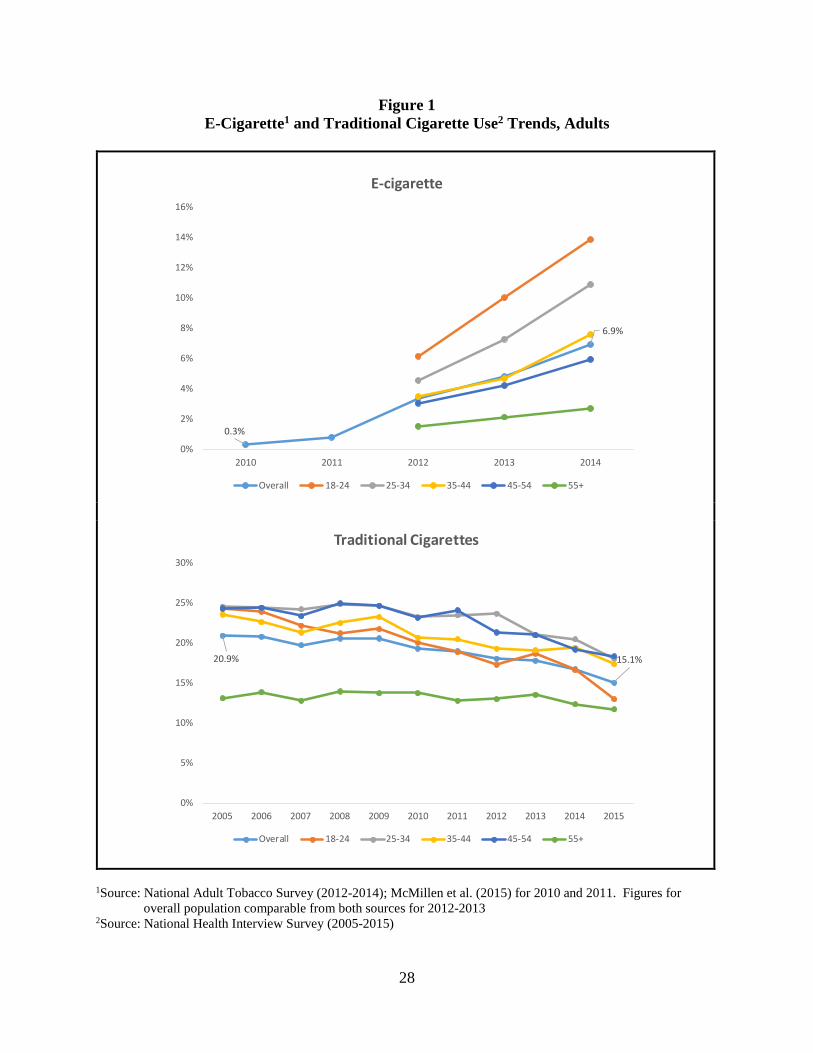
they were first introduced in the US in 2007. According to the upper portion of Figure 1,
participation grew from 0.3 percent in 2010 to 6.9 percent in 2014. Participation by 18-24 year
olds approximately doubled that of adults of all ages in years in which data for the former group
are available. The lower portion of Figure 1 highlights the well-known downward trend in
smoking participation by adults. That rate fell from 20.9 percent in 2005 to 15.1 percent in 2015.

2
In the latter year the number of adults who smoke fell below 40 million for the first time since
record keeping of the behavior began 50 years ago (Ahmed et al. 2016). That downward trend
also is evident in the period in which trends in e-cigarette participation are available (2011-2015)
Figure 1. Participation fell by slightly less than 4 percentage points in that period. The almost 2
percentage point decline in that rate between 2014 and 2015 was the largest in more than twenty
years.
Figure 2 depict similar trends for youths. Past-month participation in e-cigarettes by
youths in grades 6 through 12 increased from 1.0 percent in 2011 to 11.3 percent in 2015. At the
same time, past month participation in cigarettes fell from 10.5 percent in the former year to 6.1
percent in the latter year. The long-term reduction in the latter outcome for adults in in Figure 1
also is evident for youths since the participation rate of 13.2 percent in 2006 was more than
double the rate in 2015.
Concurrent with the surge in e-cigarette use, there has been a substantial increase in
advertising from $5.6 million in 2010 to $82.1 million in 2013, with the vast majority of
spending devoted to magazines (59 percent) and television (27 percent) with national reach
(Kim, Arnold, and Makarenko 2014). Figure 3 depicts these trends in more detail. There was
virtually no advertising before 2012, followed by a sharp increase through 2014. Advertising
decreased in 2015 but increased again in 2016.1 Almost 48 percent of adults have been exposed
to e-cigarette marketing (Kim, Arnold, and Makarenko 2014) and youth exposure to TV ads
increased over 250 percent between 2011 and 2013 (Duke et al. 2014).
1 Mickle (2015) attributes the reduction in advertising in 2015 to inventory backlogs, new state laws, and uncertainty concerning final rules concerning the regulation of e-cigarettes by the Food and Drug Administration. These regulations were announced in May 2016 (see below).

3
The trends just discussed have generated an extremely contentious policy debate
concerning the regulation of e-cigarettes. At the heart of this regulatory debate are fundamental
questions regarding whether e-cigarettes will draw cigarette smokers away from a dangerous
habit or lure new initiates into tobacco use and lead to a new generation of nicotine addicts.
While e-cigarettes are not a completely safe alternative to cigarettes, in April 2016 the Royal
College of Physicians in Great Britain issued a report urging smokers to switch to e-cigarettes
(Royal College of Physicians 2016). That echoed advice some physicians had started giving to
their patients who smoked (Kandra et al. 2014). A few weeks later, the European Court of
Justice, Europe’s highest court, found that the European Union had the right to regulate e-
cigarettes including banning advertising (Jolly 2016). At approximately the same time, the U.S.
Food and Drug Administration, which was given the authority to regulate ENDS by the 2009
Family Protection and Tobacco Control Act, announced regulations that would ban the sale of e-
cigarettes and related products to minors at the national level and would require all products that
were not commercially marketed prior to February 15, 2007 to gain FDA approval (U.S. Food
and Drug Administration 2016a). While e-cigarette advertisements were not banned on
television, the approval process can be quite lengthy. Thus, it has the potential to eliminate
many current producers and result in significant price increases.
Since few individuals start to smoke after their early twenties, the downward trend in
adult smoking participation in Figure 1 reflects an upward trend in the number of smokers who
quit. The increase in the number of adults who use e-cigarettes in the period in which the two
series overlap is suggestive, although certainly not definitive, evidence that the product may have
encouraged and may continue to encourage smokers to quit. Since some of the very recent
reduction in participation may reflect a lagged response to the introduction of e-cigarettes, that

4
product may continue to reduce future reductions in smoking. Hence, for adults, e-cigarettes
may be a harm-reducing device. The flip side is that the downward trend in youth smoking
participation in Figure 2 reflects a reduction in the number who start to smoke. Possibly, that is
because they start to vape instead. Clearly, it is much too early to evaluate whether that trend is
harm-reducing because youths who initiate the use of nicotine with e-cigarettes may transition to
conventional cigarettes or to dual use. In addition, their cognitive development may be impaired.
The purpose of this paper is to shed light on one side of the contentious debate just
outlined by investigating whether e-cigarette advertising on television and in magazines
encourage adult smokers to quit. To preview our results, the answer to this question is a
tentative yes for TV advertising but no for magazine advertising. We use extremely detailed
information on TV viewing patterns and magazine issues read in the Simmons National
Consumer Survey and match this information to all e-cigarette ads aired on national and local
broadcast and cable stations and all ads published in magazines from Kantar Global. The match
yields estimates of the number of ads seen and read by each survey respondent in the past six
months. We find that an additional ad seen on TV increases the number of adults who quit
smoking by almost 1 percent relative to a mean quit rate of 9 percent in the past year.
II. Prior Studies
There are no prior studies that contain estimates of the effects of e-cigarette advertising
on quit behavior of current smokers. Three streams of literature do, however, bear on our study.
One addresses the effectiveness of e-cigarettes when used to aid smoking cessation in
comparison with nicotine replacement therapy (NRT) and with unaided quitting (“cold turkey”
quitting). Brown et al. (2014) and Zhuang et al. (2016) found that quit rates were higher among
e-cigarette users than among the other two groups. On the other hand, Kalkhoran and Glantz

5
(2016) review a number of studies that reach the opposite conclusion, although the studies find
that the use of e-cigarettes is associated with some quitting. Some of this research is based on
small samples of smokers and does not control for unobserved factors that may be correlated
with the decision to use a particular method to attempt to quit.
The second group of studies contains estimates of the effects of advertising on sales or
consumption of e-cigarettes and combustible cigarettes. In two related papers with the same data
but with slightly different estimation methods (Zheng et al. 2016, 2017) found that TV
advertising increased per capita e-cigarette sales by convenience stores in a time series of 30 US
cities in the period from 2009 through 2013. Results for magazine ads were inconclusive.
Clearly, these results do not pertain specifically to the behavior of consumers, and there is no
way of assessing whether individuals who made the purchases actually were exposed to the ads.
O’Connor et al. (2016) report that subjects who participated in an experimental auction in
which they bid for e-cigarettes were willing to pay more if they saw print ads for the product
prior to the auction compared to those who saw no ads. This result did not carry over to those
who saw TV ads. In a study with a similar research design, Rousu, O’Connor, and Corrigan
(forthcoming) report cases in which participants who were exposed to an ad for a specific brand
of e-cigarettes were willing to pay more for that brand and less for a competing product. They
also report cases in which exposure to an ad for one product appears to increase demand for that
product as well as for cigarettes based on willingness to pay bids. If these results carry over to a
real-world setting as opposed to an experimental setting, they suggest reasons why advertising
may not encourage quit behavior. But they are based on small samples of individuals who reside
in one or two cities. Hence, they may not generalize to the population of smokers at large.

6
From a methodological perspective, our study is most closely related to the body of
literature in which detailed information on consumer TV viewing and magazine reading patterns
in the Simmons National Consumer Survey (NCS) is combined with comprehensive measures of
advertising in these two media primarily from Kantar Media to assess the effects of advertising
on the demand for cigarettes (Avery et al. 2007; Kenkel, Mathios, and Wang forthcoming);
smokeless tobacco (Dave and Saffer 2013); alcohol (Molloy 2016); pharmaceutical products to
treat allergies, arthritis, asthma, high cholesterol (Avery et al. 2008); antidepressants (Avery,
Eisenberg, and Simon 2012); weight-loss products (Avery et al. 2013); and vitamins (Eisenberg,
Avery, and Cantor forthcoming). Most of these studies find positive effects of advertising on the
outcomes being considered. The one by Avery et al. (2007) is especially relevant because they
find that an increase in exposure to magazine advertisements of nicotine replacement therapy
(NRT) products is associated with higher quit rates among cigarette smokers.
The NCS is a nationally representative proprietary marketing survey whose media usage
and consumer demographic information are utilized by virtually all major marketing and
advertising firms in the US (Avery et al. 2013). Hence, the use of the NCS allows one to observe
the same consumer information and characteristics as the advertiser, minimizing the “targeting
bias” that would result from ads potentially being targeted based on unobserved factors (Avery et
al. 2007). Furthermore, the in-depth information on media usage allows one to construct detailed
and salient measures of advertising exposure that vary at the individual level to identify plausibly
causal effects of this exposure. For instance, even readers of the same magazine may be exposed
to different levels of e-cigarette ads due to variation in their reading frequency and the staggering
of ads across different months and issues, and similarly for viewers of the same TV program.
III. Empirical Implementation

7
A. Sample and Measurement of Outcomes
The NCS is a repeat cross section conducted on a quarterly basis and contains
approximately 25,000 individuals ages 18 and over each year. Because no information on e-
cigarettes was obtained prior to the fourth quarter of 2013, we use data from that quarter through
the fourth quarter of 2015.2 That yields an approximate sample size of 58,000 individuals.
Respondents report their current smoking status and smoking cessation (attempted and whether
successful) over the past year.
One limitation of the NCS is that information on e-cigarette use is available only in the
context of quitting. That is, individuals respond whether they attempted to quit smoking, in the
past year and if so, whether they used e-cigarettes as a method. A second limitation is that there
is no information on the number of e-cigarettes currently smoked or smoked in the past year.
Note, however, that a key question at the center of the harm reduction/policy debates concerns
whether e-cigarette advertising impacts smoking cessation. To that end, the structure of the
questions in the NCS are helpful towards assessing whether that advertising has impacted
smoking cessation in general, and smoking cessation with the aid of e-cigarettes in particular.
Furthermore, the NCS also asks respondents whether their quit attempt involved FDA-approved
nicotine replacement therapy (NRT). One concern among public health officials and
policymakers is that the use of e-cigarettes as an unsanctioned cessation aid may crowd-out other
approved (and possibly more effective) modes of smoking cessation. Thus, with the NCS, we
directly test whether ENDS advertising (and other regulations) have affected smoking cessation
through approved methods such as NRT.
2 We cannot include more recent Simmons surveys because they are extremely expensive.

8
Given the structure of the survey, we limit our sample to individuals who are either past-
year quitters or current smokers (N = 8,302). There are three groups in the sample: successful
quitters or simply quitters (Q = 747), unsuccessful quitters or simply failures (F = 2,330), and
non-attempters (D = 5,225). The last two groups form the larger group of current smokers.
Panel A of Table 1 contains the basic outcomes that we consider in our empirical analysis
and the mean of each outcome. The quit rate in the sample (q = Q/N) expressed as a percentage
is 9.0 percent, and the failure rate (f = F/N) is 28.1 percent. Hence, the attempt rate
(A/N = a = q + f, where A = Q + F) is 37.1 percent, or almost 40 percent of the sample attempted
to quit in the past year. In addition to considering the attempt, quit, and failure rates as
outcomes, we examine the determinants of the success rate conditional on an attempt or the
conditional probability of success (π = Q/A = q/a). The mean of that outcome is 24.3 percent.3
Panel B of Table 1 contains outcomes related to those in Panel A that we also examine.
They are the percentage of attempts accounted for by each of four specific methods of quitting
and the success rate of each method. The methods are the use of e-cigarettes only, the use of
nicotine replacement therapy (NRT) only, cold turkey (attempts without the use of any products
and without any assistance), and other methods (gradual reduction, hypnosis, acupuncture, quit
smoking programs, and mixed methods). Attempts using e-cigarettes account for the second
highest percentage of all attempts (23.8 percent compared not surprisingly to 39.9 percent for
mixed methods). Attempts using e-cigarettes have the second highest success rate (30.0 percent
compared to 31.5 percent for cold turkey attempts). It is notable that the NRT quit rate is lower
than the e-cigarette rate. Again not surprisingly, attempts to quit by other methods are the least
successful.
3 The rates just defined can be interpreted as probabilities at the individual level.

9
Note that the sample includes starters (individuals who began to smoke for the first
time sometime during the past year but less than one year ago) and restarters (individuals who
smoked in the past but did not smoke one year ago). Put differently, the sample is not limited to
people who smoked exactly one year prior to their interview date because smoking status on that
date is not obtained. Note also that starters and restarters may also have quit in the past year.
Note finally that starters are likely to comprise a very small percentage of the sample since
almost all smokers initiate that behavior by their early twenties.
B. Measurement of Advertising
To measure the NCS respondent’s potential exposure to e-cigarette advertising, we
combine questions that ask respondents about their TV watching and magazine reading habits
with ad placements in TV and magazine. There are two sets of broad questions in the NCS about
TV viewing behavior. One set of questions tells us the times they have watched specific
channels in the past week. To give a couple of examples, a respondent may check that they have
watched NBC from 8:00 PM-8:30 PM, sometime from Monday-Friday, or that they watched
Bravo from Noon-3 PM on the weekend. Note that the time slot can be narrow or broad
depending on if it is a time slot that is frequently watched such as a weekday network primetime
time slot or uncommonly watched such as the afternoon cable weekend time slot.
A second set of questions asks respondents to recall whether they usually watch specific
programs on each channel. For network TV, the survey asks the frequency that the respondent
usually watches a program; one to four times a month for weekly programs or one to five times a
week for daily programs. For example, a respondent can say that she has watched The Big Bang
Theory on CBS one out of four times a month or that she has watched Good Morning America
on ABC three times out of five a week. For cable TV, the survey asks only whether she has

10
watched a program at all in the past seven days or in the past 4 weeks. For example, she could
have viewed American Dad on TBS in the past seven days, or Bones on TNT in the past four
weeks.
Kantar Media, provides us a list of advertising placements for e-cigarettes, that includes
the date and time the ad aired, on what channel, during what program, and what brand of e-
cigarette is advertised. The data we connect to the NCS goes from the 2nd quarter of 2013
through the 4th quarter of 2015. We consider a respondent to have been potentially exposed to an
ad if she reports watching a program and channel where an electronic cigarette ad aired in the
past 6 months, and having watched a time slot on the same channel where that same electronic
cigarette ad aired in the past 6 months. We use this strict criterion for several reasons. One, a
program can air on a channel many times throughout the day. E-cigarette ads tend to air on
network television outside of the primetime schedule where most respondents report watching
television. If we simply counted all ads that aired on this network without regard to what time
the respondent watches television on this channel, we would over count e-cigarette ad exposure.
Second, as mentioned, the time slots are specified for any time between Monday through Friday,
or separately on the weekend. Therefore, if an ad simply aired during a time slot the respondent
reports watching but on a day which airs a program they do not actually watch, this would again
be over counting e-cigarette ad exposure. Three, the time slots are broad and off hours can be as
large as 6-hour time frames. Reporting watching a time slot does not necessarily imply the
respondent watched every program in that time slot. Applying this strict matching criterion,
minimizes positive measurement error given the available information and assuming regularity
in viewing behavior over a 6-month period.

11
For spot ads that appear only in certain designated market areas (DMAs), which are
media market areas similar to Standard Metropolitan Statistical Areas) there is the additional
restriction that we only count a person as exposed if they live in the DMA in which the ad
appeared. In this sample of the NCS, only 46 DMA’s can be identified, although they include 72
percent of the total NCS sample. Nevertheless, we still include the sample of adults that reside
in areas outside the 46 identified DMA’s. We do this because only approximately 3 percent of
the ads that we identify respondents having been exposed to are spot television ads and therefore
will have minimal impact on our estimates.
We apply summation weights to ad exposure depending on the frequency of viewing a
program. The weight for a respondent watching a daily show where an e-cigarette ad airs on
network TV and watches it once a week, twice a week, three times a week, four times a week, or
five times a week, is 0.2, 0.4, 0.6, 0.8, or 1, respectively. Similarly, the weight for a respondent
watching a weekly show where an e-cigarette ad airs on network TV and watches it once a
month, twice a month, three times a month, or four times a month is 0.25, 0.5, 0.75 or 1
respectively. Finally, the weight for a respondent watching a cable TV show, and has watched it
in the past 4 weeks or the past 7 days, is 0.5 or 1 respectively.
Kantar Media also provides the issue and date that e-cigarette ads appear in magazines.
NCS respondents report magazine reading behavior by responding to the number of issues of
each magazine they have read or looked into out of four issues in the past 6 months. Magazine
ad exposure is measured as the weighted sum of the number of ads that appeared in a magazine
in the past 6 months depending on the number out of four issues a respondent read. The weights
for reading a magazine less than one out of four, one out of four, two out of four, three out of
four, or four out of four, are 0.1, 0.25, 0.5, 0.75, and 1 respectively.

12
C. Definitions of Other Variables and Sample Characteristics
All logit models estimated in Section IV contain age, gender, race, education, and
household income as independent variables. These variables are defined in Table 2, and their
means in each of the three groups in the sample (quitters, failures, and non-attempters) are
shown. Means of exposure to TV ads and to magazine ads in each group also are shown.
Males, whites, those with high levels of education, and those residing in households with
high levels of income are overrepresented in the sample of quitters. The relationship between
age and the probability of quitting is nonlinear, with the two youngest and the oldest age groups
accounting for larger percentages of the quit group than of the other two groups. It also is
notable that quitters are exposed to more TV ads for e-cigarettes (3.9) than failures (3.2) or non-
attempters (2.6). The latter pattern, does not, however hold in the case of magazine ads. Quitters
have more exposure to these ads than non-attempters but less exposure than failures. All of the
differences just mentioned are statistically significant at the 1 percent level.
In addition to the variables in Table 2, the most complete specifications in Section IV
contain year-quarter, magazine, program, time slot, and channel fixed effects.4 Each of these
variables are important in controlling for unobservable characteristics that may be correlated
with both outcomes such as quitting and independent variables of interest such as advertising
exposure. Year-quarter fixed effects, one for each year and quarter combination, are necessary
because there is variation in advertising spending over time which may be correlated with any
other variables that would influence quitting rates in the US over time. DMA fixed effects,
which include a fixed effect for 46 identified DMA’s and one for all the unidentified DMA’s, are
necessary because people in different areas may be exposed to spot ads at different rates, or more
4 Since we have only 9 quarters of data and since year-quarter and DMA fixed effects are employed as regressors, there is almost no remaining variation in cigarettes and e-cigarette prices. Hence, these variables are omitted.

13
importantly have different viewing patterns based on the local preferences of an area. Magazine
fixed effects, include a set of 32 fixed effects that equal 1 regardless if they read or looked into a
magazine, regardless of frequency of reading, and 0 if they do not. Magazine fixed effects are
only included if at one point a magazine ad appeared in one of these magazines during the study
period. Time slot fixed effects, are a set of 62 time slot fixed effects that identify different time
slots you may watch TV on regardless of what channel the respondent was viewing at the time.
Time slot fixed effects are different by weekend and weekday viewing, as well as by cable or
network viewing. Channel fixed effects, include a set of 131 fixed effects, identified off of the
variables that ask about which time slot you watched on each channel, and equal 1 regardless of
the time slot, as long as the respondent watched the channel in at least one time slot. Channel
fixed effects are only included for channels that at one point aired an e-cigarette ad during the
study period. Finally program fixed effects are a set of 326 program fixed effects that identify
different programs a respondent watches on television regardless of the channel respondents
watch them on, the time slot they watch them on, or the frequency with which they’ve watched
them. Program fixed effects are only included if an e-cigarette ad at one point aired on that
program during the study period. The magazine, channel, time slot, and program fixed effects
are necessary because advertisers may target e-cigarette ads to viewers that are prone to be more
likely to quit and try e-cigarettes if induced.
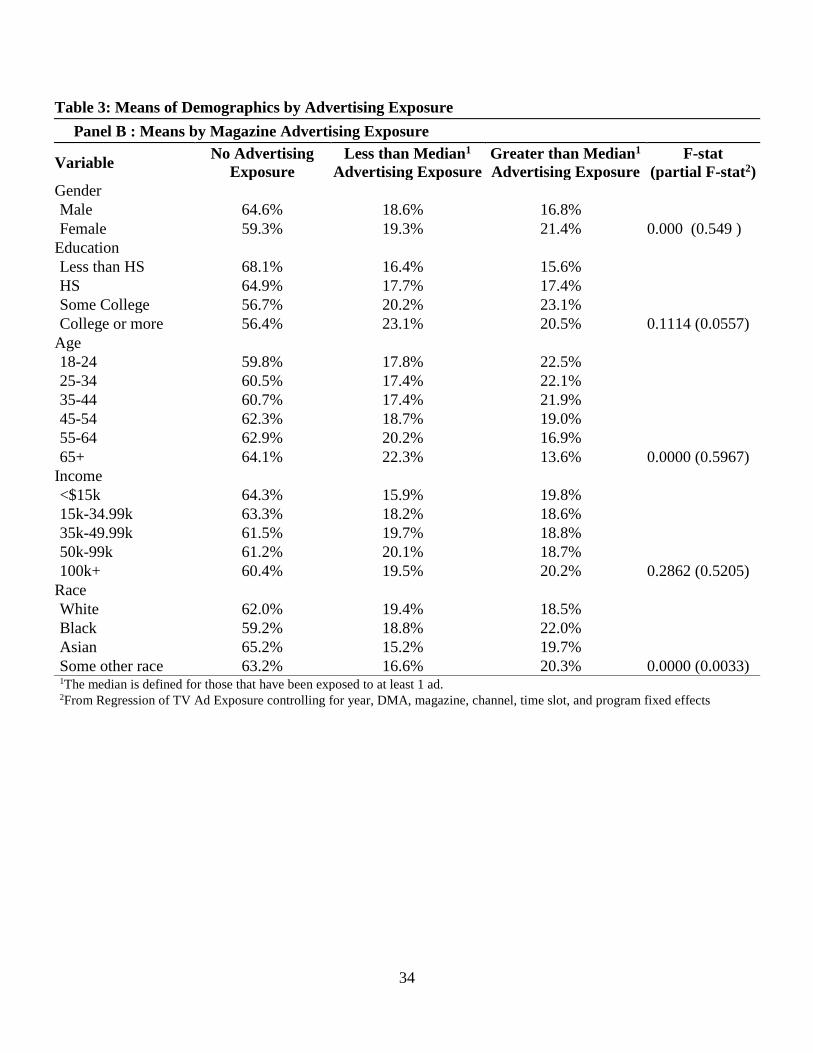
Table 3 shows the necessity of these fixed effects. One can see that before inclusion of
the fixed effects, respondents are unbalanced on their observable characteristics across
advertising exposure. This is confirmed statistically by running a simple regression for each
demographic variable where we test the joint-hypothesis that the effect of the observable
characteristic on TV ad exposure as a continuous variable is zero, and find significant differences

14
for gender, education and age. Once we control for the other demographics and fixed effects, the
partial F-statistic of the effect of each of these demographic variables on TV ad exposure is
statistically insignificant except for gender (see Panel A of Table 3). For magazine ads, the
variables are statistically unbalanced across treatment for gender, age, and race. Once we
include the other demographic controls and fixed effects, it is only unbalanced by race and
marginally significant for education. All variables move in the direction of balance for this
variable except for education (see Panel B).
Even after controlling for all of the fixed effects there are still sources of variation in
advertising exposure. For example, someone could watch the same programs, watch the same
channels, watch TV in the same general timeframes, in the same quarter, in the same DMA, and
have the same demographics but have different TV ad exposure. For example, person A could
be watching The Big Bang Theory on TBS at 8:30 PM and an e-cigarette ad could air, while
person B is watching Law and Order: SVU on USA Network at 8:30 PM and no e-cigarette ads
air. Person B could also watch The Big Bang Theory on TBS but at 4:00 PM while person A
watches Law and Order: SVU on USA Network at 4:00 PM and no e-cigarette ads air on either
show. Therefore, person A and person B would have the same program, channel, and time slot
fixed effects but different ad exposure. Other sources of variation are, changes in ad exposure on
a program relative to other programs from one quarter to another and the frequency with which a
person watches a program. For magazine ads, the primary sources of magazine advertising
variation after controlling for magazine fixed effects are the changes in ad exposure in a
magazine relative to other magazines over time, and the number of issues out of the last four that
they’ve read. A regression of demographic, year-quarter, channel, program, time slot, and

15
magazine fixed effects yields an R2 on TV ad exposure of 0.3047 and on magazine ad exposure
of 0.6557.
D. Empirical Specifications
Recall that the sample consists of individuals who are either past-year quitters or current
smokers (N = 8,302) and that there are three groups in it. These are successful quitters or simply
quitters (Q = 747), unsuccessful quitters or simply failures (F = 2,330), and non-attempters (D =
5,225). We begin by estimating a multinomial logit function with three outcomes: successfully
quitting smoking or simply quitting, attempting to quit and failing or simply failing, and not
attempting to quit. The mean probability of quitting (q, expressed as a percentage) is 9.0 percent.
The comparable probabilities of failing (f) and not attempting (d) are 28.1 percent and 62.9
percent, respectively. We take D as the omitted category in the logit so the logit coefficients
pertain to changes in the log odds of q or f relative to d.
Since the attempt rate (a) is the sum of the quit rate and the failure rate and since
d = 1 – a = 1 – q – f, (1)
the marginal effect of any variable, x, on a is the negative of the marginal effect of that variable
on d or the sum of the marginal effect of that variable on q and its marginal effect on f. This
estimate is more flexible than one obtained from a binomial logit in which the two outcomes are
attempts and non-attempts because it allows the marginal effects on q and f to differ. Similar
considerations underscore the advantage of obtaining quit effects from the multinomial logit
model rather than from a binomial logit model in which the two outcomes are quits and the other
two are combined (f + d). In particular, the latter model is appropriate only if x has no impact on
the log odds of f relative to d. From, however, an empirical perspective, effects that emerge

16
from the two binomial logit models just described are similar to those that emerge from the
multinomial logit model.
In addition to treating q, f, and a as outcomes, we also treat the conditional probability of
success (π = q/a) as a fourth outcome. Conceptually, this can be done in two ways. The first
involves deleting all the individuals who do not attempt to quit and then estimating a binomial
logit model with two outcomes: quits or failures. That is, the logit is limited to observations for
individuals who attempt to quit. The second method is to obtain the relevant logit coefficient of
x on the log odd of q relative to f as the difference between the logit coefficient of x on the log
odds of q relative to d and the logit coefficient of x on the log of f relative to d. We prefer the
first method because it is more convenient to compute the marginal effect from it, but we want to
emphasize that the two methods are identical save for rounding due to the algorithm used to
achieve convergence.5
Finally, we estimate logit models in which the outcomes are the method-specific attempt
or success rates defined in Panel B of Table 1. The former logits are limited to individuals who
attempt to quit and allow us to determine whether exposure to advertising induces crowd-out
from other methods of quitting, especially nicotine replacement therapy, to the use of e-
cigarettes. The latter logits contain an important specification or falsification test. If advertising
encourages successful quitting, that effect should be largest for those who use e-cigarettes to
quit.
5 This result illustrates the property of independence of irrelevant alternatives (IIA) that characterizes multinomial and conditional logit models. The former refer to models in which the regressors that vary among individuals but not among choices (our case), while the latter refer to models in which the regressors vary among choices as well as among individuals. IIA can be tested in a conditional logit model by deleting one of the choices and then comparing the remaining coefficients to those in the full model. That test cannot be performed with a multinomial model because that model allows for a full set of interactions between the regressors and the choices. On the other hand, in a conditional logit model, choice-specific regressors are forced to have the same coefficient for each choice.

17
IV. Results
Marginal e-cigarette TV and magazine advertising exposure effects from multinomial
logit models that examine the probabilities of quitting, failing to quit, and attempting to quit are
contained in Table 4. Five specifications are shown. In the first, the only fixed effects included
pertain to year and quarter. In the second, DMA indicators are added followed by time slot
indicators in the third. In the fourth logit, channel and magazine fixed effects are included. In
the last and most comprehensive equation, program indicators join the set of fixed effects.
Focusing on the marginal effect of TV advertising on the probability of quitting, one sees
that this effect is positive and significant at the 5 percent level in the first two models and at the 1
percent level in the last three models. The size of the effect is fairly stable across alternative
specifications and actually gets larger as more fixed effects are added. In the most
comprehensive model, an increase in exposure to one additional ad raises the quit probability by
0.0008 *100 = 0.08 percentage points. The magnitude of this effect is identical to the impact of
an increase in exposure to one additional magazine ad for an NRT product in a study by Avery et
al. (2007). They use Simmons NCS data for fall and spring quarters from the fall of 1995
through the fall of 1999. The quit rate in their sample of 10 percent is approximately the same as
the 9 percent rate in our sample.
In the first model, TV advertising has a positive effect on the failure rate that is larger
than the effect on the quit rate. The former effect is significant at the 10 percent level but not at
the five percent level. It is not significant in the other four models and actually becomes
negative in the last two.
In the most comprehensive model, exposure to an additional ad raises the attempt
probability by 0.07 percentage points. This suggests that most of the quit effect is due to an

18
increase in the success rate conditional on attempting. That issue is explored in more detail in
the next table.
Exposure to an additional magazine ad never has a significant effect on the quit
probability. The effect is small in magnitude and becomes negative in the last two models. The
failure effect is positive, significant, and quite large in the first three models but is greatly
reduced and becomes negative once magazine fixed effects are included.
The estimated TV effects are not sensitive to the exclusion of magazine advertising since
the two advertising variables are weakly correlated. The estimated TV effects also are not
sensitive to the order in which the different types of fixed effects are included. In summary, the
results in Table 4 indicate that exposure to TV ads raises the quit probability but exposure to
magazine ads does not.
In multinomial logits not shown, we have examined the effects of advertising on method-
specific attempt rates and find no significant effects of each type of advertising on these rates.
Hence, there is no evidence of crowd-out. Instead, TV advertising appears to encourage smokers
to attempt to quit by each of the four methods that we consider. This result is similar to one
reported by Kenkel et al. (2007). They find that exposure to NRT ads in magazines raises the
attempt rate but does not increase attempts using NRT relative to cold turkey attempts.
Table 5 contains the results of binary logit models in which the conditional probability of
success (quits conditional on attempts denoted byπ) is the outcome. These models are estimated
separately for all attempts to quit and for each of four method-specific attempts to quit. Only the
marginal effects and standard errors of the TV advertising exposure measure are shown because
the magazine exposure effects are unstable and insignificant. The magazine advertising variable
is, however, included in all specifications.

19
Focusing on the results for all attempts, one sees that an increase in exposure to e-
cigarette advertising on TV has a positive effect on the success rate. The effect is significant in
the three most comprehensive specifications and is fairly stable across alternative specifications.
It ranges in magnitude from a 0.06 percentage point increase in the probability of success to a
0.16 percentage point increase in that probability.
The results just reported can be combined with those in Table 4 to decompose the quit
effect into a component due to an increase in the attempt rate (a) and one due to an increase in
the success rate (π). This decomposition also puts the magnitude of these effects in perspective.
Since q = aπ,
(qx/q) = (ax/a) + (πx/π), (2)
where x is the advertising variable and a subscript denotes a partial derivative. The means of q,
a, and π are 9.0 percent, 37.1 percent, and 24.3 percent, respectively. Based on the fifth and
most comprehensive specification in Tables 4 and 5, our results imply that an additional
exposure to an e-cigarette advertisement on TV raises the quit rate by 0.9 percent, the attempt
rate by 0.2 percent, and the success rate by 0.7 percent. Clearly, most of the almost 1 percent
increase in the number of smokers who quit is due to the increase in the success rate. While
these effects are somewhat modest, they pertain to a small change in exposure. Computations
suggest that the logits are fairly linear in the range in which we estimate them. Hence an
exposure to five additional ads would increase the number of quitters by almost 5 percent.
The remainder of the estimates in Table 5 pertain to marginal effects of exposure to TV
ads on attempt-specific success rates. As in the case with the models for success with all
attempts, magazine effects are not shown because they never are significant. Some of the
models are omitted because they did not converge because of insufficient sample size.

20
The only case in which success effects are positive, generally significant, and generally
stable pertains to e-cigarette only attempters. These range from a marginal effect of 0.21
percentage points to 1.1 percentage points. The pattern of larger and more significant effects as
additional fixed effects are included mirrors that observed for all attempters.
How reasonable are the effects just observed? As an identity,
π = keπe + knπn + kcπc + koπo, (3)
where the superscript denotes the method (e for electronic cigarettes only, n for NRT only, c for
cold turkey, and o for other methods) and ke, for example is the fraction of all attempts accounted
for by e-cigarette attempts. We find that exposure to additional ads has no effect on the attempt-
specific fractions just defined. Hence
(∂π/∂x) = ke*(∂πe/∂x). (4)
The fraction of attempts accounted for by e-cigarette attempts (ke) equals 0.238, and in the third
specification in Table 5, ∂πe/∂x = 0.0040. Therefore, the estimated value of the right-hand side
of equation (4) is 0.0009. That is very similar to the actual value of ∂π/∂x of 0.0012 in the third
specification of the success rate logit for all attempters in Table 5. In the fourth specification,
∂πe/∂x equals 0.0108. So the right-hand side of equation (4) becomes 0.0025. That over-
predicts that actual value of ∂π/∂x of 0.0017 in the fourth specification of the success rate logit
for all attempters. But with a round-to-even rule, both values come to 0.002 to three decimal
places.
In summary, the lack of effects for attempt methods other than with e-cigarettes amounts
to an important falsification test. In addition, the agreement between the two methods of
estimating the success rate for all attempts is an important specification check.
V. Discussion

21
The title of this paper poses the question whether e-cigarette advertising encourages
smokers to quit. The results in the paper suggest that the answer is a tentative yes for TV
advertising but no for magazine advertising. We find that exposure to an additional ad seen on
TV increases the number of adults who quit by almost 1 percent relative to a mean quit rate of 9
percent in the past year. Most of this effect is due to an increase in the success rate conditional
on attempts rather than to an increase in attempts. We find no effects of exposure to magazine
ads on quit behavior. We label the TV findings as tentative because they pertain to a short
period of time (the fourth quarter of 2013 through the fourth quarter of 2015). Studies that span
a longer period of time deserve a high priority on an agenda for future research. Given the short
period of time that e-cigarettes have been on the market, the lack of information on the use of the
product in the NCS until the fourth quarter of 2013, and the absence of comparable sources, this
research will require the use of very current data. One advantage of such research is that it can
address the issue of whether e-cigarettes may continue to promote the continued reduction in
adults’ smoking participation possibly because of lagged responses to the introduction of the
product.
Our results and those by Majeed et al. (2017) should give pause to those who advocate a
complete ban on e-cigarette advertising. Majeed and colleagues examine whether the perceived
harm of e-cigarettes among U.S. adults changed between 2012 and 2015. They find that it did.
In 2015 approximately 36 percent of adults perceived that e-cigarettes had the same level of
harm as cigarettes compared to only 12 percent in 2012. Even more striking, there was a
fourfold increase in the number of adults who perceived e-cigarettes to be more harmful than
cigarettes from roughly 1 percent in 2012 to 4 percent in 2015. In light of contradictory evidence

22
in the medical literature, these trends point to a lack of information about a product that
potentially is harm-reducing.
Of course, it is far too early for us or other investigators to advocate unrestricted
advertising of e-cigarettes. Medical researchers need to investigate the long-term health
consequences of the use of the product. Economists need to investigate the role of e-cigarettes in
initiation in the use of nicotine by youths. Do youths who otherwise would start to smoke
cigarettes substitute e-cigarettes instead? Or does the availability of a new source of nicotine
attract youths who otherwise would not use the product? And does initiation into the use of
nicotine by both types of youths eventually lead them to start to smoke conventional cigarettes
by means of a “gateway” effect?
Some of these questions revolve around whether e-cigarettes and combustible cigarettes
are substitutes or complements. Friedman (2015) and Pesko, Hughes, and Faisal (2016) find that
state bans on e-cigarette sales to minors raise smoking rates among youths ages 12-17 in two
different data sets. These studies suggest that the two products are substitutes, but do not use
recent data and do not verify that the use of e-cigarettes was affected in states with higher
minimum purchase age laws. Using a third different data set, Abouk and Adams (2017) report
that state bans on e-cigarette sales to minors actually lower youth smoking participation rates.
They also present suggestive evidence that the bans lower youth e-cigarette participation rates.
These results suggest that the two sources of nicotine are complements, although the findings for
e-cigarettes are based on within state monthly changes in the laws banning sales in a single year.
These conflicting findings and our remarks above concerning research on quit behavior by adults
and advertising underscore the rich nature of future research by economists on e-cigarettes.
23
References
Abouk, Rahi, and Scott Adams. 2017. “Bans on Electronic-Cigarette Sales to Minors and
Smoking Among High School Students.” Journal of Health Economics 54(July): 17-24.
Ahmed Jamal, Brian A. King, Linda J. Neff, Jennifer Whitmill, Stephen D. Babb, and Corinne
M. Graffunder. 2016. “Current Smoking Among Adults—United States—2005-2015.”
Mortality and Morbidity Weekly Report 65(44): 1205-1211.
Avery, Rosemary, Donald Kenkel, Dean Lillard, and Alan Mathios. 2007. “Private Profits and
Public Health: Does Advertising Smoking Cessation Products Encourage Smokers to
Quit?” Journal of Political Economy 115(3): 447-481.
Avery, Rosemary J., Donald Kenkel, Dean R. Lillard, Alan Mathios, and Hua Wang. 2008.
Health Disparities and Direct-to-Consumer Advertising of Pharmaceutical Products. In
Beyond Health Insurance: Public Policies to Improve Health, ed. Lorens Helmchen,
Robert Kaestner, and Anthony Lo Sasso. Volume 19 of Advances in Health Economics
and Health Services Research. Bingley, UK: Emerald Publishing Ltd., 71-94.
Avery, Rosemary A., Matthew D. Eisenberg, and Kosali I. Simon. 2012. “The Impact of Direct-
to-Consumer Television and Magazine Advertising on Antidepressant Use.” Journal of
Health Economics 31(5): 705-718.
Avery, Rosemary J., John Cawley, Matthew Eisenberg, and Jonathan Cantor. 2013. “The
Change in Deceptive Advertising of Weight Loss Products after the Federal Trade
Commission’s 2003 Red Flags Initiative.” Journal of Public Policy and Marketing
32(1): 129-139.

24
Brown, Jamie, Emma Beard, Daniel Kotz, Susan Michie, and Robert West. 2014. “Real‐world
Effectiveness of E‐cigarettes When Used to Aid Smoking Cessation: A Cross‐sectional
Population Study. Addiction 109(9): 1531-1540.
Czogala, Jan, Maciej L. Goniewicz, Bartlomiej Fidelus, Wioleta Zielinska-Danch, Mark J.
Travers, and Andrzej Sobczak. 2014. “Secondhand Exposure to Vapors from Electronic
Cigarettes.” Nicotine & Tobacco Research 16(6): 655-662.
Dave, Dhaval, and Henry Saffer. 2013. “Demand for Smokeless Tobacco: Role of Magazine
Advertising.” Journal of Health Economics 32(4): 682-697.
Duke, Jennifer C., Youn O. Lee, Annice E. Kim, Kimberly A. Watson, Kristin Y. Arnold, James
M. Nonnemaker, and Lauren Porter. 2014. “Exposure to Electronic Cigarette Television
Advertisements Among Youth and Young Adults.” Pediatrics 134(1): e29-e36.
Eisenberg, Matthew D., Rosemary Avery, and Jonathan H. Cantor. Forthcoming. “Vitamin
Panacea: Is Advertising Fueling Demand for Products with Little Scientific Benefits?
Journal of Health Economics.
Friedman, Abigail S. 2015. “How Does Electronic Cigarette Access Affect Adolescent
Smoking?” Journal of Health Economics 44(December): 300-308.
Goniewicz, M.L., J. Knysak, M. Gawron, L. Kosmider, A. Sobczak, J. Kurek, A. Prokopowicz,
M. Jablonska-Czapla, C. Rosik-Dulewska, C. Havel, P. Jacob, 3rd, and N. Benowitz.
2013. “Levels of Selected Carcinogens and Toxicants in Vapour from Electronic
Cigarettes.” Tobacco Control 23(2): 133-9.
Jolly, David. 2016. “European Court of Justice Upholds Strict Rules on Tobacco.” New York
Times, May 4:B1.

25
Kalkhoran, Sara, and Stanton A. Glantz. 2016. “E-cigs and Smoking Cessation in Real-World
and Clinical Settings: a Systematic Review and Meta-Analysis.” The Lancet Respiratory
Medicine 4(2): 116-128.
Kandra, Kelly L., Leah M. Ranney, Joseph G.L. Lee, and Adam O. Goldstein. 2014.
“Physicians’ Attitudes and Use of E-Cigarettes as Cessation Devices, North Carolina,
2013.” PloS one 9(7): e103462.
Kenkel, Donald, Alan Mathios, and Hua Wang. Forthcoming. “Advertising and Health: A Case
Study of Menthol Cigarette Advertising and Cigarette Demand.” American Journal of
Health Economics.
Kim, Annice E., Kristin Y. Arnold, and Olga Makarenko. 2014. “E-cigarette Advertising
Expenditures in the U.S., 2011-2012.” American Journal of Preventive Medicine 46(4):
409-412.
Majeed, Ban A., Scott R. Weaver, Kyle R. Gregory, Carrie F. Whitney, Paul Slovic, Terry F.
Pechacek, and Michael P. Eriksen. 2017. “Changing Perceptions of Harm of E-
Cigarettes Among U.S. Adults, 2011-2015. American Journal of Preventive Medicine
52(3): 331–338
Markus, Ruth. 2014. “The E-Cigarette Quandary: Helping Smokers Quit While Enticing New
Addicts.” The Washington Post September 5,
http://www.washingtonpost.com/opinions/ruth-marcus-the-e-cigarette-quandary-helping-
smokers-quit-while-enticing-new-addictsthe-e-cigarette-dilemma/2014/09/05/95ccd876-
3538-11e4-a723-fa3895a25d02_story.html, last accessed June 19, 2017.
McMillen, Robert C., Mark A. Gottlieb, Regina M. Whitmore Shaefer, Jonathan P. Winickoff,
and Jonathan D. Klein. 2015. “Trends in Electronic Cigarette Use Among U.S. Adults:

26
Use is Increasing in Both Smokers and Nonsmokers.” Nicotine and Tobacco Research
17(10): 1195-1202.
Mickle, Tripp. 2015. “E-Cigarette Sales Rapidly Lose Steam: Customer Dissatisfaction,
Inventory Backlogs, State Laws, and Safety Issues are Curbing Revenue Growth.” Wall
Street Journal November 18, retrieved from
http://search.proquest.com/docview/17336925524?accountid=35174, July 5, 2016.
Molloy, Eamon. 2016. “This Ad is for You: Targeting and the Effect of Alcohol Advertising on
Youth Drinking.” Health Economics 25(2): 148-164.
O’Connor, Richard, Matthew C. Rousu, Maansi-Travers, Lisa Vogal, and Jay R. Corrigan. 2016.
“Using Experimental Auctions to Examine Demand for E-Cigarettes.” Nicotine &
Tobacco Research: 1-6, doi:10.1093/ntr/ntw257.
Pesko, Michael F., Jenna M. Hughes, and Fatima S. Faisal. 2016. “The Influence of Electronic
Cigarette Age Purchasing Restrictions on Adolescent Tobacco and Marijuana Use.”
Preventive Medicine 87(June): 207-212.
Richtel, Matt. 2014. “E-cigarettes, By Other Names, Lure Young and Worry Experts.” The
New York Times March 23, 2014: B1, B4.
Rousu, Matthew C., Richard O’Connor, and Jay Corrigan. Forthcoming. “Effect of Brand and
Advertising Medium on Demand for E-Cigarettes: Evidence from an Experimental
Auction.” Preventive Medicine Reports.
Royal College of Physicians. 2016. Nicotine without Smoke: Tobacco Harm Reduction.
London: Royal College of Physicians.
U.S. Food and Drug Administration. 2016a. “Deeming Tobacco Products To Be Subject to the
Federal Food, Drug, and Cosmetic Act, as Amended by the Family Smoking Prevention

27
and Tobacco Control Act; Restrictions on the Sale and Distribution of Tobacco Products
and Required Warning Statements for Tobacco Products; Final Rule. Federal Registrar
May 10.
U.S. Food and Drug Administration. 2016b. “FDA Warns of Health Risks Posed by E-
Cigarettes.” https://www.fda.gov/ForConsumers/ConsumerUpdates/ucm173401.htm, last
accessed June 19, 2017.
U.S. National Institute on Drug Abuse. 2016. “Electronic Cigarettes.” Drug Facts.
https://www.drugabuse.gov/publications/drugfacts/electronic-cigarettes-e-cigarettes, last
accessed June 19, 2017.
U.S. Surgeon General. 2014. The Health Consequences of Smoking—50 Years of Progress.
Rockville, MD: Office of the Surgeon General, Public Health Service, US Department of
Health and Human Services.
Zheng, Yuqing, Chen Zhen, James M Nonnemaker, and Daniel Dench. 2016. “Advertising,
Habit Formation, and U.S. Product Demand.” American Journal of Agricultural
Economics 98(4): 1038-1054.
Zheng, Yuqing, Chen Zhen, Daniel Dench, and James M. Nonnemaker. 2017. “U.S. Demand
for Tobacco Products in a System Framework.” Health Economics 26(8): 1067-1086.
Zhuang, Yue-Lin, Sharon E. Cummins, Jessica Y. Sun, and Shu-Hong Zhu. 2016. “Long-term
E-cigarette Use and Smoking Cessation: A Longitudinal Study with US Population.”
Tobacco Control 25(Suppl. 1): i90-i95.
28
Figure 1 E-Cigarette1 and Traditional Cigarette Use2 Trends, Adults
1Source: National Adult Tobacco Survey (2012-2014); McMillen et al. (2015) for 2010 and 2011. Figures for
overall population comparable from both sources for 2012-2013 2Source: National Health Interview Survey (2005-2015)
0.3%
6.9%
0%
2%
4%
6%
8%
10%
12%
14%
16%
2010 2011 2012 2013 2014
E-cigarette
Overall 18-24 25-34 35-44 45-54 55+
20.9% 15.1%
0%
5%
10%
15%
20%
25%
30%
2005 2006 2007 2008 2009 2010 2011 2012 2013 2014 2015
Traditional Cigarettes
Overall 18-24 25-34 35-44 45-54 55+

29
Figure 2 E-Cigarette and Traditional Cigarette Use Trends, Youths1
1Source: National Youth Tobacco Survey
13.2%
6.1%
1.0%
11.3%
0%
2%
4%
6%
8%
10%
12%
14%
2006 2007 2008 2009 2010 2011 2012 2013 2014 2015
Perc
ent u
sers
"Cigarette Use" "E-cig Use

30
Figure 3 E-Cigarette Magazine and Television Advertising Trends1
1Source: Kantar Media (2012-2016)
0
50
100
150
200
250
0
5
10
15
20
25
30
35
40
1 2 3 4 1 2 3 4 1 2 3 4 1 2 3 4 1 2 3 4
2012 2013 2014 2015 2016
Magazine Advertising
Mag Ad Spending ($ millions) Ad Pages
0
50,000
100,000
150,000
200,000
250,000
300,000
350,000
400,000
450,000
500,000
0
1
2
3
4
5
6
7
8
9
10
1 2 3 4 1 2 3 4 1 2 3 4 1 2 3 4 1 2 3 4
2012 2013 2014 2015 2016
TV Advertising
TV Ad Spending ($ millions) TV ads Length (Secs)

31
Table 1: Definitions and Means of Key Outcomes1 Panel A: Basic Outcomes Variable Definition Mean Attempt Rate: a = A/N 37.1% Quit Rate q = Q/N 9.0% Failure Rate: f = F/N 28.1% Success Rate π = Q/A = q/a 24.3% Panel B, Percentage Distribution of Attempts by Method and Success Rates by Method Method Percentage of Attempts Success Rate E-cigs only 23.8% 30.0% NRT only 18.5% 27.4% Cold Turkey 17.8% 31.5% Other2 39.9% 16.9% 1Sample (N = 8,302) consists of quitters in past year (Q), failures in past year (F), and non-attempters in past year (D). N = Q + F + D, A = Q + F, a = q + f, current smokers = F + D. 2Includes gradual reduction, hypnosis, acupuncture, quit smoking program, and mixed methods.

32
Table 2: Means of Independent variables by quitting, failing to quit, and not trying Variable/Outcome Q F D Gender Male 55.2% 41.7% 51.0% Female 44.8% 58.3% 49.0%
Education Less than HS 12.2% 17.9% 22.2% HS 30.4% 34.4% 36.6% Some College 34.9% 33.4% 28.2% College or more 22.5% 14.3% 13.0%
Age 18-24 9.2% 7.9% 8.7% 25-34 18.9% 15.6% 17.0% 35-44 18.5% 17.2% 18.3% 45-54 20.2% 22.4% 23.9% 55-64 17.0% 23.0% 20.2% 65+ 16.2% 13.9% 12.0%
Income <$15k 7.6% 15.0% 13.7% 15k-34.99k 13.7% 18.6% 19.5% 35k-49.99k 13.3% 14.8% 15.8% 50k-99k 34.7% 30.6% 31.4% 100k+ 30.8% 21.1% 19.6%
Race White 83.5% 75.2% 73.8% Black 7.0% 12.5% 11.5% Asian 2.0% 1.5% 1.2% Some other race 7.5% 10.9% 13.5%
TV Ad Exposure 3.9 3.2 2.6 Magazine Ad Exposure 3.76 4.77 3.31 N 747 2,330 3,077

33
Table 3: Means of Demographics by Advertising Exposure Panel A: Means by TV Advertising Exposure
Variable No Advertising Exposure
Less than Median1 Advertising Exposure
Greater than Median1 Advertising Exposure
F-stat (partial F-stat2)
Gender Male 44.1% 47.3% 47.7% Female 55.9% 52.8% 52.3% 0.0020 (0.0072)
Education Less than HS 17.1% 15.3% 15.2% HS 34.4% 31.5% 33.6% Some College 32.7% 36.3% 36.8% College or more 15.8% 17.0% 14.3% 0.0397 (0.8012)
Age 18-24 8.3% 7.8% 9.5% 25-34 16.1% 17.0% 17.0% 35-44 16.5% 19.3% 18.4% 45-54 22.0% 20.5% 20.9% 55-64 22.4% 20.0% 22.5% 65+ 14.7% 15.5% 11.6% 0.0001 (0.7473)
Income <$15k 14.2% 13.8% 13.2% 15k-34.99k 17.7% 17.3% 13.9% 35k-49.99k 14.2% 12.3% 15.0% 50k-99k 30.5% 31.8% 32.3% 100k+ 23.4% 25.0% 25.7% 0.1551 (0.6478)
Race White 78.1% 73.0% 74.8% Black 10.3% 16.3% 13.0% Asian 1.6% 1.3% 1.8% Some other race 10.0% 9.5% 10.5% 0.9024 (0.4225) 1The median is defined for those that have been exposed to at least 1 ad. 2From Regression of TV Ad Exposure controlling for year, DMA, magazine, channel, time slot, and program fixed effects
34
Table 3: Means of Demographics by Advertising Exposure Panel B : Means by Magazine Advertising Exposure
Variable No Advertising Exposure
Less than Median1 Advertising Exposure
Greater than Median1 Advertising Exposure
F-stat (partial F-stat2)
Gender Male 64.6% 18.6% 16.8% Female 59.3% 19.3% 21.4% 0.000 (0.549 )
Education Less than HS 68.1% 16.4% 15.6% HS 64.9% 17.7% 17.4% Some College 56.7% 20.2% 23.1% College or more 56.4% 23.1% 20.5% 0.1114 (0.0557)
Age 18-24 59.8% 17.8% 22.5% 25-34 60.5% 17.4% 22.1% 35-44 60.7% 17.4% 21.9% 45-54 62.3% 18.7% 19.0% 55-64 62.9% 20.2% 16.9% 65+ 64.1% 22.3% 13.6% 0.0000 (0.5967)
Income <$15k 64.3% 15.9% 19.8% 15k-34.99k 63.3% 18.2% 18.6% 35k-49.99k 61.5% 19.7% 18.8% 50k-99k 61.2% 20.1% 18.7% 100k+ 60.4% 19.5% 20.2% 0.2862 (0.5205)
Race White 62.0% 19.4% 18.5% Black 59.2% 18.8% 22.0% Asian 65.2% 15.2% 19.7% Some other race 63.2% 16.6% 20.3% 0.0000 (0.0033) 1The median is defined for those that have been exposed to at least 1 ad. 2From Regression of TV Ad Exposure controlling for year, DMA, magazine, channel, time slot, and program fixed effects

35
Table 4: Multinomial Logit Model, Marginal Effects [S.E.]1 Independent Variable Outcome (1) (2) (3) (4) (5)
TV Ads
Q 0.0005 [0.0002]**
0.0006 [0.0002]**
0.0007 [0.0002]***
0.0008 [0.0003]***
0.0008 [0.0003]***
F 0.0007 [0.0004]*
0.0006 [0.0004]
0.0001 [0.0004]
-0.0001 [0.0005]
-0.0001 [0.0005]
A2 0.0012 [0.0005]***
0.0012 [0.0005]**
0.0008 [0.0005]
0.0007 [0.0005]
0.0007 [0.0005]
Magazine Ads
Q 0.0002 [0.0003]
0.0001 [0.0003]
0.0002 [0.0003]
-0.0004 [0.0005]
-0.0010 [0.0006]
F 0.0025 [0.0005]***
0.0028 [0.0005]***
0.0023 [0.0005]***
0.0004 [0.0008]
0.0009 [0.0008]
A 0.0027 [0.0005]***
0.0029 [0.0006]***
0.0025 [0.0006]***
-0.0001 [0.0009]
-0.0001 [0.0009]
Year-qtr. fixed effects, and demographic controls Yes Yes Yes Yes Yes
DMA fixed effects No Yes Yes Yes Yes Time slot fixed effects No No Yes Yes Yes Channel and Magazine fixed effects No No No Yes Yes
Program fixed effects No No No No Yes 1 *p<0.10, **p<0.05, ***p<0.01 2Marginal effect of regressor on A is negative of marginal effect of regressor on D or sum of marginal effects of regressor on Q and F.

36
Table 5: Binomial Logit Models of Successful Quitting Given Attempting, Marginal Effects of TV Ads [S.E.]1 Independent Variable Sub-population2 (1) (2) (3) (4) (5)
TV Ads
All Attempters 0.0007 [0.0006]
0.0006 [0.0006]
0.0012 [0.0006]**
0.0017 [0.0007]**
0.0016 [0.0008]**
E-cig Only Attempters 0.0021 [0.0014]
0.0030 [0.0015]**
0.0040 [0.0016]**
0.0108 [0.0026]***
2
NRT Only Attempters 0.0010 [0.0010]
0.0012 [0.0010]
0.0020 [0.0013]
2 2
Cold Turkey Attempters -0.0017 [0.0019]
-0.0016 [0.0020]
-0.0015 [0.0022]
2 2
Other Method Attempters -0.0002 [0.0009]
-0.0003 [0.0010]
0.0003 [0.0010]
0.0016 [0.0013]**
2
Year-qtr fixed effects, and demographic controls Yes Yes Yes Yes Yes DMA fixed effects No Yes Yes Yes Yes Time slot fixed effects No No Yes Yes Yes Channel and Magazine fixed effects No No No Yes Yes Program fixed effects No No No No Yes
1 *p<0.10, **p<0.05, ***p<0.01 2 Models did not converge because of insufficient sample size 3 N=3,076 for All attempters, N=740 for E-cig Only, N=561 for NRT Only, N=546 for Cold Turkey Only, N=1.229 for Other Method