nb: please refer to how to use new powerpoint template on ...€¦ · international low cost...
TRANSCRIPT

Sydney Airport
Half Year Results 2013
22 August 2013

Disclaimer
Half Year Results 2013 (22 August 2013) 2
General securities warning
This presentation has been prepared by Sydney Airport Holdings Limited (ACN 075 295 760 / AFSL 236875).
This presentation is not an offer or invitation for subscription or purchase of or a recommendation of securities. It does not take into account the
investment objectives, financial situation and particular needs of the investor. Before making an investment in Sydney Airport Trust 1 (ARSN 099
597 921) or Sydney Airport Trust 2 (ARSN 099 597 896) (Sydney Airport), the investor or prospective investor should consider whether such an
investment is appropriate to their particular investment needs, objectives and financial circumstances and consult an investment adviser if
necessary.
Information, including forecast financial information, in this presentation should not be considered as a recommendation in relation to holding,
purchasing or selling shares, securities or other instruments in Sydney Airport. Due care and attention has been used in the preparation of
forecast information. However, actual results may vary from forecasts and any variation may be materially positive or negative. Forecasts by their
very nature are subject to uncertainty and contingencies, many of which are outside the control of Sydney Airport. Past performance is not a
reliable indication of future performance.
Agenda
3
1. Results and Recent Highlights
2. Traffic Development
3. Financial Results HY 2013
4. Business Strategies Driving Growth
5. Airport Planning and Productivity
6. Outlook

10
12
14
16
18
20
22
24
2009 2010 2011 2012 2013
Cents
Annual distribution
Investor returns and dividend growth
4
7% headline distribution growth, rolling annual return of 17%
Source: IRESS
Total Investor Return 16% year to date
To 30 June 2013:
• Rolling annual return 17%
• Average annual investor return since
listing of 13%
• Average investor return for the last
three years of 23%
2013 distribution guidance of 22.5 cents*
• Headline distribution growth of 7%
• Underlying distribution growth of 10%**
• First half Net Operating Receipts 11 cents,
underlying growth of 8%**
Foreign ownership 28.2%
22.5 cents represents
7% headline growth
and 10% underlying
growth
*Our guidance remains subject to external shocks to the aviation industry, material
changes to forecast assumptions
**Adjusted for $27 million SKIES release in 1H12 distribution and $15.5 million of
Newcastle and Bristol proceeds in 1H13
3
3.1
3.2
3.3
3.4
3.5
3.6
3.7
3.8
3.9
Aug 12 Oct 12 Dec 12 Feb 13 Apr 13 Jun 13 Aug 13
Share
price (
$)
12 month security price performance

Highlights HY 2013
5
Strong result, driven by international traffic and yield improvement from new initiatives
Financial Highlights
• 6.3% EBITDA growth relative to 3.0% passenger growth
• Continuing strong business performance driven by traffic, investment and management
initiatives
• Yield improvements across all businesses
• Distribution guidance of 22.5 cents for the year, 7% headline growth
• Distribution expected to be fully covered by Net Operating Receipts
Operational Highlights
• 3.6% international passenger growth; 3.0% total passenger growth
• Significant upgauging and increased frequencies
• Focus on customer experience and value proposition continuing
• Release of the 2033 Master Plan (preliminary draft)

Minority acquisitions, ATO resolution and simplification
6
Providing investors with certainty and a simplified platform for growth
• SYD will own 100% of Sydney Airport
• ASX 50 index weighting increased
• Strategic benefits, greater flexibility, clarity of operations and
cash flows
1. 100% Ownership
2. Tax Certainty
• In-principle non-binding agreement with Australian Taxation
Office (ATO) for settlement of all historic matters concerning
deductibility of interest paid on RPS
• SYD to make a cash payment of $69m (~$0.03 per stapled
security)
3. Simplification
• SYD holding structure to be further simplified
• Under the proposed simplification foreign ownership limit
increases from 40% to 49%

7
Traffic Development
Kerrie Mather
Chief Executive Officer

Traffic performance
8
Traffic year to date up 3.0% and international up 3.6%; strong start to second half with July international up 5.5%
• Record first half passengers of
18.2 million
• Strong international passenger growth
of 3.6%, while domestic passengers
grew 2.8%
• Key drivers of international growth
• Upgauging from existing carriers
• Seat capacity and load factors
• Inbound Asian growth, particularly
Chinese nationals
• Full year effect of Scoot and
AirAsia X
• Traffic growing steadily through time,
five year CAGR 3.5%
14,000
14,500
15,000
15,500
16,000
16,500
17,000
17,500
18,000
18,500
1H08 1H09 1H10 1H11 1H12 1H13
To
tal P
assengers
Growth in total passengers half on half
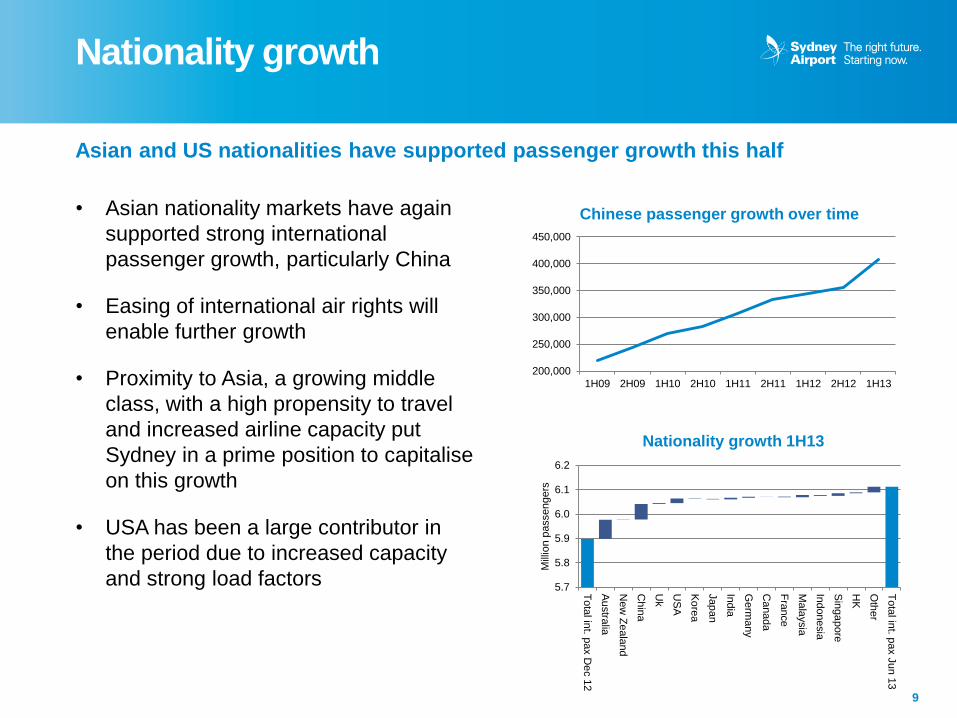
Nationality growth
9
Asian and US nationalities have supported passenger growth this half
• Asian nationality markets have again
supported strong international
passenger growth, particularly China
• Easing of international air rights will
enable further growth
• Proximity to Asia, a growing middle
class, with a high propensity to travel
and increased airline capacity put
Sydney in a prime position to capitalise
on this growth
• USA has been a large contributor in
the period due to increased capacity
and strong load factors
200,000
250,000
300,000
350,000
400,000
450,000
1H09 2H09 1H10 2H10 1H11 2H11 1H12 2H12 1H13
Chinese passenger growth over time
5.7
5.8
5.9
6.0
6.1
6.2
To
tal in
t. pax D
ec 1
2
Au
stra
lia
New
Ze
ala
nd
Chin
a
Uk
US
A
Ko
rea
Jap
an
India
Germ
any
Canada
Fra
nce
Ma
laysia
Indonesia
Sin
ga
pore
HK
Oth
er
Tota
l int. p
ax J
un 1
3
Mill
ion p
assengers
Nationality growth 1H13

International low cost carrier case study
10
Long haul low cost carriers (LCC) have created new markets and unlocked latent demand
• Malaysia and Singapore, were seen as
well served markets for Sydney before
the entry of Scoot and AirAsia X
• Markets have grown 51% and 19%
respectively
• Incumbent carriers in both markets
continue to perform well
• Low cost carriers have changed the
way our airport is used: they use
infrastructure more efficiently, have
higher load factors, and passengers
have longer dwell times
• Sydney international LCC penetration
grew to 9% on June pcp, there
remains significant potential for future
LCC growth
0
100,000
200,000
300,000
400,000
500,000
600,000
2011/12 2012/13
Direct Malaysian route growth in the year post commencement of AirAsia X
800,000
900,000
1,000,000
1,100,000
1,200,000
1,300,000
2011/12 2012/13
Direct Singaporean route growth in the year post commencement of Scoot
51%
19%

India case study
11
Significant growth potential in the India nationality market, to be serviced directly for the first time in 22 years by Air India
• India - Australia and is Sydney’s
largest unserved market
• Nearly 40% of passenger traffic
between India and Australia is
between Sydney and India
• Sydney and NSW have Australia
highest number of residents with
Indian ancestry
• Air India will operate Delhi-Sydney-
Melbourne-Delhi 4 times weekly and
the reverse 3 times weekly
• Sydney Airport’s partnership with
Destination NSW and Tourism
Australia played a major role in the
establishment of this route
• There is significant potential for growth
in this market, in particular Mumbai
Jan-08 Jul-08 Jan-09 Jul-09 Jan-10 Jul-10 Jan-11 Jul-11 Jan-12 Jul-12 Jan-13
Passengers
Sydney-India route has grown +26.8% from Jan08-Jan13 with no direct flight
136,552
63,109
30,528 27,999 27,907
19,886 13,425
10,184 10,559
0
20,000
40,000
60,000
80,000
100,000
120,000
140,000
160,000
DEL BOM BLR HYD MAA AMD COK CCU other
O&
D P
asseng
ers
O&D Passengers between Sydney and IndiaMay 12 - April 13

12
Financial Results HY 2013
Stephen Mentzines
Chief Financial Officer

SYD Statutory income statement
13
SYD Statutory Income Statement HY 2013
Category HY 2013 ($m) HY 2012 ($m)
Revenue 554.9 512.2
Revaluation of Investments - (0.1)
Other Income (1.0) (3.5)
Total Revenue 553.9 508.6
Finance Costs 241.8 219.2
Other expenses 259.1 243.6
Operating Expenses 500.9 462.8
Profit Before Tax 53.0 45.8
Income Tax Benefit (39.7) 32.0
Profit After Income Tax 13.3 77.8
Profit Attributable to Non Controlling Interests 10.7 10.8
Net Profit / (Loss) Attributable to Investors 24.0 88.6

Sydney Airport EBITDA
14
Strong first half EBITDA growth of 6.3%
Category HY 2013 ($m) HY 2012 ($m) %
Aeronautical revenue 223.6 209.2 6.9%
Aeronautical security recovery 42.0 38.2 10.0%
Retail revenue 116.4 115.4 0.9%
Property and car rental revenue 90.3 81.7 10.5%
Car parking and ground transport revenue 62.9 56.4 11.5%
Other 2.7 2.7 -0.4%
Total Revenue 537.9 503.6 6.8%
Expenses (pre recoverable security and specifics) (64.4) (58.9) 9.4%
Recoverable Expenses (36.7) (32.7) 12.2%
Other 0.1 (0.9)
EBITDA 436.9 411.1 6.3%
Depreciation and amortisation (114.2) (112.0)
EBIT 322.7 299.1
Total external finance costs (219.1) (219.1)
Shareholder related finance costs (140.7) (141.0)
Total finance costs (359.8) (360.1)
Profit/(Loss) before income tax expense (37.1) (61.0)

Sydney Airport distribution calculation
15
Sydney Airport Distribution Calculation HY 2013
Category* HY 2013 ($m) HY 2012 ($m)
Profit/(Loss) before income tax expense (37) (61)
Add back: borrowing costs – RPS held by ordinary shareholders 141 141
Add back: depreciation & amortisation 114 112
Profit before tax, shareholder interest, depreciation & amortisation 218 192
- Fair value adjustment to interest swaps not qualifying as hedges 1 4
- Amortisation of deferred debt establishment costs & other borrowings costs 5 10
- Capital indexed bonds capitalised during the period less interest expense 15 13
- Borrowing costs capitalised (4) (4)
Total non-cash financial expenses 17 23
- Movement in cash balances reserved for specific purposes (1) 34**
- Other 1 (6)
Add back / (subtract): other cash movements - 28
Cash flow available to equity 235 243
*Refer to page 12 of the SCACH interim financial report for the half year ended 30 June 2013 for further information and source data
** Includes approximately $27m release of SKIES interest reserve
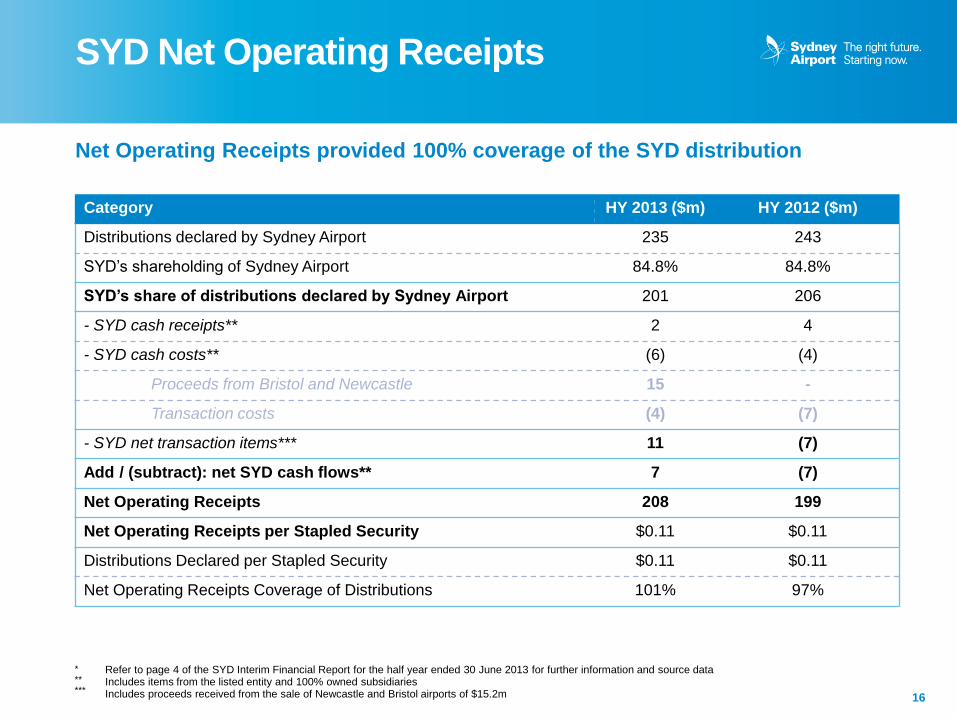
SYD Net Operating Receipts
16
Net Operating Receipts provided 100% coverage of the SYD distribution
Category HY 2013 ($m) HY 2012 ($m)
Distributions declared by Sydney Airport 235 243
SYD’s shareholding of Sydney Airport 84.8% 84.8%
SYD’s share of distributions declared by Sydney Airport 201 206
- SYD cash receipts** 2 4
- SYD cash costs** (6) (4)
Proceeds from Bristol and Newcastle 15 -
Transaction costs (4) (7)
- SYD net transaction items*** 11 (7)
Add / (subtract): net SYD cash flows** 7 (7)
Net Operating Receipts 208 199
Net Operating Receipts per Stapled Security $0.11 $0.11
Distributions Declared per Stapled Security $0.11 $0.11
Net Operating Receipts Coverage of Distributions 101% 97%
* ** ***
Refer to page 4 of the SYD Interim Financial Report for the half year ended 30 June 2013 for further information and source data Includes items from the listed entity and 100% owned subsidiaries Includes proceeds received from the sale of Newcastle and Bristol airports of $15.2m

Capital management
17
Solid balance sheet ratios and strong credit metrics
• Smooth and long-dated maturity profile
• Diversified funding sources
• $1.3b liquidity in undrawn facilities and
cash
• Fully funded capex into 2016
• Stable cost of debt, IR hedged 95%,
currency hedged 100%*
Sydney Airport Key Debt Metrics
Category 30 June 2013
Net Debt $6.2 billion
Net Debt/EBITDA 7.1x
DSCR 2.2x
Credit Rating BBB / Baa2 / BBB
Next Unfunded Maturity Q4 2014*
Average Maturity 7.6 years
Average Interest Rate 6.4%**
* Funding already raised to redeem bonds maturing in 2013 ** Cash interest paid / average gross debt
1.21x
1.71x
2.19x
1.00x
1.20x
1.40x
1.60x
1.80x
2.00x
2.20x
2.40x
CY02 CY07 1H13
Total Interest Coverage
36
438 245 316
86
302
417 700
300
200
175
100
217
519
822 913
547
732
317
684 719 750 802
659
360
0
250
500
750
1,000
1,250
1,500
2013 2015 2017 2019 2021 2023 2025 2027 2029
AU
D m
illio
ns
Debt Maturity Profile**
Drawn Bank Undrawn Bank Domestic Wrapped Bonds
Domestic Unwrapped Bonds Offshore Bonds
Average Maturity
* As at 30 June 2013
** Funding already raised to redeem bond maturing in 2013
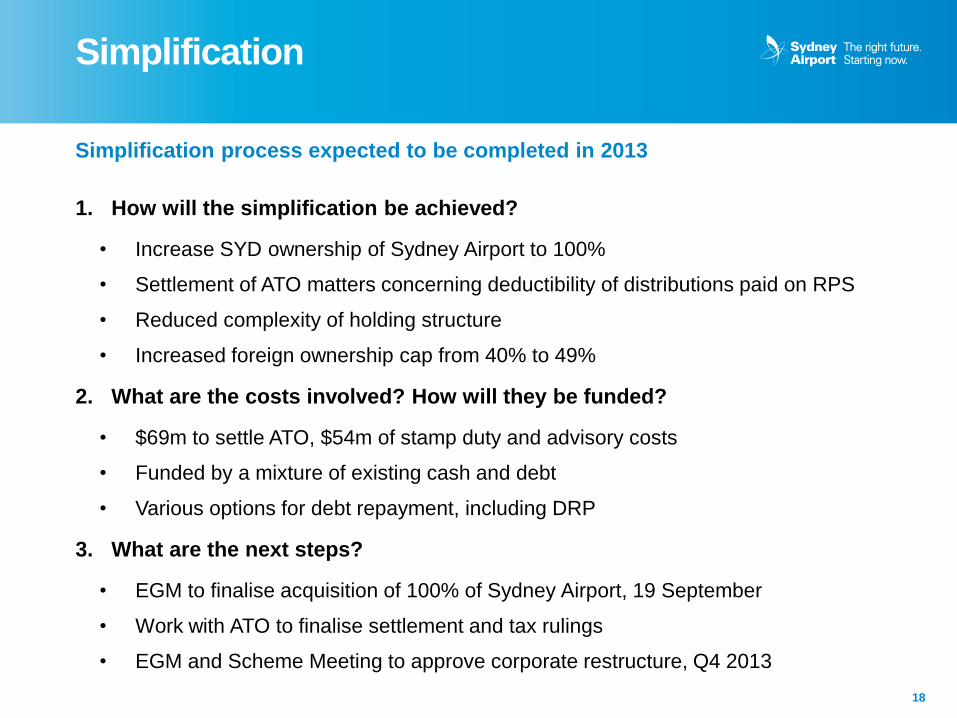
Simplification
18
Simplification process expected to be completed in 2013
1. How will the simplification be achieved?
• Increase SYD ownership of Sydney Airport to 100%
• Settlement of ATO matters concerning deductibility of distributions paid on RPS
• Reduced complexity of holding structure
• Increased foreign ownership cap from 40% to 49%
2. What are the costs involved? How will they be funded?
• $69m to settle ATO, $54m of stamp duty and advisory costs
• Funded by a mixture of existing cash and debt
• Various options for debt repayment, including DRP
3. What are the next steps?
• EGM to finalise acquisition of 100% of Sydney Airport, 19 September
• Work with ATO to finalise settlement and tax rulings
• EGM and Scheme Meeting to approve corporate restructure, Q4 2013

19
Business Strategies Driving Growth
Kerrie Mather
Chief Executive Officer

Successful implementation of our strategy
20
Stakeholder and Partnership engagement is key to our success
Retail Strategy
Retail Strategy Car Parking Strategy
Property Strategy
Executing strategy to deliver sustainable growth and distributable cash
Customer experience is a key focus
EBITDA growth
Aeronautical
Strategy
Traffic
Retail Strategy Car Parking
Strategy
Property
Strategy
Our vision: To deliver a world class airport experience and foster the growth of Sydney Airport for the benefit of Sydney, NSW and Australia

Improving the customer experience - Investment
21
Investing in capacity for growth and passenger facilitation
Large projects commenced or completed
over the period
• Aprons
- Increased facilities for larger aircraft
- Greater flexibility for airlines
• Departures screening – works to
support body scanners
- Increased floor area to facilitate
passenger circulation
• Seventh Street car park
- 900 new spaces in the domestic
precinct due for delivery 2H13
• Improvements to Pier C in T1
- Expanded gate lounges
- Improved lighting
- New stores and brands
Investment for 1H13 $103.6m
Investment in capacity & facilities,
until 2013-2015 ~$700m

• Aero revenue increased 6.9%
• Self serve kiosks in international,
undergone successful trial and looking
to expand offering
• Self serve bag drop trial in
international currently undergoing
assessment
• Smart Gates: increasing nationality
eligibility, more capacity and retail
promotions to raise penetration
• Focus on self service and technology,
to speed the passenger journey, ease
congestion, reduce costs and increase
passenger satisfaction
Improving the customer experience - Aeronautical
22
Embracing technology to streamline the passenger journey

• Customer led approach
• Significant customer analysis complete
• Information utilised to develop stores and brands
Understanding our customers
• Identifying gaps in current offering
• Focus on new, exclusive and unique products
• Benchmarking all retailers and offering travel essentials at prices comparable to downtown
Brand and value enhancements
• T1 objective - maximise quality of existing space and increase available retail area
• T2 objective - increase available space
Property & space improvements
• Ensuring value and changing perceptions
• Monitor customer service and set targets
• Understand trends and evolve offering
• Implement customer service training
Customer service focus
Improving the customer experience - Retail
23
Defined retail strategy will drive improved growth
Improving the customer experience - Retail
24
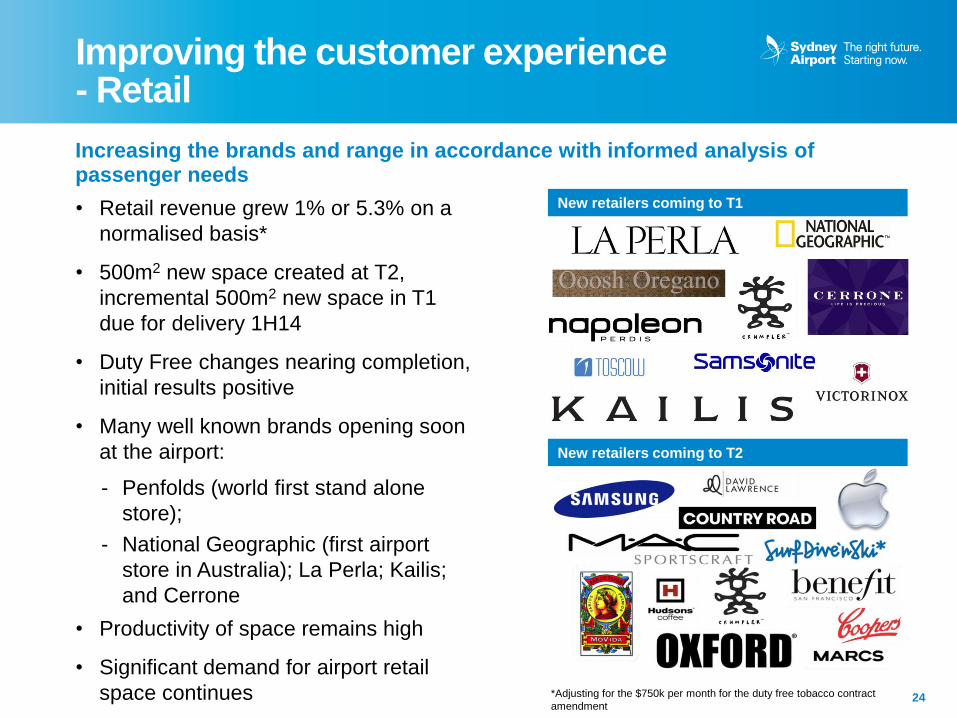
Increasing the brands and range in accordance with informed analysis of passenger needs
• Retail revenue grew 1% or 5.3% on a
normalised basis*
• 500m2 new space created at T2,
incremental 500m2 new space in T1
due for delivery 1H14
• Duty Free changes nearing completion,
initial results positive
• Many well known brands opening soon
at the airport:
- Penfolds (world first stand alone
store);
- National Geographic (first airport
store in Australia); La Perla; Kailis;
and Cerrone
• Productivity of space remains high
• Significant demand for airport retail
space continues
New retailers coming to T1
New retailers coming to T2
*Adjusting for the $750k per month for the duty free tobacco contract
amendment

Improving the customer experience - Car Parking
25
Car Parking yield improvement reflects increased capacity and increased parkers based on good value products and a superior experience
• Car Parking revenue grew 11.5%
• Online bookings now comprise 18% of
car parking revenue
• 900 new domestic spaces under
construction, due for delivery 2H13
• New market created in International
long stay
• Targeted special offers very successful
• Further scope for yield management
refinements and capacity utilisation
• Successful marketing campaign,
driving strong results
Improving the customer experience - Property
26
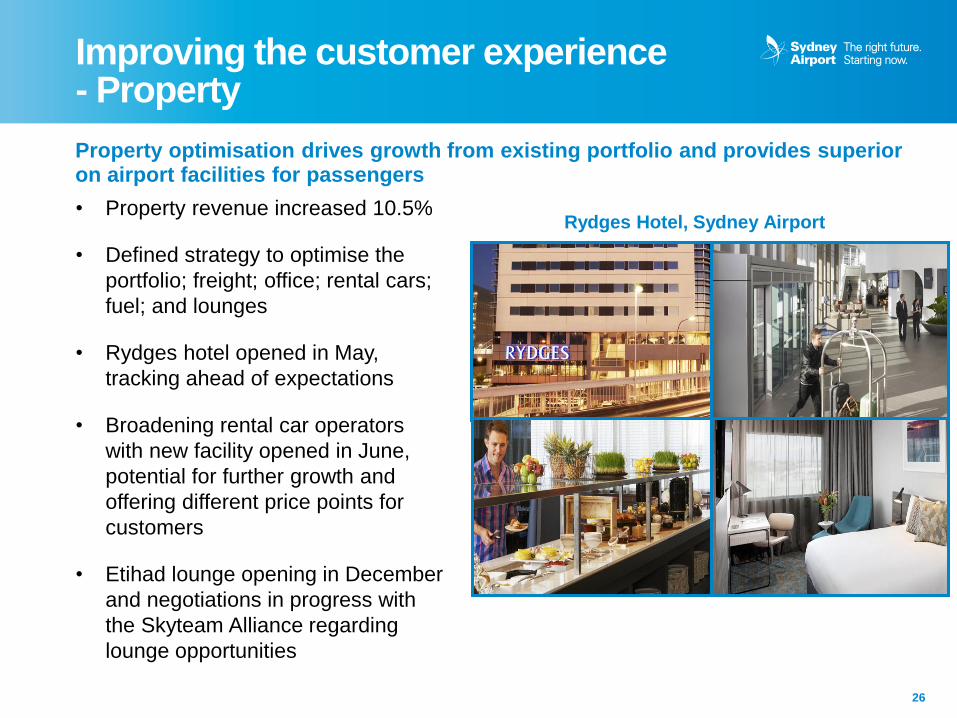
Property optimisation drives growth from existing portfolio and provides superior on airport facilities for passengers
• Property revenue increased 10.5%
• Defined strategy to optimise the
portfolio; freight; office; rental cars;
fuel; and lounges
• Rydges hotel opened in May,
tracking ahead of expectations
• Broadening rental car operators
with new facility opened in June,
potential for further growth and
offering different price points for
customers
• Etihad lounge opening in December
and negotiations in progress with
the Skyteam Alliance regarding
lounge opportunities
Rydges Hotel, Sydney Airport

Integrated business approach to customers and markets
27
An integrated approach to the Chinese market is driving performance improvements across all businesses
Aeronautical Improvements
• Way finding/signage
• Red ambassadors
• Chinese mobile application
• Smart gates, Chinese eligibility
Retail and Services
• Luxury brands and concessions
• Targeted advertising
• China Union pay
Property Opportunities
• Office space for Chinese Airlines
• Lounge opportunities

28
Airport Planning and Productivity
Kerrie Mather

Airport productivity
29
Sydney Airport has adequate capacity to meet air traffic demand for the foreseeable future
• Sydney Airport expects to have sufficient capacity well beyond 2033
• Approximately 320,000 slots a year are utilised out of a possible 500,000 regulated
slots
• Sydney Airport supports the Joint Study Recommendations:
- Optimising the use of Sydney Airport to ensure it operates efficiently and safely and
can grow to its practical maximum operating capacity
- Protect and optimise the use of other existing airports in the Sydney region
- Select and confirm the site for a new supplementary airport for the Sydney region
• New generation, quieter and larger aircraft are transforming airport usage
• Since 2000 passengers have increased by more than 46%, with less than 3% increase
in aircraft take offs and landings as a result of larger aircraft
Key areas for investment:
• Development of airfield capacity, aprons, gates and terminals in line with demand
• Ground transport improvements

Long term planning – productivity and improved passenger experience
Long term master plan released as preliminary draft on 5 June, following extensive industry and community consultation
Planning concepts focus on maximising
the productivity of the infrastructure and
delivering better customer and operational
outcomes for passengers and airlines.
The plan is:
• Better for passengers
• Better for airlines
• Better for freight operators
• Better for Sydney residents
• Better for regional communities
• Better for business and tourism
• Better for investors
30
No overlap in busiest
international and domestic
hours of operation

31
Ground transport 2013-2018
The road and intersection solutions provide more capacity, simpler flows and integration with the NSW Government’s off airport plans. They will deliver improved road and intersection performance in and around Sydney Airport
31

32
Outlook
Kerrie Mather
Chief Executive Officer
2013 Outlook
33
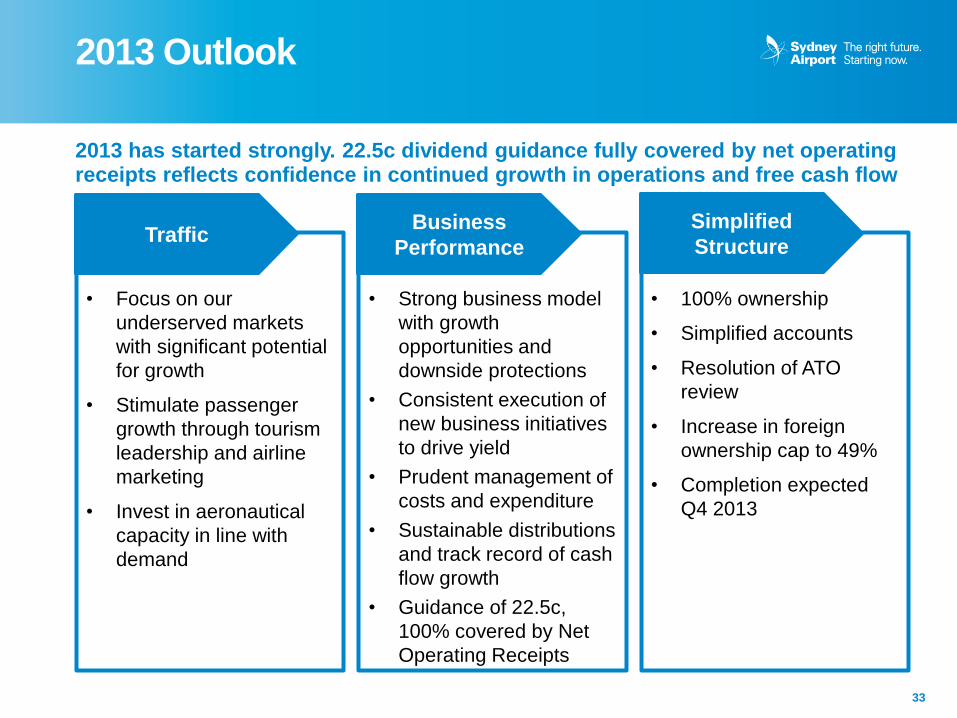
2013 has started strongly. 22.5c dividend guidance fully covered by net operating receipts reflects confidence in continued growth in operations and free cash flow
• Focus on our
underserved markets
with significant potential
for growth
• Stimulate passenger
growth through tourism
leadership and airline
marketing
• Invest in aeronautical
capacity in line with
demand
• Strong business model
with growth
opportunities and
downside protections
• Consistent execution of
new business initiatives
to drive yield
• Prudent management of
costs and expenditure
• Sustainable distributions
and track record of cash
flow growth
• Guidance of 22.5c,
100% covered by Net
Operating Receipts
• 100% ownership
• Simplified accounts
• Resolution of ATO
review
• Increase in foreign
ownership cap to 49%
• Completion expected
Q4 2013
Traffic Business
Performance
Simplified
Structure

34
Thank you for your attention
Questions?