navy optimization strategy - clu-in · don cleanup execution players ... any plans to install new...
TRANSCRIPT

Navy Optimization Strategy
Richard G. Mach Jr., P.E.

2
“Our Goal is to Achieve
Environmentally Protective Site Close-Outs At Least Cost.”
-The Honorable Robert B. Pirie, Jr.Former Assistant Secretary of the Navy Installation and Environment
December 3, 1996
Environmental Restoration Program

3
BUZZ WORDS/ACRONYMS – Past and Present
•SACM•DPGs•Triad•Optimization•Streamlined•Metrics•Performance based•Risk Based•Cost effective•Better, Faster, Cheaper•Execution goals
4
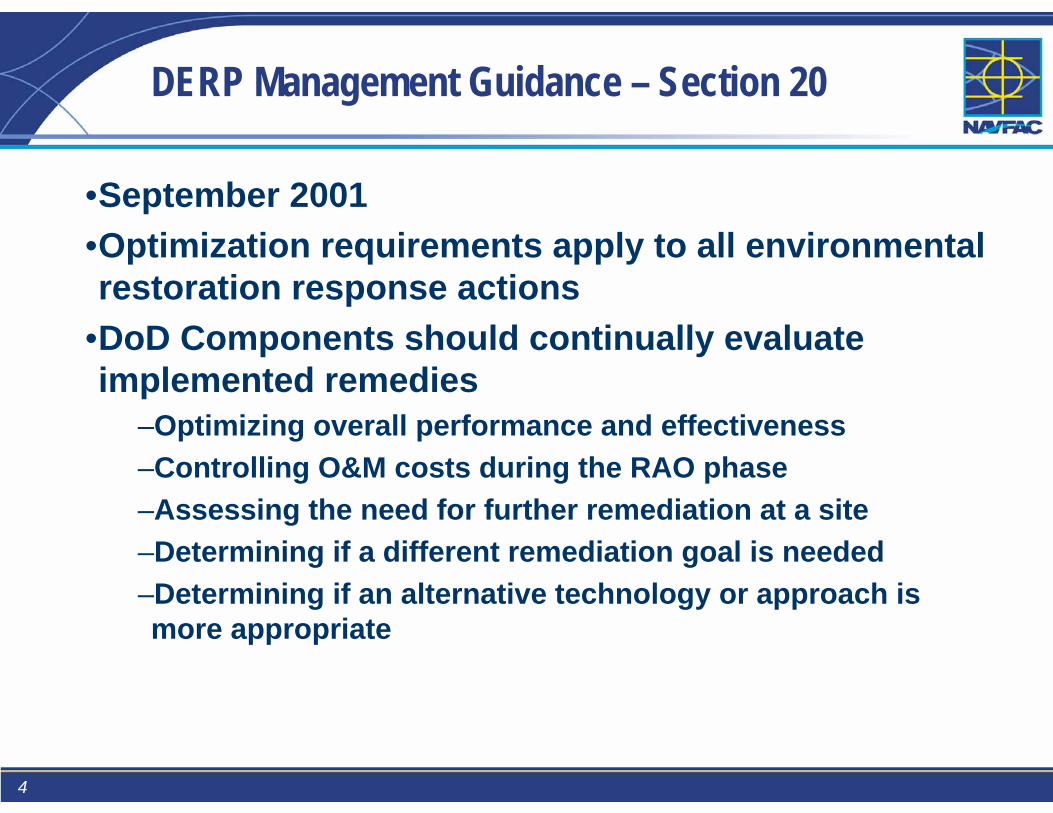
DERP Management Guidance – Section 20
•September 2001•Optimization requirements apply to all environmental restoration response actions
•DoD Components should continually evaluate implemented remedies
–Optimizing overall performance and effectiveness–Controlling O&M costs during the RAO phase–Assessing the need for further remediation at a site–Determining if a different remediation goal is needed–Determining if an alternative technology or approach is more appropriate

5
DON Cleanup Execution Players
•Assistant Secretary of the Navy
•Chief of Naval Operations
•Naval Facilities Engineering Command, HQ
•Engineering Field Divisions/Activities
•Activities

EFA Northeast
EFA Chesapeake
Atlantic Division
Southern DivisionSouthwest Division
EFA West
EFA Northwest
EFA Midwest
Pacific Division
Naval Facilities Engineering Command
EFA South

7
Environmental Restoration Process Phases
PA/SIRI/FS
RDRA
ConstructionRA
OperationLong-Term
Management
RD - Remedial DesignRA - Remedial ActionRIP - Remedy In-PlaceRC - Response CompleteSC - Site Closeout
RC
RIP
Site Closeout (SC) Process
SC
NFAROD
Optimization Design Optimization

8
ER,N FUNDING FOR STUDY/CLEANUP/LTM-LTO
$0$20,000$40,000$60,000$80,000
$100,000$120,000$140,000$160,000$180,000
2000
2001
2002
2003
2004
2005
2006
2007
2008
2009
2010
2011
2012
2013
2014
RAO/LTM Study CleanupNO MRP

9
DON Optimization Policy
•April 2004•Required by NAVFAC for all remediation response actions
–Started with top 20% most costly operating remediation systems in FY-03 Spring budget guidance
–Requirement to use three NAVFAC Optimization Guidance Docs–Requires HQ approval for all new P&T systems
•3rd Party Evaluation–In-House Technical Support or Independent Contractor
•Track progress within NORM–Recommendations from optimization study–Implemented Strategies–Results–Cost Savings

10
Required Navy Guidance Documents
•Navy Guidance for Optimizing Remedial Action Operation (RAO), April 2001
•Navy Guide to Optimal Groundwater Monitoring, January 2000
Navy Guidance for Optimizing Remedy Evaluation, Selection and Design, April 2004

11
Applicability to Cleanup Phases
•Feasibility Study and/or Engineering Evaluation/Cost Analysis
•Record of Decision and/or Action Memorandum (Remedy Selection)
•Remedial Design•Remedial and/or Removal Action Construction
•Remedial/Removal Action Operation •Long Term Management

12
New P&T Requirements
Any plans to install new pump and treat systems on Navy and Marine Corps installations requires approval from Headquarters (HQ) at the Naval Facilities Engineering Command (NAVFAC). This requirement applies to all “pump and treat” systems (remedial and removal actions) where groundwater is removed from the sub-surface by pumping or other means, treated above ground in any way, and discharged in any way (i.e. off site disposal, sewer systems, re-injected, etc.). In order to receive the NAVFAC HQ approval, the IR Manager shall forward a summary of the site background, the conceptual site model (CSM), the remedial actionobjectives, a listing of the technologies screened for the site, a summary of the alternatives analysis, and a statement of why “pump and treat” is the most appropriate technology to be used at the site, including a life cycle cost analysis (net present value and total site cost) and exit strategy. NAVFAC HQ will provide a written approval/dis-approval response to the IR Manager based on review of this submittal.


14
RAO/LTMgt Optimization Workgroup Members
•Tanwir Chaudhry NFESC (Intergraph)•Kelly Dreyer USMC HQ•Jeff Dale EFANE•Karla Harre NFESC•Richard Mach NAVFAC HQ•Mike Maughon EFDSOUTH•Bob McGee EFDLANT•Michael Pound EFDSW•Joe Rail EFANE•Teresa Thomas EFANW•Michelle Yoshioka EFDPAC

15
BRAC CTC Validation (FY-02)
Department of Navy BRAC Environmental Program Cost to
Complete Validation
July 2002

16
PROBLEM
• Scope Growth (Cleanup and Reuse)• CTC cost growth from fall 01 to spring 02.• Increase and changing cost of BRAC environmental
estimates has resulted in:– Loss of credibility in the Budget/POM process– Uncoordinated execution goals and transfer efforts
• Questions regarding what is needed to complete the BRAC program.

17
PLAN OF ACTION
• Stand down – Scrub the CTC• Letter to EFD/As
– Guidance (conference call)– Spreadsheets
• EFD/As submit basis for estimates and certify cost to HQ
• Technical Peer Review Team Q&As• VTCs with EFD/As• Follow-up Q&As• Resolve differences and certify scope/cost
18
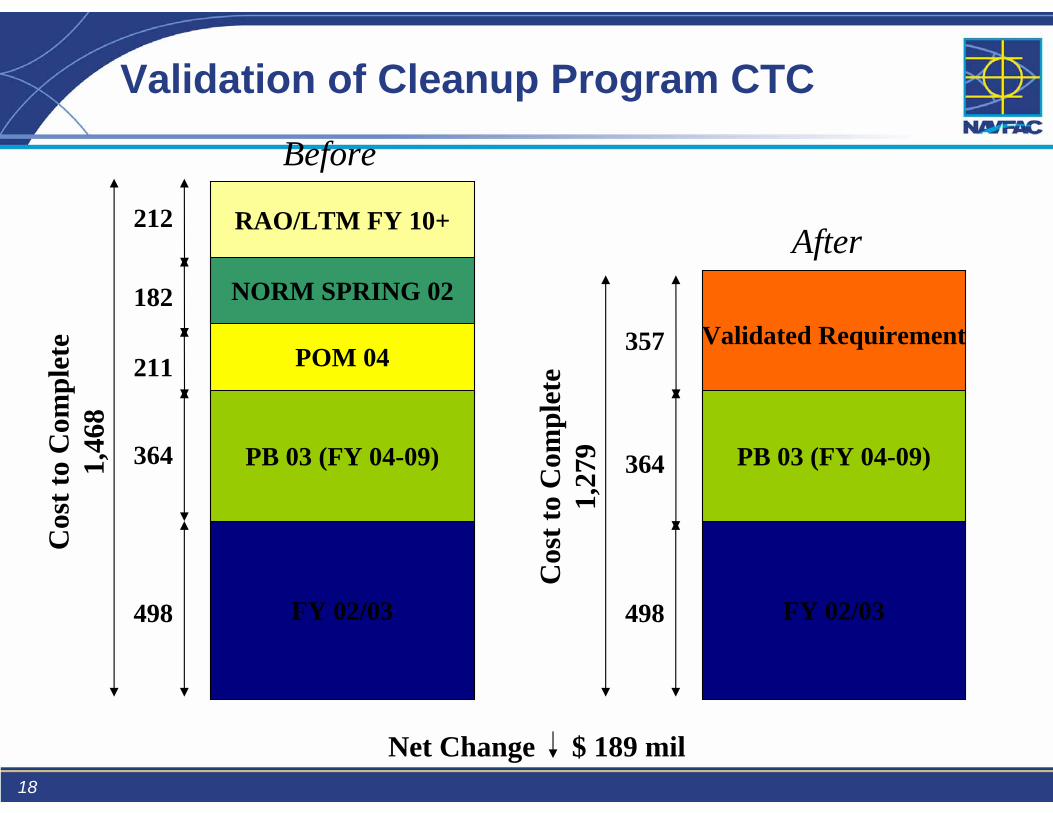
Validation of Cleanup Program CTC
FY 02/03
RAO/LTM FY 10+
POM 04
PB 03 (FY 04-09)
NORM SPRING 02
Validated Requirement
FY 02/03
PB 03 (FY 04-09)
Before
After
498
357
364
212
182
211
364
498
Cos
t to
Com
plet
e 1,
468
Cos
t to
Com
plet
e 1,
279
Net Change $ 189 mil

19
PEER REVIEW TEAM
• HQ Management – Brian Harrison, P.E.– Bill Judkins, P.E.
• Early Transfer Hub– David Criswell, P.E.– Cliff Casey, P.E.
• Technical Personnel– SOUTHDIV – Mike Maughon, P.E.– LANTDIV – Mark Barnes, P.E.– Headquarters
• Richard Mach, P.E.• Rob Sadorra, P.E.
• Contractor Support - Ensafe
20
ER,N CTC Validation (FY-04)
Department of Navy ER,N Program Cost to Complete Validation
February 2004

21
ER,N CTC Validation Objectives (FY-04)
•Validate – cleanup requirements – strategies and technologies – associated cost
•Goal - ID CTC Cost avoidance through Optimization (EOY FY 03 baseline)
– 8% initially– 2% in the following 2 years
•Provide technical review and assistance in overall cleanup approach
•Identify departures from strict risk and regulations based cleanup

22
VALIDATION PROCESS
1. Selected 220 of the highest CTC sites– Highest 15% of all ER,N program sites – Represents sites with CTC of $ 3 M and greater– Represents 67% of total ER,N program CTC
2. Distributed questionnaire in a standard template for submittal
3. Selected Review Team Members4. Established interactive web-based document
repository for Team and RPM collaboration

23
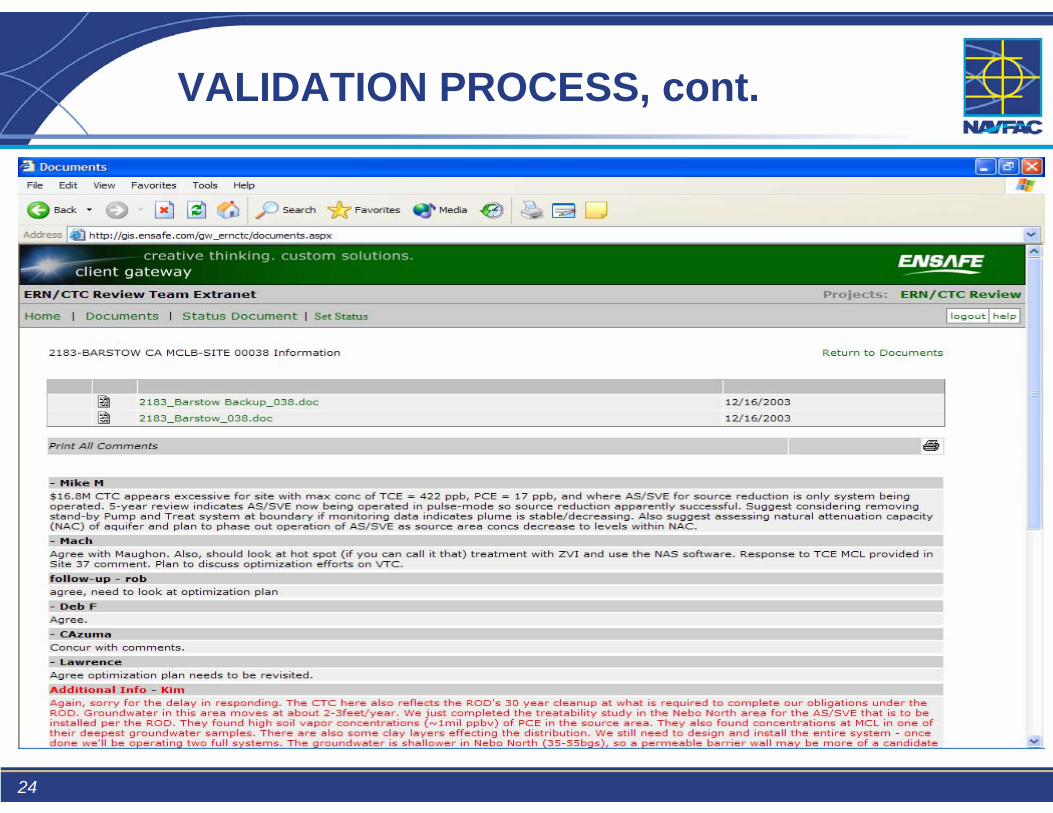
VALIDATION PROCESS, cont.
24
VALIDATION PROCESS, cont.

25
VALIDATION PROCESS, cont.
5. Team selected sites for further discussion, based on:– Level of information submitted– Strength of cleanup approach assumptions– Strength of technologies selected– Consistency of cost– Other concerns (i.e. ER,N eligibility)
152 sites slated for further discussions with RPMs/Managers6. Team and RPM conferences
In discussions, sites were classified in 1 of 4 categories:(Cat. 1) - No change in site strategy or cost necessary (Cat. 2) - Team and RPM agree CTC may not be up-to-date or may be overly conservative, and can be revised immediately (Cat. 3) - Early Phase Site: uncertain, but probable/less conservative CTC should be considered in future (Cat. 4) - Mature Site: could benefit from further RPM review, optimization study or Tiger team review Also identified some sites with apparent potential cost growth, or other issues (i.e. MRP policy, ER,N eligibility issues, etc.)

26
RESULTS – Category 2
• Immediate savings achieved in our category 2 sites– $271 M savings FY 05 and out– $156 M savings FY 05 to FY 11
$ 44 M$ 26 M$ 14 M$ 32 M$ 57 M$ 48 M$ 11 M$ 13 M$ 15 M$ 8 M$ 5 M
FY 15FY 14FY 13FY 12FY 11FY 10FY 09FY 08FY 07FY 06FY 05
0102030405060
FY 06 FY 07 FY 08 FY 09 FY 10 FY 11 FY 12 FY 13 FY 14 FY 15
$ (M)

27
SUMMARY AND FUTURE ACTIONS
•With 9.5% savings, we have exceeded the initial year goal of 8%
•Continue finding program efficiencies–Follow-up action on category 3 and 4 sites–Extend process to other sites below the $ 3 M threshold
•Options:–EFD review teams –East and West coast review teams (available HQ and ESC support)

28
VALIDATION REVIEW TEAM MEMBERS
Cowan Azuma, PACDIVMichael Pound, SWDIVLawrence Lansdale, SWDIVMark Wicklein, EFANWMark Barnes, LANTDIVDebra Felton, EFANE
Mike Maughon, SDIVCliff Casey, SDIVDavid Criswell, SDIVSteve McCarel, NFESCRichard Mach, HQRob Sadorra, HQ
Contract Support provided by Ensafe Inc.

29
Navy Path Forward
•Ensure optimization at all phases
•Minimize/eliminate use of P&T
•Track optimization efforts
•Work with EPA on promoting Triad
•Perform additional validation efforts
30
Questions?