navrachana international school vadodara ib dp chemistry ... · pdf filenavrachana...
TRANSCRIPT

NAVRACHANA INTERNATIONAL SCHOOL VADODARA
IB DP CHEMISTRY
STANDARD LEVEL (SL) HANDBOOK
YEAR 2015-17
Compiled by:
Dr. Trushna Kapadia –IB DP Chemistry Tutor

SYLLABUS CONTENT
Core [95 hours]
Topic 1: Stoichiometric relationships
1.1 Introduction to the particulate nature of matter and chemical change
1.2 The mole concept
1.3 Reacting masses and volumes
Topic 2: Atomic structure
2.1 The nuclear atom
2.2 Electron configuration
Topic 3: Periodicity
3.1 The periodic table
3.2 Periodic trends
Topic 4: Chemical bonding and structure
4.1 Ionic bonding and structure
4.2 Covalent bonding
4.3 Covalent structures
4.4 Intermolecular forces
4.5 Metallic bonding
Topic 5: Energetics/thermochemistry
5.1 Measuring enthalpy changes
5.2 Hess’s law
5.3 Bond enthalpies
Topic 6: Chemical kinetics
6.1 Collision theory and rates of reaction
Topic 7: Equilibrium
7.1 Equilibrium
Topic 8: Acids and bases
8.1 Theories of acids and bases
8.2 Properties of acids and bases
8.3 The pH scale
8.4 Strong and weak acids and bases

8.5 Acid deposition
Topic 9: Redox processes
9.1 Oxidation and reduction
9.2 Electrochemical cells
Topic 10: Organic chemistry
10.1 Fundamentals of organic chemistry
10.2 Functional group chemistry
Topic 11: Measurement and data processing
11.1 Uncertainties and errors in measurement and results
11.2 Graphical techniques
11.3 Spectroscopic identification of organic compounds
Options [15 hours – SL]
A: Materials
Core topics
A.1 Materials science introduction
A.2 Metals and inductively coupled plasma (ICP) spectroscopy
A.3 Catalysts
A.4 Liquid crystals
A.5 Polymers
A.6 Nanotechnology
A.7 Environmental impact – plastics
B: Biochemistry
Core topics
B.1 Introduction to biochemistry
B.2 Proteins and enzymes
B.3 Lipids
B.4 Carbohydrates
B.5 Vitamins
B.6 Biochemistry and the environment

C: Energy
Core topics
C.1 Energy sources
C.2 Fossil fuels
C.3 Nuclear fusion and fission
C.4 Solar energy
C.5 Environmental impact—global warming
D: Medicinal chemistry
Core topics
D.1 Pharmaceutical products and drug action
D.2 Aspirin and penicillin
D.3 Opiates
D.4 pH regulation of the stomach
D.5 Anti-viral medications
D.6 Environmental impact of some medications
ASSESSMENT OUTLINE
STANDARD LEVEL ASSESSMENT SPECIFICATIONS
ComponentOverall
Weight age Duration Format & Details
Paper 1 20 ¾ hr 30 multiple-choice questions on thecore
Paper 2 40 1 ¼ hr Data based, short answer and extendedresponse questions.
Paper 3 20 1 hr Questions on core and SL optionmaterial.Section A - short answer question onexperimental workSection B - answer and extended-response questions from one option.
ExternalsInternals
80%20% [ Investigations + Group 4 project ]

PRACTICAL WORK AND INTERNAL ASSESSMENT
Internal Assessment Specifications 20%
INTERNAL ASSESSMENT CRITERIA
The new assessment model uses five criteria to assess the final report of the individual
investigation with the following raw marks and weightings assigned.
PersonalEngagement Exploration Analysis Evaluation Communication Total
2(8%) 6(25%) 6(25%) 6(25%) 4(17%) 24(100%)
Students at SL are required to spend 40 hours, and students at HL 60 hours, on practical
activities (excluding time spent writing up work). These times include 10 hours for the group
4 project and 10 hours for the internal assessment investigation. (Only 2–3 hours of
investigative work can be carried out after the deadline for submitting work to the moderator
and still be counted in the total number of hours for the practical scheme of work.)
RESOURCES:
Books: Chemistry Course Companion, Sergey Bylikin, Gary Horner, Brian Murphy, David
Tarcy, Oxford University Press. Pearson Baccalaureate Standard Level Chemistry 2nd edition, Catrin Brown, Mike
Ford. IB Chemistry Study Guide: 2014 Edition: Oxford IB Diploma Program (Oxford IB
Study Guides): Geoffrey Neuss.

Internal Assessment Group 4 Sciences[Biology, Chemistry & Physics]
Weighting - 20% Time – 10 hoursThe new assessment model uses five criteria to assess the final report of the individualinvestigation with the following raw marks and weightings assigned:
Personal Engagement: 2Exploration: 6Analysis: 6Evaluation: 6Communication: 4TOTAL: 24
Personal engagement – 2 marksThis criterion assesses the extent to which the student engages with the exploration andmakes it their own. Personal engagement may be recognized in different attributes andskills. These could include addressing personal interests or showing evidence ofindependent thinking, creativity or initiative in the designing, implementation orpresentation of the investigation.
Mark Descriptor
0 The student’s report does not reach a standard described by the descriptors below.
1
The evidence of personal engagement with the exploration is limited with littleindependent thinking, initiative or creativity.
The justification given for choosing the research question and/or the topic underinvestigation does not demonstrate personal significance, interest or curiosity.
There is little evidence of personal input and initiative in the designing,implementation or presentation of the investigation.
2The evidence of personal engagement with the exploration is clear with significantindependent thinking, initiative or creativity.
The justification given for choosing the research question and/or the topic underinvestigation demonstrates personal significance, interest or curiosity.
There is evidence of personal input and initiative in the designing, implementationor presentation of the investigation.

Exploration – 6 marksThis criterion assesses the extent to which the student establishes the scientific context forthe work, states a clear and focused research question and uses concepts and techniquesappropriate to the Diploma Programme level. Where appropriate, this criterion also assessesawareness of safety, environmental, and ethical considerations.
Mark Descriptor
0 The student’s report does not reach a standard described by the descriptorsbelow.
1–2
The topic of the investigation is identified and a research question of somerelevance is stated but it is not focused.
The background information provided for the investigation is superficial or oflimited relevance and does not aid the understanding of the context of theinvestigation.
The methodology of the investigation is only appropriate to address the researchquestion to a very limited extent since it takes into consideration few of thesignificant factors that may influence the relevance, reliability and sufficiency ofthe collected data.
The report shows evidence of limited awareness of the significant safety, ethicalor environmental issues that are relevant to the methodology of the investigation.
3–4The topic of the investigation is identified and a relevant but not fully focusedresearch question is described.
The background information provided for the investigation is mainly appropriateand relevant and aids the understanding of the context of the investigation.
The methodology of the investigation is mainly appropriate to address theresearch question but has limitations since it takes into consideration only someof the significant factors that may influence the relevance, reliability andsufficiency of the collected data.
The report shows evidence of some awareness of the significant safety, ethical orenvironmental issues that are relevant to the methodology of the investigation*.
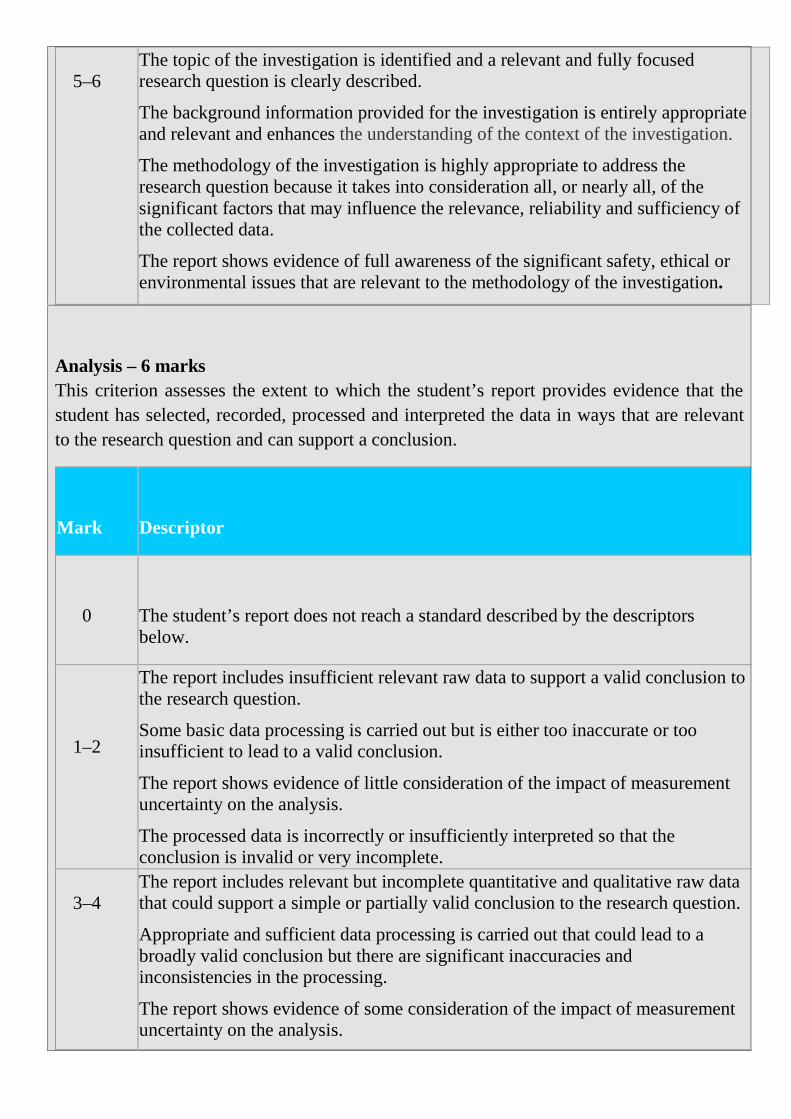
5–6The topic of the investigation is identified and a relevant and fully focusedresearch question is clearly described.
The background information provided for the investigation is entirely appropriateand relevant and enhances the understanding of the context of the investigation.
The methodology of the investigation is highly appropriate to address theresearch question because it takes into consideration all, or nearly all, of thesignificant factors that may influence the relevance, reliability and sufficiency ofthe collected data.
The report shows evidence of full awareness of the significant safety, ethical orenvironmental issues that are relevant to the methodology of the investigation.
Analysis – 6 marksThis criterion assesses the extent to which the student’s report provides evidence that thestudent has selected, recorded, processed and interpreted the data in ways that are relevantto the research question and can support a conclusion.
Mark Descriptor
0 The student’s report does not reach a standard described by the descriptorsbelow.
1–2
The report includes insufficient relevant raw data to support a valid conclusion tothe research question.
Some basic data processing is carried out but is either too inaccurate or tooinsufficient to lead to a valid conclusion.
The report shows evidence of little consideration of the impact of measurementuncertainty on the analysis.
The processed data is incorrectly or insufficiently interpreted so that theconclusion is invalid or very incomplete.
3–4The report includes relevant but incomplete quantitative and qualitative raw datathat could support a simple or partially valid conclusion to the research question.
Appropriate and sufficient data processing is carried out that could lead to abroadly valid conclusion but there are significant inaccuracies andinconsistencies in the processing.
The report shows evidence of some consideration of the impact of measurementuncertainty on the analysis.

The processed data is interpreted so that a broadly valid but incomplete or limitedconclusion to the research question can be deduced.
5–6The report includes sufficient relevant quantitative and qualitative raw data thatcould support a detailed and valid conclusion to the research question.
Appropriate and sufficient data processing is carried out with the accuracyrequired to enable a conclusion to the research question to be drawn that is fullyconsistent with the experimental data.
The report shows evidence of full and appropriate consideration of the impact ofmeasurement uncertainty on the analysis.
The processed data is correctly interpreted so that a completely valid and detailedconclusion to the research question can be deduced.
Evaluation – 6 marksThis criterion assesses the extent to which the student’s report provides evidence ofevaluation of the investigation and the results with regard to the research question and theaccepted scientific context.
Mark Descriptor
0 The student’s report does not reach a standard described by the descriptorsbelow.
1–2
A conclusion is outlined which is not relevant to the research question or is notsupported by the data presented.
The conclusion makes superficial comparison to the accepted scientific context.
Strengths and weaknesses of the investigation, such as limitations of the data andsources of error, are outlined but are restricted to an account of the practical orprocedural issues faced.
The student has outlined very few realistic and relevant suggestions for theimprovement and extension of the investigation.
3–4A conclusion is described which is relevant to the research question andsupported by the data presented.
A conclusion is described which makes some relevant comparison to theaccepted scientific context.
Strengths and weaknesses of the investigation, such as limitations of the data andsources of error, are described and provide evidence of some awareness of the
methodological issues involved in establishing the conclusion.
The student has described some realistic and relevant suggestions for theimprovement and extension of the investigation.
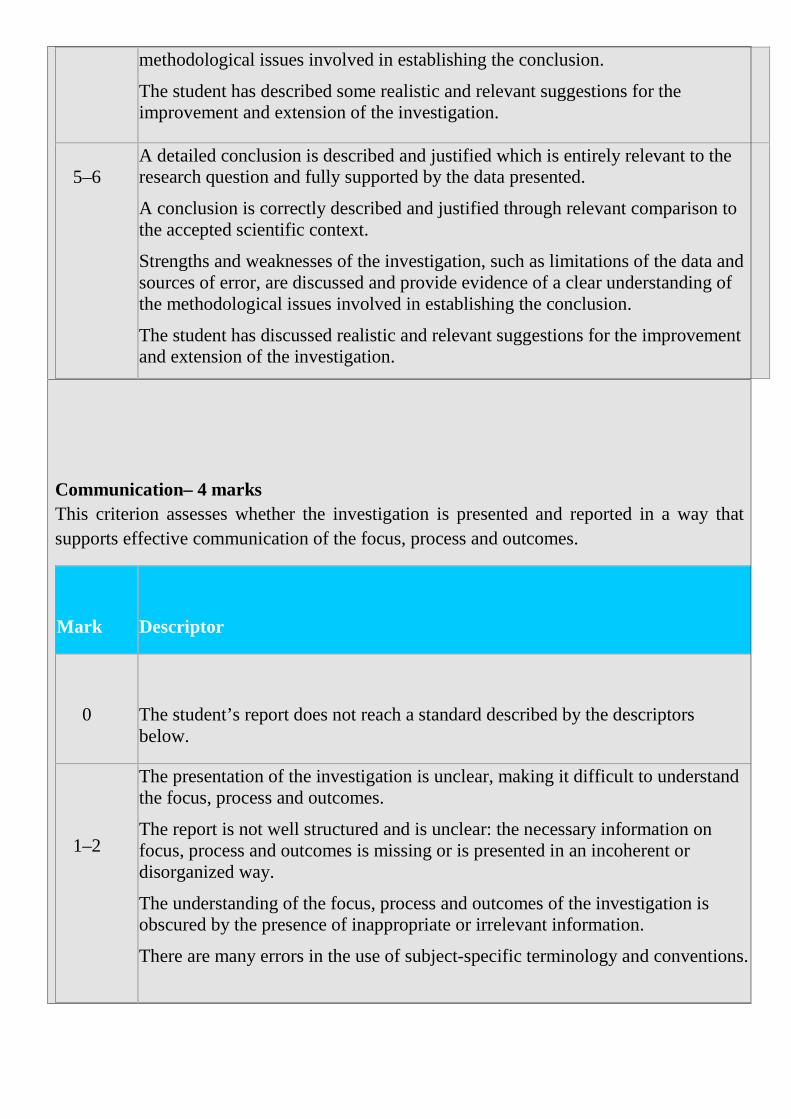
5–6A detailed conclusion is described and justified which is entirely relevant to theresearch question and fully supported by the data presented.
A conclusion is correctly described and justified through relevant comparison tothe accepted scientific context.
Strengths and weaknesses of the investigation, such as limitations of the data andsources of error, are discussed and provide evidence of a clear understanding ofthe methodological issues involved in establishing the conclusion.
The student has discussed realistic and relevant suggestions for the improvementand extension of the investigation.
Communication– 4 marksThis criterion assesses whether the investigation is presented and reported in a way thatsupports effective communication of the focus, process and outcomes.
Mark Descriptor
0 The student’s report does not reach a standard described by the descriptorsbelow.
1–2
The presentation of the investigation is unclear, making it difficult to understandthe focus, process and outcomes.
The report is not well structured and is unclear: the necessary information onfocus, process and outcomes is missing or is presented in an incoherent ordisorganized way.
The understanding of the focus, process and outcomes of the investigation isobscured by the presence of inappropriate or irrelevant information.
There are many errors in the use of subject-specific terminology and conventions.

3–4The presentation of the investigation is clear. Any errors do not hamperunderstanding of the focus, process and outcomes.
The report is well structured and clear: the necessary information on focus,process and outcomes is present and presented in a coherent way.
The report is relevant and concise thereby facilitating a ready understanding ofthe focus, process and outcomes of the investigation.
The use of subject-specific terminology and conventions is appropriate andcorrect. Any errors do not hamper understanding.

Chemistry teacher support material 1
Investigation 1 (annotated)
1
CHEMISTRY INVESTIGATION
FACTORS EFFECTING THE BOILING AND MELTING POINTS IN ORGANIC HOMOLOGOUS SERIES.
Introduction
The idea for this investigation came about when we were learning about trends in physical properties in homologous series. With regards to alkanes we saw that the boiling point increases with increasing carbon number due to stronger van der Waal’s forces as the temporary dipoles increase. However according to Brown and Fordi “the increase is not linear, but steeper near the beginning as the influence of increased chain length is proportionally greater for the small molecules”.
Also I have seen that for compounds of similar molar masses (so that the strength of van der Waal’s forces are similar) that the addition of functional groups into the hydrocarbon chain make a very great difference to the melting and boiling temperatures. For example the permanent dipole due to the carbonyl group in aldehydes and ketones results in a stronger dipole-dipole forces and so a higher boiling or melting point. The OH group in alcohols will cause an even higher boiling and melting temperature because it causes the strongest intermolecular force, hydrogen bonding to occur. This is supported if we take three compounds of similar molar mass, propane, ethanol and ethanol and compare their boiling temperature.
Mr (g mol-1) Strongest intermolecular force
Boiling Temperature ii (ºC)
Propane 44 Van der Waal’s -42
Ethanal 44 Dipole-Dipole 20
Ethanol 46 Hydrogen Bonding 78
From these values we see that the effect on the boiling temperature of adding a carbonyl or hydroxyl group is very large. But these are small molecules and I wondered if again the effect will be reduced with increasing hydrocarbon chain length because the proportionate effect of the functional group will get less and the aldehyde, ketone or alcohol will become more “alkane” in nature as the chain length increases. Will we see the melting and boiling points of the aldehydes, ketones and alcohols converge on those of the alkanes and if so at what chain length does the effect of a carbonyl or hydroxyl group become insignificant?
When looking at the effects of carbonyl or hydroxyl group one other possible influencing factor is the position on the chain of the carbonyl or hydroxyl group. I can imagine that a functional group hidden in the middle of a long hydrocarbon chain may not be able to approach and attract a close by molecule as easily as a functional group at the end of a chain. So my second aim is to see if a
EX: Going towards fulfilling “The background information provided for the investigation is entirely appropriate and relevant and enhances the understanding of the context of the investigation. “
EX: More relevant background information.
PE: Evidence of curiosity arising out of their classroom learning.
PE: Independent thinking about the research question.

Chemistry teacher support material 2
Investigation 1 (annotated)
2
functional group at the end of a chain will have a greater, lesser or the same effect on the intermolecular forces as one in the middle of a chain?
Research Questions
(i) Will the melting and boiling points of the aldehydes, ketones and alcohols converge on those of the alkanes as we increase the carbon number and if so at what chain length does the effect of a carbonyl or hydroxyl group become insignificant?
(ii) What will be the effect on the melting and boiling points of changing the position of the functional group in the ketone of alcohol.
Methodology
The dependent variables in this investigation are the melting and boiling points of the compounds in the homologous series: alkanes, aldehydes, 2-ketones, 3-ketones, 1-alcohols, 2-alcohols and 3-alcohols. The independent variables are the molar mass of the compound and the identity and position of the functional group
A control variable is that I will only look at compounds with linear hydrocarbon chains so there will be no added effect from branching.
When assessing the effect of the identity and position of the functional group I will be graphing the melting and boiling temperatures against the Molar Mass of the compound.
This investigation will use data available from two databases
1. CRC Handbook of Chemistry and Physics, 85th Edition, CRC Press, 2004 2. The RSC Chemspider online chemical databaseiii
The Chemspider database contains experimental data and predicted data from ACD/LABS (boiling point only) and EPISuite. The predicted data was only to be used where an experimentally determined value was not available in the CRC Handbook or the Chemspider website.
The CRC Handbook was the first choice source of data since it is a resource that has been available for many years and I would assume many people have cross checked the data. Also once I was able to find a compound e.g. hexane, it was very quick and easy to read off values for hexanal, 1-hexanol, etc, since they were adjacent in the table of physical properties. In Chemspider I had to make a separate formula search for each one which was much slower.
C: Very clearly presented and clarified research questions. Good.
EX: The topic of the investigation is identified and a relevant and fully focused research question is clearly described.
EX: There are other databases available through the web but this was sufficient to address research question.
EX: Good consideration regarding reliability of data.

Chemistry teacher support material 3
Investigation 1 (annotated)
3
Raw Data
DATA TABLE 1 Melting Pts Melting Point (± 1 ºC)
Num
ber
Carb
ons
+
Oxy
gens
Mr (±0.
5 g/
mol
)
Line
ar
Alk
anes
Line
ar
Alde
hyde
s
Line
ar
2-ke
tone
s
Line
ar
3-ke
tone
s
Line
ar
1-al
coho
ls
Line
ar
2-
alco
hols
Line
ar
3-al
coho
ls
1 16 -182
2 30 -183 -92
2 32 -98
3 44 -188 -123
3 46 -114
4 58 -138 -80 -95
4 60 -124 -88
5 72 -130 -97 -87
5 74 -89 -89
6 86 -95 -92 -77 -39
6 88 -78 -73 -69
7 100 -91 -56 -56 -55
7 102 -47 -51 -51
8 114 -57 -43 -35 -39
8 116 -33 -39 -70
9 128 -53 -16
9 130 -15 -32 -45
10 142 -30 -19 -8 -8
10 144 -5 -35 22
11 156 -26 -4 14 1
11 158 7 -1 -8
12 170 -10 -2 15 9
12 172 16 0
13 184 -5 12 21
13 186 24 19
14 198 6 14 31 31
14 200 32 23 32
15 212 10 30 35 34
15 214 38 34 32
16 226 18 25 20
16 228 44 35 39
17 240 22 35 43
17 242 49 44 50
18 254 28 36 48
18 256 61 54
19 268 32 46 51
19 270 58
20 282 36 57
20 284 62
C: No use of compound names and a lot of empty cells do make the data tables a little hard to follow. However they bring together a large amount of data quite concisely (better than multiple tables for each homologous series) and there is a logic to their construction with the data organised according to ascending Mr.
Chemistry teacher support material 4
Investigation 1 (annotated)
4
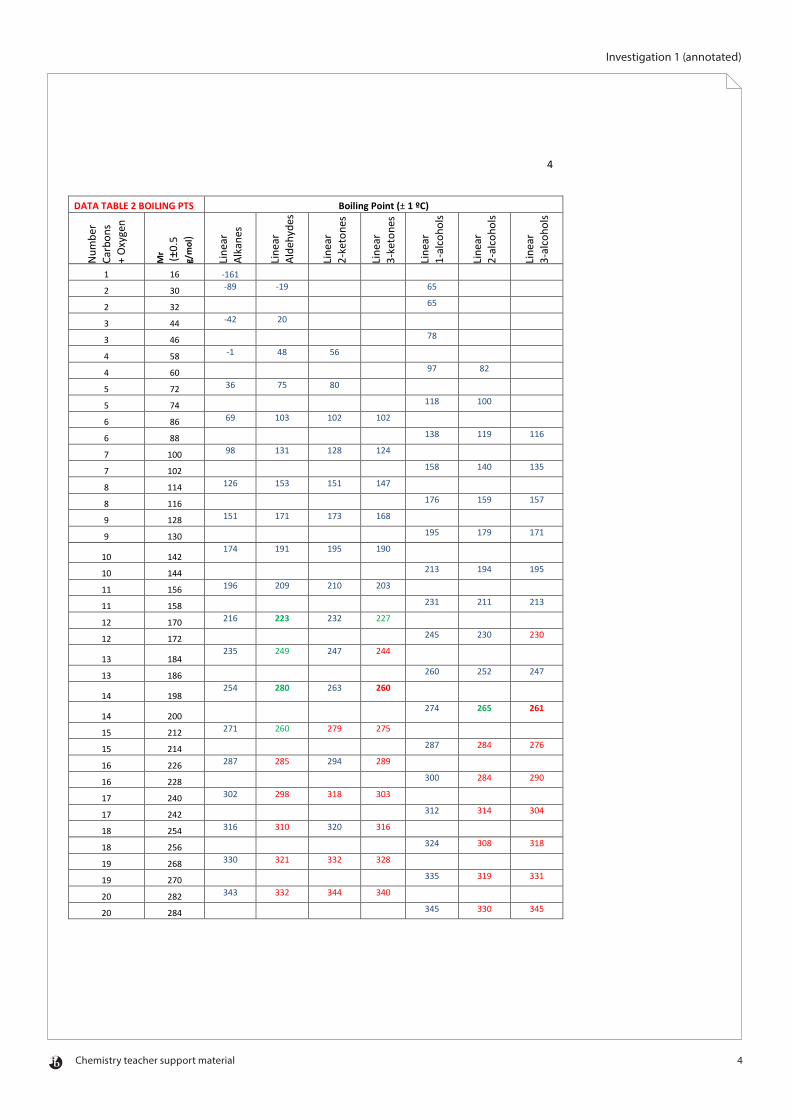
DATA TABLE 2 BOILING PTS Boiling Point (± 1 ºC)
Num
ber
Carb
ons
+ O
xyge
n
Mr (±0.
5 g/
mol
)
Line
ar
Alka
nes
Line
ar
Alde
hyde
s
Line
ar
2-ke
tone
s
Line
ar
3-ke
tone
s
Line
ar
1-al
coho
ls
Line
ar
2-al
coho
ls
Line
ar
3-al
coho
ls
1 16 -161
2 30 -89 -19 65
2 32 65
3 44 -42 20
3 46 78
4 58 -1 48 56
4 60 97 82
5 72 36 75 80
5 74 118 100
6 86 69 103 102 102
6 88 138 119 116
7 100 98 131 128 124
7 102 158 140 135
8 114 126 153 151 147
8 116 176 159 157
9 128 151 171 173 168
9 130 195 179 171
10 142 174 191 195 190
10 144 213 194 195
11 156 196 209 210 203
11 158 231 211 213
12 170 216 223 232 227
12 172 245 230 230
13 184 235 249 247 244
13 186 260 252 247
14 198 254 280 263 260
14 200 274 265 261
15 212 271 260 279 275
15 214 287 284 276
16 226 287 285 294 289
16 228 300 284 290
17 240 302 298 318 303
17 242 312 314 304
18 254 316 310 320 316
18 256 324 308 318
19 268 330 321 332 328
19 270 335 319 331
20 282 343 332 344 340
20 284 345 330 345

Chemistry teacher support material 5
Investigation 1 (annotated)
5
Key to Data Sources in Data Tables
Blue font – CRC Handbook Green Font – Chemspider Experimental
Red Font = ACD/Labs prediction Mustard Font – EPI Suite
Uncertainty in Raw Data
The experimental data were cited with varying precision ranging from zero to three decimal places. Also the melting temperature was sometimes cited as a range. Where a range was given I have chosen the midpoint and have rounded off to the nearest integer value.
The data sources were evaluated by looking at some example compounds where experimentally determined data is available as well a prediction given
Table 3: Evaluation of Data Sources
Compound CRC Handbook Experimental data
Chemspider Experimental data
Chemspider ACD/Labs Predicted Data
Chemspider EPISuite Predicted Data
M.Pt (ºC) B.Pt (ºC) M.Pt (ºC) B.Pt (ºC) M.Pt (ºC) B.Pt (ºC) M.Pt (ºC) B.Pt (ºC)
Hexane -95 69 -95 69 NA 69 -94 72
Pentanal -92 103 -92 103 NA 104 -68 109
1-Pentanol -78 138 -79 137 NA 138 -50 137
Looking at Table 3 it is clear that there is usually good agreement between the CRC Handbook and Chemspider experimentally sources.
The ACD Labs predicted values for boiling temperatures appear quite close to experimental and can be used where experimental data is not available. At higher temperatures the experimental values in the CRC handbook relate to that measured at lower than atmospheric pressure. This could be because the boiling temperature at normal atmospheric pressure is very higher and the compounds may thermally decompose before the predicted boiling temperature.
The EPISuite predicted data is not so reliable. There is some variation in the boiling points and large variation in the melting temperature data. As a result I have omitted the EPI Suite data in the analysis section below.
EX: Again described methodology regarding uncertainty of data. Good.
EX: Once again methodology is evaluating reliability of data. Good
A: Comments on lack of reliability of the EPI Suite data and understands the impact this will have on the validity of the results and so chooses to eliminate its data from analysis
Chemistry teacher support material 6
Investigation 1 (annotated)
6
Analysis and Discussion
Part (i) Effect of chain length on the comparative melting and boiling points of the alkanes, aldehydes, ketones and alcohols.
The first two graphs below represent all the gathered data (except the discarded EPISuite predicted data).
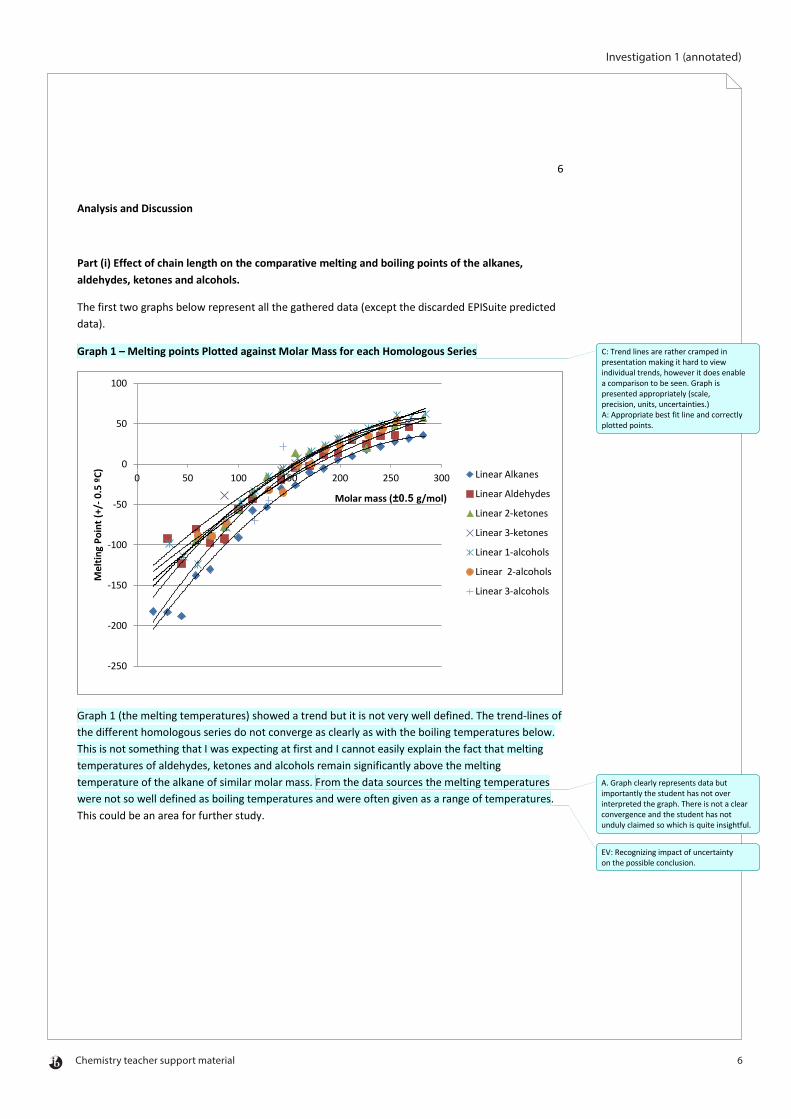
Graph 1 – Melting points Plotted against Molar Mass for each Homologous Series
Graph 1 (the melting temperatures) showed a trend but it is not very well defined. The trend-lines of the different homologous series do not converge as clearly as with the boiling temperatures below. This is not something that I was expecting at first and I cannot easily explain the fact that melting temperatures of aldehydes, ketones and alcohols remain significantly above the melting temperature of the alkane of similar molar mass. From the data sources the melting temperatures were not so well defined as boiling temperatures and were often given as a range of temperatures. This could be an area for further study.
-250
-200
-150
-100
-50
0
50
100
0 50 100 150 200 250 300
Mel
ting
Poin
t (+/
- 0.5
ºC)
Molar mass (±0.5 g/mol)
Linear Alkanes
Linear Aldehydes
Linear 2-ketones
Linear 3-ketones
Linear 1-alcohols
Linear 2-alcohols
Linear 3-alcohols
C: Trend lines are rather cramped in presentation making it hard to view individual trends, however it does enable a comparison to be seen. Graph is presented appropriately (scale, precision, units, uncertainties.) A: Appropriate best fit line and correctly plotted points.
A. Graph clearly represents data but importantly the student has not over interpreted the graph. There is not a clear convergence and the student has not unduly claimed so which is quite insightful.
EV: Recognizing impact of uncertainty on the possible conclusion.

Chemistry teacher support material 7
Investigation 1 (annotated)
7
Graph 2 – Boiling points Plotted against Molar Mass for each Homologous Series
From Graph 2 we see that the boiling temperatures are well defined and the smooth trend-lines do indicate the boiling temperature values for the alkanes, aldehydes, ketones and alcohols do appear to converge at molar mass values above 220 gmole-1. This is not surprising since the influence on the intermolecular forces of the carbonyl and hydroxyl groups reduces as the hydrocarbon chain increases and dominates the character of the molecule.
If we look only at the CRC Handbook experimental data and not use any predicted data then the convergence is even more clear (and removes the anomalous linear aldehyde data points at 198 and 212 gmol-1) as shown in Graph 3 below.
-200
-100
0
100
200
300
400
0 50 100 150 200 250 300
Boili
ng P
oint
(±0.
5ºC)
Molar Mass (±0.5 g/mol)
Linear Alkanes
Linear Aldehydes
Linear 2-ketones
Linear 3-ketones
Linear 1-alcohols
Linear 2-alcohols
Linear 3-alcohols
C: Again trend lines are rather cramped in presentation making it hard to view point of convergence. Graph 3 with just the experimental data reveals this more clearly. Graph is presented appropriately (scale, precision, units, uncertainties.)
A: Graph allows for valid interpretation.
C: Use of correct convention for representing unit. Should be 220 gmol-1, but not sufficient to hamper understanding.
EV: Student has described AND justified a valid conclusion.
A: This was an excellent step to remove the predicted data. Fine reflective thinking while processing.

Chemistry teacher support material 8
Investigation 1 (annotated)
8
Graph 3: CRC Handbook Experimental Data Only
Graphs 2 and 3 also show that at low molar masses that the trend in boiling points is
alcohols > aldehydes/ketones > alkanes
which agrees with hydrogen bonding being stronger than dipole-dipole forces which are stronger than van der Waal’s forces. At higher molar masses the difference gets much less.
Part(ii). Effect on the boiling points of the functional group position in the aldehyde/ketones and alcohols.
Because the boiling points are so much clearer than the melting points the rest of my analysis will be based only on the boiling points.
-200
-100
0
100
200
300
400
0 50 100 150 200 250 300
Boili
ng P
oint
(±0.
5ºC)
Molar Mass (±0.5 g/mol)
Linear Alkanes
Linear Aldehydes
Linear 2-ketones
Linear 3-ketones
Linear 1-alcohols
Linear 2-alcohols
Linear 3-alcohols
Poly. (Linear Alkanes)
Poly. (Linear 1-alcohols)
EV: Again justifying the conclusion.
A: A sensible decision.

Chemistry teacher support material 9
Investigation 1 (annotated)
9
Graph 3 Effect on the Boiling Points of the carbonyl position in the aldehyde and ketones
There is very little difference in the melting points between the aldehyde, 1-ketone and 2-ketone isomers at each molar mass and the graph lines are very similar. There is a strange anomaly with the data for the aldehydes C13H18O and C14H30O where the respective boiling points of 280ºC and 260ºC seem to be swapped around. I have checked again the experimental data on ChemSpider and those are the values given. The values are not available in the CRC Handbook to double check and this means that I am not very confident in their correctness.
If the data in the table is looked at in Data table 2 we can see that where experimental values are are available the 3-ketone has a slightly lower boiling point by between 1 and 6 ºC. But the predicted values are often higher than the corresponding aldehyde and 2-ketone. I suggest that 3 ketones have a lower melting point than the aldehydes and 2-ketones but the effect is not large enough to state confidently.
-50
0
50
100
150
200
250
300
350
400
0 50 100 150 200 250 300
Boili
ng P
oint
(±0.
5ºC)
Molar Mass (±0.5 g/mol)
Linear Aldehydes
Linear 2-ketones
Linear 3-ketones
EV: Clear evidence of appreciating limitations in data and understanding methodological implications.
EV: Once again student gets it right by not overstating their interpretation.

Chemistry teacher support material 10
Investigation 1 (annotated)
10
Graph 4 Effect on the Boiling Points of the OH group position in the alcohols
Graph 4 shows that the boiling points of the 1-alcohols are significantly higher than the corresponding 2-alcohols and 3-alcohols. Where we have the CRC Handbook experimental data available for all three series (up until the dodecanol C12H26O isomers) the 2- and 3- alcohols have similar boiling temps which are significantly below the 1-alcohols. I can make the hypothesis that this is because the OH group at the end of the chain in the 1-alcohols can more easily approach from a variety of angles another OH group from another 1-alcohol molecule. If the OH group is in the middle of a chain (like a 3-alcohol) then there are less ways that two molecules can align and attract each other. I have shown these possibilities in Figure 1 and 2 below with Chemsketch 3D images of 1-hexanol and 3-hexanol. It can be seen that there are more possible orientations where the 1-hexanol molecule OH groups can approach and H-bond
Figure 1: 1-Hexanol
or
or
0
50
100
150
200
250
300
350
400
0 50 100 150 200 250 300
Boili
ng P
oint
(±0.
5ºC)
Molar Mass (±0.5 g/mol)
Linear 1-alcohols
Linear 2-alcohols
Linear 3-alcohols
EV: Clear conclusion supported by the data is given. The student then goes on to try to justify within a relevant scientific context.
PE: This personal hypothesis shows some real original thinking. Shame that the student hasn’t found any literature support for the hypothesis. That would then have been close to perfect! As it is this is an outstanding effort.

Chemistry teacher support material 11
Investigation 1 (annotated)
11
Figure 2. 3-Hexanol
Conclusion
The main conclusions to this research are the answers to the two parts of the research question given earlier
(i) The boiling points of the aldehydes, ketones and alcohols do converge on those of the alkanes as we increase the carbon number and above 200gmol-1 the differences become minimal. The melting points were less well defined and although there is some convergence it is not so clear as for the boiling points
(ii) The effect of boiling point on changing the position of the functional group in the alcohol is significant. 1-alcohols with the OH group at the end of the chain have a higher boiling temperature than the 2- and 3-alcohols.
There were other interesting findings such as the significant differences in how well defined the melting and boiling temperatures were and the fact that some predicted values available in the web-based databases were very unreliable. These can be the basis for further study.
i C. Brown and M. Ford, Higher Level Chemistry, p 367, Pearson Baccalaureate, 2009 ii CRC Handbook of Chemistry and Physics, 85th Edition, CRC Press, 2004 iii http://www.chemspider.com, last accessed on 11/3/2012
C: Clearly restated main conclusions.
EV: Not very strong suggestions and no real suggestions for modifications.
Chemistry teacher support material 1
Investigation 4 (annotated)
AN INVESTIGATION INTO THE DEPENDENCE OF EGG PROTEIN DENATURATION ON TEMPERATURE.
Aim
The aim of this investigation was to investigate how the rate of denaturation of egg white proteins is dependent on temperature and to experimentally determine the Activation Energy of the denaturation process.
Introduction.
The original idea for this project came from a lesson on boiling temperature and vapour pressure when we learned why it takes longer for an egg to hard boil at high altitude (due to the lower boiling temperature of water). This topic stimulated many thoughts. How is the time it takes to boil an egg dependant on temperature? Can the time taken to exactly hard boil an egg be predicted over all temperatures? Below what temperature do eggs cease to hard boil?
I decided that the investigation would concentrate on determining one important parameter which is the Activation Energy barrier to egg protein denaturation. If this can be determined then predictions of the egg’s behaviour during boiling at a range of temperatures can be made and then tested.
Background
This project has two main theoretical bases, the principles of kinetics and process of the nature of protein denaturation, which I will describe below.
Part A: Kinetics and the Arrhenius Equation
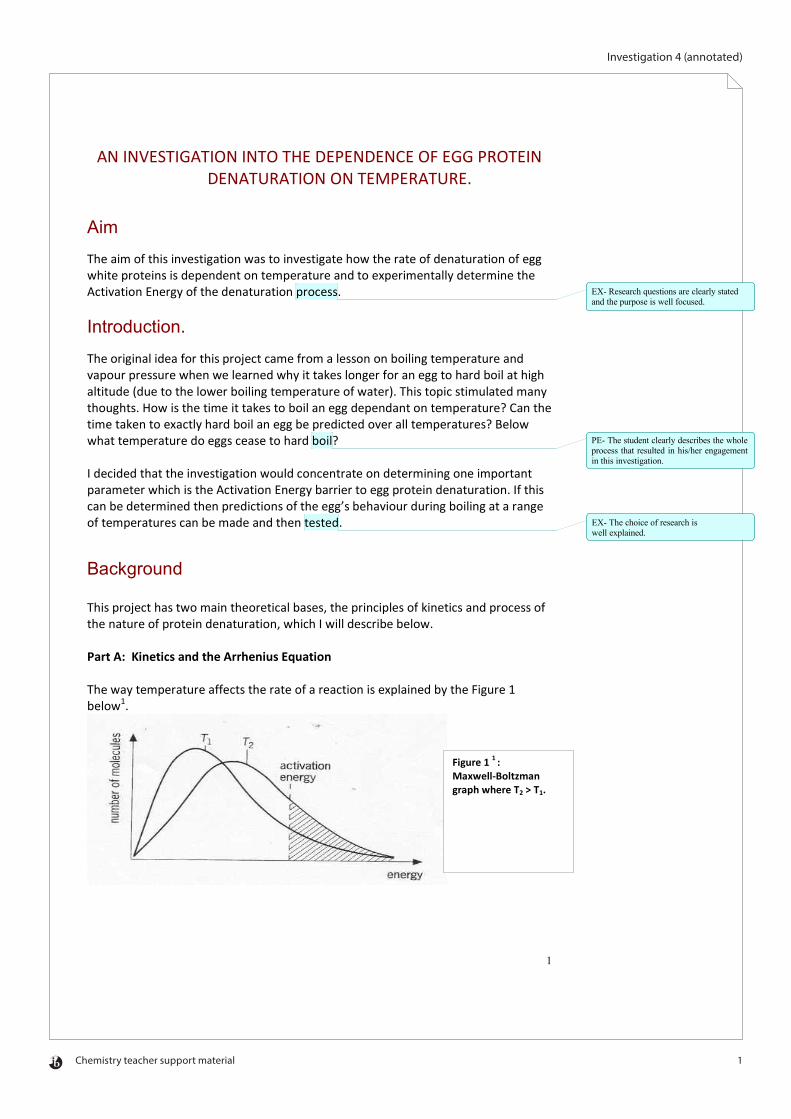
The way temperature affects the rate of a reaction is explained by the Figure 1 below1.
Figure 1 1 : Maxwell-Boltzman graph where T2 > T1.
EX- Research questions are clearly statedand the purpose is well focused.
PE- The student clearly describes the whole process that resulted in his/her engagement in this investigation.
EX- The choice of research is well explained.
1

Chemistry teacher support material 2
Investigation 4 (annotated)
Only collisions with more energy than that of Activation Energy (the minimum energy that must be surpassed in order for a chemical reaction to take place) will cause a reaction. Therefore, in the graph above, the shaded area represents those collisions.
According to theory, as temperature increases, the molecule velocities increase, and therefore, both the frequency of collision between molecules is greater and a greater proportion of collisions cause a reaction. In figure 1, this is apparent. At the lower temperature, T1, the fraction of molecules reacting is less than of T2 (shaded area on graph). The rate of reaction is proportional to the number of molecules with more energy than Ea and increases exponentially with temperature.
The relationship between reaction rate and temperature is expressed by the Arrhenius equation which relates the rate constant of a reaction k to the absolute temperature T:
k = Ae-(Ea/R.T)
where k= rate constant, Ea= Activation energy, T= Reaction Temperature, R= Gas constant and A = Arrhenius constant which is a factor that relates to the orientation of collision; only molecules colliding in the correct orientation with sufficient energy react.
Note that the Arrhenius equation is an exponential function and only applies when the activation energy lies within the exponential decay part of the curve to the right hand side of the Boltzman distribution graph in Figure 1.
Part B: Proteins & Denaturation
Proteins are formed by a combination of amino acids containing often 50 to 1000 amino acid residues). All proteins, independent of their nature (shape, complexity etc…) have structures, which are divided into four categories: primary, secondary, tertiary and quaternary.
The primary structure is mainly concerned with protein polypeptide chains (subunits) and with its amino acid sequence. In the secondary structure, there are different types of energetically stable three-dimensional structures of the polypeptide chain (also referred to as conformations). For some proteins, their polypeptide chain might form a β-pleated sheet and for others it might follow the spiral a-helix conformation. The tertiary structure is the overall three-dimensional appearance of the protein which is held together by strong intermolecular forces (e.g. Hydrogen bonding). For example, a globular protein such as in egg white, is approximately spherical and folding is extensive to obtain a compact tertiary structure. Lastly, the interaction of various polypeptide chains in a non-covalent way to pattern the protein molecule is said to present the quaternary structure.
EX- The student provides a goodsupport for the chosen approach.
EX- The student establishes thescientific context for the investigationthrough a discussion on its significance.
2

Chemistry teacher support material 3
Investigation 4 (annotated)
Denaturation is when the biological activity of a protein is lost and disruption in the secondary, tertiary and quaternary structure of a protein occurs due to changes in temperature, pH, ionic strength, or due to an addition of organic solvents. For instance, when egg white is exposed to heat, it thickens and changes color. At that point, denaturation has occurred and all its structure has been disrupted, except for its primary structure, and an alternative energetically stable three dimensional structure is formed. It is the energy barrier to this process of permanently disrupting the three dimensional structure of the egg protein that is the focus of this investigation.
Methodology A common procedure (Hill, G & Holman, J (2001))2 to determining the Ea, is by measuring the time of reaction (in this case of final time of denaturation of egg proteins determined as the time when the film of egg white between the two microscope slides became opaque) at various different reaction temperatures using the Arrhenius equation:
k = Ae-(Ea/R.T) Ink = InA-(Ea/R.T)
and since k is proportional to 1/Time:
Ink = -InTime + a constant InTime = (Ea/R.T) –InA + a constant
Now, we can plot a graph, InTime versus 1/Temperature (in Kelvin) and calculate the gradient. Since we recognize the gas constant(R=8.3145 JK-1mol-1), we can determine the Activation energy:
Gradient = Ea/R Ea = R x Gradient
Gradient=Ea/R
1/Temp (K-1)
ln Time
EX- Relevant scientific concepts arecorrectly considered.
EX- The methodology allows the use of concepts and techniques appropriate to Diploma level.
C- The methodology could be easily repeated by others.
3
Chemistry teacher support material 4
Investigation 4 (annotated)
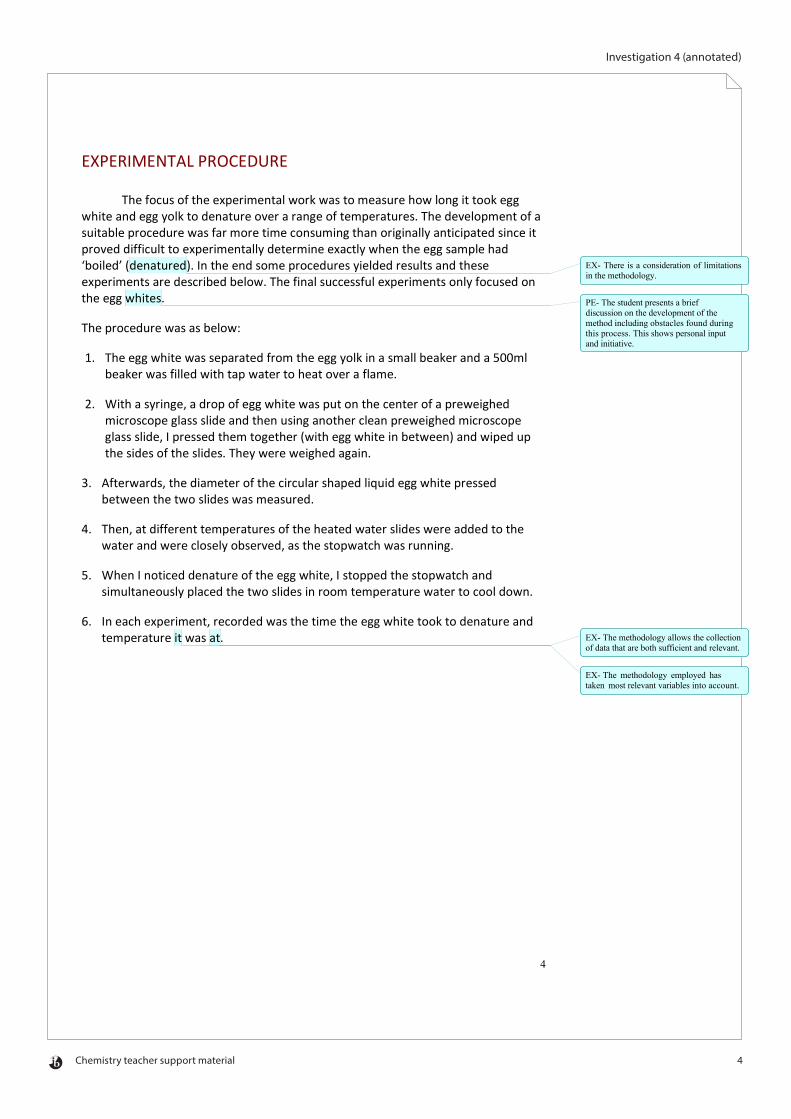
EXPERIMENTAL PROCEDURE
The focus of the experimental work was to measure how long it took egg white and egg yolk to denature over a range of temperatures. The development of a suitable procedure was far more time consuming than originally anticipated since it proved difficult to experimentally determine exactly when the egg sample had ‘boiled’ (denatured). In the end some procedures yielded results and these experiments are described below. The final successful experiments only focused on the egg whites.
The procedure was as below:
1. The egg white was separated from the egg yolk in a small beaker and a 500mlbeaker was filled with tap water to heat over a flame.
2. With a syringe, a drop of egg white was put on the center of a preweighedmicroscope glass slide and then using another clean preweighed microscopeglass slide, I pressed them together (with egg white in between) and wiped upthe sides of the slides. They were weighed again.
3. Afterwards, the diameter of the circular shaped liquid egg white pressedbetween the two slides was measured.
4. Then, at different temperatures of the heated water slides were added to thewater and were closely observed, as the stopwatch was running.
5. When I noticed denature of the egg white, I stopped the stopwatch andsimultaneously placed the two slides in room temperature water to cool down.
6. In each experiment, recorded was the time the egg white took to denature andtemperature it was at.
EX- There is a consideration of limitations in the methodology.
PE- The student presents a brief discussion on the development of the method including obstacles found during this process. This shows personal input and initiative.
EX- The methodology allows the collectionof data that are both sufficient and relevant.
EX- The methodology employed has taken most relevant variables into account.
4

Chemistry teacher support material 5
Investigation 4 (annotated)
Results
Egg white results Diameter (+/- 0.1
cm) Mass of egg white
(+/- 0.005 g) Temperature of
water (+/- 0.5 oC) Time of
denaturation (+/- 0.5 sec)
2.5 by 5.0 0.01 25.0 Never denatured 2.5 by 5.0 0.01 30.0 Never denatured 2.5 by 4.5 0.01 35.0 Never denatured. Not
even after 15 min. 2.5 by 5.0 0.01 40.0 Never denatured. Not
even after 10 min. 2.5 by 5.0 0.02 45.0 Never denatured. Not
even after 5 min. 2.5 by 5.0 0.01 50.0 Never denatured. Not
even after 5 min. 2.5 by 5.5 0.01 55.0 Never denatured. Not
even after 5 min. 2.5 by 5.0 0.01 60.0 Never denatured. Not
even after 5 min. 2.5 by 5.0 0.01 62.5 49.9 sec. 2.5 by 5.0 0.01 62.5 49.7 sec. 2.5 by 5.0 0.01 65.0 32.8 sec. 2.5 by 4.5 0.01 67.5 21.0 sec. 2.5 by 5.5 0.01 70.0 15.9 sec. 2.5 by 5.5 0.01 75.0 11.0 sec. 2.5 by 5.0 0.01 80.0 8.0 sec. 2.5 by 5.0 0.01 81.0 7.6 sec. 2.5 by 5.0 0.01 82.5 7.0 sec. 2.5 by 5.0 0.01 84.0 6.4 sec. 2.5 by 5.0 0.01 85.0 6.0 sec. 2.5 by 5.0 0.01 86.0 5.5 sec. 2.5 by 5.5 0.01 87.5 4.9 sec. 2.5 by 5.0 0.01 89.0 4.2 sec. 2.5 by 5.0 0.02 90.0 4.0 sec. 2.5 by 5.0 0.01 91.0 3.8 sec. 2.5 by 5.5 0.02 92.5 3.5 sec. 2.5 by 5.0 0.01 94.0 3.3 sec. 2.5 by 5.5 0.01 95.0 3.0 sec. 2.5 by 5.0 0.01 97.5 2.4 sec. 2.5 by 5.0 0.01 97.5 2.5 sec. 2.5 by 5.0 0.01 100.0 2.1 sec. 2.5 by 5.0 0.01 100.0 2.2 sec.
A- Sufficient quantitative data has beencollected. Uncertainties have been recorded although those for time are notconsistent with the cited precision of thedata.
5
Chemistry teacher support material 6
Investigation 4 (annotated)
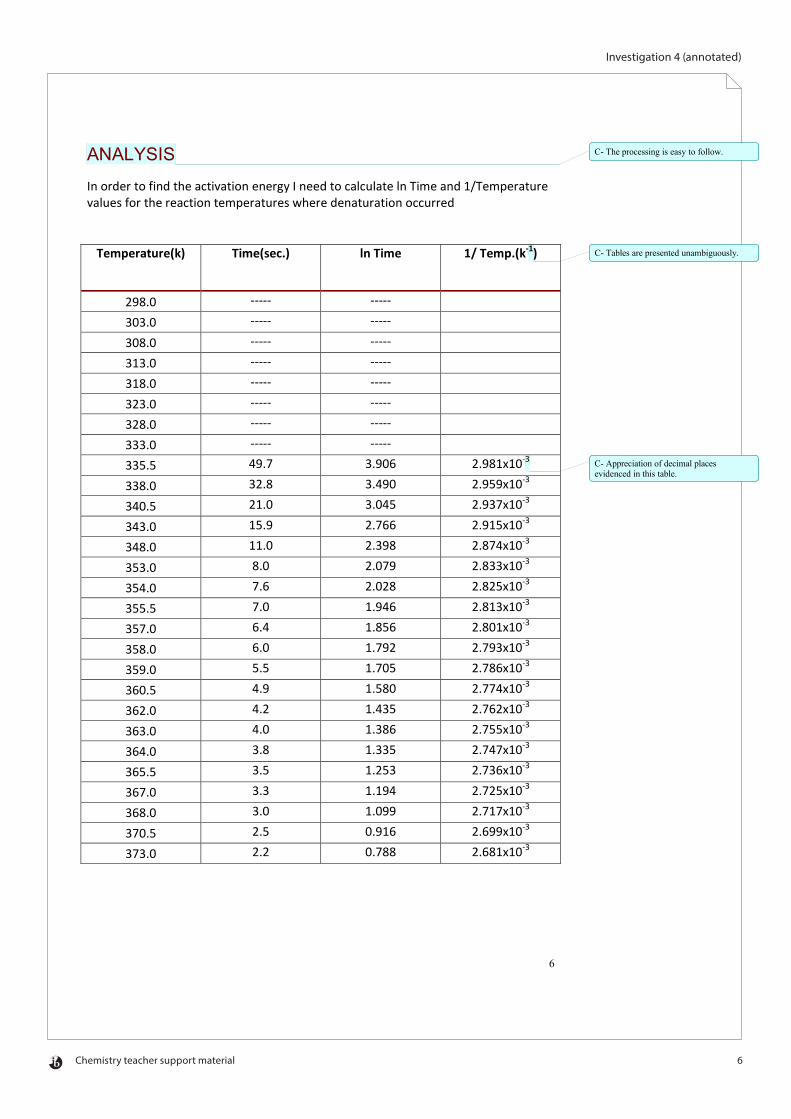
ANALYSIS
In order to find the activation energy I need to calculate ln Time and 1/Temperature values for the reaction temperatures where denaturation occurred
Temperature(k) Time(sec.) ln Time 1/ Temp.(k-1)
298.0 ----- -----
303.0 ----- -----
308.0 ----- -----
313.0 ----- -----
318.0 ----- -----
323.0 ----- -----
328.0 ----- -----
333.0 ----- -----
335.5 49.7 3.906 2.981x10⁻³
338.0 32.8 3.490 2.959x10⁻³
340.5 21.0 3.045 2.937x10⁻³
343.0 15.9 2.766 2.915x10⁻³
348.0 11.0 2.398 2.874x10⁻³
353.0 8.0 2.079 2.833x10⁻³
354.0 7.6 2.028 2.825x10⁻³
355.5 7.0 1.946 2.813x10⁻³
357.0 6.4 1.856 2.801x10⁻³
358.0 6.0 1.792 2.793x10⁻³
359.0 5.5 1.705 2.786x10⁻³
360.5 4.9 1.580 2.774x10⁻³
362.0 4.2 1.435 2.762x10⁻³
363.0 4.0 1.386 2.755x10⁻³
364.0 3.8 1.335 2.747x10⁻³
365.5 3.5 1.253 2.736x10⁻³
367.0 3.3 1.194 2.725x10⁻³
368.0 3.0 1.099 2.717x10⁻³
370.5 2.5 0.916 2.699x10⁻³
373.0 2.2 0.788 2.681x10⁻³
C- The processing is easy to follow.
C- Tables are presented unambiguously.
C- Appreciation of decimal placesevidenced in this table.
6

Chemistry teacher support material 7
Investigation 4 (annotated)
Graph 1. Plot of ln Time against 1/Temperature
Calculation to determine Activation energy, Ea.
Gradient from Excel derived linear equation = 9.6164 × 103 = 9616 Gradient= Ea/R so Ea= 9616x 8.314
Ea= 79974 J mol-1
Ea = 80kJ mol-1
The two data points corresponding to the lowest reaction temperatures at 335.5 and 338.0 K do not appear to conform to the linear plot. I have removed these two points as anomalous in the graph below and recalculated Ea.
Graph 2. Plot of ln Time against 1/Temperature with discarded data points
y = 9.6164x - 25.08 R² = 0.9838
0.000 0.500 1.000 1.500 2.000 2.500 3.000 3.500 4.000 4.500
2.6 2.7 2.8 2.9 3
ln T
ime
1/Temp x 10-3 (K-1)
y = 8.6521x - 22.416 R² = 0.9975
0
0.5
1
1.5
2
2.5
3
3.5
2.65 2.7 2.75 2.8 2.85 2.9 2.95
ln T
ime
1/Temp x 10-3 (K-1)
C- Graphs are presented unambiguously.
EV--The student takes reliability intoaccount.
A- Processing pays due consideration toanomalies.
7

Chemistry teacher support material 8
Investigation 4 (annotated)
Gradient from Excel derived linear equation = 8.6521 × 103 = 8652 Gradient= Ea/R so Ea= 8652x 8.314
Ea= 71932.73 J mol-1
Ea = 72kJ mol-1
By cutting the data back further to a maximum 1/Temp value of 2.766 x 10⁻³ which represents the closely spaced data points the graph becomes
Graph 3. Plot of ln Time against 1/Temperature with further discarded data points
and Ea= 8753x 8.314
Ea= 72772.44 J mol-1
Ea = 73kJ mol-1
The calculated Es results are tabulated below along with the R2 correlation value that relates to how good the linear fit was in the graphs (with 1 being perfect fit)
Graph 1 Graph 2 Graph 3 Ea (kJ mol-1) 80 72 73 R2 0.9838 0.9975 0.996
The best value is from graph 2 and the value from Graph 3 gives some idea as to the amount of uncertainty arising from the plots.
My final experimental value for Ea of egg protein denaturation = 72 ± 1 kJ mol-1
y = 8.7532x - 22.693 R² = 0.996
0
0.5
1
1.5
2
2.5
2.65 2.7 2.75 2.8 2.85
ln T
ime
1/Temp x 10-3 (K-1)
A- Processing correctly uses chemical concepts and graphical analysis to determine Ea.
A- The student shows evidence of a goodunderstanding of graphical analysis.
EV- Evidence supporting the student has considered the impact of uncertainties on results (line of best fit).
C- Correct use of significant figures.
A- The processing involves correctlyconstructed lines of best fit and makes useof R2 for evaluating uncertainties.
EV- Evidence that the student understands the impact of uncertainties on results.
A- The processing presents a valid comparison which duly considersuncertainties and shows a good grasp ofgraphical analysis.
A- Uncertainties considered in final value.
8
Chemistry teacher support material 9
Investigation 4 (annotated)
Conclusion and Evaluation
The initial aims of the investigation have been met. It has be seen that denaturation did not take place at 60ºC and below. Above this temperature the rate of protein denaturation increases rapidly with temperature.
I was able to calculate an Activation Energy for the activation energy of egg protein denaturation and it was
Ea = 72 ± 1 kJ mol-1
I could not find an exact literature value for the Ea of egg protein (albumin). One article3 studied the effect at acidic pH’s (which will change the Ea because acidic pH also denatures proteins) and gave the values as 36.7 and 50.0 kcal./mole which correspond to 150-200 kJ mol-1
My value is about a half or a third of this literature value. When I reflect on the simplicity of the method I am impressed that this investigation has arrived at a value that is so sensible in size.
It is also significant that the Arrhenius equation seems appropriate for the determination of egg protein denaturation as long as the temperature range for the measurements is kept within specifically defined limits. This is because the Arrhenius equation strictly applies to ideal gas reactions only although it has been widely used in the study of liquids and solution reactions where collision theory still holds and only the Arrhenius constant A is affected by the change of state.
However the denaturation reaction of proteins is not a collision reaction (it depends on the protein chains rotating and intermolecular forces breaking and reforming) and the theoretical basis of the equation no longer so obviously holds. There is no obvious reason why the plot of ln(Time) v 1/Temperature should have been so clearly linear. It is maybe the most interesting finding of this investigation that the relationship in the Arrhenius Equation still seems appropriate.
C- The report has been easy to follow, concise and shows a logical sequence.
C- Subject specific terminology is correctly used throughout the report.
C- The report makes use of subject-specificnotation.
A- Comparison with scientific literaturemade.
EV- There are no clear suggestions of feasible extensions to this investigation.
EV- There are no clear suggestions onrelevant and feasible alternatives toimprove methodology.
EV- The reflections demonstrate a clear understanding of implications of the conclusion.
EV- Student considers limitations of the methodology.
9
Chemistry teacher support material 10
Investigation 4 (annotated)
References
1. http://www.webchem.net/notes/how_far/kinetics/rate_factors.htm, lastaccessed 3rd March 2012
2. Hill, G & Holman, J (2001). Chemistry in Context: Laboratory Manual andStudy Guide, 5th Edition, pp 54-55, Surrey, Nelson
3. Investigations on proteins and polymers. VII. The denaturation of eggalbumin, Robert J. Gibbs, M. Bier, F.F. Nord, Archives of Biochemistry andBiophysics, Volume 35, Issue 1, January 1952, Pages 216–228, Last accessedat http://www.sciencedirect.com/science/article/pii/S0003986152800670 on4th March 2012
Further Bibliography
• Chemistry for the IB Diploma, G. Neuss, Oxford University Press 2007
4. http://chemistry.about.com/od/biochemistry/a/proteinstructur.htm, lastaccessed 26th February 2012
10