navigating volatility - ey · pdf filenavigating volatility | 2 executive summary from a...
TRANSCRIPT

Navigating volatilityMessaging and planning in an uncertain environment
February 2017

1 | Navigating volatility

Navigating volatility | 2
Executive summaryFrom a European insurance perspective, the launch of Solvency II on 1 January 2016 was a notable event. Despite many years of preparation, no one really knew how Solvency II would work in practice, nor how other stakeholders — principally investors — would react to Solvency II disclosures.
At the same time, there has been heightened political and monetary uncertainty causing capital market instability. While Solvency II did not cause widespread initial capital challenges, the broader political and market backdrop has exacerbated its inherent volatility.
We note that a market-based regime, especially one in which liabilities are valued using a swaps-based discount rate curve and assets are fair valued, will always exhibit balance sheet variability. However, Solvency II capital volatility has received much more attention than anticipated — not just because the variance was generally negative, but also because the published sensitivities of most companies coming into Solvency II showed relatively stable solvency ratios, compared to a more volatile outcome.
Insurers are responding to this volatility in diverse ways:
• Freeing up capital to offset solvency declines, as well as to dampen future volatility
• Focusing on capital generation metrics and associated management actions, including strategic initiatives to exit low return-on-equity (ROE) business lines
• Emphasizing the “business of the future,” including customer engagement, digital investment and new products
In this paper, we look back at the first year of Solvency II. We analyze the drivers of Solvency II volatility, why investors and management are focusing increasingly on capital generation, and how insurers should develop their messaging against a backdrop of evolving disclosures.

3 | Navigating volatility
EY’s view of the insurance investor propositionIn March 2016, we presented a framework for analyzing the overall insurance investor proposition and explored the impact of Solvency II. Our core thesis remains: value is delivered across a combination of cash returns — i.e., a dividend stream — and stock of value, measured across a number of metrics (see Figure 1).
Figure 1: EY’s view of the insurance investor proposition
Investor returns
Dividends
EarningsReturn on
equity > cost of equity
Capital generation
Net asset value
accretionLiquidity
Growth and franchise value add
Value

Navigating volatility | 4
Dividends continue to dominate the equation — not simply as the main part of the investment proposition, but also in magnitude relative to ongoing earnings and capital generation. The ability to maintain and grow dividends is dependent on sufficient earnings, capital and liquidity.
All too often, Solvency II capital adequacy, at either the solo or group entity level, is the major constraint. This becomes especially acute when capital volatility threatens capital sufficiency or, in other words, when balance sheet movements expose surplus capital such that further distributions become difficult from a risk appetite or a regulatory perspective.
Solvency II complicates the dynamics between group and solo-entity solvency due to diversification, fungibility and transferability. How third-country operations are tweaked, including varying degrees of “equivalence,” further complicates matters. In many instances, insurers have to publish regulatory disclosures for their solo entities for the first time in 2017.
We anticipate that management and investors will focus increasingly on the “stock of value” of the proposition; for example:
• Worries that insurers are distributing stock of capital as well as income, exacerbating questions over the sustainability of current dividend yields. Distinguishing between stocks and flows is never straightforward in insurance, nor is there a universally acceptable measure of book value. It could be International Financial Reporting Standards (IFRS), embedded value or Solvency II. What is the “real” tangible net asset value of the insurance company?
• Concerns over insurers’ sustainable ROE, especially when measured on a Solvency II basis. With the view that Solvency II is increasingly a major constraint on returns, we see investors assessing value creation as sustainable regulatory capital generation over available capital. This gives Solvency II ROE, which may differ significantly from IFRS ROE.
• The future of insurance (especially life and savings), given public antipathy to financial services, conduct risk, low interest rates, low industry growth and disrupted distribution or business models arising from digital innovation and non-traditional competition.

5 | Navigating volatility
First impressions of Solvency II after one yearDespite the capital market volatility relating to political and monetary policy uncertainty, the impact of Solvency II has not yet produced radical changes. Much energy and focus has been spent on getting ready, and the full implications are still being worked through.
There are a number of observations to support the “evolutionary rather than revolutionary” nature of Solvency II:
1. Underlying strategic trends have not changed even if Solvency II has accelerated or crystallized them. The moves in business models to hold less capital, be more customer-centric and embrace digital are not consequences of Solvency II. What Solvency II has done is to shine the light more brightly on the need for efficiency, whether that be of capital, cost or customer management.
2. Based on published group solvency ratios, other than for a small number of companies, capital adequacy under Solvency II has not been an issue. The majority of groups have entered Solvency II with acceptable capital adequacy, though it is too early to say whether capital levels are merely adequate or strong (see Figure 2).
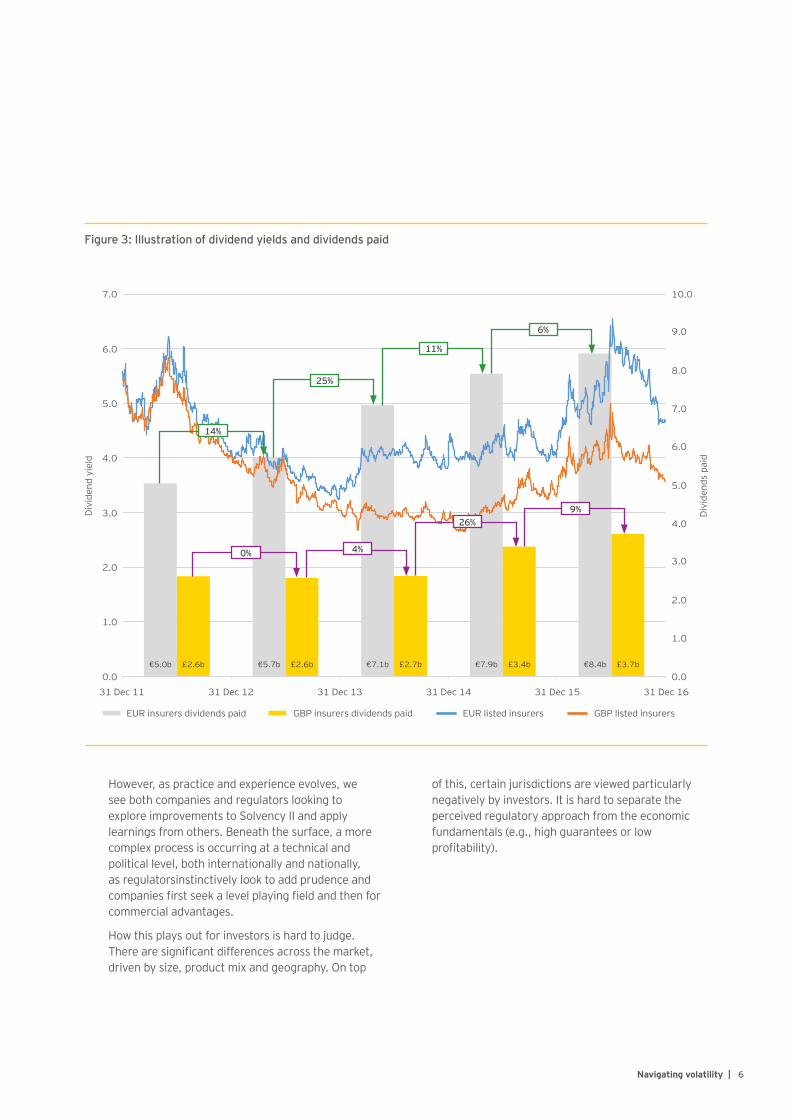
Dividend payouts remain a key focus of the investor proposition, with continued high payout ratios and increasing absolute amounts. So far, Solvency II has not proven to be a constraint. Typically, dividend policy is set based on IFRS earnings, with a floor (usually soft) determined by a minimum group solvency ratio (see Figure 3). However, investors are increasingly focusing on this floor, driven by two factors: dividend payouts are trending to 100% of organic Solvency II capital generation, and capital volatility was negative in 2016 and remains larger than expected.
3. As a result, we see two main responses: First, investors are starting to move to a Solvency II “own funds” view of net worth and defining earnings capacity on a Solvency II surplus generation basis. This implies an ROE based on Solvency II capital generation over Solvency
Figure 2: Trend in publicly disclosed insurance group solvency over the first six months of 2016
100%
200%
277%
Max: 252%
Upper quartitle: 191%
Lower quartitle: 158%
123% Min: 122%
FY15 FY16
158%
178%
199%
150%
250%
300%
Average: 174%
II own funds. Companies are responding with new definitions of “operating capital generation” and, as with previous cash generation metrics, there is no standard basis of calculation.
The second response is an increased focus on managing the technical details of Solvency II but to simplify complicated disclosure to investors. So far, the main areas of focus have been on long-term guarantee measures, such as matching adjustment and volatility adjustment (VA), alongside the impact of the ultimate forward rate (UFR) and transitional measures for technical provisions. The full impacts of these will be disclosed for the first time in 2017.
Navigating volatility | 6
Figure 3: Illustration of dividend yields and dividends paid
7.0 10.0
9.0
6.0
3.0
8.0
5.0
2.0
7.0
4.0
1.0
EUR insurers dividends paid GBP insurers dividends paid EUR listed insurers GBP listed insurers
3.0Div
iden
d yi
eld
Div
iden
ds p
aid
5.0
1.0
6.0
2.0
4.0
0.031 Dec 11
€5.0b €5.7b €7.1b €7.9b €8.4b£2.6b £2.6b £2.7b £3.4b £3.7b
31 Dec 12 31 Dec 13 31 Dec 14 31 Dec 15 31 Dec 160.0
14%
0% 4%
26%9%
25%
11%
6%
However, as practice and experience evolves, we see both companies and regulators looking to explore improvements to Solvency II and apply learnings from others. Beneath the surface, a more complex process is occurring at a technical and political level, both internationally and nationally, as regulatorsinstinctively look to add prudence and companies first seek a level playing field and then for commercial advantages.
How this plays out for investors is hard to judge. There are significant differences across the market, driven by size, product mix and geography. On top
of this, certain jurisdictions are viewed particularly negatively by investors. It is hard to separate the perceived regulatory approach from the economic fundamentals (e.g., high guarantees or low profitability).

7 | Navigating volatility
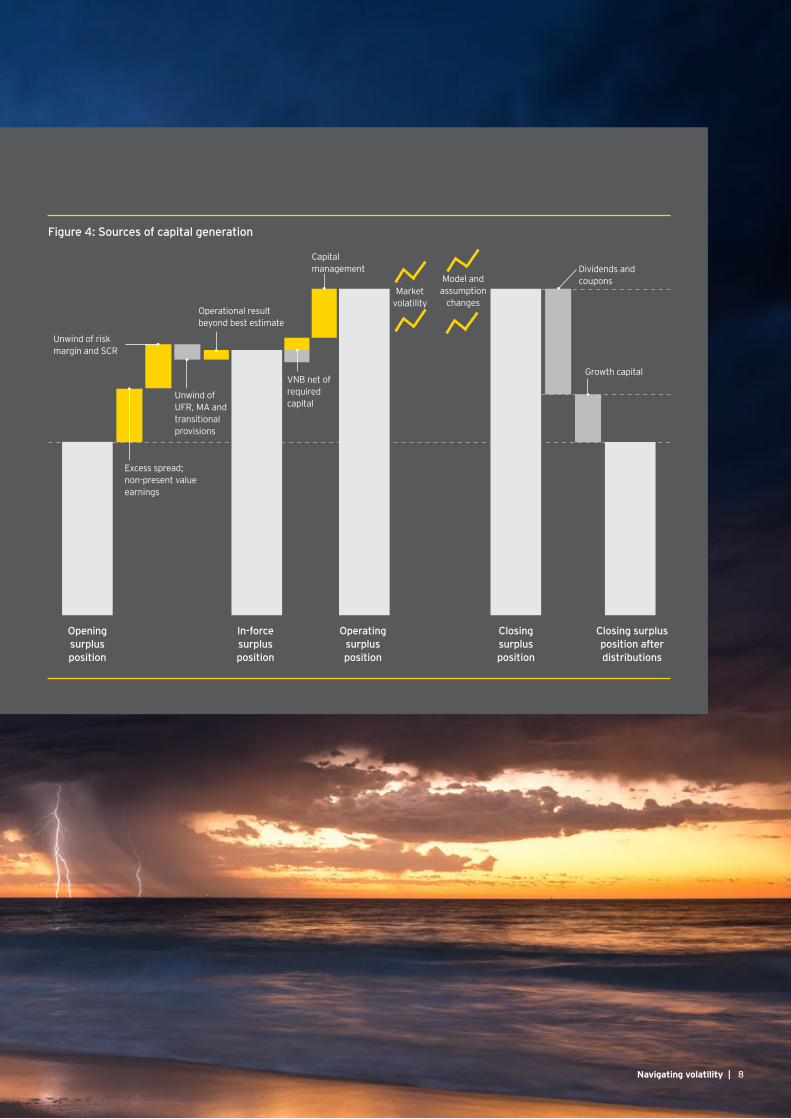
Revisiting capital generation under Solvency II As shown in Figure 4, sources of capital generation under Solvency II include the following:
• Excess spread. In most cases, liabilities are discounted at the risk-free rate. When insurers earn returns in excess of the risk-free rate, capital generation will emerge on an ongoing basis. To the extent insurers have increased the liability discount rate (e.g., using matching adjustment or UFR), there will be a lower embedded excess spread and, therefore, lower in-force capital generation.
• Non-present value (PV) income streams. This refers to any income streams that are not capitalized on the balance sheet as part of the best estimate — for example, investment business that falls outside the Solvency II contract boundary or earnings from non-Solvency II entities, such as asset management or banking operations, as well as investment return on capital.
• Risk margin unwind. For those insurers with policies that contain significant risks that cannot be hedged, the release of the risk margin over time will be material. Where the risk margin has been offset by the use of transitional measure technical provisions, capital generation will be reduced.
• Operational result. Capital generation gains may occur when insurers are able to deliver actual outcomes ahead of their best estimate assumptions. Expense efficiency is an obvious focal point.
• Value of new business (VNB) net of required capital. Whether this is positive or negative will depend on the mix of business and its inherent profitability. We anticipate traditional guaranteed business will be VNB negative given large capital strains.
• Capital management. Structural initiatives to remove capital constraints within operating entities may lead to one-off gains or recurring capital efficiencies. This may have a considerable impact on the insurers’ portfolio or product mix.
• Market volatility. This often has a significant impact in excess of “expected” capital generation (both positive and negative depending on market moves).
• Model and assumption changes. Under a best-estimate and PV-based regulatory regime, management will need to demonstrate that reserving assumptions at product or portfolio level are met.
Navigating volatility | 8
Figure 4: Sources of capital generation
Opening surplus position
Excess spread; non-present value earnings
Unwind of risk margin and SCR
Unwind of UFR, MA and transitional provisions
VNB net of required capital
Operational result beyond best estimate
Capital management
Growth capital
Market volatility
Model and assumption
changes
In-force surplus position
Operating surplus position
Closing surplus position
Closing surplus position after distributions
Dividends andcoupons
Revisiting capital generation under Solvency II

9 | Navigating volatility
Understanding Solvency II volatility
Coming into Solvency II, companies spent a significant amount of time educating investors on what Solvency II meant for them. Much of this was focused on the components of the Solvency II balance sheet — in particular, the breakdown of the solvency capital requirement (SCR) — and the changes from Solvency I.
Underpinning this explanation was a clear subtext from insurers: “Solvency II does not cause us a capital problem — we have an adequate and stable capital position.” This message was reinforced by showing capital positions comfortably within risk appetite and sensitivity analysis showing limited exposure to market risk.
The desire for, and expectation of, stability and predictability is entirely reasonable. Solvency I, which combined a static valuation of technical provisions in most cases and in some cases book value of assets, produced a stable and predictable capital position that often was only exposed to equity, currency and impairment risk.
Many companies had developed their own economic capital models and introduced market risk management to
manage the exposures on their balance sheet. Compared to banks, insurers fared well during the global financial crisis, and risk management frameworks have continued to evolve and strengthen since then.
So why has Solvency II volatility been such a surprise? Our view is that this is a result of five factors:
1. The Solvency II balance sheet is more complex and inherently more volatile than first imagined. Second- and third-order effects have a magnified impact on solvency.
2. Producing the numbers, especially going through IMAP and preparing for Pillar 3 disclosures, has been an intense effort. Management has not had enough bandwidth to digest what the numbers mean.
3. Initially, companies focused on capital adequacy rather than capital stability. The bias was to optimize the day 1 position and “manage what happens” afterward. There is still a significant range of opinion as to what components of the balance sheet should or should not be managed (e.g., duration risk in the risk margin).
4. Most insurers do not have a full toolkit to manage capital volatility. This is partly organizational, as companies are generally poorly equipped to forecast the Solvency II balance sheet. That the capacities to understand and manage this are split across finance

Navigating volatility | 10
and risk does not help.Managing volatility is also partly cultural; those who understood the Solvency II balance sheet rarely understood the commercial and market drivers of the balance sheet, and vice versa.
5. The observed volatility has been directionally negative, bringing capital floors closer to the money.
Sources of volatilityThe Solvency II balance sheet is volatile by construction: on a mark-to-market basis, “fair-valued” assets are used to back liability cash flows that are discounted using a risk-free curve. Technical provisions are valued on a market-consistent and best-estimate basis, capturing interest rate movements and removing prudence (and smoothing) respectively.
Even if market risk were to be fully hedged, technical provisions are exposed to a range of traditional underwriting risks, including loss events and customer behavior. Shifts in these bases introduce a further asset-liability mismatch, unless rebalanced; however, in practice, they are hard to manage given the time lags between cause and recognition. To add further complexity, the presence of options and guarantees, as well as profit-sharing contracts, means that market-risk exposures are often non-linear and path-dependent.
The Solvency II balance sheet is not fully market consistent. The discount rate curve is complex and includes a number of non-hedgeable adjustments, including the credit risk adjustment, UFR and last liquid point, the VA reference portfolio, and fundamental spread revision risk, among others. Moreover, there is a duration mismatch between the official balance sheet and the true economic balance sheet. For example:
• The SCR and risk margin technically have zero duration for the purposes of calculating the interest rate shock.
• Contract boundaries exclude some future premiums and associated liabilities that would be reflected on a fully economic balance sheet.
• The ability to recalculate transitional measure technical provisions provides a significant cushion against interest rate sensitivity on business written prior to 1 January 2016.
Other sources of volatility are off-balance-sheet exposures, in particular arising from defined benefit pension schemes, which can be both material and difficult to manage. Also, it is impracticable to hedge the capital ratio and absolute surplus at the same time. Since there is no clear answer as to what is the right measure to manage to, stakeholders may have differing views.

11 | Navigating volatility
Why capital volatility matters?Volatility of capital matters because regulators require insurers to hold a minimum amount. Falling below that minimum amount has a direct cost to investors as, at best, dividends are reduced, and, at worst, further capital is needed.
Balance sheet volatility is not new. Indeed, managing market volatility as well as underwriting risk is arguably a key objective of traditional guaranteed and profit-sharing business. The life insurance industry has a track record of introducing market-sensitive measures and managing the messaging around earnings volatility by emphasising “operating” earnings. Insurers have told investors to focus on long-term returns resulting from anticipated mean reversion.
For the first time, however, Solvency II has caused the regulatory balance sheet to be volatile. Regulators are unlikely to distinguish between short-term and structural causes of a breach of the minimum requirements when it comes to approving a dividend payment.
How has volatility management changed?There are two fundamental differences in volatility management under Solvency II:
1. Solvency II is a balance sheet construct, not a measure of earnings. In other words, there is no “below the line” in Solvency II. All movements on the balance sheet matter. There may be some leniency in capital policy, but an adjusted solvency position based on long-term investment conditions is unlikely to be acceptable to regulators if limits are breached.
2. A large part of capital volatility is driven by interest rate risk, which is unrewarded (i.e., there is no structured risk premium that can be captured) and may not be mean reverting, especially in current times of unconventional monetary policy.
A clear capital management framework is neededWe believe that a clear capital management framework focusing on capital generation and volatility will be the most effective and most likely industry response. Such a solution will take time to implement and refine. Insurers

Navigating volatility | 12
need to focus on internal audiences and metrics, including embedding and reviewing these, while they also manage the expectations of external audiences. We suggest the following components:
• A clear capital management framework that articulates both risk appetite and strategic financial risk management. We would expect the former to have clear ranges of capital appetite (red, amber, green) and explicit linkage between risk appetite and financial impacts, and the latter to consider hedging approaches for all risk exposures and incorporate a range of dynamic and structural hedges. While the key principles of the framework should be disclosed, the finer details are likely to remain private.
• A comprehensive capital generation approach that provides credible guidance externally and robust forecasts and sensitivities internally. The latter is noticeably absent for many European insurers; forecasting and planning is dominated by the income statement, and sensitivity analysis tends to be simplistic and static.
• A balance between “income statement” and “change in balance sheet” measures. Ultimately, investors will be looking to assess the underlying earnings capacity of the insurer, and management will want to take capital off the table. However, for the reasons outlined above, capital will always remain a constraint on distributions and ROE and will need to be monitored and its management challenged.
Such an approach, if implemented effectively, will move the focus from capital adequacy and capital volatility to capital generation. Capital generation is increasingly seen as the primary metric to assess sustainable dividend capacity. This is due partly to the expectation that Solvency II will be the main constraint at the operating company level for internal distributions, and partly to a view that capital generation is a better measure of underlying earnings than IFRS.
These challenges extend beyond life insurance. Property and casualty insurers will face a more complex narrative in a world of discounted reserves and capital requirements. Understanding capital generation will no longer be the sum of margins on premium and invested assets.

13 | Navigating volatility
Forecasting capital generation: Sound capital planning and forecasting is a key capability for management to improve control of their business. It is a way to avoid surprises and improve decision-making through better understanding of the business.
Capital planning and forecasting is a three-dimensional problem, as shown in Figure 5:
• Establishing the base financial projection for the balance sheet, including own funds and solvency capital requirement, as well as cash generation
• Deriving a full suite of sensitivities; for instance, the ability to model yield curve twists, convexity and cross correlations
• Modeling path dependencies; e.g., rates fall followed by an increase in credit spreads versus an increase in credit spreads followed by a fall in rates, as well as the impact of the UFR and other non-economic measures
This requires a thoroughly parameterized and validated proxy model with the capability to run model stresses, scenario tests, transactions, and recovery and resolution plans. However, timely decision-making requires compromises relative to a full model run.

Navigating volatility | 14
Forecasting capital generation: Defining the problem
Base financial projections
Sensitivities
Path dependencies and non-linearities
Correlation and path dependency of market and demographic sensitivities lead to a wide variety of outcomes relative to the base financial projections.
Figure 5

15 | Navigating volatility
Communicating capital generationThe starting point for communicating capital generation, especially for life insurers, is “cash.” However, there are multiple variations of how cash is defined — for example, as actual versus expected, or with or without capital requirements.
Solvency II capital generation is inherently more complex than Solvency I, given the nature of the Solvency II balance sheet, but many of the debates are the same. As Figure 6 shows, differences are already emerging between the approaches that companies are pursuing.
Figure 6: Capital generation differences
Key mtric New business SII capital Central
costsOne-off items
Economic variances
Company A Normalized operational free cash flow √ √
Company B Solvency II operating capital generation √ √ √ √
Company C Net free surplus generation √ √ √ √*
Company D Net cash generation √ √*Only interest rates variances
Comparisons across the sector are complicated by significant variations in the definitions of the components of capital generation definitions and disclosure of line items. Given that analysts want to calculate a return on own funds, there is a natural incentive for insurers to develop gross measure of capital generation, which excludes central costs and one-off items.
Navigating volatility | 16
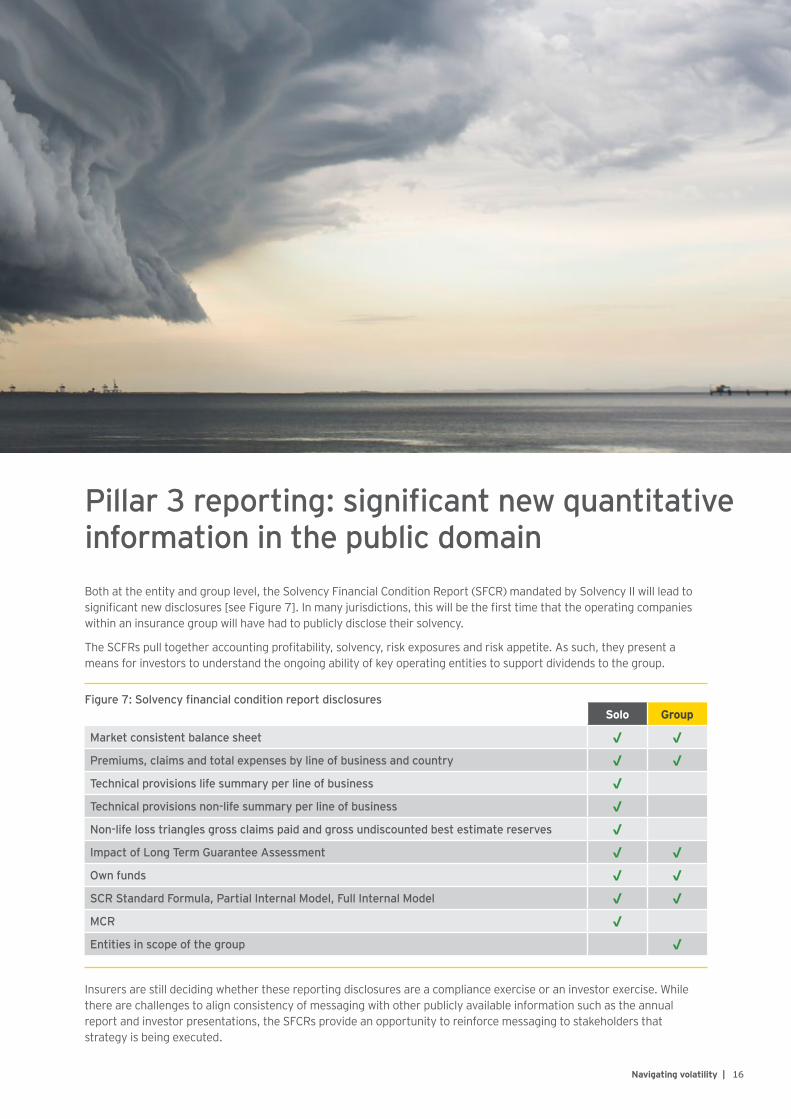
Both at the entity and group level, the Solvency Financial Condition Report (SFCR) mandated by Solvency II will lead to significant new disclosures [see Figure 7]. In many jurisdictions, this will be the first time that the operating companies within an insurance group will have had to publicly disclose their solvency.
The SCFRs pull together accounting profitability, solvency, risk exposures and risk appetite. As such, they present a means for investors to understand the ongoing ability of key operating entities to support dividends to the group.
Pillar 3 reporting: significant new quantitative information in the public domain
Insurers are still deciding whether these reporting disclosures are a compliance exercise or an investor exercise. While there are challenges to align consistency of messaging with other publicly available information such as the annual report and investor presentations, the SFCRs provide an opportunity to reinforce messaging to stakeholders that strategy is being executed.
Solo Group
Market consistent balance sheet √ √Premiums, claims and total expenses by line of business and country √ √Technical provisions life summary per line of business √Technical provisions non-life summary per line of business √Non-life loss triangles gross claims paid and gross undiscounted best estimate reserves √Impact of Long Term Guarantee Assessment √ √Own funds √ √SCR Standard Formula, Partial Internal Model, Full Internal Model √ √MCR √Entities in scope of the group √
Figure 7: Solvency financial condition report disclosures

17 | Navigating volatility
ConclusionVolatility is not new, but it is now firmly on boards’ and shareholders’ agendas. The market-sensitive nature of Solvency II makes that volatility far more material. Regulators are unlikely to waive the impacts of market volatility, in particular when this threatens target capitalization.
The insurance industry has needed to change its approach from managing overall capital adequacy to managing the stability of its balance sheet. This requires both a change of mindset and a new toolkit of both information and solutions. Information gaps need filling around a forward-looking Solvency II and legal entity view of capital generation.
We will continue to see innovation in capital management as companies and other market participants develop new tools and extend their use of existing solutions, including reinsurance.
From a disclosure perspective, capital management policies and sensitivity analyses have been used to reassure investors about management’s view of acceptable levels of volatility. Published sensitivities have provided limited comfort to investors as market events and high dividend payout ratios have increased investor focus on the likelihood of regulatory solvency constraining dividends.
Insurers need to develop better tools to understand the sources of regulatory volatility and capital generation within their balance sheet and clearly articulate the bounds within which inevitable volatility will be managed.

Navigating volatility | 18
EY contactsFinance, Risk and Actuarial Change
Capital optimization and disclosure Finance, Risk and Actuarial Change leadership
Simon [email protected] +44 20 7980 9599
Oliver Herbert [email protected] +44 20 7951 5230
Martin Bradley [email protected] +44 20 7951 8815
Phil Vermeulen [email protected] +41 58 286 3297
Reporting and accounting
Kevin [email protected] +44 20 7951 0905
Dr. Thomas Kagermeier [email protected] +49 89 14331 24402
Evan [email protected]+1 212 773 1428
Pierre Planchon [email protected] +33 1 46 93 62 54
Americas
Doug French [email protected]+1 212 773 4120
Chad [email protected]+1 212 773 1015
Nuno Viera [email protected]+55 11 2573 3098
Asia-Pacific
Jonathan Zhao [email protected] +85 2 2846 9023
Sumit [email protected]+65 6309 6452
Europe
Belgium France Germany ItalyKris Volkaerts [email protected]+32 2 774 9670
Francois [email protected] +33 1 55 61 01 09
Thomas Korte [email protected] +49 89 14331 15166
Gabriele [email protected]+39 027 221 2434
Netherlands Nordics Spain SwitzerlandPaul De [email protected] +31 88 407 1829
Kristin [email protected]+47 9424 7130
Angel Campomanes [email protected]+34 915 727 163
Andrew Gallacher [email protected]+41 58 286 3120

EY | Assurance | Tax | Transactions | Advisory
About EY EY is a global leader in assurance, tax, transaction and advisory services. The insights and quality services we deliver help build trust and confidence in the capital markets and in economies the world over. We develop outstanding leaders who team to deliver on our promises to all of our stakeholders. In so doing, we play a critical role in building a better working world for our people, for our clients and for our communities.
EY refers to the global organization, and may refer to one or more, of the member firms of Ernst & Young Global Limited, each of which is a separate legal entity. Ernst & Young Global Limited, a UK company limited by guarantee, does not provide services to clients. For more information about our organization, please visit ey.com.
© 2017 EYGM Limited. All Rights Reserved.
EYG no: 00768-174Gbl 1701-2158194 ED NoneThis material has been prepared for general informational purposes only and is not intended to be relied upon as accounting, tax or other professional advice. Please refer to your advisors for specific advice.
ey.com