navigating uncertainty - world bank
TRANSCRIPT

N A V I G A T I N G U N C E R T A I N T Y
WORLD BANK EAST ASIA AND PACIFIC ECONOMIC UPDATE OCTOBER 2018


WORLD BANK EAST ASIA AND PACIFIC ECONOMIC UPDATE OCTOBER 2018
Navigating Uncertainty

© 2018 International Bank for Reconstruction and Development / The World Bank
1818 H Street NW, Washington, DC 20433
Telephone: 202-473-1000; Internet: www.worldbank.org
Some rights reserved
1 2 3 4 22 21 20 19
This work is a product of the staff of The World Bank with external contributions. The findings, interpretations, and conclusions expressed in this work do not necessarily reflect the views of The World Bank, its Board of Executive Directors, or the governments they represent. The World Bank does not guarantee the accuracy of the data included in this work. The boundaries, colors, denominations, and other information shown on any map in this work do not imply any judgment on the part of The World Bank concerning the legal status of any territory or the endorsement or acceptance of such boundaries.
Nothing herein shall constitute or be considered to be a limitation upon or waiver of the privileges and immunities of The World Bank, all of which are specifically reserved.
Rights and Permissions
This work is available under the Creative Commons Attribution 3.0 IGO license (CC BY 3.0 IGO) http://creativecommons.org/licenses/by/3.0/igo. Under the Creative Commons Attribution license, you are free to copy, distribute, transmit, and adapt this work, including for commercial purposes, under the following conditions:
Attribution—Please cite the work as follows: World Bank. 2018. “Navigating Uncertainty” East Asia and Pacific Economic Update (October), World Bank, Washington, DC. Doi: 10.1596/978-1-4648-1366-5. License: Creative Commons Attribution CC BY 3.0 IGO
Translations—If you create a translation of this work, please add the following disclaimer along with the attribution: This translation was not created by The World Bank and should not be considered an official World Bank translation. The World Bank shall not be liable for any content or error in this translation.
Adaptations—If you create an adaptation of this work, please add the following disclaimer along with the attribution: This is an adaptation of an original work by The World Bank. Views and opinions expressed in the adaptation are the sole responsibility of the author or authors of the adaptation and are not endorsed by The World Bank.
Third-party content—The World Bank does not necessarily own each component of the content contained within the work. The World Bank therefore does not warrant that the use of any third-party-owned individual component or part contained in the work will not infringe on the rights of those third parties. The risk of claims resulting from such infringement rests solely with you. If you wish to re-use a component of the work, it is your responsibility to determine whether permission is needed for that re-use and to obtain permission from the copyright owner. Examples of components can include, but are not limited to, tables, figures, or images.
All queries on rights and licenses should be addressed to World Bank Publications, The World Bank Group, 1818 H Street NW, Washington, DC 20433, USA; e-mail: [email protected].
ISBN (electronic): 978-1-4648-1366-5
DOI: 10.1596/978-1-4648-1366-5
Photo credits in this publication. Further permission required for reuse.
Cover: Wenyong Li / World Bank.
Page 1: Nguyen Khanh / World Bank
Page 69: Stanislas Fradelizi / World Bank
Page 109: Wetlands International-China Office

Contents
List of Abbreviations xiii
Preface and Acknowledgments xv
Executive Summary xvii
Part I. Recent Developments and Outlook 1
I.A. Recent Developments 2Regional growth remained resilient in the first half of 2018, despite increased risks 2
Export growth peaked in early 2018 before easing over the year 9
Domestic demand remained robust across the region 10
Inflation is edging up, though rates generally remain below target levels 15
Heightened uncertainty has weighed on exchange rates and financial markets 16
Fiscal space in many regional economies is shrinking as governments adopt accommodative fiscal policies to support growth 20
Despite rising revenues, Pacific island countries continue to face a risk of debt distress, as well as the persistent threat of natural disasters 22
Poverty rates have continued to fall across the EAP region 23
I.B. Outlook and Risks 25Growth is expected to moderate slightly but remain generally strong across the region 25
Domestic demand will continue to drive regional growth 30
Continued growth is expected to support further declines in poverty 31
Escalating protectionism could dampen the growth outlook for developing EAP 35
Heightened financial market turbulence would complicate macroeconomic management 42
The interaction of these risks could exacerbate short-term vulnerabilities and hinder growth prospects 48
Among the Pacific island countries, risks remain tilted to the downside 49
I.C. Policy Considerations 50Mitigate short-term vulnerabilities and enhance preparedness 50
Strengthen and expand the global rules-based trade and investment framework, including through deeper regional integration 52
Deepen structural reforms to support medium-term growth 58
Enhance economic security and promote economic mobility 59
An agenda for the Pacific island countries 60
Part I References 64
NAVIGATING UNCERTAINTY
IIILIST OF COnTEnTS

Part II. Medium-Term Development Agenda 69
II.A.IntergenerationalMobilityinEastAsiaandthePacific 70Intergenerational mobility has profound implications for social and economic development 70
How is economic mobility across generations measured in this analysis? 72
Intergenerational mobility in the EAP region 74
Income mobility is closely aligned with education mobility in EAP 79
Economic growth can, but does not inevitably, promote mobility 80
Policies to enhance intergenerational mobility in EAP 81
II.B. Meeting the Jobs Challenge in Southeast Asia: Lessons from Cambodia, Myanmar, and Vietnam 86Introduction 86
The key employment challenge facing the Mekong LMICs is not to create more jobs, but to create higher-quality, more-inclusive jobs 87
Inclusiveness in employment is also a challenge, as pockets of inequality persist 90
Job quality is improving among the Mekong LMICs, and jobs are becoming more inclusive, but progress has been slow 91
Among the Mekong LMICs, labor costs are increasing faster than labor productivity, and a reliance on low-value-added components of global value chains may hinder improvements in job quality, with especially negative consequences for young women 92
The domestic sectors in the Mekong LMICs face various obstacles that create perverse incentives for job creation and upgrading 94
The quality of agricultural jobs will likely improve, driven both by megatrends and continued structural change 96
A low-skilled workforce and an inadequate skills-development system may impede progress across all job types 97
Policy Implications 100
Conclusions 102
Part II References 104
Part III. Country Summaries and Key Indicators 109Cambodia 110
Central Pacific Islands 113
China 116
Fiji 119
Indonesia 122
Lao PDR 125
Malaysia 128
Mongolia 131
Contents continued
EAST ASIA AND PACIFIC ECONOMIC UPDATE OCTOBER 2018
IV LIST OF COnTEnTS

Myanmar 134
north Pacific Islands 137
Papua New Guinea 140
Philippines 143
Solomon Islands 146
South Pacific Islands 149
Thailand 152
Timor-Leste 155
Vietnam 158
Contents continued
NAVIGATING UNCERTAINTY
VLIST OF COnTEnTS

List of Figures
Part I. Recent Developments and Outlook
I.A. Recent DevelopmentsFigure I.A.1. Growth among developing EAP economies has remained resilient in 2018 3
Figure I.A.2. Business confidence indicators have yet to show clear signs of slowing economic momentum among developing countries in East Asia and the Pacific 3
Figure I.A.3. Monthly indicators suggest that China’s economic momentum remains strong 9
Figure I.A.4. The region’s largest developing economies continued to register robust growth through Q2 2018 9
Figure I.A.5. Economic activity was generally solid across the region’s smaller economies 9
Figure I.A.6. Growth in export values peaked in early 2018… 10
Figure I.A.7. …as did growth in export volumes 10
Figure I.A.8. Strong domestic demand continued to underpin growth 11
Figure I.A.9. Robust net FDI inflows also supported the economic expansion 14
Figure I.A.10. Import growth has generally remained firm among the region’s major economies 15
Figure I.A.11. Current account developments have been mixed 15
Figure I.A.12. In recent months, inflation has begun to tick up across the region… 16
Figure I.A.13. …and rising producer prices suggest underlying price pressures may be building 16
Figure I.A.14. Converging risks triggered increased stock market volatility 17
Figure I.A.15. External corporate and sovereign bond spreads have continued to widen as uncertainty surrounding the economic outlook has intensified 17
Figure I.A.16. Equity markets have trended down amid heightened volatility… 18
Figure I.A.17. …as have the currencies of the region’s large economies 18
Figure I.A.18. Spreads with the U.S. Federal Reserve’s federal funds rate have narrowed as developing EAP central banks have maintained accommodative monetary policies to support growth 19
Figure I.A.19. Despite recent reductions, foreign reserves remain ample across the region’s major economies 19
Figure I.A.20. In most countries, credit growth rates either remain high or have recently increased 20
Figure I.A.21. The stock of private sector debt remains high but stable in China and Malaysia 20
Figure I.A.22. Fiscal deficits have generally remained contained 21
Figure I.A.23. The risk of external debt distress among Pacific island countries remains elevated 22
Figure I.A.24. Poverty rates have continued to decline across the region 23
I.B. Outlook and RisksFigure I.B.1. Domestic demand will continue to drive growth over the forecast period despite the
negative impact of declining net exports 31
Figure I.B.2. Banking sectors remain well capitalized across the region 44
I.C. Policy ConsiderationsFigure I.C.1. In recent years, robust fiscal revenues have contributed to relatively narrow deficits… 52
Figure I.C.2. …and broadly stable debt stocks across the region 52
EAST ASIA AND PACIFIC ECONOMIC UPDATE OCTOBER 2018
VI LIST OF COnTEnTS

Part II. Medium-Term Development Agenda
II.A.IntergenerationalMobilityinEastAsiaandthePacificFigure II.A.1. Globally, lower relative income mobility is associated with greater income inequality 72
Figure II.A.2. Among the youngest generation of adults, developing EAP outperforms other developing regions in both relative and absolute education mobility, but it lags the averages for advanced economies 74
Figure II.A.3. Many large EAP countries have higher absolute mobility than would be expected given their levels of intergenerational persistence 75
Figure II.A.4. Absolute education mobility has risen more rapidly in East Asia and the Pacific than it has among any global income group 76
Figure II.A.5. Despite showing some improvement in relative education mobility, EAP lags high-income countries, and upward mobility from the bottom half of the distribution is declining 77
Figure II.A.6. Progress in improving relative education mobility has been mixed 77
Figure II.A.7. Relative mobility in education and income are strongly but imperfectly correlated across countries globally 79
Figure II.A.8. Intergenerational education mobility does not always rise with GDP per capita 81
Figure II.A.9. Relative mobility tends to be higher when public education spending is higher, and richer countries tend to have higher levels of public education spending 82
Figure II.A.10. Greater inequality in education is associated with lower relative education mobility 83
Figure II.A.11. Economies with greater educational mobility tend to exhibit less spatial segregation by education level 84
II.B. Meeting the Jobs Challenge in Southeast Asia: Lessons from Cambodia, Myanmar, and VietnamFigure II.B.1. By the standards of their regional peers, the Mekong LMICs are still at a relatively early
stage in their structural transformation… 87
Figure II.B.2. …and their agricultural sectors continue to account for a large share of employment 87
Figure II.B.3. Labor-force participation rates among the Mekong LMICs are high by regional standards 87
Figure II.B.4. While productivity in the paddy-rice agricultural subsector is low, jobs in this subsector are numerous 89
Figure B.II.5. Average wages in the Mekong LMIC garment sector are close to or below the averages for garment sectors in other developing countries 89
Figure II.B.6. Significant gender-based wage gaps persist among Mekong LMICs 90
Figure II.B.7. Unit labor costs among Mekong LMICs are high by the standards of comparable countries 93
Figure II.B.8. Small enterprises and startups drive job creation among Mekong LMICs 95
Figure II.B.9. Garment firms in the Mekong LMICs purchase only a small share of their inputs locally 95
Figure II.B.10. Below the level of secondary-school completion, additional education generates minimal wage gains in Cambodia, while across the region employers report shortages of skilled labor 98
Figure II.B.11. Employers in Myanmar report shortages of both technical and nontechnical workforce skills, especially interpersonal and managerial skills 99
List of Figures continued
NAVIGATING UNCERTAINTY
VIILIST OF COnTEnTS

Part III. Country Summaries and Key Indicators
Cambodia
Figure 1. Real GDP growth, contribution to real growth 112
Figure 2. Trends in rubber and rice prices and remittances 112
Central Pacific Islands
Figure 1. Sources of domestic revenue - projections to 2020 115
Figure 2. Projected sovereign wealth fund balances and per capita values 115
China
Figure 1. Real GDP growth and contributions to real GDP growth 118
Figure 2. Poverty estimates and projections 118
Fiji
Figure 1. Real GDP growth and total investment share in GDP 121
Figure 2. Fiscal balance and public debt 121
Indonesia
Figure 1. Real GDP growth and contribution to growth 124
Figure 2. Poverty rate, actual and projected 124
Lao PDR
Figure 1. Real GDP growth, contribution to real growth 127
Figure 2. Actual and projected poverty rates 127
Malaysia
Figure 1. Real GDP growth, contribution to real growth 130
Figure 2. Growth incidence curves 130
Mongolia
Figure 1. Real GDP growth, contribution to real growth 133
Figure 2. Poverty rate (official poverty line): 2010–16 133
Myanmar
Figure 1. Real GDP growth and sector contribution to real GDP growth 136
Figure 2. CPI inflation and exchange rate 136
north Pacific Islands
Figure 1. Former sector employment 139
Figure 2. Overall fiscal balance 139
List of Figures continued
EAST ASIA AND PACIFIC ECONOMIC UPDATE OCTOBER 2018
VIII LIST OF COnTEnTS

Papua New Guinea
Figure 1. Real GDP growth, contribution to real growth 142
Figure 2. Key fiscal and debt indicators 142
Philippines
Figure 1. Real GDP growth, contribution to real growth 145
Figure 2. Actual and projected poverty rates and real GDP per capita 145
Solomon Islands
Figure 1. Trade balance 148
Figure 2. Per capita GDP 148
South Pacific Islands
Figure 1. Incidence of poverty at international poverty lines and national hardship thresholds 151
Figure 2. Public and publicly guaranteed external debt 151
Thailand
Figure 1. Contributions to real GDP growth 154
Figure 2. Actual and projected poverty rates and real private consumption per capita 154
Timor-Leste
Figure 1. Real growth and contributions to real GDP growth 157
Figure 2. Fiscal aggregates 157
Vietnam
Figure 1. Real GDP growth and contribution to real GDP growth 160
Figure 2. Poverty rate and real GDP per capita 160
List of Figures continued
NAVIGATING UNCERTAINTY
IxLIST OF COnTEnTS

List of Tables
Part I. Recent Developments and Outlook
I.B. Outlook and RisksTable I.B.1. GDP growth projections for developing EAP remain generally solid 25
Table I.B.2. Poverty in developing EAP is projected to continue falling over the projection period 34
Part II. Medium-Term Development Agenda
II.B. Meeting the Jobs Challenge in Southeast Asia: Lessons from Cambodia, Myanmar, and VietnamTable II.B.1. Among Mekong LMICs, “traditional” jobs account for a large share of total employment 89
Table II.B.2. Most of the fastest-growing occupational categories offer higher-quality jobs 92
Part III. Country Summaries and Key IndicatorsCambodia Selected Indicators 112
Central Pacific Islands Selected Indicators 115
China Selected Indicators 118
Fiji Selected Indicators 121
Indonesia Selected Indicators 124
Lao PDR Selected Indicators 127
Malaysia Selected Indicators 130
Mongolia Selected Indicators 133
Myanmar Selected Indicators 136
north Pacific Islands Selected Indicators 139
Papua New Guinea Selected Indicators 142
Philippines Selected Indicators 145
Solomon Islands Selected Indicators 148
South Pacific Islands Selected Indicators 151
Thailand Selected Indicators 154
Timor-Leste Selected Indicators 157
Vietnam Selected Indicators 160
EAST ASIA AND PACIFIC ECONOMIC UPDATE OCTOBER 2018
x LIST OF COnTEnTS

List of Boxes
Part I. Recent Developments and Outlook
I.A. Recent DevelopmentsBox I.A.1. Recent Global Developments 3
Figure BI.A.1.1. The global Purchasing Managers’ Index: manufacturing output and new export orders 4
Figure BI.A.1.2. Global trade growth has decelerated 4
Figure BI.A.1.3. Global economic growth rates, 2007–18 4
Figure BI.A.1.4. Regional economic growth rates, 2012–18 4
Figure BI.A.1.5. International commodity prices 5
Table BI.A.1.1. Evolution of Federal Reserve policy rate projections 5
Box I.A.2. Rising Trade Tensions: A Timeline 6
Table BI.A.2.1. Planned and implemented changes to tariffs on trade between the U.S. and its key trading partners 7
Box I.A.3. China’s Investment Slowdown 11
Figure BI.A.3.1. Real gross capital growth rate, China, 2001–2017 12
Figure BI.A.3.2. Average annual gross capital growth rate, China and comparators, 2012–16 12
Figure BI.A.3.3. Real gross fixed-capital formation by sector, 2007–2016 average 12
Figure BI.A.3.4. nominal fixed-asset investment growth in selected sectors, 2017 13
I.B. Outlook and RisksBox I.B.1. Global Outlook and Risks 27
Figure BI.B.1.1. Aggregate GDP growth rates, estimated and projected 27
Figure BI.B.1.2. Regional GDP growth rates, estimated and projected 27
Figure BI.B.1.3. World commodity price forecasts 28
Box I.B.2. Indonesia’s Middle Class and a New Social Contract 32
Figure BI.B.2.1. Economic classes by population share, Indonesia, 2002–2016 33
Figure BI.B.2.2. Share of national household consumption by economic class, Indonesia, 2002–2016 33
Figure BI.B.2.3. Choice of healthcare provider by economic class, 2016 34
Box I.B.3. Global Value-Chain Integration in East Asia and the Pacific 36
Figure BI.B.3.1. Global value-chain participation index, selected developing countries in East Asia and the Pacific, 1995 and 2011 36
Figure BI.B.3.2. Diagram of regional value chains in East Asia and the Pacific, 2011 36
Figure BI.B.3.3. Expected losses among economies in East Asia and the Pacific due to a U.S.-China trade war, 2011 37
Box I.B.4. Spillovers to Developing East Asia and Pacific from China 39
Figure BI.B.4.1. External exposure among developing economies in East Asia and the Pacific 40
Figure BI.B.4.2. Regional spillovers from China 41
NAVIGATING UNCERTAINTY
xILIST OF COnTEnTS

Box I.B.5. How Vulnerable Is the East Asia and Pacific Regional Banking Sector? 44
Figure BI.B.5.1. Banking-sector assets as a share of GDP 44
Table BI.B.5.1. Banking-sector heat map for East Asia and the Pacific 45
Figure BI.B.5.2. Bank credit as a share of GDP, 2006–2018 46
Figure BI.B.5.3. Decomposition of credit-to-GDP ratios, 2013–17 46
Table BI.B.5.2. Key banking-sector vulnerabilities in the East Asia and Pacific region 47
I.C. Policy ConsiderationsBox I.C.1. The Distributional Impacts of Free-Trade Agreements in Vietnam and Indonesia 54
Figure BI.C.1.1. The projected distributional impact of CPTPP membership, Vietnam and Indonesia 55
Box I.C.2. The Growth and Welfare Effects of the Belt and Road Initiative 56
Figure B1.C.2.1. Average percentage change in shipping time (left) and trade costs (right) of East Asia and Pacific Countries due to the BRI 57
Figure B1.C.2.2. Average percentage changes in GDP and welfare for countries in developing EAP 58
Box I.C.3. The De-Risking Phenomenon and Its Impact on the Pacific 61
Part II. Medium-Term Development Agenda
II.A.IntergenerationalMobilityinEastAsiaandthePacificBox BII.A.1. Absolute and Relative Intergenerational Mobility 71
Figure BII.A.1.1. Intergenerational mobility 71
Box BII.A.2. The Data Sources and Measures of Intergenerational Mobility Used in This Analysis 73
Box BII.A.3. Recent Trends in Intergenerational Education Persistence in China 78
II.B. Meeting the Jobs Challenge in Southeast Asia: Lessons from Cambodia, Myanmar, and VietnamBox BII.B.1. Defining Job Quality 88
Box BII.B.2. The Rise of the Sew-Bots? Maybe Not Yet… 93
Part III. Country Summaries and Key Indicators
List of Boxes continued
EAST ASIA AND PACIFIC ECONOMIC UPDATE OCTOBER 2018
xII LIST OF COnTEnTS

AEC ASEAn Economic CommunityAFAS ASEAn Framework Agreement on Services
AML/CFT Anti-Money Laundering and Combating the Financing of Terrorism
ASEAn Association of Southeast Asian NationsATISA ASEAn Trade in Services AgreementBASAs Bilateral Air Services Agreementsbbl per barrelBRI Belt & Road InitiativeCBR correspondent banking relationshipsCPI Consumer Price Index
CPMI Committee on Payments and Market Infrastructures
CPTPP Comprehensive and Progressive Agreement for Trans-Pacific Partnership
CMT Cut Make TrimDSA debt sustainability analysisEAP East Asia and the PacificEMDEs emerging market and developing economiesEU European UnionFATF Financial Action Task ForceFDI foreign direct investmentFOMC The Federal Open Market CommitteeFTA Free trade agreementsFY fiscal yearFX foreign exchangeGATS General Agreement on Trade in ServicesGST Goods and Services TaxSST Sales and Services TaxGDP gross domestic productGDMI Global Database of Intergenerational MobilityGVCs global value chainsIFC International Finance CorporationIGM intergenerational mobilityIMF International Monetary FundLFP labor force participationLGFV local government financing vehiclesLMIC lower-middle-income classLMICs low and middle income countriesMTO Money Transfer Operators
NBFIs non-bank financial institutionsn.e.c. not elsewhere classifiedNPLs nonperforming loansNTMs nontariff measures
OECD Organisation for Economic Co-operation and Development
OPEC Organization of the Petroleum Exporting CountriesOJK Indonesian Financial Services AuthorityPBOC People’s Bank of ChinaPDR People’s Democratic RepublicPICs Pacific Island CountriesPISA Programme for International Student AssessmentPMI Purchasing Managers’ IndexPPP purchasing power parityPTA preferential trade agreementsQ1 first quarterQ2 second quarterQ3 third quarterQ4 fourth quarterQABs Qualified ASEAn BanksR&D research and developmentRCEP Regional Comprehensive Economic Partnershiprhs right-hand sideSAR Special Administrative RegionSAAR seasonally adjusted annual rateSME small and medium-sized enterpriseSOE state-owned enterpriseSVAR Bayesian structural vector autoregressionTiVA Trade in value added TPP Trans-Pacific PartnershipTRAIN Tax Reform for Acceleration and InclusionTVET training and vocational educationUMIC upper-middle-income classUN SDGs United Nations Sustainable Development GoalsUSTR United States Trade RepresentativeVAT Value Added TaxWITS World Integrated Trade SolutionWTO World Trade Organizationy/y year-over-year
List of Abbreviations
NAVIGATING UNCERTAINTY
xIIILIST OF ABBREVIATIOnS

Regions, World Bank Classification and Country Groups
ASEAn Association of Southeast Asian NationsEAP East Asia and PacificECA Eastern Europe and Central AsiaLAC Latin America and the Caribbean
MEnA Middle East and north AfricaMNA Middle East and north AfricaPICs Pacific Island CountriesSAR South AsiaSSA Sub-Saharan Africa
List of Abbreviations continued
Country Abbreviations
ARG ArgentinaAUS AustraliaBRA BrazilBRN Brunei DarussalamCAN CanadaCHN ChinaCYM Cayman IslandsDEU GermanyFJI FijiFSM Federation States of MicronesiaHKG Hong Kong SAR, ChinaIDN IndonesiaJPN JapanKHM CambodiaKIR KiribatiKOR Republic of KoreaLAO Lao People’s Democratic RepublicMEX MexicoMNG Mongolia
MMR MyanmarMYS MalaysiaNRU NauruPHL PhilippinesPLW PalauPNG Papua New GuineaRMI Republic of the Marshall IslandsRUS RussiaSGP SingaporeSLB Solomon IslandsTHA ThailandTLS Timor-LesteTON TongaTUR TurkeyTUV TuvaluTWN Taiwan, ChinaUSA United StatesVNM VietnamVUT VanuatuWSM Samoa
Currency Units
A Australian dollar$NZ New Zealand dollarB Thai bahtCR Cambodian rielD Vietnamese dongF$ Fiji dollarK Myanmar kyatK Papua New Guinea kina
Kip Lao kipP Philippine pesoRM Malaysian ringgitRMB Chinese renminbiRp Indonesian rupiahSI$ Solomon Islands dollarTog Mongolian turhrikUS$ Timor-Leste (U.S. dollar)US$ United States dollar
EAST ASIA AND PACIFIC ECONOMIC UPDATE OCTOBER 2018
xIV LIST OF ABBREVIATIOnS

Preface and Acknowledgments
The East Asia and Pacific Economic Update is a joint product of the World Bank Office of the Chief Economist, East Asia and Pacific Region, and the Macroeconomics, Trade and Investment Global Practice, prepared in collaboration with the Poverty and Equity Global Practice, the Development Prospects Group, and the Finance and Markets Global Practice. The report was prepared by Ha Nguyen (Co-Task Team Leader) and Andrew Blackman (Co-Task Team Leader), under the guidance of Sudhir Shetty (Chief Economist, East Asia and Pacific Region). ndiame Diop, Deepak Mishra, and Salman Zaidi provided valuable advice to the team.
Chapter I was prepared by Andrew Blackman (lead), Ekaterine Vashakmadze, Judy Yang, Vera Kehayova and Ha nguyen. Contributions were received from the Chapter III team (listed below), as well as Ana Maria Aviles, Massimiliano Cali, Carlo Corazza, Ergys Islamaj, Maryla Maliszewska, Robert Henry Malpass, Andy Mason, Elitza Mileva, Keita Miyaki, Francesca de Nicola, Israel Osorio-Rodarte, Jiyoung Song, Diego Sourrouille, François de Soyres, Radu Tatucu, Matthew Wai-Poi, Jinxin Wu and Luan Zhao.
Chapter II was prepared by Ambar Narayan and Judy Yang (Chapter II.A), and Wendy Cunningham (Chapter II.B).
Chapter III was prepared by staff from the Macroeconomics, Trade and Investment Global Practice and the Poverty and Equity Global Practice: Kiatipong Ariyapruchya, Davaadalai Batsuuri, Hans Beck, Andrew Blackman, Derek Hung Chiat Chen, Yew Keat Chong, Olga Da Conceicao, Kevin Chua, Kevin Cruz, Francis Addeah Darko, Somneuk Davading, Georgia Demarchi, Gabriel Demombynes, Reno Dewina, Viet Tuan Dinh, Sebastian Eckardt, Kim Alan Edwards, Samuel Freije-Rodriguez, Imogen Halstead, Birgit Hansl, Kristen Himelein, Taufik Ramadhan Indrakesuma, Demet Kaya, Annette De Kleine, Chandana Kularatne, John Litwack, Xubei Luo, Sodeth Ly, Miguel Eduardo Sanchez Martin, Pedro Miguel Gaspar Martins, Elitza Mileva, Thi Da Myint, Shabih Ali Mohib, Arvind nair, Jean-Pascal nguessa nganou, Clarence Tsimpo Nkengne, Keomanivone Phimmahasay, Obert Pimhidzai, Sharon Faye Alariao Piza, Ririn Purnamasari, Rong Qian, Richard Record, Jaffar Al Rikabi, Anna Robinson, Carlos Orton Romero, Frederico Gil Sander, Ilyas Sarsenov, Imam Setiawan, Dhruv Sharma, Altantsetseg Shiilegmaa, Kenneth Simler, Sailesh Tiwari, Kimsun Tong, Ikuko Uochi, Judy Yang, Gabriel Roberto Zaourak, and Luan Zhao. The work was managed by Ndiame Diop and Deepak Mishra for the Macroeconomics, Trade and Investment Global Practice, and by Salman Zaidi for the Poverty and Equity Global Practice. Thi Thanh Thanh Bui, Kristina Catherine Tan Mercado, and David Andrew Stephan, made substantive contributions to the model, table production and assisting staff with their forecasts. Angkanee Luangpenthong, Yulita Sari Soepardjo and Ivana Ticha provided technical support.
Assistance with communications and outreach was provided by Marcela Sanchez-Bender, Lívia Pontes and Alejandro Cedeno Ulloa (External Communications, East Asia and Pacific Region). The report was edited by Sean Lothrop, and designed and typeset by Budy Wirasmo. Administrative support was provided by Cecile Wodon.
NAVIGATING UNCERTAINTY
xVPREFACE AnD ACKnOWLEDGMEnTS

Throughout the report, geographic groupings are defined as follows:
DevelopingEastAsiaandPacific comprises Cambodia, China, Indonesia, Lao People’s Democratic Republic (PDR), Malaysia, Mongolia, Myanmar, Papua new Guinea, the Philippines, Thailand, Timor-Leste, Vietnam, and the Pacific Island Countries.
The PacificIslandCountries comprise Fiji, Kiribati, the Marshall Islands, the Federated States of Micronesia, Palau, Samoa, the Solomon Islands, Tonga, Tuvalu, and Vanuatu.
The ASEAN member countries comprise Brunei Darussalam, Cambodia, Indonesia, Lao PDR, Malaysia, Myanmar, the Philippines, Singapore, Thailand, and Vietnam.
The ASEAN-5 comprise Indonesia, Malaysia, the Philippines, Thailand, and Vietnam.
This report is based on data available through Sep 18, 2018, inclusive.
Preface continued
EAST ASIA AND PACIFIC ECONOMIC UPDATE OCTOBER 2018
xVI PREFACE AnD ACKnOWLEDGMEnTS

Executive Summary
GrowthindevelopingEastAsiaandPacific(EAP)wasresilientduringthefirsthalfof2018.Across the region, solid economic activity was underpinned by strong domestic demand. In China, private consumption strengthened, as the government continued its strategy of rebalancing growth away from investment. Meanwhile, robust labor demand and healthy wage growth supported consumption spending across the large ASEAn economies. Investment also picked up across the region, except in China, where measures to support deleveraging have cooled investment growth. By contrast, the region’s export growth rate appears to have peaked in early 2018 as external demand has moderated. Inflation rates are edging up across the region, especially in Myanmar, the Philippines, and Vietnam.
The external environment has become less favorable in some respects. In recent months, the trade tensions between the United States and its major trading partners—particularly China, but also the European Union, Canada, and Mexico—have increased. As a result, global trade growth has shown signs of slowing, and nonenergy commodity prices have fallen. In addition, buoyant U.S. economic activity, including a strong labor market and rising inflation rates, have accelerated the planned pace of monetary policy normalization by the Federal Reserve, strengthening the U.S. dollar. The convergence of these developments has triggered bouts of capital outflows from developing EAP, putting pressure on regional exchange rates and equity markets.
Despite these emerging headwinds, the regional growth outlook for 2018–2020 remains positive. After peaking in 2017, growth in developing EAP is expected to slow slightly to 6.3 percent in 2018, due to the moderation in China’s economic expansion. Excluding China, growth in developing EAP is expected to remain stable during 2018–2020. Robust domestic demand will remain the main driver of growth across the region, as moderating external demand shifts net exports from contributing to growth in 2017 to detracting from it in 2018 and beyond. With most economies operating close to or above their potential growth, price pressures are expected to rise.
Growth in China is expected to slow moderately in 2018–2020 as its economy continues to rebalance. China’s economy is continuing to transition away from investment- and export-led growth and toward consumption- and services-led growth. The recently-implemented U.S. tariff measures are expected to have only a small direct contractionary effect on growth, which should be offset by recent accommodative monetary and fiscal policy measures. Over the medium term, the impact of escalating trade tensions on investor confidence could play a larger role and would need to be countered by accelerated structural reforms.
Growth among the large ASEAN countries is expected to remain solid in 2018 and beyond. Robust private consumption will remain the key driver of growth. Private investment is expected to also support growth in Indonesia and Vietnam, while large, ongoing public works projects will boost economic activity in the Philippines and Thailand. By contrast, investment growth is projected to remain subdued in Malaysia, as slowing global momentum and the cancellation of two large public infrastructure projects weigh on the outlook. The cyclical moderation of global demand, combined with slowing demand from China along regional supply chains, is expected to moderate export growth during 2018–20.
Growthprospectsamongtheregion’ssmallereconomiesaregenerallyfavorable,reflectingstrongdomesticdemand over the medium term. The growth outlook remains strong for Cambodia, Lao PDR, Mongolia, and Myanmar, with annual growth rates in each country projected to average over 6 percent during 2018–2020. Growth is expected
NAVIGATING UNCERTAINTY
xVIIEXECUTIVE SUMMARY

to pick up in Timor-Leste following the resolution of a political impasse that had weighed heavily on the economy. The Papua New Guinean economy is projected to contract in 2018 following the large earthquake that struck the country in February, though growth is expected to rebound in 2019. Growth among the Pacific island countries is expected to remain relatively firm over the forecast horizon, although the growth outlook for these economies remains highly vulnerable to natural disaster shocks.
Robust growth has underpinned, and will continue to support, further declines in poverty. The extreme poverty rate (based on the international poverty line of US$1.90/day in 2011 PPP terms) is now below 2 percent of the region’s total population including China, and 4.4 percent excluding China. By 2020, this rate and the number of people below this poverty line will fall even further, with the highest rates of extreme poverty to be found in Lao PDR, Papua New Guinea, and Timor-Leste, as well as remote areas of more-affluent countries. The region’s positive economic outlook is expected to raise 60 million people above the lower-middle-income class poverty line (US$3.20/day, PPP) by 2020, reducing the poverty rate relative to this line from 9.4 percent in 2017 to 6.4 percent in 2020.
Nevertheless,heighteneduncertaintyhasintensifiedtheriskstotheregion’sgrowthoutlook.Consequently, the range around the baseline growth projections has widened. First, an escalation in protectionism would have more severe impacts on regional growth. An increase in the scope and/or intensity of U.S. tariffs on Chinese exports, or the expansion of tariff measures to other U.S. trading partners in developing EAP, would have a meaningful impact on regional economic activity. To the extent that an escalation in trade tensions leads to weaker economic growth in China, there could be additional negative impacts on both regional exports to China and global commodity prices. In an extreme scenario, a spillover of protectionist sentiment to investment would have more severe adverse implications for regional and global growth.
Second, heightened financial market turbulence would complicate macroeconomic management. A sudden change in market expectations regarding the pace of U.S. interest rate normalization would likely trigger further capital outflows from developing EAP. Furthermore, despite stronger growth prospects and larger buffers in most countries in the region compared to most other emerging market economies, the risk of financial market contagion from vulnerable economies elsewhere in the world has increased. Heightened financial market turbulence would likely accentuate debt rollover risks and increase risk premiums. Moreover, elevated financing costs could limit the scope for implementing countercyclical fiscal policies to offset future downturns.
While each of these risks could have adverse effects on its own, the combined impact of multiple shocks would be even greater. Escalating protectionism coupled with a reevaluation of the pace of U.S. monetary policy normalization and/or deteriorating investor confidence in emerging market economies could precipitate large and rapid capital outflows from developing EAP and lead to further currency depreciations. Domestic vulnerabilities—such as elevated domestic debt levels and large external financing needs, which persist for some countries in the region—would amplify the impact of external shocks, especially where buffers are limited, prompting further capital outflows and dampening growth.
In a context of increasing risks, developing EAP economies should utilize the full range of available macroeconomic, prudential, and structural policies to smooth external shocks and raise potential growth rates. Regional authorities are advised to pursue a four-pronged approach to enhance preparedness and strengthen resilience. First, current conditions require a focus on reducing short-term vulnerabilities and building policy buffers. Proactive macroprudential policies can help address financial sector vulnerabilities and encourage banks and corporations to reduce
EAST ASIA AND PACIFIC ECONOMIC UPDATE OCTOBER 2018
xVIII EXECUTIVE SUMMARY

balance sheet mismatches. In China, continued deleveraging and the implementation of new rules for local government borrowing can help mitigate the potential impact on investor sentiment of recently-announced trade restrictions. In countries that use a flexible exchange rate regime, maintaining exchange rate flexibility can help economies absorb and adapt to external shocks, including surges in capital flows. During periods of intense pressure, sterilized foreign exchange intervention could be considered to smooth excessive exchange rate and capital market volatility. Fiscal policies need to focus on preserving and rebuilding buffers where required, both to create fiscal space to cope with the next downturn and to enhance debt sustainability and financial resilience in a context of potentially more volatile capital markets.
Second, developing EAP countries can and should show global leadership by redoubling their commitment to an open, rules-based international trade and investment framework, including through deeper regional economic integration. Regional economies could reap substantial benefits by deepening existing preferential trade agreements and lowering nontariff barriers. Deeper integration can be pursued via mechanisms such as the Comprehensive and Progressive Agreement for Trans-Pacific Partnership, the Regional Comprehensive Economic Partnership, the Belt and Road Initiative, and new bilateral agreements. In addition, developing EAP countries should attempt to avoid a further escalation of trade tensions by seeking negotiated agreements to resolve trade disputes, either bilaterally or via the World Trade Organization.
Third, deepening structural reforms remains crucial to enhance medium-term growth prospects and bolster competitiveness. For China to counter the potential negative impact of recent trade measures on investment—especially foreign direct investment—the reform agenda should remain focused on the continued liberalization of key sectors, improvements in the business climate, better protection of intellectual property, and increased regulatory predictability and transparency. As global trade growth slows, other countries in the region should continue to advance reforms to the business environment designed to enhance competitiveness and increase medium-term growth. Leveling the playing field between large firms and small and medium-sized enterprises, and between foreign-owned and domestic firms, is a priority, as it would reduce resource misallocation while helping to create higher-quality, more-inclusive jobs.
Finally, the intensifying risks to the regional outlook underscore the need to continue strengthening economic security while promoting economic mobility. Expanding targeted cash transfer programs can enhance economic security among the poor and vulnerable. In addition, establishing effective, fiscally sustainable social insurance systems can provide critical support to households against economic shocks. Countries in developing EAP should explore three policy options for promoting economic mobility. First, increasing investment in prenatal and early childhood development could improve educational outcomes and lifetime earnings. Second, channeling resources to schools in geographically disadvantaged areas, including salary incentives for teachers, can help address gaps in education access and quality. Third, targeted cash transfer programs can enhance educational mobility by increasing private investment in human capital.
ThePacificislandcountries(PICs)needtofocusonmaintainingfiscalanddebtsustainabilitywhilecontinuingto strengthen their resilience to natural disasters. The frequency and scale of natural disasters in the PICs heightens the importance of medium-term economic and fiscal planning to minimize the adverse impacts of these shocks on development outcomes. Mitigating the effects of future natural disasters requires building fiscal buffers, improving crisis preparedness, management, and mitigation, and expanding targeted social protection mechanisms. Given the elevated risk of debt distress across the PICs, continued efforts to strengthen debt policies and debt management, build fiscal space, and boost the quality of spending will be crucial to improve debt sustainability.
NAVIGATING UNCERTAINTY
xIxEXECUTIVE SUMMARY


Part I. Recent Developments and Outlook
1
WORLD BANK EAST ASIA AND PACIFIC ECONOMIC UPDATE OCTOBER 2018

I.A. Recent Developments
Growth among developing countries in East Asia and the Pacific has thus far remained resilient in 2018, underpinned by still-strong domestic demand. As a result, poverty has continued to fall in most countries. Nevertheless, economies across the region have experienced headwinds in recent months: trade tensions, monetary policy tightening in advanced economies, a stronger U.S. dollar, and heightened financial market volatility in emerging economies. These factors have triggered episodes of financial market turbulence in many regional economies, weighing on currencies, bond spreads, and equity markets. External demand has also begun to moderate since early 2018. Amid monetary tightening in advanced countries, regional central banks are facing a difficult tradeoff between increasing interest rates to support domestic capital markets and currencies and maintaining an accommodative stance to support growth.
Regionalgrowthremainedresilientinthefirsthalfof2018,despiteincreasedrisks
GrowthamongdevelopingcountriesintheEastAsiaandPacific(EAP)regionwasresilientduringthefirsthalfof 2018, and the regional economy grew by 6.4 percent in Q2. While the pace of growth was marginally lower than that observed in both the second half of 2017 and in Q1 2018 (Figure I.A.1), it was broadly in line with expectations. The region remains a key driver of the global economy, accounting for about 29 percent of global growth.
However, the external environment has become less favorable in some respects (Box I.A.1). In recent months, the threat of trade measures—not just between the U.S. and China, but also between the U.S. and other major trading partners such as the European Union, Canada, and Mexico—has materialized (Box 1.A.2). In a climate of heightened trade policy uncertainty, the volume of global goods trade contracted in April for the first time since mid-2016. In addition, most nonenergy commodity prices have fallen since July as trade tensions between the U.S. and China have intensified. In addition, buoyant U.S. economic activity, including a strong labor market and rising inflation, have accelerated the planned pace of monetary policy normalization by the U.S. Federal Reserve, causing the U.S. dollar to appreciate (Box 1.A.1). The interaction of global trade tensions, a strong U.S. dollar, and tightening monetary policy across advanced economies has contributed to tighter financing condition for emerging markets and developing economies (EMDEs), while also increasing uncertainty over trade and long-term investment flows. Consequently, many EMDEs in EAP and outside the region—most notably Argentina and Turkey—have experienced sizable capital outflows, depreciating exchange rates, and falling equity prices.
Despite these emerging headwinds, indicators of real economic activity are not yet showing clear signs of slowing growth momentum in most economies. High-frequency financial market indicators (including exchange rates, bond spreads, and equity markets) highlight that the intensification of risks is already impacting regional economies. However, because most national accounts statistics are produced with a roughly three-month lag, the initial effects of escalating trade tensions and financial market volatility on GDP growth will not appear until the Q3 data are released in late 2018. Furthermore, aside from the export data, most high-frequency, forward-looking indicators—such as measures of business and investor confidence—have yet to show a definitive downturn in regional momentum (Figure I.A.2).
EAST ASIA AND PACIFIC ECONOMIC UPDATE OCTOBER 2018
2 PART I. RECEnT DEVELOPMEnTS AnD OUTLOOK

Figure I.A.1. Growth among developing EAP economies has remained resilient in 2018
Figure I.A.2. Business confidence indicators have yet to show clear signs of slowing economic momentum among developing countries in East Asia and the Pacific
GDP growth rates, percent change, y/y Manufacturing Purchasing Managers’ Index (3-month moving average)
8
7
6
5
4
3
2
1
0
Q4-
2014
Q1-
2015
Q2-
2015
Q3-
2015
Q4-
2015
Q1-
2016
Q1-
2017
Q2-
2016
Q2-
2017
Q3-
2016
Q3-
2017
Q4-
2016
Q4-
2017
Q1-
2018
Q2-
2018
55 90
54
53
80
52
70
51
60
50
50
49
40
48
30
47
20
10
46 0
Jan-
16
Apr-16
Jul-1
6
Oct-1
6
Jan-
17
Jan-
18
Apr-17
Apr-18
Jul-1
7
Jul-1
8
Oct-1
7
Aug-
18
J Developing EAP and China ▬ China ▬ Developing EAP ▬ CHN ▬ IDN ▬ MYS ▬ VNM ▬ THA ▬ 50+ expansion ▬ PHL, rhs
Sources: Haver Analytics; World Development Indicators. Sources: Haver Analytics.Note: 50+ = expansion, except in the Philippines, where the index represents the share of firms that are optimistic about the business outlook minus the share that are negative.
Box I.A.1. Recent Global Developments1
While the global economic growth rate remained robust in Q2 2018 at an estimated 3.6 percent (q/qsaar),incomingdataindicatethatbothglobaltradeandindustrialactivityhavelostmomentuminrecent months. Following a synchronized global upturn, worldwide economic activity now appears to be slowing. The deceleration is especially evident in the data for global industrial activity, manufacturing, and trade (Figure BI.A.1.1). Demand for imports is softening across advanced economies—with the notable exception of the United States—and exports from Asia are faltering. Although global demand appears to be waning, labor markets remain tight, and inflation rates are rising in many countries.
Global trade in goods is softening in a context of heightened policy uncertainty. Following strong gains at the start of the year, global goods trade stagnated for the first time in two years in Q2 2018 (Figure BI.A.1.2). The deceleration was more pronounced than had been expected, and it was broad-based across regions. This slowdown is occurring in an environment of rising trade barriers and elevated policy uncertainty. Since the beginning of the year, the United States has imposed tariffs on about US$300 billion in imports, and other countries have placed retaliatory tariffs on a comparable value of U.S. exports. China is the subject of most of the new tariffs from the Unites States, which apply to about US$250 billion in Chinese exports. Significantly larger U.S. tariffs on global automotive imports have been considered, but no measures have yet been specified. Although progress has been made in some trade negotiations, considerable uncertainty regarding the ultimate outcome of this process remains. Container shipping data indicate a recovery at the start of Q3 2018, but new export orders continued to deteriorate, suggesting softening momentum. The global Purchasing Managers’ Index (PMI) for new export orders fell from a seven-year high of 53.8 in January to 50.3 in August.
1 This box was prepared by Ekaterine Vashakmadze.
(continued)
3
NAVIGATING UNCERTAINTY
I.A. RECEnT DEVELOPMEnTS

Figure BI.A.1.1. The global Purchasing Managers’ Index: manufacturing output and new export orders
Figure BI.A.1.2. Global trade growth has decelerated
Index, 50+ = expansion, 3-month moving average Percent change, y/y
55
54
53
52
51
50
Jan-18 Feb-18 Mar-18 Apr-18 May-18 Jun-18 Jul-18 Aug-18
25
20
15
10
5
0
-5
-10
-15
-20
2006
2007
2008
2009
2010
2011
2012
2013
2014
2015
2016
2017
2018
J Manufacturing output ▬ Export orders ▬ Volume ▬ Value
Sources: Haver Analytics, World Bank.Note: (SA, 50+=Expansion). Data are 3-month moving averages. The last observation is June 2018.
Sources: World Bank.Note: Last observation is May 2018. M = month.
The growth trajectories of advanced economies are diverging. In 2018, most advanced economies have continued to grow at rates above their long-run potential (Figure BI.A.1.3). However, recent data point to a divergence between the United States, the Euro Area, and Japan. In the United States, where fiscal stimulus continues to bolster economic activity, the GDP growth rate rose to 4.2 percent (q/q saar) in Q2 2018, its fastest pace since 2014. The inflation rate stood at 2.9 percent from June through July of 2018, remaining at its highest level since February 2012. In the Euro Area, growth stabilized at 1.6 percent (q/q saar) in Q2 2018, following strong gains throughout 2017. The inflation rate eased slightly to 2 percent (y/y) in August, while the core inflation rate remained subdued at 1 percent. In Japan, a 0.9 percent contraction (q/q saar) in Q1 2018 was followed by a 1.9 percent expansion (q/q saar) in Q2 2018, supported by rebounding domestic demand.
Figure BI.A.1.3. Global economic growth rates, 2007–18 Figure BI.A.1.4. Regional economic growth rates, 2012–18
GDP growth, percent change, y/y GDP growth, percent change, y/y
8
6
4
2
0
-2
-4
2007
2008
2009
2010
2011
2012
2013
2014
2015
2016
2017
2018
f
8
6
4
2
0
-2
2014
2015
2016
2017
2018f
2014
2014
2014
2014
2014
2015
2015
2015
2015
2015
2016
2016
2016
2016
2016
2017
2017
2017
2017
2017
2018f
2018f
2018f
2018f
2018f
J World ▬ Advanced economies ▬ Emerging and developing economies J EAP J SAS J ECA J LAC J MEnA J SSA
Sources: Haver Analytics; World Bank. Notes: f = forecasts. Data for 2018 are working assumptions. The updated data and forecasts will be published in the January 2019 issue of the World Bank’s Global Economic Prospects.
Sources: Haver Analytics; World Bank. Note: f = forecasts. Data for 2018 are working assumptions. The updated data will be published in the January 2019 issue of the World Bank’s Global Economic Prospects. Lines denote long-run (1990–2017) average growth.
(continued)
(Box I.A.1 continued)
EAST ASIA AND PACIFIC ECONOMIC UPDATE OCTOBER 2018
4 PART I. RECEnT DEVELOPMEnTS AnD OUTLOOK
Among EMDEs, commodity exporters continue to experience a cyclical acceleration, but its momentum isdwindlingascommoditypriceshavelargelyflattenedandcountry-specificchallengesamongsomelarge commodity exporters have resurfaced. Growth in EMDE regions with a substantial number of commodity exporters—e.g., Latin America and Sub-Saharan Africa—is expected to pick up only moderately this year (Figure BI.A.1.4). Argentina, one of the largest EMDE commodity exporters, has experienced substantial financial market stress, resulting in a sharp currency depreciation and monetary policy tightening. A large-scale labor strike slowed economic activity in Brazil in mid-2018, and growth has remained lackluster amid heightened policy uncertainty.
Robust domestic demand continues to shore up economic activity among commodity importers, but exports have slowed significantly.Activity has remained generally strong in Asia, and growth among the region’s largest economies has accelerated. The Indian economy continues to expand, driven by an upswing in household demand and firming investment growth; however, external headwinds and tighter lending conditions present serious challenges to the country’s economic outlook. Moderating growth in the Euro Area has weakened positive trade and financial spillovers in Central and Eastern Europe. In Turkey, external and domestic headwinds have resulted in significant currency pressures and rapidly deteriorating borrowing conditions.
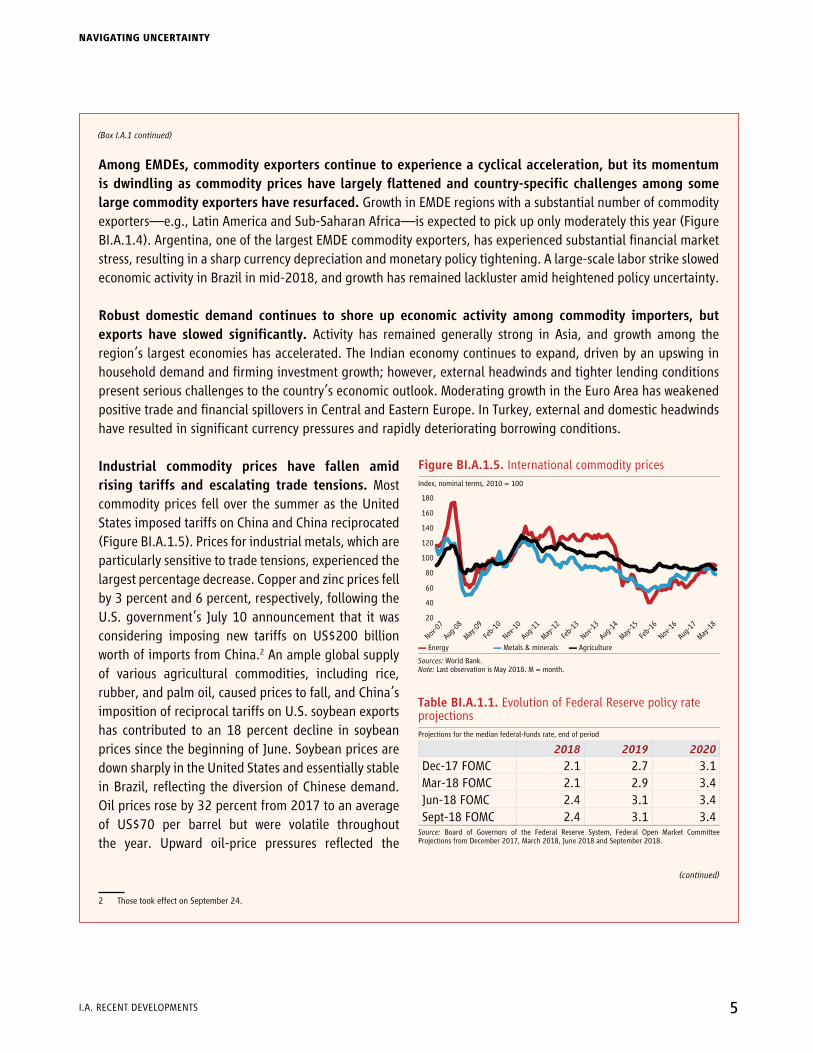
Industrial commodity prices have fallen amid rising tariffs and escalating trade tensions. Most commodity prices fell over the summer as the United States imposed tariffs on China and China reciprocated (Figure BI.A.1.5). Prices for industrial metals, which are particularly sensitive to trade tensions, experienced the largest percentage decrease. Copper and zinc prices fell by 3 percent and 6 percent, respectively, following the U.S. government’s July 10 announcement that it was considering imposing new tariffs on US$200 billion worth of imports from China.2 An ample global supply of various agricultural commodities, including rice, rubber, and palm oil, caused prices to fall, and China’s imposition of reciprocal tariffs on U.S. soybean exports has contributed to an 18 percent decline in soybean prices since the beginning of June. Soybean prices are down sharply in the United States and essentially stable in Brazil, reflecting the diversion of Chinese demand. Oil prices rose by 32 percent from 2017 to an average of US$70 per barrel but were volatile throughout the year. Upward oil-price pressures reflected the
2 Those took effect on September 24.
(Box I.A.1 continued)
(continued)
Figure BI.A.1.5. International commodity prices Index, nominal terms, 2010 = 100
180
160
140
120
100
80
60
40
20
Nov
-07
Aug-
08
May
-09
Feb-
10
Nov
-10
Nov
-13
Nov
-16
Aug-
11
Aug-
14
Aug-
17
May
-12
May
-15
May
-18
Feb-
13
Feb-
16
▬ Energy ▬ Metals & minerals ▬ Agriculture
Sources: World Bank.Note: Last observation is May 2018. M = month.
Table BI.A.1.1. Evolution of Federal Reserve policy rate projectionsProjections for the median federal-funds rate, end of period
2018 2019 2020
Dec-17 FOMC 2.1 2.7 3.1Mar-18 FOMC 2.1 2.9 3.4Jun-18 FOMC 2.4 3.1 3.4Sept-18 FOMC 2.4 3.1 3.4
Source: Board of Governors of the Federal Reserve System, Federal Open Market Committee Projections from December 2017, March 2018, June 2018 and September 2018.
5
NAVIGATING UNCERTAINTY
I.A. RECEnT DEVELOPMEnTS

Box I.A.2. Rising Trade Tensions: A Timeline1
Recent months have seen escalating threats of trade protection and the implementation of protectionist actions (Table BI.A.2.1). The U.S. administration has invoked Section 232 of the Trade Expansion Act of 1962, which allows the president to impose tariffs based on the recommendation of the U.S. Secretary of Commerce if “an article is being imported into the United States in such quantities or under such circumstances as to threaten or impair the national security.” This section of the law is rarely used, and it has not been invoked since the World Trade Organization (WTO) was established in 1995.2
Inadditiontotariffchanges,tradecomplaintshavebeenfiledwiththeWTO,butthedispute-settlementprocess may take years to complete. Between February and September 2018, 16 complaints against U.S. trade practices were filed with the WTO, and the United States submitted eight complaints against other nations during the same period. Nineteen of the 24 total complaints are related to the tariff measures outlined above, with nine
1 This box was prepared by Andrew Blackman, Vera Kehayova, and Ha Nguyen.2 The U.S. government considered invoking this provision in 1999 (regarding oil imports) and 2001 (regarding iron ore and semi-finished steel) but declined to do so. See:
U.S. Department of Commerce, 1999 and 2001.
(Box I.A.1 continued)
(continued)
continuing decline in Venezuelan production, the reintroduction of U.S. sanctions on Iran, and persistently robust demand despite rising global trade tensions.
EMDEfinancialmarketsareshowingsignsofstrain.Global borrowing costs stabilized during the summer and remain broadly favorable, even as advanced economies scale back their monetary policy accommodation. U.S. 10-year Treasury yields have hovered around 2.8–2.9 percent since mid-2018. A search for higher-yielding yet safe assets continues to bolster demand for long-term U.S. Treasuries, further compressing the U.S. yield curve despite rising inflation and the prospect of a significant increase in government borrowing. However, lending conditions have tightened in EMDEs amid concerns about reduced dollar-denominated funding. This is due in part to the U.S. Federal Reserve accelerating its planned path of interest-rate tightening over the 2018–2020 period (Table BI.A.1.1) and in part to escalating trade tensions and rising policy uncertainty.
The continued appreciation of the U.S. dollar, intensifying trade tensions, and signs of weakening global growth have renewed concerns about emerging-market vulnerabilities and have contributed to significantdepreciationsandcapitaloutflowsinanumberofEMDEs. The strain on EMDE financial markets is most acute in Turkey and Argentina, and the value of both the Turkish lira and the Argentine peso has dropped by nearly 40 percent since the start of the year. Meanwhile, other major EMDEs are exhibiting signs of increased risk aversion, especially those with relatively liquid financial markets and large current account deficits, or those that have been directly targeted by tariffs and sanctions. The renewed decline in industrial commodity prices has also negatively affected the currencies of commodity exporters.
EAST ASIA AND PACIFIC ECONOMIC UPDATE OCTOBER 2018
6 PART I. RECEnT DEVELOPMEnTS AnD OUTLOOK

focused on the tariffs on steel and aluminum products. Although the WTO’s target is for the dispute-settlement process to take one year, plus an additional three months if an appeal is made, disputes generally take much longer to resolve.3
Table BI.A.2.1. Planned and implemented changes to tariffs on trade between the U.S. and its key trading partnersA
Implementing country
Partner country Date Type of goods
by key industry Tariff amount Status
UnITED STATES ALLB Jan. 22, 2018 Solar panels and washing
machines
30% on solar panels and 20-50% on washing
machines
Implemented on Jan 22, 2018
UnITED STATES CHINA
Mar. 8, 2018 Steel and aluminum 25% on steel and 10% on aluminum
Implemented on Mar. 23, 2018
July 6, 2018
Semiconductors, chemicals, base metals, intermediate
inputs, and capital equipment
25% tariff on 818 products totaling US$34 billion in
imports
Implemented on July 6, 2018
25% tariff on 279 products totaling US$16 billion in
imports
Implemented on Aug. 23, 2018
July 10, 2018
Fruit, vegetables, fish, handbags, refrigerators,
rain jackets, baseball gloves, and other products
10% tariff on US$200 billion worth of imports,
climbing to 25% on Jan 1, 2019
Implemented on Sept. 24, 2018
CHINA UnITED STATES
Apr. 2, 2018Aluminum waste, scrap, steel pipes, fruits, pork,
and wine
Tariffs ranging from 15% to 25% on imports worth
US$3 billion
Implemented on April 2, 2018
July 6, 2018
Soybeans, seafood, pork, chicken, energy products,
medical devices, coal, cars, bicycles, and steel products
25% tariff on US$34 billion worth of imports
Implemented on July 6, 2018
25% tariff on US$16 billion; new list includes
659 items
Implemented on Aug. 23, 2018
Aug. 3, 2018
Smaller aircraft, computers and textiles, chemicals, meat, wheat, wine and
natural gas
25% tariff on imports worth US$60 billion
Implemented on Sep 24, 2018
UnITED STATES
EUROPEAn UNION June 1, 2018 Steel and aluminum 25% tariff on steel and
10% tariff on aluminumImplemented on
June 1, 2018
EUROPEAn UNION
UnITED STATES June 22, 2018
Steel and aluminum, agricultural goods, and a combination of other
products
Counter-tariffs applied to imports worth €6.4 billion
(equal to U.S. steel and aluminum tariffs), with tariffs on €2.8 billion in imports imposed
immediately
Implemented on June 22, 2018
3 In a review of 517 disputes from 1995 to 2015, Johannesson and Mavroidis (2017) find that, on average, each step in the dispute-resolution process (consultation, panel proceedings, appeals, compliance panel) took two to three times longer than the WTO target, while the implementation of negotiated or awarded resolutions took another 11.6 and 9.6 months, respectively, on average.
(continued)
(Box I.A.2 continued)
7
NAVIGATING UNCERTAINTY
I.A. RECEnT DEVELOPMEnTS

GrowthinChinaremainedresilientinthefirsthalfof2018at6.8percent,underpinnedbyfinalconsumption,while measures to support deleveraging cooled investment growth. Final consumption contributed 5.3 percentage points to GDP growth, reflecting ongoing efforts to rebalance the economy toward consumption and services. Meanwhile, the contribution of investment to GDP growth continued to diminish, falling from 2.9 percent in 2015–16 to 2.2 percent in 2017 and 2.1 percent in the first half of 2018, as the authorities continued to implement measures to slow credit growth and curb the rapid increase in corporate leverage. Despite recent downward pressure on the renminbi and equity markets, high-frequency data suggest that economic momentum remains firm, with indicators of manufacturing, construction, and services activity holding steady in recent months (Figure I.A.3).
Following a robust expansion in Q1 2018, growth among other large regional economies eased slightly in Q2 but remained solid, reflecting strong domestic demand (Figure I.A.4). Consumer confidence remained elevated through June across the ASEAn-5, as strong labor demand and healthy wage growth supported consumption
Table BI.A.2.1. Planned and implemented changes to tariffs on trade between the U.S. and its key trading partnersA
Implementing country
Partner country Date Type of goods
by key industry Tariff amount Status
EUROPEAn UNION
UnITED STATES June 22, 2018
Steel and aluminum, agricultural goods, and a combination of other
products
Pending tariffs on the remaining €3.6 billion in
imports
To be implemented
UnITED STATES CANADA June 1, 2018 Steel and aluminum 25% tariff on steel and
10% tariff on aluminumImplemented on
June 1, 2018
CANADA UnITED STATES July 1, 2018
Steel products and over 80 other products, including
toffee, maple syrup, coffee beans, and strawberry jam
Counter-tariffs applied to imports worth 16.6
billion Canadian dollars (US$12.5 billion, equal to U.S. steel and aluminum
tariffs); 25% tariff on steel products; 10% tariff
on more than 80 other products
Implemented on July 1, 2018
UnITED STATES MEXICO June 1, 2018 Steel and aluminum 25% tariff on steel and
10% tariff on aluminumImplemented on
June 1, 2018
MEXICO UnITED STATES June 6, 2018
Steel products and agricultural products,
including pork, apples, potatoes, bourbon, and
cheese
15%-25% tariffs on imports totaling US$3
billion
Implemented on June 6, 2018
UnITED STATES VIETnAMC May 21, 2018 Steel products
Import duties on Vietnamese steel
products made from steel originating in China
Implemented on May 21, 2018
UnITED STATES InDOnESIAD July 9, 2018
124 products, including textiles and agricultural
goods
Tariffs on 124 imported products Planned
Note: On June 1, the U.S. also imposed steel and aluminum tariffs on Turkey and India, with initial temporary exemptions that have since expired. Brazil and South Korea are exempt from the U.S. steel tariffs but are subject to the aluminum tariffs.A This table exclusively covers tariff changes formally proposed or implemented by national trade agencies. It includes no other trade-related actions, whether planned or implemented.B While this policy applies to all countries, the tariff on solar panels primarily affects China.C Vietnam is also subject to the U.S. tariffs on steel and aluminum imposed on March 23. However, the Vietnamese government is currently in talks with the United States to obtain an exemption.D Indonesia’s government is applying a “soft approach” to planned U.S. tariffs, which prioritizes collaboration via talks to reduce the trade deficit between the two countries.
(Box I.A.2 continued)
EAST ASIA AND PACIFIC ECONOMIC UPDATE OCTOBER 2018
8 PART I. RECEnT DEVELOPMEnTS AnD OUTLOOK

spending. However, following an exceptionally strong Q1, moderating net export growth slowed overall growth in Malaysia, the Philippines, Thailand, and Vietnam in Q2. Indonesia bucked the regional trend, with robust domestic demand pushing Q2 growth beyond expectations, as strong labor markets and stable inflation supported an increase in private consumption, while higher commodity prices boosted investment.
Meanwhile, the performance of the region’s smaller economies was also generally solid. Similar to the ASEAn-5, robust domestic demand has supported continued growth in Cambodia, Lao PDR, and Myanmar in 2018, though weakening external demand has moderated the overall economic expansion (Figure I.A.5). Lao PDR’s
growth rate remains high by regional standards, driven primarily by the buoyant performance of the power, construction, and manufacturing sectors. Mongolia’s growth rate has accelerated substantially since late 2017, as increasing investment has boosted output in the mining and construction sectors. By contrast, Papua New Guinea continues to recover from an earthquake in February, which suppressed economic activity during the first half of the year. While in Timor-Leste, the year-long political deadlock—which was finally resolved in June—continued to curb public infrastructure spending during the first half of 2018, weighing on the economy.
Export growth peaked in early 2018 before easing over the year
Export growth peaked in early 2018 amid easing, though still robust, global economic growth. In recent months, escalating trade tensions and accompanying heightened uncertainty have put further downward pressure on export volumes (Figures I.A.6 and I.A.7). In addition, the completion of technology inventory restocking has contributed to a softening of electronics exports during 2018, negatively impacting export growth in China, Malaysia, the Philippines, Thailand, and
Figure I.A.3. Monthly indicators suggest that China’s economic momentum remains strongMonthly indices
66
64
62
60
58
56
54
52
50
48
Feb-
16
Aug-
18
May
-16
Aug-
16
Nov
-16
Feb-
17
May
-17
Aug-
17
Nov
-17
Feb-
18
May
-18
▬ NBS PMI (manufacturing) ▬ NBS PMI (services) ▬ NBS PMI (construction) ▬ Caixin: composite PMI
Sources: CEIC and Wind Info.Note: 50+ = expansion. NBS refers to the Chinese National Bureau of Statistics.
Figure I.A.4. The region’s largest developing economies continued to register robust growth through Q2 2018
Figure I.A.5. Economic activity was generally solid across the region’s smaller economies
GDP growth, percent change, y/y GDP growth, percent change, y/y
8
7
6
5
4
3
2
1
0
Q4-
2014
Q1-
2015
Q2-
2015
Q3-
2015
Q4-
2015
Q1-
2016
Q1-
2017
Q2-
2016
Q2-
2017
Q3-
2016
Q3-
2017
Q4-
2016
Q4-
2017
Q1-
2018
Q2-
2018
10
8
6
4
2
0
-2
-4
2014 2015 2016 2017 2018e
▬ CHN ▬ IDN ▬ MYS ▬ PHL ▬ THA ▬ VNM ▬ KHM ▬ LAO ▬ MNG ▬ MMR ▬ PNG
Sources: Haver Analytics; World Bank World Development Indicators. Source: World Bank staff estimates.
9
NAVIGATING UNCERTAINTY
I.A. RECEnT DEVELOPMEnTS

Vietnam. The slowing growth of export volumes and values was especially acute in the Philippines, where electronics and integrated circuits make up over half of the nation’s export basket.1 Robust external demand during early 2018 was also a key source of growth for countries with large export-oriented garment and tourism sectors, including Cambodia, Thailand, and Vietnam. Sweltering summer weather in Japan and Europe increased demand for liquified natural gas, benefiting regional exporters such as Indonesia, Myanmar, and Papua New Guinea. In China, the announcement of new U.S. tariff measures caused exports to surge in June and July, as merchants rushed to fill orders before the tariffs entered into force.
Domestic demand remained robust across the region
Private consumption continued to bolster growth, underpinned by tight labor markets and rising wages (Figure I.A.8). Reflecting China’s ongoing economic rebalancing, final consumption drove growth in the first half of 2018. However, as the growth of final consumption eased slightly in Q2, evidenced by the moderating growth of retail sales, overall growth drifted down. Buoyant private consumption also underpinned growth in the ASEAn-5, particularly in Indonesia (due to strong labor markets and increased consumer activity during Islamic holidays) and Thailand (due to an upsurge in the consumption of durable goods). Rising wages have also bolstered the growth of private consumption across the region.
Investment growth in China eased in Q2 2018, as policy measures to support gradual deleveraging continued to take effect (Box I.A.3). After several quarters of slower growth, there were incipient signs of a pickup in investment
1 World Bank, 2018b.
Figure I.A.6. Growth in export values peaked in early 2018…Export-value growth rates, percent change, y/y, 12-month moving average
25
20
15
10
5
0
-5
-10
-15
-20
Jul-1
5
Oct-1
5
Jan-
16
Apr-16
Jul-1
6
Jul-1
7
Oct-1
6
Oct-1
7
Jan-
17
Jan-
18
Apr-17
Apr-18
Jul-1
8
▬ CHN ▬ IDN ▬ MYS ▬ PHL ▬ THA ▬ VNM
Sources: Haver Analytics; World Bank staff estimates.
FigureI.A.7.…as did growth in export volumesExport-volume growth rates, percent, 12-month growth rate
Panel A Panel B12
10
8
6
4
2
0
-2
-4
-6
Jan-
15
Oct-1
5
Jan-
16
Apr-16
Jul-1
6
Jul-1
7
Oct-1
6
Oct-1
7
Jan-
17
Jan-
18
Apr-17
Apr-18
Jul-1
8
Apr-15
Jul-1
5
25
20
15
10
5
0
-5
-10
Jan-
15
Oct-1
5
Jan-
16
Apr-16
Jul-1
6
Jul-1
7
Oct-1
6
Oct-1
7
Jan-
17
Jan-
18
Apr-17
Apr-18
Jul-1
8
Apr-15
Jul-1
5
▬ CHN ▬ EAP excl. China ▬ IDN ▬ THA ▬ MYS ▬ PHL
Sources: Haver Analytics; World Bank staff estimates.Note: March-July values for China are estimates.
EAST ASIA AND PACIFIC ECONOMIC UPDATE OCTOBER 2018
10 PART I. RECEnT DEVELOPMEnTS AnD OUTLOOK

in Q1 2018. However, the increase in investment was short-lived, as new regulations on shadow financing2 and a new effort to regulate debt and manage leverage reduced lending to local government financing vehicles and slowed the growth of commercial bank assets. Consequently, gross capital formation contributed slightly less to growth in Q2 2018 than it had in previous years.
Figure I.A.8. Strong domestic demand continued to underpin growthContribution of expenditure components to changes in GDP, percentage points, y/y
18
16
14
12
10
8
6
4
2
0
-2
-4
-6
-8
-10
Q1-
2016
Q1-
2017
Q3-
2016
Q3-
2017
Q1-
2018
Q2-
2018
China
Q1-
2016
Q1-
2016
Q1-
2016
Q1-
2017
Q1-
2017
Q1-
2017
Q1-
2017
Q3-
2016
Q3-
2016
Q3-
2016
Q3-
2016
Q3-
2017
Q3-
2017
Q3-
2017
Q3-
2017
Q1-
2018
Q1-
2018
Q1-
2018
Q1-
2018
Q2-
2018
Q2-
2018
Q2-
2018
Q2-
2018
Malaysia Philippines ThailandIndonesia
Q1-
2016
J Private consumption J Gross capital formation J Government consumption J Net exports J Statistical discrepancy ▬ GDP growth
Source: Haver Analytics; Thailand Office of the national Economic and Social Development Board; World Bank staff calculations.Note: For China, consumption refers to both government and private consumption.
2 See Box I.B.3 in World Bank (2017a) for a detailed discussion of shadow financing in China.
Box I.A.3. China’s Investment Slowdown1
InvestmentgrowthinChinahasweakenedsignificantlyinrecentyears.Real investment increased by just 5.0 percent in 2017, down from an annual average rate of 18 percent from 2001 to 2011 (Figure BI.A.3.1). This decline in investment has occurred in a context of slower economic growth and an economy-wide rebalancing toward household consumption. Recent efforts to reduce excess industrial capacity and limit financial risks have also contributed to lower rates of investment growth. Given these trends, as well as China’s persistently high overall investment rate, the country’s main policy challenge is not to boost investment growth but to encourage the reallocation of capital toward activities with higher returns.
Despite the slowdown, China’s economic growth rate and level of investment both remain high by international standards. During 2013–17, the annual gross capital growth rate averaged 7.0 percent, well above the average of 4.9 percent for upper-middle-income countries. Even in a region known for strong investment growth, China has outperformed many of its neighbors (Figure BI.A.3.2). Gross investment in China equaled 43 percent of its GDP in 2017—one of the highest rates in the world. In recent years, high levels of infrastructure spending in response to the global financial crisis have driven robust investment. Given China’s already well-developed public infrastructure, recent investments have yielded diminishing returns (World Bank, 2017b). Moreover, China’s investment rate is very high in other parts of the economy, including the business sector (Figure BI.A.3.3).
1 This box was prepared by Elitza Mileva and Luan Zhao.
(continued)
11
NAVIGATING UNCERTAINTY
I.A. RECEnT DEVELOPMEnTS

Figure BI.A.3.1. Real gross capital growth rate, China, 2001–2017
Figure BI.A.3.2. Average annual gross capital growth rate, China and comparators, 2012–16
Percent
30
25
20
15
10
5
0
2001
2007
2009
2011
2013
2015
2017
2003
2005
PHL
KHM
VNM
CHN
LAO
UMICs
MYS
IDN
THA
-5 0 5 10 15 20
▬ 2001–10 average ▬ 2011–17 average Percent
Source: National Bureau of Statistics; World Bank staff calculations. Source: World Development Indicators.UMICs refers to upper-middle-income countries.
Figure BI.A.3.3. Real gross fixed-capital formation by sector, 2007–2016 averagePercent of GDP
45
40
35
30
25
20
15
10
5
0
Austria
Belg
ium
Czec
h Re
p.
Den
mar
k
Esto
nia
Finl
and
Fran
ce
Germ
any
Greec
e
Hun
gary
Ireland
Isra
elIta
ly
Japa
n
Kore
a, R
ep.
Latvia
Luxe
mbo
urg
Mex
ico
Net
herla
nds
Nor
way
Poland
Portug
al
Slov
akia
Slov
enia
Spain
Swed
en
Uni
ted
King
dom
Uni
ted
Stat
es
of A
mer
ica
Chin
a*
J Business J Infrastructure J Government J Construction and real estate
Source: Herd (2018), OECD, World Bank staff calculations.Note: * Estimates for China from Herd (2018). 2007–15 data for some countries.
From a long-term perspective, the recent decrease in annual investment growth from double digits in the2000stolessthan7percentsince2015isinlinewithexpectations.The share of consumption in GDP has declined almost every year since the beginning of the reform process in 1978, falling below 50 percent in 2008. Since then, however, a gradual transition from external to domestic demand, and from investment to consumption, has gained momentum, and the share of consumption in GDP rose to 54 percent in 2016–17. In addition, new economic sectors such as software, information technology, and consumer services tend to be less capital intensive than older sectors such as manufacturing. China’s investment slowdown is therefore consistent with the rising share of consumption in GDP.
In addition to long-term trends, a weaker growth outlook and diminished investor confidence havecontributed to the investment slowdown observed since 2015. In Q3 2015, China’s quarterly GDP growth rate fell below 7 percent for the first time since the global financial crisis. The Shanghai Composite Index peaked on June 12, 2015, and by August 31 it had lost 38 percent of its value. The renminbi depreciated by 6.2 percent
(continued)
(Box I.A.3 continued)
EAST ASIA AND PACIFIC ECONOMIC UPDATE OCTOBER 2018
12 PART I. RECEnT DEVELOPMEnTS AnD OUTLOOK

against the U.S. dollar between July 31, 2015 and the end of the year. Meanwhile, the Investors’ Confidence Index declined by 18 points to 41.3 in August.
In 2015, the authorities also began reducing excess industrial capacity and tightening enforcement of environmental rules (World Bank, 2018a). The government targeted lower capacity in the steel industry, coal production, the metal and other mineral mining and processing sector, paper production, the chemical industry, and rail, ship, and aircraft equipment production. In addition, the government stepped up enforcement of environmental protections and energy-efficiency standards, curtailed access to finance in sectors with excess capacity, and closed some inefficient state-owned enterprises. Investment in most of the above-mentioned sectors has contracted since 2015 (Figure BI.A.3.4).
Starting in late 2016, the government began introducing policies aimed at slowing credit growth. A less accommodative monetary policy, new financial regulations, more comprehensive bank risk monitoring, and improvements in local government budgeting, financing, and debt management contributed to the moderation in debt growth. Total credit to the nonfinancial sector increased by 13.6 percent in 2017, down from 15.8 percent in 2016.
These policies have affected both the growth rate and the composition of investment. Fixed-asset investment in mining and mineral processing, construction, and financial services declined in 2016 and 2017. Meanwhile, fixed-asset investment experienced a less pronounced slowdown in equipment manufacturing and remained strong in skill-intensive manufacturing and service sectors such as computer and communications equipment, information technology, and software services. Finally, fixed-asset investment grew significantly in the education and healthcare sectors.
Over the past 40 years, China has made such great strides in capital deepening that its government capital stock per worker has already reached OECD levels (DRC and World Bank, 2018). The capital-output ratio for the infrastructure sector increased by 250 percent between 2000 and 2016, indicating diminishing returns to growth from new investment (Herd, 2018). However, there is still scope for rapid growth in private capital. Starting from a very low base in the 1970s, the supply of private capital in China has increased at a remarkable pace, though it remains well below OECD levels.
(Box I.A.3 continued)
Figure BI.A.3.4. nominal fixed-asset investment growth in selected sectors, 2017Percent
Computer& other electr. equipmentWater, environment & utility mgmt
Chemical fiberEducation
Health care & social workTransport, storage and postal service
Software and IT servicesAutomobile manufacturing
Scientific researchElectrical machinery & equipment
TextileGarment & apparel
Real estateFabricated metal product
Special equipmentTransport equipment
General equipmentNon metallic mineral product
Non ferrous metal smeltingMedical & pharmaceutical product
ChemicalsWholesale and retail trade
Ferrous metal smeltingMining
Financial intermediationConstruction
20 10 0 10 20
Source: National Bureau of Statistics; World Bank staff calculations.
(continued)
13
NAVIGATING UNCERTAINTY
I.A. RECEnT DEVELOPMEnTS

Investment intheothermajordevelopingEAPeconomiespickedup inthefirsthalfof2018,supported inseveral cases by large public and private infrastructure projects. In Indonesia, higher commodity prices continued to underpin solid private sector capital formation. While public investment growth moderated in Vietnam, private sector investment (both domestic and foreign) continued to surge, especially in the export-oriented manufacturing sector. In the Philippines, public spending on infrastructure and other capital outlays exceeded its programmed target during the first six months of 2018 and was 42 percent higher than during the corresponding period in 2017, as the authorities ramped up spending on transportation infrastructure. Private investment also picked up, particularly investment in capital equipment. After public investment in Thailand slowed in 2017, the authorities began to ramp up construction of a series of large infrastructure projects during the first half of 2018, particularly in the transportation sector. By contrast, Malaysia’s private investment growth softened, and public investment cooled in Q2 as the May presidential election heightened political uncertainty. In addition, the cancellation of two large Belt and Road Initiative (BRI) projects in August further depressed public investment.
Rising investment also supported growth in several of the region’s smaller economies. In Cambodia, the 2018 budget scaled up public capital spending, in part to compensate for a decline in donor-financed investment. In Lao PDR, the authorities have ramped up investment in the energy sector. In Mongolia, higher commodity prices and improved business sentiment supported strong private investment. By contrast, public investment growth has been slow in Myanmar due to ongoing challenges with budget execution and a pause in new capital spending while the government changes its fiscal year.3
Net foreign direct investment (FDI) also remainedrobust, though FDI inflows moderated somewhatfromthehighlevelsobservedin2017(Figure I.A.9). net FDI remained firm in Indonesia and the Philippines, albeit down somewhat from 2017. FDI inflows continued to surge in Vietnam, reaching a record level in Q2 2018 as an increase in state-owned enterprise (SOE) divestment contributed to rising equity inflows, which supplemented traditional greenfield FDI. Over the past two years, Thailand has registered net FDI outflows as major Thai multinationals have expanded their investments in the
3 Myanmar announced a change in the fiscal year from April–March to October–September, which will take effect on October 1, 2018. A six-month “bridge” budget was approved for April–October 2018, which includes a provision that no new capital expenditure projects will be approved during this period.
Inthiscontext,policiesthatfocusonenhancingtheallocativeefficiencyofmarkets,includingthefinancialsystem, would support continued economic growth. The government could promote the reallocation of capital toward more productive sectors and firms by strengthening market discipline, hardening budget constraints in the state sector, and improving the legal framework for resolving bad debt, thereby reducing distortions in risk pricing. A greater focus on allocative efficiency would imply that local public investment would grow at a more moderate pace in the future.
(Box I.A.3 continued)
Figure I.A.9. Robust net FDI inflows also supported the economic expansionQuarterly net FDI flows, US$ billions
8 60
6 45
4 30
2 15
0 0
-2 -15
-4 -30
-6 -45
-8 -60
Q1-
2016
Q1-
2017
Q2-
2016
Q2-
2017
Q3-
2016
Q3-
2017
Q4-
2016
Q4-
2017
Q1-
2018
Q2-
2018
▬ IDN ▬ MYS ▬ PHL ▬ THA ▬ VNM ▬ CHN, rhs
Source: Haver Analytics; CEIC; Central Bank of Malaysia; Bank of Thailand.
EAST ASIA AND PACIFIC ECONOMIC UPDATE OCTOBER 2018
14 PART I. RECEnT DEVELOPMEnTS AnD OUTLOOK

sub-region. However, a decline in outbound FDI this year turned net FDI positive in Q2. Malaysia also returned to a net FDI outflow position in Q2, as the outcome of the May election, combined with escalating trade tensions and a weakening currency, gave foreign investors pause.
CurrentaccounttrendsamongthelargerEAPeconomieshavebeenmixed,reflectinggenerallyfirmimportgrowth combined with an export slowdown in some economies (Figures I.A.10 and I.A.11). In China, import growth continued to outpace export growth. In Q1 2018, the country posted its first current account deficit in 17 years, which was followed by a second consecutive deficit in Q2. A surge in machinery and equipment imports, combined with rising outbound travel and intellectual property royalties, drove overall import growth. Indonesia’s current account deficit widened, as rising investment levels boosted imports of capital goods and higher crude oil prices increased fuel imports. In response, the government has implemented measures designed to curb imports of consumer goods, capital goods, and fuel, while taking steps to increase coal exports, in an effort to reduce the deficit and relieve pressure on the rupiah.4 In the Philippines, imports have eased from their peak in late 2017, though moderating export growth has kept the current account in deficit. Thailand’s large current account surplus makes it an outlier compared to the other large regional economies. The country’s trade surplus in goods has remained relatively flat, while slowing growth in the tourism sector has narrowed the current account surplus. In contrast to the regional trend, import growth in Malaysia has been weak, with uncertainty surrounding large public investment projects dampening demand for capital goods imports. However, export growth also stalled in Q2, narrowing the current account surplus. Among the smaller regional economies, current account deficits widened slightly in Cambodia and Mongolia but were largely financed by net FDI inflows.
Inflationisedgingup,thoughratesgenerallyremainbelowtargetlevels
Inflation has begun to rise across the region, with price pressures emerging particularly inMyanmar, thePhilippines, and Vietnam. Four key factors are driving an increase in both consumer and producer prices: (i) continued firm economic growth, which is closing output gaps; (ii) nominal depreciation, which is pushing up import prices; (ii) the pass-through effect of higher global oil and food prices;5 and (iv) rising wages. Formal-sector labor markets in the
4 These measures include: (i) imposing higher withholding taxes on 1,147 imported (mostly consumer) goods; (ii) import-substitution measures such as increasing local-content requirements for infrastructure projects and mandating the use of biodiesel in non-subsidized fuels; (iii) delaying infrastructure projects, notably in the electricity sector; and (iv) raising export quotas in the coal sector to generate up to an additional US$1.5 billion from exports.
5 However, this effect is likely waning, as most nonenergy commodity prices have fallen since July.
Figure I.A.10. Import growth has generally remained firm among the region’s major economies
Figure I.A.11. Current account developments have been mixed
Imports of goods and services, percent change, 12-month growth rate Current account balance, percent of GDP, seasonally adjusted
30
20
10
0
-10
-20
Q4-
2015
Q1-
2016
Q1-
2017
Q2-
2016
Q2-
2017
Q3-
2016
Q3-
2017
Q4-
2016
Q4-
2017
Q1-
2018
Q2-
2018
14
12
10
8
6
4
2
0
-2
-4
Q1-
2015
Q2-
2015
Q3-
2015
Q4-
2015
Q1-
2016
Q1-
2017
Q2-
2016
Q2-
2017
Q3-
2016
Q3-
2017
Q4-
2016
Q4-
2017
Q1-
2018
Q2-
2018
▬ CHN ▬ IDN ▬ MYS ▬ PHL ▬ THA ▬ VNM ▬ CHN ▬ IDN ▬ MYS ▬ PHL ▬ THA
Sources: Haver Analytics; World Bank staff calculations. Sources: Haver Analytics; Central Bank of the Philippines; World Bank staff calculations.
15
NAVIGATING UNCERTAINTY
I.A. RECEnT DEVELOPMEnTS
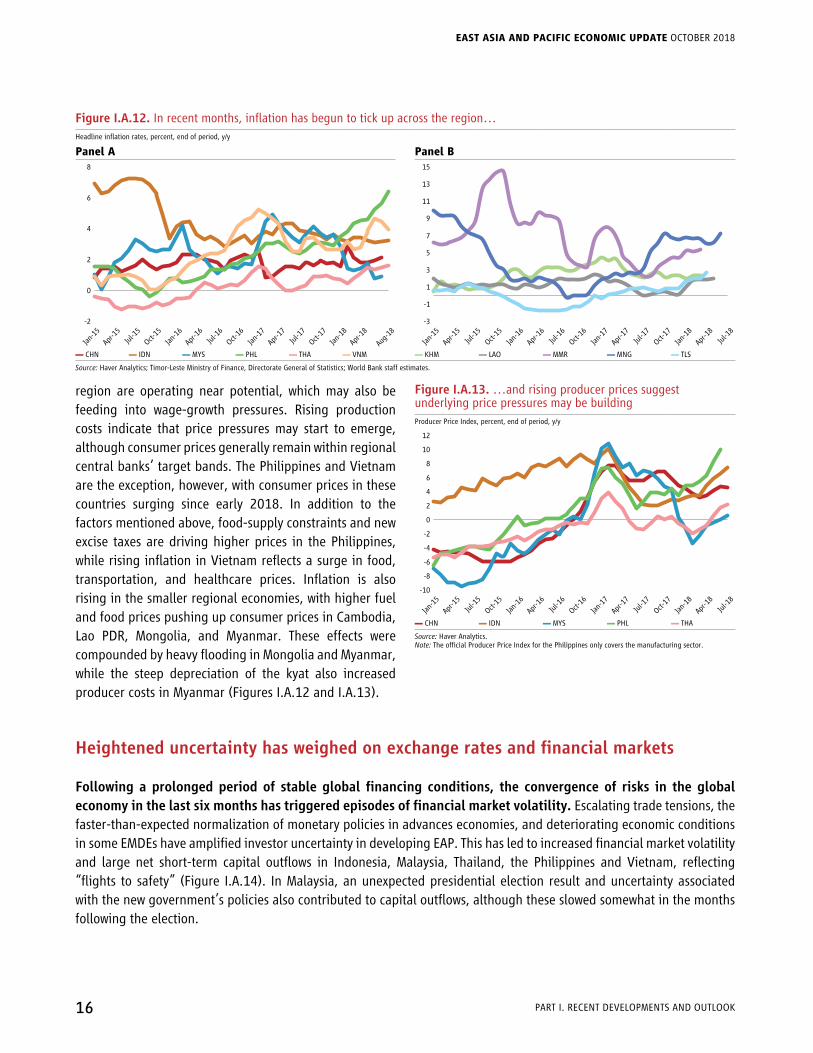
region are operating near potential, which may also be feeding into wage-growth pressures. Rising production costs indicate that price pressures may start to emerge, although consumer prices generally remain within regional central banks’ target bands. The Philippines and Vietnam are the exception, however, with consumer prices in these countries surging since early 2018. In addition to the factors mentioned above, food-supply constraints and new excise taxes are driving higher prices in the Philippines, while rising inflation in Vietnam reflects a surge in food, transportation, and healthcare prices. Inflation is also rising in the smaller regional economies, with higher fuel and food prices pushing up consumer prices in Cambodia, Lao PDR, Mongolia, and Myanmar. These effects were compounded by heavy flooding in Mongolia and Myanmar, while the steep depreciation of the kyat also increased producer costs in Myanmar (Figures I.A.12 and I.A.13).
Heighteneduncertaintyhasweighedonexchangeratesandfinancialmarkets
Followingaprolongedperiodof stableglobalfinancingconditions, the convergenceof risks in theglobaleconomyinthelastsixmonthshastriggeredepisodesoffinancialmarketvolatility.Escalating trade tensions, the faster-than-expected normalization of monetary policies in advances economies, and deteriorating economic conditions in some EMDEs have amplified investor uncertainty in developing EAP. This has led to increased financial market volatility and large net short-term capital outflows in Indonesia, Malaysia, Thailand, the Philippines and Vietnam, reflecting “flights to safety” (Figure I.A.14). In Malaysia, an unexpected presidential election result and uncertainty associated with the new government’s policies also contributed to capital outflows, although these slowed somewhat in the months following the election.
Figure I.A.12. In recent months, inflation has begun to tick up across the region…Headline inflation rates, percent, end of period, y/y
Panel A Panel B
Jan-
15
Oct-1
5
Jan-
16
Apr-16
Jul-1
6
Jul-1
7
Oct-1
6
Oct-1
7
Jan-
17
Jan-
18
Apr-17
Apr-18
Aug-
18
Apr-15
Jul-1
5
8
6
4
2
0
-2
15
13
11
9
7
5
3
1
-1
-3
Jan-
15
Oct-1
5
Jan-
16
Apr-16
Jul-1
6
Jul-1
7
Oct-1
6
Oct-1
7
Jan-
17
Jan-
18
Apr-17
Apr-18
Jul-1
8
Apr-15
Jul-1
5
▬ CHN ▬ IDN ▬ MYS ▬ PHL ▬ THA ▬ VNM ▬ KHM ▬ LAO ▬ MMR ▬ MNG ▬ TLS
Source: Haver Analytics; Timor-Leste Ministry of Finance, Directorate General of Statistics; World Bank staff estimates.
Figure I.A.13. …and rising producer prices suggest underlying price pressures may be buildingProducer Price Index, percent, end of period, y/y
Jan-
15
Oct-1
5
Jan-
16
Apr-16
Jul-1
6
Jul-1
7
Oct-1
6
Oct-1
7
Jan-
17
Jan-
18
Apr-17
Apr-18
Jul-1
8
Apr-15
Jul-1
5
12
10
8
6
4
2
0
-2
-4
-6
-10
-8
▬ CHN ▬ IDN ▬ MYS ▬ PHL ▬ THA
Source: Haver Analytics.Note: The official Producer Price Index for the Philippines only covers the manufacturing sector.
EAST ASIA AND PACIFIC ECONOMIC UPDATE OCTOBER 2018
16 PART I. RECEnT DEVELOPMEnTS AnD OUTLOOK

Bond spreads have widened across the EAP region, and bond issuances have declined. After bottoming out in early February, risk premia have been rising in several economies, including China, Indonesia, Malaysia, the Philippines, and Vietnam, as heightened uncertainty has weighed on the economic outlook and investors’ risk appetite. Nevertheless, borrowing costs remain moderate by historical standards (Figure I.A.15). EMDE bond issuances also declined in the first half of 2018, reflecting tighter financial condition and rising interest rates.
Figure I.A.14. Converging risks triggered increased stock market volatilityStock price indices, large developing economies in EAP and emerging markets worldwide, percent, 3-month moving average
Panel A Panel B
Jan-
17
0.6
0.5
0.4
0.3
0.2
0.1
0
Mar
-17
May
-17
Jul-1
7
Sep-
17
Nov
-17
Jan-
18
Mar
-18
May
-18
Jul-1
8
Sep-
18
Jan-
17
0.7
0.6
0.5
0.4
0.3
0.2
0.1
0
Mar
-17
May
-17
Jul-1
7
Sep-
17
Nov
-17
Jan-
18
Mar
-18
May
-18
Jul-1
8
Sep-
18
▬ CHN ▬ IDN ▬ MYS ▬ PHL ▬ THA ▬ VNM ▬ BRA ▬ MEX ▬ ARG ▬ TUR ▬ RUS
Source: Thomson Reuters; Datastream; International Finance Corporation Global Macro & Market Research; Haver Analytics; World Bank staff calculations.Note: The volatility in stock prices is the ratio of the absolute value of the cyclical component over the trend component of the indices. The Hodrick-Prescott filter is used to decompose the natural log of the stock price indices into cyclical and trend components. All indices are rebased to December 2015 = 100.
Figure I.A.15. External corporate and sovereign bond spreads have continued to widen as uncertainty surrounding the economic outlook has intensifiedEmerging Market Bond Index spreads, large developing economies in EAP and emerging markets worldwide, basis points
Panel A Panel B600
500
400
300
200
100
0
Dec
-15
Apr-16
Aug-
16
Dec
-16
Dec
-17
Apr-17
Apr-18
Aug-
17
Aug-
18
800
700
600
500
400
300
200
100
0
Dec
-15
Apr-16
Aug-
16
Dec
-16
Dec
-17
Apr-17
Apr-18
Aug-
17
Aug-
18
▬ CHN ▬ IDN ▬ MYS ▬ PHL ▬ VNM ▬ EM global diversified ▬ BRA ▬ RUS ▬ MEX ▬ ARG ▬ TUR
Sources: J.P. Morgan; International Finance Corporation Global Macro & Market Research.
RegionalequitymarketshavetrendeddownamidheightenedEMDEuncertaintyandgrowingconcernsaboutthe impact of escalating trade tensions on the economic outlook. After increasing steadily for more than two years, regional equity markets have reversed course since early February (Figure I.A.16). As of September 6, the Chinese stock market had declined by 30 percent in U.S.-dollar terms from its January peak, reflecting investor concerns about the country’s short-term exports and long-term growth prospects. However, declining equity markets are not limited to China. Sharp corrections have been observed across the ASEAn-5 countries as foreign investors rebalance their risk-
17
NAVIGATING UNCERTAINTY
I.A. RECEnT DEVELOPMEnTS

adjusted portfolios to reflect reassessments of economic fundamentals, changing expectations about monetary policy normalization in advanced economies, and concerns about potential EMDE contagion from outside the EAP region.
Amid capital outflows and heightened financialvolatility, major currencies in the region have depreciated against the U.S. dollar (Figure I.A.17). The Chinese renminbi has been depreciating since mid-April, shedding about 9 percent of its value against the dollar between then and early September. Indonesia, Malaysia, the Philippines, and Thailand have also seen their currencies decline despite stabilizing efforts by several of their central banks. Meanwhile, the sharp depreciation of the kyat forced the Central Bank of Myanmar to remove the trading bands in its de jure managed float regime, effectively moving to a de facto floating exchange rate regime, and authorizing trading in dollar swaps.
Asaconsequence,centralbanksinseveralcountrieshave been forced to juggle competing priorities. Faced with monetary tightening in advanced economies, central banks in developing EAP are under pressure to increase interest rates to support domestic financial markets and currencies (Figure I.A.18). The People’s Bank of China has implemented an array of monetary easing measures to support growth and calm markets amid growing headwinds. These include cash injections to the banking system to encourage investment in lower-rated corporate debt, as well as relaxed loan quotas, diminished required reserve ratios, and lower “structural” and “procyclical contribution” parameters for macro-prudential assessments of banks’ balance sheets, all of which are designed to support increased lending. Bank Indonesia has increased its policy rate by 125 basis points since May to support the rupiah and stem capital outflows, and it reactivated the sale of 9- and 12-month central bank certificates in a bid to deepen the country's money market and stabilize the currency. The central bank of the Philippines has also raised its interest rates by 100 basis points since May
Figure I.A.16. Equity markets have trended down amid heightened volatility…
Panel A. Equity market indices Panel B. Changes in equity market indices (US$) from their 2018 peaks to September 6
US$, index, end-2015 = 100 Percent
210
190
170
150
130
110
90
70
Dec
-15
Mar
-16
Jun-
16
Dec
-16
Jun-
18
Sep-
16
Mar
-17
Jun-
17
Dec
-17
Sep-
17
Mar
-18
Russia
Mexico
Malaysia
Thailand
Argentina
Brazil
Philippines
Vietnam
Turkey
Indonesia
China
-35 -30 -25 -20 -15 -10 0-5
▬ CHN ▬ IDN ▬ MYS ▬ PHL ▬ THA ▬ VNM
Sources: Thomson Reuters; Datastream; International Finance Corporation Global Macro & Market Research.
FigureI.A.17.…as have the currencies of the region’s large economiesIndex of U.S. dollar to local currency, December 2015 = 100)
120
115
110
105
100
95
90
85
Dec
-15
Apr-16
Aug-
16
Dec
-16
Dec
-17
Apr-17
Apr-18
Aug-
17
Aug-
18
▬ CHN ▬ IDN ▬ MYS ▬ PHL ▬ THA ▬ VNM
Source: Haver Analytics.Note: Decrease denotes depreciation against the U.S. dollar.
EAST ASIA AND PACIFIC ECONOMIC UPDATE OCTOBER 2018
18 PART I. RECEnT DEVELOPMEnTS AnD OUTLOOK

in response to rapid capital outflows and rising inflation, and it has cut the banking sector’s required reserve ratio by 200 basis points since March, potentially stimulating credit growth at a time when inflation is already well above its target band. By contrast, Thailand’s central bank has held interest rates flat in a context of limited capital outflows. Bank negara Malaysia has also kept its policy rate flat since January, opting instead to use open market operations to ensure sufficient liquidity to sustain the orderly functioning of money and foreign exchange markets and intermediation activity.
Nevertheless, foreign reserves remain high in most of the region’s larger economies, providing an important buffer to help manage volatile short-term capital flows.Prior to the recent bouts of volatility, the region
benefited from a sustained period of net capital inflows, which national authorities prudently utilized to accumulate large stocks of foreign reserves. In recent months, some governments have drawn down their reserves to “lean against the wind.” As of July, the U.S.-dollar value of Indonesia’s foreign reserves had fallen by 10 percent from its 2018 peak, while reserves in Malaysia, the Philippines, and Thailand were down by about 5 percent. However, foreign reserve levels generally remain high relative to both the value of goods and services imports and the stock of short-term debt, providing an important buffer against external liquidity shocks (Figure I.A.19).
Credit growth continued to decline in China but remained high or has been rising in other countries. Though declining, China’s credit growth rate remained elevated through the first half of 2018 (Figure I.A.20). While leverage in the corporate sector stabilized, and stricter enforcement of off-budget borrowing for local government projects began to show results, household debt continued to rise. The household-debt-to-GDP ratio reached 49 percent in March 2018,6
6 These estimates for household debt include “operation” loans, which are intended for business-operation purposes. If operation loans are excluded, the household-debt-to-GDP ratio would be 11 percentage points lower in March 2018.
Figure I.A.18. Spreads with the U.S. Federal Reserve’s federal funds rate have narrowed as developing EAP central banks have maintained accommodative monetary policies to support growthDifference between the policy rate and the U.S. federal funds rate, percentage points
8
7
6
5
4
3
2
1
0
-1
Jan-
15
May
-15
Sep-
15
Sep-
18
Jan-
16
Jan-
17
May
-16
May
-17
Sep-
16
Sep-
17
Jan-
18
May
-18
▬ CHN ▬ IDN ▬ MYS ▬ PHL ▬ THA ▬ VNM
Sources: Haver Analytics; CEIC; World Bank staff calculations.
Figure I.A.19. Despite recent reductions, foreign reserves remain ample across the region’s major economies
International reserves Panel A Panel BIn months of imports As a percentage of external short-term debt
20
18
16
14
12
10
8
6
4
2
0
China Thailand Philippines Indonesia Malaysia
700
600
500
400
300
200
100
0
China Thailand Philippines Indonesia Malaysia
J Q1-2017 J Q2-2017 J Q3-2017 J Q4-2017 J Q1-2018 J Q2-2018 J Q1-2017 J Q2-2017 J Q3-2017 J Q4-2017 J Q1-2018 J Q2-2018
Source: Haver Analytics; World Bank staff calculations.
19
NAVIGATING UNCERTAINTY
I.A. RECEnT DEVELOPMEnTS

driven by a significant increase in mortgage and consumer loans (Figure I.A.21). Household leverage also remained high in Malaysia at 84 percent and in Thailand at 78 percent. Credit growth in Malaysia, Thailand, and Indonesia picked up slightly in the first half of the year, though the latter remains below Bank Indonesia’s target credit growth rate of 10–12 percent, which could indicate that firms are unable to obtain sufficient capital to finance planned investments. Rapid credit growth remains a concern in the Philippines and Vietnam.
Fiscal space in many regional economies is shrinking as governments adopt accommodativefiscalpoliciestosupportgrowth
Despite a planned fiscal consolidation, the Chineseauthorities have responded to global economic headwindsbyadoptinganumberoffiscalmeasurestosupport growth. In July, China’s State Council announced that the government would implement “preemptive policy fine-tuning” to support domestic demand in an increasingly uncertain external environment. To support investment growth, the authorities have eased restrictions on local government financing vehicles and pledged to expand local government special-purpose bond issuances in the second half of the year. In addition, a series of tax
incentives has been announced, including a lower value-added tax (VAT) rate in some sectors, as well as higher thresholds for VAT and income tax for small- and medium-sized enterprises (SMEs) and larger tax deductions for investments in new equipment and research and development.7
7 The government estimates that these policies will reduce the corporate tax burden by about 0.5 percent of GDP in 2018.
Figure I.A.20. In most countries, credit growth rates either remain high or have recently increasedReal growth in net domestic credit, percent, y/y
Panel A Panel B22
20
18
16
14
12
10
8
6
4
2
0
Jan-
14
Apr-14
Jul-1
4
Oct-1
4
Jan-
15
Jan-
16
Jan-
17
Jan-
18
Apr-15
Apr-16
Apr-17
Apr-18
Jul-1
5
Jul-1
6
Jul-1
7
Jul-1
8
Oct-1
5
Oct-1
6
Oct-1
7
35
30
25
20
15
10
5
-5
0
Jan-
14
May
-14
Sep-
14
Jan-
15
Jan-
16
Jan-
17
Jan-
18
May
-15
May
-16
May
-17
May
-18
Sep-
15
Sep-
16
Sep-
17
▬ CHN ▬ IDN ▬ MYS ▬ PHL ▬ THA ▬ VNM ▬ KHM ▬ LAO ▬ TLS
Sources: Haver Analytics; CEIC; World Bank staff estimates.Note: nominal growth in domestic credit is deflated by the Consumer Price Index. Data for Vietnam refer to total credit, data for Cambodia refer to net credit to the private sector, and data for Timor-Leste refer to private sector credit.
Figure I.A.21. The stock of private sector debt remains high but stable in China and MalaysiaCredit by sector, percent of GDP
China
2010
300
250
200
150
100
50
0
2015
2016
2017
Malaysia Vietnam Thailand Philippines IndonesiaEmergingeconomies
2010
2010
2010
2010
2010
2010
2015
2015
2015
2015
2015
2015
2016
2016
2016
2016
2016
2016
2017
2017
2017
2017
2017
2017
J Credit to general government J Credit to households J Credit to nonfinancial corporations
Sources: Bank for International Settlements; Central Bank of the Philippines; IMF International Financial Statistics.Note: For the Philippines and Vietnam, disaggregated data on credit to households and nonfinancial corporations are not available. The group “emerging economies” comprises the following countries for which data are available: Argentina, Brazil, Chile, India, Mexico, Russia, South Africa, and Turkey.
EAST ASIA AND PACIFIC ECONOMIC UPDATE OCTOBER 2018
20 PART I. RECEnT DEVELOPMEnTS AnD OUTLOOK

Strong revenueperformance in thefirsthalf of the yearhashelped tofinanceadditionalpublic spendingin Indonesia, the Philippines, and Thailand. In Indonesia, fiscal revenue reached a 10-year high in the first four months of 2018, driven by robust non-oil-and-gas income tax and VAT. However, some of this additional revenue has already been used to finance increased subsidy spending to cushion the impact of higher global commodity prices on households and increased transfers to subnational governments. In the Philippines, the successful implementation of the first phase of the Tax Reform for Acceleration and Inclusion (TRAIn) initiative in January 2018 has caused revenues to outperform budget projections, creating space to help finance increased infrastructure spending. In Thailand, stronger-than-expected domestic economic activity and a substantial increase in indirect taxes have also caused revenue collection to outperform budget targets, opening additional fiscal space to accommodate the 15 percent increase in infrastructure spending necessary to finance the 2016–18 Transport Action Plan. In Malaysia, the elimination of the Goods and Services Tax and the reintroduction of the Sales and Services Tax will diminish tax revenue in 2018,8 while the adjustment to a new fuel pricing mechanism could increase fuel subsidies. However, solid economic growth and an average oil export price that exceeds the 2018 budget assumption should enable the government to achieve its 2018 fiscal deficit target of 2.8 percent of GDP. By contrast, relatively weak revenue performance in Vietnam in the first half of 2018 has necessitated expenditure restraint as concerns about debt sustainability continue to drive fiscal consolidation.
Figure I.A.22. Fiscal deficits have generally remained containedGeneral government fiscal balance, percent of GDP
Panel A Panel B 0
-1
-2
-3
-4
-5
-6
-7
-8
2013 2014 2015 2016 2017
0 0
-1 -2
-2 -4
-3 -6
-4 -8
-5 -10
-6 -12
-7 -14
-8 -16
2013 2014 2015 2016 2017
▬ CHN ▬ IDN ▬ MYS ▬ PHL ▬ THA ▬ VNM ▬ KHM ▬ FJI ▬ LAO ▬ MMR ▬ MNG, rhs
Source: World Bank staff estimates.Note: These data refer to general government fiscal balances in all countries except Indonesia, where the data refer to the central government fiscal balance; fiscal deficits do not reflect off-budget expenditures.
FiscaldeficitshavebeenmixedacrossthesmallereconomiesofdevelopingEAP(Figure I.A.22). Domestic pressures and concerns around debt sustainability have prompted fiscal consolidation in Fiji, Mongolia, Papua new Guinea, and the Solomon Islands, while infrastructure investments in Samoa and Tonga and the election cycle in Cambodia have boosted public spending. In Lao PDR, large and persistent fiscal deficits have intensified debt vulnerabilities. In Myanmar and Papua new Guinea, there is evidence of continued central bank financing of the fiscal deficit, which could increase inflation.
8 The Goods and Services Tax constituted an average of 19.8 percent of total federal government revenue between 2016 and 2017, while the Sales and Services Tax contributed only 7.5 percent of revenue between 2010 and 2014.
21
NAVIGATING UNCERTAINTY
I.A. RECEnT DEVELOPMEnTS

Despiterisingrevenues,Pacificislandcountriescontinuetofaceariskofdebtdistress, as well as the persistent threat of natural disasters
TwofactorscontinuetodrivegrowthamongthePacificislandcountries(PICs):post-disasterreconstructionanddonor-funded projects. The Pacific is one of the world’s most disaster-prone regions, and the PICs are highly vulnerable to storms, earthquakes, volcanic activity, floods, droughts, and landslides.9 Natural disasters often have devastating economic impacts; they can reduce annual GDP by more than 10 percent,10 and the affected country can take years to fully recover. Consequently, rather than being underpinned by a business cycle, growth among the PICs is often driven by a “natural-disaster cycle.” This cycle begins when a natural disaster strikes, causing widespread damage and economic losses that precipitate a sharp economic downturn, which is followed by a gradual process of reconstruction and recovery that boosts growth over the following two to five years, depending on the severity of the disaster. For example, current growth trends and fiscal pressures in Vanuatu, Fiji, and Tonga are directly related to their ongoing reconstruction and recovery efforts following major disasters that occurred in 2015, 2016, and February 2018. The second key driver of growth in PICs is donor-funded infrastructure projects. This “aid cycle” is most evident in the north Pacific nations: the Federated States of Micronesia (FSM), the Republic of the Marshall Islands (RMI), and Palau. Each has entered into a Compact of Free Association with the United States, under which the U.S. government provides annual grants focused on infrastructure, education, and health services in exchange for full international defense authority and responsibilities. Periods of weak and strong growth in these countries generally reflect delays or accelerations in Compact spending. The “aid cycle” is also evident in the other PICs,11 and an increase in multilateral donor activity is currently driving growth in the Solomon Islands and Tuvalu.
RisingrevenueshaveimprovedthefiscalpositionsofmanyPICs.The Vessel Day Scheme (a regional agreement that establishes the minimum price of a vessel day and limits the total number of vessel days sold) and favorable weather conditions (which influence the migratory patterns of fish stocks) continue to bolster revenues from fishing-license fees in FSM, Kiribati, Nauru, and RMI. Improvements in tax administration and compliance are also supporting revenue growth in Samoa, Tonga, Vanuatu, and Palau. While the tax-to-GDP ratio remains low among the PICs in general, these countries have made good progress in boosting revenue in recent years.
PICs have strengthened debt management, but the risk of debt distress remains elevated due to structural factors. While levels of external indebtedness are low to moderate among the PICs,12 recent IMF-World Bank debt sustainability analyses (DSAs) indicate a high risk of debt distress in many of these countries (Figure I.A.23). A high risk of debt distress and low-to-moderate levels of indebtedness are not inconsistent among small island economies, as the level of risk also reflects their
9 Based on estimated annualized expected losses (as a share of GDP) due to natural disasters, eight of the PICs are among the top 30 most disaster-prone countries in the world (World Bank, 2012).
10 For example, in 2015, 2016, and 2018, Tropical Cyclones Pam, Winston, and Gita caused damages and losses equivalent to around 64 percent, 20 percent, and 38 percent of GDP in Vanuatu, Fiji, and Tonga, respectively.
11 See Duncan (2016) for further details on the aid cycle among PICs.12 In present-value terms, public and publicly guaranteed external debt averages 27.3 percent of GDP across the nine PICs, ranging from 6.8 percent in the Solomon Islands to
43.7 percent in Vanuatu.
Figure I.A.23. The risk of external debt distress among Pacific island countries remains elevated
Pacific island countries by risk of debt distressNumber of PICs
9
8
7
6
5
4
3
2
1
0
2006
2007
2008
2009
2010
2011
2012
2013
2014
2015
2016
2017
2018
2 2 2 2 2 3 2 2 2
1
0 0 0
0
3
4
0
3
4
0
3
4
1
2
4
1
2
4
1
2
3
2
2
3
2
2
3
2
3
2
4
4
0
5
4
0
3
6
0
3
6
0
J Low J Moderate J High J No DSA
Source: IMF-World Bank Debt Sustinability Analyses, multiple countries and years.
EAST ASIA AND PACIFIC ECONOMIC UPDATE OCTOBER 2018
22 PART I. RECEnT DEVELOPMEnTS AnD OUTLOOK

very limited debt-service capacity due to low GDP and export growth rates, relatively undiversified economic structures, and exposure to frequent and intense natural disasters. An improvement in the DSA methodology that incorporates the effects of natural disasters into the baseline forecasts both provides a more realistic outlook for the likely path of these economies and has contributed to some of the downgrades in their debt distress ratings by lowering growth estimates and increasing fiscal expenditure estimates. In response to concerns regarding debt sustainability, many PICs have strengthened their debt policies and debt management systems and refrained from taking on new non-concessional loans. For example, Fiji, Samoa, the Solomon Islands, Tonga and Vanuatu have adopted ceilings on external borrowing, concessionality requirements, and/or fiscal rules.
Poverty rates have continued to fall across the EAP region
Solid growth has continued to support poverty reduction. Extreme poverty (based on the international poverty line of US$1.90/day in 2011 PPP terms) is now below 2 percent of the region’s population including China, and 4.4 percent excluding China. While eliminating extreme poverty remains a central goal, since 2017 the World Bank has also reported poverty rates for all countries using two complementary poverty lines, which may be more relevant in countries where extreme poverty has been mostly eradicated. These two additional lines are the lower-middle-income class (LMIC) poverty line of US$3.20/day PPP and the upper-middle-income class (UMIC) poverty line of US$5.50/day PPP. The values of the LMIC and UMIC poverty lines are derived from the median of the national poverty lines in lower- and upper-middle income countries, respectively, though all three lines are reported for all countries. At the LMIC poverty line, regional poverty rates are 9.4 percent including China and 19.6 percent excluding China. At the UMIC poverty line, the rates are 28.8 percent including China and 44.2 percent excluding China (Figure I.A.24).13 Across all three measures, poverty has consistently trended down over recent years, as solid growth has helped lift the poorest in each country.
Figure I.A.24. Poverty rates have continued to decline across the region
Aggregate poverty rates and total poor populations in developing countries in East Asia and the Pacific under various poverty lines, including and excluding ChinaPanel A. Developing EAP Panel B. Developing EAP excluding ChinaPoverty rate, percent Poverty rate, percent
60
50
40
30
20
10
0
2012 2013 2014 2015 2016 2017
139
69 58 45 40 35
455
942
338
828
294
757
243
690
222
644
192
588
60
50
40
30
20
10
0
2012 2013 2014 2015 2016 2017
5144 39 35 32 29
183
344
174
334
165
327
148
317
141
303
128
290
Sources: World Bank East Asia and Pacific Team for Statistical Development; PovCalnet.Note: The three rows of bubbles present poverty figures based on the international poverty line (US$1.90 per day), the LMIC poverty line (US$3.20 per day), and the UMIC poverty line (US$5.50 per day, all in 2011 PPP terms). The x-axis shows the percentage of the population below the poverty line, while the bubbles indicate the number of poor people in millions.
13 See World Bank (forthcoming-a) for more details on these measures and a rich discussion of poverty and shared prosperity.
23
NAVIGATING UNCERTAINTY
I.A. RECEnT DEVELOPMEnTS

However,substantialvariationsinsubnationalpovertyratesrevealsignificantregionaldifferencesinwellbeing.For example, in the Philippines, the 2015 poverty rate at the LMIC poverty line ranged from just 6.1 percent in the greater Manila region to 65.2 percent in Mindanao. Nonmonetary indicators of poverty and living standards shed further light on geographic disparities in household wellbeing. While rates of improved drinking water and sanitation access are generally high in EAP, some areas remain severely underserved. For example, over 40 percent of the population in coastal Myanmar lacks access to either electricity or improved drinking water sources.
EAST ASIA AND PACIFIC ECONOMIC UPDATE OCTOBER 2018
24 PART I. RECEnT DEVELOPMEnTS AnD OUTLOOK

I.B. Outlook and Risks
The growth outlook for the region remains solid under the baseline scenario, albeit slightly less favorable than it was six months ago. Strong domestic demand will continue to drive growth in most economies, which will partially offset slowing exports. China’s growth will continue to slow gradually in 2018–2020, in line with its continued economic rebalancing, while ongoing trade tensions with the United States will not significantly affect growth under the baseline assumptions, which include the accommodative domestic policy response. Regional GDP growth excluding China is also expected to slow slightly in 2018–2020, due largely to a moderate deceleration in Malaysia. Continued growth is expected to yield further gains in poverty reduction across the region. However, the level of uncertainty around these growth forecasts is higher than in the past. Escalating protectionist measures, especially between China and the United States, could have serious adverse implications for regional growth. In addition, financial contagion from other emerging markets and/or a sudden change in the expected pace of U.S. monetary policy normalization could lead to an abrupt tightening of financial market conditions, heightened volatility, and the further depreciation of regional currencies.
Growth is expected to moderate slightly but remain generally strong across the region
Under the baseline scenario, the aggregate growth rate for developing EAP is projected to ease slightly from 6.6percentin2017to6.3percentin2018and6.0percentin2019and2020(Table I.B.1). The growth estimates for 2018 and 2020 remain unchanged from those published in the April 2018 edition of the East Asia and Pacific Economic Update, while the outlook for 2019 has been revised downward by 0.1 percentage points. Projections for net exports have been revised downward for both 2018 and 2019 due to a slightly weaker outlook for external demand, combined with disruptions in trade flows as regional value chains are adapted and/or rerouted in response to higher tariffs on some Chinese exports to the United States. However, these downward pressures on growth have been offset by the stronger-than-expected performance of Cambodia, Indonesia, Mongolia, Thailand, and Vietnam during the first half of 2018, as well as the accommodative policy response in China.
Table I.B.1. GDP growth projections for developing EAP remain generally solid
ForecastChange from
April 2018 Updatea
(percentage points)2016 2017 2018 2019 2020 2018 2019 2020
Developing EAP 6.4 6.6 6.3 6.0 6.0 0.0 -0.1 0.0China 6.7 6.9 6.5 6.2 6.2 0.0 -0.1 0.0
Developing EAP excl. China 4.9 5.4 5.3 5.3 5.3 -0.1 0.0 0.0Developing ASEAn 5.0 5.4 5.4 5.3 5.3 0.0 -0.1 -0.1
Indonesia 5.0 5.1 5.2 5.2 5.3 -0.1 -0.1 -0.1Malaysia 4.2 5.9 4.9 4.7 4.6 -0.5 -0.4 -0.2Philippines 6.9 6.7 6.5 6.7 6.6 -0.2 0.0 0.0Thailand 3.2 3.9 4.5 3.9 3.9 0.4 0.1 0.1
25
NAVIGATING UNCERTAINTY
I.B. OUTLOOK AND RISKS

Table I.B.1. GDP growth projections for developing EAP remain generally solid
ForecastChange from
April 2018 Updatea
(percentage points)2016 2017 2018 2019 2020 2018 2019 2020
Vietnam 6.2 6.8 6.8 6.6 6.5 0.3 0.1 0.0Cambodia 7.0 6.9 7.0 6.8 6.8 0.1 0.1 0.2Lao PDR 7.0 6.9 6.7 6.9 6.9 0.1 0.0 0.0Myanmar 5.9 6.4 6.2 6.5 6.8 -0.5 -0.4 -0.3Mongolia 1.4 5.4 5.9 6.6 6.3 0.6 0.2 -0.2Fiji 0.4 3.8 3.5 3.4 3.3 0.0 0.0 0.0Papua New Guinea 1.6 2.5 -1.6 3.5 3.1 -4.1 0.8 0.2Solomon Islands 3.5 3.5 3.4 2.9 2.8 0.4 0.0 0.0Timor-Lesteb 5.3 -4.7 0.8 3.3 4.9 -1.4 -0.9 0.9
The external environment
World 2.5 3.0 3.0 2.9 2.8 -0.2 -0.2 -0.1Advanced economies 1.7 2.3 2.2 2.0 1.6 -0.1 0.0 -0.1Emerging and developing economies 3.7 4.3 4.2 4.3 4.6 -0.4 -0.4 -0.1Crude oil (spot, US$/barrel) 43 53 71 73 71 11 12 9Non-energy commodities (index, 2010=100) 79 84 86 85 86 0 -2 -1Food (index, 2010=100) 89 90 92 93 94 0 0 0
Source: World Bank data and staff estimates.Notes: a. World Bank East Asia and Pacific Economic Update, April 2018 (World Bank 2018a). b. Nonoil GDP. c. Global growth and commodity price forecasts represent preliminary working assumptions. Myanmar data are fiscal year growth rates (2017 = FY2017/18). Changes from April 2018 are calculated with one-decimal-point-precision and rounded to one decimal point.
Global economic conditions are expected to moderate but remain broadly supportive of growth. Under the baseline scenario, the global growth rate is expected to remain firm at 3.0 percent in 2018 before slowing slightly to 2.9 percent in 2019 and 2.8 percent in 2020 (Box I.B.1). The growth rate of global goods and services trade is expected to decline from 4.8 percent in 2017 to 4.3 percent in 2018, then fall to less than 4 percent by 2020. Due to the prospect of faster monetary policy normalization in major advanced economies, financing conditions in emerging markets are expected to tighten more rapidly over the forecast horizon than previously anticipated. Oil price forecasts have been revised upwards since the April 2018 edition, while projections for nonenergy commodity prices have been revised down slightly but are expected to remain broadly stable over the forecast period.
China’s growth rate is projected to modestly decelerate as its economic rebalancing continues, and recently announced U.S. tariff measures are expected to have a measurable impact on growth. Despite rising headwinds, the 2018 growth projection for China remains unchanged from April 2018, as recent monetary and fiscal policy measures to support domestic demand are expected to offset the negative impact of higher U.S. tariffs on export volumes. Under the baseline scenario, China’s growth rate is forecast to moderate to 6.5 percent in 2018 and 6.2 percent in 2019 and 2020 as the economy continues to shift from investment-led to consumption- and services-led growth. The baseline scenario assumes that the authorities will continue implementing reforms to address excess industrial capacity, improve environmental sustainability, and reduce the macroeconomic vulnerabilities that have accumulated in recent years.
Growth among the ASEAN-5 countries is expected to remain generally robust. The direct contractionary effects on ASEAn-5 growth due to the recently-implemented U.S. tariffs are expected to be small.14 However, the cyclical moderation of global demand is expected to reduce the positive contribution of net exports to growth over the projection
14 While exposure to slowing demand for Chinese final exports varies by country due to differences in export composition, the spillover effects on income and value added in developing EAP (excluding China) are expected to be modest (Freund et al., 2018; see also Box I.B.4).
EAST ASIA AND PACIFIC ECONOMIC UPDATE OCTOBER 2018
26 PART I. RECEnT DEVELOPMEnTS AnD OUTLOOK

Box I.B.1. Global Outlook and Risks1
Afterreaching3percentinboth2017and2018,theglobaleconomicgrowthrateisexpectedtoslowover the next two years. During this period, global slack should gradually dissipate as major central banks phase out their policy accommodation and the cyclical upturn among commodity exporters matures (Figure BI.B.1.1). Following a broad-based recovery in 2017, growth in advanced economies is projected to tick down to 2.2 percent in 2018, then moderate to an average of 1.8 percent in 2019–2020 as labor markets tighten and monetary-policy accommodation is gradually unwound. Over the forecast horizon, advanced economies are expected to move closer to their relatively modest long-run potential growth rates, which remain constrained by aging populations and weak productivity trends.
Figure BI.B.1.1. Aggregate GDP growth rates, estimated and projected
Figure BI.B.1.2. Regional GDP growth rates, estimated and projected
Percent Percent
8
6
4
2
0
-2
-4
2007
2008
2009
2010
2011
2016
2017
2018
f
2019
f
2020
f
–201
5
8
6
4
2
0
-2
2015
2016
2017
2018f
2019f
2020f
2015
2016
2017
2018f
2019f
2020f
2015
2016
2017
2018f
2019f
2020f
2015
2016
2017
2018f
2019f
2020f
2015
2016
2017
2018f
2019f
2019f
2020f
2020f
2015
2016
2017
2018f
J World ▬ Advanced economies ▬ Emerging and developing economies J EAP J SAS J ECA J LAC J MEnA J SSA
Source: World Bank. Note: F = forecast; updated forecasts will be published in the January 2019 issue of the World Bank report, Global Economic Prospects.
Source: World Bank.Note: Lines denote long-run (1990–2017) average growth rates. f=forecast; updated forecasts will be published in the January 2019 issue of the World Bank report, Global Economic Prospects.
Growth among EMDEs is expected to remain broadly unchanged in 2018 and 2019 before firmingslightly to 4.6 percent in 2020. The aggregate EMDE growth rate is expected to remain relatively stable at about 4.3 percent in 2018 and 2019, then accelerate to 4.6 percent in 2020 (Figure BI.B.1.2). This trend primarily reflects the moderating pace of cyclical acceleration among commodity exporters, whose growth rates are forecast to rise to 1.9 percent in 2018 and average 2.6 percent over 2019–2020 as commodity prices flatten and financing conditions tighten. negative output gaps among commodity exporters are expected to narrow more gradually than earlier projections indicated, assuming oil and other commodity prices remain broadly stable over the forecast period.
The aggregate growth rate among commodity importers is projected to fall to 5.8 percent in 2018 and 5.6 percent in 2019. A moderate acceleration among other large commodity importers is expected to partially offset China’s ongoing structural slowdown. Economic activity is forecast to remain robust in EMDE regions with large numbers of commodity importers, including South Asia, East Asia, and the Pacific, though support from exports is expected to diminish.
1 This box was prepared by Ekaterine Vashakmadze.
(continued)
27
NAVIGATING UNCERTAINTY
I.B. OUTLOOK AND RISKS

WhilegrowthratesamongEMDEsareprojectedtofirmupovertheforecasthorizon,long-termdriversofEMDEgrowthareexpectedtocontinueweakeningduringthecomingdecade,unlesssignificantpolicychanges effectively boost potential growth rates. EMDEs face a subdued pace of capital accumulation, slowing productivity growth, and maturing demographic transitions.2 While demographic trends will continue to support growth in South Asia, aging populations and rising dependency ratios are expected to weaken growth in East Asia and the Pacific (e.g., China and Thailand) and Europe and Central Asia (e.g., Poland and Russia).
Global economic conditions are expected to become less supportive of growth over the forecast period. Global trade activity accelerated sharply in 2017, driven by a cyclical upturn in worldwide manufacturing. However, trade growth is expected to moderate over the forecast horizon due to easing global investment growth, ongoing policy uncertainty, and higher tariffs. If all threatened tariff measures were to be implemented, the average U.S. tariff rate would rise to levels not seen in the past 50 years. New tariffs are likely to depress bilateral trade, weaken global supply chains, and increase trade diversion. Overall, the growth of global trade in goods and services is expected to moderate from 4.8 percent in 2017 to 4.3 percent in 2018 before slowing further to about 3.8 percent by 2020.
Global interest rates are expected to rise. As global interest rates continue to increase, EMDEs could face more challenging external financing conditions in 2019, leading to the further deceleration of inbound capital flows. Investors are also likely to increasingly discriminate between countries based on their exposure to rising interest rates and currency pressures. Borrowing costs for EMDEs are expected to rise as the U.S. dollar continues to appreciate, intensifying trade tensions, signaling weakening global growth, and perpetuating investor concerns about emerging-market vulnerabilities. Rising interest rates will have the strongest impact on countries with relatively liquid financial markets, large current account deficits, and/or economic ties to distressed economies, as well as those that have been directly targeted by tariffs and sanctions. A renewed decline in industrial commodity prices is expected to have negative implications for the currencies of commodity exporters, which have already been adversely affected by the protracted downturn in global commodity prices.
OilpricesareexpectedtodeclineslightlytoanaverageofUS$72perbarrelin2019and2020,broadlyin line with previous projections. Increased supply from the United States is expected to accompany the anticipated rise in global demand. However, upside price risks remain high given low levels of excess capacity
2 For more on trends in EMDE growth drivers, see the January 2018 edition of Global Economic Prospects.
(Box I.B.1 continued)
Figure BI.B.1.3. World commodity price forecastsNominal US$, 2010 = 100
130
110
90
70
50
30
10
1980
1995
2000
2005
2010
2015
2020
1985
1990
▬ Energy ▬ Metals ▬ Agriculture
Source: World Bank.
(continued)
EAST ASIA AND PACIFIC ECONOMIC UPDATE OCTOBER 2018
28 PART I. RECEnT DEVELOPMEnTS AnD OUTLOOK

period. Consequently, robust private consumption will remain the key driver of growth among the ASEAn-5 economies, supported by a generally robust outlook for investment across the region. Growth is expected to remain robust in Thailand and Vietnam in 2018 before drifting down in 2019 and 2020 as stronger domestic demand only partially offsets the moderation in net export growth. Weaker-than-expected economic activity in the first half of 2018 has dragged down the annual growth forecast for the Philippines, although the expected increase in public investment will boost growth over the medium term. Malaysia’s growth profile has been revised downward from previous forecasts due to moderating global demand and the cancellation of two major BRI-related projects. Indonesia’s economic outlook has also been revised down marginally due to weaker external demand, though the growth rate is still expected to increase slightly over the projection period relative to recent years.
Theeconomicprospectsofseveraloftheregion’ssmallereconomiesremainrobust,reflectingsoliddomesticdemand over the medium term. The growth outlook remains strong for Cambodia, Lao PDR, Mongolia, and Myanmar, with growth rates in each country projected to average over 6 percent per year during 2018–2020. Economic momentum is expected to remain strong in Cambodia in 2018, underpinned by upbeat investor sentiment and rising government spending, though moderating global growth is expected to lead to slightly slower domestic growth in 2019 and 2020. After a brief slowdown in 2018, growth in Myanmar is expected to recover toward its long-run potential in 2019 and 2020, though the recent sharp depreciation of the kyat has clouded the outlook for import-dependent sectors such as construction and transportation and could affect commercial banks with significant loan exposure to those sectors. Mongolia’s growth rate is forecast to accelerate, driven by increasing investment and exports related to the mining
and ongoing uncertainty about Venezuelan production. Metal prices are expected to decline slightly in 2019 in a context of subdued demand, particularly from China, and remain broadly stable in 2020. Agricultural prices are projected to firm up, albeit insignificantly, in 2019 and 2020.
Riskstotheglobalgrowthoutlookhaveintensified,reflectingrisingtradetensionsandstrainedfinancialmarkets in several EMDEs. In addition, the recent drop in prices for industrial metals and other commodities, which was driven in part by the imposition of extensive U.S. tariffs on China and reciprocal Chinese tariffs on the United States, implies rising downside risks for commodity exporters. Domestic and external vulnerabilities among EMDEs could amplify the impact of shocks or limit policy options to respond to financial stress in more exposed economies. The main risks include the possibility of financial market disruptions and/or escalating trade protectionism in a climate of elevated policy uncertainty. The impact of abruptly tightening global financing conditions could be particularly severe in an environment marked by record debt levels, mounting refinancing needs, and deteriorating credit quality in a number of EMDEs. The potential escalation of trade restrictions among advanced economies also poses a major threat to the global growth outlook, as it could derail the recovery of international trade and dampen investor confidence worldwide. The materialization of multiple downside risks could trigger a sharper-than-expected slowdown in global growth, with especially negative implications for countries with depleted policy buffers and sizable vulnerabilities. Conversely, growth among advanced economies could exceed expectations, with positive spillovers on their global trading partners. In the long run, EMDEs will need to tackle persistent structural challenges and boost their long-run potential growth rates by promoting competitiveness, adapting to technological change, and fostering greater trade openness.
(Box I.B.1 continued)
29
NAVIGATING UNCERTAINTY
I.B. OUTLOOK AND RISKS

sector (mainly copper and coal), though this forecast assumes that the ongoing reform process will continue as the 2020 parliamentary election approaches. Economic activity is expected to pick up in Timor-Leste due to increased public spending and improving business confidence following the resolution of a political impasse that had slowed economic activity. By contrast, the Papua New Guinean economy is expected to contract in 2018 due to the forced shutdown of key mining and gas projects following the earthquake that struck the country in February 2018. Growth is expected to rebound in 2019, however, as the natural-resource sector returns to full production.
The growth outlook for the PICs is mixed. The “natural disaster cycle” described above is evident in Tonga, where the effects of Tropical Cyclone Gita are projected to result in a sharp growth slowdown in 2018, followed by a strong rebound as reconstruction ramps up during 2019. Meanwhile, the end of recovery-related activities in Fiji and Vanuatu is expected to slow growth in 2018 and over the medium term. The “aid cycle” remains an important driver of the economic outlook in FSM, Kiribati, RMI, the Solomon Islands, and Tuvalu, as donor-funded construction will underpin firm growth rates in 2018 and 2019, while in Palau the recovery of the tourism sector is expected to drive a rebound in growth.
Heightened uncertainty has widened the bands around these baseline estimates, particularly at the lower end. These projections assume gradually tightening but still broadly favorable financial conditions, as well as moderate reductions in output and trade flows due to the recent tariff increases. However, spillovers to long-term cross-border investment flows are assumed to be relatively limited. In the event that the negative effects on investment are amplified—for example, due to a further escalation of trade tensions, a disorderly financial market adjustment caused by a broad investor retreat from EMDEs, or a sudden change in expectations regarding the pace of U.S. interest rate normalization—regional economic activity could slow more sharply than predicted.
Domestic demand will continue to drive regional growth
Private consumption in developing EAP will continue to support economic growth (Figure I.B.1). Growth rebalancing is expected to continue in China, with private consumption estimated to account for over half of economic growth during the projection period. Private consumption will also remain robust in Indonesia, bolstered by increased spending related to the 2019 presidential election and recovering credit growth. In Malaysia, recent adjustments to the consumption tax system and fuel pricing mechanism are expected to ease cost-of-living pressures on households, which should help support consumption. In the Philippines, rising inflation will limit real wage growth, but spending related to local and mid-term congressional elections should offset this effect and boost both public and private final consumption.
Investment spending will also support growth. If energy and metal prices remain close to their current levels, as is assumed in the baseline scenario, solid natural-resource export receipts should bolster investment growth in Indonesia, Mongolia, and Papua New Guinea. In the Philippines and Thailand, large ongoing public infrastructure projects are expected to boost economic activity, although the pace of investment growth will depend on the timely and effective implementation of government procurement plans. Private investment growth is expected to remain robust in Vietnam, with both domestic and foreign investment focused on the rapidly growing high-tech manufacturing and services sectors. However, investment growth is projected to remain subdued in Malaysia as the reassessment of several large planned infrastructure projects contributes to an uncertain outlook for capital spending.
EAST ASIA AND PACIFIC ECONOMIC UPDATE OCTOBER 2018
30 PART I. RECEnT DEVELOPMEnTS AnD OUTLOOK
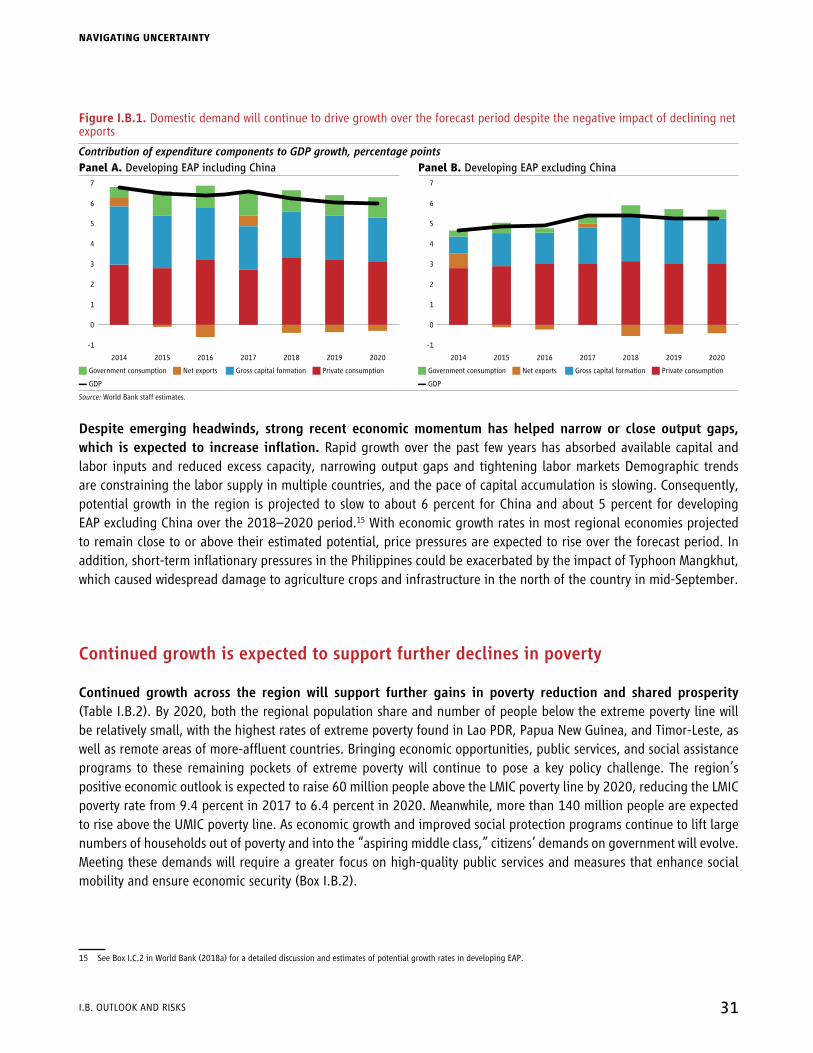
Figure I.B.1. Domestic demand will continue to drive growth over the forecast period despite the negative impact of declining net exports
Contribution of expenditure components to GDP growth, percentage pointsPanel A. Developing EAP including China Panel B. Developing EAP excluding China
7
6
5
4
3
2
1
-1
0
2014 2015 2016 2017 2018 2019 2020
7
6
5
4
3
2
1
-1
0
2014 2015 2016 2017 2018 2019 2020
J Government consumption J Net exports J Gross capital formation J Private consumption J Government consumption J Net exports J Gross capital formation J Private consumption
▬ GDP ▬ GDP
Source: World Bank staff estimates.
Despite emerging headwinds, strong recent economic momentum has helped narrow or close output gaps, whichisexpectedto increaseinflation.Rapid growth over the past few years has absorbed available capital and labor inputs and reduced excess capacity, narrowing output gaps and tightening labor markets Demographic trends are constraining the labor supply in multiple countries, and the pace of capital accumulation is slowing. Consequently, potential growth in the region is projected to slow to about 6 percent for China and about 5 percent for developing EAP excluding China over the 2018–2020 period.15 With economic growth rates in most regional economies projected to remain close to or above their estimated potential, price pressures are expected to rise over the forecast period. In addition, short-term inflationary pressures in the Philippines could be exacerbated by the impact of Typhoon Mangkhut, which caused widespread damage to agriculture crops and infrastructure in the north of the country in mid-September.
Continued growth is expected to support further declines in poverty
Continued growth across the region will support further gains in poverty reduction and shared prosperity (Table I.B.2). By 2020, both the regional population share and number of people below the extreme poverty line will be relatively small, with the highest rates of extreme poverty found in Lao PDR, Papua New Guinea, and Timor-Leste, as well as remote areas of more-affluent countries. Bringing economic opportunities, public services, and social assistance programs to these remaining pockets of extreme poverty will continue to pose a key policy challenge. The region’s positive economic outlook is expected to raise 60 million people above the LMIC poverty line by 2020, reducing the LMIC poverty rate from 9.4 percent in 2017 to 6.4 percent in 2020. Meanwhile, more than 140 million people are expected to rise above the UMIC poverty line. As economic growth and improved social protection programs continue to lift large numbers of households out of poverty and into the “aspiring middle class,” citizens’ demands on government will evolve. Meeting these demands will require a greater focus on high-quality public services and measures that enhance social mobility and ensure economic security (Box I.B.2).
15 See Box I.C.2 in World Bank (2018a) for a detailed discussion and estimates of potential growth rates in developing EAP.
31
NAVIGATING UNCERTAINTY
I.B. OUTLOOK AND RISKS

Box I.B.2. Indonesia’s Middle Class and a New Social Contract1
Over the past two decades, 40 percent of the East Asia region’s population has risen above the global poverty line. This period of burgeoning prosperity has also witnessed the rapid growth of the region’s middle class, defined as households that have attained a reasonable degree of economic security and are no longer vulnerable to falling back into poverty. Between 2002 and 2015, the middle class grew from one-fifth to nearly two-thirds of the regional population. However, the size of the middle class relative to the total population is greater in China, Malaysia, and Thailand than it is in other large middle-income countries like Indonesia, where low rates of extreme poverty coexist with a middle class that has just now grown to one-fifth of the population, the regional average for 2002 (World Bank, 2018d).
This box is based on a forthcoming World Bank report that examines Indonesia’s rapidly growing middle class, with a focus on the aspiring middle class.2 Members of the aspiring middle class are no longer poor or vulnerable but are not yet economically secure.3 The aspiring middle class comprises nearly half of Indonesia’s population. Like the country itself, they have achieved considerable gains, yet they aspire to more.
Inrecentyears,concernshavebeenraisedthatslowingpovertyreductionandincreasinginequalitymayundermine Indonesia’s prospects for escaping the middle-income trap and becoming a high-income country. Among the most troubling possibilities is the risk that increasing inequality will be accompanied by declining economic mobility, creating a widening gulf between the “haves” and “have nots.” Between 2002 and 2016, the Indonesian middle class rose from 7 percent of the population to 20 percent (Figure BI.B.2.1), while its share in total national consumption increased from 21 percent to 43 percent (Figure BI.B.2.2). Combined with the country’s very small upper class,4 the middle class now accounts for about half of all consumption, which threatens to undermine both economic growth (Berg and Ostry, 2011) and social cohesion5 and could imperil Indonesia’s transition to high-income status.
New investments in physical and human capital could accelerate Indonesia’s transformation into a high-incomecountrywhileenhancingeconomicmobility,whichinturnwillrequireincreasingrevenuecollection and broadening the revenue base, especially among the middle and upper classes.6 Indonesia’s total public revenue is lower than that of many other middle-income countries, both globally and in East Asia. Indonesia’s total public revenue equals just 10.9 percent of GDP, compared with 16.5 percent in Thailand, 16.1 percent in Malaysia, and 15.7 percent in the Philippines. The middle and upper classes account for almost all of Indonesia’s income tax revenue. Mobilizing additional revenue will require both boosting collection from the existing middle class and increasing the size of the middle class.
1 This box was prepared by Matthew Wai-Poi and Sailesh Tiwari.2 The report is entitled “Aspiring Indonesia: Expanding the Middle Class.”3 The poor are defined as individuals with income levels below the national poverty line; the vulnerable are defined as those who have a greater than 10 percent chance of
falling into poverty within the next year; and the middle class are defined as those whose chance of falling into either poverty or vulnerability within the next year is less than 10 percent. The aspiring middle class are those who are above the vulnerability line, but who have a greater than 10 percent chance of becoming vulnerable within the next year.
4 Indonesia’s upper class appears very small, but it is likely underrepresented in the household survey data. See World Bank (forthcoming-b).5 Indonesian districts with levels of inequality above the national average have a rate of conflict 1.6 times that of districts with lower levels of inequality (World Bank, 2015a).6 See World Bank (2014c).
(continued)
EAST ASIA AND PACIFIC ECONOMIC UPDATE OCTOBER 2018
32 PART I. RECEnT DEVELOPMEnTS AnD OUTLOOK

Figure BI.B.2.1. Economic classes by population share, Indonesia, 2002–2016
Figure BI.B.2.2. Share of national household consumption by economic class, Indonesia, 2002–2016
Percent Percent
100
90
80
70
60
50
40
30
20
10
0
2006
2007
2008
2009
2010
2011
2012
2013
2014
2015
2016
2005
2004
2003
2002
100
90
80
70
60
50
40
30
20
10
0
2006
2007
2008
2009
2010
2011
2012
2013
2014
2015
2016
2005
2004
2003
2002
J Poor J Vulnerable J ECC J MC J UC J Poor J Vulnerable J ECC J MC J UC
Source: Susenas and World Bank calculations.Note: CAGR is the compound annual growth rate for 2002-16. P is poor, V is vulnerable, AMC is aspiring middle class, MC is middle class, and UC is upper class. The UC share is poorly estimated due to the small number of households participating in the national household survey. See World Bank (forthcoming) for definitions and thresholds.
Lowratesofincometaxcomplianceamongthemiddleclassandaspiringmiddleclassreflect,inpart,alackofconfidenceinthevalueofpayingtaxes.The middle and upper classes are beginning to opt out of public services in favor of private alternatives, while the aspiring middle class continues to rely on public services. Access to public education and healthcare is nearly universal for the middle class, but service quality is highly variable. Many local health facilities lack adequate equipment or trained staff to provide basic care and essential services, even in urban areas, where most of the middle class live. Meanwhile, despite a rising number of public-school teachers, a new teacher-certification program, and improved teacher compensation, Indonesia’s education outcomes have shown little improvement and remain among the lowest in the world.
Facedwithlow-qualitysocialservices,middle-classhouseholdsareincreasinglyturningtotheprivatesector, particularly for healthcare. Although public health centers offer universal coverage, middle-class Indonesians are much less likely to use local health centers for inpatient and outpatient care than are their counterparts in the aspiring middle class, and especially the poor and vulnerable. Half of the middle class and three-quarters of the upper class use private hospitals for inpatient treatment, compared to just one-third of the aspiring middle class and even smaller shares of the poor and vulnerable (Figure BI.B.2.3). Similarly, middle- and upper-class Indonesians are more likely to give birth in a hospital rather a local health center or clinic, and they are more likely to receive care from a doctor rather than from a midwife or nurse. In addition, a modest but growing share of the middle class, and a larger share of the upper class, are now sending their children to private schools.
Indonesia needs a new social contract that leverages public investment to drive inclusive growth, embraces social insurance systems to protect economic gains, and encourages greater civic participation by bolstering tax compliance to finance these activities. Efforts to revitalize the relationship between Indonesia’s government and its citizens should focus on three areas. First, providing quality public services, especially healthcare and education, but also water and sanitation, can enable children from the aspiring middle class to develop the human capital they need to succeed in the labor market. Visible improvements in the quality of
(continued)
(Box I.B.2 continued)
33
NAVIGATING UNCERTAINTY
I.B. OUTLOOK AND RISKS

Table I.B.2. Poverty in developing EAP is projected to continue falling over the projection period
Extreme poverty line (US$1.90 per-capita per-day PPP): Estimates and projectionsYear 2017 2018 2019 2020
Developing EAPPoverty rate (%) 1.7 1.5 1.4 1.2Number of poor (millions) 35 31 28 26
Developing EAP excluding ChinaPoverty rate (%) 4.4 4.0 3.7 3.4Number of poor (millions) 29 27 25 23
LMIC poverty line (US$3.20 per-capita per-day PPP): Estimates and projectionsYear 2017 2018 2019 2020
Developing EAPPoverty rate (%) 9.4 8.2 7.2 6.4Number of poor (millions) 192 169 149 132
Developing EAP excluding ChinaPoverty rate (%) 19.6 18.1 16.7 15.4Number of poor (millions) 128 120 112 104
public services may also strengthen support for greater public investment and encourage tax compliance. Second, adopting reforms designed to facilitate entrepreneurship can enable workers from the middle class and aspiring middle class to access new livelihood opportunities, enhancing their economic mobility. Closing the infrastructure gap, strengthening administrative decentralization, more effectively managing the urbanization process, and offering targeted support to less-developed regions can further expand economic opportunities. Finally, providing adequate and sustainable health, income, and old-age insurance can provided the security necessary for aspiring middle class households to successfully transition into the middle class, while also protecting the economic gains that the middle class has already achieved. Improving income tax compliance among the current middle class and broadening the tax base by increasing the size of the middle class will be critical to ensure adequate financing for these much-needed investments.
Figure BI.B.2.3. Choice of healthcare provider by economic class, 2016Percent
OU
TPA
TIEN
TIN
PA
TIEN
T
POOR VULNERABLE AMC MC 1 MC 2 UC
5
2
37
6
415
22
5
39
8
37
422
3
7
4
41
12
29
322
10
11
38
19
181
2 1
13
2334
20 70
2 1
11
30
34
166 111
45
15
73
28
11
44
21
75
22
10
43
316
6
13
10
39
48
4
4
5
0,0 33
60
222
01
21
75
1
2
10,0
J State J Private J Practice doctor J Clinic J Puskesmas J UKBM J Traditional J Others
Source: Susenas and World Bank calculations.
(Box I.B.2 continued)
EAST ASIA AND PACIFIC ECONOMIC UPDATE OCTOBER 2018
34 PART I. RECEnT DEVELOPMEnTS AnD OUTLOOK

Table I.B.2. Poverty in developing EAP is projected to continue falling over the projection period
UMIC poverty line (US$5.50 per-capita per-day PPP): Estimates and projectionsYear 2017 2018 2019 2020
Developing EAPPoverty rate (%) 28.8 26.1 23.7 21.4Number of poor (millions) 588 537 489 444
Developing EAP excluding ChinaPoverty rate (%) 44.2 41.8 39.6 37.5Number of poor (millions) 290 277 265 254
Source: World Bank East Asia and Pacific Team for Statistical Development.Note: The most recent household income and expenditure surveys vary from 2006 in Kiribati to 2017 in Indonesia. Estimates are extrapolated based on per capita GDP growth and historical estimates of the growth elasticity of poverty. PPP = purchasing power parity.
Escalating protectionism could dampen the growth outlook for developing EAP
An escalation in U.S.-China trade tensions could take three forms. Tariffs could be expanded to cover more products, existing tariff rates could be increased, or investment restrictions could be adopted that would prevent Chinese citizens from acquiring, controlling, or owning significant shares of U.S. businesses. While the first two forms would have moderately adverse impacts, a spillover of protectionist sentiment into investment restrictions could have far more serious repercussions for both the regional and global economies.
Recentanalysesindicatethatthepotentialimpactoftariffexpansionsortariffrateincreaseswouldbesignificantbut manageable. Under various scenarios, ranging from an isolated increase in tariffs on U.S.-China bilateral trade to a global increase in trade prices, potential shocks are estimated to reduce global economic activity by between 0.3 and 2.0 percent.16 However, these estimates do not incorporate impacts on investment and financial markets, which are likely to magnify the negative effect of escalating protectionism on trade and income.
The negative impact of an escalating U.S.-China trade dispute would pass through to the rest of developing EAP via regional supply chains. Further U.S. tariffs would push up the final prices of Chinese goods in the U.S., reducing the quantity demanded. This effect would reverberate through regional value chains, weakening demand for developing EAP exports that are inputs for Chinese exports to the U.S. (Box I.B.3). Over the longer term, regional value chains could be restructured so that final exports are not produced in China but in another location that is not subject to tariff restrictions. However, such a reorientation would be slow and costly.
Although higher tariffs on bilateral U.S.–China trade could create an opportunity for other developing EAP countries to increase exports to both markets, this will not be easy. The most significant challenge to the rest of developing EAP restructuring production and exports in this manner is that other economies—including Europe, Japan, Korea, and Mexico—are also readying themselves to take advantage of these relative price changes. Furthermore, export entry, transportation, and regulatory costs are nontrivial, and establishing the required organizational mechanisms and
16 Freund et al. (2018) estimate that a 25 percent tariff rate on all bilateral trade between the U.S. and China would reduce global output by 0.3 percent, lowering incomes by 2.5 percent in China and 0.4 percent in the U.S. In another study, IMF (2018a) estimated that if the various tariffs threatened by the U.S., China, Europe, Mexico, Japan, and Canada were all implemented, impacting business confidence and investment plans, global output could fall about 0.5 percent below current projections by 2020. Anderson et al. (2013) focus on a scenario in which the U.S. applies a 10 percentage-point increase in tariffs on imports from all nations. This shock is estimated to decrease global output by 0.5 percent. Kutlina-Dimitrova and Lakatos (2017) calculate that a worldwide increase in tariffs up to the legally allowed limit under WTO commitments (WTO bound rates), coupled with a 3 percent increase in the cost of traded services, would translate into annual global real income losses of 0.8 percent. In another exercise, IMF (2016a) estimates the effects of a 10 percent increase in global import prices driven by a symmetrical rise in both tariff and nontariff barriers. This shock is estimated to shave about 2 percent off global output.
35
NAVIGATING UNCERTAINTY
I.B. OUTLOOK AND RISKS

Box I.B.3. Global Value-Chain Integration in East Asia and the Pacific1
Developing countries in EAP play a pivotal role in international production sharing. Their increasing integration into global value chains (GVCs) is reflected in their scores on the GVC participation index (Figure BI.B.3.1). This index, which was proposed by Koopman et al. (2010), summarizes backward and forward GVC linkages. Backward linkages represent the value of foreign inputs in a given country’s exports, and forward linkages represent the value of inputs produced in a given country that are used in the exports of other countries.
From 1995 to 2011, domestic demand for foreign intermediate and final inputs grew in everydeveloping EAP country listed in Figure BI.B.3.1 except the Philippines. Malaysia and Thailand have especially strong backward linkages, and Malaysia has the highest GVC participation index score among the developing EAP countries included in this analysis. Over the period, the importance of forward linkages increased in all countries except Cambodia. Indonesia experienced the largest increase in forward linkages, and it now has the strongest forward linkages in developing EAP.
China is the region’s most important purchaser of value added by developing EAP countries, followed by Japan and Korea. Figure BI.B.3.2, below, diagrams the main buyers of value added by various EAP economies. The size of the arrows captures the amount of each economy’s bilateral gross exports relative to its gross value added, and the size of the node denotes the centrality of the economy in the network.
1 This box was prepared by Francesca de Nicola.
Figure BI.B.3.1. Global value-chain participation index, selected developing countries in East Asia and the Pacific, 1995 and 2011
0 20 40 60
PHL
KHM
VNM
CHN
MYS
IDN
THA
Percent of total gross exports
Q GVC index 1995 Q Backward links 1995 Q Forward links 1995
Q GVC index 2011 Q Backward links 2011 Q Forward links 2011
Source: OECD TiVA data.Note: CHN = China, IDN = Indonesia, KHM = Cambodia, MYS = Malaysia, PHL = the Philippines, THA = Thailand, VNM = Vietnam.
Figure BI.B.3.2. Diagram of regional value chains in East Asia and the Pacific, 2011
Source: TiVA data elaborated using Gephi. Note: This figure includes only those EAP economies for which TiVA data are available: Cambodia, China, Indonesia, Malaysia, Philippines, Thailand, and Vietnam (developing EAP economies), and Australia, Brunei, Hong Kong SAR, China, Japan, Korea, New Zealand, Singapore and Taiwan, China (high-income EAP economies). Arrows point to the buyers, and their thickness is proportional to the ratio of exports to value added in the producer country. The size of the nodes is proportional to the ratio of exports to value added bought on the global market.
(continued)
EAST ASIA AND PACIFIC ECONOMIC UPDATE OCTOBER 2018
36 PART I. RECEnT DEVELOPMEnTS AnD OUTLOOK

Developing EAP countries that are more integrated in GVCs stand to lose more from a U.S.-China trade war. On the one hand, as the United States and China substitute away from each other, other developing EAP countries that produce competing products may be able to benefit by expanding their exports. On the other hand, however, as China reduces its exports to the United States, its demand for intermediate inputs from its neighbors will also fall, and countries that are more deeply integrated into regional GVCs have more to lose from declining Chinese demand. While modelling techniques are still being developed to capture the first effect, the existing data allow for an assessment of the second. Expected losses among developing EAP countries due to the disruption of U.S.-China trade are calculated based on the value that inputs sourced in EAP add to Chinese exports to the United States. Losses are expressed as share of the total value added by the source country.
Examining two extreme scenarios can shed light on the potential impact of a U.S.-China trade war among developing countries in EAP. The first, more conservative scenario assumes that the trade war will be limited to the aluminum and steel products targeted for tariffs in March.2 Further tariff increases, which would amount to about US$200 billion dollars and target a majority of products exported by China to the United States, were announced in July and implemented in September. The second scenario therefore assumes that tariffs will be increased on any Chinese sector that exports to the United States. Among developing EAP countries, Malaysia is the most integrated into GVCs and stands to lose the most from a U.S.-China trade war under both scenarios, with estimated costs ranging from 1 to 1.5 percent of total value added (Figure BI.B.3.3). However, two caveats should be borne in mind when interpreting these results. First, the estimation methodology does not account for trade elasticities and thus may overestimate potential losses. Second, the estimates rely on data from 2011, and if developing countries in EAP have become more integrated with China since then—as is likely, given past trends—the estimates could undervalue the potential losses incurred by a U.S.-China trade war.
Figure BI.B.3.3. Expected losses among economies in East Asia and the Pacific due to a U.S.-China trade war, 2011Percent of value added Percent of value added
2.5
2.0
1.5
1.0
0.5
0
KHM IDN VNM THA PHL MYS
2.5
2.0
1.5
1.0
0.5
0
BRN HKG JPN KOR SGP TWN
J Tariff-exposed sectors J All sectors J Tariff-exposed sectors J All sectors
Source: TiVA data.
2 The initial round of tariff measures is defined in docket number USTR-2018-0005.
(Box I.B.3 continued)
37
NAVIGATING UNCERTAINTY
I.B. OUTLOOK AND RISKS

distribution networks will take time.17 The developing EAP countries most able to increase their export shares to the U.S. are those that already compete with Chinese exports in the United States and can leverage their knowledge of trade processes and existing U.S.-based business relationships. Vietnam and Malaysia, for example, are significant direct exporters to the U.S. of several products for which Chinese exports are now subject to tariffs. However, because the U.S. has focused its recent tariff increases on trading partners with whom it has a sizeable bilateral trade deficit, there is a risk that if countries such as Indonesia, Thailand, and Vietnam supplant Chinese exports, their rising prominence in the U.S. trade profile might encourage U.S. policymakers to raise tariffs on imports from those countries as well.
Producers in developing EAP could also face increasing competition in domestic markets from Chinese goods seeking alternative export destinations. This competitive shock is likely to fall most heavily on those countries that already source a relatively large share of their imports from China, including Indonesia, Malaysia, the Philippines, Thailand, and Vietnam.18 These competitive pressures could be magnified if the renminbi were to depreciate against other EAP currencies. Despite these adjustment costs, there are also likely to be benefits to the domestic economies in developing EAP from increased competition, including lower prices, an expanded range of products available to consumers and producers, and efficiency gains via increased specialization.
Spilloverstoinvestment,shouldtheyarise,couldbeevenmoreconsequentialfordevelopingEAP.Spillovers from trade protectionism have already occurred, as the escalation in protectionist rhetoric and policies in mid-2018 increased volatility and caused regional equity markets and currencies—including the renminbi—to trend down. These developments highlighted the risk that the effects of trade policy shocks will not be contained to trade flows. Indeed, the impacts on regional growth would be larger if an escalation in protectionist sentiment were to affect business confidence and investment decisions.19 For example, changing trade conditions and heightened uncertainty could lead to delays or cancelations of investment plans associated with regional value chains as companies await greater clarity regarding the trade regime.
To the extent that an escalation in U.S.–China trade tensions leads to weaker economic growth in China, there couldbeadditionalnegativeconsequences fordevelopingEAP (Box I.B.4). Slower domestic demand growth in China could also affect EAP exports destined for final consumption in China. On the goods side, this includes both finished products and goods used as inputs for products consumed in China, such as fuel, electronics, construction materials, and furniture. The regional economies that are most exposed to this demand shock include Malaysia, the Philippines, and Vietnam (electronics); Lao PDR (copper); Mongolia (copper and coal); Myanmar (liquified natural gas); Papua new Guinea (liquified natural gas and wood); and the Solomon Islands (wood). On the services side, lower Chinese income growth could impact Chinese international tourism, which has recently been an important driver of domestic economic activity in Cambodia, Fiji, Lao PDR, Myanmar, Palau, and Thailand. Furthermore, a negative growth shock in China could dampen offshore investment and slow credit growth. These transmission channels are likely to be most important for Cambodia, Lao PDR, Mongolia, Myanmar, and Vietnam, all of which are developing EAP countries where Chinese investment—either directly or through affiliates in Hong Kong SAR, China and Macau SAR, China—represents a large share of FDI, and where the domestic banking sectors are significantly exposed to Chinese banks.
A slowing Chinese economy could also soften global demand for commodities and weaken commodity prices more broadly, with negative implications for EAP commodity exporters. Notwithstanding the gradual rebalancing
17 See Djankov et al., 2002; Dennis and Shepherd, 2007.18 See Bastos, 2018.19 For example, Freund et al. (2018) estimate the impact of a 0.5 percent decline in the global investment to GDP ratio in addition to a 25 percent tariffs on all U.S.–China bilateral trade.
In this scenario, global income could decline by up to 1.7 percent, with China and the U.S. suffering income declines 3.5 percent and 1.6 percent, respectively. Real income in the EAP excluding China is projected to fall by 1.3 percent.
EAST ASIA AND PACIFIC ECONOMIC UPDATE OCTOBER 2018
38 PART I. RECEnT DEVELOPMEnTS AnD OUTLOOK
Box I.B.4. Spillovers to Developing East Asia and Pacific from China1
ThedeepregionalandglobalintegrationofEAPeconomiesintensifiestheirvulnerabilitytoexternalshocks. Countries across the region rely heavily on exports and FDI. Total foreign exchange inflows exceed 50 percent of GDP in more than two-thirds of EAP economies and 100 percent in about one-third. Moreover, EAP economies are densely integrated into global and regional value chains (Box I.B.3), and China has become the largest trading partner and source of FDI for many regional economies.
China’s economic linkages with the rest of the region are large and complex and have deepened over time. Intraregional trade and FDI flows are substantial. In 2017, intraregional trade accounted for more than half of the EAP region’s total trade. Linkages with China are driven by Chinese demand for goods (e.g., commodities, consumer and investment goods, parts and components) and services (e.g., education and tourism), as well as investment (mainly outbound FDI) and other capital flows. In Mongolia, Lao PDR, Myanmar, and the Solomon Islands, commodity exports are driving an especially large and growing trade exposure to China. These countries also appear to be have benefited from substantial FDI inflows from China between 2013 and 2017, including investments made as part of the Belt and Road Initiative. Trade exposure to China among the biggest emerging-market economies in the region remained at around 10 percent of GDP during the 2013–17 period, and trade links have remained strong during China’s ongoing transition to a consumer-led, services-driven economy, its movement up the global value chain, and its gradual capital account liberalization (Figure BI.B.4.1).
China’s rapid industrialization under an investment- and manufacturing-driven growth model has spurred a surge in demand for commodities since 2000. China accounted for almost the entire increase in global metals consumption and half the increase in primary energy consumption observed over the 2010–17 period, and it now accounts for about 50 percent of global consumption of coal and metals. China is the world’s single largest consumer of coal, aluminum, refined copper, lead, and fertilizers. Economic fluctuations in China significantly impact global commodity prices, with important implications for commodity-exporting economies (Freund et al., 2018; World Bank, 2018f).
China’s robust economic growth over the last several decades has had positive spillover effects across the EAP region, but China’s dense regional linkages can also transmit volatility and idiosyncratic shocks across borders. Even countries that are not directly impacted by developments in China may experience spillover effects via changes in investor sentiment across the region. Rising U.S.-China trade tensions since the beginning of the year have increased uncertainty and negatively affected confidence in markets across the EAP region. Given its size and integration with the global and regional economies, a significant growth slowdown in China could negatively affect the entire region.
An unexpected one-off drop in China’s GDP growth rate of 1 percentage point would lower the aggregate growth rate in the rest of developing EAP by 0.5 percentage points after two years. This estimate is based
1 This box was prepared by a team led by Ekaterine Vashakmadze that included Ergys Islamaj and Jinxin Wu.
(continued)
39
NAVIGATING UNCERTAINTY
I.B. OUTLOOK AND RISKS

Figure BI.B.4.1. External exposure among developing economies in East Asia and the Pacific
A. Global exposure by type of foreign inflows, 2013–17 B. Exposure to China, 2008–2017Percent of GDP Percent of GDP Percent of GDP
160
80
60
40
20
-20
0
140
120
100
VNM
KHM
MYS TH
AMNG
BRN
LAO
PHL
MMR
IDN
TUV
KIR
RMI
FSM
PLW FJ
IVU
TTO
NSL
BW
SM TLS
PNG
6 0.4
5
0.3
4
0.23
0.1
2
1
0 0
2008 2009 2010 2011 2012 2013 2014 2015 2016 2017
J Goods export J Service export J Primary & secondary income ▬ Exports to China ▬ FDI from China, rhs
J Direct investment J Others Q Goods exports to China as a share of GDP
C. Goods exports D. Commodities exportsPercent of GDP Percent
VNM
20
08
–1
2
20
13
–1
7
MYS
20
08
–1
2
20
13
–1
7
THA
20
08
–1
2
20
13
–1
7
KHM
20
08
–1
2
20
13
–1
7
MNG
20
08
–1
2
20
13
–1
7
SLB
20
08
–1
2
20
13
–1
7
PNG
20
08
–1
2
20
13
–1
7
LAO
20
08
–1
2
20
13
–1
7
PHL
20
08
–1
2
20
13
–1
7
IDN
20
08
–1
2
20
13
–1
7
FJI
20
08
–1
2
20
13
–1
7
MMR
20
08
–1
2
20
13
–1
7
90
80
70
60
50
40
30
20
0
90
80
70
60
50
40
30
20
0
MNG
20
08
–1
2
20
13
–1
7
SLB
20
13
–1
7
MMR
20
08
–1
2
20
13
–1
7
FJI
20
08
–1
2
20
13
–1
7
LAO
20
08
–1
2
20
13
–1
7
IDN2
00
8–1
2
20
13
–1
7
MYS
20
08
–1
2
20
13
–1
7
THA
20
08
–1
2
20
13
–1
7
VNM
20
08
–1
2
20
13
–1
7
KHM
20
08
–1
2
20
13
–1
7
J Total exports Q Exports to China J Commodity exports as a share of total goods exports
Q Commodity exports to China as a share of total goods exports
E. FDI liabilities (stocks) F. Investment financed under the Belt and Road InitiativePercent of GDP Percent of GDP
180
160
140
120
100
80
60
40
20
0
MNG
20
08
–1
2
20
13
–1
6
KHM VNM MMR LAO MYS THA IDN PHL
20
08
–1
2
20
13
–1
6
20
08
–1
2
20
13
–1
6
20
08
–1
2
20
13
–1
6
20
08
–1
2
20
13
–1
6
20
08
–1
2
20
13
–1
6
20
08
–1
2
20
13
–1
6
20
08
–1
2
20
13
–1
6
20
08
–1
2
20
13
–1
6
2.5
2.0
1.5
1.0
0.5
0
LAO MNG KHM MMR MYS VNM IDN THA PHL
J Total FDI Q FDI from China J Planned J BRI investment (2013–17 average)
Source: World Bank, IMF Balance of Payments Statistics (BOPS), IMF Direction of Trade Statistics (DOTS), UNCTAD, Ministry of Commerce of China, World Tourism Organization (UNWTO), World Integrated Trade Solution (WITS).Notes: A: Other channels include portfolio investment, financial derivatives, and capital account inflows. The linkages presented in this chart only present direct channels. Spillovers may propagate via indirect channels such as global and regional value chains. Star denotes direct exposure to China. B: Exports refer to goods exports, GDP-weighted average. C.D.E.F: Simple average. F: Shaded area indicates planned investment.
(Box I.B.4 continued)
(continued)
EAST ASIA AND PACIFIC ECONOMIC UPDATE OCTOBER 2018
40 PART I. RECEnT DEVELOPMEnTS AnD OUTLOOK

on a Bayesian structural vector autoregression (SVAR) model, which can capture both the upside and downside risks associated with China’s economic growth. Its results are consistent with previous findings (World Bank, 2016a; World Bank, 2016b). The effects of a simulated 1 percentage-point slowdown in China range from a decline of 0.4 percentage points in Thailand’s growth rate to a declined of almost 0.8 percentage points in Malaysia’s (Figure BI.B.4.2). Growth spillovers from China are especially large for Mongolia, due to its reliance on commodity exports to China.2 Furthermore, spillovers from China to the developing EAP region are projected to rise over time, in line with the increased exposure observed in the data.
Figure BI.B.4.2. Regional spillovers from China
A. Impact of a 1 percentage-point decline in the Chinese GDP growth rate on the growth rates of other regional economies
B. Impact of a 1 percentage-point decline in the Chinese GDP growth rate on the aggregate growth rate of developing EAP economies
Percentage point Percentage point
0
-0.5
-1.5
-1.0
SGP MYS IDN PHL THA JPN KOR
0
-0.5
-1.0
Q1/1998–Q4/2014 Q1/1998–Q1/2018
Source: World Bank, Haver Analytics, J.P. Morgan, IMF Balance of Payments Statistics (BOP), IMF Direction of Trade Statistics (DOTS), UNCTAD.Notes: Median of posterior distribution. Estimates based on a Bayesian SVAR, estimated using quarterly data for Q1 1998–Q1 2018. Estimates for each country include the following variables: growth in G7 excluding Japan; the JPMorgan Emerging Market Bond Index; growth in Japan, China, and Korea; commodity price growth; recipient-country growth; and the real exchange rate of the recipient country. Commodity exports are weighed by each commodity’s average export share in commodity export basket of the spillover destination country. A lag of four quarters is adopted. Identification is based on a recursive structure, with variables ordered as listed above, and earlier variables are assumed to be contemporaneously unaffected by later variables Inferences are based on 2,000 Monte Carlo draws. Developing EAP economies include Indonesia, Malaysia, the Philippines and Thailand. Mongolia and Vietnam are excluded due to poor data quality. Estimated spillovers include effects through indirect channels, including confidence and global and regional value chains. A. B. Cumulative impact on growth after two years. B. GDP weighted.
A growth shock originating in China would impact other EAP economies through bilateral trade, including tradeinintermediategoodswithinregionalsupplychains,tradeinservices(especiallyinthePacificIslands),andfinancialflows,includingFDI.On average, exports and investment accounted for more than 80 percent of GDP growth in the EAP region between 2000 and 2017, compared to less than 60 percent among global EMDEs. Mongolia, the Solomon Islands, Lao PDR, and Myanmar are especially exposed to China as a destination for exports and as a source of FDI. In addition to trade and financial channels, slower Chinese growth could transmit a significant shock to regional economies by depressing confidence and investment. negative spillovers from China would adversely affect trade and FDI inflows in the short term and domestic investment and productivity growth over the medium term, thereby lowering regional growth rates.
A growth shock in China would also reverberate throughout global commodity markets, which are especially sensitive to changes in China’s growth rates, and declining commodity prices would darken the growth outlook among commodity exporters. A 1 percent change in Chinese industrial production has
2 Large point estimates, especially for Mongolia, are consistent with the patterns of exposure observed in the data. Among a broader sample of EMDEs, spillovers from China are found to be larger for commodity exporters.
(continued)
(Box I.B.4 continued)
41
NAVIGATING UNCERTAINTY
I.B. OUTLOOK AND RISKS

of China’s growth model toward consumption and away from investment and exports, the strength of China’s economic activity continues to influence global commodity demand and prices, particularly for metals and crude oil.20 Consequently, in addition to its direct demand effects, slowing momentum in China would have spillover effects on net energy exporters in developing EAP, including Mongolia, Myanmar, and Papua new Guinea, as well as countries with a high export concentration in metals, such as Lao PDR.
In an extreme scenario, a severe escalation in protectionism could derail global growth prospects, with negative consequencesforcommoditypricesandEAPeconomicmomentum.While this scenario remains unlikely at this point, if trade tensions intensified and spilled over into investment flows, negative effects on growth would likely extend not just to developing EAP, but to advanced economies as well, diminishing global growth prospects.21 Such a scenario would likely cause a sharp correction in commodity prices and a severe dislocation in global financial markets.
Heightenedfinancialmarketturbulencewouldcomplicatemacroeconomicmanagement
A sudden reassessment of the expected pace of U.S. interest rate rises could lead to an abrupt tightening of EMDEfinancialmarketconditionsandheightenedvolatility. Buoyant U.S. economic activity, a strong labor market, and rising inflation have prompted the Federal Reserve to accelerate the planned pace of monetary policy normalization during 2018 and 2019, with the policy rate now projected to reach 3.1 percent by December 2019 (Box 1.A.1). nevertheless, markets continue to expect a shallower trajectory for U.S. interest rates, reflecting their weaker expectations for medium-term growth and inflation.22 Indeed, while the Federal Reserve projects that the federal funds rate will reach 2.4 percent at end-2018, 3.1 percent at end-2019, and 3.4 percent at end-2020, markets are expecting the policy rate to reach just 2.3 percent at end-2018 before levelling off at 2.8 percent over the medium term.23 Consequently, even a modest acceleration in U.S. inflation could spur an upward adjustment in U.S. interest rate expectations, triggering
20 Over a one-year horizon, a 1 percent increase in Chinese industrial production leads to an estimated 5–7 percent increase in metal and fuel prices (Kolerus et al., 2016; Roache and Roussett, 2015; IMF, 2011, 2016b).
21 IMF (2016a) estimates that a 10 percent increase in global import prices, driven by a symmetrical rise in both tariff and nontariff barriers, could reduce global output by about 2 percent.
22 The Federal Reserve projects that the growth of the U.S. economy will remain solid in 2018 before easing in 2019 and 2020. Markets, however, are forecasting a stronger expansion in 2018 followed by a sharper slowdown, reflecting expectations that trade conflicts will diminish the growth outlook to a greater extent than the authorities have projected.
23 See CME Group, 2018.
been associated with a 5–7 percent change in metal and energy prices over the following year (Kolerus et al., 2016; World Bank, 2018f). Commodity exports to China constitute a considerable share of total exports in Mongolia, the Solomon Islands, Myanmar, and Lao PDR, as well as Malaysia, Thailand, and Vietnam, leaving those countries highly exposed to economic fluctuations in China.
Furtherglobaland regional integrationcouldencouragediversification in tradeandfinancialflows,mitigating the expose of developing EAP countries to Chinese growth shocks. Developing EAP countries tend to impose higher capital account restrictions than do their peers in other regions. While greater financial integration would likely increase bilateral exposure to China, it could also expand and diversify financial linkages within and outside the region, reducing the impact of spillover shocks in the longer term.
(Box I.B.4 continued)
EAST ASIA AND PACIFIC ECONOMIC UPDATE OCTOBER 2018
42 PART I. RECEnT DEVELOPMEnTS AnD OUTLOOK

capital outflows from developing EAP. Countries with more-open capital accounts (e.g., Indonesia, Malaysia, and the Philippines) and sizeable nonresident holdings of bonds and stocks (e.g., Indonesia, Malaysia, and Thailand) are most likely to be exposed to these sources of financial market volatility.
DespitetheEAPregion’srelativelystrongfundamentals,theriskoffinancialmarketcontagionfromvulnerableemerging market economies elsewhere in the world has increased. Developing EAP economies, by and large, have stronger economic fundamentals than do Turkey, Argentina, and many other EMDEs that have been affected by recent financial market turbulence. Furthermore, developing EAP has very limited direct trade links or financial sector connections to the worst-hit of these economies. nevertheless, heightened financial market sensitivities to economic and political events in EMDEs has elevated the risk of contagion across countries—a risk to which developing EAP remains vulnerable. A sudden reassessment of regional risk-adjusted returns or full-blown contagion across the EMDE asset class could cause rapid and large short-term capital outflows from developing EAP, as well as sharp exchange rate movements.
Additionalboutsofcapitaloutflowswouldaccentuatedebtrolloverrisksandfurtherincreaseriskpremiums.Across developing EAP, portfolio capital reversals could reduce sovereign and private sector capacity to issue and roll over foreign-currency-denominated debt, with potentially disruptive implications for business operations and solvency on the corporate side, and for deficit financing and debt sustainability on the sovereign side. Rollover risks are potentially acute for Indonesia and Thailand, given their sizeable stocks of short-term debt (around US$50 billion and US$63 billion, respectively). However, it is unlikely that liquidity risk would translate into solvency risk in these countries, given their relatively low levels of foreign debt, strong financial sector capital adequacy and liquidity, and ample monetary and fiscal buffers. Meanwhile, rollover risk is high in Papua new Guinea, as the authorities have continued to issue short-term Treasury bills to help finance the budget deficit, shortening the maturity profile of the public debt. Even countries that have access to financing would likely face a higher risk premium. Elevated financing costs could delay planned public and private investments and reduce the fiscal space to implement countercyclical fiscal policies and finance public health, education, and other services. Risk premiums are likely to be especially high for countries in which both the public and private sectors are net borrowers—i.e., countries running twin fiscal and current account deficits—as the public and private sectors will compete for scarce capital to fulfil their consumption and investment plans, bidding up market-determined interest rates (e.g., Indonesia and the Philippines).
Asharpdepreciationamonglocalcurrenciescouldimpactdebtsustainability,banklending,andconfidence,whilealsopushingupinflation.Currency depreciation would increase the share of domestic revenue necessary to finance foreign-currency-denominated debts, putting pressure on both corporate balance sheets and fiscal sustainability. Although most regional economies have sound banking sectors, pockets of vulnerability exist (Box I.B.5). The pressure from currency depreciation would be magnified in countries where the private sector and/or the government retain significant currency mismatches—e.g., where a large share of debt is issued in foreign currency, while revenues are predominantly in local currency24—which include Lao PDR, Mongolia, Papua New Guinea, and Vietnam. This risk has been partially mitigated in Mongolia, where the government has rebuilt its foreign exchange reserves over 2017 and 2018. Nevertheless, reserves remain low relative to goods and services imports in each of these economies. Currency mismatches in the banking sector could cause liquidity constraints or a credit crunch, negatively affecting economic activity. Moreover, although regional banking systems are generally well capitalized, asset quality has deteriorated in some countries (Figure I.B.2). Weaker currencies could erode consumer and investment confidence, with adverse effects on consumption and investment. Currency depreciation could also put upward pressure on inflation as the domestic
24 Eichengreen et al., 2005; Ranciere et al., 2010.
43
NAVIGATING UNCERTAINTY
I.B. OUTLOOK AND RISKS

price of imports rises, with especially negative consequences for the purchasing power of vulnerable households. These effects are likely to be strongest in the Philippines and Vietnam, where inflation is already above central bank targets.
Figure I.B.2. Banking sectors remain well capitalized across the region
Panel A. Capital adequacy ratio Panel B. Percentage of nonperforming loans to total loansPercent Percent
25
20
15
10
5
0
Cambodia China Indonesia Malaysia Philippines Thailand Vietnam
3.5
3.0
2.5
2.0
1.5
1.0
0.5
0
Cambodia China Indonesia Malaysia Philippines Thailand
J Capital to risk-weighted assets J Tier 1 capital to risk-weighted assets J Q4-2016 J Q1-2017 J Q2-2017 J Q3-2017 J Latest*
Source: Financial Soundness Indicators, CEIC.Note: *China (Q1-2018); Philippines (Q1-2018); Thailand (Q1-2018); Cambodia (Q1-2018), Indonesia (Q4-2017), Malaysia (Q1-2018).
Box I.B.5. How Vulnerable Is the East Asia and Pacific Regional Banking Sector?1
The largest banking systems in the EAP region appear strong and well-managed, yet some structural challenges remain unaddressed. The size and complexity of the region’s financial systems has increased dramatically over the last decade. Overall, EAP countries have managed their financial systems very prudently: the region’s banking sector is well capitalized, and its financial soundness indicators are strong (Figure BI.B.5.1). However, credit growth has increased significantly over the last decade, and the private-sector credit-to-GDP ratios of some EAP countries are among the highest in the developing world. Therefore, private-sector leverage continues to pose a structural challenge for many of the region’s financial systems.
The EAP region includes some of the largest banks and financial systems among EMDEs worldwide.For example, between 2005 and 2016 the amount of assets held by China’s financial system increased almost tenfold, rising from 201.5 percent of GDP to 466.1 percent. Today, China’s bank assets exceed 300 percent of GDP. China is home to some of the world’s
1 This box was prepared by Ana Maria Aviles, Jiyoung Song, Radu Tatucu, and Elisabeth Hyun, with support from Diego Sourrouille.
(continued)
Figure BI.B.5.1. Banking-sector assets as a share of GDPPercent
350
300
250
200
150
100
0
50
CHN
200
180
160
140
120
100
80
60
40
20
0
THA VNMPHLMYSIDNKHM
J 2010 J 2017
Source: Haver Analytics; World Bank World Development Indicators (WDI), and authors’ calculations.
EAST ASIA AND PACIFIC ECONOMIC UPDATE OCTOBER 2018
44 PART I. RECEnT DEVELOPMEnTS AnD OUTLOOK
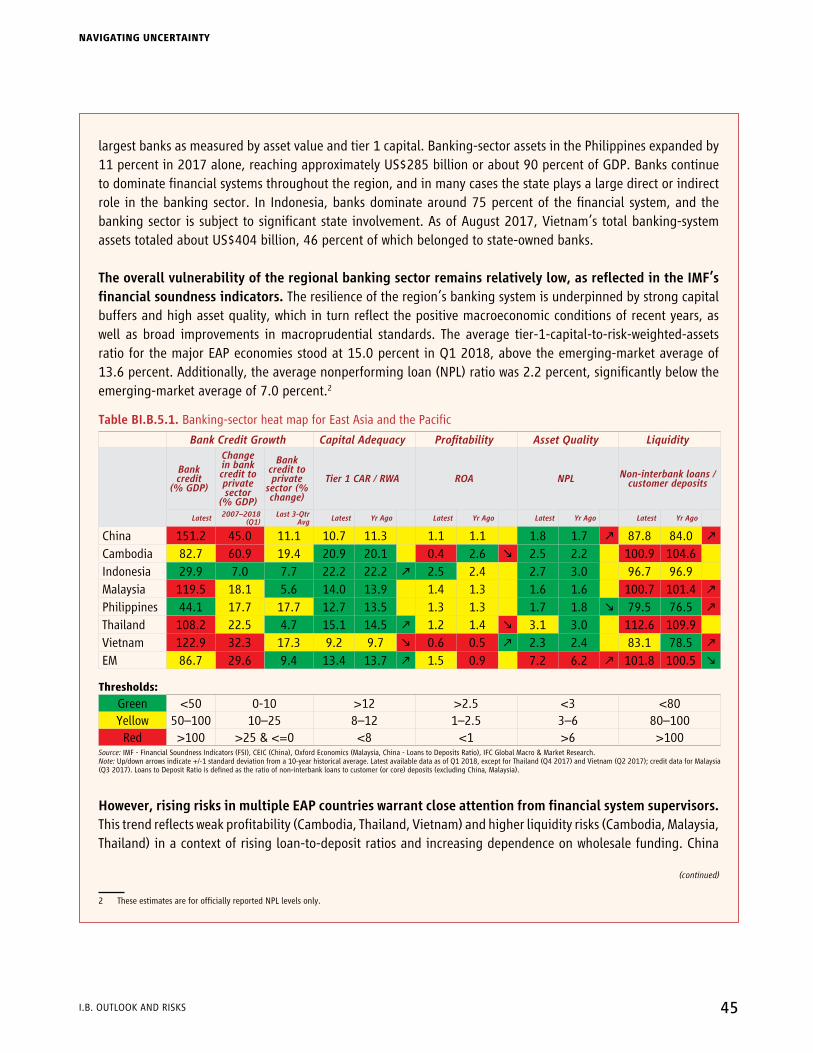
largest banks as measured by asset value and tier 1 capital. Banking-sector assets in the Philippines expanded by 11 percent in 2017 alone, reaching approximately US$285 billion or about 90 percent of GDP. Banks continue to dominate financial systems throughout the region, and in many cases the state plays a large direct or indirect role in the banking sector. In Indonesia, banks dominate around 75 percent of the financial system, and the banking sector is subject to significant state involvement. As of August 2017, Vietnam’s total banking-system assets totaled about US$404 billion, 46 percent of which belonged to state-owned banks.
Theoverallvulnerabilityoftheregionalbankingsectorremainsrelativelylow,asreflectedintheIMF’sfinancialsoundnessindicators.The resilience of the region’s banking system is underpinned by strong capital buffers and high asset quality, which in turn reflect the positive macroeconomic conditions of recent years, as well as broad improvements in macroprudential standards. The average tier-1-capital-to-risk-weighted-assets ratio for the major EAP economies stood at 15.0 percent in Q1 2018, above the emerging-market average of 13.6 percent. Additionally, the average nonperforming loan (nPL) ratio was 2.2 percent, significantly below the emerging-market average of 7.0 percent.2
Table BI.B.5.1. Banking-sector heat map for East Asia and the Pacific
Bank Credit Growth Capital Adequacy Profitability Asset Quality Liquidity
Bank credit
(% GDP)
Change in bank credit to private sector
(% GDP)
Bank credit to private
sector (% change)
Tier 1 CAR / RWA ROA NPL Non-interbank loans / customer deposits
Latest 2007–2018 (Q1)
Last 3-Qtr Avg Latest Yr Ago Latest Yr Ago Latest Yr Ago Latest Yr Ago
China 151.2 45.0 11.1 10.7 11.3 1.1 1.1 1.8 1.7 87.8 84.0 Cambodia 82.7 60.9 19.4 20.9 20.1 0.4 2.6 2.5 2.2 100.9 104.6Indonesia 29.9 7.0 7.7 22.2 22.2 2.5 2.4 2.7 3.0 96.7 96.9Malaysia 119.5 18.1 5.6 14.0 13.9 1.4 1.3 1.6 1.6 100.7 101.4 Philippines 44.1 17.7 17.7 12.7 13.5 1.3 1.3 1.7 1.8 79.5 76.5 Thailand 108.2 22.5 4.7 15.1 14.5 1.2 1.4 3.1 3.0 112.6 109.9Vietnam 122.9 32.3 17.3 9.2 9.7 0.6 0.5 2.3 2.4 83.1 78.5 EM 86.7 29.6 9.4 13.4 13.7 1.5 0.9 7.2 6.2 101.8 100.5
Thresholds:
Green <50 0-10 >12 >2.5 <3 <80Yellow 50–100 10–25 8–12 1–2.5 3–6 80–100Red >100 >25 & <=0 <8 <1 >6 >100
Source: IMF - Financial Soundness Indicators (FSI), CEIC (China), Oxford Economics (Malaysia, China - Loans to Deposits Ratio), IFC Global Macro & Market Research.Note: Up/down arrows indicate +/-1 standard deviation from a 10-year historical average. Latest available data as of Q1 2018, except for Thailand (Q4 2017) and Vietnam (Q2 2017); credit data for Malaysia (Q3 2017). Loans to Deposit Ratio is defined as the ratio of non-interbank loans to customer (or core) deposits (excluding China, Malaysia).
However,risingrisksinmultipleEAPcountrieswarrantcloseattentionfromfinancialsystemsupervisors.This trend reflects weak profitability (Cambodia, Thailand, Vietnam) and higher liquidity risks (Cambodia, Malaysia, Thailand) in a context of rising loan-to-deposit ratios and increasing dependence on wholesale funding. China
2 These estimates are for officially reported nPL levels only.
(continued)
45
NAVIGATING UNCERTAINTY
I.B. OUTLOOK AND RISKS

and Vietnam continue to struggle with lower capital adequacy ratios than many of their regional peers, with tier-1-capital-to-assets ratios of 9.2 and 10.7 percent, respectively, in the latest quarter for which data are available. This is cause for concern given the perception that actual levels of bad assets in the financial system are higher than reported. In addition, elevated credit costs will continue to negatively impact profit margins.
Private-sectordebtremainsthemainsourceofriskstofinancialstabilityintheEAPregion.With the long period of low interest rates in the United States and Asia now approaching its end, most economies in the region have experienced significant growth in private-sector debt. According to estimates from the Institute of International Finance, the global debt stock reached US$237 trillion at end-2017, with corporate and personal debt reaching record levels around the world. In some Asian economies, the debt-to-GDP ratio is well above the global average. Since 2015–16, bank credit growth as a share of GDP has moderated in some of the most indebted countries, due in part to a concerted effort to deleverage and improve regulatory standards. However, the overall level of bank credit remains high in many regional countries, including China, Malaysia, Thailand, and Vietnam. Conversely, in Cambodia and the Philippines, where indebtedness levels are lower, bank credit has continued to grow at relatively fast rates of 19.4 and 17.7 percent, respectively, over the past three quarters. Indonesia is an exceptional case, as both the level and growth rate of bank credit have been low (Figure BI.B.5.2).
Figure BI.B.5.2. Bank credit as a share of GDP, 2006–2018
Figure BI.B.5.3. Decomposition of credit-to-GDP ratios, 2013–17
percent Percent Percent of GDP
100
80
60
40
20
0
160
140
120
100
80
60
40
6 8 10 12 14 16 18
300
250
200
150
100
50
0
CHN
2013 2017
EM IDN KOR MYS SGP THA
2013 2017 2013 2017 2013 2017 2013 2017 2013 2017 2013 2017
▬ CHN, rhs ▬ IDN ▬ MYS, rhs ▬ PHL ▬ THA, rhs ▬ KHM ▬ VNM, rhs J Credit to nonfinancial corporations J Credit to households
J Credit to general government ▬ Average of total credit to EM in 2017
Source: IMF International Financial Statistics; Oxford Economics; national sources; IFC Global Macro & Market Research.
Source: Bank of International Settlements.
Financial system vulnerabilities also stem from the private sector. Among EAP economies, China has the greatest exposure to corporate leverage risks, while Malaysia and Thailand have the most exposure to household debt (Figure BI.B.5.3). Following many years of using credit to spur growth, China now faces a large and growing debt overhang. Weak corporations, local government entities, and overleveraged nonbank financial institutions account for a large share of this debt. Moreover, credit growth has vastly outpaced GDP growth in recent years. As interest rate and prudential controls were put in place, banks and other financial intermediaries responded by developing a range of complex instruments, many of which were kept off bank balance sheets. Since 2016, China
(Box I.B.5 continued)
(continued)
EAST ASIA AND PACIFIC ECONOMIC UPDATE OCTOBER 2018
46 PART I. RECEnT DEVELOPMEnTS AnD OUTLOOK

has begun a slow and gradual deleveraging process, but the pace of the progress may slow as trade tensions escalate and domestic growth concerns become more evident.
InMalaysia,thehousehold-lendingsectoraccountedfor57percentoftotalbanking-systemloansasofApril 2018, andhouseholddebt remainedhigh at 84.6percent ofGDP inQ32017.Half of total household debt consists of mortgage exposure, about 85 percent of which belongs to primary homeowners. While investment-property mortgages account for just 3 percent of mortgage exposure, financial risks associated with residential and commercial property developers should be monitored. The overhang of unsold houses reached a 10-year high at the end of Q3 2017, exposing the housing market to a potential price adjustment. Moreover, the supply of new offices and shopping complexes is expected to reach historic levels in the coming years. According to the Malaysian central bank, commercial banks have become more cautious in lending to the real-estate sector, and they have sufficient buffers to absorb the potential impact of price corrections in the medium term.
InThailand,privatesectorcreditcomprisesthemajorityofhouseholddebt,whichequaled78percentofGDPatend-2017.Rising unemployment or higher interest rates could worsen conditions for small businesses and households, potentially compromising their ability to make good on their obligations. There are also some asset-quality issues related to unsecured retail loans and loans to small and medium enterprises that exhibit weak economic performance. These and other regional vulnerabilities are described in Table BI.B.5.2, below.
Table BI.B.5.2. Key banking-sector vulnerabilities in the East Asia and Pacific region
Country Banking Sector Vulnerabilities
China
• The financial sector is increasingly vast, complex, and interconnected, with a large stock of nonfinancial-sector debt
• There are general concerns about underlying asset quality • Corporations account for about two-thirds of total credit to nonfinancial sectors, and credit to households has increased rapidly in recent years
Indonesia
• Banks are exposed to corporate vulnerabilities, and financial soundness varies across banks • Many banks, especially smaller banks, are vulnerable to liquidity shocks, including foreign-exchange liquidity shortfalls, due to their reliance on short-term deposits and limited access to the money market
• The share of NPLs in total loans has stabilized at just below 3 percent, due to improved corporate performance and household debt-service capacity, but special-mention loans and restructured loans remain elevated
Malaysia
• The household-debt-to-GDP ratio is high by international standards • Financial risks associated with residential and commercial property should be monitored • The overhang of unsold houses reached a 10-year high in Q3 2017, exposing the housing market to a potential price adjustment
Philippines
• Rapid credit growth, particularly in the real-estate and household-lending sectors, could increase systemic risks
• Certain conglomerates and real-estate developers have high leverage ratios • Shadow banking activities have expanded
(continued)
(Box I.B.5 continued)
47
NAVIGATING UNCERTAINTY
I.B. OUTLOOK AND RISKS

The interaction of these risks could exacerbate short-term vulnerabilities and hinder growth prospects
While each of the risks described above would have damaging effects on its own, the combined impact of multiple shocks would be even greater. For instance, escalating protectionism combined with changing expectations regarding the pace of U.S. monetary policy normalization and/or deteriorating EMDE investor confidence could precipitate large and rapid capital outflows from developing EAP and lead to further appreciation of the U.S. dollar. Domestic vulnerabilities—such as elevated domestic debt levels and large external financing needs, which persist among some countries in the region—would amplify the impact of external shocks, especially where policy buffers are limited, prompting further capital outflows and dampening growth. A stronger U.S. dollar is likely to accentuate bilateral trade imbalances, which may provoke further trade measures from the U.S. administration, reinforcing the negative cycle.
There is also a risk that converging external headwinds could stoke protectionist sentiment within the region. Facing rising protectionism in advanced economies, depreciating domestic currencies, widening current account deficits in some regional countries, and worries about increased domestic market competition from diverted Chinese exports, there are already some calls for higher import barriers and more nationalistic economic policies within developing EAP. In Indonesia and Vietnam, for example, concerns that Chinese manufacturers may attempt to divert exports from the U.S.
Table BI.B.5.2. Key banking-sector vulnerabilities in the East Asia and Pacific region
Country Banking Sector Vulnerabilities
Thailand
• The household-debt-to-GDP ratio is high by international standards and reached 78 percent of GDP at end-2017
• There are asset-quality issues related to unsecured retail loans and loans to small and medium enterprises that exhibit weak economic performance
• Questionable practices among savings cooperatives (e.g., debt rollover and maturity mismatches) are increasing financial-sector risks
Vietnam • There are outstanding legacy issues in the financial sector and among state-owned enterprises • Progress in addressing NPLs has been uneven, and NPL ratios are still high for several banks • System-wide profitability is low compared to other emerging markets, reflecting high provisioning needs
Source: IMF, Article IV staff reports: China (August 2017); Indonesia (February 2018); Malaysia (March 2018); the Philippines (November 2017); Thailand (June 2018); Vietnam (July 2018).
Despite these vulnerabilities, the outlook for the regional banking system remains broadly positive, given strongbalancesheets,manageableassetquality,andstableprofitprojections.Overall, the banking sector is well capitalized, and its buffers appear adequate to withstand potential shocks in the short-to-medium term. However, as monetary policies become less accommodative, financial systems that rely on the wholesale market for funding will face higher financing costs, though high lending spreads should partly offset these costs in the short term. Nevertheless, continued monitoring is important in a context of high levels of indebtedness, gradually rising U.S. interest rates—which will prompt subsequent interest-rate adjustments in Asia—and intensifying trade tensions between the United States and China, which will increase the burden faced by borrowers, putting pressure on the region’s financial stability.
(Box I.B.5 continued)
EAST ASIA AND PACIFIC ECONOMIC UPDATE OCTOBER 2018
48 PART I. RECEnT DEVELOPMEnTS AnD OUTLOOK

to their markets have led to calls for measures to protect domestic industries.25 Meanwhile, the Malaysian authorities are considering restricting imports of foreign vehicles to promote domestic production.26
AmongthePacificislandcountries,risksremaintiltedtothedownside
PICs face both internal and external risks to their growth outlook. Despite their generally less-complex economic structures, PICs are still exposed to potential spillovers from the heightened uncertainty clouding the regional economic outlook. A severe adjustment in global financial markets would have important valuation effects for PICs’ sovereign wealth funds, potentially impacting future fiscal sustainability in FSM, Kiribati, nauru, Palau, RMI, and Tuvalu. Slower global growth could also diminish remittances from overseas workers, which are a particularly important component of household income in Samoa, Tonga, and Fiji. The Pacific region’s vulnerability to natural disasters was again highlighted in early 2018, when Papua new Guinea, Fiji, FSM, and Tonga suffered earthquakes, cyclones, and floods that inflicted a tragic human toll, as well as considerable economic losses, and put additional pressure on private and public balance sheets. On the domestic front, a sharp policy-induced slowdown in the logging sector in the Solomon Islands would negatively impact growth and government revenues, but if logging output is not restricted, the depletion of the country’s forest stock could have severely negative impacts on environmental and fiscal sustainability, as well as economic growth. Finally, strong revenues from fishing-license fees provide an opportunity to bolster sovereign wealth funds and increase investment in critical public infrastructure. However, higher revenues have also led to looser controls on the public payroll. If these increased revenues prove temporary, hikes in permanent spending on personnel could threaten medium-term fiscal sustainability in Kiribati, nauru, RMI, and Tuvalu. In Tonga, high public-sector staff costs have previously resulted in recurrent spending crowding out capital spending. Consequently, for all of these countries, fiscal sustainability depends on the success of measures to control the public wage bill.
Continued efforts to build fiscal space and improve expenditure quality will help mitigate risks to debtsustainability. Among countries currently benefiting from elevated fishing-related revenues, fiscal sustainability hinges on keeping recurrent expenditures consistent with a conservative estimate of average future revenues. Across PICs, attention to expenditure quality is vital, as large deficits in infrastructure and essential services, as well as young and growing populations, create pressing needs that cannot be met without more effective spending. In addition, room needs to be left for disaster-related expenditure shocks, especially as climate change increases the frequency and severity of these shocks. Protecting and improving debt sustainability will also require ongoing vigilance in the application of debt ceilings and concessionality requirements for new borrowing.
25 Soeriaatmadja, 2018; Uyen, 2018.26 Bowie, 2018.
49
NAVIGATING UNCERTAINTY
I.B. OUTLOOK AND RISKS
I.C. Policy Considerations
In a context of rising global economic risks, policymakers in developing EAP will need to utilize the full range of available macroeconomic, structural, and prudential policies. National authorities should consider a four-pronged approach to enhance their policy preparedness and economic resilience. First, short-term vulnerabilities need to be reduced through the judicious use of prudential regulation, exchange rate flexibility, and the accumulation of fiscal buffers. Second, actions are needed to strengthen the global rules-based trading and investment system, including measures to promote deeper regional economic integration. Third, growth-enhancing structural reforms should continue, both to raise potential growth rates and to reassure financial markets that long-term fundamentals remain strong. Finally, greater investment in human capital and social protection are necessary to strengthen economic security and promote economic mobility.
Mitigate short-term vulnerabilities and enhance preparedness
ProactivemacroprudentialpoliciescanhelpdevelopingEAPcountriesaddressfinancialsectorvulnerabilitiesstemmingfromexcessivecreditgrowth,significantcreditconcentration,andhighleverage.Cambodia, China, Myanmar, and Vietnam may need to take additional steps to prevent excessive credit flows to, or credit concentration in, high-risk sectors such as real estate and construction via measures such as restrictions on loan-to-value ratios, countercyclical capital requirements, and loan provisions. Similar measures—along with leverage ratios and credit-growth caps—may provide useful tools to address high rates of household leverage in China, Malaysia, and Thailand. These provisions could be complemented by revisions to zoning policies and the tax treatment of residential and commercial real estate, particularly real estate owned by investors. The Chinese authorities could also consider increasing the use of debt-service-to-income ratio caps and broadening their application to include nonmortgage loans and borrowing via fintech channels.27
China’s policy stimulus to support short-term growth needs to be consistent with sustaining progress toward deleveragingandensuringthesustainabilityoflocalgovernmentfinances.Although China’s growth performance still appears strong, concerns about a potential slowdown due to escalating trade tensions have led authorities to pre-emptively loosen monetary, fiscal and prudential policies. The envisioned fiscal stimulus once again highlights debt financing for higher levels of investment by local governments. To the extent that stimulus measures might relax recent restrictions on bank lending and off-budget borrowing for public investment, some recent hard-won gains in moderating credit growth and promoting fiscal sustainability at the local level could be at risk. Continued progress in these areas is important for improving the return to investment and reducing macroeconomic vulnerabilities that could negatively influence longer-term growth prospects.
Macroprudentialmeasuresmayhelp attenuate the effects of heightenedfinancialmarket volatility amongcountries with relatively open capital markets. With further financial market volatility possible over the forecast horizon, policymakers in Indonesia, Malaysia, the Philippines and Thailand could consider imposing additional measures—or strengthening and broadening existing measures—to reduce the volatility of nonresident investor flows. Such measures include reserve requirements on domestic debt instruments, minimum asset-holding periods, and time-based ceilings on outflows (i.e., monthly maximums). Efforts to reinforce regulatory and supervisory frameworks could
27 IMF, 2018b.
EAST ASIA AND PACIFIC ECONOMIC UPDATE OCTOBER 2018
50 PART I. RECEnT DEVELOPMEnTS AnD OUTLOOK

also help ensure that domestic financial systems are able to absorb, and safely and efficiently intermediate, higher capital flows. For example, stress tests such as the one recently conducted by the Indonesian Financial Services Authority28 can help analyze the shock-absorbing capacity of both individual financial institutions and the broader financial system.
Prudential provisions can also help developing EAP economies strengthen their resilience to rapid exchange rate movements by encouraging banks and corporations to reduce their balance-sheet mismatches. Indonesia’s recent reforms related to corporate hedging of foreign currency exposure provide an instructive example. These reforms included establishing minimum requirements for hedging net short-term foreign exchange liabilities, setting a high short-term liquidity ratio (i.e., the ratio of foreign exchange assets to foreign exchange liabilities maturing within three months), and establishing a minimum credit rating for corporations to be permitted to borrow externally. To safeguard financial stability, other national authorities—particularly those in Lao PDR and Vietnam—could consider adopting similar provisions for corporations where applicable. For commercial banks, regulations on foreign borrowing and lending to nonresidents, as well as reserve requirements for foreign currency deposits and derivative positions, may be appropriate in Lao PDR, Mongolia, and Vietnam. China could enhance the resilience of its banking sector by identifying systemically important banks and imposing an additional capital requirement on them.
Flexible exchange rates continue to serve as an important tool to absorb and adapt to external shocks. In countries that use a flexible exchange rate regime, currencies should be allowed to respond to changing fundamentals, as the impact of global financial shocks on domestic financial and macroeconomic conditions in EMDEs is amplified under pegged exchange rate regimes relative to more flexible regimes.29 Flexible exchange rates can also help absorb shocks created by strong capital flows, though authorities should carefully monitor inflationary pass-through effects and valuation effects on debt, which may justify a monetary policy response. During periods of financial market dislocation, central banks could resort to foreign exchange sterilization—as long as the purpose and duration of the policy is effectively communicated to the market—to smooth excessive exchange rate and capital market volatility without the need for excessive policy tightening.
Buildingfiscalbuffersandstrengtheningdebtsustainabilityareimportanttoenhanceresilience.Supported by robust growth and rising revenues, most developing EAP economies generally ran modest fiscal deficits from 2015 to 2017, which kept debt burdens stable (Figure I.C.1 and Figure I.C.2). Under the baseline scenario, fiscal deficits are projected to remain contained. However, in a context of intensifying risks, EAP countries would do well to refocus their fiscal policies on preserving and rebuilding buffers where needed and reducing public-debt-to-GDP ratios. Prudent fiscal consolidation, combined with adequate external and fiscal buffers and growth-enhancing reforms, can help guard against a disorderly financial market adjustment. Fiscal consolidation is especially important for countries with large current account deficits, including Cambodia, Indonesia, Lao PDR, Malaysia, and Mongolia. To this end, improved revenue collection should be prioritized. The Indonesian authorities should accelerate reform activities in line with their medium-term revenue mobilization strategy. In Malaysia, recent changes to the consumption tax system and the fuel pricing mechanism, together with concerns about the extent of contingent liabilities, indicate that identifying adequate compensatory revenue-raising measures will be important to safeguard long-term fiscal and debt sustainability.30 With public debt levels already close to the legislated ceiling of 65 percent of GDP in Vietnam, policymakers should push ahead with the delayed VAT reform process while improving natural-resource and property-tax collection. In the Philippines, an expanding fiscal deficit is expected to widen the current account deficit due to rising capital goods imports, which could
28 Conducted in April 2018, the financial stress test demonstrated that the Indonesian financial system is well prepared to withstand various negative shocks, including a potential depreciation of the rupiah up to a level of 20,000, a worsening NPL ratio, and higher interest rates (Jefriando, 2018).
29 Obstfeld et al., 2018.30 In August, the Malaysian finance minister announced that the repeal of the Goods and Services Tax and the reintroduction of the Sales and Services Tax would reduce 2019 tax revenue
by about 23 billion ringgits, or about 1.6 percent of nominal GDP.
51
NAVIGATING UNCERTAINTY
I.C. POLICY COnSIDERATIOnS
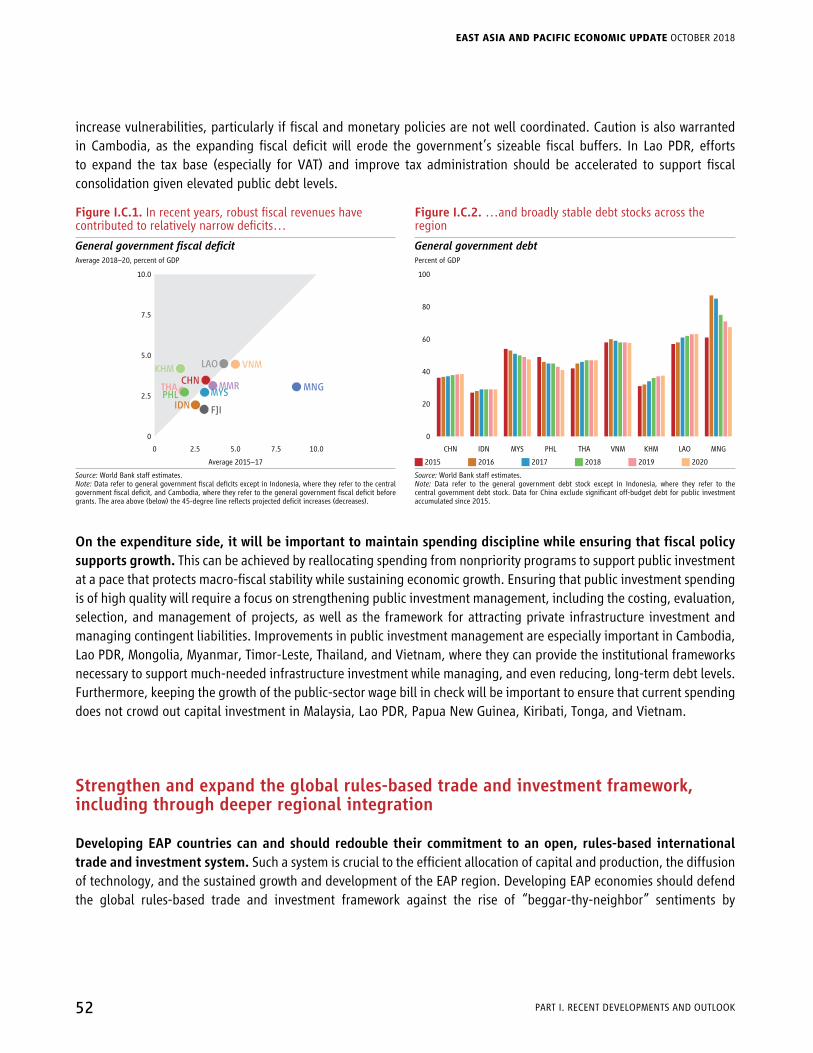
increase vulnerabilities, particularly if fiscal and monetary policies are not well coordinated. Caution is also warranted in Cambodia, as the expanding fiscal deficit will erode the government’s sizeable fiscal buffers. In Lao PDR, efforts to expand the tax base (especially for VAT) and improve tax administration should be accelerated to support fiscal consolidation given elevated public debt levels.
Figure I.C.1. In recent years, robust fiscal revenues have contributed to relatively narrow deficits…
Figure I.C.2. …and broadly stable debt stocks across the region
General government fiscal deficit General government debtAverage 2018–20, percent of GDP Percent of GDP
0 2.5 5.0 7.5 10.0
10.0
7.5
5.0
2.5
0
KHM
CHN
VNM
IDN
THA MNGPHL
LAO
FJI
MMRMYS
100
80
60
40
20
0
CHN IDN MYS PHL THA VNM KHM LAO MNG
Average 2015–17 J 2015 J 2016 J 2017 J 2018 J 2019 J 2020
Source: World Bank staff estimates.Note: Data refer to general government fiscal deficits except in Indonesia, where they refer to the central government fiscal deficit, and Cambodia, where they refer to the general government fiscal deficit before grants. The area above (below) the 45-degree line reflects projected deficit increases (decreases).
Source: World Bank staff estimates.Note: Data refer to the general government debt stock except in Indonesia, where they refer to the central government debt stock. Data for China exclude significant off-budget debt for public investment accumulated since 2015.
Ontheexpenditureside,itwillbeimportanttomaintainspendingdisciplinewhileensuringthatfiscalpolicysupports growth. This can be achieved by reallocating spending from nonpriority programs to support public investment at a pace that protects macro-fiscal stability while sustaining economic growth. Ensuring that public investment spending is of high quality will require a focus on strengthening public investment management, including the costing, evaluation, selection, and management of projects, as well as the framework for attracting private infrastructure investment and managing contingent liabilities. Improvements in public investment management are especially important in Cambodia, Lao PDR, Mongolia, Myanmar, Timor-Leste, Thailand, and Vietnam, where they can provide the institutional frameworks necessary to support much-needed infrastructure investment while managing, and even reducing, long-term debt levels. Furthermore, keeping the growth of the public-sector wage bill in check will be important to ensure that current spending does not crowd out capital investment in Malaysia, Lao PDR, Papua New Guinea, Kiribati, Tonga, and Vietnam.
Strengthen and expand the global rules-based trade and investment framework, including through deeper regional integration
Developing EAP countries can and should redouble their commitment to an open, rules-based international trade and investment system. Such a system is crucial to the efficient allocation of capital and production, the diffusion of technology, and the sustained growth and development of the EAP region. Developing EAP economies should defend the global rules-based trade and investment framework against the rise of “beggar-thy-neighbor” sentiments by
EAST ASIA AND PACIFIC ECONOMIC UPDATE OCTOBER 2018
52 PART I. RECEnT DEVELOPMEnTS AnD OUTLOOK

resisting calls for more protectionist domestic measures31 and by renewing their commitment to deepening regional trade and investment integration via initiatives such as the Comprehensive and Progressive Agreement for Trans-Pacific Partnership (CPTPP), the Regional Comprehensive Economic Partnership (RCEP), and the Belt and Road Initiative (BRI). China’s recent announcement that it will continue to reduce average tariff rates on imports is a welcome signal in this regard.32 A further escalation of trade tensions could also be avoided by seeking negotiated agreements to resolve trade disputes either bilaterally or via the World Trade Organization (WTO).
DeepeningexistingtradeagreementscouldenhancethebenefitsofgreatertradeopennessamongdevelopingEAP countries. Most preferential trade agreements (PTAs) in EAP do not cover key policy areas included in WTO agreements, such as public procurement, subsidies, state trading companies, and nontariff barriers. Extending PTAs to encompass these areas while strengthening protections on foreign investment and intellectual property rights, improving competition policies, and ensuring a level playing field for SOEs could encourage greater specialization and promote the deepening of global value chains.33
There remain considerable opportunities to expand services trade within developing EAP, with potentially large growth payoffs. While regional governments have substantially liberalized goods trade, policies regarding services trade remain restrictive, as developing EAP countries have been much less willing to open their service sectors to both global and regional trade and investment flows. However, liberalized services trade could be a powerful engine for productivity growth, with less cyclical sensitivity than goods trade.34 Under the ASEAn Framework Agreement on Services (AFAS), member countries have begun to liberalize services trade by broadening coverage and reducing limitations on market access. The next step is to negotiate and implement the ASEAn Trade in Services Agreement (ATISA) as the legal instrument for further integrating the services sector across Southeast Asia.35
The CPTPP could be expanded to other developing EAP economies. The agreement will enter into force when it has been ratified by six of its 11 signatories. To date, Japan, Mexico, and Singapore have completed their ratification processes, and Australia, New Zealand, and Vietnam are likely to complete their processes by the end of 2018—suggesting that the CPTPP could take effect by the end of the year. In another important step toward greater international economic integration and reduced protectionism, negotiators from the 11 CPTPP signatories have agreed to start accession talks with potential new members in 2019. Colombia, Indonesia, the Philippines, South Korea, Sri Lanka, Thailand, and Taiwan, China have all expressed an interest in joining an expanded CPTPP.36 Free trade agreements (FTAs) such as the CPTPP are expected to create jobs and help reduce poverty among participating countries, though they can also increase inequality (Box I.C.1).
The RCEP37 has the potential to achieve ambitious reductions in nontariff barriers and liberalize trade in services. In June, ministers from the RCEP countries announced their intention to finalize an agreement by the end of 2018. Deep reductions in nontariff barriers, measures to strengthen the protection of intellectual property rights, and efforts to promote trade in services could greatly enhance the benefits of the RCEP.
31 While in some circumstances protectionist policies could help mitigate the short-term effects of external shocks on some narrow interest groups or policy objectives, the medium-term impacts are almost certain to be welfare-reducing on balance. In fact, import and export restrictions are likely to reduce efficiency and productivity even in the short term, harming competitiveness and diminishing both current and future growth prospects (Topalova and Khandelwal, 2011; Kasahara and Lapham, 2013; Halpern et al., 2015).
32 Bloomberg, 2018.33 Laget et. al., 2018.34 Constantinescu et al., 2018; Borchert and Mattoo, 2010.35 ASEAn Secretariat, 2015.36 Harding et al., 2018; Tani, 2018; Angulo, 2018.37 The RCEP is a proposed FTA that would encompass the 10 ASEAn states plus six Asia-Pacific partners (Australia, China, India, Korea, new Zealand, and Japan).
53
NAVIGATING UNCERTAINTY
I.C. POLICY COnSIDERATIOnS

Box I.C.1. The Distributional Impacts of Free-Trade Agreements in Vietnam and Indonesia1
VietnamandIndonesiaarebothevaluatingthecomplexdistributionalconsequencesofenteringamajorEAP regional free trade agreement (FTA), the Comprehensive and Progressive Agreement for Trans-PacificPartnership(CPTPP).2 Vietnam has already signed the CPTPP, while Indonesia is still considering the merits of joining an expanded 15-country CPTPP community (CPTPP-15), which would include Thailand, the Philippines, and South Korea.3 This box analyzes the distributional impacts of Vietnam’s entry into the CPTPP, as well as the potential implications of CPTPP-15 membership for Indonesia.
Because FTAs impact the economy through a variety of channels, their effects can be analyzed through a general equilibrium framework.By increasing the size of markets and leveraging national comparative advantages, FTAs alter the composition of production and trade. As this occurs, the reallocation of economic resources across sectors impacts wages, employment, household income, and consumer prices, thereby affecting the incidence of poverty and the distribution of income. These economic and distributional effects can be assessed through a macro-micro modeling framework that links a computable general equilibrium (CGE) model with detailed household-level information from income and expenditure surveys.4 The macro-micro simulation distributes shocks from the CPTPP and simulates impacts on (i) the reallocation of labor across sectors, (ii) changes in relative wage rates, and (iii) changes in real household income, including changes in prices for food and nonfood consumer goods.
UnlikeIndonesia,VietnamisexpectedtofacesignificantlyreducedtariffsasaconsequenceofjoiningtheCPTPP,whilebothcountrieswillexperienceasubstantialreductioninnontariffmeasures(NTMs)inforeign markets. The average trade-weighted tariff rate for Vietnamese exports in the CPTTP area will fall from 1.7 percent to 0.2 percent. By contrast, Indonesia will experience only a marginal decline, since its average trade-weighted tariff rate in CPTPP markets is already close to zero—though tariffs on Indonesian apparel and leather goods will drop significantly from their current average of 5.9 percent. In ad valorem-equivalent terms, the nTMs faced by both countries are higher that their respective average trade-weighted tariff rates and are expected to experience a larger decline. NTMs are expected to drop by 3.6 percentage points for Vietnam and 3.3 percentage points for Indonesia in ad valorem-equivalent terms. CPTPP membership is expected to increase market access for Vietnam, especially in the food, beverage, and tobacco, and apparel and leather sectors.5 Meanwhile, Indonesia’s market access is projected to expand in the food, beverage, and tobacco, communications and business services, and finance and other business services sectors.
1 This box was prepared by Maryla Maliszewska, Israel Osorio-Rodarte and Massimiliano Cali. It is based on Maliszewska, Olekseyuk and Osorio-Rodarte (2018) and Maliszewska, et. al. (2018).
2 This box analyses the potential impacts on the incidence of poverty using two international poverty lines, US$3.20 and US$5.50 per day in purchasing-power-parity terms. Detailed changes in the distribution of benefits are assessed by comparing gains for each income percentile, which can be summarized graphically in growth-incidence curves.
3 The CPTPP includes Australia, Brunei, Canada, Chile, Japan, Malaysia, Mexico, new Zealand, Peru, Singapore, and Vietnam. The Trans-Pacific Partnership was transformed into the CPTPP after the United States withdrew its participation in 2017. The remaining countries continued the negotiations in an effort to maintain the ambition that marked the original agreement. The CPTPP encompasses about 14 percent of global GDP, 16 percent of global trade, and 500 million people.
4 This analysis uses the 2012 Vietnam Household Living Standard Survey and the 2014 Indonesian national Socio-Economic Survey.5 See Maliszewska et al. (2018) for a detail discussion of the expected reductions in tariffs and NTMs at the sector level.
(continued)
EAST ASIA AND PACIFIC ECONOMIC UPDATE OCTOBER 2018
54 PART I. RECEnT DEVELOPMEnTS AnD OUTLOOK

Under theCPTPP,Vietnamhas also committed to significantly reduce tradebarriers in its domesticagricultural sector. As a result, Vietnamese agricultural exports are expected to decline as imports increase, with both approaching US$20 billion by 2030. The CGE model accounts for both the positive welfare effects produced by lower food prices resulting from cheaper agricultural imports and the loss of income among workers in the agricultural sector due to diminished exports.
CPTPP membership is expected to positively impact poor households in both countries. In general, trade agreements have the greatest effect on poverty when they enhance economic opportunities in sectors where many of the poor are already employed. In this context, the CPTPP is expected to generate a modest but significant decrease in poverty rates in both Vietnam and Indonesia. By 2030, CPTPP membership is expected to enable more than 0.6 million Vietnamese to rise above the poverty line,6 reducing the poverty rate by about 0.57 percentage points. In Indonesia, CPTPP membership should enable almost 1.3 million people to escape poverty, lowering the poverty rate by 0.43 percentage points (Figure BI.C.1.1, Panel A).
Figure BI.C.1.1. The projected distributional impact of CPTPP membership, Vietnam and Indonesia
A. Effect on poverty rates B. Effect on growth-incidence curves, 2030Percentage-point decrease from baseline Percent increase from baseline
0.6
0.5
0.4
0.3
0.2
0.1
0
$3.20/day $5.50/day
2.5
2.0
1.5
1.0
0.5
0
0 8 16 24 32 40 48 56 64 72 80 88 96
J CTPPP-Vietnam J CPTPP15-Indonesia ▬ CTPPP-Vietnam ▬ CPTPP15-Indonesia
Inbothcountries,CPTPPmembershipwillbenefitmiddle-classandwealthierhouseholdsmorethanpoorhouseholds, as the FTA is expected to create more economic opportunities for skilled workers. The growth-incidence curves for both countries reveal that households in the poorest quintile of the income distribution will benefit from the CPTPP, but that benefits will tend to increase with income level from the bottom through the middle quintiles (Figure BI.C.1.1, Panel B). In both cases, benefits will tend to level off between the middle and upper quintiles, and in the case of Indonesia households in the lower-middle class are expected to benefit slightly more than households in the top quintile. These distributional effects are primarily the result of rising wages, as CPTPP membership is expected to boost demand for skilled labor, though in Indonesia the CPTPP is also expected to have a mildly progressive impact on food prices.
6 The poverty line used in these estimates is US$5.50 per day in purchasing-power-parity terms.
(Box I.C.1 continued)
55
NAVIGATING UNCERTAINTY
I.C. POLICY COnSIDERATIOnS

While the BRI could generate substantial gains, the countries involved should take steps to mitigate its potential risks. In addition to improving trade facilitation by reducing transportation costs (Box I.C.2), the BRI offers opportunities for regional economies to access financing for important domestic infrastructure projects. These projects can ease infrastructure constraints, catalyzing growth and private sector development. However, the risks associated with the BRI need to be precisely identified and addressed. Large amounts of borrowing, even on concessional terms, could increase the risk of sovereign debt distress, unless steps are taken to ensure that the projects being financed are economically viable. Hurley, et al. (2018) report that 23 out of 68 countries that are hosting BRI projects could be at risk of debt distress. In addition, there are inherent environmental and social risks associated with all large infrastructure projects, which host countries will need to mitigate through appropriate safeguards.
Developing EAP countries should also consider new trade arrangements. For example, the Vietnam-European Union FTA, to be ratified this year, is expected to eliminate 99 percent of custom duties on goods while reducing various nontariff barriers to trade. The agreement will open Vietnamese service markets to E.U. companies, and it has the potential to increase Vietnamese exports to the E.U. by one-third.38 Another example is the new bilateral FTA between Australia and Indonesia. First launched in 2010, negotiations concluded in August, and the agreement is expected to be in place by the end of 2018. Within developing EAP, Cambodia and Vietnam have recently signed a joint framework to foster extensive economic cooperation and connectivity. Negotiations to improve access for Cambodian exports to the Chinese market are also ongoing.
38 European Parliament, 2018.
Box I.C.2. The Growth and Welfare Effects of the Belt and Road Initiative1
The Belt and Road Initiative (BRI) is an ambitious Chinese-led development strategy focused onintensifying economic connectivity and cooperation on a transcontinental scale. Although its scope is still taking shape, the initiative’s “road” component is inspired by the ancient Eurasian “silk road” trading route, while the “belt” component involves building a series of maritime transportation corridors designed to boost trade and stimulate economic growth across Asia, Europe, and East Africa. The BRI encompasses a vast range of activities, including policy coordination, infrastructure development, trade and investment, financial flows, and personnel exchanges.
The implementation of all BRI transportation projects will have a positive systemic impact on global shipping time, with the EAP region reaping the largest gains. Using a combination of precisely geo-localized information on BRI transportation projects and a network algorithm, it is possible to compute average shipping times between any two countries in the world before and after the BRI. The results of this analysis indicate an average 1.2 percent decrease in shipping times across all pairs of countries. EAP countries are expected to experience the largest reduction in shipping times. The reduction in average shipping times from EAP countries to countries in other regions is estimated at 2.31 percent, including a 4.35 percent decrease in shipping times to
1 This box was prepared by François de Soyres (MnACE), based on two papers by François de Soyres, Alen Mulabdic and Michele Ruta (2018) and François de Soyres, Alen Mulabdic, Siobhan Murray, Nadia Rocha and Michele Ruta (2018).
(continued)
EAST ASIA AND PACIFIC ECONOMIC UPDATE OCTOBER 2018
56 PART I. RECEnT DEVELOPMEnTS AnD OUTLOOK

countries in South Asia and a 2.87 percent decrease in shipping times to countries in the Middle East and north Africa.2
While the “time sensitivity” of each sector will determine how the reduction in shipping time affects the costs of trade, EAP countries are expected to experience the largest gains across tradable sectors. Using estimates for time sensitivity derived from the literature, the reduction in trade costs varies significantly across geographic areas due to differences in export and import baskets between country pairs. Reduced trade costs will impact production costs in all countries, altering the distribution of comparative advantage. CGE modelling can estimate the effects of these changes on GDP and welfare indicators.
Figure B1.C.2.1. Average percentage change in shipping time (left) and trade costs (right) of East Asia and Pacific Countries due to the BRI
Sources: Based on de Soyres, Mulabdic and Ruta (2018). For each country, the decrease in shipping time and trade cost is the average taken with respect to all other countries in the world.
TheresultsofaquantitativetrademodelindicatethattheBeltandRoadInitiativewillincreasetheGDPof developing EAP countries by an average of 2.6 to 3.9 percent, which is greater than the expected gains for the world as a whole.3 The projected effects vary substantially across countries, with Cambodia, Vietnam, and Malaysia experiencing the largest gains in GDP. The magnitude of these gains reflects two forces. First, the networked nature of transportation infrastructure implies that increasing the efficiency of a given rail line or port facility will lower trade costs for all countries using that infrastructure, not just the country in which it is
2 These estimates were constructed by determining the average decrease in shipping times between all pairs of countries where the country of origin is in the EAP region and the destination country is in South Asia or the Middle East and north Africa.
3 These estimates are based on de Soyres et al. (2018), who use a quantitative CGE model along the lines of Caliendo and Parro (2014). The authors rely on assumptions described in their paper, and their estimates do not necessarily represent the views of the World Bank. The developing EAP countries included in the analysis are Cambodia, China, Indonesia, Lao PDR, Malaysia, Mongolia, the Philippines, Thailand, and Vietnam.
(continued)
(Box I.C.2 continued)
57
NAVIGATING UNCERTAINTY
I.C. POLICY COnSIDERATIOnS

Deepen structural reforms to support medium-term growth
In China, despite emerging headwinds to the near-term outlook, it remains important that authorities continue key supply-side reforms and the process of opening up of the economy. To enhance the country’s medium-term growth prospects, the reform agenda should remain focused on controlling credit growth, addressing excess capacity, implementing budget reforms for subnational governments, promoting fair competition, and opening up the economy. To slow credit growth and improve its efficiency, the authorities should remain focused on strengthening financial regulations and enforcing strong market-based financial discipline among firms, local governments, and financial institutions. Further progress in opening up the economy would boost medium-term potential growth by improving relations with trade and investment partners, thereby facilitating greater competition and access to foreign technology. It will be important that any additional demand-side policy stimulus remain consistent with sustaining progress toward
located. Second, the dense connectivity of production systems and regional value chains in EAP amplifies the economic effects of reduced trade costs.
The cost of BRI infrastructure projects will partially offset the initiative’s large average welfare effects. Many countries will benefit from new or upgraded infrastructure and faster shipping, but only a few countries are expected to pay for the BRI’s infrastructure improvements. Resources devoted to investment cannot be used for consumption, which reduces welfare gains and may even lead to welfare losses depending on the financing scheme. The resulting discrepancy between the geographical distribution of costs and benefits may impact the way different countries perceive the initiative. For example, the model predicts that if Mongolia were to pay the full costs of its BRI-related infrastructure improvements, those costs would outweigh the country’s gains from improved access to both export and import markets.
Likeallmodelingprojections,thecostandbenefitestimatespresentedabovereflectaspecificsetofunderlying assumptions. First, the analysis focuses on transportation infrastructure projects that can be mapped precisely, which represent only a subset of all projects currently being developed as part of the BRI. Second, while the structure of the model accounts for complex production linkages across countries, as well as possible import and export substitutions leading to shifts in comparative advantage, it omits other dynamics, such as technology transfer, foreign direct investment, or capital accumulation, that could affect GDP and welfare gains. Finally, both the total cost of the BRI projects included in the model and the distribution of payments for those projects are estimated based on the available information, as the precise figures have not been published.
(Box I.C.2 continued)
Figure B1.C.2.2. Average percentage changes in GDP and welfare for countries in developing EAPPercent
4
3
2
1
0
Lower bound Upper bound
2.59
1.73
3.88
2.81
J GDP J Welfare
Sources: Based on simulations presented in de Soyres, Mulabdic and Ruta (2018). Countries in “Developing East Asia Pacific” included in the analysis are Mongolia, Indonesia, China, Lao PDR, Philippines, Thailand, Malaysia, Vietnam and Cambodia.
EAST ASIA AND PACIFIC ECONOMIC UPDATE OCTOBER 2018
58 PART I. RECEnT DEVELOPMEnTS AnD OUTLOOK

deleveraging and the achievement of fiscal sustainability by local governments. Given the high degree of uncertainty in the outlook, continuing to pursue deleveraging and financial discipline in the short run, when growth momentum is still strong, would create more fiscal space to finance potential stimulus measures in the future.
In the context of slowing global trade, developing countries in EAP should continue to advance key structural reforms to enhance their competitiveness and improve their long-term growth prospects. Several improvements to the business environment are currently underway. Vietnam has made starting a business easier by publishing notices of incorporation online, reducing the cost of business registration, and streamlining the process for paying various taxes. The Philippines passed the Ease of Doing Business and Efficient Government Service Delivery Act in May 2018, which is designed to improve the business environment by streamlining administrative processes and reducing processing times by government agencies. A new Anti-Red Tape Authority, to be established under the Office of the President, will be responsible for monitoring agency compliance and overseeing the national policy for improving the ease of doing business. Malaysia is undertaking reforms to reduce business operating costs by automating procedures for licensing, tax registration, and land management, as well as efforts to improve competition in key sectors such as telecommunications. In Myanmar, the landmark 2017 Myanmar Companies Law, which took effect in August, introduces new standards for corporate governance and establishes an institutional framework to support the gradual opening up of the economy. The new law allows up to 35 percent foreign shareholding in local companies, removes some permit requirements for foreign companies, and reduces the number of products requiring export licenses. Across the region, implementing the provisions of these and other legal reforms, especially in lagging policy areas, remains a key challenge.
LevelingtheplayingfieldbetweenSMEsandlargefirms,andbetweenforeignanddomesticfirms,canhelpreduceresourcemisallocation,enhanceproductivity,andcreatejobs(PartII.B).Lowering entry barriers to start a business and reducing the costs of regulatory compliance would disproportionately help smaller firms. More importantly, countries should work to reduce preferential access to inputs and resources (currently enjoyed by some SOEs, for example). Fostering linkages between foreign- and domestically-owned firms, and between SMEs and large firms, could bolster the productivity of SMEs and help create new markets and high-quality domestic jobs. Along with their capacity to accelerate future job creation and improve welfare, such productivity-enhancing structural reforms can strengthen investor confidence in an economy’s medium-term fundamentals and help ameliorate capital outflows.
Enhance economic security and promote economic mobility
Intensifying risks to the global and regional outlook underscore the need to continue strengthening social protection programs. The incidence of social assistance benefits accruing to the poorest quintile in developing EAP is extremely low at less than 2 percent.39 In this context, expanding targeted cash transfer programs could reinforce economic security among the poor and vulnerable. The largest such program is China’s Rural Minimum Living Standard Guarantee, which now covers about 70 million people.40 In addition, establishing an effective, fiscally sustainable social insurance system can provide critical support against economic shocks. Healthcare is a key component of social insurance, and many EAP countries are making substantial progress toward universal health coverage, though many challenges remain.41 Among the PICs, cash transfer programs can play a dual role by supporting the livelihoods of the
39 World Bank, 2018e.40 World Bank, 2018d.41 See, e.g., World Bank, 2014a for Vietnam; Yu, 2015 for China; and World Bank, 2018d for Thailand.
59
NAVIGATING UNCERTAINTY
I.C. POLICY COnSIDERATIOnS

poor, while also providing a rapidly scalable mechanism to disburse assistance to vulnerable and affected households following a natural disaster.
Increasing intergenerational mobility is an integral part of inclusive growth (Part II.A). Promoting both absolute mobility (i.e., the extent to which individuals are wealthier or better educated than their parents) and relative mobility (i.e., the extent to which the relative income and education level achieved by individuals is independent of the level achieved by their parents), could help improve social cohesion, reduce inequality, and promote growth.
Three policy options for promoting economic mobility are worth exploring. First, countries in the region should consider increasing investment in prenatal and early childhood development. Relatively low-cost investments in this early stage can have significant impacts on educational outcomes and lifetime earnings and help obviate developmental gaps that are otherwise difficult to close later in life. Successful examples of such interventions include relatively inexpensive supplemental nutritional support and nutrition awareness programs for mothers. Universal preschool programs can also play an important equalizing role, as evidence suggests that programs that start before children reach the age of three can have long-lasting effects on cognitive abilities. Most developing EAP countries provide good health service coverage for pregnancy and birth, but coverage rates for child health, development, and preschool programs are much lower.42
Second,measurestoreducegapsineducationaccessandqualitycanhelpimproveintergenerationalmobility.Across countries, large gaps in learning outcomes are observed between children of parents with different levels of income and education.43 Governments can reduce these gaps by channeling resources to schools in geographically disadvantaged areas and by increasing salaries for teachers working in those schools to help equalize teacher quality. For example, the Vietnamese public education system allocates more spending per capita to geographically disadvantaged provinces and provides higher salaries and various allowances to teachers working in these disadvantaged areas to help reduce gaps in teacher quality.44 Scholarships and tuition subsidies to students from low-income families can further reduce educational disparities. Eliminating pedagogic approaches that track students by academic ability, or postponing them until students are older, can further promote equality of opportunity.
Finally, targeted cash transfer programs can promote private investment in human capital. Transfers targeted to disadvantaged households can promote educational mobility by alleviating constraints on household resources and access to finance, and they have been found to positively impact school attendance and other education indicators. Cash transfer programs have been widely adopted in EAP countries, including Cambodia, Indonesia, and the Philippines.
AnagendaforthePacificislandcountries
In the PICs,maintainingfiscal and debt sustainability while continuing to advance key structural reformsremains a challenge. The frequency and scale of natural disasters among the PICs heightens the importance of using medium-term economic and fiscal planning to minimize the adverse impacts of these shocks on development outcomes. Reinforcing resilience against natural disasters requires building fiscal buffers, strengthening crisis preparedness, management, and mitigation, and expanding targeted social protection mechanisms. Given the scope of this challenge and their limited revenue envelopes, PICs should focus on enhancing public expenditure efficiency to ensure sufficient
42 World Bank, 2018c.43 Ibid.44 Ibid.
EAST ASIA AND PACIFIC ECONOMIC UPDATE OCTOBER 2018
60 PART I. RECEnT DEVELOPMEnTS AnD OUTLOOK

fiscal space is available for priority spending while reinforcing debt sustainability. Improved management of natural resources, including fisheries and forests, is also a key priority, as strong regulatory frameworks are necessary to increase resource revenues while ensuring environmental sustainability. Continued investment in human capital through more efficient public health and education systems will be essential to promote economic mobility, raise living standards, and expand the access of Pacific workers to larger regional labor markets.
Alleviating the negative impact of de-risking is a critical priority for the PICs. In a context marked by declining cross-border lending in the wake of the global financial crisis, stricter Anti-Money Laundering and Combating the Financing of Terrorism (AML/CFT) regulations have resulted in the cancellation of correspondent banking relationships (CBRs) in some jurisdictions.45 The loss of CBRs through the de-risking process has critical implications for many PICs, due to their limited number of banks and the outsized role of remittances in supporting household welfare. Consequently, designing and implementing effective measures to limit the negative impact of de-risking will be critical to maintain economic and financial stability in the Pacific (Box I.C.3).
45 CBRs are bilateral arrangement between onshore and offshore banks that allow both parties to settle transactions across jurisdictions. As such, they provide an essential link between national financial sectors and the international financial system.
Box I.C.3. The De-Risking Phenomenon and Its Impact on the Pacific1
Inrecentyears,theglobalfinancialcommunityhasbecomeincreasinglyconcernedaboutde-risking.The Financial Action Task Force (FATF)2 defines de-risking as “the phenomenon of financial institutions terminating or restricting business relationships with clients or categories of clients to avoid, rather than manage, risk in line with the FATF’s risk-based approach.”3 In practical terms, de-risking consists of foreign banks terminating correspondent-banking relationships (CBRs)4 with various categories of customers, including money-transfer operators (MTOs) such as Western Union and MoneyGram, banks, corporations and trading companies, and, in extreme cases, entire national financial sectors. As the availability of CBRs is critical to the regular operations of businesses and governments that undertake cross-border transactions, the de-risking phenomenon has important implications for the region.
The increase inde-riskingreflects the lowreturns thatsomefinancial institutionsgeneratevia theirCBRs, as well as rising concerns among global banks regarding compliance with anti-money laundering andcombatingthefinancingofterrorism(AML/CFT) legislation.For example, a 2016 study of 55 small economies by the Committee on Payments and Market Infrastructure (CPMI) found that an average of just four banks provided CBR services in each economy. The small number of banks providing CBR services reflects the low business volume and limited profitability of the CBR segment, which discourages domestic banks from maintaining relationships with correspondent banks.
Theeffectsofde-riskinghavebeenparticularlyacuteinthePacific,duetotheregion’ssmallnumberofbanksandlargeremittanceinflows.In small island states, a limited number of banks reduces the possibility of
1 This box was prepared by Carlo Corazza.2 The FATF is an intergovernmental organization founded in 1989 as part of a G7 initiative to develop policies to combat money laundering.3 See also http://www.fatf-gafi.org/topics/fatfrecommendations/documents/rba-and-de-risking.html4 A correspondent bank is a financial institution that provides services on behalf of another financial institution. These services may include executing wire transfers,
conducting business transactions, accepting deposits, or gathering documentation.
(continued)
61
NAVIGATING UNCERTAINTY
I.C. POLICY COnSIDERATIOnS

finding alternative CBR providers, intensifying the potential impact of de-risking. For example, de-risking halved the number of MTOs in Samoa from 24 in 2010 to 12 in 2018. Meanwhile, in Tonga, two of the oldest family-run MTOs have exited the market. Major companies like Western Union and MoneyGram lost hundreds of collection and disbursement points in Australia, New Zealand, and various island nations as their agents’ accounts were closed.
The most salient effects of de-risking have been focused on the remittance market. MTOs have been particularly affected, because a large majority of their remittance collections and disbursements are in cash. Due to the cash-based nature of the business, MTOs are monitored closely by correspondent banks, as such transactions are more likely to raise issues involving compliance with AML/CFT legislation, entail greater reputational risks, or incur large regulatory penalties. Correspondent banks have frequently reported low levels of confidence in the capacity of MTOs to comply with the legal procedures mandated by AML/CFT legislation, which has prompted a general reevaluation of the benefits and risks of maintaining MTOs as customers. Consequently, the entities most frequently involved in de-risking have been MTOs.
GiventheimportanceofremittanceinflowsasasourceofincomeinmultiplePacificcountries—especiallyFiji,Samoa,andTonga—de-riskingcouldhavesevereconsequences,thoughnocredibleestimatesofits likely economic impact are yet available. In 2017, remittance inflows represented over 20 percent of GDP in Tonga and Samoa and over 5 percent of GDP in Fiji. These funds are a critical resource for the families of migrant workers and are associated with positive impacts on health and education (World Bank, 2018g; Brown, 2008). While de-risking has been underway for over a decade, in recent years the process has intensified in Australia, New Zealand, and the United States, as major banks have implemented blanket account closures for various MTOs. As the majority of Pacific islands’ remittances originate in these three markets, the account closures have significantly reduced the number of MTOs operating in the Pacific. In the Solomon Islands and Vanuatu, remittances represent a relatively modest share of household income, but their importance has been increasing over the past five years. This trend suggests that de-risking could also affect these markets in the near future.
In an extreme scenario, de-risking threatens to completely cut off the Republic of the Marshall Islands (RMI)fromtheglobalfinancialsystem.Prior to the global financial crisis, the RMI had four CBRs connecting the local economy to the global financial system. However, three of these CBRs have since been closed, and most of the private sector and all levels of government now perform their cross-border transactions through a single CBR, which is threatened by de-risking. The closure of the final CBR could have dire consequences for economic activity, service delivery, and household welfare. As part the RMI’s most recent Article IV consultations, IMF (2018c) assesses the threat of losing the last CBR as both a high-likelihood and high-impact event, and the materialization of this risk is expected to have “significant negative economic repercussions” in the absence of alternative arrangements.
Thede-riskingphenomenoncouldalsonegativeimpacttheefficiencyofremittanceflowsinthePacific.Fewer MTOs would likely reduce competition, potentially resulting in a few large international operators dominating
(continued)
(Box I.C.3 continued)
EAST ASIA AND PACIFIC ECONOMIC UPDATE OCTOBER 2018
62 PART I. RECEnT DEVELOPMEnTS AnD OUTLOOK

the market. An oligopolistic market structure could create barriers to entry, potentially stifling innovations that could lower prices and provide greater convenience for remittance senders and recipient households. In Q2 2018, the cost of sending US$200 from Australia and New Zealand was around 10 percent, compared to just 7 percent in many other major remittance source economies (World Bank, 2018h). Reducing current costs by 5–7 percentage points, in line with international commitments and the Un Sustainable Development Goals, would greatly increase incomes for migrants and their families. The ongoing decline in the number of agents available in the receiving countries is also limiting access to remittances services in some remote areas and islands. For countries with considerable logistical limitations, this situation prevents many people from receiving funds close to their home or work, potentially increasing the costs for recipients. The de-risking process has also forced many MTOs to transfer money via unregulated and unusual channels, including cash-management companies or the physical transportation of cash. This is undesirable from the perspective of AML/CFT, as the companies have shifted from a traceable and monitored system of transactions executed via CBRs to a set of alternatives with much lower levels of transparency and supervision.
Proposals are being developed to mitigate the negative impact of de-risking.5 For example, providing support to banks in developing economies could strengthen their capacity to monitor and enforce AML/CFT requirements. One widely supported approach is the creation of know-your-customer utilities, potentially implemented via blockchain technology, which could both increase compliance and reassure correspondent banks regarding the quality of compliance among their various customers. However, the Pacific private sector has not yet made a clear commitment to know-your-customer utilities, likely due to a lack of profitability.
Pacific economies could consider adopting legislativemeasures similar to the EU’s SecondPaymentService Directive. These measures could limit de-risking by requiring that all payment-service providers6 receive access to a bank’s payment services unless a legitimate reason exists to deny them access. This requirement would be legally enforceable, as banks could be required to prove in court that they performed a risk-based analysis of each of their clients and determined that a given client represented an excessive source of risk. This legal requirement would not eliminate de-risking, but it would help limit it to those cases where banks can identify and prove serious and tangible risks. At the same time, the requirement would allow national supervisors to evaluate the situation and propose solutions. There are signs that regulations in the region are moving in this direction. Large Australian banks dominate the Pacific banking sector, and the government of Australia is examining the Second Payment Service Directive in its discussions of the new open-banking framework.7
5 See, e.g., Financial Stability Board, 2018; IFC, 2016 and 2017; IMF, 2017; and World Bank, 2015b.6 These include all operators who establish the hardware and software conditions to conduct transactions with electronic money, without necessarily being the issuer of the
electronic money units. They include MTOs, mobile wallet providers, and online payment providers such as Paypal, among others.7 Australian Government Treasury, 2017.
(Box I.C.3 continued)
63
NAVIGATING UNCERTAINTY
I.C. POLICY COnSIDERATIOnS

Part I References
Anderson, D., Benjamin Hunt, Mika Kortelainen, Michael Kumhof, Douglas Laxton, Dirk Muir, Susanna Mursula, and Stephen Snudden. 2013. “Getting to Know GIMF: The Simulation Properties of the Global Integrated Monetary and Fiscal Model”, IMF Working Paper, WP/13/55. Washington, DC: International Monetary Fund.
Angulo, Sharay. 2018. “Colombia has made request to join Pacific trade pact: Mexico”, Reuters online edition, 16 June 2018. Access on 25 July 2018 from https://www.reuters.com/article/us-trade-tpp-colombia/colombia-has-made-request-to-join-pacific-trade-pact-mexico-idUSKBn1JB2QV
ASEAn Secretariat. 2015. ASEAN Economic Community Blueprint 2025. Jakarta: ASEAn Secretariat.
Australian Government Treasury. 2017. Open Banking: Customer Choice, Convenience, Confidence. Canberra: Government of Australia
Bastos, Paulo. 2018. “Exposure of Belt and Road Economies to China Trade Shocks.” World Bank Policy Research Working Paper, No. 8503. Washington, DC: World Bank.
Berg, A. and J. Ostry. 2011. “Inequality and Unsustainable Growth: Two Sides of the Same Coin?” IMF Staff Discussion Note SDN/11/08. Washington, DC: International Monetary Fund.
Bloomberg. 2018. “China Plans Broad Import Tax Cut as Soon as October”, Bloomberg. Online edition, 20 September 2018. Access on 20 September 2018 from https://www.bloomberg.com/news/articles/2018-09-20/china-is-said-to-plan-broad-import-tax-cut-as-soon-as-october-jma3g8jg
Borchert, Ingo and Aaditya Mattoo. 2010) “The Crisis-Resilience of Services Trade.” The Services Industries Journal, 2115-2136
Bowie, B. 2018. “Mahathir driving for a new national dream car”, Asia Times. Online edition 5 September 2018. Accessed on 10 September 2018 from http://www.atimes.com/article/mahathir-driving-for-a-new-national-dream-car/
Brown, R. 2008. “Remittances and Development in the Pacific: Effects on Human Development in Fiji and Tonga.” UN/POP/EGM-MIG/2008/3 Bangkok: United nations Economic and Social Commission for Asia and the Pacific.
Caliendo, L., and Parro, F. (2015). “Estimates of the Trade and Welfare Effects of nAFTA.” Review of Economic Studies 82, 1: 1–44.
CME Group. 2018. “30-Day Federal Funds Futures Settlements.” Accessed on 28 August 2018 at https://www.cmegroup.com/trading/interest-rates/stir/30-day-federal-fund_quotes_settlements_futures.html
Constantinescu, C., A. Mattoo and M. Ruta. 2018 “The Global Trade Slowdown: Cyclical or Structural?” World Bank Economic Review.
de Soyres, F., A. Mulabdic, and M. Ruta. (2018). “The Belt and Road Initiative: A Structural Analysis.” mimeo
de Soyres, F., A. Mulabdic, S.Murray, N. Rocha, and M. Ruta (2018). “How Much Will the Belt and Road Initiative Reduce Trade Costs?” mimeo
Dennis, Allen; Shepherd, Ben. 2007. “Trade Costs, Barriers to Entry, and Export Diversification in Developing Countries”. Policy Research Working Paper; No. 4368. Washington, DC: World Bank.
The Development Research Center of the State Council (DRC) and the World Bank. 2018. Innovative China: New Drivers of Growth. Washington DC: World Bank
Djankov, S., R. La Porta, F. Lopez-De-Silanes and A. Shleifer. 2002. “The Regulation of Entry.” The Quarterly Journal of Economics, MIT Press, vol. 117(1): 1-37.
Duncan, Ron. 2016. “Sources of Growth Spurts in Pacific Island Economies”, Asia & the Pacific Policy Studies, vol. 3, no. 2, pp. 351–365.
EAST ASIA AND PACIFIC ECONOMIC UPDATE OCTOBER 2018
64 PART I. RECEnT DEVELOPMEnTS AnD OUTLOOK

Eichengreen, Barry, Ricardo Hausmann, and Ugo Panizza. 2005. “The Pain of Original Sin,” in Barry Eichengreen and Ricardo Hausmann (eds.) Other People’s Money, Chicago: Chicago University Press.
European Parliament. 2018. “EU-Vietnam free trade agreement”, briefing http://www.europarl.europa.eu/RegData/etudes/BRIE/2018/614702/EPRS_BRI(2018)614702_En.pdf
Financial Stability Board. 2018. FSB Action Plan to Assess and Address the Decline in Correspondent Banking: Progress Report to G20 Finance Ministers and Central Bank Governors Meeting of March 2018. Basel: Financial Stability Board.
Freund, C., M. J. Ferrantino, M. Maliszewska, and M. Ruta. 2018. “Impacts on Global Trade and Income of Current Trade Disputes.” MTI Practice Note No. 2. Washington, D.C.: World Bank Group.
Johannesson, Louise and Petros C. Mavroidis, 'The WTO Dispute Settlement System 1995-2016: A Data Set and Its Descriptive Statistics' (2017) Journal of World Trade, Issue 3, pp. 357–408
Halpern, László, Miklós Koren, and Adam Szeidl. 2015. “Imported Inputs and Productivity.” American Economic Review, 105 (12): 3660-3703
Harding, Robin, Shawn Donnan, Joe Leahy and Edward White. 2018. “Pacific countries seek new members for regional trade deal”, Financial Time online edition 8 March 2018. Accessed on 25 July 2018 from https://www.ft.com/content/423b4908-2225-11e8-add1-0e8958b189ea
Herd, R., 2018, “Estimating capital formation and the capital stock by economic sector in China.” In DRC and World Bank, Innovative China: New Drivers of Growth. Washington DC: World Bank
Hurley, J., S. Morris, and G. Portelance. 2018. “Examining the Debt Implications of the Belt and Road Initiative from a Policy Perspective.” CGD Policy Paper 121. Washington, DC: Center for Global Development
International Finance Corporation (IFC). 2016. Mitigating the Effects of De-risking in Emerging Markets to Preserve Remittance Flows. Washington, DC: International Finance Corporation.
____________________________. 2017. De-risking and Other Challenges in the Emerging Market Financial Sector: Findings from IFC’s Survey on Correspondent Banking. Washington, DC: International Finance Corporation.
International Monetary Fund (IMF). 2011. “China Spillovers: Global Commodity Markets.” China Spillover Report 2011. Washington, DC: International Monetary Fund.
_____________________________. 2016a. Regional Economic Outlook: Asia and Pacific, April 2016. Washington, DC: International Monetary Fund.
_____________________________. 2016b. Subdued Demand: Symptoms and Remedies. World Economic Outlook October 2016. Washington, DC. International Monetary Fund
____________________________. 2017. Recent Trends in Correspondent Banking Relationships – Further Considerations. Washington, DC: International Monetary Fund.
____________________________. 2018a. G-20 Surveillance Note. Prepared for the G-20 Finance Ministers and Central Bank Governors’ Meetings July 21-22, 2018, in Buenos Aires, Argentina. Washington, DC: International Monetary Fund.
____________________________. 2018b. 2018 Article IV Consultation—Press Release; Staff Report; Staff Statement and Statement by the Executive Director for The People’s Republic Of China. IMF Country Report No. 18/240. Washington, DC: International Monetary Fund.
____________________________. 2018c. “Republic of the Marshall Islands—Staff Report for the 2018 Article IV Consultation.” Washington, DC: International Monetary Fund
65
NAVIGATING UNCERTAINTY
PART I REFEREnCES

Jefriando, M. 2018. “Indonesia financial industry able to withstand much weaker rupiah – regulators”, Thompson Reuters online edition. 30 April 2018. Accessed on 17 August 2018 from https://www.reuters.com/article/indonesia-rupiah/update-1-indonesia-financialindustry-able-to-withstand-much-weaker-rupiah-regulators-idUSL3N1S74DU
Kasahara, H. and Lapham, B. 2013. “Productivity and the decision to import and export: Theory and evidence”, Journal of International Economics. Volume 89, Issue 2, March 2013, Pages 297-316.
Kolerus, C., P. N’Diaye, and C. Saborowski. “China’s Footprint in Global Commodity Markets.” Spillover Notes 6. Washington, DC: International Monetary Fund.
Koopman, R., Powers, W., Wang, Z., & Wei, S. J. (2010). “Give Credit Where Credit Is Due: Tracing Value Added in Global Production Chains” NBER Working Paper 16426. national Bureau of Economic Research.
Kutlina-Dimitrova, Z. and Lakatos, C. 2017. “The Global Costs of Protectionism”, World Bank Policy Research Working Paper, No. 8277. Washington, DC: World Bank.
Laget, E., A. Osnago, n. Rocha and M. Ruta. 2018. “Deep Trade Agreements and Global Value Chains.” Policy Research Working Paper No. 8491, World Bank, Washington, DC.
Maliszewska, M., M. Cali, Z. Olekseyuk, and I. Osorio-Rodarte. 2018. “Economic and Distributional Impacts of Free Trade Agreements: The Indonesian Case.” Mimeo.
Maliszewska, M., Z. Olekseyuk, and I. Osorio-Rodarte. 2018. “Economic and Distributional Impacts of the Comprehensive and Progressive Agreement for Trans-Pacific Partnership: The Case of Vietnam.” http://documents.worldbank.org/curated/en/530071520516750941/Economic-and-distributional-impacts-of-comprehensive-and-progressive-agreement-for-trans-pacific-partnership-the-case-of-Vietnam
Obstfeld, M., Ostry, J. and Qureshi, M. 2018. “A Tie That Binds: Revisiting the Trilemma in Emerging Market Economies”, The Review of Economics and Statistics. Volume 0, Issue ja.
Ranciere, R., Tornell, A., and Vamvakidis, A. 2010. Currency mismatch, systemic risk and growth in emerging Europe. Economic Policy, Volume 25, Issue 64, 1 October 2010, Pages 597–658.
Roache, S. and K. Roussett. 2015. “China: Credit, Collateral, and Commodity Prices.” HKIMR Working Paper 27/2015, Hong Kong Institute for Monetary Research.
Soeriaatmadja, W. 2018. “US steel tariffs plan may redirect shipment to Indonesia, hurting local industries”, The Straits Times. Online edition 2 March 2018. Accessed on 10 September 2018 from https://www.straitstimes.com/asia/se-asia/us-steel-tariffs-plan-may-redirect-shipment-to-indonesia-hurting-local-industries
Tani, Shotaro. 2018. “Indonesia making preparations to join TPP”, Nikkei Asian Review online edition, 12 June 2018. Accessed on 25 July 2018 from https://asia.nikkei.com/Spotlight/The-Future-of-Asia-2018/Indonesia-making-preparations-to-join-TPP
Topalova, P. and Khandelwal, A. 2011. “Trade Liberalization and Firm Productivity: The Case of India.” The Review of Economics and Statistics, August 2011, 93(3): 995–1009.
U.S. Department of Commerce. 1999. The Effect on the National Security of Imports of Crude Oil and Refined Petroleum Products. U.S. Department of Commerce, Washington, DC.
U.S. Department of Commerce. 2001. The Effect of Imports of Iron Ore and Semi-Finished Steel on the National Security. U.S. Department of Commerce, Washington, DC.
Uyen, N. 2018. “Vietnam Goes on the Defense as China and U.S. Clash on Trade”, Bloomberg. Online edition 17 July 2018. Accessed on 10 September 2018 from https://www.bloomberg.com/news/articles/2018-07-17/vietnam-goes-on-the-defense-as-china-and-u-s-clash-over-trade
EAST ASIA AND PACIFIC ECONOMIC UPDATE OCTOBER 2018
66 PART I. RECEnT DEVELOPMEnTS AnD OUTLOOK

World Bank. 2012. Acting Today for Tomorrow: A Policy and Practice Note for Climate and Disaster Resilient Development in the Pacific Islands Region. Sydney: World Bank.
_________. 2014a. Moving toward universal coverage of social health insurance in Vietnam: Assessment and options. Washington, DC: World Bank.
_________. 2014b. World Development Report 2014: Risk and Opportunity—Managing Risk for Development. Washington, DC: World Bank.
__________.2014c. “Indonesia: Avoiding the Trap.” Development Policy Review. Jakarta: World Bank.
__________.2015a. Indonesia’s Rising Divide: Why Inequality Is Rising, Why it Matters, and What Can be Done. Washington, DC: World Bank.
__________. 2015b. Report on the G20 Survey on De-risking Activities in the Remittance Market. Washington, DC: World Bank.
__________.2016a. Spillovers Amid Weak Growth. Global Economic Prospects. January 2016. Washington, DC: World Bank.
__________.2016b. East Asia Pacific Economic Update, April. Washington, DC: World Bank.
__________.2017a. East Asia and Pacific Economic Update: October 2017. Washington, DC: World Bank.
__________.2017b. China Economic Update: Growth Resilience and Reform Momentum Washington, DC: World Bank
__________. 2018a. East Asia Pacific Economic Update: April. Washington, DC: World Bank.
__________. 2018b. Philippine Economic Update: January. Washington, DC: World Bank.
__________. 2018c. Growing Smarter, Learning and Equitable Development in East Asia and the Pacific. Washington, DC: World Bank.
__________. 2018d. “Riding the Wave: An East Asian Miracle for the 21st Century.” World Bank East Asia and Pacific Regional Report. Washington, DC: World Bank.
__________. 2018e. The Atlas of Social Protection Indicators of Resilience and Equity (ASPIRE) database. Washington, DC: World Bank. Available from http://datatopics.worldbank.org/aspire/
__________.2018f. The Turning of the Tide? Global Economic Prospects June 2018. Washington, DC: World Bank.
__________.2018g. Maximizing the Development Impacts from Temporary Migration: Recommendations for Australia’s Seasonal Worker Programme. Washington, DC: World Bank.
__________.2018h. “Remittance Prices Worldwide.” Online database. Washington, DC: World Bank.
__________. forthcoming-a. Poverty and Shared Prosperity Report 2018: Piecing Together the Poverty Puzzle. Washington, DC: World Bank.
__________. forthcoming-b. Aspiring Indonesia: Expanding the Middle Class. Washington, DC: World Bank.
Yu, Hao. 2015. “Universal health insurance coverage for 1.3 billion people: What accounts for China’s success”. Health Policy. Vol. 119, Issue 9, Sept. 2015, pp 1145-1152.
67
NAVIGATING UNCERTAINTY
PART I REFEREnCES


Part II. Medium-Term Development Agenda
69
WORLD BANK EAST ASIA AND PACIFIC ECONOMIC UPDATE OCTOBER 2018

II.A. Intergenerational Mobility in East Asia and the Pacific1
Developing human capital by improving access to education has been fundamental to rapid growth and improved equity in the EAP region. Nevertheless, further progress is necessary to improve skill levels and equalize opportunities among the region’s workforce. Achieving adequate levels of mobility across generations is a key aspect of this challenge. Promoting both absolute mobility, or the extent to which individuals are wealthier or better educated than their parents, and relative mobility, or the extent to which the relative position of individuals on the education or income scale is independent of the relative position of their parents, would support economic growth, improve social cohesion, and reduce inequality over time. The EAP region experienced a rapid increase in absolute education mobility over a 40-year period, and the EAP average for absolute education mobility now matches the high-income-country average. But progress in improving relative education mobility has been much more uneven, and the EAP average remains well below the high-income-country average. Indeed, indicators of relative education mobility have worsened in three of the six EAP countries for which adequate time-series data are available, raising concerns about the potential deepening of inequality across generations. Education mobility is strongly associated with income mobility, and while economic growth can promote absolute mobility in both income and education, it may not be sufficient to improve relative mobility, as the experiences of several EAP countries illustrate. Policies that promote inclusion, with a focus on equalizing opportunities in early childhood development, narrowing gaps in education access and quality, and reducing geographic disparities, will be crucial to improve economic mobility in the region.
Intergenerational mobility has profound implications for social and economic development
Intergenerational economic and educational mobility can be assessed both in absolute terms and in relative terms. Absolute mobility refers to the extent to which individuals are better educated and enjoy higher living standards than their parents did. Relative mobility refers to the extent to which the relative educational and socioeconomic status of individuals is independent from that of their parents (Box BII.A.1). Absolute and relative mobility complement each other, and they help sustain the social contract by enabling individuals to achieve their aspirations and by promoting an inclusive pattern of development.
Individuals are more likely to achieve their aspirations for higher living standards and socioeconomic fairness in a society with greater economic mobility across generations. Absolute economic mobility reflects the universal human aspiration among parents to provide a better life for their children. Relative economic mobility reflects the hope of every generation to live in a fair society where all individuals, regardless of their parental connections or social status, have the opportunity to climb to a higher rung on the economic ladder than the rung on which they happened to be born. Economic mobility is especially relevant in EAP, where beliefs in the importance of equity and fairness appear to be deeply rooted.2
1 This section was prepared by Ambar narayan and Judy Yang. Rakesh Gupta nichanametla Ramasubbaiah prepared the figures and conducted some of the empirical analysis. Daniel Gerszon Mahler conducted a literature review on mobility and education in China. The analysis is based on a recent World Bank report entitled “Fair Progress? Economic Mobility across Generations around the World.” The text includes direct excerpts from that report and from the World Bank Global Database for Intergenerational Mobility (GDIM) database documentation note.
2 World Bank (2018c).
EAST ASIA AND PACIFIC ECONOMIC UPDATE OCTOBER 2018
70 PART II. MEDIUM-TERM DEVELOPMEnT AGEnDA

Greater mobility can enhance people’s perceptions of socioeconomic fairness and foster optimism for the future, thereby promoting social cohesion and stability. For example, in countries with greater relative education mobility, parents are likely to be more optimistic that their children will have opportunities to learn and grow.3 Perceptions of higher mobility can lead to greater acceptance of policies that increase growth and prosperity in the long run, while reducing tolerance for redistribution in the short run.4 Conversely, a lack of mobility can impair social stability. For example, a substantial rise in perceptions of downward mobility in income was reported in 2012 compared to a decade earlier in at least three countries affected by the Arab Spring.5
Higher mobility is likely to lead to a more inclusive pattern of development. In a global dataset, countries with lower relative mobility are also likely to have greater income inequality—a relationship often referred to in the economic literature as the “Great Gatsby” curve (Figure II.A.1).6 Worldwide, lower relative education mobility among a given generation is associated with greater income inequality during that generation’s peak income-earning years.7
3 Chapter 5, Narayan et al. (2018).4 Benabou and Ok (2001). This conclusion seems to be supported by empirical evidence in several countries; see, e.g. Alesina et al. (2018) and Gaviria et al. (2007).5 Krishnan et al. (2016).6 Corak (2013) presents one of the earliest examples of the Great Gatsby curve. narayan et al. (2018) find a similar relationship using a larger dataset, with estimates compiled from
different studies for 75 countries.7 See Figure 3.11(c) in Narayan et al. (2018).
Box BII.A.1. Absolute and Relative Intergenerational Mobility
The concepts of absolute and relative intergenerational mobility are related, but they operate independently. In the top panel of Figure BII.A.1.1, all individuals in a given generation have climbed two rungs above the level of their parents, but without any individuals passing any others in the same generation. This indicates an absolute mobility rate of 100 percent, but with no relative mobility. In the bottom panel, every individual in the current generation is on a rung that is different from the rung occupied by his or her parent, indicating a high degree of relative mobility. But the absolute mobility rate of this society is just 50 percent, since only two of the four individuals are on a higher rung than their parents occupied. The younger generation as a whole also occupies the same rungs of the ladder as the parents’ generation, which implies that the average standard of living has not improved. In a society with high absolute and relative mobility, these pictures would be combined: all four individuals would be on rungs higher than those of their parents, and they would be ranked differently from how their parents were ranked in their generation.
Figure BII.A.1.1. Intergenerational mobility
Absolute upward Inter-generational Mobility (IGM):
People born poor are better-off than their parentsRelative Inter-generational Mobility (IGM):
Children with parents who are relatively poor canbecome middle-class or rich among their generation
Parents Offspring Parents Offspring
71
NAVIGATING UNCERTAINTY
II.A. InTERGEnERATIOnAL MOBILITY In EAST ASIA AnD THE PACIFIC

Relativemobilityandinequalityarecorrelatedviaatwo-way relationship. Higher inequality tends to limit relative mobility, which in turn tends to worsen inequality over time.8 This is because higher inequality leads to more unequal parental investments in children and affects the policies, institutions, and distributions of social power that shape opportunities. Greater inequality of opportunity (i.e., the extent to which people’s life achievements are affected by the circumstances they are born into) in turn leads to lower relative mobility and more inequality in the next generation, and so on in a cycle that is in effect an "inequality trap".9 Breaking this cycle requires public policies and investments that promote equality of opportunity among individuals with vast differences in parental education and income levels, race, gender, geographic location, and other characteristics.
In the global data, economies with higher education mobility tend to experience faster rates of growth and poverty reduction.10 Higher education mobility is also associated with higher income levels across provinces or states within five large developing countries around the world, including Indonesia (but not China).11 Greater absolute mobility in education implies faster accumulation of human capital, which boosts long-term economic growth. For example, human capital development was a major driver of East Asia’s initial economic success, as improvements in education that achieved widespread basic literacy and numeracy supported the growth of manufacturing and product assembly.12 Higher relative education and income mobility also promote economic growth by supporting a more efficient allocation of resources, as individuals with greater abilities—rather than those with wealthier or more educated parents—are more likely to obtain higher levels of education and take more productive jobs.13
How is economic mobility across generations measured in this analysis?
Thisstudyfocusesprimarilyoneducationmobility,whichiscomplementedbyfindingsonincomemobility.Education is a key dimension of wellbeing. Mobility in education across generations is an essential element of economic mobility and tends to be a strong predictor of lifetime earnings.14 This analysis uses four measures of mobility. Absolute mobility in education is measured by the share of the population in a given age cohort that has achieved a higher education level than that attained by their parents. Relative mobility in education measures the extent to which a child’s educational attainment level is dependent of his or her parents’ level, as indicated by regression analyses. Higher values for this measure indicate greater intergenerational persistence in education and lower relative mobility.
8 See the discussion in Corak (2013), who also presents an early example of the Gatsby curve.9 Persistent inequality despite broad-based growth can suggest the presence of inequality traps. See Bourguignon, Ferreira, and Walton (2007).10 This observation is supported by regressions of (logarithm of) GDP or headcount poverty rates on measures of absolute or relative mobility at the time when the average age of cohort
members was about 15, controlling for lagged (log) GDP levels just before the individuals were born and economy- or region-specific effects (see narayan et al., 2018). The strength of the association can be illustrated by the rise of an economy from the bottom quartile of economies (sorted by relative mobility) to the top quartile, which is associated with an increase in GDP per capita of about 10 percent when the generation reaches adulthood.
11 See Figure 3.13 in Narayan et al. (2018).12 Permani (2009); World Bank (2018b); and Gill, Revenga and Zeballos (2016).13 See, for example, Owen and Weil (1998), Galor and Tsiddon (1997), and Hassler and Mora (2000).14 This database was compiled by Narayan et al. (2018) using surveys from countries across the world.
Figure II.A.1. Globally, lower relative income mobility is associated with greater income inequality
Intergenerational income persistence and Gini coefficients by countryIntergenerational income persistence
1.2
1.0
0.8
0.6
0.4
0.2
0.2 0.3 0.4 0.5 0.6 0.7
Correlation = 0.56
Income inequality (Gini coefficient)
Source: Based on Figure O.11 in Narayan et al. (2018).Note: Higher intergenerational income persistence indicates lower relative mobility in income. Red dots are EAP countries.
EAST ASIA AND PACIFIC ECONOMIC UPDATE OCTOBER 2018
72 PART II. MEDIUM-TERM DEVELOPMEnT AGEnDA

Since the measure does not distinguish between upward and downward mobility, the upward mobility from the bottom half to the top quartile in education provides a complementary measure of relative upward mobility among those born into disadvantaged circumstances.15 Finally, relative mobility in income is measured by persistence in income across generations, which expresses the relationship between an individual’s earnings and his or her parents’ earnings. Like the measure of relative education mobility, higher values indicate greater intergenerational persistence in income and thus lower relative mobility. Box BII.A.2 provides precise definitions for each of these measures.
15 This indicator, termed the “poverty to privilege rate” in Narayan et al. (2018), is identical to the indicator referred to as “rags to riches” in Corak (2016).
Box BII.A.2. The Data Sources and Measures of Intergenerational Mobility Used in This Analysis
This analysis uses four indicators of intergenerational mobility: absolute education mobility, relative educationmobility,upwardmobilityfromthebottomhalftothetopquartileineducation,andrelativeincome mobility. Educational mobility is estimated for individuals born in each decade, from the 1940s to the 1980s, who are part of the youngest cohort to have definitely completed their education by the time of the surveys used for the estimates. Relative income mobility is estimated for a cohort of individuals born in the 1960s and 1970s.
Absolute education mobility is measured by the share of the population in a country (for a givencohort) thathasattainedahigher levelofeducationthanthemaximumeducation levelattainedbytheirparents(excludingadultswhoseparentshavetertiaryeducation).This is similar in spirit to the well-known measure of absolute income mobility used by Chetty et al. (2017), but here it is applied to educational attainment instead of income level. For relative education mobility, the primary measure is the coefficient from the regression of children’s years of education on the education of their parents, with higher values indicating greater intergenerational persistence and lower relative mobility. Upward mobility from the bottom half to the top quartile in education, which can be interpreted as another measure of relative mobility, is the share of individuals who reach the top quartile of education in their generation among all individuals who are born to parents with educational attainment levels in the bottom half of their generation.
Since in most cases the incomes of parents and offspring are not observed directly from the same survey, a more complex exercise is needed to estimate relative income mobility. Income persistence is measured by regressing the earnings of individuals on predicted parental earnings (at a reference age), where a higher value for the regression coefficient indicates lower relative mobility. Parental earnings are predicted using econometric techniques that involve estimating the relationship between earnings and characteristics like age and education using an older survey based on a sample of individuals who represent the current population of parents when they were younger.
Allaverages forgroupsofeconomies (byregionsor incomelevels) reported inthisstudyaresimple averages, unweighted by population. This implies that they refer to the mobility of the “average” economy in a group, and not that of the average individual belonging to that group of economies.
(continued)
73
NAVIGATING UNCERTAINTY
II.A. InTERGEnERATIOnAL MOBILITY In EAST ASIA AnD THE PACIFIC

Intergenerational mobility in the EAP region
Ì A snapshot of educational mobility in EAP among the youngest generation of adults
High and rising levels of absolute education mobility are an important element of EAP’s success story. After decades of rapid improvement, average absolute education mobility among the latest generation of adults (those born in the 1980s) in EAP is on par with the average for high-income economies and significantly higher than the average for developing economies (the diamonds in Figure II.A.2). Average relative education mobility for the 1980s generation in EAP is still higher than the average for the same generation in all other developing regions but significantly lower than the high-income average. The EAP average for upward mobility from the bottom half to the top quartile of the distribution is also below the average for high-income economies (Figure II.A.5).
Compared to the rest of the world, developing EAP performs better on indicators of absolute mobility than relative mobility (Map II.A.1). Across the world, countries with higher levels of absolute mobility are also likely to have higher levels of relative mobility (Figure II.A.3). However, several EAP countries, including four of the six largest countries in the region, have much higher absolute mobility than would be expected given their levels of intergenerational persistence.16
Developing countries in EAP with higher levels of poverty, such as Lao PDR and Papua New Guinea, as well as remote Pacific island countries (PICs), havethe lowest rates of absolute education mobility.17
16 The Philippines is the only large country where absolute mobility is below what would expect for its level of relative mobility, whereas Lao PDR falls somewhere in the middle of the global range for both types of mobility. The estimates for the Philippines for the 1980s generation are, however, subject to caveats that reduce confidence in these estimates.
17 Small PICs experience high rates of emigration and have some of the world’s highest rates of remittances as a share of GDP. Highly educated workers are likely to emigrate and seek opportunities elsewhere and are not included in survey data.
The Global Database of Intergenerational Mobility provides educational-mobility estimates for 148 economies covering 96 percent of the world’s population. For 111 economies covering 87 percent of the world’s population, mobility is estimated for multiple cohorts from the 1940s and 1950s to the 1980s. Estimates of income mobility are available for 75 economies. The database includes educational-mobility estimates for 16 developing EAP countries, five of which have mobility estimates for all cohorts from the 1940s through the 1980s. For the Philippines, estimates for the 1980s cohort are excluded from time-trend comparisons, since the data source differs significantly from those used for earlier cohorts.
(Box BII.A.2 continued)
Figure II.A.2. Among the youngest generation of adults, developing EAP outperforms other developing regions in both relative and absolute education mobility, but it lags the averages for advanced economies
Mobility in education among the 1980s generation, averages by region and income groupIntergenerational persistence or share of population
0.8
0.6
0.4
0.2
0
AllHigh income
economiesDevelopingeconomies EAP MENA ECA LAC SSA SAR
J Intergenerational persistence Q Absolute upward mobility
Source: Based on Figure 3-4 in Narayan et al. (2018) Note: Absolute mobility is the share of individuals with higher educational attainment than their parents (excluding adults whose parents have tertiary education). Intergenerational persistence is the coefficient from the regression of children’s years of schooling on parents’ years of schooling. Averages are not weighted by population. Higher intergenerational persistence implies lower relative mobility. Regions are sorted in decreasing order of relative mobility.
EAST ASIA AND PACIFIC ECONOMIC UPDATE OCTOBER 2018
74 PART II. MEDIUM-TERM DEVELOPMEnT AGEnDA
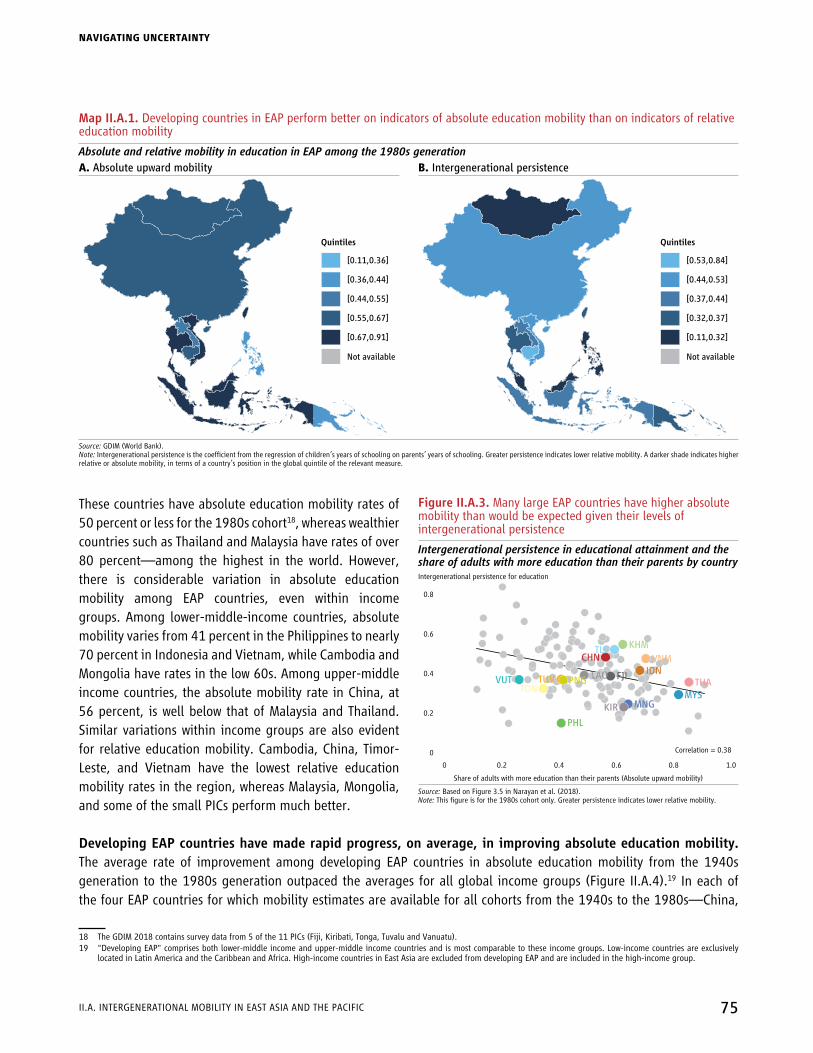
These countries have absolute education mobility rates of 50 percent or less for the 1980s cohort18, whereas wealthier countries such as Thailand and Malaysia have rates of over 80 percent—among the highest in the world. However, there is considerable variation in absolute education mobility among EAP countries, even within income groups. Among lower-middle-income countries, absolute mobility varies from 41 percent in the Philippines to nearly 70 percent in Indonesia and Vietnam, while Cambodia and Mongolia have rates in the low 60s. Among upper-middle income countries, the absolute mobility rate in China, at 56 percent, is well below that of Malaysia and Thailand. Similar variations within income groups are also evident for relative education mobility. Cambodia, China, Timor-Leste, and Vietnam have the lowest relative education mobility rates in the region, whereas Malaysia, Mongolia, and some of the small PICs perform much better.
Developing EAP countries have made rapid progress, on average, in improving absolute education mobility. The average rate of improvement among developing EAP countries in absolute education mobility from the 1940s generation to the 1980s generation outpaced the averages for all global income groups (Figure II.A.4).19 In each of the four EAP countries for which mobility estimates are available for all cohorts from the 1940s to the 1980s—China,
18 The GDIM 2018 contains survey data from 5 of the 11 PICs (Fiji, Kiribati, Tonga, Tuvalu and Vanuatu).19 "Developing EAP" comprises both lower-middle income and upper-middle income countries and is most comparable to these income groups. Low-income countries are exclusively
located in Latin America and the Caribbean and Africa. High-income countries in East Asia are excluded from developing EAP and are included in the high-income group.
Figure II.A.3. Many large EAP countries have higher absolute mobility than would be expected given their levels of intergenerational persistence
Intergenerational persistence in educational attainment and the share of adults with more education than their parents by countryIntergenerational persistence for education
0.8
0.6
0.4
0.2
0
0 0.2 0.4 0.6 0.8 1.0
KHMTLS
CHN VNM
IDN
THA
MYSMNGKIR
PHL
TONVUT TUV PNG
LAO FJI
Correlation = 0.38
Share of adults with more education than their parents (Absolute upward mobility)
Source: Based on Figure 3.5 in Narayan et al. (2018).Note: This figure is for the 1980s cohort only. Greater persistence indicates lower relative mobility.
Map II.A.1. Developing countries in EAP perform better on indicators of absolute education mobility than on indicators of relative education mobility
Absolute and relative mobility in education in EAP among the 1980s generationA. Absolute upward mobility B. Intergenerational persistence
Quintiles
[0.11,0.36]
[0.36,0.44]
[0.44,0.55]
[0.55,0.67]
[0.67,0.91]
Not available
Quintiles
[0.53,0.84]
[0.44,0.53]
[0.37,0.44]
[0.32,0.37]
[0.11,0.32]
Not available
Source: GDIM (World Bank).Note: Intergenerational persistence is the coefficient from the regression of children’s years of schooling on parents’ years of schooling. Greater persistence indicates lower relative mobility. A darker shade indicates higher relative or absolute mobility, in terms of a country’s position in the global quintile of the relevant measure.
75
NAVIGATING UNCERTAINTY
II.A. InTERGEnERATIOnAL MOBILITY In EAST ASIA AnD THE PACIFIC
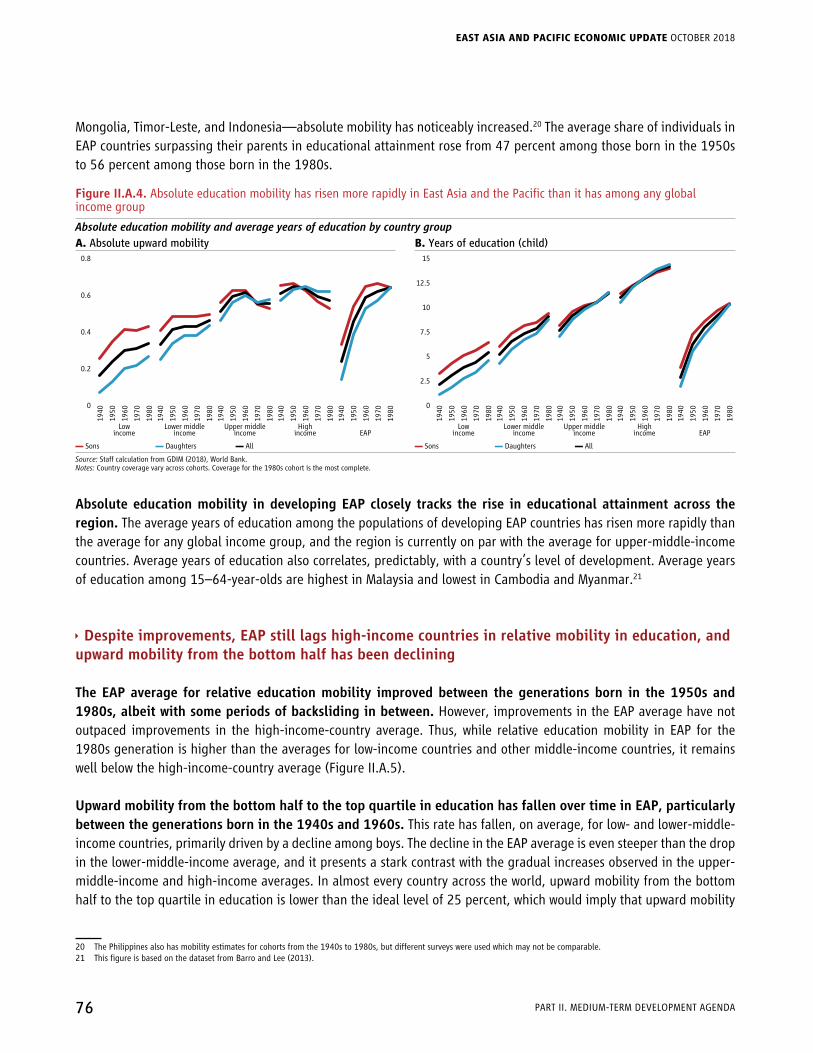
Mongolia, Timor-Leste, and Indonesia—absolute mobility has noticeably increased.20 The average share of individuals in EAP countries surpassing their parents in educational attainment rose from 47 percent among those born in the 1950s to 56 percent among those born in the 1980s.
Figure II.A.4. Absolute education mobility has risen more rapidly in East Asia and the Pacific than it has among any global income group
Absolute education mobility and average years of education by country groupA. Absolute upward mobility B. Years of education (child)
0.8
0.6
0.4
0.2
0
19
40
19
50
19
60
19
70
19
80
19
40
19
40
19
40
19
40
19
50
19
50
19
50
19
50
19
60
19
60
19
60
19
60
19
70
19
70
19
70
19
70
19
80
19
80
19
80
19
80
Lowincome
Lower middleincome
Upper middleincome
Highincome EAP
15
12.5
7.5
5
0
19
40
19
50
19
60
19
70
19
80
19
40
19
40
19
40
19
40
19
50
19
50
19
50
19
50
19
60
19
60
19
60
19
60
19
70
19
70
19
70
19
70
19
80
19
80
19
80
19
80
Lowincome
Lower middleincome
Upper middleincome
Highincome EAP
10
2.5
▬ Sons ▬ Daughters ▬ All ▬ Sons ▬ Daughters ▬ All
Source: Staff calculation from GDIM (2018), World Bank.Notes: Country coverage vary across cohorts. Coverage for the 1980s cohort is the most complete.
Absolute education mobility in developing EAP closely tracks the rise in educational attainment across the region. The average years of education among the populations of developing EAP countries has risen more rapidly than the average for any global income group, and the region is currently on par with the average for upper-middle-income countries. Average years of education also correlates, predictably, with a country’s level of development. Average years of education among 15–64-year-olds are highest in Malaysia and lowest in Cambodia and Myanmar.21
Ì Despite improvements, EAP still lags high-income countries in relative mobility in education, and upward mobility from the bottom half has been declining
The EAP average for relative education mobility improved between the generations born in the 1950s and 1980s, albeit with some periods of backsliding in between. However, improvements in the EAP average have not outpaced improvements in the high-income-country average. Thus, while relative education mobility in EAP for the 1980s generation is higher than the averages for low-income countries and other middle-income countries, it remains well below the high-income-country average (Figure II.A.5).
UpwardmobilityfromthebottomhalftothetopquartileineducationhasfallenovertimeinEAP,particularlybetween the generations born in the 1940s and 1960s. This rate has fallen, on average, for low- and lower-middle-income countries, primarily driven by a decline among boys. The decline in the EAP average is even steeper than the drop in the lower-middle-income average, and it presents a stark contrast with the gradual increases observed in the upper-middle-income and high-income averages. In almost every country across the world, upward mobility from the bottom half to the top quartile in education is lower than the ideal level of 25 percent, which would imply that upward mobility
20 The Philippines also has mobility estimates for cohorts from the 1940s to 1980s, but different surveys were used which may not be comparable.21 This figure is based on the dataset from Barro and Lee (2013).
EAST ASIA AND PACIFIC ECONOMIC UPDATE OCTOBER 2018
76 PART II. MEDIUM-TERM DEVELOPMEnT AGEnDA

is totally unrelated to parental education. But the lowest rates are found mostly in the developing world: developing economies make up 46 of the bottom 50 economies by this measure.
Figure II.A.5. Despite showing some improvement in relative education mobility, EAP lags high-income countries, and upward mobility from the bottom half of the distribution is declining
Relative education mobility by country groupA. Intergenerational persistence (lower values imply higher mobility)
B. Upward mobility from the bottom half to the top quartile of the distribution
Intergenerational persistence Share (bottom half to top quintile)
0.6
0.4
0.3
19
40
19
50
19
60
19
70
19
80
19
40
19
40
19
40
19
40
19
50
19
50
19
50
19
50
19
60
19
60
19
60
19
60
19
70
19
70
19
70
19
70
19
80
19
80
19
80
19
80
Lowincome
Lower middleincome
Upper middleincome
Highincome EAP
0.5
3.5
3.0
1.5
1.0
19
40
19
50
19
60
19
70
19
80
19
40
19
40
19
40
19
40
19
50
19
50
19
50
19
50
19
60
19
60
19
60
19
60
19
70
19
70
19
70
19
70
19
80
19
80
19
80
19
80
Lowincome
Lower middleincome
Upper middleincome
Highincome EAP
2.5
2.0
▬ Sons ▬ Daughters ▬ All ▬ Sons ▬ Daughters ▬ All
Source: Staff calculations using GDIM (2018), World Bank.Notes: Country coverage varies by cohort. Intergenerational persistence is the coefficient from the regression of children’s years of schooling on parents’ years of schooling. In Panel A, lower values indicate higher relative mobility. Panel B shows the proportion of children whose parents are in the bottom half of the distribution and whose own education is in the top quartile of their cohort.
Figure II.A.6. Progress in improving relative education mobility has been mixed
Changes in relative mobilities across cohorts, selected countriesA. Intergenerational persistence B. Share (bottom half to top quartile)
CHN
IDN
LAO
MNG
TLS
VNM
1.0 0.8 0.6 0.4 0.2
Low IGM High IGM
CHN
IDN
LAO
MNG
TLS
VNM
0.05 0.10 0.15 0.20 0.25
Low IGM High IGM
Intergenerational persistence in 1950 and 1980 Share (bottom half to top quintile) in 1950 and 1980
Q 1950’s estimate Q 1980's estimate Q 1950’s estimate Q 1980's estimate
Source: Staff calculations using GDIM (2018), World Bank.Notes: Intergenerational persistence is the coefficient from the regression of children’s years of schooling on parents’ years of schooling. Lower persistence indicates higher relative mobility. Panel B shows individuals whose education is in the top quartile of their cohort and whose parental education is in the bottom half of their parents’ cohort as a share of all individuals whose parental education is in the bottom half of their parents’ cohort.
Across EAP countries, progress in improving relative education mobility has been mixed. Among the six countries with estimates for multiple cohorts, three countries—Lao PDR, Timor-Leste, and Indonesia—experienced a decline in persistence (i.e., an increase in relative mobility) between the 1950s and the 1980s cohorts (Figure II.A.6). But in China, Mongolia, and Vietnam, persistence is higher (i.e., relative mobility is lower) for the 1980s cohort than it was for the 1950s cohort (see Box BII.A.3 for mobility in China). Persistence at the bottom is also becoming more pronounced, as measured by large declines in mobility from the bottom half to the top quartile in five out of the six countries. The share does not exceed 20 percent in any EAP country for the 1980s generation.
77
NAVIGATING UNCERTAINTY
II.A. InTERGEnERATIOnAL MOBILITY In EAST ASIA AnD THE PACIFIC

Box BII.A.3. Recent Trends in Intergenerational Education Persistence in China
The declining trend in relative education mobility from the 1950s generation to the 1980s generation in China runs counter to the trends for EAP, lower-middle-income countries, and upper-middle-income countries. As a result, relative education mobility in China among the 1980s generation is below the averages for EAP and upper-middle-income countries. By contrast, China’s trajectory for absolute education mobility is consistent with a rapid expansion of education and broadly consistent with the average trajectories for EAP and upper-middle-income countries, with a steady increase followed by a leveling off from the 1960s generation onward.
Trends in relative education mobility in China are consistent with those reported in other research. Fan et al. (2015) find relative mobility in both income and education to be lower for individuals born after 1970 than for those born between 1949 and 1970. Magnani and Zhu (2015) find that parent/child educational correlations increased from the cohort born in 1966-1970 to the cohort born in 1976–1980. Both Chen et al. (2015) and Golley and Kong (2013) find that intergenerational persistence has increased since about 1950.
Several hypotheses have been suggested to explain why persistence has increased even as educational attainment has risen in a context of rapid economic expansion. One possible explanation is an increasing rural-urban divide. Huang et al. (2016) argue that the expansion of compulsory education suffered from poor targeting and insufficient enforcement, which may have hit rural households harder than urban households. Gong et al. (2012) find that policies that restricted geographical labor mobility in the Mao Zedong era may have created direct barriers to education access for the rural population. Knight et al. (2013) show that progression to higher levels of education slowed in the 1980s, especially in rural areas.
Somealsospeculatethatthebenefitsoftheexpansionofhighereducationhaveprimarilygonetotheelite(see,e.g.,Huang et al., 2016). Both Magnani and Zhu (2015) and Fan et al. (2015) find that returns to education to have increased in the past decades, which can increase the incentives for better-off parents to invest even more in their children’s education. Fan et al. (2015) also find evidence of a sharp rise in the cost of tertiary education, which makes it harder for children from low-income backgrounds to access higher education.
Decliningrelativemobilitycouldalsoreflectwideninginequalitybetweenhouseholdswhoareregisteredas rural or urban. In 2012, the National Bureau of Statistics reported that 279 million individuals lacked a formal certificate of registration (hukou) for the location in which they resided, most of whom were people with a rural agricultural registration living in urban areas. Rural-registered children in urban areas who were born in the 1990s are less likely than urban-registered children to be enrolled in school, suggesting that the registration system can limit educational mobility of rural-registered households in urban areas. Liu (2005) finds that individuals who receive urban registration late in life still have less education than other urban residents. Data from the China Family Panel Studies survey show that average persistence among registered urban residents is much lower than persistence among both registered rural residents and all (registered and unregistered) urban residents. Persistence also increased more among all urban residents than it did among registered rural and registered urban residents between the 1960s and the 1970s generations, which could reflect the large-scale rural-urban migration that occurred after 1978.
EAST ASIA AND PACIFIC ECONOMIC UPDATE OCTOBER 2018
78 PART II. MEDIUM-TERM DEVELOPMEnT AGEnDA

Ì Gender gaps in both absolute and relative education mobility have almost disappeared in the EAP region
On average, gender gaps in absolute and relative education mobility have closed rapidly in EAP. Narrowing gender gaps in absolute mobility and in mobility from the bottom half to the top quartile are consistent with global trends (Figure II.A.4- Panel A and Figure II.A.5- Panel B). In EAP, the gender gaps in these two measures clearly favored boys in the 1940s generation, but they had all but disappeared by the 1980s generation, mirroring the rapid increases in girls’ education during the intervening time (Figure II.A.5). The gender gap in persistence has also disappeared in EAP, similar to the pattern observed in the upper-middle-income group, whereas persistence among girls has increased relative to boys in the low- and lower-middle-income groups (Figure II.A.5- Panel A).
Some gender gaps in education remain in individual countries, and a reverse gender gap could be an emerging area of concern. Absolute mobility among girls is much lower than among boys in Lao PDR, and Cambodia has the region’s largest gap in average years of schooling between women and men aged 15–64.22 Reverse gender gaps among subsequent generations could become a cause for concern in EAP, given trends observed among high-income and upper-middle-income countries globally. Early indications of such a reversal have already appeared in some countries. In Thailand, Mongolia, and some PICs, a girl from the 1980s generation is much more likely to have more education than her parents than a boy is.
Income mobility is closely aligned with education mobility in EAP
Across countries and regions, income mobility is strongly correlated with education mobility. However, these two measures yield different relative rankings of economies, since educational attainment is not the only factor influencing income mobility in a society. Other influences include the quality of learning, which matters for the skills that an individual will acquire, and efficiency and fairness in the labor market, which affect how those skills translate to earnings.
Income mobility in five EAP countries appears toalign well with education mobility in a cross-country comparison. In China, Malaysia, and Vietnam, income mobility is closely aligned with what each country’s level of education mobility would predict. All three are in the middle third in both income and education mobility among the 75 economies for which both estimates are available (Figure II.A.7). Overall, there is no evidence of
22 Barro and Lee, 2013.
FigureII.A.7.Relative mobility in education and income are strongly but imperfectly correlated across countries globally
Intergenerational income elasticity and intergenerational education persistence by countryIntergenerational income elasticity
1.0
0.8
0.6
0.4
0.2
0
0 0.2 0.4 0.6 0.8 1.0
MNG CHN
VNM
MYS
TLS
Correlation = 0.49
Intergenerational persistence in education
▬ Fitted line --- 45deg line
Source: Based on Figure 4.4 in Narayan et al. (2018).Note: Includes 75 economies. Higher elasticity (persistence) indicates lower mobility. Income persistence estimates are for the 1960s or 1970s cohort; education persistence estimates are for the 1980s cohort. MNG: Mongolia, MYS: Malaysia, CHN: China, VNM: Vietnam, TLS: Timor-Leste.
79
NAVIGATING UNCERTAINTY
II.A. InTERGEnERATIOnAL MOBILITY In EAST ASIA AnD THE PACIFIC

a significant disconnect between education and income mobility in EAP, at least among the limited set of countries for which both estimates are available.
The evidence seems to show that education and income mobility are strongly linked in EAP. However, the international experience suggests that as EAP countries get richer, this link could become more tenuous, and other types of inequity—such as disparities in access to higher-quality education and economic opportunities—may become increasingly important constraints on income mobility.23 These forms of inequity can be created by several factors, such as distorted labor markets that reward parental connections, legacies, or social rank, or the clustering of richer people in locations where their offspring have access to higher-quality services, information, and interpersonal networks. Such opportunity gaps are also likely to widen if ownership of wealth or assets were to become increasingly concentrated among a small elite as these countries develop. If these types of inequity cause economic opportunity to fail to keep pace with rising education mobility, societies may face growing social and political stress, as can be already seen in some parts of the developing world.24
Economic growth can, but does not inevitably, promote mobility
Economic growth can increase mobility through different channels. Increased incomes may enable poor households to invest more in education. Growth also tends to increase public resources, which can be invested in human capital development. And greater rewards to education in the labor market are likely to increase parents’ incentives to invest in their children’s education.
Nevertheless,risingaverageincomelevelsalonemaynotbesufficienttoraiseabsoluteandrelativemobility.High rates of absolute mobility also require a more equitable distribution of the benefits of growth to ensure that a larger share of the population experience better outcomes than their parents did.25 And even if absolute mobility were to increase, relative mobility would not necessarily follow suit. Countries with higher absolute education mobility are also likely to have higher relative mobility, but as described above, the correlation is far from perfect, especially in EAP (Figure II.A.3).
Examples from individual EAP countries illustrate how economic growth does not inevitably lead to higher relative mobility. Trends in relative mobility in education and national income can be tracked in six large developing EAP countries with a long series (Figure II.A.8-Panel A). Relative mobility increased with national income in Lao PDR, Malaysia, and Indonesia, but not in China, Mongolia, and Vietnam. Only in Malaysia did upward mobility from the bottom half to the top quartile of the education distribution increase unambiguously with economic growth (Figure II.A.8-Panel B). That China and Vietnam showed increasing persistence despite rapid economic progress may be in part related to the significant changes experienced by these countries in the last half century, including the wars that affected those born from the 1950s to the 1970s, as well as changes in market structures and governance. Within China, provinces with higher levels of GDP per capita have lower relative education mobility on average.26 This may be due to
23 Narayan et al., 2018.24 For example, income mobility in Egypt, Morocco, and Tunisia is much lower than what their level of education persistence would predict. As economic opportunities have failed to meet
the rising expectations of an increasingly educated population in these countries, the potential for social instability may have grown. See Narayan et al. (2018), citing Campante and Chor (2012).
25 For example, the sharp decline in absolute income mobility in the United States between individuals born in the 1940s and the 1980s was driven more by the unequal distribution of economic growth than by the slowdown in aggregate growth observed since the 1940s (Chetty et al., 2017).
26 See Figure 3.13b in Narayan et al. (2018).
EAST ASIA AND PACIFIC ECONOMIC UPDATE OCTOBER 2018
80 PART II. MEDIUM-TERM DEVELOPMEnT AGEnDA

richer regions attracting more migrants, who have less access to high-quality services due to their registration status as rural residents in urban areas (see Box BII.A.3, above).
Figure II.A.8. Intergenerational education mobility does not always rise with GDP per capita
Mobility indicators and GDP per capita in selected EAP countries, 1960–80 cohortsA. Intergenerational persistence B. Upward mobility from bottom to topIntergenerational persistence Share (bottom half of top quartile)
0.7
0.6
0.5
0.4
0.3
0.2
0.1
500 1,000 2,500 5,000 10K
1960
19701980
1960
1960
1960
1960
1960
1970
1970
1970
1970
1970
1980
1980
19801980
1980
0.3
0.25
0.2
0.15
0.1
0.05
500 1,000 2,500 5,000 10K
1960
1970
1980
1960
1960
1960
1960
1960 1970
1970
1970
19701970
19801980
1980
1980
1980
GDP per capita (logarithmic scale) GDP per capita (logarithmic scale)
▬ CHN ▬ IDN ▬ LAO ▬ MYS ▬ MNG ▬ VNM ▬ CHN ▬ IDN ▬ LAO ▬ MYS ▬ MNG ▬ VNM
Source: Modified from Figure 3.9 in narayan et al. (2018) using data from GDIM 2018 and the Maddison Project.Note: Intergenerational persistence of each cohort is matched to GDP for the year when the average individual in the cohort was five years old. For example, mobility of the 1980s cohort is matched to GDP and public spending in 1990.
Policies to enhance intergenerational mobility in EAP
In broad terms, policies that promote economic growth and inclusion, with a focus on investing in human capitalandequalizingopportunities,arelikelytoimproveintergenerationalmobility.Macroeconomic stability, a healthy investment climate, and greater integration with global markets can enhance growth and promote inclusion. Public policies can also help ensure that the benefits of economic progress are widely shared by improving opportunities for the least-advantaged groups and helping to manage the risks faced by poor households. Increasing public spending is key: across the world, higher levels of public spending (either on education or in the aggregate) relative to the size of the economy are associated with higher relative education mobility after controlling for the country’s level of development.27 Both globally and in EAP, public education spending increases with national income levels, and relative mobility tends to be higher in countries where public spending represents a larger share of GDP (Figure II.A.9). The evidence thus suggests that richer countries tend to have higher relative education mobility on average because they tend to invest more in human capital development (relative to the size of their economy), which equalizes opportunities.28 Public policies can improve education mobility by: (i) closing opportunity gaps between children born into different family circumstances; (ii) helping to equalize the geographic distribution of opportunities; and (iii) using fiscal policy to realize these equity objectives and manage risks faced by households.
27 Based on linear regressions of relative education mobility on public education spending or total public spending (as a share of GDP) and (the logarithm of) per capita GDP of an economy, pooling cohorts from the 1960s to the 1980s and including cohort fixed effects (narayan et al., 2018).
28 Relative mobility increases with per capita GDP if the latter exceeds a certain level (roughly US$2,500 per capita in 1990 purchasing-power-parity terms), probably because the policies needed to equalize opportunities are not affordable at lower levels of national income (narayan et al, 2018). A similar pattern is also observed in EAP countries.
81
NAVIGATING UNCERTAINTY
II.A. InTERGEnERATIOnAL MOBILITY In EAST ASIA AnD THE PACIFIC

Figure II.A.9. Relative mobility tends to be higher when public education spending is higher, and richer countries tend to have higher levels of public education spending
A. Public spending on education as share of GDP and GDP per capita
B. Intergenerational persistence and public spending on education as share of GDP
Government education expenditure/GDP Intergenerational persistence
6
5
4
3
2
500 1,000 2,500 5,000 25K10,000
0.6
0.5
0.4
0.3
0.1
0.2
0 2 4 6 108
GDP per capita (logarithmic scale) Government education expenditure/GDP
J World J EAP J World J EAP
Source: Modified from Figure 4.12 (a, b) in narayan et al. (2018) using data from GDIM 2018, the Maddison Project, and UnESCO.Note: Intergenerational persistence of each cohort is matched to GDP and public spending for the year when the average individual in the cohort was five years old. For example, mobility of the 1980s cohort is matched to GDP and public spending in 1990. The shaded areas indicate 95 percent confidence intervals.
Ì Equalizingopportunitiesinuteroandinearlychildhood
Improvingtheearlylifeenvironmentiscritical,becausegapsthatemergeearlyinlifearedifficulttooffsetthrough interventions later in life. Interventions to equalize opportunities must begin even before a child is born. Policy measures aimed at disadvantaged women of childbearing age, such as programs providing relatively inexpensive nutritional supplements to mothers and building nutritional awareness among mothers (e.g., through visits by health workers)29 can have a positive impact on child health, strengthening children’s readiness to learn. Support during pregnancy and medical care at birth are generally good in EAP countries, but coverage rates for family-support programs and child health and development services are much lower.30
Programstargetinghealthanddevelopment inearlychildhoodcanyield long-termbenefits ineducationaloutcomes and wages. Nutritional supplements can reduce child malnutrition, which is associated with learning difficulties, poor health, and lower lifetime productivity and earnings.31 Supplements seem to have the strongest effects when they are given to children ages two and younger.32 Universal preschool programs can also play an important equalizing role. Intervening during preschool years is more effective than later interventions, and only programs that start before children reach the age of three seem to have long-lasting effects on cognitive abilities.33 There are large gaps in the coverage of preschool programs in EAP, particularly between rich and poor families. In Cambodia, for example, there is a 31 percentage-point gap in access to preschool between households in the poorest and richest income quintiles.34
29 See, e.g., the review of evidence from the United States in Aizer and Curry (2014) and evidence from developing countries in Abu-Saad and Fraser (2010).30 World Bank, 2018b.31 Alderman et al., 2006; Hoddinott et al., 2008.32 See, e,g,, Hoddinott and others (2008, 2013).33 Heckman et al., 2013.34 World Bank, 2018b.
EAST ASIA AND PACIFIC ECONOMIC UPDATE OCTOBER 2018
82 PART II. MEDIUM-TERM DEVELOPMEnT AGEnDA

Early childhood interventions also need to focus on developing noncognitive skills. Intensive preschool programs in the United States are found to have strong long-term benefits because they also improve noncognitive skills among children, starting at around age three.35 An influential study in Jamaica finds that interventions to improve children’s socioemotional skills during the first three years of life can have a positive and significant impact on labor earnings in adulthood.36
Ì Reducingopportunitygapsineducationaccessandquality
Evidence from the global database on mobility and the findingsofotherstudiesunderscore the importanceof reducing opportunity gaps in education to improve mobility. Greater inequality in education outcomes (in terms of years of education) is associated with lower relative education mobility for a given cohort, both globally and among EAP countries (Figure II.A.10). Within countries, large gaps in learning outcomes can be observed between children of parents with different levels of income and education.37 For example, in Lao PDR, 20 percent of children from families in the poorest quintile can count from one to ten, compared to 65 percent of children from the richest quintile.38
EAP countries, on average, have shown vast improvements in education outcomes. They tend to score well on the Programme for International Student Assessment (PISA) test, sometimes above the OECD average, and students in China and Vietnam have the highest PISA scores in the developing world.39 However, the stagnation in relative education mobility and the decline in upward mobility from the bottom half of the education distribution observed in EAP are indicative of rising inequality of opportunity. Sixty percent of school-age children in EAP live in regions with poorly performing school systems.40 Across the world, higher average test scores in primary education are associated with higher absolute and relative education mobility for the same generation.41 Improving the quality of education will be particularly important for income mobility, since the anticipated slowing of export-oriented growth will increase the importance of leveraging a highly skilled labor force to support future growth. Improving education quality will require more than just greater resources, and a recent study suggests that increased education spending is not associated with better learning outcomes above a certain level of spending per student.42
35 Heckman and Kautz, 2014.36 Gertler et al., 2014.37 For example, socioeconomically disadvantaged students across OECD countries are almost three times more likely than advantaged students not to attain the baseline level of
proficiency in science (OECD, 2016).38 See Figure 6.8. in World Bank (2018b).39 World Bank, 2018b.40 Ibid.41 See Figure 5.3 in Narayan et al. (2018).42 Vegas and Coffin (2015) find that, after controlling for GDP per capita and income inequality, higher education spending has a significant association with increased student
performance only among education systems that spend less than US$8,000 per student annually (in purchasing-power-parity terms). Mean student achievement is approximately 14 points higher on the PISA scale for every additional US$1,000 spent.
Figure II.A.10. Greater inequality in education is associated with lower relative education mobility
Intergenerational persistence and standard deviation in years of schooling among the 1980s cohortIntergenerational persistence (1980s cohort)
0.8
0.6
0.4
0.2
0
2 4 6 8
Correlation = 0.56
KHMTLS
CHNVNM
IDN
THA
MYSMNG KIR
PHL
TONVUTTUV PNG
LAOFJI
Standard deviation in years of schooling (1980s cohort)
Source: Based on Figure 3.11 in Narayan et al. (2018). Using data in the GDIM (World Bank).Note: Inequality in education is measured by the standard deviation of education in the same decade.
83
NAVIGATING UNCERTAINTY
II.A. InTERGEnERATIOnAL MOBILITY In EAST ASIA AnD THE PACIFIC

A broad set of policies is required to improve educational mobility. Reducing vast inequalities in learning outcomes requires policies that address the proximate and systemic causes of the “learning crisis” described in the World Bank’s 2018 World Development Report.43 These policies can be grouped into three categories: (i) assessing learning through better measurement and tracking, (ii) acting on evidence to make schools work effectively for all students, and (iii) aligning the incentives of actors to make the entire education system support learning. Educational mobility also can benefit from improving education access among disadvantaged students. For example, reducing the tracking of students by academic ability, or postponing it until students are older, tends to promote equality of opportunity, as evidenced by studies in three Nordic countries.44 Other policy changes can help reduce the implicit or explicit costs of education, particularly at the post-primary levels.
Ì Equalizingthegeographicdistributionofeducationopportunities
Reducing geographic opportunity gaps can increase mobility. Globally, smaller differences in educational attainment across geographic areas are associated with higher absolute and relative education mobility (Figure II.A.11). The same pattern is evident across provinces within six large developing countries, including China and Indonesia.45 In economies (or provinces) with less-acute geographical differences in educational attainment, children from disadvantaged backgrounds may have more opportunities to share public services with children from wealthier backgrounds, which may generate positive spillovers. Evidence from high-income countries indicates that improving local communities or neighborhoods—by, inter alia, enhancing safety, accessibility, and infrastructure quality, increasing the quality and availability of childcare, health care, educational institutions, and recreational facilities, and reducing the concentration of poverty and socioeconomic segregation46—can increase mobility by improving children’s long-term outcomes, including their incomes as adults.47 Registration systems in some countries that restrict access to public resources are examples of barriers that create inequities in opportunities. These systems can reduce the access of rural-born individuals
43 World Bank, 2018a.44 Tracking refers to the common practice of separating students by academic ability and having them follow different curricula or placing them in different schools. For evidence on the
impact of tracking, see Brunello and Checchi (2007), Pekkarinen et al. (2009), Aakvik et al. (2010), and Meghir and Palme (2005).45 See Figure 5.10 in Narayan et al. (2018).46 See, e.g., Chetty and Hendren (2018a, 2018b).47 See Chetty et al. (2016).
Figure II.A.11. Economies with greater educational mobility tend to exhibit less spatial segregation by education level
Relative and absolute mobility across countriesA. Relative mobility: all countries B. Absolute mobility: all countriesIntergenerational persistence Absolute upward mobility
0.8
0.6
0.4
0.2
0
0 0.2 0.4 0.6 0.8
Correlation = 0.36
TLSCHN VNM
IDN
MNG
LAO
1.0
0.8
0.6
0.4
0.2
0
0 0.2 0.4 0.6 0.8
Correlation = 0.37
TLSCHN
VNM IDNMNG
LAO
Mean log deviation (geographic segregation) Mean log deviation (geographic segregation)
Source: Based on Figures 5.9 and 5.10 in Narayan et al. (2018).Note: Intergenerational mobility estimates are for the cohort born in the 1980s. Higher mean log deviation indicates greater geographic segregation, which is defined here as inequality in educational attainment between geographic areas (defined by primary sample units) as a share of total inequality in educational attainment for each country.
EAST ASIA AND PACIFIC ECONOMIC UPDATE OCTOBER 2018
84 PART II. MEDIUM-TERM DEVELOPMEnT AGEnDA

and migrants to education and formal employment opportunities in urban areas. Recently, the ho khau residence registration system has been abolished in Vietnam—a reform that is likely to reduce inequalities in opportunity
Ì Enhancingtheroleoffiscalpolicyandlabormarketsinpromotingeconomicmobility
Amobility-enhancingfiscalpolicyshouldstrivetomobilizeresourcestofinancepublicinvestmentsthatpromotehighermobility,tomoderateincomeinequalityandreducegapsininheritedcircumstances,andtobalancetheseobjectiveswithpromotingefficiencyandgrowth.Policies that broaden the income tax base, strengthen tax compliance, increase fiscal progressivity through mechanisms such as property and inheritance taxes, complemented by investments in administrative capacity, can promote mobility.
Well-targeted transfer programs can improve mobility by increasing human capital investment at the household level. Transfers targeted to disadvantaged households can promote educational mobility by alleviating household-level resource constraints and mitigating the impacts of economic shocks, which is especially important in EAP, as upward mobility from the bottom half of the distribution has been declining in several countries. Cash transfers have been widely adopted in East Asian countries like Cambodia, Indonesia, and the Philippines. While numerous studies have found cash transfers to have positive short-term impacts, such as improvements in school attendance, evidence regarding their long-term impacts in developing countries is still limited.48 A recent review concludes that cash-transfer programs have positive impacts on educational outcomes, while the evidence on employment and income effects is more mixed.49 Evidence from high-income countries, however, suggests that well-designed transfers can significantly improve both the education and labor-market outcomes of children from low-income families.50 Stipends for secondary-school students can also improve education outcomes in countries with high dropout rates at the secondary level.51
As EAP countries become wealthier and education levels continue to rise, relative income mobility will be increasinglylinkedtoequitableaccesstoeconomicopportunities.Labor-market discrimination, anticompetitive behavior, and barriers to mobility across areas and industries are likely to constrain income mobility, compounding the impact of factors that limit educational mobility. Many countries in EAP have strong labor-market fundamentals that have been reflected in high rates of labor-force participation and job creation, and rising labor earnings have driven poverty reduction in many regional countries. However, labor informality remains pervasive, which limits productivity, leads to labor-market segmentation, and can reduce labor mobility.52 The state can play a key role in making labor and other factor markets work efficiently and equitably by adopting appropriate regulatory and investment policies, so that rising educational mobility can generate commensurate improvements in income mobility.
48 Fiszbein et al., 2009.49 Molina-Millan et al., 2016.50 For example, in the United States, teenagers whose households receive the Earned Income Tax Credit—a tax benefit targeted to low-income households that is in effect one of the
largest transfer programs in the country—are found to have better test scores, high school and college completion rates, employment outcomes, and higher earnings as a young adult (Dahl and Lochner, 2012; Chetty et al., 2011; Bastian and Michelmore, 2017).
51 For example, a large randomized intervention involving secondary-school scholarships in rural Ghana was found to have strong positive impacts on the education and labor-market outcomes of low-income students (Duflo et al., 2017).
52 World Bank, 2014.
85
NAVIGATING UNCERTAINTY
II.A. InTERGEnERATIOnAL MOBILITY In EAST ASIA AnD THE PACIFIC

II.B. Meeting the Jobs Challenge in Southeast Asia: Lessons from Cambodia, Myanmar, and Vietnam53
Cambodia, Myanmar and Vietnam have seen robust growth and declining poverty. As their citizens’ aspirations rise, these countries still face challenges in providing broader access to higher quality jobs. Most jobs in these economies are still low quality and there remain pockets of exclusion. All three economies have succeeded in creating new jobs in modern factories by attracting foreign investment. But, these jobs are still in the minority. More than 72 percent of jobs remain in traditional sectors, namely family farming, non-farm household enterprises, or wage jobs that are subject to poor worker conditions. Over 89 percent of jobs are in low- to semi-skilled occupations. And, women, ethnic minorities, and conflict-affected populations remain concentrated in low-quality jobs. The current pace of transformation suggests that traditional jobs will continue to dominate these economies for several decades. Global mega-trends—changes in consumption and trade patterns, the rise of knowledge economies, and more automation—provide opportunities to accelerate the pace of job transformation. Five areas of policy reform can help leverage these opportunities to grow modern-sector jobs while improving productivity and job quality in the traditional sectors and expanding opportunities for excluded groups. First, pursue foreign direct investment (FDI) aligned with higher value-added jobs and linkages to local suppliers. Second, level the playing field by ensuring equal access to inputs for foreign- and domestically-owned firms, and for small and large firms. Third, increase the productivity of traditional jobs, including through broader access to digital technologies. Fourth, reform education and skills development systems to build a 21st century workforce. Fifth, enact targeted policies to allow access to excluded populations.
Introduction
Cambodia,Myanmar,andVietnam,threelower-middle-incomecountries(LMICs)intheMekongregion,haveachieved enviable economic growth rates and declining poverty trends, coupled with rising aspirations for middle-class status. The creation of high-quality jobs can convert ongoing economic growth into broader improvements in quality of life and help households and communities achieve their rising aspirations. Accelerated job growth will also absorb the region’s growing working-age population. Cambodia, Myanmar, and Vietnam, referred to hereafter as the Mekong LMICs, have transitioned from almost completely closed to globally integrated economies, and they heavily rely on (or are working toward) attracting foreign direct investment (FDI) and promoting exports as an engine of growth. Nevertheless, all three countries are still in their structural transformation process. They remain the poorest countries in the region, the agriculture sector accounts for a substantial share of output and jobs (Figures II.B.1 and II.B.2), and their labor forces are among the least educated in the region. In this context, promoting the creation of high-quality jobs will be central to achieving the developmental goals of the Mekong LMICs.
This section explores the jobs challenge facing the Mekong LMICs and evaluates policies to promote the growth ofhigh-qualityemployment.It first identifies the key jobs challenges in the subregion and discusses the prospects for creating new, higher-quality, and more-inclusive jobs, given current regional megatrends. It then proposes policies to enable the Mekong LMICs to overcome these challenges and leverage the megatrends to improve the quality of future employment. Cambodia, Myanmar, and Vietnam are each the focus of a recently completed, independently
53 This section was prepared by Wendy Cunningham.
EAST ASIA AND PACIFIC ECONOMIC UPDATE OCTOBER 2018
86 PART II. MEDIUM-TERM DEVELOPMEnT AGEnDA

prepared country study,54 though data availability and local circumstances differ for each country. The unique context of the Mekong LMICs—which are increasingly export-dependent, yet still rely heavy on agricultural jobs—limits the applicability of the conclusions and recommendation to other countries in the EAP region, though the findings may have important implications for developing countries elsewhere in the world.
The key employment challenge facing the Mekong LMICs is not to create more jobs, buttocreatehigher-quality,more-inclusivejobs55
The number of jobs, relative to the size of the adult population, is exceptionally high among the Mekong LMICs. The labor-force participation rate (LFPR56) is close to 80 percent in Cambodia and Vietnam, among the highest in the world (Figure II.B.3). Myanmar’s LFPR is more modest at 65 percent, but still above the predicted level given the country’s level of development. Thus, the challenge facing the Mekong LMICs is not simply to create more jobs, as their labor forces already have ample employment.
To achieve their developmental aspirations, the Mekong LMICs must create better jobs. While job quality is to some extent subjective, it is possible to identify desirable job characteristics based on available data. These include higher levels of wage and nonwage
54 See Cunningham et al. (2018a) for Vietnam, Cunningham et al. (2018b) for Myanmar, and Cunningham et al. (forthcoming) for Cambodia.55 Hallward-Driemeier, 2015.56 The LFPR measures the share of adults over the age of 15 who are employed or seeking employment.
Figure II.B.3. Labor-force participation rates among the Mekong LMICs are high by regional standards
Labor-force participation rates by per capita GDPLFP, adults 15+
100
90
80
70
60
50
40
30
20
3.0 3.25 3.5 3.75 4.0 4.25 4.5 4.75 5.0
KHM
CHN
VNM
IDNTHA
MYS
MNGKIRVUT
PNG
LAO
FJI
RMI
WSM
MMR PHL
NZLNRU KOR
AUS BRNSGP
MAC
HKG
JPN
Logarithm (base 10) of GDP per capita, PPP
Q All countries Q EAP countries ▬ Locally linear fit
Source: Cunningham et al. (forthcoming).
Figure II.B.1. By the standards of their regional peers, the Mekong LMICs are still at a relatively early stage in their structural transformation…
Figure II.B.2. …and their agricultural sectors continue to account for a large share of employment
Sectoral contribution to GDP among East Asian countries, 2016 Share of jobs by sector among East Asian countries, 2016
100
90
80
70
60
50
40
30
20
10
0
MMR KHM VNM LAO IDN PHLDeveloping
EAP MYS CHN THA EAP KOR JPN HKG SGP
100
90
80
70
60
50
40
30
20
10
0
MMR KHM VNM LAO IDN PHLDeveloping
EAP MYS CHN THA EAP KOR JPN HKG SGP
J Agriculture, forestry, and fishing J Industry J Services J Agriculture J Industry J Services
Source: World Development Indicators.Notes: Sectoral contributions are measured in terms of value added as a share of GDP. Due to estimation errors, the totals do not equal 100 percent.
Source: World Development Indicators. Cambodia’s estimates are from the 2016 Cambodian Socio-economic Census.
87
NAVIGATING UNCERTAINTY
II.B. MEETInG THE JOBS CHALLEnGE In SOUTHEAST ASIA: LESSOnS FROM CAMBODIA, MYAnMAR, AnD VIETnAM

remuneration, less risk of employment termination or of not being remunerated, better working conditions, and greater productivity (Box BII.B.1). These factors are more prevalent in wage-paying jobs in firms that are separate entities (i.e., not an extension of a household) and that comply with labor laws. These jobs are referred to below as “modern jobs” to distinguish them from “traditional jobs” in family farms and household enterprises, as well as wage employment without a contract.57
MostjobsintheMekongLMICsareconsideredpoorqualityaccordingtothemeasuresusedinthisanalysis.More than two-thirds of Mekong LMIC jobs are in “traditional” sectors: approximately one-third of all workers are family farmers, another 16–26 percent work in jobs that do not comply with labor legislation, and 17–26 percent are household-enterprise owners (Table II.B.1). Traditional agricultural work or “elementary occupations”—such as security guard, motorcycle driver, or market vendor—constitute 46–67 percent of all jobs in these countries, while only
57 Pasquier et al., 2017
Box BII.B.1. Defining Job Quality
Jobqualityisasubjectivemeasurebasedonindividualandsocialpreferencesandconstraints.While some employees may prefer to work in an office for set hours and a salary, others may prefer flexible hours, home-based employment, or profit-based compensation.
Thisanalysisassumesthatpeoplevalueexpectedearnings(realandimputed)andputlittlestockinnon-pecuniary aspects of work. The assumption may not apply in all cases. For example, 80 percent of Vietnam’s unregistered household enterprise owners say that they prefer owning their own small business over holding a wage job4, since self-employment gives them independence and opportunities to balance other aspects of their lives—a particularly important concern among women. However, most also said that their current job was the best that they could get given their level of education, and all hoped that their children would hold salaried office jobs. This indicates that employment as a household-enterprise owner is less valued than salaried employment but may be the best option available given individual and household-level constraints.
Thisanalysisassumesthatjobswhichofferhigherincomes,moregenerousbenefits,andlowerlevelsofriskaregenerallyregardedashigher-qualityjobs.All farm- and nonfarm household enterprises, as well as small enterprises, are assumed to be generally considered of lower quality as they tend to not have economies of scale or the tools for risk management, yet are subject to higher risks associated with weather, global market prices (especially for commodities), and razor-thin profit margins.
Estimatingthequalityofworkarrangementsisachallengeduetomissingdata.For Vietnam, workers with a signed labor contract are classified as being in a “better” job than workers without a contact. In Myanmar, workers in firms with 10 employees or more are also classified as employed in a “better” job, as data show that firms with fewer than 10 workers are less likely to register with authorities or abide by labor laws. The data for Cambodia do not provide information on contract status, firm size, or receipt of social benefits. Instead, because one-third of Vietnamese employees are observed to be working under contracts with domestically owned firms, it is assumed that one-third of Cambodian employees working in domestically owned firms can also be classified as having “better” jobs.
EAST ASIA AND PACIFIC ECONOMIC UPDATE OCTOBER 2018
88 PART II. MEDIUM-TERM DEVELOPMEnT AGEnDA

3–11 percent can be categorized as professional jobs. Half of all agricultural workers (both family farmers and contract laborers) are engaged in paddy-rice cultivation, where average earnings are well below those for many other crops (Figure II.B.4). Household enterprises primarily produce low value-added goods and services, which they often trade with each other.58 Even among the “good” jobs in foreign-owned factories, job quality does not reach the levels of most comparator countries. A comparison of wages in garment industries finds that Myanmar and Cambodia, in particular, offer low wages compared to other countries for similar types of work (Figure II.B.5).
Table II.B.1. Among Mekong LMICs, “traditional” jobs account for a large share of total employment
Distribution of jobs in Cambodia, Myanmar, and Vietnam by job type and occupation, 2015Cambodia Myanmar Vietnam
Number of jobs (millions) 8.0 24.1 50.1LFP rates (%) 80 65 80Share employed in traditional jobs (%) 72.1 88.0 76
Family farmers 38.0 35.3 38.9Household enterprise owners 17.4 25.7 20.6Employees, informal 16.7 27.0 16.8
Share employed in modern jobs 27.9 12.0 14Employees, formal, domestically owned firms 8.3
7.19.4
Employees, formal, foreign-owned firms 14.9 4.2Public sector 4.9 3.5 10.2
OccupationsAgriculture and elementary occupations 46.6 66.7 49.1Semi-skilled manufacturing and services 47.2 29.5 39.8Professionals, managers, associate professionals 6.2 3.1 10.9
Number working outside the country (millions) 1.0 2.8 2.7Source: Cunningham et al. (2018a), Cunningham et al. (2018b) and Cunningham et al. (forthcoming). Migration numbers are from the United Nations (2017). Notes: “Employees, informal” are those who work in domestically-owned firms and are not covered by labor law (Vietnam) or work in firms with ten employees or fewer (Myanmar). The table assumes that two-thirds of Cambodia’s wage jobs in domestically owned firms are not covered by labor laws. The Myanmar data do not allow for an estimate of the number of “modern” jobs provided by domestic versus foreign-owned firms.
Figure II.B.4. While productivity in the paddy-rice agricultural subsector is low, jobs in this subsector are numerous
Figure B.II.5. Average wages in the Mekong LMIC garment sector are close to or below the averages for garment sectors in other developing countries
Remuneration per day of work (Vietnamese dong) and number of employed workers by agricultural subsector
Average wages (US$) paid by apparel firms, Mekong LMICs and comparator countries
VN dong per day of work, in thousands Number of jobs, in millions USD (base 2010), in thousands
600 9
500
400
8
300
7
200
6
100
5
4
3
2
1
0 0
Paddy Pigs Citrus Fish Shrimp Coffee Mango Pepper
8
7
6
5
4
3
2
1
0
Cambodia
Bangladesh
EthiopiaIndia
Myanmar
Nicaragua
Pakistan
Philippines
Turke
y
Vietnam
J Labor productivity by commodity Q Number of workers
Source: Cunningham et al (2018b).Notes: Labor-productivity estimates are derived from the Vietnam Household Living Standards Survey 2014; the number of workers per subsector is estimated from input-output matrix (2012).
Source: Cunningham et al. (forthcoming).Notes: Data derived from the World Bank Enterprise Surveys.
58 Pasquier et al., 2017.
89
NAVIGATING UNCERTAINTY
II.B. MEETInG THE JOBS CHALLEnGE In SOUTHEAST ASIA: LESSOnS FROM CAMBODIA, MYAnMAR, AnD VIETnAM

Inclusivenessinemploymentisalsoachallenge,aspocketsofinequalitypersist
Inclusiveness in employment encompasses two concepts. First, for employment to be inclusive, good jobs must be accessible across the adult population, regardless of non-productivity-related factors such as gender, age, membership in a minority ethnic group (Vietnam), and location in a conflict-affected area (Myanmar).59 Second, in an inclusive employment structure, the modern and traditional economic sectors are integrated into a single market.
IntheMekongLMICs,jobqualitytendstobelowerforwomenthanformen,despitesomegainsingenderparity. The growth of relatively female-oriented sectors, including textiles, garments, and tourism, has created new job opportunities for women. However, average earnings among women continue to lag the average for men. Women earn 12 percent less than men in Vietnam (Figure II.B.6-Panel A), 14 percent less in Cambodia (Figure II.B.6-Panel B), and 35 percent less in Myanmar. This is partly due to women’s outsized presence in traditional jobs such as family farming and household enterprises, their relative concentration in less-lucrative sectors such as services, and their frequent struggle to balance income-generating activities with a disproportionate household workload.60 If Cambodian women were distributed evenly across the same industries and occupations as men, the gender wage gap would fall by 4 percentage points (Figure II.B.6-Panel B).61
Figure II.B.6. Significant gender-based wage gaps persist among Mekong LMICs
A. Wage gap by gender and ethnicity, Vietnam B. Wage gap by gender, Cambodiawage gap unexplained gender gaps, in log points
18
16
14
12
10
8
6
4
2
0
2011 2012 2013 2014
0.25
0.2
0.15
0.1
-0.05
0
0.05
2007 2008 2009 2010 2011 2012 2013 2014 2015
▬ Gender ▬ Ethnicity ▬ Total pay gap ▬ Adjusted for basic covariates
▬ Adjusted for covariates + occupation and industry choices
Source: Adapted from Demombynes and Testaverde (2018).Note: The wage gap is the percent difference in mean wages between men and women, or between ethnic minorities and non-minorities. These estimates control for differences in education, occupations, and demographic characteristics.
Source: Cunningham et al. (forthcoming). Note: The “adjusted covariates” control for male-female differences in age, education, and region.
Olderworkerstendtoholdlower-qualityjobsthandoyoungerworkers.Forty percent of Cambodians ages 20–29 hold wage jobs in private firms, compared to just 9 percent of workers ages 45–59. Far more Vietnamese workers ages 15–25 have moved into wage jobs in the foreign-owned private sector as compared to the share of any other age group. Older workers tend to work on family farms and in low-level occupations. However, not all younger workers are employed in wage-paying jobs; a significant share—particularly those who have not completed secondary school—are employed in non-contract wage jobs, with very limited opportunities to transition into contract-based work.62 The concentration of
59 Employment data for minority groups are available only for Vietnam. Of the Mekong LMICs, only Myanmar includes conflict-affected areas.60 Twenty-five percent of female household-enterprise owners in Vietnam say that they prefer self-employment over wage employment, as it allows them to balance work with domestic
responsibilities, while the equivalent figure for men is just 6 percent (Pasquier et al 2017). Occupational sorting seems to occur not when young people select a field of study, but rather when they enter the labor force and begin balancing work and domestic life (Chowdhury et al., 2018).
61 A recent study in Vietnam suggests that women often select jobs that pay less but that offer more advantages to the household, such as social benefits, flexible work hours, and family leave (Chowdhury et al., 2018).
62 Nguyen, 2017.
EAST ASIA AND PACIFIC ECONOMIC UPDATE OCTOBER 2018
90 PART II. MEDIUM-TERM DEVELOPMEnT AGEnDA

younger workers in modern jobs and older workers in traditional jobs may reflect different levels of asset accumulation, with young workers leveraging their greater educational attainment and older workers leveraging their higher rates of land ownership. Mobility costs may also limit the movement of older workers into new jobs,63 and some employers may prefer to hire younger workers for modern jobs.
Limitedaccess tononagricultural incomeconstrains jobqualityamongethnicminorities inVietnam.While earnings from crops, livestock, and fisheries are broadly similar among ethnic groups, members of the ethnic majority double their incomes by operating household enterprises and holding wage jobs. The earnings gap and lack of opportunities are particularly dire for female members of ethnic minorities. Ethnic minorities also earn lower wages than non-minorities, and the gap between them has been widening in recent years (Figure II.B.6-Panel A). Employment and income disparities by ethnicity may reflect a range of factors, including the more remote locations of many ethnic minority communities and their relative lack of access to markets and sources of nonagricultural income, as well as lower education levels among ethnic minorities, particularly those who do not speak Vietnamese, and the challenges they may face integrating into urban centers.
Jobprospectsinconflict-affectedzonesinMyanmarareparticularlylimitedduetoalackofwell-functioningmarkets. Employment creation can support the peace process as Myanmar moves toward a more cohesive society. While not enough data are available to assess the jobs situation in conflict-affected areas in Myanmar, evidence from other countries suggests that job markets in conflict settings tend to be stunted. Conflict-affected populations tend to have few assets, due to both the destructive impact of the conflict and the inability of households to accumulate assets because of risks or lack of access to education and other inputs. Moreover, conflict-affected areas often lack the necessary infrastructure for markets to develop.
JobqualityisimprovingamongtheMekongLMICs,andjobsarebecomingmoreinclusive, but progress has been slow
Inrecentyears,jobqualityhasbeenimprovingamongtheMekongLMICs.The fastest-growing job type, albeit from a very low base, is wage-paying jobs in firms that (generally) abide by labor laws. Job growth is driven by FDI inflows and the formation of new domestic firms.64 Although low-quality jobs persist, the fastest-growing occupations are mostly “better” jobs, as the term is defined above. Vietnam’s 10 fastest-growing occupational categories include health and science professionals and semi-skilled blue- and white-collar workers (Table II.B.2). Cambodia is slowly shifting toward semi-skilled blue- and white-collar jobs, as market-based wage-paying jobs displace parallel subsistence jobs. For example, the number of shop salespeople is increasing, while the number of street vendors is declining. Wages continue to rise in both Vietnam and Cambodia.
There are signs that job markets are becoming more inclusive. Gender wage gaps are narrowing (Figure II.B.6), and in some areas women are outperforming men. A larger share of women than men hold professional jobs in Myanmar, as they do in some sectors (e.g., garments and services) in Cambodia. In Vietnam, a larger share of women than men work in contract-based, wage-paying jobs in firms.
63 Hollweg, 2018.64 For example, in Vietnam, more than 4 million jobs were created between 2007 and 2015 in domestic- and foreign-owned private-sector firms, while the number of jobs in family
farming and household enterprises declined—though more than 2 million non-contract wage jobs were also created during the period. In Myanmar, the number of jobs in the domestic private sector increased by 13 percent per year during 2012–14, and in Cambodia the number of private-sector jobs increased by 11 percent per year during 2007–2015.
91
NAVIGATING UNCERTAINTY
II.B. MEETInG THE JOBS CHALLEnGE In SOUTHEAST ASIA: LESSOnS FROM CAMBODIA, MYAnMAR, AnD VIETnAM

Whileemploymentqualityis improving,thepaceofchange is slow. The share of “good” jobs expanded by 5 percentage points over a seven-year period in Vietnam. While this represents significant progress, at this rate 57 percent of jobs will still be traditional in 2040. New jobs will likely replicate old jobs in terms of quality and inclusiveness.
This gradual improvement in job quality may beeither disrupted or accelerated by megatrends that are reshaping employment across the world. The rise of the Asian middle class will increase the demand for (semi) processed goods and more sophisticated services. Shifting trade patterns will affect which value chains LMICs can and cannot engaged in. The rise of the global knowledge economy may provide new high-value jobs, but those jobs will require new skills and a different export model than the one currently used by the Mekong LMICs. Automation may replace jobs if workers are not equipped with the skills to use technology to their benefit. Together, these megatrends could favor the growth of higher-quality jobs, but only if firms, farms, and workers are prepared to take on new opportunities. The megatrends also may benefit some workers—especially younger, more-educated urban workers—while others—especially older, less-educated rural workers and ethnic minorities—may be left behind.
FourdefiningcharacteristicsoftheMekongLMICsandtheiruniquerelationshipwiththemegatrendsdescribedabovewillshapethequalityandinclusivenessoffuturejobs.The following section discusses the current status of those characteristics, the risks and challenges that the megatrends pose to future job quality and inclusiveness, and the opportunities they may offer to countries, firms, and workers who are prepared to take advantage of them.
Among the Mekong LMICs, labor costs are increasing faster than labor productivity, and a reliance on low-value-added components of global value chains may hinder improvementsinjobquality,withespeciallynegativeconsequencesforyoungwomen
FDI has transformed employment among the Mekong LMICs. One in eight jobs in Cambodia (1 million jobs) are in the foreign-owned textile and apparel industries, and these jobs are primarily held by young women. Another 1 in 25 jobs in Vietnam (2.1 million jobs) are provided by foreign investors, primarily in textiles and electronics. The numbers are much smaller in Myanmar, which is still in the process of opening its economy to international trade and investment.65 Many of these jobs are part of global value chains (GVCs), production models in which processes are distributed across multiple countries. FDI-financed firms tend to provide more jobs than other exporting firms, and exporters in general tend to provide more jobs than non-exporters.66 Both FDI-financed firms and exporters in general also expand the size
65 Myanmar has a workforce of about 24 million, yet just 300,000 jobs are in foreign-owned firms.66 The export sector encompasses both FDI-financed firms and domestic exporters. For example, 17 percent of private-sector jobs in Myanmar are in foreign-owned firms, but 30 percent
of jobs are in exporting firms.
Table II.B.2. Most of the fastest-growing occupational categories offer higher-quality jobs
The ten fastest-growing occupations in Vietnam and their average growth rates 2013–15, percent
Average Growth
Assemblers 32Food preparation assistant 18Stationary plant and machine operators 15Electrical and electronic trade workers 12Health professionals 10Cleaners and helpers 10Science and engineering professionals 8Recording clerks 7Metal, machinery, and related trade workers 7Customer service clerks 6
Source: Cunningham et. al. (2018b).Notes: Based on the Vietnam Labor Force Survey 2009–2015. The sample only included occupations at Vietnam’s two-digit occupation-classification level for occupations with an absolute change of more than 25,000 workers.
EAST ASIA AND PACIFIC ECONOMIC UPDATE OCTOBER 2018
92 PART II. MEDIUM-TERM DEVELOPMEnT AGEnDA

of their workforces more quickly on average,67 and they provide higher-quality jobs in terms of remuneration, social benefits, and working conditions.68 Women in particular have benefitted from these jobs, comprising a disproportionate share of employment in the garment and textile sectors in all three countries. Older workers and ethnic minorities, however, are only marginally engaged in FDI-financed firms or export-oriented sectors.
The Mekong LMICs attract FDI by offering large pools of low-cost, low-skilled labor, but they may now be at risk of losing that cost advantage. Wages have been increasing in all three countries at a faster rate than labor-productivity gains. While the average wage in, for example, the apparel sector is low in these countries (Figure II.B.5), the cost per unit of output69 is among the highest for comparable countries (Figure II.B.7). For example, the unit labor cost of garment production in Cambodia is nearly double the cost in Bangladesh and India, two of Southeast Asia’s biggest competitors in garment-related FDI (Figure II.B.7). Myanmar’s 2018 minimum-wage hike is not reflected in the current data, but to the extent that unit labor costs rise as a result, Myanmar risks losing its competitiveness in garment GVCs.70
67 Exporting firms create new jobs more rapidly than non-exporters. In Myanmar, 43 percent of foreign-owned firms created new jobs in the 2012-14 period, compared to 27 percent of domestically owned firms.
68 For example, 99 percent of workers in foreign-owned firms in Vietnam received full benefits, compared to 70 percent in domestically owned firms. For information on Myanmar, see Tanaka (2017).
69 This is measured as a firm’s wage bill divided by the number of units of output in the same time period.70 According to the 2016 World Bank Enterprise Survey, 99 percent of foreign investors cite labor costs/availability as one of their top three reasons for selecting Cambodia over other
countries. The second most common reason was tax incentives, which were cited by 42 percent of surveyed firms.
FigureII.B.7.Unit labor costs among Mekong LMICs are high by the standards of comparable countries
Average unit labor costs (% of value added) for apparel firms, Mekong LMICs and comparator countriespercentage
80
70
60
50
40
30
20
10
0
Cambodia
Bangladesh
EthiopiaIndia
Myanmar
Nicaragua
Pakistan
Philippines
Turke
y
Vietnam
Source: Cunningham et al. (2018a). Note: Derived from the World Bank Enterprise Surveys.
Box BII.B.2. The Rise of the Sew-Bots? Maybe Not Yet…
Recent publications have estimated that 86 percent of Vietnam’s garment jobs will be replaced by machinesinthenext15years(ILO2016).This is an alarming prospect, as the country exports US$29 billion worth of garments each year. Garments make up about 13 percent of Vietnam’s total exports (as of 2015) and support 1.3 million jobs. However, a closer look at the apparel industry suggests that these predicted job losses may be overestimated, especially in the short run. Several factors need to come together for machines to begin replacing human workers, and none of these are currently present in the apparel industry:
1. While technology is being employed in some parts of the apparel GVC, there is still no machine that can replace sewing-machine operators, who comprise 70 percent of all garment workers. While the first cut-make-trim (CMT) machine—a potential replacement for human operated sewing machines—is expected to hit the market in 2019, it can only produce the most basic garment, an 8-step t-shirt. The technology is still far from being able to create a 78-step dress.
(continued)
93
NAVIGATING UNCERTAINTY
II.B. MEETInG THE JOBS CHALLEnGE In SOUTHEAST ASIA: LESSOnS FROM CAMBODIA, MYAnMAR, AnD VIETnAM

Emergingmegatrends—includingchangingtradepatterns,theriseofknowledgeeconomies,andautomation—may either enhance or threaten low value-added assembly jobs among Mekong LMICs. New opportunities in low value-added activities may emerge as China continues offshoring these jobs to its neighbors. New trade pacts can also accelerate job creation and upgrading; for example, the Comprehensive and Progressive Agreement for Trans-Pacific Partnership (CPTPP) is expected to increase wages for Vietnamese workers.71 However, other factors may lead to a significant loss of low value-added assembly jobs among Mekong LMICs. First, new countries are vying for entry-level positions in GVCs. Second, new technologies are shifting the capital-to-labor ratio so that some jobs either return to their original country (a process known as “re-shoring”) or disappear altogether. While the full automation of the garment-assembly industry is still many decades off (see Box BII.B.2), some jobs in the garment sector are already being replaced by machines.
The domestic sectors in the Mekong LMICs face various obstacles that create perverse incentives for job creation and upgrading
Most wage-paying jobs in the Mekong LMICs are currently being created by domestically owned small and mediumenterprises (SMEs).The domestic private sector in Vietnam creates three times as many jobs as the FDI-financed sector, while the domestic private sector in Cambodia creates twice as many. In Myanmar, 83 percent of private-sector jobs are in domestically owned firms. In both Vietnam and Myanmar, SMEs are net job creators, mostly through startups (Figures II.B.8).72 notably, net job creation in large domestically owned firms is null, as is net job creation in Vietnamese state-owned enterprises (SOEs).
71 World Bank, 2018d.72 Data constraints prevent a similar analysis in Cambodia.
2. Fashion changes quickly. While people can easily learn to stitch a new angle, stretch a new fabric, or add a new adornment, machines will not have this type of flexibility for many years.
3. Although labor costs are increasing in Vietnamese garment factories, they still pale relative to the cost of machines. While the CMT machine for t-shirts is estimated to pay for itself within two years (via displaced worker wages), the machine itself will need to be replaced frequently as fashions change.
For these reasons, the large-scale replacement of apparel workers by machines is unlikely to happen soon. And many jobs that cannot be automated—e.g., specialized knowledge tasks that are higher up the value chain—will still exist. Meanwhile, a host of new jobs will arrive, including jobs running and repairing the machines, programming the machines to accommodate new styles, and designing shop floors that are machine-friendly.
Source: Frederick (2017): http://softwearautomation.com/
(Box BII.B.2 continued)
EAST ASIA AND PACIFIC ECONOMIC UPDATE OCTOBER 2018
94 PART II. MEDIUM-TERM DEVELOPMEnT AGEnDA

Three factors limit SME job upgrading and inclusion; first, domestically owned SMEs face significantconstraints to job growth. Most job creation occurs through SME startups, yet firms in the Mekong LMICs rarely grow five years after being established.
Second, privately owned domestic firms are notleveragingthepresenceofforeignfirmstoacceleratetheir own growth. Garment firms in the Mekong LMICs buy only a small share of their inputs from domestic producers (Figure II.B.9). Cambodian firms locally source about 30 percent of their inputs, and a significant share of these are purchased from foreign firms operating in Cambodia. More local sourcing could spur job growth among domestically owned firms, but its potential is limited. For example, in India, exporters locally source nearly 100 percent of their inputs, yet this barely makes a dent in India’s large domestic sector.
Third, policies constrain access to complementary inputs among private domestically ownedfirms, furtherlimiting job creation. All three countries provide preferential treatment to foreign-owned firms, while policies in Vietnam and Myanmar also favor SOEs. The government of Vietnam facilitates access to land for foreign firms and SOEs; foreign firms utilize streamlined export processes in Cambodia, which reduce a two-week process to a few days; and special economic zones in Myanmar have far better land, electricity, and transportation networks than the rest of the country.
Householdenterprises—whichcreateanevenlargershareoftotaljobsthanSMEs,especiallyinclusivejobs—arealso constrained by weak linkages and limited access to inputs. Owner/operators of household enterprises comprise 20 percent of all jobs in the Mekong LMICs: 10 million jobs in Vietnam, 1.4 million in Cambodia, and 6.2 million in Myanmar. These include noodle-shop owners in Vietnam, tuktuk drivers in Cambodia, market vendors in Myanmar, and
Figure II.B.9. Garment firms in the Mekong LMICs purchase only a small share of their inputs locallypercent of supplies and inputs locally sourced
100
80
60
40
20
0
Cambodia
2016
Bangladesh
2013Ethiopia
2015 India
2014Mya
nmar
2016Pakis
tan
2013 Turke
y
2013Vietnam
2015
Source: Cunningham et al. (forthcoming). Derived from World Bank Enterprise Surveys.
Figure II.B.8. Small enterprises and startups drive job creation among Mekong LMICs
A. Net job creation by firm size, age, and ownership, Vietnam B. Job creation and destruction, by firm size, Myanmarworkers, in thousands percent
3,000
2,000
1,000
0
-1,000
Domestic private1–9
Foreign Public10–19 20–99 100+ 1–9 1–910–19 10–1920–99 20–99100+ 100+
25
20
15
10
5
0
-5
-10
-15
Job creationEntrants Survivors
Job destructionEntrants Survivors
J Entry J Age 2–5 J Age 6–9 J Age 10+ J Micro (1–4) J Small (5–19) J Medium (20–99) J Large (100+)
Source: Cunningham et al. (2018b).Notes: Derived from Vietnam Enterprise Census.
Source: Cunningham et al. 2018a.Notes: Derived from the Myanmar World Bank Enterprise Survey.
95
NAVIGATING UNCERTAINTY
II.B. MEETInG THE JOBS CHALLEnGE In SOUTHEAST ASIA: LESSOnS FROM CAMBODIA, MYAnMAR, AnD VIETnAM

the various other small producers and service providers that serve a majority of the region’s consumers. A larger share of women than men own and operate household enterprises in all three countries.
Householdenterprises couldbenefit frombeingmore integratedwithSMEs.Currently, household enterprises operate largely in isolation: in Vietnam and Myanmar, household-enterprise owners report that they sell 60 percent of their output to “passers-by,” and less than 35 percent of their sales are to SMEs. They also report purchasing 80 percent of their inputs from other household enterprises, at less competitive terms than they would receive if they had better access to the wider market.73 Indeed, “access to markets” is the most common complaint among household-enterprise owners in Vietnam and the second most common complaint among household-enterprise owners in Myanmar.
MegatrendsmayincreasejobqualityandinclusivenessinSMEsandhouseholdenterprisesbychangingthenature of consumption. As incomes rise and urbanization continues across developing Asia, a growing number of consumers will demand more and higher-value goods and services. Households with more disposable income tend to spend a larger share of their food budgets on fruits, vegetables, and meat,74 and they spend a larger share of their total income on services, compared to poorer households. Urban populations will purchase goods that would have been self-produced in rural areas. Due to their distance to markets and the anonymity of producers, urban consumers will demand semi-processed products with guaranteed food-safety standards. These shifting consumption patterns can create new, higher-quality jobs in processing, sales, and marketing for a more discriminating local population. This boom in demand could generate better jobs for a large number of women and older workers, who comprise a majority of household-enterprise owners.
Moreover, digitalization is reshaping the operations of both SMEs and household enterprises. Technological innovation, such as the expansion of the mobile-money system in Cambodia, is expanding access to cheaper inputs. The so-called “gig economy” is creating new short-term and freelance job opportunities for those who may currently be excluded from markets. Technology may also be increasing productivity by bringing producers and consumers together more efficiently, such as tuktuk drivers responding to calls on PassApp rather than roaming the streets of Phnom Penh in search of a fare. Technology-related services, including internet cafés, mobile-phone repair, and information-technology consulting, are growing rapidly, as are the irregular jobs associated with them, which largely employ younger workers. Technology may also improve the inclusiveness of jobs by giving excluded groups tools to integrate. For example, in Myanmar, household-enterprise owners use Facebook to interact with clients. Technology can bring the workplace to those with physical mobility challenges, as well as people living in remote areas and workers that must balance employment with household duties. The jobs that create technology—such as mobile-app development—will likely remain a small minority of the larger job market.75
Thequalityofagriculturaljobswilllikelyimprove,drivenbothbymegatrendsandcontinued structural change
As agricultural jobs are lost through structural transformation and rural-urban migration, the remaining agriculturaljobsmayimproveinquality.Job growth in other sectors is drawing away agricultural workers, and this
73 Pasquier et al., 2017.74 Jamora and Labaste, 2015.75 For example, the U.S. economy counts just 160,000 computer programmers among its 130 million employed workers, or about 0.1 percent of all jobs in a developed economy that
leads much of the world’s technological innovation (based on data from O*Net).
EAST ASIA AND PACIFIC ECONOMIC UPDATE OCTOBER 2018
96 PART II. MEDIUM-TERM DEVELOPMEnT AGEnDA

process is expected to continue as long as agricultural prices do not spike.76 The shrinking number of jobs in agriculture was associated with the rising productivity of agricultural labor in Vietnam and Cambodia during their economic reform periods. Newly created wealth in both rural and urban areas can create spillovers by sparking demand for nonfarm goods and services.
Nevertheless, agricultural jobs are still the riskiest and lowest-paying jobs in the region, and the agricultural sector employs the most-excluded groups. Older workers in all three countries, Vietnam’s ethnic minorities, less-educated workers, and Myanmar’s ethnic minorities and communities in conflict-affected areas are all overrepresented among family-farm owners. These groups are also less engaged in nonfarm activities, so the productivity of their jobs may be particularly low. Additionally, a substantial share of the agricultural sector has only limited ties to larger national economies.
Megatrends—includingshiftingconsumptionandtradepatterns,mechanization,andknowledgeeconomies—can be expected to further increase the productivity of family farms while developing local value chains to serve domestic and regional markets. As both the Mekong LMICs and the larger EAP region become wealthier, rice consumption will decline in favor of higher-value (and more nutritious) vegetables and complex proteins. Meanwhile, urbanization will increase demand for semi-processed food and food safety. Both trends will foster emerging value chains in higher-value (and higher-productivity) primary products. Vietnamese coffee and Cambodian pepper are already important global exports, and as GVCs continue to shift, the Mekong LMICs will have the potential to engage in higher-value agricultural value chains. A dynamic global agricultural research and development sector is constantly creating new, more-productive seed varieties, fertilizers, and other inputs, as well as new production and processing methods. The worldwide spread of information technology has expanded access to these inputs and methods to an unprecedented degree. Mechanization has already affected cultivation processes and will continue displacing agricultural labor, freeing up workers to engage in more-productive activities.
Alow-skilledworkforceandaninadequateskills-developmentsystemmayimpedeprogress across all job types
While the private sector is providing better job opportunities, much of today’s workforce is ill prepared for them. More than 70 percent of the current Mekong LMIC labor force has no more than lower secondary education (equivalent to the 8th grade). Average returns to education are around 5 percent in Cambodia and Myanmar and 10.5 percent in Vietnam.77 However, for workers that do not complete high school, additional years of education are often associated with modest or even negligible wage gains. For example, Cambodian workers who finished 6th grade earn about the same amount, on average, as those who finished 10th grade. Similar patterns are evident in Vietnam and in certain sectors in Myanmar (Figure II.B.10-Panel A).
Employersacrosstheregionciteinadequateworkforceskillsasanimportantobstacletodoingbusiness.Among Mekong LMICs and other EAP countries, 8-23 percent of employers identify an “inadequately skilled labor force” as a constraint to doing business (Figure II.B.10-Panel B). In these countries, lack of workforce skills ranks among the top three constraints to doing business.
76 A spike in agricultural prices in 2007-2011 caused labor to migrate from urban to rural areas, and the number of agricultural jobs in Cambodia increased. This trend reversed once agricultural prices fell (World Bank, 2018c).
77 Montenegro and Patrinos, 2014.
97
NAVIGATING UNCERTAINTY
II.B. MEETInG THE JOBS CHALLEnGE In SOUTHEAST ASIA: LESSOnS FROM CAMBODIA, MYAnMAR, AnD VIETnAM

Figure II.B.10. Below the level of secondary-school completion, additional education generates minimal wage gains in Cambodia, while across the region employers report shortages of skilled labor
A. Average returns to education by year completed, Cambodia, 2014
B. Share of employers who cite an “inadequately skilled labor force” as a constraint to doing business
Returns, relative to no-schooling
0.8
0.6
0.4
0.2
0
-0.2
1 3 6 9 12 College+
25
20
15
10
5
0
Vietnam Myanmar Philippines Indonesia EAP Bangladesh Sri Lanka Cambodia Lao PDR
Years of schooling
▬ Point estimate J 95% CI
Source: Authors’ calculations based on the Cambodia Socio-Economic Survey in 2014.Note: 95% CI indicated 95% confidence interval.
Source: Cunningham et al. (forthcoming).Note: Derived from World Bank Enterprise Surveys, various years.
EducationqualityisquitelowamongthepoorestMekongLMICs.Programme for International Student Assessment (PISA) scores among 15-year old students in Vietnam are high by global standards, but learning outcomes in the other Mekong LMICs are cause for concern. The Early Grade Reading Assessment (EGRA) reveals that 10 percent of Myanmar’s 3rd graders and 33 percent of Cambodia’s 3rd graders are not proficient readers, even though reading is a skill that should have been acquired in the 2nd grade. Today’s nine-year-old Cambodians will utilize their limited basic job skills until they retire in the year 2076.
Even if today’s studentswere acquiring a good education, the large share of currentworkerswith limitedjob skills would still impede employment upgrading. For example, simulations predict that if Cambodia continues improving educational attainment at its current rate, only half the labor force will have completed secondary school by the year 2048, up from 19 percent in 2016.
In the meantime, the rise of increasingly sophisticated jobs is leaving today’s workers even further behind. The fastest-growing jobs in Vietnam and Cambodia require relatively sophisticated skills. For example, the fastest-growing jobs in Cambodia during 2009–2015 required skills such as problem solving and oral communications, while jobs that require “non-routine manual skills” such as cleaning or elementary craft work are experiencing a slow decline. Similar patterns are evident in Vietnam.
Employers indicate that they cannot obtain a wide range of workforce skills, many of which go beyond the standard school curriculum. While technical skills such as familiarity with information technology and foreign languages are important, employers also demand a range of cognitive and interpersonal skills that are in short supply, such as leadership, teamwork, problem solving, and critical thinking (Figure II.B.11). The unmet demand for leadership and management skills is particularly acute, as indicated by the poor performance of Myanmar and Vietnam in the World Management Survey.78
78 http://worldmanagementsurvey.org/
EAST ASIA AND PACIFIC ECONOMIC UPDATE OCTOBER 2018
98 PART II. MEDIUM-TERM DEVELOPMEnT AGEnDA

Figure II.B.11. Employers in Myanmar report shortages of both technical and nontechnical workforce skills, especially interpersonal and managerial skills
Workforce skills required and obtained by employers in Myanmar, 2016percent
100
90
80
70
60
50
40
30
20
10
0
Managerial a
nd
leadership
skills
Interpersonal a
nd
communica
tions
Writing ski
lls
Reading skills
Problemsolvi
ng skills
Critica
l thinkin
g skills
Workethic
and commitm
ent
Foreign language ski
lls
Computer or g
eneral ITski
lls
Tech
nical, n
ot computer
or voca
tional
Numeracyski
lls
J Percent of firms using the skill in the workplace J Percent of firms with the workforce of less than the required level of skill
Source: Cunningham et al. (2018b).Notes: based on Myanmar Enterprise Survey, 2016.
The LMIC countries lack effective systems to help working adults improve their skills. Most jobs in the Mekong LMICs will continue to demand skills best acquired in school and in training centers. However, existing training systems are small (Cambodia and Myanmar) and fragmented (Vietnam and Cambodia), and where they do exist, they tend not to be linked to market demand. They are often more focused on lengthy theoretical courses and diplomas, rather than the swift and flexible provision of skills to an adult working population.
Certain segmentsof thepopulationareespecially ill-prepared toacquirebetter jobs.While young men and women have equal levels of education, working women have fewer years of education than men do. Older workers are at a disadvantage, as are ethnic minorities in Vietnam, particularly those who do not speak Vietnamese. Workers living in conflict-affected areas of Myanmar likely have fewer skills than comparable workers in other areas, and they have less access to services to improve their skill levels.
Emerging megatrends, particularly the rise of knowledge economies and automation, will exacerbate the negativeimpactofdeficienciesinhumancapital.Production processes are becoming less rote and more sophisticated. The demand for higher-quality services and service exports is expanding. Increasing automation and digitization are shifting the task content of jobs away from repetitive and manual tasks and toward those that require “uniquely human skills” that computers and machines lack. These new jobs rely on knowledge, higher-level cognitive skills (e.g., oral communications, problem solving, creativity, etc.), socio-emotional skills (e.g., leadership, teamwork, self-motivation, etc.), and digital literacy, most of which are not taught in schools or training programs. The megatrends are also rapidly reshaping tasks within jobs, which will require constant skill upgrading among the adult workforce. The traditional model of learning while young and then working until retirement will be less feasible in the emerging job market.
99
NAVIGATING UNCERTAINTY
II.B. MEETInG THE JOBS CHALLEnGE In SOUTHEAST ASIA: LESSOnS FROM CAMBODIA, MYAnMAR, AnD VIETnAM

Policy Implications
Proactivemeasureswillberequiredtocapitalizeonglobalmegatrends,createthenecessaryconditionsfornew,high-qualityjobs,andimprovethequalityofcurrentjobs.The primary source of higher-quality employment creation in all three Mekong LMICs is wage-paying jobs in both foreign- and domestically owned firms. The continued pursuit of these jobs will help bring more women into wage employment and provide opportunities for younger workers. However, since traditional jobs will continue to account for the majority of employment for many years, efforts to enhance their productivity and earnings are also important. Upgrading traditional jobs will provide considerable benefits for older workers, ethnic minorities, workers in conflict-affected areas, and communities that have limited access to modern wage-paying jobs. Accelerating the creation of modern jobs and improving the quality of traditional jobs will require a workforce with the right set of skills to fully leverage new job opportunities.
Ì Attract FDI that provides higher-value-added jobs with linkages to local suppliers
The Mekong LMICs should begin diversifying their FDI strategies to attract higher-value-added FDI and foster linkages with local suppliers. Cambodia and Myanmar are in the early stages of global integration, where they offer low-cost labor to attract FDI in low value-added sectors. However, positive spillovers to local suppliers are limited, as foreign firms maintain control of sourcing and frequently import managers and technical experts.79 Vietnam is in early phases of the second stage of global integration; it now engages in higher value-added activities, and foreign firms have more linkages to local suppliers. Cambodia is also moving in that direction. The second stage offers new job opportunities in higher quality jobs in FDI and domestically-linked SMEs. All three Mekong LMICs stand to benefit from further global integration.
Whileastableandtransparentpoliticalandbusinessenvironmentisaprerequisiteforgreaterengagementwiththeglobaleconomy,theMekongLMICsalsoneedtoundertaketrade-specificpolicyreforms.First, lower the cost of importing and exporting by continuing to modernize procedures in trade facilitation and streamline customs requirements and procedures for export and import licenses. Ideally, set up a comprehensive single window for trade facilitation,80 which would reduce the time and costs required for moving goods across borders. Second, develop logistics infrastructure and regulations governing it, such as allowing firms to operate private bonded-warehouses to store duty-exempted intermediate materials for export. Third, lower restrictions across the board (in non-FDI firms, as well) for importing machines and movement of skilled-labor, and facilitate other cross-border movements of inputs and outputs. Fourth, support the development of the domestic potential-supplier sectors to attract new investors (see next section).
Ì Streamlineprocessestointegrate,andleveltheplayingfieldamongforeign-anddomestically-ownedfirms,SMEs,andlargefirms
Processesshouldbesimplifiedtoreducetransactionalandinputscosts,regardlessoffirmsizeorownership.While the business environment and regulations are a challenge for all firms, simplifying processes may particularly benefit SMEs, which may lack the management skills, capital, or experience necessary to cope with burdensome administrative requirements. The Mekong LMICs should eliminate preferential access, open input markets to all competitors, and provide
79 Staritz and Frederick, 2014.80 Under a single-window system, firms submit relevant documents in a single location and have them processed simultaneously by different agencies, without the need to complete
multiple consecutive interactions with each agency.
EAST ASIA AND PACIFIC ECONOMIC UPDATE OCTOBER 2018
100 PART II. MEDIUM-TERM DEVELOPMEnT AGEnDA

other incentives for investment. Investing in public services (e.g., electricity and information technology infrastructure) and simplifying legal norms (e.g., land rights and transfer processes and interest-rate caps) would ease access to inputs. Further reforms will be necessary to eliminate unnecessary business processes in areas such as business registration, exports, imports, movement of labor, profit repatriation, etc. For example, Myanmar has recently implemented a new Companies Act to replace a set of antiquated laws that were designed in the early part of the 20th century. Information technology can be used to reduce the transaction costs involved in these new processes. For example, Cambodia’s online travel visa application cuts the visa-processing time to 10 minutes, whereas acquiring a travel visa for Vietnam can take two weeks.
Fostering linkages between foreign- and domestically ownedfirms andbetween SMEs and largefirms cancreatenewmarketsandnewhigh-qualitydomesticjobs.Governments should attract investors that provide better jobs than the low-value assembly work now prevalent in the region, as well as investors that can connect with local markets. For example, the development of GVCs in semi-perishable agro-processing could source local agricultural products to serve growing Asian markets. Brokering information between domestic firms and foreign investors related to the quality standards and processes that foreign firms require in their suppliers, and encouraging foreign producers to meet with domestic suppliers, could strengthen linkages. Finally, the authorities can help domestic suppliers upgrade to meet foreign standards by developing research and development hubs dedicated to linking into lucrative GVCs, providing managerial extension services, and offering short-term financing to help domestic suppliers upgrade to meet international standards.
Ì Increase the productivity of traditional jobs, including through expanding access to digital technologies
Governments should help family farms diversify and integrate into GVCs by shifting from rice production to higher-value-added products and products designed for domestic urban consumers or export markets. Diversification into non-rice cultivation will require reforming policies governing irrigation infrastructure, extension services, financing for technology and inputs, and social-protection schemes that cover the risk of the transition period. Governments could provide services to help upgrade farmer skills, support innovations to facilitate the transition to new crops, promote the adoption of techniques to meet international standards, and improve farming practices. Regulatory and institutional systems could set, enforce, and certify food standards, ideally in line with international standards, and establish testing, certification, and labelling facilities near cultivation zones.
Information technology can help household enterprises integrate into the local and national economy. While household enterprises are already using Facebook and local apps (e.g., Go-jek in Indonesia and PassApp in Cambodia) to do business, encouraging the development of business process-specific apps can help household enterprises more efficiently aggregate purchasing, engage in e-commerce, reach new consumers, and enhance business processes.81 Furthermore, the Mekong LMIC governments should continue to promote affordable access to broadband internet to better integrate rural residents into the national, and global, economy.
81 World Bank (2016).
101
NAVIGATING UNCERTAINTY
II.B. MEETInG THE JOBS CHALLEnGE In SOUTHEAST ASIA: LESSOnS FROM CAMBODIA, MYAnMAR, AnD VIETnAM

Ì Reform the education and skills-development system to create a 21st century workforce
A two-pronged strategy is necessary to address the skills challenge that is hindering the creation of better jobs among the Mekong LMICs. First, today’s labor market requires a broader range of skills than that which is currently taught in schools. More-sophisticated skills will be particularly valuable for tomorrow’s jobs. School curricula and teaching methods should incorporate digital literacy and higher-order cognitive and behavioral skills, while introducing methods to teach innovation, creativity, and adaptability and devoting greater emphasis to problem-solving, teamwork, communications, and the socio-emotional skills that complement technology and knowledge economies.
Second,effortsarerequiredtorapidlyandpracticallyupskilltheadultlaborforce.The megatrends described above are rapidly reshaping the world of work, and the Mekong LMICs are already lagging in terms of the skill level of their labor forces. In addition, the entry of more-educated workers into the labor force is slow relative to the total stock of workers. In this context, technical and vocational education and training systems need to offer continuous learning, short courses, and self-directed skill developments to the working adult population. There is a significant role for private training institutions, though they would benefit from public-sector oversight, monitoring and evaluation, and incentives to provide services in difficult-to-reach markets or to specific target populations. Greater engagement by private firms is needed to provide training, guide policy, and advocate for a more effective skills-development system. Public-sector leadership will be required to engage with private firms, provide financial and other incentives, and monitor and evaluate the skills-development system to ensure that it meets the needs of employers.
Ì Provide targeted assistance to the excluded
Providingopportunitiesforsomeexcludedgroupswillrequiretargetedpolicies.For example, women would have a greater choice of occupations if they were less constrained by household duties, which can be alleviated by providing quality childcare programs and flexible work schedules. Ethnic minorities may need to improve their language skills and have greater access to broadband internet in order to reach remote markets. Conflict-affected populations may require an influx of assets, including education, startup capital, and land, to kickstart production and sales in areas with underdeveloped markets.
Conclusions
While the jobs picture for Mekong LMICs is hopeful, the region also faces substantial risks. Jobs are rapidly being created by firms hiring contract labor, and exporting firms create more jobs per firm than those that are not engaged with the global economy. The number of subsistence jobs is declining, while the number of market-oriented jobs is rising. Education systems are upgrading, and women and youth are seeing improvements in their labor-market profiles. However, most jobs will remain in traditional sectors and occupations for a long time, since the flow of new jobs is relatively slow. Similarly, the flow of skilled workers is modest relative to the stock of workers, indicating that a low-skilled labor force will persist for many decades. The export-oriented sectors that have been a key source of new jobs (and economic growth) provide few opportunities for job upgrading, and Mekong LMICs may become less competitive as global partnerships evolve. Some populations, including older workers, less-skilled workers, women, and
EAST ASIA AND PACIFIC ECONOMIC UPDATE OCTOBER 2018
102 PART II. MEDIUM-TERM DEVELOPMEnT AGEnDA

ethnic minorities, risk falling further behind as their economies slowly shift toward semiskilled and market-based jobs that involve local, national, and international value chains and that produce for consumers in remote markets.
GlobalmegatrendswillnotautomaticallyimprovethejobsprofileamongMekongLMICs,andpolicymakersmustdeliberatelypursuestrategiestomaximizetheirbenefits.A proactive reform agenda along the lines discussed above would leverage evolving megatrends to improve job quality and inclusiveness. This multi-sectoral agenda implies changes to current investment, export, agricultural development, and skill development strategies, as well as improvements in information flows, greater domestic economic integration, and efforts to create a level playing field to enable firms and workers to reap the full benefits of the jobs created by the new economy.
103
NAVIGATING UNCERTAINTY
II.B. MEETInG THE JOBS CHALLEnGE In SOUTHEAST ASIA: LESSOnS FROM CAMBODIA, MYAnMAR, AnD VIETnAM

Part II References
Aakvik, Arild, Kjell G. Salvanes, and Kjell Vaage. 2010. “Measuring Heterogeneity in the Returns to Education Using an Education Reform.” European Economic Review 54 (4): 483–500.
Abu-Saad, Kathleen, and Drora Fraser. 2010. “Maternal Nutrition and Birth Outcomes.” Epidemiologic Reviews 32 (1): 5–25.
Aizer, Anna, and Janet Currie. 2014. “The Intergenerational Transmission of Inequality: Maternal Disadvantage and Health at Birth.” Science 344 (6186): 856–61.
Alderman, Harold, John Hoddinott, and Bill Kinsey. 2006. “Long-Term Consequences of Early Childhood Malnutrition.” Oxford Economic Papers 58 (3): 450–74.
Alesina, Alberto, Stefanie Stantcheva, and Edoardo Teso. 2018. “Intergenerational Mobility and Preferences for Redistribution.” American Economic Review 108 (2): 521–54.
Bastian, Jacob, and Katherine Michelmore. 2017. “The Long-Term Impact of the Earned Income Tax Credit on Children’s Education and Employment Outcomes.” Journal of Labor Economics. doi: 10.1086/697477.
Barro, Robert and Jong-Wha Lee, 2013, "A new Data Set of Educational Attainment in the World, 1950-2010." Journal of Development Economics, vol 104, pp.184-198.
Benabou, Roland, and Efe A. Ok. 2001. “Social Mobility and the Demand for Redistribution: The POUM Hypothesis.” Quarterly Journal of Economics 116 (2): 447–87.
Bourguignon, François, Francisco H.G. Ferreira, and Michael Walton. 2007. “Equity, Efficiency and Inequality Traps: A Research Agenda.” The Journal of Economic Inequality 5 (2): 235–56.
Brunello, Giorgio, and Daniele Checchi. 2007. “Does School Tracking Affect Equality of Opportunity? new International Evidence.” Economic Policy 22 (2): 782–861.
Campante, Filipe R., and Davin Chor. 2012. “Why Was the Arab World Poised for Revolution? Schooling, Economic Opportunities, and the Arab Spring.” Journal of Economic Perspectives 26 (2): 167–88.
Chen, Y., S. Naidu, T. Yu, and N. Yuchtman. 2015. “Intergenerational Mobility and Institutional Change in 20th Century China.” Explorations in Economic History 58: 44-73.
Chetty, Raj, and Nathaniel Hendren. 2018a. “The Impacts of Neighborhoods on Intergenerational Mobility I: Childhood Exposure Effects.” Quarterly Journal of Economics. https://doi.org/10.1093/qje /qjy007.
———. 2018b. “The Impacts of neighborhoods on Intergenerational Mobility II: County-Level Estimates.” Quarterly Journal of Economics. https://doi.org/10.1093/qje/qjy006.
Chetty, Raj, John n. Friedman, and Jonah E. Rockoff. 2011. “new Evidence on the Long-Term Impacts of Tax Credits.” IRS Statistics of Income White Paper, Internal Revenue Service, Washington, DC.
Chetty, Raj, nathaniel Hendren, and Lawrence F. Katz. 2016. “The Effects of Exposure to Better neighborhoods on Children: new Evidence from the Moving to Opportunity Experiment.” American Economic Review 106 (4): 855–902.
Chetty, R., D. Grusky, M. Hell, N. Hendren, R. Manduca and J. Narang. 2017. “The fading American dream: Trends in absolute income mobility since 1940”. Science, 356(6336), pp.398-406.
Chowdhury, Iffat; Johnson, Hillary C.; Mannava, Aneesh; Perova, Elizaveta. 2018. Gender Gap in Earnings in Vietnam : Why Do Vietnamese Women Work in Lower Paid Occupations?. Policy Research Working Paper; No. 8433. World Bank, Washington, DC.
EAST ASIA AND PACIFIC ECONOMIC UPDATE OCTOBER 2018
104 PART II. MEDIUM-TERM DEVELOPMEnT AGEnDA

Corak, Miles. 2013. “Income Inequality, Equality of Opportunity, and Intergenerational Mobility.” Journal of Economic Perspectives 27 (3): 79–102.
———. 2016. “Inequality from Generation to Generation: The United States in Comparison.” IZA Discussion Report No. 9929, Institute for the Study of Labor, Bonn.
Cunningham, Wendy; Claire Hollweg, Gabriel Demombynes, Mary Hallward-Driemeier, Mauro Testaverde, Michael Crawford, Elizaveta Perova, nga Thi nguyen, Obert Pimhidzai, Reyes Aterido, Sergiy Zorya, and Steven Jaffee. 2018a. Vietnam’s Future Jobs: Leveraging Mega-Trends for Greater Prosperity. World Bank: Washington, DC. http://documents.worldbank.org/curated/en/670201533917679996/
Cunningham, Wendy; Munoz Moreno, Rafael; Rahardja, Sjamsu; Hollweg, Claire Honore; Leão, Izabela; Ekanayake, Indira Janaki; Ahmed, Md Mansur; Amin, Mohammed; Rab, Habib Nasser; and Yoong, Pui Shen. 2018b. Myanmar's Future Jobs : Embracing Modernity - Main Report (English). Washington, D.C. : World Bank Group. http://documents.worldbank.org/curated/en/958621536141390299/Myanmars-Future-Jobs-Embracing-Modernity-Main-Report
Cunningham, Wendy; Hollweg, Claire; Buba, Johanne; Chea, Marong; Lee, Une; Ly, Sodeth; Nguyen, Lan; Sanchez, Miguel; and Shrestha, Maheshwor. Forthcoming. Cambodia’s Future Jobs. Washington, DC: World Bank Group.
Demombynes and Testaverde. 2016. The labor market and returns to skill in Vietnam: New estimates using the Labor Force Survey. Unpublished manuscript.
Dahl, Gordon B., and Lance Lochner. 2012. “The Impact of Family Income on Child Achievement: Evidence from the Earned Income Tax Credit.” American Economic Review 102 (5): 1927–56.
Duflo, Esther, Pascaline Dupas, and Michael Kremer. 2017. “The Impact of Free Secondary Education: Experimental Evidence from Ghana.” MIT Working Paper, Massachusetts Institute of Technology, Cambridge, MA.
Fan, Y., J. Yi, and J. Zhang. 2015. “The Great Gatsby Curve in China: Cross-Sectional Inequality and Intergenerational Mobility.” Working Paper.
Fiszbein, Ariel, norbert Schady, Francisco H. G. Ferreira, Margaret Grosh, niall Keleher, Pedro Olinto, and Emmanuel Skoufias. 2009. “Conditional Cash Transfers: Reducing Present and Future Poverty.” Policy Research Report, World Bank, Washington, DC.
Frederick, S. 2017. “Apparel Skills Mapping and Functional Upgrading in Vietnam: Jobs Diagnostic.” Mimeo. Washington, D.C.: International Bank for Reconstruction and Development/The World Bank.
Galor, Oded, and Daniel Tsiddon. 1997. “Technological Progress, Mobility, and Economic Growth.” American Economic Review 87 (3): 363–382.
Gaviria, Alejandro, Carol Graham, and Luis H. B. Braido. 2007. “Social Mobility and Preferences for Redistribution in Latin America.” Economía 8 (1): 55–96.
Gertler, Paul, James Heckman, Rodrigo Pinto, Arianna Zanolini, Christel Vermeersch, Susan Walker, Susan M. Chang, and Sally Grantham-McGregor. 2014. “Labor Market Returns to an Early Childhood Stimulation Intervention in Jamaica.” Science 344 (6187): 998–1001.
Gill, Indermit S., Ana Revenga, Christian Zeballos. (2016). Grow, Invest, Insure: A Game Plan to End Extreme Poverty by 2030. World Bank Policy Research Working Paper 7892.
Golley, J., and S. Kong. 2013. “Inequality in Intergenerational Mobility of Education in China.” China & World Economy 21 (2): 15-37.
Gong, H., A. Leigh, and X. Meng. 2012. “Intergenerational Income Mobility in Urban China.” Review of Income and Wealth 58 (3): 481-503.
Hassler, John, and José V. Rodríguez Mora. 2000. “Intelligence, Social Mobility, and Growth.” American Economic Review 90 (4): 888–908.
105
NAVIGATING UNCERTAINTY
PART II REFEREnCES

Heckman, James J., Rodrigo Pinto, and Peter Savelyev. 2013. “Understanding the Mechanisms through Which an Influential Early Childhood Program Boosted Adult Outcomes.” American Economic Review 103 (6): 2052–86.
Heckman, James J., and Tim Kautz. 2014. “Fostering and Measuring Skills: Interventions That Improve Character and Cognition.” In The Myth of Achievement Tests: The GED and the Role of Character in American Life, edited by J. Heckman, J. E. Humphries, and T. Kautz, 341–430. Chicago, IL: University of Chicago Press.
Hallward-Driemeier, Mary C.. 2015. Jobs group : jobs diagnostics guidance - why, what, and how?. Washington, D.C. : World Bank Group. http://documents.worldbank.org/curated/en/250131468182343926/Jobs-group-jobs-diagnostics-guidance-why-what-and-how
Hoddinott, John, Harold Alderman, Jere R. Behrman, Lawrence Haddad, and Susan Horton. 2013. “The Economic Rationale for Investing in Stunting Reduction.” Maternal and Child Nutrition 9 (S2): 69–82.
Hollweg, Claire. 2018. “Labor Mobility and New Trade Opportunities in Vietnam.” Mimeo. World Bank, Washington, DC.
Huang, J., Y. Guo, and Y. Song. 2016. “Intergenerational Transmission of Education in China: Pattern, Mechanism, and Policies. ECINEQ Working Paper 415.
ILO. 2016. Asean in Transformation: Perspectives of Enterprises and Students on Future Work. Bureau for Employers’ Activities (ACT/EMP), Working Paper #11.
Jamora, n. and P. Labaste. 2015. Overview of Food Demand Trends and Prospects in East Asia. Background paper prepared for the World Bank Montenegro and Patrinos (2014),
Knight, John, Terry Sicular, and Yue Ximing. 2013 “Educational Inequality in China: The Intergenerational Dimension.” In Rising Inequality in China – Challenges to a Harmonious Society. Eds. Li Shi, Hiroshi Sato, and Terry Sicular.
Krishnan, Nandini, Gabriel Lara Ibarra, Ambar Narayan, Sailesh Tiwari, and Tara Vishwanath. 2016. Uneven Odds, Unequal Outcomes: Inequality of Opportunity in the Middle East and North Africa. Washington, DC: World Bank.
Liu, Zhiqiang. 2005. “Institution and inequality: the hukou system in China”, Journal of Comparative Economics. Volume 33, Issue 1, March 2005, Pages 133-157. https://doi.org/10.1016/j.jce.2004.11.001
Magnani, E., and R. Zhu. 2015. “Social Mobility and Inequality in Urban China: Understanding the Role of Intergenerational Transmission of Education.” Applied Economics 47 (43): 4590-4606.
Meghir, Costas, and Mårten Palme. 2005. “Educational Reform, Ability, and Family Background.” American Economic Review 95 (1): 414–24
Molina-Millan, Teresa, Tania Barham, Karen Macours, John A. Maluccio, and Marco Stampini. 2016. “Long-Term Impacts of Conditional Cash Transfers in Latin America: Review of the Evidence.” IDB Working Paper Series No. IDB-WP-732, Inter-American Development Bank, Washington, DC.
Montenegro, Claudio E. and Harry Anthony Patrinos. 2014. “Comparable Estimates of Returns to Schooling Around the World.” Policy Research Working Paper No. 7020. Washington, D.C.: World Bank Group.
Narayan, Ambar, Roy Van der Weide, Alexandru Cojocaru, Christoph Lakner, Silvia Redaelli, Daniel Gerszon Mahler, Rakesh Gupta N. Ramasubbaiah, and Stefan Thewissen. 2018. Fair Progress? Economic Mobility across Generations around the World. Washington, DC: World Bank.
Nguyen, Thuy Hong Van. 2017. Informal Sector Workers in Ho Chi Minh City. Washington, D.C.: International Bank for Reconstruction and Development/The World Bank.
OECD (Organisation for Economic Co-operation and Development). 2016. PISA 2015 Results (Volume I): Excellence and Equity in Education. Paris: OECD Publishing. doi: 10.1787 /9789264266490-en
Owen, Ann L., and David n. Weil. 1998. “Intergenerational Earnings Mobility, Inequality and Growth.” Journal of Monetary Economics 41 (1): 71–104.
EAST ASIA AND PACIFIC ECONOMIC UPDATE OCTOBER 2018
106 PART II. MEDIUM-TERM DEVELOPMEnT AGEnDA

Pasquier-Doumer, Laure, Xavier Oudin, and Nguyen Thang. 2017. The Importance of Household Businesses and the Informal Sector for Inclusive Growth in Vietnam. Vietnam Academy of Social Sciences and the French National Research Institute for Sustainable Development.
Pekkarinen, Tuomas, Roope Uusitalo, and Sari Kerr. 2009. “School Tracking and Intergenerational Income Mobility: Evidence from the Finnish Comprehensive School Reform.” Journal of Public Economics 93 (7–8): 965–73.
Permani, R. 2009. “The Role of Education in Economic Growth in East Asia: A Survey”, Asia-Pacific Economic Literature 2(1): 1-20.
Staritz, Cornelia, and Stacey Frederick. 2014. “Sector Case Study: Apparel.” in Farole, Thomas. and Deborah Winkler, eds. Making Foreign Direct Investment Work in Sub-Saharan Africa: Local Spillovers and Competitiveness in Global Value Chains Washington, DC: World Bank Group
Tanaka, Mari. 2017. “Exporting Sweatshops? Evidence from Myanmar” Available at SSRn: https://ssrn.com/abstract=2938903 or http://dx.doi.org/10.2139/ssrn.2938903
United Nations. 2017. Trends in International Migrant Stock: The 2017 Revision. United Nations database. New York: UN.
Vegas, Emiliana, and Chelsea Coffin. 2015. “When Education Expenditure Matters: An Empirical Analysis of Recent International Data.” Comparative Education Review 59 (2): 289–304.
World Bank. 2014. East Asia Pacific At Work: Employment, Enterprise, and Well-being. Washington, DC: World Bank
World Bank. 2016. World Development Report 2016: Digital Dividends. Washington, DC: World Bank.
World Bank. 2018a. World Development Report 2018. Learning to Realize Education’s Promise. Washington, DC: World Bank.
World Bank. 2018b. Growing Smarter, Learning and Equitable Development in East Asia and the Pacific. Washington, DC: World Bank.
World Bank. 2018c. Riding the Wave: An East Asian Miracle for the 21st Century. World Bank East Asia and Pacific Regional Report. Washington, DC: World Bank.
World Bank 2018d. Economic and Distributional Impacts of Comprehensive and Progressive Agreement for Trans-Pacific Partnership: the case of Vietnam. Washington, DC: World Bank.
107
NAVIGATING UNCERTAINTY
PART II REFEREnCES


Part III. Country Summaries and Key Indicators
109
WORLD BANK EAST ASIA AND PACIFIC ECONOMIC UPDATE OCTOBER 2018
CAMBODIA
2017Population, million 16.1GDP, current US$ billion 22.1GDP per capita, current US$ 1,373School enrolment rate, primary (% gross)a 110.2Life expectancy at birth, yearsa 69.0Source: WDI, Macro Poverty Outlook, and official data.Notes: a. Most recent WDI value (2016).
Summary
During the first half of 2018, Cambodia’s economy continues to grow robustly, with garment exports reaching a two-year high. Foreign direct investment and private sector deposits have increased by 14.3 and 22.4 percent (y/y), respectively. The Cambodian economy is expected to grow at 7.0 percent in 2018, compared to 6.9 percent in 2017, underpinned by upbeat investor sentiment and rising government spending. This will contribute to continued reduction in poverty. But rising fiscal deficit and collateral damage from a global trade war pose risks to Cambodia’s outlook.
Recent Developments
Economic growth remains strong, driven mainly by external demand. Garment, travel goods, and footwear exports increased 16.1 percent (y/y) during the first half of 2018—a two year high—up from 8.3 percent at the end of 2017. Consistent with this trend, fabric imports, largely used as inputs for garment production, grew at
37.1 percent during the first six months of 2018, a three-year high. Tourist arrivals reached 3 million during the first six month of 2018. This represents a 13.6 percent increase (y/y), compared with 11.8 percent in 2017, and is driven by a surge in tourist arrivals by air from China.
Capital inflows continue to increase, and the external position remains stable. The current account deficit slightly widened in the first half of 2018, but was entirely financed by FDI inflows. Confidence in the banking system has remained strong and private sector deposits, largely in US dollars, grew at 22.4 percent y/y in June 2018. Gross international reserves rose to US$9.0 billion or about 6 months of prospective imports. The Cambodian riel (CR) which is pegged to the US dollar due to Cambodia’s highly dollarized economy, has remained stable, at CR 4,063 per US dollar at the end of June 2018, compared to CR 4,037 at the end-December 2017.
Large foreign direct investment inflows continue to underpin construction activity. Foreign direct investment is estimated to have increased by 14.3 percent (y/y) during the first six months of 2018. More than half of the inflows originated from China, and are directed towards commercial and residential real estate, as well as, to a lesser extent, manufacturing and agriculture. Newly emerging hot spots of the current construction boom include the seaside provincial town of Sihanoukville, whose FDI approvals amounted US$126 million in June 2018 alone.
Credit growth slightly eased, while domestic demand surged, fueling economic activity. While domestic credit growth moderated further to 17.4 percent y/y in June 2018, thanks in part to the interest rate cap, domestic demand surged. Motor vehicles and steel imports, which gauge domestic consumption and construction demand, rapidly increased, rising by 81.4 percent and 50.0 percent in June 2018, respectively. Rising prices of food and utilities have pushed up inflation, which rose to 2.9 percent y/y in June 2018, from 2.2 percent in December 2017.
EAST ASIA AND PACIFIC ECONOMIC UPDATE OCTOBER 2018
110 PART III. COUnTRY SUMMARIES AnD KEY InDICATORS: CAMBODIA

Recovering agricultural production seems to have helped contain outward migration. Depressed commodity prices and adverse meteorological conditions (el Nino) during 2014 and 2015 resulted in a pickup in migration. The recovery in agricultural production in 2016 and 2017, coupled with improving economic prospects, is believed to have contributed to a return of migrants from Thailand, as proxied by a recent fall in remittances.
Outlook
Against a backdrop of better than expected export performance, rising consumption and upbeat investor sentiment, the growth outlook has been revised up. Underpinned by exports and government spending, Cambodia’s growth is expected to marginally accelerate to 7.0 percent in 2018, compared to 6.9 percent in 2017 (revised official figure). As global demand peaks this year, growth in Cambodia is expected to remain robust, easing modestly to 6.8 percent in 2019 and 2020. Strong economic growth is expected to result in continued poverty reduction.
Expansionary fiscal policy has underpinned consumption. Driven by both wages and public investment, public outlays are budgeted to increase significantly in 2018, reaching 24.6 percent of GDP, up from 22.7 percent in 2017. The overall fiscal deficit (including grants) is therefore expected to widen to 4.2 percent in 2018, up from 1.6 percent in 2017. Fiscal buffers in the form of government deposit remain substantial, accounting for about 13 percent of GDP by mid-2018. Cambodia’s debt distress level remained low as per the 2017 WB/IMF Debt Sustainability Analysis.
Risks and Challenges
The main risks stem from rising protectionism and the potential revision of Cambodia’s preferential access to advanced economies. Tariff escalation in major economies would affect Cambodia only indirectly. On one hand, there
could be some potentially positive trade and investment diversion from China in the short-term. On the other hand, however, trade wars would disrupt global value chains and depress investors’ sentiment, adversely impacting Cambodia and other small export-oriented economies.
A sharp slowdown in the Chinese economy could substantially dampen Cambodia’s growth prospects. In the scenario of a hard landing of the Chinese economy, Cambodia would experience slower tourist arrivals and reduced foreign direct investment, hampering economic growth. The impact through the trade channel would, on the other hand, be muted, due to low dependency on China as an export destination. It is nonetheless worth noting that, in a context of shallow financial markets, Cambodia seems to be less exposed than other neighboring countries to deteriorating global financing conditions and increased volatility in capital markets.
To sustain strong growth in the medium term, Cambodia needs to mobilize domestic savings to boost investment. Cambodia lags behind other countries in East Asia and the Pacific in terms of the quality of infrastructure, and it is heavily dependent on aid and foreign funding to build its network. Overall capital accumulation, below 20 percent of GDP until recent years, has also been slower than in other fast-growing countries such as Vietnam or Thailand. Investments have been partly limited by low domestic savings. To sustain rapid growth and to reduce excessive dependency on external capital, Cambodia would need to boost domestic savings and investment, including through the diversification of financial products, the development of domestic debt market, and the strengthening of public investment management practices.
111
NAVIGATING UNCERTAINTY
PART III. COUnTRY SUMMARIES AnD KEY InDICATORS: CAMBODIA

Figure 1. Real GDP growth, contribution to real growth Figure 2. Trends in rubber and rice prices and remittancesPercent, percentage points Rice (THA) and rubber (SGP) price, 2003=100 Remittances, percent of GDP
2013 2014 2015 2016 2017/pre
8
7
6
5
4
3
2
1
0
-1
7.47.1 7.0 7.0 6.9
500
400
300
200
100
0
3.5
3.0
2.5
2.0
1.5
1.0
0.5
0
20122014
20162010
20082006
20042002
20002017
J Agriculture J Garment/footw. J Construction J Other industries J Trade ▬ Rice ▬ Rubber ▬ Remittances, rhs
J Real estate J Other services J Taxes less subsidies ▬ GDP growth
Source: National accounts of Cambodia. Source: World Bank commodity prices database, WDI.
CAMBODIA Selected Indicators 2015 2016 2017 2018e 2019f 2020f
Real GDP growth, at constant market prices 7.0 7.0 6.9 7.0 6.8 6.8Private Consumption 5.9 6.7 4.6 4.6 4.4 4.4Government Consumption 4.4 5.7 6.5 7.5 2.4 2.0Gross Fixed Capital Investment 10.6 10.1 6.1 8.5 10.2 8.8Exports, Goods and Services 7.2 8.6 5.3 9.7 9.8 10.0Imports, Goods and Services 6.5 8.6 4.1 8.1 8.4 8.4
Real GDP growth, at constant factor prices 6.9 6.9 6.8 6.9 6.7 6.7Agriculture 0.2 1.4 1.9 1.3 1.1 1.0Industry 11.7 10.5 10.1 11.4 9.7 8.7Services 7.1 6.8 6.6 5.9 6.6 7.3
Inflation (Consumer Price Index) 1.7 3.5 3.1 3.2 3.3 3.0Current Account Balance (% of GDP) -11.0 -10.2 -9.8 -10.3 -10.2 -9.9
Net Foreign Direct Investment (% of GDP) 9.1 10.8 10.8 10.9 10.6 10.4Fiscal Balance (% of GDP) -1.9 -1.4 -1.6 -4.2 -4.1 -4.3Debt (% of GDP) 31.3 32.4 33.9 36.2 37.0 37.5Primary Balance (% of GDP) -1.6 -1.0 -1.2 -3.8 -3.7 -3.9
Source: World Bank, Poverty & Equity and Macroeconomics, Trade & Investment Global Practices.Notes: e = estimate, f = forecast.
EAST ASIA AND PACIFIC ECONOMIC UPDATE OCTOBER 2018
112 PART III. COUnTRY SUMMARIES AnD KEY InDICATORS: CAMBODIA

CENTRAL PACIFIC ISLANDS
2016Population, million 0.31GDP, current US$ billion 1.12GDP per capita, current US$ 3,643Sources: WDI, World Bank staff estimates.
Summary
Economic activity and government revenues in the Central Pacific countries—Kiribati, Nauru and Tuvalu—are highly reliant on rents from a few key sources (fisheries, Tuvalu’s .tv internet domain, and Australia’s Regional Processing Centre for asylum-seekers located in Nauru). In the face of volatile revenues in Kiribati and Tuvalu, and an expected decline in revenues in Nauru, it will be important for the Central Pacific countries to focus on expenditure quality and maintaining fiscal discipline.
Recent Developments
In Kiribati, strong fisheries revenue and donor-funded construction projects have underpinned seven consecutive years of economic growth. Real GDP growth is estimated to have been 3.1 percent in 2017, while the government recorded a surplus of 3.5 percent of GDP. The current account surplus was 14 percent of GDP in 2017, with fishing license revenue and transfers more than offsetting Kiribati’s large trade imbalance. On the back of recent highs in fisheries revenue, the government has been able to build up large cash buffers and make one-off contributions
to Kiribati’s sovereign wealth fund at the same time as pursuing significant new expenditure programs. Since 2015 the government has more than doubled the size of the Copra Price Scheme, an agricultural subsidy that serves as the main source of cash income in Kiribati’s outer islands, and which is now equivalent to 12 percent of GDP. In the 2018 budget, the government also granted a 30 percent pay rise for civil servants. A government-mandated decrease in electricity fees in 2017 has made it more affordable for poorer households in South Tarawa to establish electricity connections, and contributed to low inflation of 0.4 percent.
After doubling in size in the early part of the decade, Nauru’s small, undiversified economy has grown much more slowly in recent years and remains highly vulnerable to shocks. Growth is estimated to have slowed to 4 percent in FY2017 due to a slowdown in phosphate exports—with phosphate reserves now almost completely depleted—as well as the exit and resettlement of refugees from Australia’s Regional Processing Centre (RPC), which in recent years has been the main driver of economic activity in Nauru due to direct fees and payments from Australia and associated demand for local labor and services. The economy is expected to have contracted by 3 percent in FY2018 as the RPC scales down and refugees are resettled elsewhere. Inflation is expected to have eased to below 2 percent in line with declining activity and improved functioning of the port after repairs in FY2016. Government revenue has increased about five-fold (in real terms) since FY2012 due to RPC-related revenues and fishing license fees, as well as increased tax collection from the implementation of employment and services taxes and improvements in tax administration. However, government spending has also increased rapidly, particularly on the wage bill, but also on goods, services, and social benefits, including aged and disability pensions and the community housing scheme, which benefits some of the most vulnerable in nauru. Surpluses of around 5 percent and 15 percent of GDP were realized in FY2017 and FY2018 respectively, and the government has continued to make contributions to the Nauru Trust Fund and to its cash buffers.
113
NAVIGATING UNCERTAINTY
PART III. COUnTRY SUMMARIES AnD KEY InDICATORS: CEnTRAL PACIFIC ISLAnDS
Tuvalu’s economic growth continues to be driven by the public sector and donor-funded expenditures. In 2017, GDP growth was 3.2 percent, slightly up from 3.0 percent in 2016, supported by large infrastructure and housing projects ahead of regional summits. Inflation edged up to 4.4 percent as prices for transportation and imported food increased, reflecting in part higher oil prices. The current account remained in a surplus of 5 percent of GDP, as the trade deficit was more than offset by strong factor income and current transfers. Tuvalu maintained fiscal surpluses despite high expenditure in recent years thanks to revenue from fishing license fees and the “.tv” domain, and grants. The resulting post-grant surpluses have been used to replenish the Consolidated Investment Fund (CIF) and, more recently, to capitalize the Tuvalu Trust Fund and the newly established the Tuvalu Survival Fund. However, moderating fishing revenues contributed to a fiscal deficit of 3.8 percent of GDP in 2017, financed through the CIF.
Outlook
In Kiribati growth of around 2 percent is expected over the medium term, driven by donor-funded construction, the delivery of the government’s own infrastructure program, and demand stimulated by the public sector pay rise. The fiscal surplus is expected to narrow from 2018 onwards, as fisheries revenue moderates and the government looks to increase development expenditure.
In Tuvalu, ramping up construction is expected to drive growth to about 4 percent in 2018, and inflation is expected to moderate as oil price pressures ease. Declining fishing license fees and rising infrastructure-related imports are expected to deteriorate the current account. After a projected surplus in 2018 driven by one-off revenues, the fiscal position is expected to return to deficit in 2019.
Little to no economic growth is expected in Nauru in FY2019 as the RPC continues to scale down, and only modest growth averaging around 2 percent per annum is expected over the longer term. Work on the construction of a more reliable and climate-resilient port is planned
to begin in FY2019, offering some support to overall economic activity, though there are risks of delays.
Risks and Challenges
Kiribati is contending with a large deficit in essential services, infrastructure investment and maintenance, with growing strain from internal migration, population growth and climate change. Increasing the quality of expenditure and maintaining an appropriate balance of wage, non-wage and capital spending is vital to addressing these challenges and reducing poverty.
In Nauru, growth remains dependent on the still uncertain outlook for the RPC, and the extent to which donor support compensates for any revenue shortfalls and acts to stimulate domestic incomes and output. Fishing license fees have remained above 20 percent of GDP in recent years and are likely to remain an important source of revenue, though the central case is for continued declines in RPC-related revenue, highlighting the importance of continued fiscal discipline and increased efforts to diversify the economy.
Given its size and geographical constraints, Tuvalu’s economy is highly volatile and dependent on external flows. In the absence of an independent monetary policy, fiscal policy remains the only tool to respond to shocks. Given the potential for a tightening in available resources, improving the quality of expenditure, containing the deficit and strengthening fiscal buffers will be important. It will also be important for the government to consolidate the budget while protecting high-priority expenditure on infrastructure and the social sector, while ensuring constant or growing real balances in Tuvalu’s trust funds.
EAST ASIA AND PACIFIC ECONOMIC UPDATE OCTOBER 2018
114 PART III. COUnTRY SUMMARIES AnD KEY InDICATORS: CEnTRAL PACIFIC ISLAnDS

Figure 1. Sources of domestic revenue - projections to 2020 Figure 2. Projected sovereign wealth fund balances and per capita values
Percent of GDP Fund balance, A$ millions Per capita value, A$, in thousands
120
100
80
60
40
20
0
20
15
20
16
20
17
20
18
20
19
20
20
Kiribati Nauru Tuvalu
20
15
20
15
20
16
20
16
20
17
20
17
20
18
20
18
20
19
20
19
20
20
20
20
2015 2016 2017 2018 20202019
1,400 25
1,200
20
1,000
15800
10600
5
400
200
0 0
J Fishing license fees J Regional processing centre J .TV domain J Other revenue J Kiribati J Nauru J Tuvalu
Sources: Country authorities, and World Bank and IMF staff estimates and projections. Nauru data are based on the year ended June; Kiribati and Tuvalu are calendar years.
Sources: Country authorities, and World Bank and IMF staff estimates and projections. Nauru data are based on the year ended June; Kiribati and Tuvalu are calendar years. The Nauru Trust Fund was established in 2016.
CENTRAL PACIFIC ISLANDS Selected Indicators 2015 2016 2017 2018f 2019f 2020f
Real GDP growth, at constant market pricesKiribati 10.3 1.1 3.1(p) 2.3 2.4 2.3Nauru 2.8 10.4 4.0 -3.0 0.5 1.5Tuvalu 9.1 3.0 3.2 4.3 4.1 4.4
Sources: Country authorities and World Bank and IMF staff estimates.Notes: 2017 estimates are not yet available for Kiribati. Nauru data are based on the year ended June; Kribiati and Tuvalu are calendar years.
115
NAVIGATING UNCERTAINTY
PART III. COUnTRY SUMMARIES AnD KEY InDICATORS: CEnTRAL PACIFIC ISLAnDS

CHINA
2017Population, million 1,384GDP, current US$ billion 12,027.0GDP per capita, current US$ 8,690International poverty rate ($1.9)a 0.7Lower middle-income poverty rate ($3.2)a 7.0Upper middle-income poverty rate ($5.5)a 27.2School enrolment, primary (% gross)b 100.9Life expectancy at birth, yearsb 76.3Source: WDI, Macro Poverty Outlook, and official data.Notes: a. Using tabulated data from China NBS for 2015, at 2011 PPP rates. b. Most recent WDI value (2016).
Summary
Supported by strong consumption, GDP growth remained resilient in the first half of 2018 at 6.8 percent. Growth is projected to moderate to 6.5 percent in 2018, and further to 6.2 percent in 2019-20, due to more moderate trade growth, weaker credit growth, greater investment uncertainty, and rebalancing. Poverty reduction will continue, with the extreme poverty rate projected to decline to 0.2 percent by 2020. The ongoing trade and investment dispute between the U.S. and China poses some risk to China’s growth prospects and financial market stability.
Recent Developments
Economic activity remained resilient in the first half of 2018, with GDP growing by 6.8 percent, as compared to 6.9 percent in 2017. Final consumption contributed
5.3 percentage points (pp) to GDP growth, while investment contributed 2.1pp. In contrast to 2017, when net trade supported growth, net exports reduced growth by 0.7pp in the first half of 2018 relative to the same period in 2017. As economic rebalancing continues, services grew by 7.6 percent in the first half of 2018, while industry expanded by 6.1 percent. Within services, software and IT services are rising at double-digit rates. Although their share in GDP is still rather small, they contributed 1.1 percentage points to growth in the first half of 2018.
In the first half of 2018, annual growth in real consumption expenditure per capita was 6.7 percent in urban areas and 10.1 percent in rural areas - an acceleration with respect to the first half of 2017. This acceleration is compatible with the continued reduction in rural poverty. Average real household incomes per capita grew by 5.8 percent in urban areas and by 6.8 percent in rural ones, further narrowing the urban/rural income gap.
Owing largely to weaker non-bank financing, growth in total credit to the non-financial sector grew at an annualized rate of 10.5 percent in the first half of 2018, down from 13.6 percent growth in 2016. New regulations on shadow financing, together with a new impetus for implementation of the revised Budget Reform, has lowered lending to local government financing vehicles (LGFVs), and slowed growth in commercial bank assets notably. Weaker infrastructure investment has also reduced real growth in fixed asset investment to 0.3 percent in the first half of 2018, as compared to 4.0 percent in the first half of 2017.
The fiscal stance of general government was tighter than in the first half of 2017. While revenues in the consolidated Public Finance and Government Fund Budgets increased by 15.6 percent in the first half of 2018, expenditure rose by 12.7 percent. Strong measures to reduce off-budget borrowing have also served to tighten the overall stance of general government.
In the context of rebalancing toward domestic demand, import growth continues to outpace that of exports.
EAST ASIA AND PACIFIC ECONOMIC UPDATE OCTOBER 2018
116 PART III. COUnTRY SUMMARIES AnD KEY InDICATORS: CHInA

The current account balance moved into deficit of US$28.3 billion (0.2 percent of GDP) in the first half of 2018. Net of currency valuation effects, gross foreign exchange reserves rose by US$50.1 billion to US$3.1 trillion. The rise in foreign reserves suggests net capital inflows of about US$78 billion (0.6 percent of GDP) in the first half of 2018.
Rising trade tensions have increased uncertainty in China, and was associated with some financial market volatility in recent months. From May to mid-August, 2018, the RMB depreciated by 8.6 percent against the US dollar and the Shanghai Composite Index fell by 11.6 percent.
Outlook
Growth is forecast to moderate to 6.5 percent in 2018, and further to 6.2 percent in 2019–20. The contribution of net exports is expected to be much weaker than in 2017. Both tighter domestic credit conditions, due to policy efforts to reduce financial risks, and higher investor uncertainty, stemming from the deterioration in US-China trade relations, are expected to weigh on investment. The US trade measures should impact growth momentum somewhat in the fourth quarter. The authorities plan to boost government investment to support domestic demand in the second half of 2018.
Poverty rates are expected to continue to decline. Using the international poverty line ($1.90/day 2011 PPP) poverty rates are forecasted to fall from 0.4 to 0.2 percent between 2017 and 2020. Using poverty rates of $3.20/day and $5.50/day, poverty rates are projected to be 2.0 and 13.6 percent, respectively, by 2020.
Risks and Challenges
The ongoing trade dispute between the U.S. and China poses considerable risk to China’s growth prospects, though the direct impact so far appears manageable. The effect would amplify if the disputes escalate to include
foreign direct investment, or if business sentiment deteriorates significantly. The greater risk for China and the world economy would be a major weakening of the rules governing global trade and investment and unraveling of global value chains.
China has already announced additional accommodative fiscal measures to mitigate the negative impact of US trade measures and rising investor uncertainty. While some fiscal and monetary easing under the current circumstances might be warranted, a major loosening of macroeconomic policy and financial regulations could negatively impact efforts to deleverage and mitigate financial risks. In particular, relaxing the constraints on finance for local government financing vehicles undertaking public projects would risk pushing off-track notable recent efforts to implement the 2014 Budget Reform and place local government finance on a sustainable path.
Under current trends, China is poised to reach the 13th Five-year plan goal of eliminating extreme rural poverty by 2020. However, inequality is becoming a pressing issue. The rural/urban income gap has narrowed very little since 2014, and income inequality has stopped falling (official figures report an uptick in the Gini coefficient from 0.462 to 0.465 between 2015 and 2016). Inclusive growth, further easing of restrictions on migration, and better social protection can contribute to more equality.
117
NAVIGATING UNCERTAINTY
PART III. COUnTRY SUMMARIES AnD KEY InDICATORS: CHInA

Figure 1. Real GDP growth and contributions to real GDP growth
Figure 2. Poverty estimates and projections
Percent, percentage points Percent
8
7
6
5
4
3
2
1
-1
0
2012 2013 2014 2015 2016 2017 2018f 2019f 2020f
30
25
20
15
10
5
0
2015 2016 2017 2018 2019 2020
J Private consumption J Government consumption J Gross capital formation ▬ Poverty line $1.90 a day ▬ Poverty line $3.20 a day
J Net exports J Statistical discrepancy ▬ GDP ▬ Poverty line $5.5 a day
Sources: National Bureau of Statistics; World Bank staff estimates. Sources: World Bank staff estimates using tabulated data from China NBS.
CHINA Selected Indicators 2015 2016 2017 2018e 2019f 2020f
Real GDP growth, at constant market prices 6.9 6.7 6.9 6.5 6.2 6.2Private Consumption 7.4 8.6 7.0 8.6 8.1 7.8Government Consumption 9.9 8.8 9.5 8.3 7.8 7.6Gross Fixed Capital Investment 7.0 6.8 4.3 5.5 5.3 5.2Exports, Goods and Services -1.5 1.8 8.9 3.8 3.5 3.3Imports, Goods and Services -1.3 5.7 6.6 6.4 5.8 5.2
Real GDP growth, at constant factor prices 6.9 6.7 6.9 6.5 6.2 6.2Agriculture 3.9 3.3 3.9 3.3 3.3 3.3Industry 6.2 6.3 6.1 5.9 5.5 5.4Services 8.2 7.7 8.0 7.6 7.3 7.2
Inflation (Consumer Price Index) 1.4 2.0 1.6 2.0 2.1 2.2Current Account Balance (% of GDP) 2.7 1.8 1.4 0.0 -0.2 -0.4
Net Foreign Direct Investment (% of GDP) 0.6 -0.4 0.5 0.8 1.0 1.1Fiscal Balance (% of GDP)a -2.7 -3.2 -3.7 -3.7 -3.4 -3.3Debt (% of GDP) 36.2 36.7 37.1 37.8 38.3 38.5Primary Balance (% of GDP) -1.8 -2.3 -2.4 -2.4 -2.0 -1.9International poverty rate ($1.9 in 2011 PPP)b 0.7 0.6 0.4 0.3 0.3 0.2Lower middle-income poverty rate ($3.2 in 2011 PPP)b 7.0 5.9 4.6 3.5 2.7 2.0Upper middle-income poverty rate ($5.5 in 2011 PPP)b 27.2 24.7 21.5 18.7 16.0 13.6
Source: World Bank, Poverty & Equity and Macroeconomics, Trade & Investment Global Practices.Notes: e = estimate, f = forecast. a) The adjusted fiscal balance adds up the public finance budget, the government fund budget, the state capital management fund budget and the social security fund budget. b) 2014 is actual based on group data provided by China NBS, 2015 onwards are projections using neutral distribution with pass through 0.72.
EAST ASIA AND PACIFIC ECONOMIC UPDATE OCTOBER 2018
118 PART III. COUnTRY SUMMARIES AnD KEY InDICATORS: CHInA
FIJI
2017Population, million 0.9GDP, current US$ billion 5.1GDP per capita, current US$ 5,586Life expectancy at birth, yearsa 70.3Sources: WDI, Macro Poverty Outlook, and official data.Notes: a. Most recent WDI value (2016).
Summary
Growth accelerated to 3.8 percent in 2017, underpinned by post-cyclone reconstruction, and recovery in the tourism and agricultural sectors. Despite the negative impact of Tropical Cyclones Keni and Josie that hit Fiji in April 2018, GDP growth is expected to reach 3.5 percent. Risks on the domestic front include further delays to fiscal consolidation as fiscal space is eroded by frequent disasters and rising expenditures; slowing down of the structural reform agenda; and uncertainty ahead of the expected general election.
Recent Developments
Boosted by the reconstruction post-cyclone Winston, increased tourist arrivals and the recovery of the agricultural sector, GDP growth rebounded in 2017, accelerating to 3.8 percent from 0.4 percent in 2016. The agricultural sector is the main source of livelihood for nearly half of Fijians, while its contribution to the economy remains low at around 10 percent. Tourism remains a critical industry
with combined direct and indirect contributions to GDP estimated at 30 percent.
Annual inflation slightly increased to 4.7 percent in July 2018 from 4.6 percent in June, reflecting higher prices for fuel, alcohol and tobacco. Fiji’s monetary policy has been accommodative and the RBF’s Overnight Policy Rate has remained unchanged at 0.5 percent since 2011. Domestic credit to the private sector tightened, growing 5.6 percent in July 2018, relative to 13 percent in 2017, which was caused by a slowdown in lending to businesses. The Fijian dollar has remained broadly stable against a basket of currencies of its main trading partners. According to the RBF, the REER appreciated in the year to July 2018 by 3.6 percent.
The fiscal deficit in FY2017/18 is estimated at 4.5 percent of GDP due to a rollover of capital expenditure, increases in the wage bill and social welfare. The deficit in FY2016/17 was 2.2 percent of GDP, which was much lower than the 7.3 percent of GDP projected because of delays in reconstruction due to bad weather, supply shortages, and the difficulty of delivering materials to maritime and remote areas. Government debt slightly increased to 47 percent of GDP, owing to additional borrowing for post-Winston reconstruction. In the lead-up to COP23, the government issued a Green Bond denominated in local currency with support and guidance from the World Bank and IFC.
The current account deficit widened to 5.7 percent of GDP in 2017 from 5.0 percent of GDP in 2016. The deficit reflected a large shortfall on the merchandise trade account as import demand for raw materials and capital equipment continued to be strong while reconstruction activities gathered pace. A large surplus in the services account (relating to tourism and transport) and continued strength in remittances partially offset the deficit in the goods account. The FDI inflows were more than sufficient to finance the deficit in recent years, thus leading to reserve accumulation. Foreign reserves reached US$2.2 billion at end-July, which is sufficient to cover 5 months of retained imports.
119
NAVIGATING UNCERTAINTY
PART III. COUnTRY SUMMARIES AnD KEY InDICATORS: FIJI

Outlook
Despite the negative impact by Tropical Cyclones Keni and Josie that hit Fiji in April 2018, GDP growth is expected to exceed 3 percent in 2018. Inflationary pressures remain following increases in excise taxes, public wages, and oil prices; nevertheless, the RBF projects that prices will stabilize and the end-year inflation will be around 3 percent.
The government’s budget for FY2018/19 indicates a continuation of expansionary expenditure policy on the back of a sizeable jump in projected revenue. The increase on the revenue front is expected to be contributed by tightening compliance and broadening the tax base while maintaining low tax rates. There is also a 50 percent increase in dividends from profit making SOEs, such as Fiji Airports, Energy Fiji and Fiji Ports Corporation. The expenditure front shows an across the board increase in the budget, which precedes the general election that is expected to be called within the next few months. The government’s planned deficit is 3.5 percent of GDP, although this includes the budgeted receipts from the sale of government assets of about 3.4 percent. Over the medium term, the government is planning to reduce the deficit gradually to 3.0 percent in FY2019/20 and 2.5 percent of GDP in FY2020/21. This gradual decline is expected to be achieved through a combination of the normalization of capital spending, continued effort in revenue mobilization, and greater control of recurrent spending. The ratio of public debt to GDP is projected to rise to 48.5 percent of GDP in FY2019/20.
The current account deficit is projected to decline to 5 percent of GDP in 2018 and to 4.4 percent of GDP in 2019. This follows the expected ease in import demand for reconstruction combined with a widening surplus in the services account as Fiji's tourism sector expands and transport services benefit from its position as a transport hub for the Pacific. According to the IMF, non-debt creating capital flows will continue providing coverage for the deficit.
Risks and Challenges
Potential upside risks include lower-than-expected import commodity prices and stronger-than-expected tourism. Downside risks include another natural disaster and a sharp slowdown in China, which could hit Fiji’s main export and tourism source markets such as Australia, New Zealand, and Japan. Risks on the domestic front include further delays to fiscal consolidation, slowing down of the structural reform agenda, and uncertainty ahead of the general election.
Fiji is exposed to frequent natural disasters, causing an average loss of 2-5 percent of GDP. The disasters and rising expenditures have eroded Fiji’s fiscal space in the last five years. Therefore, it is important for the government to start rebuilding fiscal space to respond to future shocks. While continuing to pursue ambitious social and investment programs, the government’s focus has been greater revenue mobilization, improved management of public debt, greater accountability through internal audit, and more frequent and comprehensive public financial reporting. Going forward, expenditure measures, such as rationalizing capital expenditure while protecting essential public investment and not increasing current expenditure in real terms, are needed to achieve the government’s medium-term fiscal targets. The structural reform agenda includes building climate resilience and creating a more supportive environment for private-sector-led growth. Attracting more FDI and expanding the role of the private sector in the economy will require modernizing the legal and regulatory framework.
EAST ASIA AND PACIFIC ECONOMIC UPDATE OCTOBER 2018
120 PART III. COUnTRY SUMMARIES AnD KEY InDICATORS: FIJI
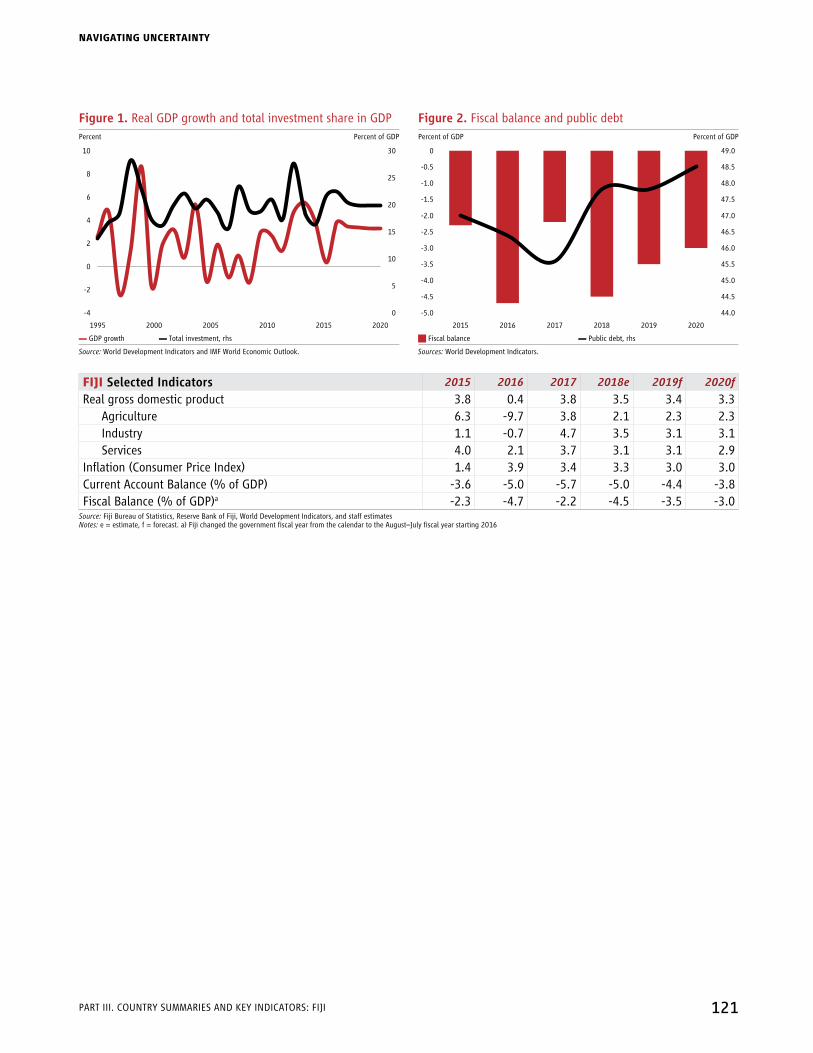
Figure 1. Real GDP growth and total investment share in GDP Figure 2. Fiscal balance and public debtPercent Percent of GDP Percent of GDP Percent of GDP
10 30
825
620
4
15
2
10
-4 0
0
5-2
20202010 20152000 20051995
0 49.0
-0.5 48.5
-1.0 48.0
-1.5 47.5
-2.0 47.0
-2.5 46.5
-3.0 46.0
-3.5 45.5
-4.0 45.0
-4.5 44.5
-5.0 44.0
2015 2016 2017 2018 2019 2020
▬ GDP growth ▬ Total investment, rhs J Fiscal balance ▬ Public debt, rhs
Source: World Development Indicators and IMF World Economic Outlook. Sources: World Development Indicators.
FIJI Selected Indicators 2015 2016 2017 2018e 2019f 2020f
Real gross domestic product 3.8 0.4 3.8 3.5 3.4 3.3Agriculture 6.3 -9.7 3.8 2.1 2.3 2.3Industry 1.1 -0.7 4.7 3.5 3.1 3.1Services 4.0 2.1 3.7 3.1 3.1 2.9
Inflation (Consumer Price Index) 1.4 3.9 3.4 3.3 3.0 3.0Current Account Balance (% of GDP) -3.6 -5.0 -5.7 -5.0 -4.4 -3.8Fiscal Balance (% of GDP)a -2.3 -4.7 -2.2 -4.5 -3.5 -3.0
Source: Fiji Bureau of Statistics, Reserve Bank of Fiji, World Development Indicators, and staff estimatesNotes: e = estimate, f = forecast. a) Fiji changed the government fiscal year from the calendar to the August–July fiscal year starting 2016
121
NAVIGATING UNCERTAINTY
PART III. COUnTRY SUMMARIES AnD KEY InDICATORS: FIJI

INDONESIA
2017Population, million 264.0GDP, current US$ billion 1,015.5GDP per capita, current US$ 3,847International poverty rate ($1.9)a 5.7Lower middle-income poverty rate ($3.2)a 27.3Upper middle-income poverty rate ($5.5)a 58.9Gini indexa 37.9School enrolment, primary (% gross)b 103.5Life expectancy at birth, yearsb 69.2Sources: WDI, Macro Poverty Outlook, and official data.Notes: a. Most recent value (2017), 2011 PPPs. b. Most recent WDI value (2016).
Summary
Despite higher global uncertainty, real GDP growth saw a boost in Q2, arising from stronger private consumption. Domestic credit growth strengthened, despite higher policy rates prompted by the ongoing U.S. monetary normalization and contagion from volatility in other large emerging markets, which have led to portfolio outflows and currency pressures. With robust fundamentals, the outlook is moderately positive on stronger domestic demand being projected over the forecasting horizon. However, downside risks are substantially larger.
Recent Developments
Real GDP growth rose to a four-year high of 5.3 percent in Q2 as Islamic festivities and low base effects boosted private consumption growth (Figure 1). Government
consumption growth was also higher, nearly doubling from Q1 on stronger personnel spending. Meanwhile, despite sustained strength in machinery and equipment investment, growth of gross fixed capital formation fell because of slower construction growth, partly due to fewer working days in this year’s Q2. Growth of both exports and imports increased over the quarter, but as import volumes grew nearly twice as fast as exports, net exports weighed on overall economic growth. As investors continued to exit emerging markets, including Indonesia, amid heightened global financial volatility, the Indonesian 10-year bond yield rose by 121 basis points in Q2, reaching 8.2 percent, the highest since the end of 2016. While the Rupiah depreciated 4.8 percent against the U.S. dollar, other emerging market currencies eased further, leading to a real effective appreciation of the currency in Q2. Despite inflation remaining well-contained and within its target, Bank Indonesia raised the policy rate by a cumulative 100 basis points to signal its commitment to stability. Credit growth picked up, as lending interest rates eased over the quarter, despite higher policy rates. With rising crude oil prices and persistent growth in equipment investment, total nominal imports grew nearly twice as fast as exports, leading to the current account deficit widening to an average of 2.3 percent of GDP in the four quarters through Q2, from the 1.7 percent deficit recorded for the whole of 2017. net capital inflows increased over the quarter mainly due to a reversal of portfolio outflows, and larger other investment. Fiscal revenues were robust, growing the fastest in 10 years, partly owing to higher commodity prices and partly to reform impact, as higher and streamlined tobacco excises and improved compliance contributed to higher non-resource revenue. Mainly because of higher subsidy spending (including of arrears from previous years), total government expenditures grew almost twice as fast as H1 2017. However, capital spending continued to contract, partly due to delays in the land procurement for some infrastructure projects. With revenues growing more than two times that of expenditures, fiscal consolidation was sustained, easing financing needs, even though this being an election year. Reaching single digits for the first time, the official poverty rate based on the national poverty line was 9.8 percent in
EAST ASIA AND PACIFIC ECONOMIC UPDATE OCTOBER 2018
122 PART III. COUnTRY SUMMARIES AnD KEY InDICATORS: InDOnESIA

March 2018, down from the 10.6 percent in March 2017, the largest reduction in poverty since March 2011. The decline was in part due to the expansion of social assistance programs such as the Family Hope Program (PKH), which helped lower chronic poverty and reduced vulnerability. The decrease in poverty was also due to buoyant labor market conditions with the employment rate reaching a two-decade high of 65.7 percent in February, matched by the unemployment rate falling to an 18-year low of 5.1 percent.
Outlook
Despite a more volatile and uncertain global environment, the growth outlook for the Indonesian economy remains moderately positive with stronger domestic demand being projected over the forecasting horizon. However, downside risks have increased. Economic growth is forecast to reach 5.2 percent this year and in 2019, gradually strengthening to 5.3 percent in 2020. Private consumption is expected to improve in light of the presidential elections next year, continued low inflation, strong labor market conditions and recovering credit growth. Similarly, due to the expansion of fiscal space associated with ongoing revenue reform, government consumption is projected to strengthen. Investment growth is expected to remain robust, especially after the presidential elections with reduced political uncertainty. In line with stronger projected economic growth and muted inflation, the extreme poverty rate in 2018 based on the international poverty line (US$1.90 per day in 2011 PPP terms) is expected to fall to 4.9 percent, 0.8 percentage point lower than in 2017. Given the expected pickup in growth, the extreme poverty rate is projected to decline further by 0.7 percentage points in 2019 and 0.6 percentage points in 2020 (Figure 2). And the poverty rate based on the lower middle-income class poverty line (US$3.2 per day in 2011 PPP terms) is expected to decline from 27.3 percent in 2017 to 25.4 percent in 2018 and 21.9 percent in 2020. These projected reductions are slower than the annual declines in poverty during 2006-10, when the extreme poverty rate fell by an average of 2.9 percentage points per year, in
part because of the higher growth rate of 6.1 percent per annum observed over the earlier period.
Risks and Challenges
Risks to Indonesia’s growth outlook are strongly tilted to the downside amid heightened global uncertainty. The ongoing normalization of U.S. monetary policy, along with volatility associated with Argentina and Turkey, are leading investors to exit emerging markets, including Indonesia, as an asset class. As a consequence, the Rupiah has been depreciating and bond yields rising. While a cheaper currency would help contain income outflows, which are the largest component of the current account deficit, it may also dampen consumer confidence and increase inflation, leading to slower consumption growth. Higher bond yields would lead to higher financing costs for corporates, which could dampen the nascent credit recovery and hence private investment. Escalating protectionism also poses a strong risk to Indonesia either through slower growth of the export sector or negative spillovers from slower regional growth—in part through weaker commodity prices. While consistently declining from 2013, the proportion of Indonesians who are non-poor, but who are vulnerable, defined as those who have at least a 10 percent chance of falling back into poverty in the following year, remained high. Nearly a quarter of the population were classified as vulnerable in March 2016. This implies that in times of economic shocks, the poverty rate could rise substantially if the vulnerable do not have adequate social protection. Therefore, it is important that social assistance programs not only target the poor, but the vulnerable as well, when focusing on poverty alleviation.
123
NAVIGATING UNCERTAINTY
PART III. COUnTRY SUMMARIES AnD KEY InDICATORS: InDOnESIA

Figure 1. Real GDP growth and contribution to growth Figure 2. Poverty rate, actual and projectedPercent, percentage points Percent
8
6
4
2
-4
0
-2
Dec-15
Mar-16
Dec-17
Mar-18
Jun-15
Sep-15
Jun-16
Sep-16
Jun-18
Dec-16
Mar-17
Jun-17
Sep-17
100
80
60
40
0
20
2013 2015 2017 2019201120092007200520032001
J Private consumption J Government consumption J Investment J Net exports ▬ PPP US$1.90 poverty rate ▬ PPP US$3.20 poverty rate
J Change in stocks J Statistical discrepancy* ▬ GDP ▬ PPP US$5.50 poverty rate
Sources: National Statistics Agency (BPS); World Bank staff calculations. Sources: National Statistics Agency (BPS); World Bank staff calculations.
INDONESIA Selected Indicators 2015 2016 2017 2018e 2019f 2020f
Real GDP growth, at constant market prices 4.9 5.0 5.1 5.2 5.2 5.3Private Consumption 4.8 5.0 5.0 5.1 5.1 5.2Government Consumption 5.3 -0.1 2.1 4.0 4.5 4.5Gross Fixed Capital Investment 5.0 4.5 6.2 6.8 6.8 6.6Exports, Goods and Services -2.1 -1.6 9.1 6.5 6.8 7.0Imports, Goods and Services -6.2 -2.4 8.1 9.5 8.7 8.5
Real GDP growth, at constant factor prices 4.2 4.6 4.8 5.2 5.2 5.3Agriculture 3.8 3.4 3.8 3.9 3.5 3.5Industry 3.0 3.8 4.1 4.0 4.2 4.3Services 5.5 5.7 5.7 6.7 6.7 6.6
Inflation (Consumer Price Index) 6.4 3.5 3.8 3.4 3.7 3.7Current Account Balance (% of GDP) -2.0 -1.8 -1.7 -2.4 -2.3 -2.4
Net Foreign Direct Investment (% of GDP) 1.2 1.7 1.9 1.9 2.1 2.3Fiscal Balance (% of GDP) -2.6 -2.5 -2.5 -2.1 -1.8 -2.0Debt (% of GDP) 27.0 27.9 29.4 28.8 28.9 29.0Primary Balance (% of GDP) -1.2 -1.0 -0.9 -0.3 0.0 -0.1International poverty rate ($1.9 in 2011 PPP)a,b 7.2 6.5 5.7 4.9 4.2 3.6Lower middle-income poverty rate ($3.2 in 2011 PPP)a,b 33.3 31.1 27.3 25.4 23.6 21.9Upper middle-income poverty rate ($5.5 in 2011 PPP)a,b 67.4 62.8 58.9 57.4 56.0 54.6
Source: World Bank, Poverty & Equity and Macroeconomics, Trade & Investment Global Practices.Notes: e = estimate, f = forecast. a) Calculations based on EAPPOV harmonization, using 2010-SUSEnAS, 2016-SUSEnAS, and 2017-SUSEnAS. Actual data: 2017. nowcast: 2018. Forecast are from 2019 to 2020. b) Projection using annualized elasticity (2010–2015) with pass-through = 1 based on GDP per capita in constant LCU.
EAST ASIA AND PACIFIC ECONOMIC UPDATE OCTOBER 2018
124 PART III. COUnTRY SUMMARIES AnD KEY InDICATORS: InDOnESIA

LAO PDR
2017Population, million 6.9GDP, current US$ billion 17.0GDP per capita, current US$ 2,477International poverty rate ($1.9)a 22.7Lower middle-income poverty rate ($3.2)a 58.7Upper middle-income poverty rate ($5.5)a 85.0Gini indexa 36.4School enrolment, primary (% gross)b 110.5Life expectancy at birth, yearsb 66.7Source: WDI, Macro Poverty Outlook, and official data.Notes: a. Most recent value (2012), 2011 PPPs. b. Most recent WDI value (2016)
Summary
The Lao PDR economy continues to be characterized by robust growth amidst rising vulnerabilities. Although growth is expected to be supported by strong infrastructure investment and export performance, the outlook is subject to increasing risks arising from the impact of floods and slippages in on-going reforms.
Recent Developments
Despite a slight deceleration, economic growth in 2018 is expected to remain robust at 6.7 percent. Growth in the first half of 2018 is driven primarily by buoyant growth in the power, construction and manufacturing (electronic parts) sectors. In contrast, despite higher metal prices in the first half of 2018, output in the mining sector declined. Similarly, output in the agriculture sector was adversely
affected by flooding across the country. notwithstanding the gradual pickup in tourism and a buoyant real estate market in the first half of 2018, growth in the service sector is expected to remain flat owing to the slowdown in the financial sector and moderate growth in the retail sector. The latter is primarily due to the continued slowdown in credit and public sector wage growth.
There is evidence of increasing job creation which is expected to increase the average household income level. According to the Labor Force Survey 2017, wage jobs are estimated to have gradually increased since 2010. This has resulted in 28 percent of households, which are situated in mostly urban areas, reporting an increase in income. As a result, possession of consumption goods among the better off households increased faster than in poorer, mainly rural, households. Therefore, while poverty is still expected to decline modestly, inequality is expected to have increased.
The Government intends to remain on the path of fiscal consolidation with the deficit expected to decrease to below 5 percent in 2018 from 5.3 percent the previous year. Preliminary information indicates that revenue collection in the first half of 2018 performed better (6.8 percent of GDP), compared to the same period last year (6.5 percent of GDP). This was mainly driven by higher excise revenues arising from higher oil prices, and supported by an increase in dividend earnings together with income and land tax receipts. Tighter control of the wage bill and a downward adjustments in non-wage current spending resulted in current spending declining to 5.4 percent of GDP in the first half, from 5.6 percent over the same period last year. This is partly offset by an increase in capital spending due to less-concessional loan-financed investment, higher interest payments and a settling of previous years’ arrears. Fiscal consolidation is expected to slow down the accumulation of public debt this year, though not enough to reverse the rising debt/GDP ratio.
Monetary conditions have slightly loosened since 2017. The Bank of Lao PDR (BoL) cut the policy rate in late 2017
125
NAVIGATING UNCERTAINTY
PART III. COUnTRY SUMMARIES AnD KEY InDICATORS: LAO PDR

and introduced interest rate caps. However, credit growth continued to slow as commercial banks tighten both foreign and domestic currency lending. The former is partly due to a directive issued by BOL on limiting foreign currency lending to specific sectors, while the latter is partly due to commercial banks’ risk appetite waning coupled with a slowdown in demand for Kip credit.
Underpinned by faster growth in resource exports, the overall trade deficit declined in the first half of 2018, despite the increase in the oil price. The increase in export earnings was driven by the key exports - electricity and minerals. The latter was due to higher commodity prices. Agricultural exports were adversely affected by lower prices for some agriculture commodities and the impact of floods. The current account is expected to remain in deficit and will mostly be financed by FDI inflows and external borrowing, with the balance covered by foreign exchange reserves. The latter has contributed to the decline in reserves over the first half of 2018 to below US$ 1 billion in June or less than three months of non-resource imports.
Increasing pressure on the local currency has led to an upward shift in the exchange rate band, resulting in a depreciation of the exchange rate in the first half of 2018. The pressure on the Kip emanates from both domestic and external factors. Namely, the restrictions placed by the central bank on the purchase of foreign currency at commercial banks has contributed to a widening of the gap between the official and parallel market exchange rates. While external pressure from a general strengthening of the US dollar against emerging market economies has also contributed to downward pressure on the Kip.
The depreciation of the Kip against the Thai baht and the US dollar, along with rising fuel and food prices are the main drivers of the upward trend in inflation for the first half of 2018. Headline inflation increased to 2.4 percent by June 2018, with fuel and fresh food prices rising by 22 percent and 1.2 percent, respectively. Core inflation rose by almost 3 percent reflecting higher prices in the apparel and hospitality sectors.
Outlook
In the near-term, growth is expected to remain robust. In 2019–2020, large hydropower projects, which are expected to begin commercial operation, and continued infrastructure investment, is expected to spur growth. Further, it is expected that the recently passed Public Debt Management Law will support a more measured public borrowing strategy.
Risks and Challenges
In the near-term, the risks continue to be weighted on the downside. Notwithstanding the efforts undertaken by government to continue to consolidate the fiscal position, the fiscal deficit and public debt is at the risk of remaining elevated owing to limited domestic revenue mobilization coupled with increased expenditure on infrastructure projects, rising payments on debt service and disaster relief efforts owing to weather-related shocks. Additionally, the key downside risks to growth include the delay in commencing operation of Xepian Xenamnoi dam and its implications for the commencement of other pipeline energy projects. The risk of prolonged flooding may also dent growth in the agriculture sector.
There are three salient challenges to achieving inclusive and sustainable growth, which is necessary to reduce poverty and inequality. These are: (i) government’s ability to continue to exercise fiscal prudence to contain rising public debt, particularly if the currency continues to depreciate more sharply and/or global interest rates increase; (ii) improving the business environment and private sector productivity; and (iii) mitigating the adverse impact of weather-related shocks.
EAST ASIA AND PACIFIC ECONOMIC UPDATE OCTOBER 2018
126 PART III. COUnTRY SUMMARIES AnD KEY InDICATORS: LAO PDR

Figure 1. Real GDP growth, contribution to real growth Figure 2. Actual and projected poverty ratesPercent Poverty rate, percent GDP per capita, constant million Kip
10
8
6
4
2
-2
0
2013 2014 2015 2016 2017 2018 2019 2020
90 25
20
80
15
70
10
60
5
50
40
30
20
10
0 0
2017 2018 2019 202020162015201420132012
J Private consumption J Government consumption J Gross fixed investment ▬ $1.9/day PPP ▬ $3.2/day PPP
J Net export ▬ GDP ▬ $5.5/day PPP ▬ GDP per capita, rhs
Source: Staff estimate based on national statistics. Source: World Bank.Notes: See Table 2.
LAO PDR Selected Indicators 2015 2016 2017 2018e 2019f 2020f
Real GDP growth, at constant market prices 7.3 7.0 6.9 6.7 6.9 6.9Private Consumption 4.5 4.5 4.3 4.3 4.4 4.4Government Consumption 4.5 7.7 6.6 2.8 2.9 3.6Gross Fixed Capital Investment 9.6 3.2 3.6 10.0 9.0 5.5Exports, Goods and Services 6.7 10.5 11.0 8.1 9.0 9.3Imports, Goods and Services 4.0 4.6 5.0 5.7 5.8 4.4
Real GDP growth, at constant factor prices 6.8 6.9 6.9 6.7 6.9 6.9Agriculture 3.6 2.8 2.9 2.4 2.9 2.9Industry 7.0 12.0 11.0 10.0 9.8 10.0Services 8.0 4.7 5.0 5.4 5.7 5.4
Inflation (Consumer Price Index) 1.3 1.6 0.8 3.0 3.0 3.0Current Account Balance (% of GDP) -20.0 -12.9 -11.6 -11.5 -12.0 -11.0Fiscal Balance (% of GDP) -3.3 -4.2 -5.3 -4.9 -4.5 -4.0Debt (% of GDP) 57.3 58.2 61.0 62.4 63.1 63.2Primary Balance (% of GDP) -2.3 -3.2 -3.9 -3.3 -2.8 -2.1International poverty rate ($1.9 in 2011 PPP)a,b 20.6 20.0 19.4 19.0 18.5 18.0Lower middle-income poverty rate ($3.2 in 2011 PPP)a,b 55.0 54.0 53.1 52.3 51.4 50.5Upper middle-income poverty rate ($5.5 in 2011 PPP)a,b 83.2 82.7 82.2 81.8 81.3 80.8
Source: World Bank, Poverty & Equity and Macroeconomics, Trade & Investment Global Practices.Notes: e = estimate, f = forecast. Estimate and forecast based on information available as of end August 2018. a) Calculations based on EAPPOV harmonization, using 2007-LECS and 2012-LECS. Actual data: 2012. nowcast: 2013–2018. Forecast are from 2019 to 2020. b) Projection using annualized elasticity (2007–2012) with pass-through = 1 based on GDP per capita in constant LCU.
127
NAVIGATING UNCERTAINTY
PART III. COUnTRY SUMMARIES AnD KEY InDICATORS: LAO PDR

MALAYSIA
2017Population, million 31.6GDP, current US$ billion 314.5GDP per capita, current US$ 9,945International poverty rate ($1.9)a 0.0Lower middle-income poverty rate ($3.2)a 0.2Upper middle-income poverty rate ($5.5)a 2.7Gini indexa 41.0School enrolment, primary (% gross)b 103.5Life expectancy at birth, yearsb 75.3Source: WDI, Macro Poverty Outlook, and official data.Notes: a. Most recent value (2015), 2011 PPPs. b. Most recent WDI value (2016).
Summary
Malaysia’s economic growth moderated in the first half of 2018. Growth continued to be supported by strong private consumption. While poverty rates are low, the rising cost of living, especially food and housing, remains a challenge for low- and even middle-income households and was a key point of contention leading up to the May 2018 general election. Going forward, the economy is forecast to expand by 4.9 percent in 2018, with lower public spending expected to impinge on growth.
Recent Developments
Malaysia’s GDP growth moderated in the first half of 2018, growing at 5.4 and 4.5 percent in the first and second quarters of the year, respectively. Private consumption continued to be the main driver of growth, underpinned by
stable labor market conditions and continued household income growth. In addition, private consumption was supported by strong spending in the second quarter, boosted by the zero-rating of the Goods and Services Tax (GST) effective June 1, 2018. Private investment provided additional support to growth, led by continued capital spending in the manufacturing and services sectors. Nevertheless, growth was weighed down by lower public expenditure. Public sector investment contracted following reductions in capital outlays by public corporations and general government, with several infrastructure projects nearing completion and a more circumspect approach towards new infrastructure projects. Meanwhile, public consumption grew at a slower pace on lower spending on supplies and services. Gross exports expanded moderately in the first half of 2018, following an exceptionally strong 2017. Growth in exports continued to be underpinned by the robust performance in manufactured exports, particularly Electrical and Electronic (E&E) products. Gross imports moderated on account of a contraction in both intermediate and capital imports. Labor market conditions remained stable throughout the first half of 2018. The labor force participation rate was marginally higher at 68.4 percent in Q2 2018, while the unemployment rate remained low at 3.3 percent. Manufacturing wages grew strongly at 10.1 percent in Q2 2018, significantly outpacing wage growth in the services sector, which was 3.7 percent over the same period. Although only 2.7 percent of Malaysians live below the World Bank’s upper-middle income country poverty line, the rising cost of living, especially food and housing, remains a challenge for lower-income households. The 20 percent of Malaysian households with incomes less than RM 3,000 per month allocate nearly 40 percent of the household budget to food and non-alcoholic beverages. Cost of living pressures are especially pronounced in urban areas, where food and housing prices have been rising faster than those in rural areas. Concerns about the cost of living and the quality of growth featured prominently in the May 2018 general election. In response to its election mandate to lower living costs, the new government introduced several fiscal policy changes, namely zero-rating the GST and replacing it with the previous Sales and Services Tax (SST), with a three-
EAST ASIA AND PACIFIC ECONOMIC UPDATE OCTOBER 2018
128 PART III. COUnTRY SUMMARIES AnD KEY InDICATORS: MALAYSIA

month tax holiday in the interim. The government also reintroduced fuel subsidies on domestic RON95 gasoline and diesel.
Headline inflation continued to moderate to 1.4 percent in the first half of 2018, aided by the zero-rating of the GST. Nevertheless, the impact from GST’s zero-rating was partially offset by higher transportation inflation, driven mainly by base effects.
Domestic financial markets experienced higher volatility during the period, as investors’ sentiment was initially affected by the electoral transition, and latterly the turmoil in several emerging markets, as well as continuing global trade tensions. In Q2 2018, the ringgit depreciated by 4.4 percent against the US dollar, while the equity market declined by 9.2 percent.
Outlook
Malaysia’s economic growth is expected to moderate in the near term, growing at 4.9 percent in 2018, underpinned by continued strong growth in private consumption. The stronger outlook for household spending primarily reflects the three-month tax holiday following the zero-rating of the GST, and one-off payouts to civil servants and pensioners. Gross fixed capital formation is expected to expand modestly, with lower public capital expenditure than previously projected, dampening growth prospects. The external sector will continue to benefit from the rebound in global investment and manufacturing activity, although this cycle is beginning to mature. Achieving the fiscal deficit target of 2.8 percent of GDP is subject to the economy growing above 5 percent; otherwise, the government may elect to run a slightly larger fiscal deficit. Higher subsidy expenditures and the revenue shortfall from the removal of GST are expected to be counterbalanced by higher oil-related revenues, as well as reduced outlays for non-priority current expenditure and deferment of capital expenditures.
The poverty rate in Malaysia is expected to continue to decline. Using the World Bank’s upper-middle income poverty line of $5.50/day (2011 PPP), the poverty headcount ratio is projected to decline to 1.2 percent by 2020. A newly introduced Cost of Living Aid (Bantuan Sara Hidup Rakyat) cash transfer program is being reviewed with the goal of providing more effective social welfare assistance to targeted lower-income households. Malaysia’s economy is projected to expand at 4.7 percent in 2019 and 4.6 percent in 2020, and the country is expected to achieve high-income country status at some point between 2020 and 2024.
Risks and Challenges
As a highly open economy, Malaysia will continue to face substantial risks relating to uncertainty in the external environment. Heightened financial market volatility either triggered by shifting monetary policy expectations in advanced economies or crisis in other regions could spread across emerging economies including Malaysia, through capital outflows and pressures on exchange rates. Another key risk relates to the escalation in protectionist tendencies and trade tensions in some major economies which could have an adverse impact on Malaysia, given its high level of integration with global markets and its dependence on global value chains as a source of growth. On the domestic front, implementation of several election pledges will require careful management of potential risks. The change from GST back to SST and the adjustment to the fuel pricing mechanism—in the absence of adequate compensatory measures—would constrain the fiscal policy space, and place greater reliance on less stable direct taxation and oil-related revenue. In addition, the reassessment of several planned large infrastructure projects increases uncertainty on the outlook for investment, and subsequently growth. Other notable risks include the relatively high public-sector debt due to the continued accumulation of fiscal deficits, and fiscal commitments from public-private partnerships. Addressing the stock of public-sector debt will require careful tradeoffs, including expenditure consolidation and a review of new sources of revenue.
129
NAVIGATING UNCERTAINTY
PART III. COUnTRY SUMMARIES AnD KEY InDICATORS: MALAYSIA

Figure 1. Real GDP growth, contribution to real growth Figure 2. Growth incidence curvesPercent, percentage point contribution Percent
10
8
6
4
2
-4
0
-2
Q4-13
Q2-14
Q4-14
Q4-15
Q4-16
Q4-17
Q2-15
Q2-16
Q2-17
Q2-18
16
14
12
10
8
6
4
2
0
0 10 20 30 40 50 60 70 80 90 100
J Private consumption J Fixed investment J Government consumption Percentile of real household income per capita
J Net exports J Change in inventory ▬ Real GDP growth ▬ 2008–2011 ▬ 2011–2013 ▬ 2013–2015
Sources: Department of Statistics Malaysia and World Bank staff calculations. Sources: Department of Statistics Malaysia.
MALAYSIA Selected Indicators 2015 2016 2017 2018e 2019f 2020f
Real GDP growth, at constant market prices 5.1 4.2 5.9 4.9 4.7 4.6Private Consumption 6.0 6.0 7.0 7.2 6.4 6.2Government Consumption 4.4 0.9 5.4 1.4 0.7 0.4Gross Fixed Capital Investment 3.6 2.7 6.2 2.1 2.2 2.2Exports, Goods and Services 0.3 1.1 9.6 3.7 3.7 3.6Imports, Goods and Services 0.8 1.1 11.0 3.4 3.2 3.1
Real GDP growth, at constant factor prices 4.9 4.2 5.8 4.9 4.7 4.6Agriculture 1.3 -5.1 7.2 0.5 2.0 2.1Industry 5.4 4.2 4.9 4.2 4.2 4.0Services 5.1 5.6 6.2 5.9 5.4 5.3
Inflation (Consumer Price Index) 2.1 2.1 3.7 1.2 1.6 2.1Current Account Balance (% of GDP) 3.0 2.4 3.0 2.9 2.8 2.8Fiscal Balance (% of GDP) -3.2 -3.1 -3.0 -2.9 -2.8 -2.5Debt (% of GDP) 54.5 52.7 50.8 49.9 48.9 47.5Primary Balance (% of GDP) -1.1 -1.0 -0.8 -0.9 -0.7 -0.6International poverty rate ($1.9 in 2011 PPP)a,b 0.0 0.0 0.0 0.0 0.0 0.0Lower middle-income poverty rate ($3.2 in 2011 PPP)a,b 0.2 0.2 0.2 0.1 0.1 0.1Upper middle-income poverty rate ($5.5 in 2011 PPP)a,b 2.7 2.3 1.9 1.6 1.4 1.2
Source: World Bank, Poverty & Equity and Macroeconomics, Trade & Investment Global Practices.Notes: e = estimate, f = forecast. a) Calculations based on EAPPOV harmonization, using 2011-HIS and 2015-HIS. Actual data: 2015. nowcast: 2016–2018. Forecast are from 2019 to 2020. b) Projection using point-to-point elasticity (2011–2015) with pass-through = 1 based on private consumption per capita in constant LCU.
EAST ASIA AND PACIFIC ECONOMIC UPDATE OCTOBER 2018
130 PART III. COUnTRY SUMMARIES AnD KEY InDICATORS: MALAYSIA

MONGOLIA
2017Population, million 3.1GDP, current US$ billion 11.9GDP per capita, current US$ 3,867national Official Poverty Ratea 29.6Gini indexa 32.0School enrolment, primary (% gross)a 104.2Life expectancy at birth, yearsa 69.3Source: WDI, Macro Poverty Outlook, and official data.Notes: a. national Statistics Office. Most recent value (2016). b. Most recent WDI value (2016).
Summary
Mongolia’s real GDP grew by 6.3 percent (y/y) in 2018 H1, supported by robust mineral exports, strong foreign direct investments, and improved business sentiments. The growth outlook remains positive in 2018 and beyond, buoyed by robust growth in private consumption and private investment in mining and manufacturing. Improvement in household incomes and the positive outlook augur well for poverty reduction after the 2016 increase. Risks to the outlook include political uncertainty, commodity shocks, border bottlenecks, and poor handling of money laundering issues.
Recent Developments
The growth momentum has continued in 2018 H1 as real GDP expanded by 6.3 percent from 5.2 percent in 2017 and 1.4 percent in 2016. Despite cross-border bottlenecks with China and weather-related shocks
(including heavy flooding during the summer), growth exceeded expectations in 2018 H1, largely supported by a revived coal sector, and strong private investment mainly in mineral and trade sectors. Improved market sentiments following successful implementation of government’s economic recovery plan also contributed to this positive performance. Positive developments in the labor market resulted in a strong recovery of private consumption in 2018 H1, which grew by 5.7 percent (y/y) from 0.5 percent in 2017. Unemployment rate in 2018 Q2 declined by over 2 percentage points from 9.6 percent in the same period last year. Although inflation remained below the central bank rate of 8 percent, it accelerated to 7.7 percent in July 2018 with rising prices of meat, vegetables (both affected by a harsh winter and heavy flooding during summer), fuel, and the effects of excise tax levied on vehicles. Real average household income, which contracted in 2016, increased by 6 percent in 2018 H1. As a result, the poverty rate is expected to fall in 2018.
The fiscal stance has continued to improve significantly, with a surplus of 2.8 percent of GDP in 2018 H1 from a deficit 0.8 percent of GDP in 2017 H1. This is explained by a better than expected revenue performance from coal and copper exports, and a commitment to spending control (e.g., reduction in interest payments, streamlining wage bill through hiring freeze, and rationalization of underperforming capital spending). Substantial improvement in fiscal balance ultimately led to a reduction in government debt in 2018 H1. In addition, government successfully repaid the first payment of US$500 million for the US$1.5 billion Chinggis Bond in January and US$160 million Dim Sum Bond in June. Despite positive terms of trade, current account balance slightly deteriorated in 2018 H1 following a surge in the service account deficit. This was mainly explained by the rise in transportation activities following a robust trade performance. Total imports increased by 40 percent in July 2018, with a surge in capital goods imports. The slight deterioration in the current account was compensated by a rise in official sector support and strong FDI inflows. With the bond repayments, gross international reserves slightly fell to US$2.9 billion in June 2018 (4.9 months of imports)
131
NAVIGATING UNCERTAINTY
PART III. COUnTRY SUMMARIES AnD KEY InDICATORS: MOnGOLIA

from US$3.2 billion reached in May, its highest level since May 2013. Bank of Mongolia (BoM) has emphasized reserves accumulation rather than nominal exchange rate appreciation. However, due to rising inflation, the real effective exchange rate appreciated modestly by about 3 percent (y/y) in June 2018.
Outlook
Supported by strong domestic demand, FDI and relatively robust commodity exports, economic growth is projected to further improve to 5.9 percent in 2018 from 5.4 percent in 2017, and to accelerate to around 6.6 percent in 2019. Private investment supported by FDI and private sector credit will remain a key driver for growth in the medium-term, especially in mining, manufacturing, and transport services. Despite reduced depreciation pressure on exchange rate, inflation will likely rise although modestly putting at risk the BOM medium term target of 8 percent amid strong domestic demand and rising food and petrol prices. Private consumption is also projected to further improve over the medium term following improvement in labor market despite efforts by the central bank to cool off strong credit growth. Accordingly, BOM is likely to gradually tighten monetary policy to contain inflation and continue to build up reserves amid fast growing imports and bank credit.
Agriculture is projected to grow by nearly 4 percent over the medium term, but below its 2014–16 performance, due to the adverse effects of a harsh winter and flooding of last summer. Industry is projected to grow by about 8 percent in 2018–20, as substantial developments are expected in mining. Services sector growth would continue to be supported by strong linkages between mining and transport.
The unexpected revenue overperformance of 2017 supported by mineral receipts will continue in 2018, resulting in a decline in the fiscal deficit to 1.4 percent of GDP from 1.9 percent in 2017.
However, although the deficit for 2019–20 will be lower than planned in the original government fiscal adjustment program, it is projected to average 4 percent in 2019–20 as the revenue performance will be slightly offset by a moderate increase in expenditures (wage increase for civil servants and a rise in donor financed investment). Declining path of deficit will likely result in continued reduction on debt over the medium term. Accordingly, the country’s declining debt will gradually help addressing underlying vulnerabilities of the balance of payments. However, despite robust export growth, investment related imports in 2019–20 would rise and put additional pressure on the current account balance. Relatively stabilized exchange rate will continue as the disbursement of donors’ support and further FDI inflows materialize. Gross international reserves are expected to continue to improve.
Given the positive economic outlook, poverty rates are expected to decline starting from 2018.
Risks and Challenges
There are substantial domestic and external exogenous risks to the outlook. These risks include political uncertainty exacerbated by the 2020 election which could trigger a delay in the implementation of mega projects in the mining sector; commodity market volatility and weakening global demand; climate shocks; revived bottlenecks at the China border; and effects of poor handling of the deficiencies of the anti-money laundering regime.
Growing political uncertainty could induce a sudden relaxation of the government’s commitment to structural reforms.
Mongolia’s growth prospects could be adversely affected by the consequences of an escalating trade war and a potential reduction in global demand—mainly from China—for coal, copper and other commodities and the resultant decline in global commodity prices.
EAST ASIA AND PACIFIC ECONOMIC UPDATE OCTOBER 2018
132 PART III. COUnTRY SUMMARIES AnD KEY InDICATORS: MOnGOLIA

Figure 1. Real GDP growth, contribution to real growth Figure 2. Poverty rate (official poverty line): 2010–16Percent, percentage points Percent of total population
35
30
25
20
15
10
5
0
-5
-10
-15
-20
-25
Q1-13
Q1-14
Q1-15
Q1-16
Q1-17
Q3-13
Q3-14
Q3-15
Q3-16
Q3-17
Q1-18Q2-1
8
50
40
30
20
10
0
2012 2014 201620112010
J Gross capital formation J Net exports J Private consumption ▬ National average ▬ Urban ▬ Rural
J Government consumption ▬ GDP
Source: national Statistics Office of Mongolia (nSO). Source: national Statistics Office of Mongolia (nSO).
MONGOLIA Selected Indicators 2015 2016 2017 2018e 2019f 2020f
Real GDP growth, at constant market prices 4.0 1.4 5.4 5.9 6.6 6.3Private Consumption 8.1 -2.6 0.5 5.8 6.8 6.7Government Consumption 6.5 10.6 -2.7 -0.3 4.5 4.8Gross Fixed Capital Investment -30.5 0.5 35.8 14.4 29.4 9.4Exports, Goods and Services 0.1 13.8 13.6 6.8 3.1 1.8Imports, Goods and Services -11.4 12.7 24.8 8.5 10.0 2.9
Real GDP growth, at constant factor prices 4.0 1.5 5.5 5.9 6.6 6.3Agriculture 10.7 6.2 1.8 1.5 3.5 3.8Industry 9.9 -0.4 0.4 5.5 7.9 9.7Services -2.6 1.7 11.3 7.6 6.5 4.3
Inflation (Private Consumption Deflator) 1.1 0.8 7.2 8.2 8.3 8.1Current Account Balance (% of GDP) -4.9 -6.4 -10.6 -10.0 -10.8 -9.2
Net Foreign Direct Investment (% of GDP) 1.6 1.1 13.2 12.5 15.2 11.8Fiscal Balance (% of GDP) -8.5 -15.9 -1.9 -1.4 -4.6 -3.2Debt (% of GDP) 61.2 87.3 84.8 74.7 71.4 67.4Primary Balance (% of GDP) -5.4 -12.1 2.0 2.3 -1.9 -1.0
Source: World Bank, Poverty & Equity and Macroeconomics, Trade & Investment Global Practices.Notes: e = estimate; f = forecast.
Weather related shocks, resumption of non-trade barriers at the border with China, could also significantly affect Mongolia’s coal exports. Limited progress on addressing anti-money laundering deficiencies could potentially affect FDI inflows and the financial sector.
133
NAVIGATING UNCERTAINTY
PART III. COUnTRY SUMMARIES AnD KEY InDICATORS: MOnGOLIA

MYANMAR
2017Population, million 54.9GDP, current US$ billion 79.6GDP per capita, current US$ 1,451International poverty rate ($1.9)a 6.4Lower middle-income poverty rate ($3.2)a 29.8Upper middle-income poverty rate ($5.5)a 67.6Life expectancy at birth, yearsb 66.6Source: WDI, Macro Poverty Outlook, and official data.Notes: a. Most recent value (2015), 2011 PPPs. b. Most recent WDI value (2016).
Summary
Growth is expected to weaken to 6.2 percent in 2018/19, driven by seasonal flooding, rising production costs, and slowing FDI commitments. Macroeconomic vulnerabilities are rising, with inflation expected to accelerate to 8.5 percent (2018/19) and significant Kyat depreciation. The implementation of the Myanmar Sustainable Development Plan and investor-friendly laws are expected to support a gradual economic recovery. Downside risks remain elevated from global economic uncertainty and the aftermath of the Rakhine crisis.
Recent Developments
Myanmar is facing economic headwinds to growth and increasing inflationary pressures. Growth in the construction, manufacturing and transport sectors is likely to be adversely impacted by higher production costs on account of the steep depreciation of the Myanmar
Kyat, a 33 percent rise in the statutory minimum wage, and increase in global fuel prices. Seasonal flooding displaced 120,000 people by end July and affected local crop production and raised food prices. Inflation rose to 6.4 percent in June 2018 from 5.4 percent (YoY) in March 2018.
The recent steep depreciation of the Kyat reflects synchronous weakening of emerging market currencies as well as domestic weaknesses. The Kyat has depreciated in nominal terms by 13 percent since April, higher than most other currencies in the region. While trade and current account deficits continued to narrow in 2017/18 and in the first quarter of 2018/19, depreciation was driven by ongoing concerns about domestic fundamentals, economic uncertainty and a slowdown in foreign direct investment. Approved FDI declined to USD 394 million in the first quarter of 2018/19 compared to USD 1,960 million in the same period last year.
The Government of Myanmar’s policy response to rising economic vulnerabilities has stemmed further deterioration. In mid-August, the Central Bank of Myanmar (CBM) removed the trading bands in its de jure managed float exchange rate regime moving Myanmar to a de-facto floating exchange rate regime. The CBM expanded USD exchange auctions to respond to liquidity concerns. In August, the government approved the Myanmar Sustainable Development Plan (MSDP) to address structural and medium-term challenges to generating and sustaining growth.
Outlook
Myanmar’s growth is projected to decline to 6.2 percent in 2018/19, a downward revision of 0.5 percentage points from the previous forecast, due to the impact of seasonal floods, rising cost and inflationary pressures, and lingering impact of the Rakhine crisis. The current account is likely to worsen to 4.9 percent of GDP (2018/19) from 4.7 percent of GDP (2017/18) as inflation is expected to rise, eroding competitiveness. Inflation is forecast to pick
EAST ASIA AND PACIFIC ECONOMIC UPDATE OCTOBER 2018
134 PART III. COUnTRY SUMMARIES AnD KEY InDICATORS: MYAnMAR
up to 8.5 percent (2018/19) from 5.5 percent (2017/18) reflecting exchange rate passthrough, food price increases and rise in the statutory minimum wage.
Growth is expected to pick up gradually in the medium term to 6.8 percent in 2020/21 as several investment-friendly laws have been passed and are anticipated to be implemented. Policy measures to encourage investment, such as the implementation of the new Myanmar Companies Law, ongoing liberalization and possible opening of the insurance sector to foreign players, and opening of wholesale and retail markets to FDI, are likely to significantly boost manufacturing and retail services.
Inflationary pressures will remain elevated in the medium term, with inflation forecast at 8–8.5 percent in the medium term. The government is expected to take a more expansionary fiscal stance towards elections in October 2020, which might feed inflationary pressures due to recourse to central bank financing of the deficit.
The pace of poverty reduction is expected to remain modest. Strong growth translated to a reduction in poverty from 48 to 32 percent over 2005–2015, based on the national poverty line. Low-skill employment opportunities outside agriculture are expected to have resulted in further poverty declines since 2015, though likely at a progressively slower rate in 2016 and 2017 given the projected slowdown in growth of private consumption. Faster agricultural growth is needed to improve the welfare of the 13.8 million rural poor. The impact of floods on agricultural production is likely to harm poor and near-poor households who rely disproportionately on agriculture for their income. Slower growth in construction could slow progress on poverty reduction in urban areas, with earning members from poorer households more likely to work as unskilled labor in this sector. The impact of inflationary pressures and potentially increased food prices needs to be monitored closely, as poorer households tend to devote a high share of monthly expenditure to food.
Risks and Challenges
Risks to Myanmar’s medium-term outlook, from domestic and external factors, are tilted to the downside. Faster than expected increases in U.S. interest rates may put pressure on the Kyat and uncertainty in global trade relationships could disrupt Myanmar’s export markets. Domestically, the international response to Rakhine crisis may reduce the level of development assistance, investment and trade. Economic reform momentum may slow leading up to elections in 2020, including in the banking sector where exposure to weakening construction and trade activities may deepen. Vulnerability to natural disasters remains an ever-present risk. Upside risks include plans for implementation of the Myanmar Sustainable Development Plan and improvement in investor sentiment driven by the Company Law and greater public-private consultations.
Myanmar’s policy instruments are still being developed to address the macro-stability risks arising from external and internal imbalances. A tighter monetary policy stance, using instruments such as slowing credit growth or increasing controlled interest rates, may need to be employed, which may in turn dampen business sentiment and activity. The burden of adjustment to external and internal imbalances is also likely to fall on fiscal policy, specifically to limit the need for inflationary deficit financing. This may create risks, as ambitious spending plans are currently outlined to implement the MSDP leading up to elections. This also underscores the importance of public investment selection and judicious prioritization of scarce budgetary resources.
135
NAVIGATING UNCERTAINTY
PART III. COUnTRY SUMMARIES AnD KEY InDICATORS: MYAnMAR

Figure 1. Real GDP growth and sector contribution to real GDP growth
Figure 2. CPI inflation and exchange rate
Percent, percentage point CPI, percent, yoy contribution Exchange rate, Kyat/USD
9
8
7
6
5
4
3
2
1
-1
0
2013 2014 2015 2016 2017f 2018f 2019f 2020f Apr-14
Sep-14
16
14
12
10
8
6
4
2
0
Jul-15
May-16
Oct-16
Mar-17
Feb-1
5
Dec-15
Aug-17
Jan-18
Jun-18
1,410
1,360
1,310
1,260
1,210
1,160
1,110
1,060
1,010
960
J Agriculture J Industry J Services ▬ Real GDP growth J CPI, nonfood J CPI, food and nonalcholic beverages ▬ CPI, all items
▬ Exchange rate, rhs
Sources: Ministry of Planning and Finance, and World Bank staff estimates. Sources: Central Statistical Organization and Wakhema exchange rate centre.
MYANMAR Selected Indicators 2015 2016 2017 2018e 2019f 2020f
Real GDP growth, at constant market prices 7.0 5.9 6.4 6.2 6.5 6.8Real GDP growth, at constant prices 7.0 5.9 6.4 6.2 6.5 6.8
Agriculture 3.4 -0.4 3.0 3.0 3.9 4.2Industry 8.3 8.9 8.0 7.8 7.9 8.0Services 8.7 8.2 7.4 7.1 7.0 7.4
Inflation (Consumer Price Index) 8.4 7.0 5.5 8.5 8.0 8.5Current Account Balance (% of GDP) -7.2 -5.3 -4.7 -4.9 -4.5 -4.6Fiscal Balance (% of GDP) -5.1 -3.0 -2.7 -3.0 -3.1 -3.3Primary Balance (% of GDP) -3.4 -1.1 -1.2 -1.4 -1.9 -2.3International poverty rate ($1.9 in 2011 PPP)a,b 6.4 5.6 5.7 4.8 3.6 2.0Lower middle-income poverty rate ($3.2 in 2011 PPP)a,b 29.8 27.3 27.6 24.4 18.2 11.2Upper middle-income poverty rate ($5.5 in 2011 PPP)a,b 67.6 64.8 65.0 62.0 55.5 42.9
Source: World Bank, Poverty & Equity and Macroeconomics, Trade & Investment Global Practices.Notes: e = estimate, f = forecast. a) Calculations based on EAPPOV harmonization, using 2015-MPLCS. Actual data: 2015. nowcast: 2016–2018. Forecast are from 2019 to 2020. b) Projection using neutral distribution (2015) with pass-through = 0.3 based on private consumption per capita in constant LCU.
EAST ASIA AND PACIFIC ECONOMIC UPDATE OCTOBER 2018
136 PART III. COUnTRY SUMMARIES AnD KEY InDICATORS: MYAnMAR

NORTH PACIFIC ISLANDS
2016Population, million 0.31GDP, US$ billion 1.12GDP per capita, current US$ 3,643Sources: WDI, World Bank staff estimates.
Summary
Growth in the Federated States of Micronesia and the Republic of the Marshall Islands is projected to remain firm in FY2018 supported by donor-funded construction, while a recovery in the tourism sector is expected to drive a rebound in growth in Palau. While high fishing revenues have bolstered fiscal balances, substantial fiscal risks remain, including due to the scheduled expiry of Compact Sector Grants (grants from the U.S. Government for the infrastructure, health and education sectors) in 2023.
Recent Developments
The economy of the Federated States of Micronesia (FSM) is estimated to have grown by 2.0 percent in FY2017, continuing the uneven growth performance of recent years which has seen the economy contract for four of the previous five years, interrupted by strong positive growth in FY2015 (of 4.9 percent growth). The estimated return to growth in FY2017 was driven by higher production in the fisheries sector and increased construction activity related to infrastructure projects. The sluggish growth performance over recent years has
weighed on formal sector employment, which—according to the latest available data (2016)—was around 15,300 employees; over 4 percent below its FY2011 level. This is likely to have exacerbated basic needs poverty in turn, since consumption welfare tends to be lower for those who are economically inactive or engaged in informal activities. The latest estimates indicate that 41.2 percent of the population were unable to afford the cost of basic needs in 2013/14. Consumer prices are estimated to have risen by less than 1 percent in FY2017, due to lower domestic fuel prices and a stronger US dollar (the official currency of the FSM) holding down prices for some imports. After traditionally registering large deficits, the current account is estimated to have registered its fourth consecutive surplus in FY2017, reflecting higher fishing license receipts and grant inflows related to the Compact of Free Association with the United States.
FSM’s fiscal performance has improved significantly in recent years, resulting in large fiscal surpluses of 7–12 percent of GDP during FY2014–FY2017. While general tax revenue has remained steady at around 12 percent of GDP, which is low relative to other countries in the Pacific, non-tax revenue (excluding grants) have more than doubled as a percent of GDP since 2011 to over 23 percent of GDP, reflecting higher fishing license fees resulting from the introduction of the Vessel Day Scheme (a regional agreement that establishes the minimum price of a vessel day and limits the total number of vessel days sold). Another sizeable fiscal surplus is expected in FY2018. The government has prudently transferred fiscal surpluses to the FSM Trust Fund aimed at mitigating external shocks and potential future revenue shortfalls from the scheduled end of Compact grants from 2024. nevertheless, further transfers of fiscal surpluses will be needed to build adequate fiscal buffers, as the combined corpus of the nation’s two trust funds (the Compact Trust Fund and the FSM Trust Fund) are projected to be less than sufficient to deliver an annual investment income that can fully replace the expiring grants. The central government retains cash reserves of around USD 64 million (5 months of general government current spending). With no central
137
NAVIGATING UNCERTAINTY
PART III. COUnTRY SUMMARIES AnD KEY InDICATORS: nORTH PACIFIC ISLAnDS

bank or foreign exchange reserves, these serve as a means to absorb short-term liquidity shocks.
Economic growth in the Republic of Marshall Islands (RMI) is expected to have accelerated in FY2017 to around 3.6 percent, driven by a strong pick-up in fisheries activity and continued public infrastructure investment, following growth of 1.9 percent in FY2016. The current account has remained in surplus in recent years, with foreign grants and higher fishing license receipts more than offsetting a fall in exports and an increase in service imports. Consumer price are estimated to have been flat in FY2017, following falls in FY2016 and FY2015, when the stronger US dollar (the official currency of the RMI) put downward pressure on food and transport prices. The combination of stronger economic growth (assuming it is equitable across the income distribution), public infrastructure investment, and low food price inflation are likely to have accelerated poverty reduction, though the extent of this is not known due to lack of data on household incomes and expenditures in the RMI.
High fishing license fees have underpinned small fiscal surplus over the past four years, a trend which is expected to have continued in FY2018. However, larger fiscal surpluses will be required to build adequate buffers to sustain government spending following the scheduled end of Compact grants from 2024, as current projections indicate that the corpus of the RMI Trust Fund will not be sufficiently large to generate an annual income stream that can fully replace the expiring grants. In addition, government cash reserves are expected to have remained low (the most recent data indicate that reserves were around USD 13.6 million at the end of 2017, equivalent to around 1 month of recurrent spending), although the steady flow of external grants has shielded the RMI from liquidity squeezes.
The Palauan economy contracted by 3.7 percent in FY2017 as the government continued its structural reform of the tourism sector away from a high-volume model and towards a high-quality model of sustainable ecotourism development. Following explosive growth in tourist arrivals
of over 52 percent between FY2013 and FY2015—driven by a 10-fold increase in Chinese tourists—authorities have clamped down on package tourism and charter flights, as part of a new ‘Pristine Paradise Palau’ strategy to target the luxury tourism market and protect the environment. The result was a 28 percent fall in tourist arrivals from FY2015 to FY2017, although this was partially offset by a 14 percent increase in spending per tourist. Lower overall tourism receipts, combined with higher imports for transport and fuel, also weakened the external position, with the current account deficit reaching 21 percent of GDP in FY2017. Despite slowing growth, the economy continued to create jobs (up 4.1 percent in FY2017), meaning formal employment has now increased by 20 percent since FY2012. Consumer prices rose by 0.9 percent in FY2017, as the stronger US dollar (the official currency of Palau) held down local prices for food and transport services. The combination of strong formal employment growth and low food price inflation is likely to have reduced the poverty risk for many Palauan households.
Palau’s fiscal position has strengthened in recent years, with FY2017 registering a fiscal surplus (including grants) of 4.5 percent of GDP, the seventh consecutive annual surplus, underpinned by increased revenues from fishing license fees. These were partially offset by increased capital transfers to state governments and higher contributions to public sector pensions. The government has retained a healthy cash balance, with reserves estimated to increase from around 3 months of government spending in FY2015 to about 6 months of spending by FY2021. However, the Compact Trust Fund remains below its pre-Global Financial Crisis level as a percent of GDP. Greater fiscal consolidation and revenue mobilization is necessary to ensure long-term fiscal sustainability.
Outlook and Risks
In FY2018 growth is expected to register 1.4 percent and 2.5 percent, respectively, in the FSM and RMI, driven by continued infrastructure investment. In Palau, growth is expected to rebound to around 5 percent as tourism activity
EAST ASIA AND PACIFIC ECONOMIC UPDATE OCTOBER 2018
138 PART III. COUnTRY SUMMARIES AnD KEY InDICATORS: nORTH PACIFIC ISLAnDS

Figure 1. Former sector employment Figure 2. Overall fiscal balanceIndex, 2007=100 Percent of GDP
110
105
100
95
85
90
2007 2008 2009 2010 2011 2012 2013 2014 2015 2016 2017e
15
10
5
0
-5
2007 2008 2009 2010 2011 2012 2013 2014 2015 2016 2017e
▬ PLW ▬ RMI ▬ FSM ▬ PLW ▬ RMI ▬ FSM
Sources: national sources via EconMap. Sources: national sources via EconMap and latest available joint World Bank and IMF DSAs.
NORTH PACIFIC ISLANDS Selected Indicators 2015 2016 2017e 2018f 2019f 2020f
Real GDP growth, at constant market pricesRepublic of the Marshall Islands -0.4 1.9 3.6 2.5 2.3 2.2Federated States of Micronesia 4.9 -0.1 2.0 1.4 0.9 0.7Palau 10.1 0.1 -3.7 5.0 4.0 3.0
Sources: EconMAP; IMF and World Bank MTI Global Practice.Notes: e = estimate; f = forecast.
recovers with the entry of new hotels, and construction picks up. Overall, the outlook for the north Pacific countries is subject to substantial risks due to their reliance on grants, tourism, and commodity imports. A slow-down in key trading partners, a further U.S. dollar appreciation, and natural disasters could impact negatively on tourism activity. Higher commodity prices could make food and fuel imports costlier and inflation higher. These countries
will have to rely on fiscal and structural policies should the above-mentioned risks materialize. Global financial sector volatility could also affect returns on the various trust funds and their ability to provide fiscal space for priority spending or respond to future shocks, given the limited space for additional debt and the lack of monetary policy levers.
139
NAVIGATING UNCERTAINTY
PART III. COUnTRY SUMMARIES AnD KEY InDICATORS: nORTH PACIFIC ISLAnDS

PAPUA NEW GUINEA
2017Population, million 8.3GDP, current US$, billion 19.8GDP per capita, current US$ 2,402Poverty rate ($1.90/day 2011 PPP terms)a 38.0National poverty ratea 39.9Gini coefficienta 41.9Life expectancy at birth, yearsb 65.5Source: WDI, Macro Poverty Outlook, and official data.Notes: a. Most recent value (2009/10). b. Most recent WDI value (2016).
Summary
The resource sector remains the main driver of the economy but also contributes to macroeconomic volatility. A temporary output disruption in the resource sector—due to an earthquake—led to a decline in GDP growth in 2018. The growth rate is expected to rebound in 2019–20 when resource-sector output will normalize, and commodity prices are projected to strengthen. Downside risks include further production disruptions due to natural disasters and a decline in commodity prices due to weaker global demand.
Recent Developments
After a rebound in economic growth in 2017, the real GDP growth rate in Papua New Guinea (PNG) is estimated to have declined in 2018. The main cause of the decline was a severe earthquake which hit PNG in February 2018 and affected output in the resource sector, comprising
mining and hydrocarbon extraction, the main drivers of the PNG economy. The earthquake has also affected the non-resource economy, with some signs of a slowdown reported by the authorities for the first quarter of 2018. The economic impact of the earthquake is estimated to be significant, with a preliminary estimate that the economy will contract by 1.6 percent in 2018, down from 2.5 percent growth in 2017. Weaker domestic demand has led to lower headline inflation, which eased from 6.0 percent year-on-year (yoy) in the first quarter of 2017 to 4.5 percent yoy in the first quarter of 2018.
The current account surplus has remained substantial since the production and export of liquefied natural gas (LNG) commenced in 2014. The current account surplus is offset by net outflows in the capital and financial account, mainly reflecting the repayment of debt obligations used for construction of the first LnG project in the country. Although the level of gross foreign exchange reserves has remained stable at about US$1.7 billion (about 5 months of imports) since 2016 until the first quarter of 2018, quantitative restrictions on access to foreign exchange led to a shortage of foreign currency available for international trade. As a result, imports contracted and a backlog of foreign exchange orders emerged, exceeding US$1 billion at the end of 2017.
The PNG authorities are still adjusting macroeconomic policy to the low commodity-price environment. So far, the macroeconomic policy adjustment to the commodity-price shock has been shouldered by fiscal policy, while the lack of a monetary and exchange rate adjustment has led to a shortage of foreign exchange and rationing, as described above. In 2018 the government has continued to implement its fiscal consolidation strategy, focusing on fiscal and debt sustainability. Fiscal consolidation efforts, mainly focused on containing expenditure, helped to halve the overall fiscal deficit from above 5 percent of GDP in 2016 to below 3 percent in 2017. Moreover, in September 2017, the government adopted the non-resource primary balance (as percent of non-resource GDP) as a fiscal anchor. This indicator is targeted to reach zero by 2022. Financing of the fiscal deficit by government external borrowing
EAST ASIA AND PACIFIC ECONOMIC UPDATE OCTOBER 2018
140 PART III. COUnTRY SUMMARIES AnD KEY InDICATORS: PAPUA nEW GUInEA

allowed the central bank to partially clear the backlog of foreign exchange orders to the level of US$0.5–0.6 billion by mid-2018.
From global as well as regional perspectives, the prevalence of extreme poverty in PNG is high. About 38 percent of the population in PNG in 2010 (the latest household budget survey available) lived under the internationally recognized extreme poverty line of US$1.90 per day (2011 PPP terms). The national poverty rate was estimated at 39.9 percent of the population. This incidence of poverty is by far one of the highest rates in the East Asia and Pacific region. It is also higher than in many of PNG’s lower middle-income, resource-rich peer countries. Broadly consistent with the high proportion of the population living in rural areas (87 percent), almost 90 percent of the country’s poor are located in rural PNG and are more likely to be engaged in agricultural activities.
Outlook
Economic growth is expected to rebound to 3.5 percent in 2019 and 3.1 percent in 2020, primarily due to a return to full production in the resource sector, LNG and gold extraction. Projected higher oil and gas prices, due to stronger global demand and supply constraints, should also support the growth rebound. Non-resource sector activity is expected to pick up, with growth in the agriculture sector supported by anticipated new commercial operations and higher demand for copra oil from the food, chemical, and beauty industries, particularly in Asia. In the longer-term, GDP growth is expected to edge towards its potential rate, which is estimated at 4 percent per year.
Inflation is forecast to ease to 3.8 percent in 2019–20, as the output gap in the non-resource sector is expected to remain significant. Following below-trend growth in recent years, capacity utilization across the non-resource economy is likely to remain low. Thus, it would take a significant rebound in broader conditions for the recent downward trajectory in inflation to be reversed. nonetheless, a disorderly exit from the managed exchange rate regime
and potential continuation of central bank financing of the budget deficit remain adverse risks to the inflation outlook.
Looking further ahead, PNG’s medium-term economic outlook is relatively sanguine, underpinned by further large-scale resource projects. Given the low costs of domestic production, PNG is well positioned to take advantage of growing regional demand and rising global prices. Future large-scale investment in the sector appear likely, with plans to double LNG production and develop new gold, copper and silver reserves from 2020 onward.
Risks and Challenges
Macroeconomic outcomes remain subject to further risks following the earthquake. These include: (i) a softening of commodity prices, which could dampen exports and GDP growth and increase pressure on the exchange rate; (ii) other natural disasters, which are frequent in PNG and can devastate the local economy, disrupt the extraction and processing of natural resources, and create considerable fiscal pressures; and (iii) civil unrest or disturbances, which could adversely affect oil and LNG production.
While not all of these risks can be completely mitigated—as they largely remain out of authorities’ control—risk mitigation is helped in part by the government’s ongoing fiscal consolidation efforts, which aim to boost revenue collection and streamline inefficient expenditure. To strengthen fiscal and debt sustainability, the government should adhere to the adopted non-resource primary fiscal balance as a fiscal anchor and operationalize the established sovereign wealth fund. These measures, along with the implementation of the Public Expenditure and Financial Accountability (PEFA) Road Map 2015–2018, constitute important efforts to strengthen fiscal resilience. The support provided by development partners through financial and technical assistance is also a key mitigating factor which, for example, can help the government alleviate the impacts of natural disasters such as the recent earthquake.
141
NAVIGATING UNCERTAINTY
PART III. COUnTRY SUMMARIES AnD KEY InDICATORS: PAPUA nEW GUInEA

Figure 1. Real GDP growth, contribution to real growth Figure 2. Key fiscal and debt indicatorsPercent, percentage points Percent of GDP Percent of GDP
8
6
4
2
-4
-2
0
2015 2016 2017e 2018e 2019f 2020f 2015 2016 2017 2018e 2019f 2020f
40
35
30
25
20
15
10
25
20
15
10
5
0
-5
-10
-15
-20
-25
J Resource sector J Nonresource sector ▬ Real GDP growth J Revenue J Expenditure ▬ Overall balance ▬ Public debt, rhs
Source: World Bank and IMF staff calculations and estimates. Source: World Bank and IMF staff calculations and estimates.
PAPUA NEW GUINEA Selected Indicators 2015 2016 2017e 2018e 2019f 2020f
Real GDP growth, at constant market prices 5.3 1.6 2.5 -1.6 3.5 3.1Resourcea 39.0 6.3 4.3 -9.4 8.3 5.0Non-resource -3.1 -0.1 1.9 1.4 1.9 2.3
Inflation (Consumer Price Index p.a.) 6.0 6.7 5.4 4.2 3.8 3.8Current Account Balance (% of GDP) 12.0 24.1 24.0 22.7 22.8 20.0
Resourcea 20.3 26.6 29.1 30.0 33.5 31.0Non-resource -8.3 -2.4 -5.1 -7.3 -10.7 -11.0
Overall fiscal balance (% of GDP) -4.4 -5.2 -2.8 -2.2 -2.3 -2.1Non-resource primary balance (% of non-resource GDP) -4.7 -4.7 -1.9 -0.3 -0.9 -0.6Public debt (% of GDP) 32.3 37.0 36.9 36.2 36.0 35.8
Sources: World Bank and IMF staff calculations and estimates, based on official data.Note: e= estimate; f = forecast; Estimates and forecasts are as of June 15, 2018. a) The resource sector includes mining, quarrying, petroleum and gas production.
EAST ASIA AND PACIFIC ECONOMIC UPDATE OCTOBER 2018
142 PART III. COUnTRY SUMMARIES AnD KEY InDICATORS: PAPUA nEW GUInEA

PHILIPPINES
2017Population, million 104.9GDP, current US$ billion 313.6GDP per capita, current US$ 2,989International poverty rate ($1.9)a 6.6Lower middle-income poverty rate ($3.2)a 27.0Upper middle-income poverty rate ($5.5)a 56.1Gini indexa 44.4Life expectancy at birth, yearsb 69.1Sources: World Bank WDI, Macro Poverty Outlook, and official data.Notes: a. Most recent value (2015) 2011 PPPs. b. Most recent WDI value (2016).
Summary
Economic growth moderated in H1 2018 due to weaker export growth. Capital formation was the main growth engine fueled by public construction activities. Fiscal policy remains expansionary supported by higher tax collection. Private consumption moderated slightly due to increasing inflation reaching 4.5 percent in the first seven months of 2018. To manage inflation expectations, the country’s central bank raised gradually the policy rate. Sustained real household income suggests that poverty may have declined further.
Recent Developments
The Philippine economy expanded by 6.3 percent year-on-year in H1 2018, slower than the 6.6 growth in H1 2017. Since early 2018 observed slowdown was mainly driven by the weak performance of exports due to the cyclical global
downturn in demand for electronics, the Philippines’ main export good. Investment spending fueled growth, supported by a strong expansion in investments in durable equipment and the construction sector. Public consumption growth accelerated in H1 2018, in line with the government’s expansionary fiscal policy stance. Private consumption growth remained robust despite increased inflation, supported by a steady inflow of remittances and a stable labor market. The services sector remained the main engine of growth, accelerating to 6.7 percent year-on-year in H1 2018, from 6.5 percent a year ago. Meanwhile, industry expanded by 7.0 percent year-on-year in H1 2018, similar to the same period in 2017. The agriculture sector underperformed in H1 2018 compared to the same period last year due to adverse weather conditions and persistent productivity challenges in the sector.
Headline inflation averaged 4.8 percent in the first eight months of 2018, higher than the 2.8 percent average in the same period in 2017, breaching the central bank’s target range of 2–4 percent, driven by domestic food supply constraints, higher global oil prices filtering through higher domestic fuel prices, a weaker peso, and new excise taxes. To manage inflation expectations, the Bangko Sentral ng Pilipinas (BSP) raised its key policy rate thrice since January, by a total of 100 basis points from 3.0 percent to 4.0 percent.
The government continued its expansionary fiscal path for the third year in a row, widening the fiscal deficit to 2.3 percent of GDP in H1 2018 from 2.0 percent of GDP a year ago, but remained within the government’s deficit ceiling of 3.0 percent of GDP. Expenditures increased from 17.6 percent of GDP in H1 2017 to 19.5 percent of GDP in H1 2018, driven by robust growth in public infrastructure investment and rising wage bill expenditures. Revenue growth increased from 15.6 percent of GDP in H1 2017 to 17.1 percent in H1 2018, supported by the robust expansion in tax revenues, in part due to the implementation of new tax policy. The government’s overall debt-to-GDP ratio remained at 42.5 percent of GDP in H1 2018.
143
NAVIGATING UNCERTAINTY
PART III. COUnTRY SUMMARIES AnD KEY InDICATORS: PHILIPPInES

The country’s balance of payments turned into deficit in the first seven months of 2018, driven by a widening trade deficit and higher capital outflows. The Philippine peso continued to depreciate and reached a 12-year low in July 2018 as a result of the ongoing monetary policy normalization in the United States, global trade uncertainties, a slowdown in electronics export growth, and the sustained growth of capital and raw materials imports.
Sustained growth in real household incomes suggests that poverty declined further in 2017. Household incomes, those in the bottom 40 percent of the population grew faster than inflation rate implying real income growth and contributing to further poverty reduction.
Outlook
The Philippines’ medium-term growth outlook remains strong, supported by an expected rise in public investment spending during the upcoming pre-election period and a robust private demand. The economy is projected to expand by 6.5 percent in 2018, 6.7 percent in 2019, and 6.6 percent in 2020. Investment growth is expected to be driven by continued strong public investment growth, consistent with the government’s plan to speed up the implementation of its infrastructure program. This investment spending is expected to accelerate import growth, while export growth is projected to remain moderate given the global trade slowdown. Private consumption growth is projected to remain strong, supported by a steady labor market, continued inflows of remittances, and inflation easing.
Increasingly inclusive growth is likely to continue to contribute to poverty reduction. High economic growth will facilitate growth of household incomes through wages and sustained domestic remittances. Social cash transfers from government are likewise expected to continue in the coming years. Based on the economic growth outlook, poverty rate based on the lower middle-income poverty line of US$3.20/day, is projected to decline from 27.0 percent
in 2015 to 23.0 percent in 2018, 21.8 percent in 2019, and 20.6 percent in 2020. These projections would imply a continuing trend of one million Filipinos being lifted out of poverty each year.
Risks and Challenges
External risks have increased in recent months driven by the intensified trade protectionist sentiments in some advanced economies and may impact export demand for Philippine products, especially electronics, adversely. Rising uncertainty in the financial markets and weakened investor sentiments toward emerging markets may result in larger capital outflows, higher financing costs, and further pressure on the peso. On the domestic front, the effect of rising inflation on private consumption growth constitutes a risk. In addition, Typhoon Mangkhut might have an impact on food inflation given the crop damages in the affected area. While the BSP is committed to managing inflation expectations, delays in resolving the economy’s supply constraints and the further depreciation of the peso may raise inflation in the medium term. In addition, the investment growth outlook depends on the timely and effective implementation of government investment program.
While the country has been shown to be resilient, measure to boost productivity growth will become essential to sustain high and inclusive growth. Priority policy areas include improving market competition through regulatory reforms, improving trade and investment climate policies and regulations, and reducing labor market rigidities and costs.
EAST ASIA AND PACIFIC ECONOMIC UPDATE OCTOBER 2018
144 PART III. COUnTRY SUMMARIES AnD KEY InDICATORS: PHILIPPInES

Figure 1. Real GDP growth, contribution to real growth Figure 2. Actual and projected poverty rates and real GDP per capita
Percent, percentage points Poverty rate, percent GDP per capita, constant LCU, in thousands
15
10
5
0
-5
-10
Q1-14
Q1-15
Q1-16
Q1-17
Q3-14
Q3-15
Q3-16
Q3-17
Q1-18Q2-1
82003 2005 2007 2009 2011 2013 2015 2017 2019f
70
60
50
40
30
20
10
0
120
100
80
60
40
20
0
J Private consumption J Government consumption J Investments ▬ International poverty rate ▬ Lower middle-income poverty rate
J Discrepancy J Net exports ▬ GDP growth ▬ Upper middle-income poverty rate ▬ GDP per capita, rhs
Source: Philippine Statistics Authority. Sources: World Bank staff estimates.
PHILIPPINES Selected Indicators 2015 2016 2017 2018e 2019f 2020f
Real GDP growth, at constant market prices 6.1 6.9 6.7 6.5 6.7 6.6Private Consumption 6.3 7.1 5.9 5.8 5.9 5.8Government Consumption 7.6 9.0 7.0 12.1 12.2 10.5Gross Fixed Capital Investment 16.9 26.1 9.5 16.2 15.0 15.0Exports, Goods and Services 8.5 11.6 19.5 11.4 13.0 13.0Imports, Goods and Services 14.6 20.2 18.1 15.7 15.7 15.3
Real GDP growth, at constant factor prices 6.1 6.8 6.7 6.5 6.7 6.6Agriculture 0.1 -1.2 3.9 1.0 1.1 1.1Industry 6.4 8.0 7.2 7.3 7.6 7.6Services 6.9 7.4 6.7 6.8 7.0 6.8
Inflation (Consumer Price Index) 0.7 1.3 2.9 4.9 3.9 3.4Current Account Balance (% of GDP) 2.5 -0.4 -0.8 -1.1 -1.3 -1.4
Net Foreign Direct Investment (% of GDP) 2.0 2.7 3.2 3.2 2.8 2.8Fiscal Balance (% of GDP) -0.9 -2.4 -2.2 -2.5 -2.8 -2.8Debt (% of GDP) 48.8 45.6 45.1 44.5 43.0 40.9Primary Balance (% of GDP) 1.4 -0.3 -0.3 -0.6 -0.8 -0.7International poverty rate ($1.9 in 2011 PPP)a,b 6.6 5.8 5.1 4.6 4.0 3.6Lower middle-income poverty rate ($3.2 in 2011 PPP)a,b 27.0 25.5 24.2 23.0 21.8 20.6Upper middle-income poverty rate ($5.5 in 2011 PPP)a,b 56.1 55.0 53.9 52.9 51.9 50.9
Source: World Bank, Poverty & Equity and Macroeconomics, Trade & Investment Global Practices.Notes: e = estimate, f = forecast. a) Calculations based on EAPPOV harmonization, using 2006-FIES and 2015-FIES. Actual data: 2015. nowcast: 2016–2018. Forecast are from 2019 to 2020. b) Projection using annualized elasticity (2006–2015) with pass-through = 1 based on GDP per capita in constant LCU.
145
NAVIGATING UNCERTAINTY
PART III. COUnTRY SUMMARIES AnD KEY InDICATORS: PHILIPPInES

SOLOMON ISLANDS
2017Population, million 0.6GDP, current US$ billion 1.3GDP per capita, current US$ 2,133National basic needs poverty rate (%)a 12.7School enrolment, primary (% gross)b 114.8Life expectancy at birth, yearsc 70.7Source: WDI, Macro Poverty Outlook, and official data.Notes: a. Solomon Islands national Statistics Office. Most recent value (2013). b. Most recent WDI value (2016). c. World Health Organization (2016).
Summary
After three years of poor fiscal management that led to consecutive budget deficits and a depletion of cash reserves, the new government returned to fiscal discipline with the passage of a balanced budget in 2018. The macroeconomic situation remains benign, with moderate growth and low inflation. Growth is expected to remain at trend of around 3 percent. Emerging risks include a sharper than expected downturn in the Chinese economy, and ongoing uncertainties, particularly in the logging, mining and banking sectors.
Recent Developments
The Central Bank’s production index, a key proxy for domestic activity, increased by 2 percentage points to 121 points in 2017. Fish, copra and coconut oil production remained strong, owing to favorable commodity prices, increased international demand, and benign domestic weather conditions. Log output remained subdued in
2017 owing to weak production over the first half of the year, despite stronger production in the second half. In 2018, the production index declined over the first five months by 6.6 percent to 113 index points, reflecting weakened copra production and fish catch volumes outweighing a notable increase in log output compared to the same period in the previous year. International prices for most key export commodities fell in the year to May, most notably for copra. Despite strong production in the logging sector over the first half of 2018, output is expected to normalize over the second half of the year. Based on proxy employment indicators from the National Provident Fund, active contributors declined by 0.1 percent over 2017 to 55,788. The Public service increased by 6 percent to 17,562 filled positions. Between 2015 and 2017 the government pursued expansionary fiscal policy with investments towards rural infrastructure and development, and the health and education sectors—potentially important and direct investments in improving the well-being of Solomon Islands’ poor. These increased levels of expenditures resulted in fiscal deficits, financed through a draw-down of the government’s cash reserves, which declined from 3.6 months of recurrent spending to around 1 month over the same period. As a result, the government’s ability to absorb price or natural disaster shocks was severely limited. Public financial management problems throughout 2017 resulted in the accumulation of substantial domestic payment arrears (1.4 percent of GDP), impeding private sector activity. A newly-formed government in end-2017 eliminated the payment arrears and returned to fiscal prudence with the passage of a balanced budget in 2018. This was achieved through a substantial reduction in development expenditures, possibly affecting levels of service delivery in rural areas. A supplementary budget was passed in August to cater mainly for unbudgeted public works contracts and payment arrears arising throughout the year, financed almost fully by stronger than expected revenues and a domestic development bond. Cash reserves remain thin, preventing effective cash-flow management and the implementation of the budget. Total PPG external debt stood at 7.7 percent of GDP in end-2017, however is projected to rise to just over 35 percent of GDP by
EAST ASIA AND PACIFIC ECONOMIC UPDATE OCTOBER 2018
146 PART III. COUnTRY SUMMARIES AnD KEY InDICATORS: SOLOMOn ISLAnDS

2028, reflecting an increase in credits to fund large infrastructure investments. International reserves stood at US$500 million at end-2017, equivalent to 8.5 months of imports. The current account deficit is projected to widen from 4.2 percent of GDP in 2017 to over 6 percent in 2018, reflecting heightened levels of imports related to large infrastructure projects—most of which are partly or fully externally financed. Inflation remained contained at 1 percent in 2017.
Outlook
Despite current fiscal consolidation efforts, growth is projected to only marginally decline from current levels, averaging around 3 percent per year over the medium-term, and continue to be driven by major infrastructure investments in the roads, air transport, telecommunications and energy sectors. This baseline scenario also assumes resumed gold-mining activity, the exploitation of large nickel deposits, and sustained levels of foreign direct investment averaging 3.3 percent of GDP. A sustainable forestry policy is currently being developed, intended to gradually curb log output, and is expected to impact on fiscal space going forward. However, the return to sound fiscal management in 2018, complemented by key public financial management reforms and a tax review, are expected to ease fiscal pressures. The payment of expenditure arrears instilled confidence, although cash reserves will need to be rebuilt to ensure effective cashflow management and buffer against shocks. Expenditure pressures associated with the 2019 general elections and the hosting of the 2023 South Pacific Games pose a risk to medium-term fiscal consolidation; as do scholarships, should current expenditure restraint measures not be maintained. The current account deficit—financed through large aid flows in the capital account—is expected to widen to further to around 8 percent of GDP in 2019, reflecting a continued increase in imports, and the underlying long-run decline in logging exports. The Honiara Consumer Price Index is expected to remain at around 3 percent over the medium term.
Risks and Challenges
With logging sources expected to be depleted in the long run and uncertainty around the exploitation of the country’s mining potential, Solomon Islands faces the challenge of developing new sources of growth. In the near term, growth will be supported by infrastructure projects and logging may not decline significantly. This outlook is subject to considerable risks, particularly from any contraction in log demand in China (the main export destination for logs), or delays in infrastructure projects. Thereafter, the impending decline of the logging industry will impact on growth and a vital source of government revenue. The new sustainable forestry policy may risk being undermined and result in foregone revenues, if insufficient resources are dedicated to its implementation. If not resolved by year-end, the cessation of the correspondent banking relationship of a key service provider to the logging industry places a significant risk to government finances and the broader economy. Mining could become a driver of growth but developments in the sector hinge on the adoption of a legal and regulatory framework conducive to mining, and on clear procedures for the acquisition of land (for the exploration and exploitation). Such frameworks and procedures, which are currently being put in place, will also ultimately impact the extent to which forthcoming benefits from mining are shared across the population. In the context of a constrained fiscal environment, a heightened focus on development expenditures could maximize their effectiveness for the most vulnerable.
147
NAVIGATING UNCERTAINTY
PART III. COUnTRY SUMMARIES AnD KEY InDICATORS: SOLOMOn ISLAnDS

Figure 1. Trade balance Figure 2. Per capita GDPUS$, thousands Percent of GDP Percent change Index, 2003=100
40
30
20
10
0
-10
-20
-30
-40
900
800
700
600
500
400
300
200
100
0
20092012
20192015
20062007
20082016
20172018
20132014
20102011
20212020
20092012
20192015
20062007
20082016
20172018
20132014
20102011
20212020
12
10
8
6
4
2
0
-2
-4
-6
-8
160
140
120
100
80
60
40
20
0
J Trade balance, rhs ▬ Imports, lhs ▬ Exports, lhs J Real GDP per capita ▬ Real GDP per capita index, rhs
Sources: Central Bank of the Solomon Islands, World Bank staff estimates, IMF.Note: rhs= right-hand side.
Sources: World Bank staff estimates, IMF.Note: rhs= right-hand side.
SOLOMON ISLANDS Selected Indicators 2015 2016 2017 2018e 2019f 2020f
Real GDP growth, at constant market prices 2.5 3.5 3.2 3.5 3.5 3.5Private Consumption -6.5 18.5 -16.8 5.0 5.0 5.0Government Consumption 11.9 -3.5 3.5 4.5 4.5 4.5Gross Fixed Capital Investment 26.8 15.4 24.1 1.8 1.8 1.8Exports, Goods and Services 10.2 -3.8 8.3 5.0 5.0 5.0Imports, Goods and Services 13.7 4.3 -0.8 3.6 3.6 3.6
Inflation (Consumer Price Index) -0.6 0.5 0.5 0.0 0.1 0.1Current account balance (% of GDP) -3.1 -4.0 -3.6 -0.3 3.1 6.5Fiscal Balance (% of GDP) -0.2 -3.3 3.8 4.5 5.1 5.7Debt (% of GDP) 10.1 7.9 16.2 17.2 18.4 19.5Primary Balance (% of GDP) 0.2 -3.2 3.9 4.6 5.1 5.7
Sources: World Bank, Poverty & Equity and Macroeconomics, Trade & Investment Global Practices.Notes: e = estimate; f = forecast.
EAST ASIA AND PACIFIC ECONOMIC UPDATE OCTOBER 2018
148 PART III. COUnTRY SUMMARIES AnD KEY InDICATORS: SOLOMOn ISLAnDS

SOUTH PACIFIC ISLANDS
2016Population, million 0.58GDP, US$ billion 2.00GDP per capita, current US$ 3,419Sources: WDI, World Bank staff estimates.
Summary
In the South Pacific countries—Samoa, Tonga, and Vanuatu—economic activity has been affected by recent natural disasters, with Tonga in the early recovery stage from Tropical Cyclone (TC) Gita which hit in February 2018, while Vanuatu has now almost completely recovered from TC Pam (2015), with several large reconstruction projects nearing completion. Given fiscal pressures in each country, continued efforts are necessary to increase domestic revenues, control current spending, and carefully prioritize capital spending.
Recent Developments
Economic growth in Samoa is expected to have moderated to 1.8 percent in FY2018 (year ended June) from 2.4 percent in FY2017, due to the closure of a major manufacturer of automotive wire harnesses in August, and as fishing exports revert to more normal levels from an earlier peak. The economic impact of TC Gita, which hit in February 2018, was relatively contained. Average annual inflation is expected to have quickened somewhat in FY2018 (from 1.3 percent in FY2017), due to a pick-up in import prices
and more recently domestic food prices in the wake of TC Gita. The current account balance has narrowed to between 2 and 3 percent of GDP in recent years, due to strong growth in tourism-related services exports and (in FY2017) an easing in imports for construction. Significant increases in domestic revenue collection and tighter controls on operating expenditure helped to bring the budget close to balance in FY16 and FY17. Nevertheless, current spending is projected to have picked up in FY2018, due to spending related to the Pacific Games and other government-sponsored events, and an increase in spending for road rehabilitation and maintenance and medical supplies.
Tonga is recovering from Cyclone Gita which hit in February 2018, caused widespread damage and losses totaling around US$164 million, or 38 percent of GDP. The cyclone is estimated to have affected around three quarters of Tonga’s population, or about 80,000 people, with over 800 homes destroyed and a further 4,000 damaged, and the poor and vulnerable particularly hard hit with fewer financial buffers to sustain resilience. Latest estimates suggest that growth will slow to around 1 percent in FY2018 due to the impact of the cyclone on agricultural production, tourism, and the commercial sector. Relatively fast inflation—7.2 percent in annual average terms in FY2017, due primarily to dry weather and policy-driven tax increases—may persist for longer than expected due to the impact of TC Gita on local market food prices. The current account deficit is expected to have deteriorated to close to 20 percent of GDP in FY2018 (from 12 percent of GDP in FY2017) due to an increase in imports and a decline in exports of agricultural products and tourism services. Prior to TC Gita, the authorities had maintained a generally prudent fiscal stance, with the deficit contained at around half a percent of GDP in FY2016 and FY2017, and domestic revenues on an upwards trend. While the FY2018 budget was comparatively expansionary, spending through the year has fallen short of initial expectations due to delays in implementation and the decision to not host the 2019 Pacific Games, while donor support has helped to finance many of the immediate cyclone recovery needs, keeping the estimated fiscal outcome close to balance.
149
NAVIGATING UNCERTAINTY
PART III. COUnTRY SUMMARIES AnD KEY InDICATORS: SOUTH PACIFIC ISLAnD COUnTRIES

Vanuatu is close to full recovery from Tropical Cyclone Pam, which struck in March 2015. Several large infrastructure projects, including the rehabilitation of damaged road transport infrastructure, and a port upgrade in the capital, are nearing completion, while a further ramping up of other infrastructure projects as well as a recovery in the agriculture and tourism sectors are expected to maintain GDP growth at around 4 percent in CY2018. Inflation is estimated at 3.1 percent in 2017, reflecting increased domestic demand for food, transport and education, and is projected to increase to around 4.8 percent in 2018, driven by the impacts of a temporary VAT increase from 12.5 percent to 15 percent. The current account deficit is estimated at 9 percent of GDP in 2017 and 2018—in line with the high import content of infrastructure projects—and is financed in part through foreign grants. The advancement of several major reconstruction and rehabilitation projects following Tropical Cyclone Pam resulted in significant fiscal pressures in 2016 and 2017. Government spending in 2017 surpassed 2016 levels by around 13 percent, largely due to severance payments and the Pacific Mini Games, widening the fiscal deficit from 6.1 percent in 2016 to 7.5 percent in 2017. Despite a temporary VAT increase, an increase in the public wage bill (by around 7 percent) in 2018 is expected to add to fiscal pressures and widen the deficit further to 8 percent of GDP.
Outlook
In Samoa, economic growth is projected to pick up in FY19 and FY20 before settling at between 2 and 2.5 percent per year in the medium term. Growth is expected to rebound to 3.2 percent in FY19 and around 5 percent in FY20, as two new businesses set up operations at the old Yazaki plant (producing mattresses and wire harnesses, and re-employing a small proportion of the ex-Yazaki workers), preparations for the July 2019 Pacific Games take place, tourism activity increases, and several public projects near completion. Over the medium term, the economy will be supported by continued growth in the tourism and agriculture sectors, which should directly create formal
job opportunities for Samoa’s more vulnerable people (including its youth who tend to experience particularly high levels of unemployment), while also spurring related activity in the informal sector.
In Tonga, reconstruction and repair activity for housing, public buildings, and schools is projected to ramp up over the next two to three years, which, together with a recovery in the agriculture and services sector, is expected to drive a rebound in growth to around 3 to 4 percent in FY19 and FY20. On the fiscal side, public sector cyclone recovery needs over the period to FY21 estimated at around US$113 million or a quarter of GDP have only been partially covered by pledged donor support.
In Vanuatu, GDP growth is expected to decline to around 3.5 percent in 2019, and further to 3 percent over the medium-term, as large infrastructure projects are completed. Reforms to tax administration and the introduction of new legislation, coupled with the winding down of capital expenditures, is expected to narrow the fiscal deficit to under 5 percent of GDP in 2019. The proposed tax reforms are likely to increase cost-of-living pressure for households, though the largest impact is expected to be borne by those with greater levels of income and consumption in urban areas. For the approximately 80 percent of the population living in rural areas and relying on subsistence agriculture, the impact is expected to be more limited.
Risks and Challenges
Government spending is projected to rise in Samoa, though the projected increases are relatively small compared to the substantial fiscal consolidation achieved over the last few years, with external public debt declining to below 50 percent of GDP. Nevertheless, as public debt remains comparatively high, it is important that overall fiscal restraint is maintained, consistent with recent government efforts to increase domestic revenues, control spending, and pursue only high-priority and concessionally-funded capital investments.
EAST ASIA AND PACIFIC ECONOMIC UPDATE OCTOBER 2018
150 PART III. COUnTRY SUMMARIES AnD KEY InDICATORS: SOUTH PACIFIC ISLAnD COUnTRIES

Figure 1. Incidence of poverty at international poverty lines and national hardship thresholds
Figure 2. Public and publicly guaranteed external debt
Percent of the population Percent of GDP
40
35
30
25
20
15
10
5
0Tonga2009
Samoa2008
Vanuatu2010
60
50
40
30
20
10
0
2010 2011 2012 2013 2016 2018201720152014
J Extreme poverty (US$1.90/day) J Poverty (US$3.20/day) J nationally defined hardships ▬ Samoa ▬ Tonga ▬ Vanuatu
Sources: World Bank (2016), Systematic Country Diagnostic for the eight Small Pacific Island Countries. Sources: Latest available joint IMF/World Bank Debt Sustainability Analyses.
SOUTH PACIFIC ISLANDS Selected Indicators 2015 2016 2017 2018e 2019f 2020f
Real GDP growth, at constant market pricesSamoa 1.6 7.1 2.4 1.8 3.2 5.0Tonga 3.7 3.4 2.7 1.2 3.0 3.8Vanuatu 0.2 3.5 4.2 3.8 3.5 3.0
Sources: World Bank, Macroeconomics and Fiscal Management Global Practice, and Poverty Global Practice.Notes: Financial years for Samoa and Tonga are Jul–Jun, for Vanuatu is Jan–Dec. e = estimate; f = forecast.
In general, the key challenge facing Tonga in the next few years is to maintain its prudent fiscal stance in the face of several competing pressures. The government should continue to strengthen management of the government wage bill via implementation of a new remuneration framework and performance management system, and carefully prioritize necessary cyclone-related reconstruction spending, while preserving the fiscal space necessary to meet pressing service delivery needs.
In Vanuatu, the structural increase in recurrent spending and much needed public investments in infrastructure have placed considerable pressure on public finances, and delays in the implementation of new revenue mobilization measures could further strain fiscal accounts. Current and planned public investments therefore need to be implemented in a prioritized fashion, and with due regard to domestic capacity constraints.
151
NAVIGATING UNCERTAINTY
PART III. COUnTRY SUMMARIES AnD KEY InDICATORS: SOUTH PACIFIC ISLAnD COUnTRIES

THAILAND
2016Population, million 69.0GDP, current US$ billion 457.1GDP per capita, current US$ 6,621International poverty rate ($1.9)a 0.0Lower middle-income poverty rate ($3.2)a 0.5Upper middle-income poverty rate ($5.5)a 7.1Gini indexa 36.0Life expectancy at birth, yearsb 75.3Source: WDI, Macro Poverty Outlook, and official data.Notes: a. Most recent value (2015), 2011 PPPs. b. Most recent WDI value (2016).
Summary
Thailand’s economic recovery continued to strengthen and broaden due to external and domestic demand. GDP growth in 2018Q2 remained strong at 4.6 percent year-on-year slightly above market expectations due to private consumption growth at 4.5 percent year-on-year, the fastest pace since 2013. Headline inflation, while low, accelerated to reach the lower end of the target range of 1–4 percent. Low inflation reflects declining agricultural prices, which may slow the reduction in poverty in the medium term.
Recent Developments
Thailand’s economic recovery strengthened in 2018Q2 driven by private consumption, in particular durables, as consumer confidence and agricultural income improved.
Private investment improved gradually. Growth in 2018H1 registered 4.8 percent, the highest pace since 2013.
Economic fundamentals remain stable, with headline inflation slightly above 1 percent, current account in surplus and financial stability maintained with stable ratios of Non-Performing Loans (NPLs) and loan concentration among sectors being reduced.
Exports of goods and services continued to support the recovery, growing by 6.4 percent in 2018Q2. This was supported by global growth and global demand for electronics, including Thai hard-disk drives and electronics. However, service receipts decelerated to 3.1 percent year-on-year as tourist arrivals slowed largely due to a high base.
Domestic demand showed stronger signs of recovery. Private consumption expanded at over 4.5 percent, the fastest pace since 2013Q1, driven by improved purchasing power of both non-agricultural and agricultural households, as improved yield compensated for low farm prices. Private investment, particularly in construction and machinery and equipment, continued to recover steadily growing by 3.2 percent in 2018Q2, improving from the modest 1.7 percent in 2017. Imports of machinery and equipment also expanded. Business sentiment indicators improved due to greater clarity over public infrastructure investments.
Public investment expanded by 4.9 percent after overcoming execution challenges such as approval and procurement processes as well as inclement weather in 2017.
Poverty has been on the decline. As one of the wealthiest countries in developing East Asia and Pacific, Thailand accordingly boasts one of the lowest levels of extreme poverty as measured by the International Poverty Line ($1.90/day 2011 PPP). However, at the more stringent upper-middle income class poverty line, ($5.5/day 2011 PPP), Thailand’s poverty rate of 7.1 percent in 2015 is similar to its wealthier neighbor, Malaysia.
EAST ASIA AND PACIFIC ECONOMIC UPDATE OCTOBER 2018
152 PART III. COUnTRY SUMMARIES AnD KEY InDICATORS: THAILAnD

While inequality remains a challenge, average incomes of the bottom 40 percent of the population rose faster than the average increase for the overall Thai population over the period 2010-2015. Inequality declined over the long-run, but its level remains higher than most other developing EAP countries. In addition, low agricultural prices may slow future improvements in inequality and poverty, particularly among agricultural households.
Outlook
Thailand’s economic recovery is expected to solidify in 2018 led by domestic demand. Growth is projected to accelerate further to 4.5 percent in 2018, on the back of domestic demand recovery and a boost in public investment activity due to execution of large infrastructure projects and spending by state owned enterprises. Progress on critical public infrastructure connectivity projects will in turn improve business sentiment and lead to an expected pick-up in private investment at 3.9 percent.
Economic growth will moderate in the medium term. Exports is expected to slow as the global upswing passes its peak. Government investment may taper after strong growth in 2018 due to possible delays in mega projects particularly as the new procurement law takes effect.
Macroeconomic stability will likely be maintained, while fiscal and monetary policy stances are expected to remain accommodative. Headline inflation is unlikely to deviate from the inflation target range of 1–4 percent amid anchored inflationary expectations and a gradual recovery. Monetary and fiscal buffers are expected to remain adequate with room for further expansion to support economic activity, if needed.
Strong macroeconomic fundamentals including a strong current account surplus and high foreign reserves will help Thailand weather possible capital flow turbulence as evidenced by the recent Turkish currency crisis. Following the Turkish currency crisis, the Thai baht weakened slightly by 1.65 per cent against the US dollar on August 15, 2018,
since end-2017 amid some equity outflows and since then has appreciated.
Risks and Challenges
A key downside risk is uncertainty in external demand as the global economic upswing peaks. Increased protectionism as well as slowing growth in Thailand’s key trading partners, may diminish export growth and slow private investment recovery. Recent trade indicators in July and July already show a softening in merchandise trade.
A second key risk is delayed private investment recovery given concerns over political uncertainty. Private investment sentiment notably improved in 2018H2 but in general has been weak since 2012. Private investors remain concerned about political uncertainty and the adverse impact on planned public infrastructure projects and policy continuity. Continued progress on execution of mega-projects including those under the Eastern Economic Corridor and dual-tracking of railways will be critical to shoring up private investor confidence.
153
NAVIGATING UNCERTAINTY
PART III. COUnTRY SUMMARIES AnD KEY InDICATORS: THAILAnD

Figure 1. Contributions to real GDP growth Figure 2. Actual and projected poverty rates and real private consumption per capita
Percent Poverty rate, percent Private consumption per capita, constant LCU, in thousands
6
4
2
0
-2
-4
2013 2014 2015 2016 2017
45 180
160
140
40
35
120
100
80
30
25
60
40
20
15
20
10
5
0 0
20122014
20162010
20082006
20042002
20182020
J Total consumption J Gross fixed capital formation J Inventory change ▬ International poverty rate ▬ Lower middle-income poverty rate
J Net foreign demand J Residual ▬ Upper middle-income poverty rate ▬ GDP per capita, rhs
Sources: national Statistics Office. Sources: national Statistics Office.
THAILAND Selected Indicators 2015 2016 2017 2018e 2019f 2020f
Real GDP growth, at constant market prices 2.9 3.2 3.9 4.5 3.9 3.9Private Consumption 2.2 3.1 3.2 3.7 3.1 3.1Government Consumption 3.0 1.7 2.0 2.9 2.6 2.6Gross Fixed Capital Investment 4.4 2.8 2.1 6.0 4.7 4.6Exports, Goods and Services 0.7 2.1 7.5 6.9 6.0 4.7Imports, Goods and Services 0.0 -1.4 6.5 6.5 5.6 4.1
Real GDP growth, at constant factor prices 2.9 3.2 3.9 4.5 3.9 3.9Agriculture -5.7 0.6 6.2 4.0 3.5 3.5Industry 2.8 2.1 2.9 5.4 3.4 3.1Services 4.1 4.3 4.3 4.1 4.3 4.5
Inflation (Consumer Price Index) -0.9 0.2 0.7 1.0 1.2 1.3Current Account Balance (% of GDP) 8.0 11.8 10.9 11.3 11.8 12.1
Net Foreign Direct Investment (% of GDP) -0.1 -0.1 -0.1 -0.1 -0.1 -0.1Fiscal Balance (% of GDP) 0.1 -2.6 -2.8 -2.9 -2.8 -2.7Debt (% of GDP) 42.3 45.1 46.4 46.6 46.8 47.0Primary Balance (% of GDP) 1.1 -1.5 -1.6 -1.6 -1.4 -1.1International poverty rate ($1.9 in 2011 PPP)a,b 0.0 0.0 0.0 0.0 0.0 0.0Lower middle-income poverty rate ($3.2 in 2011 PPP)a,b 0.5 0.4 0.4 0.3 0.3 0.3Upper middle-income poverty rate ($5.5 in 2011 PPP)a,b 7.1 6.5 5.6 4.8 4.2 3.6
Source: World Bank, Poverty & Equity and Macroeconomics, Trade & Investment Global Practices.Notes: e = estimate; f = forecast. a) Calculations based on EAPPOV harmonization, using 2015-SES. Actual data: 2015. nowcast: 2016–2016. Forecast are from 2017 to 2020. b) Projection using neutral distribution (2015) with pass-through = 0.87 based on GDP per capita in constant LCU.
EAST ASIA AND PACIFIC ECONOMIC UPDATE OCTOBER 2018
154 PART III. COUnTRY SUMMARIES AnD KEY InDICATORS: THAILAnD

TIMOR-LESTE
2017Population, million 1.3GDP, current US$ billion 1.6GDP per capita, current US$ 1,249School enrolment, primary (% gross)a 109.5Life expectancy at birth, yearsa 68.9Source: WDI, Macro Poverty Outlook, and official data.Notes: a. Most recent WDI value (2016).
Summary
A sharp decline in public spending weakened economic activity in 2017 and is also affecting 2018. This ‘forced’ fiscal consolidation resulted from a year-long political deadlock that was eventually resolved by mid-2018. With capital spending declining by 57 percent, resilient private consumption and lower imports probably averted a larger economic contraction. The outlook for 2018 remains subdued, but economic activity is expected to pick up in 2019—under a scenario of political stability. Fiscal sustainability and spending efficiency remain key concerns.
Recent Developments
A political stalemate severely constrained public spending—which fell by 25 percent in 2017—mainly through delayed capital investments. This was due to a combination of factors: the 2017 budget was more conservative than the previous budget—in anticipation of mid-year elections—while the ensuing (minority)
government was unable to pass a budget rectification or obtain parliamentary approval for additional Petroleum Fund withdrawals. With a scarce resource envelope, public spending was severely hampered. Since the public sector has a large weight in the economy—accounting for over half of total domestic expenditure—GDP is estimated to have contracted by 4.7 percent. Private consumption was supported by public sector wage growth and social transfer programs, both critical for sustaining household incomes. Imports declined by 7 percent, owing to lower demand for goods and services linked to large public infrastructure projects. Construction, commerce and public services were likely the most affected sectors. Although bank credit to the construction sector grew strongly in late 2017, this was probably due to companies trying to offset government payment delays. Capital spending declined by 57 percent in 2017 with major road projects being delayed. Wages & salaries was the only budget item to increase (by over 10 percent) as civil service salary scales were revised for the first time in several years. Government expenditure remained significantly constrained until now. Petroleum revenues increased considerably, as Petroleum Fund investment returns benefited from a bullish international stock market in 2017—though unlikely to be repeated this year. Paradoxically, this did not prevent the largest expenditure contraction in Timor-Leste’s history—since parliamentary approval is required to transfer petroleum revenues to the state budget. Domestic tax revenues declined by about 8 percent in 2017, mainly due to lower withholding tax receipts from public infrastructure projects, and are declining further in 2018. Domestic resource mobilization remains weak, with a tax-to-GDP ratio below 12 percent. The overall balance improved due to the ‘forced’ fiscal consolidation. Consumer price inflation increased but remains low at 2.6 percent in the second quarter of 2018 (year-on-year) due to a combination of food, tobacco and education price increases. Because food has a large weight in the consumption basket and much of it is imported, international food prices and exchange rates have a strong impact on overall domestic inflation. Credit to the private sector grew substantially in 2017, likely because businesses dependent on government contracts faced severe cashflow problems. Credit growth
155
NAVIGATING UNCERTAINTY
PART III. COUnTRY SUMMARIES AnD KEY InDICATORS: TIMOR-LESTE

collapsed in the first half of 2018, predominantly due to lower individual borrowing. A declining loan-to-deposit ratio and evidence of excess liquidity in the banking sector suggest that financial intermediation remains weak. The recently approved government program envisages the establishment of a state-owned development bank (BDTL) to enhance access to credit. The current account improved in 2017, as income from the Joint Petroleum Development Area (JPDA) increased and total imports declined. Non-oil exports remain small—below $60 million—with coffee and travel services accounting for most export earnings. (Oil proceeds are not accounted as exports but rather as primary income in the balance of payments.) Portfolio investment has dwindled through time as large outflows—mainly relating to Petroleum Fund investments abroad—turned into inflows (divestment), which has financed the current account deficit to a significant extent. Foreign direct investment is relatively small and has declined in recent years. Improving the business environment will be critical to attract foreign investors in strategic economic sectors, such as tourism. Despite the economic downturn, poverty levels are unlikely to have changed significantly. Household consumption was sustained by ringfenced social transfer programs and public wage increases—the latter accounting for a considerable proportion of total wage employment.
Outlook
The economic outlook for 2018 remains uncertain, partly hinging on the execution of the state budget and consumer confidence. The large expenditure increases planned for the last four months of the year present a significant challenge. Moreover, some funds will be used to settle previous financial commitments for activities already undertaken (expenditure arrears). GDP is forecast to grow by 0.8 percent in 2018. In the medium-term, economic growth is anticipated to recover by 2019. Expenditures will reach pre-crisis levels by 2019 and moderate in 2020 due to the expected conclusion of key capital projects—mostly relating to roads. Nonetheless, new projects might be brought into the pipeline, especially if the policy of
frontloading strategic capital investments continues. Growth is forecast to accelerate to 3.3 percent in 2019 and 4.9 percent in 2020. This rebound would be underpinned by stronger public and foreign investments, as well as renewed consumer and business confidence—which would also support credit growth. Inflation is expected to remain below the Strategic Development Plan’s target range—4 to 6 percent—given the strength of the US dollar and expected stable food prices. Current account deficits are likely to be financed by additional Petroleum Fund divestments. Poverty trends are difficult to forecast due to the lack of recent data.
Risks and Challenges
Fiscal sustainability and the quality of public spending remain a key concern. Offshore petroleum production from the remaining field in JPDA is expected to cease by 2023, while the prospective Greater Sunrise Liquified natural Gas development is unlikely to be fully operational in the next decade. Meanwhile, systematic excess withdrawals are depleting the Petroleum Fund through a strategy of expenditure frontloading. Limiting withdrawals to the Estimated Sustainable Income (ESI) and improving domestic resource mobilization would simultaneously support fiscal sustainability, spending efficiency and accountability. These improvements would be critical to further reduce poverty.
The domestic political situation may pose the greatest (short-term) risk to the economy. Stability within the government coalition is a prerequisite for a smooth and effectual implementation of the government program, while potential frictions could lead to further political and economic instability. A productive relationship between the President and the new government is also of vital importance. Approval of the 2019 budget will be critical for a new period of stability.
EAST ASIA AND PACIFIC ECONOMIC UPDATE OCTOBER 2018
156 PART III. COUnTRY SUMMARIES AnD KEY InDICATORS: TIMOR-LESTE

Figure 1. Real growth and contributions to real GDP growth Figure 2. Fiscal aggregatesPercent, percentage points Percent of GDP
10
5
0
-5
-10
2015 2016 2017e 2018f 2019f 2020f
150
100
50
0
-50
-100
-150
2015 2016 2017e 2018f 2019f 2020f
J Consumption J Investment J Change in inventory J Net exports Q Growth J Recurrent expenditure J Capital expenditure J Total revenue ▬ Fiscal balance
▬ Fiscal balance (ESJ adjusted)
Sources: Ministry of Finance and World Bank staff estimates. Sources: Ministry of Finance and World Bank staff estimates.
TIMOR-LESTE Selected Indicators 2015 2016 2017e 2018f 2019f 2020f
Real GDP growth, at constant market prices 4.0 5.3 -4.7 0.8 3.3 4.9Private Consumption 0.2 6.0 4.8 1.9 4.4 4.7Government Consumption 3.2 -0.2 -3.8 0.7 1.0 1.0Gross Fixed Capital Investment -3.6 16.0 -23.8 3.9 19.9 9.4Exports, Goods and Services -29.2 15.2 -2.2 7.1 13.2 15.6Imports, Goods and Services -8.4 8.1 -7.4 1.8 12.3 4.7
Real GDP growth, at constant factor prices 5.8 4.9 -4.6 0.8 3.2 4.9Agriculture -4.3 3.0 -1.0 1.1 1.2 1.2Industry 22.2 7.6 -5.0 0.6 4.6 4.8Services 4.7 4.7 -5.5 0.8 3.4 6.0
Inflation (Consumer Price Index) 0.6 -1.3 0.6 1.2 2.5 3.3Net Foreign Direct Investment (% of GDP) 1.9 -0.4 0.4 1.2 2.1 2.0
Fiscal Balance (% of GDP)a -13.0 -32.9 52.7 23.1 7.9 -7.8ESI-adjusted balance (% of GDP)a -42.9 -64.1 -43.2 -26.4 -32.0 -35.3
Source: World Bank, Poverty & Equity and Macroeconomics, Trade & Investment Global Practices.Notes: e = estimate, f = forecast. a) The ESI-adjusted budget balance is calculated as domestic revenue plus ESI (sustainable disbursements from the Petroleum Fund) less total expenditure.
157
NAVIGATING UNCERTAINTY
PART III. COUnTRY SUMMARIES AnD KEY InDICATORS: TIMOR-LESTE

VIETNAM
2017Population, million 93.7GDP, current US$ billion 223.9GDP per capita, current US$ 2,391International poverty rate ($1.9)a 2.0Lower middle-income poverty rate ($3.2)a 8.2Upper middle-income poverty rate ($5.5)a 28.7Gini indexa 35.3School enrollment, primary (% gross)b 110.0Life expectancy at birth, yearsb 76.3Source: WDI, Macro Poverty Outlook, and official data.Notes: a. Most recent value (2016), 2011 PPPs. b. Most recent WDI value (2016).
Summary
Vietnam’s economy continues to perform well, propelled by the sustained global recovery and continued domestic reforms. Robust growth is boosting job creation and income growth, leading to broad-based welfare gains and poverty reduction. Despite improved short term prospects, external and domestic risks and longer-term challenges remain. These include risks of global financial volatility and rising protectionism as well as domestic vulnerabilities associated with remaining banking sector weaknesses, elevated public debt and limited fiscal space, and subdued productivity growth.
Recent Developments
Vietnam’s gross domestic product (GDP) is estimated to have increased by 7.1 percent (y/y) in the first half of 2018.
GDP growth was broad-based, led by strong manufacturing growth of 13 percent, bolstered by strong external demand. Agriculture output growth also accelerated to 3.9 percent largely due to strong performance in the export oriented fishery sub-sector. Meanwhile, expansion of the service sector remained robust at 6.9 percent underpinned by strong underlying retail sector growth supported by buoyant private consumption and record tourist arrivals.
Strong GDP growth was accompanied by moderate inflation and a strengthening external position. Annual average headline CPI rose 3.5 percent (below the government’s target of 4 percent this year) while core inflation hovered around 1.4 percent in the first seven months of 2018.
Robust economic performance is underpinned by a Government commitment to macroeconomic stability and private sector-led growth. Economic policies continue to focus on market-oriented reforms to reduce the economic role of the state, boost business conditions and open the economy for more private investment.
Vietnam’s dynamic economy continues to translate into broad-based welfare gains and poverty reduction. Expanding wage employment and rising real wages have been the underlying drivers of poverty reduction, accounting for more than half of the poverty reduction since 2014. Evidence points to a continued improvement in job creation and income growth. More than 900,000 wage jobs were created in 2017 and real wages further increased by 4.3 percent, driven by strong labor demand in the manufacturing, construction and service sectors. Poverty is thus projected to continue declining at a high rate. Estimates of poverty based on the international lower middle-income poverty line ($3.2 PPP 2011) are projected to have declined from around 8.2 percent in 2016 to 6.4 percent in 2018.
Vietnam’s exports continued to perform strongly, benefiting from stronger external demand and expanding capacity, driven by robust FDI in export-oriented manufacturing. The value of merchandise exports from Vietnam increased 16 percent in January—July 2018. At the same time,
EAST ASIA AND PACIFIC ECONOMIC UPDATE OCTOBER 2018
158 PART III. COUnTRY SUMMARIES AnD KEY InDICATORS: VIETnAM

import turnover moderated to 11.1 percent resulting in a trade and current account surplus. Supported by a favorable balance of payment, the State Bank of Vietnam built up the foreign reserves, reaching a record level of US$64 billion in June.
Amidst moderate price pressures, monetary and credit policies continued to balance stability and growth objectives. Credit growth remained elevated at around 17 percent (y/y) in June 2018. Such rapid credit expansion may induce excessive risk taking and poor credit allocation and lead to associated deterioration in asset quality.
Fiscal consolidation is underway, but the quality and sustainability of the adjustment could be improved. After public debt stabilized in 2017, maintaining fiscal discipline remains a priority. An expenditure-led adjustment reduced the overall fiscal deficit to about 4.6 percent of GDP in 2017. This together with a reduction in government guarantees and significant privatization proceeds resulted in a decline in public-debt-to-GDP ratio to an estimated 58.9 percent in 2017 from 60 percent in 2016 (IMF GFS definition). During first half of 2018, the government continued to contain expenditure growth to offset relatively weak revenue performance.
Outlook
Vietnam’s medium-term outlook has improved further. Real GDP is now projected to expand by 6.8 percent in 2018 (up from 6.5 percent in our previous projection) before moderating to 6.6 percent in 2019 and 6.5 percent in 2020 due to the envisaged cyclical moderation of global demand. Despite reduced slack in the economy, we expect inflation to remain around the 4 percent government target, predicated on some tightening of the monetary stance to counter price pressures emanating from domestic input price pressures and rising global commodity prices. On the external front, we expect the current account balance to remain in surplus, but start narrowing from 2019 reflecting widening deficits on the
income and services accounts. Fiscal consolidation is expected to contain public debt over the projection period.
Risks and Challenges
Despite improved short term prospects, risks remain significant. Domestically, a slow-down in restructuring of the SOE and the banking sectors could adversely impact the macro-financial situation, undermine growth prospects, and create large public-sector liabilities. External risks include escalating trade protectionism, heightened global and regional geopolitical uncertainty, and continuing tightening of global financing conditions which could lead to disorderly financial market movements.
Policymakers should take advantage of the favorable economic environment to push ahead with policies that increase macroeconomic resilience and lay the foundation for sustained growth in the future. Monetary policy should tighten liquidity in the banking sector to align interbank rates with policy interest rates and to bring credit growth in line with fundamentals. This could be supported by macro-prudential measures aimed at preventing excessive credit flows to high risk sectors such as real estate. Furthermore, steps to enhance banking supervision, resolve NPLs, and reinforce capital buffers would not only reduce risks to financial stability but also improve financial intermediation which in turn would contribute to higher medium-term growth. Further flexibility in the exchange rate management could help mitigate risks of external volatility.
On the fiscal front, further deficit reduction should be underpinned by a comprehensive strategy to enhance spending efficiency and sustain medium-term revenue potential. Prudent macroeconomic policies should be accompanied by continued focus on comprehensive and deep structural reforms, including regulatory reforms to remove barriers to and reduce the cost of private sector activity, human capital and high-quality infrastructure investments, and further reforms to enhance productivity of the SOE sector. Several provinces in Vietnam have been
159
NAVIGATING UNCERTAINTY
PART III. COUnTRY SUMMARIES AnD KEY InDICATORS: VIETnAM

affected by storms and flooding recently. This continues to be a source of vulnerability for Vietnamese households. Thus, investing in climate change mitigation measures remains a priority for reducing households’ vulnerability to shocks.
Figure 1. Real GDP growth and contribution to real GDP growth
Figure 2. Poverty rate and real GDP per capita
Percent, percentage points Poverty rate, percent GDP per capita, constant VND, in million
10
8
6
4
2
-2
0
2013 2016 2017e 2018f20152014
50
40
30
20
10
0
2010 2012 2016 20182014 2020
100
90
80
70
60
50
40
30
20
10
0
J Gross capital formation J Government consumption J Household consumption ▬ $1.9/day PPP ▬ $3.2/day PPP ▬ $5.5/day PPP ▬ GDP per capita, rhs
J Net exports of GNFS ▬ GDP growth
Sources: Official data and Macro Poverty Outlook. Sources: Official data and Macro Poverty Outlook.
VIETNAM Selected Indicators 2015 2016 2017 2018e 2019f 2020f
Real GDP growth, at constant market prices 6.7 6.2 6.8 6.8 6.6 6.5Private Consumption 9.3 7.3 7.4 7.3 7.2 7.2Government Consumption 7.0 7.5 4.9 5.8 5.8 6.0Gross Fixed Capital Investment 9.4 9.9 9.4 8.8 8.4 8.0Exports, Goods and Services 12.6 13.9 14.9 14.0 14.1 14.0Imports, Goods and Services 18.1 15.3 15.3 14.3 14.2 14.1
Real GDP growth, at constant factor prices 6.6 6.4 6.7 6.8 6.6 6.5Agriculture 2.4 1.3 2.8 2.1 2.0 2.0Industry 9.6 7.9 8.0 8.1 8.0 8.0Services 5.8 7.3 7.1 7.4 6.9 6.6
Inflation (Consumer Price Index) 0.9 3.2 3.5 4.0 4.0 4.0Current Account Balance (% of GDP) 0.1 2.9 2.2 2.2 2.1 1.8Fiscal Balance (% of GDP) -5.5 -4.9 -4.6 -4.5 -4.4 -4.4Debt (% of GDP) 57.6 60.0 58.9 58.3 58.0 57.6Primary Balance (% of GDP) -3.5 -2.8 -2.6 -2.6 -2.5 -2.4International poverty rate ($1.9 in 2011 PPP)a,b .. 2.0 1.6 1.3 1.0 0.8Lower middle-income poverty rate ($3.2 in 2011 PPP)a,b .. 8.2 7.4 6.4 5.6 4.7Upper middle-income poverty rate ($5.5 in 2011 PPP)a,b .. 28.7 25.6 22.8 20.5 18.4
Source: World Bank, Poverty & Equity and Macroeconomics, Trade & Investment Global Practices.Notes: e = estimate, f = forecast. a) Calculations based on EAPPOV harmonization, using 2016-VHLSS. Actual data: 2016. nowcast: 2017–2018. Forecast are from 2019 to 2020. b) Projection using neutral distribution (2016) with pass-through = 1 based on GDP per capita in constant LCU.
EAST ASIA AND PACIFIC ECONOMIC UPDATE OCTOBER 2018
160 PART III. COUnTRY SUMMARIES AnD KEY InDICATORS: VIETnAM


WORLD BANK EAST ASIA AND PACIFIC ECONOMIC UPDATE OCTOBER 2018