navigating choppy waters opportunities and … choppy waters – opportunities and challenges in the...
TRANSCRIPT
www.nsr.com © 2016 – NSR
Claude Rousseau
Research Director
Northern Sky Research
Navigating Choppy Waters – Opportunities and Challenges in the Shipping Industry
Intelsat Briefing, Digital Ship @Posidonia
8th June 2016
Athens, Greece
www.nsr.com © 2016 – NSR
About NSR
Maritime Satcom Market
• Addressable Markets
• Market Overview
• Broadband Maritime Markets
• Similarities with Aircraft Connectivity
• Merchant Maritime – Satcom Value Proposition
Challenges & Opportunities
• Applications
• Revenues Opportunities
• Non-Broadband != ‘Unconnected’
• Bigger & Better
• Addressable Markets and Forecasts
• Market Outlook and Strategic considerations
Agenda
June 2016 NSR Presentation 2
www.nsr.com © 2016 – NSR
About NSR

www.nsr.com © 2016 – NSR
About NSR
Intelsat Briefing @ Digital Ship Posidonia
NSR is a Global Leader in Satellite Market Research and Consulting
Founded in 2000, NSR specializes in analysis of growth
opportunities across the satellite industry
NSR’s expert consultants are located globally and possess over 140 years of combined
industry experience.
Multi-Client Reports on Various Satellite Topics
Extensive Client Research, Consulting and Advisory Services
“Holistic” approach to research enables NSR to anticipate trends with a higher
degree of confidence and precision than the competition and stay ahead of the curve.
www.nsr.com
June 2016 NSR Presentation 4
www.nsr.com © 2016 – NSR
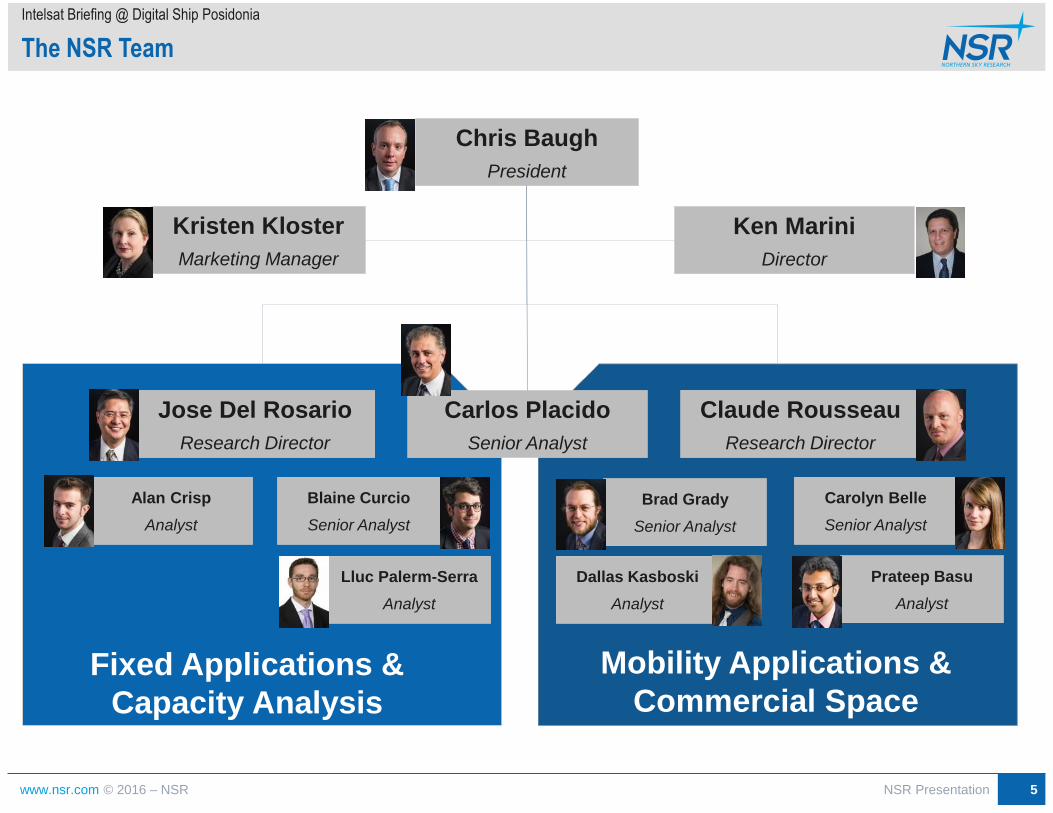
Fixed Applications &
Capacity Analysis
June 2016
The NSR Team
Intelsat Briefing @ Digital Ship Posidonia
Chris Baugh
President
Carlos Placido
Senior Analyst
Claude Rousseau
Research Director
Jose Del Rosario
Research Director
Kristen Kloster
Marketing Manager
Ken Marini
Director
Alan Crisp
Analyst
Blaine Curcio
Senior Analyst
Lluc Palerm-Serra
Analyst
Brad Grady
Senior Analyst
Dallas Kasboski
Analyst
Prateep Basu
Analyst
Mobility Applications &
Commercial Space
Carolyn Belle
Senior Analyst
NSR Presentation 5

www.nsr.com © 2016 – NSR
NSR Market Research Reports
Intelsat Briefing @ Digital Ship Posidonia
NSR’s reports present an independent view of the markets
It is a tool for strategic business planning.
Our equal emphasis on both market based issues and technology trends allow
our clients to create comprehensive plans for the future.
Topics:
• Global Satellite Capacity & Supply Demand
• Government and Military Satellite Communications
• Maritime Satellite Services
• Aeronautical Satcom Markets
• Linear TV
• Wireless Backhaul via Satellite
• Global Satellite Manufacturing and Launch Markets
• Oil and Gas via Satellite
• Satellite Operator Financial Analysis
• VSAT and Broadband Satellite Markets
• M2M and IoT via Satellite Markets
• Nano and Microsatellite Markets
• Global Satellite-Based Earth Observation
• Flat Panel Satellite Antennas
June 2016 NSR Presentation 6
www.nsr.com © 2016 – NSR
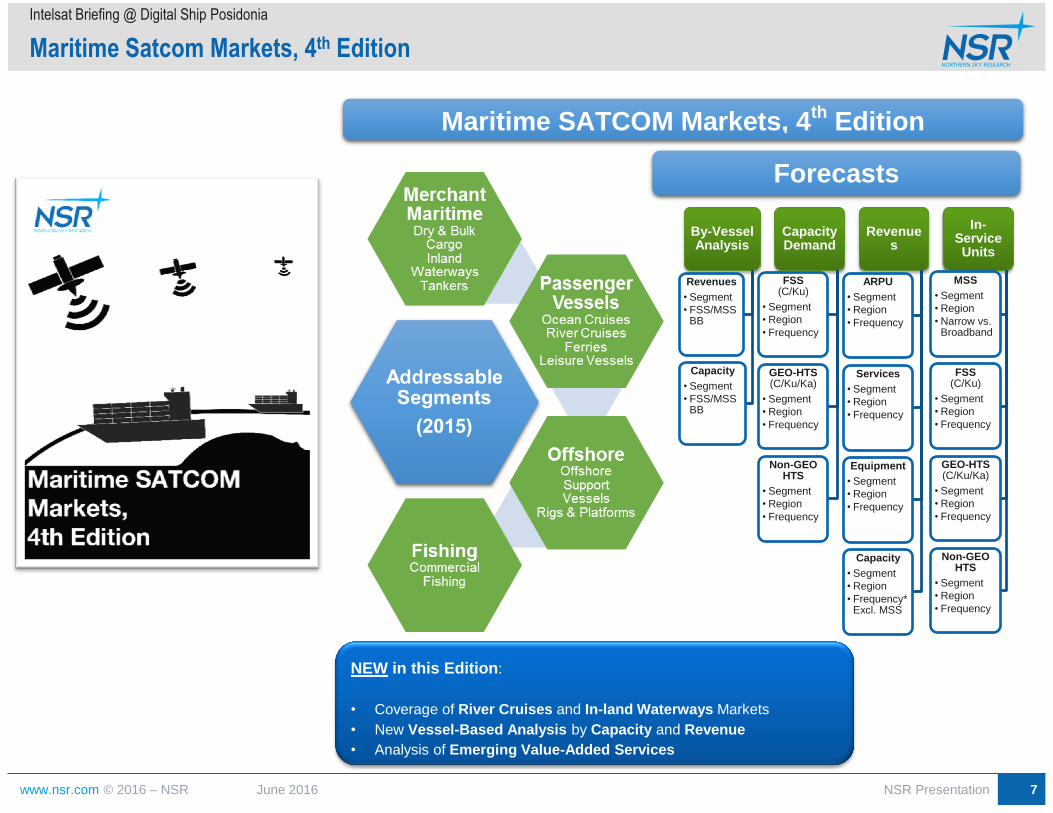
Maritime Satcom Markets, 4th Edition
Intelsat Briefing @ Digital Ship Posidonia
June 2016
Off
sh
ore
NSR Presentation 7
NEW in this Edition:
• Coverage of River Cruises and In-land Waterways Markets
• New Vessel-Based Analysis by Capacity and Revenue
• Analysis of Emerging Value-Added Services
Maritime SATCOM Markets, 4th
Edition
Forecasts
In-Service Units
MSS
• Segment
• Region
• Narrow vs. Broadband
FSS (C/Ku)
• Segment
• Region
• Frequency
GEO-HTS (C/Ku/Ka)
• Segment
• Region
• Frequency
Non-GEO HTS
• Segment
• Region
• Frequency
Revenues
ARPU
• Segment
• Region
• Frequency
Services
• Segment
• Region
• Frequency
Equipment
• Segment
• Region
• Frequency
Capacity
• Segment
• Region
• Frequency* Excl. MSS
Capacity Demand
FSS (C/Ku)
• Segment
• Region
• Frequency
GEO-HTS (C/Ku/Ka)
• Segment
• Region
• Frequency
Non-GEO HTS
• Segment
• Region
• Frequency
By-Vessel Analysis
Revenues
• Segment
• FSS/MSS BB
Capacity
• Segment
• FSS/MSS BB
www.nsr.com © 2016 – NSR
Maritime Satcom Markets
www.nsr.com © 2016 – NSR
Addressable Market
Intelsat Briefing @ Digital Ship Posidonia
June 2016
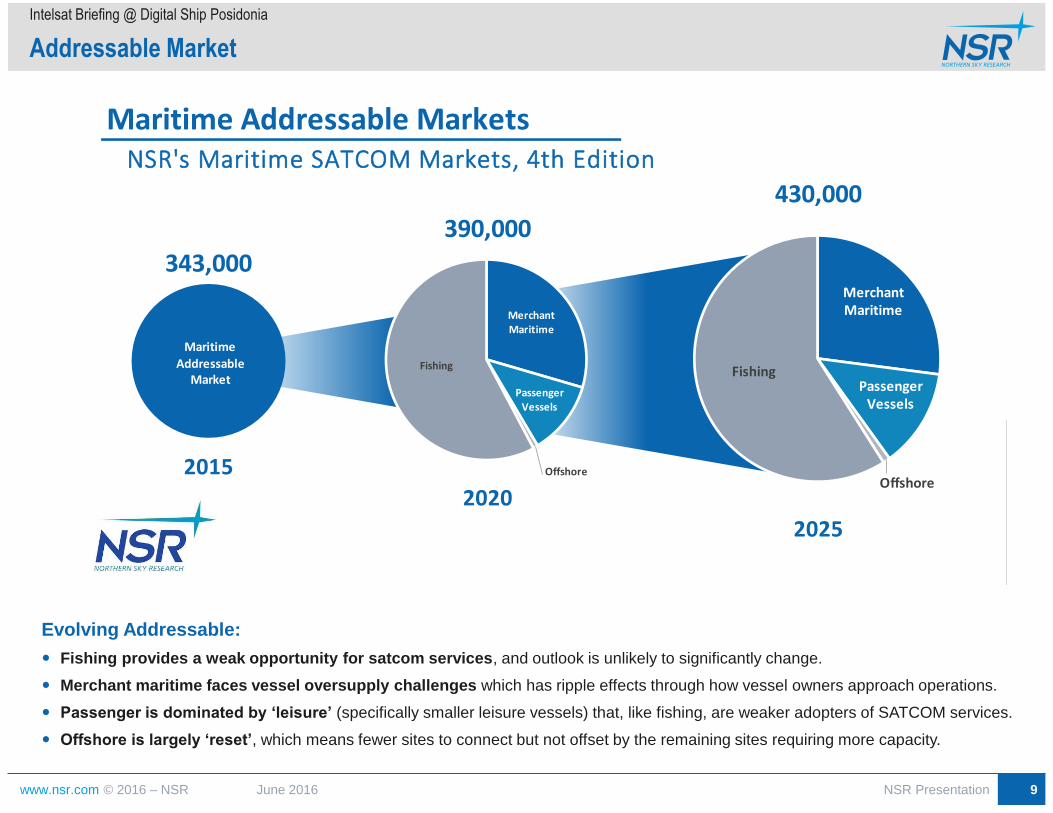
Maritime Addressable MarketsNSR's Maritime SATCOM Markets, 4th Edition
430,000
390,000
343,000
2015
2020
2025
Maritime
Addressable Market
Merchant Maritime
Passenger Vessels
Offshore
Fishing
Merchant Maritime
Passenger Vessels
Offshore
Fishing
Off
sh
ore
Evolving Addressable:
Fishing provides a weak opportunity for satcom services, and outlook is unlikely to significantly change.
Merchant maritime faces vessel oversupply challenges which has ripple effects through how vessel owners approach operations.
Passenger is dominated by ‘leisure’ (specifically smaller leisure vessels) that, like fishing, are weaker adopters of SATCOM services.
Offshore is largely ‘reset’, which means fewer sites to connect but not offset by the remaining sites requiring more capacity.
NSR Presentation 9
www.nsr.com © 2016 – NSR
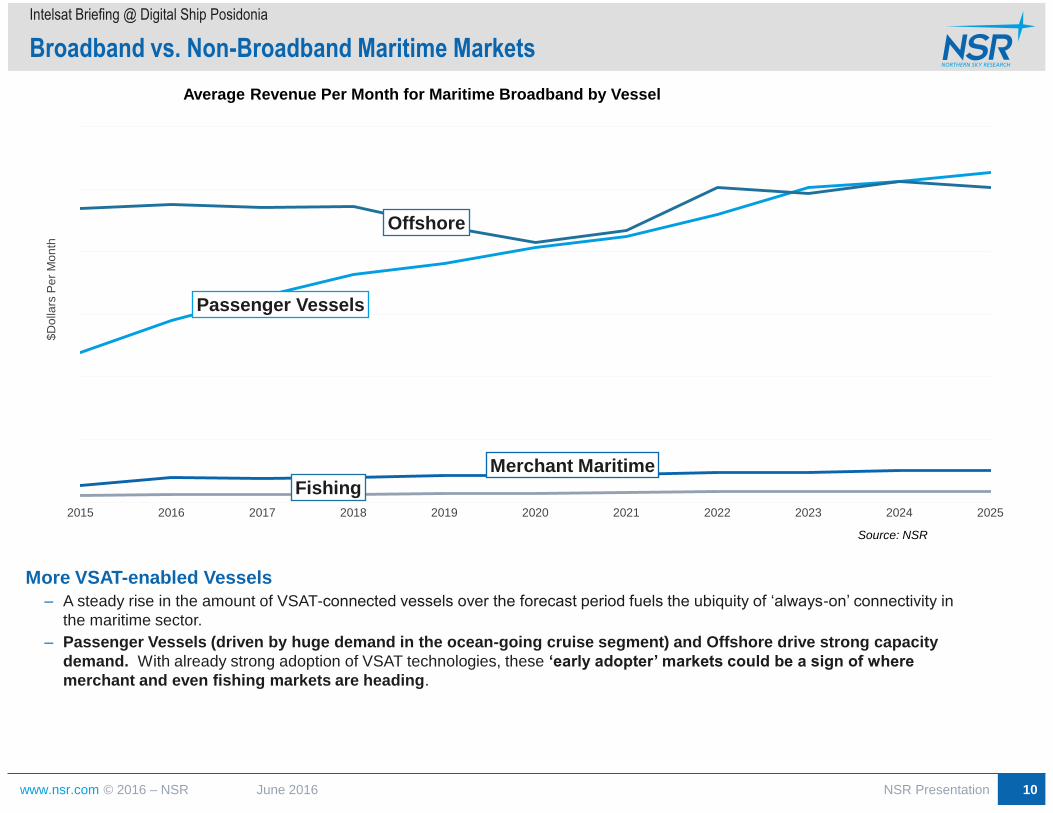
More VSAT-enabled Vessels
– A steady rise in the amount of VSAT-connected vessels over the forecast period fuels the ubiquity of ‘always-on’ connectivity in
the maritime sector.
– Passenger Vessels (driven by huge demand in the ocean-going cruise segment) and Offshore drive strong capacity
demand. With already strong adoption of VSAT technologies, these ‘early adopter’ markets could be a sign of where
merchant and even fishing markets are heading.
Broadband vs. Non-Broadband Maritime Markets
Intelsat Briefing @ Digital Ship Posidonia
June 2016
Merchant Maritime
Passenger Vessels
Offshore
Fishing
2015 2016 2017 2018 2019 2020 2021 2022 2023 2024 2025
$D
olla
rs P
er
Mo
nth
Average Revenue Per Month for Maritime Broadband by Vessel
Source: NSR
NSR Presentation 10

www.nsr.com © 2016 – NSR
Similarities with Aircraft Connectivity
Intelsat Briefing @ Digital Ship Posidonia
June 2016 NSR Presentation 11
Source: maritimetraffic.com Source: ESA
Aeronautical Traffic Patterns Maritime Traffic Patterns
Aero+Maritime routes
will continue to push
high-utilization rates for
HTS spot-beam
capacity.. But each
vertical has their own
individual ‘hot-spots’.
For Maritime,
Africa+IOR is a unique
area for SPs to acquire
capacity.
For Aero, Northern
Atlantic Route will see
‘heavy’ traffic
Maritime-
Heavy Area
Aero-Heavy
Area
www.nsr.com © 2016 – NSR
Similarities with Aircraft Connectivity
Intelsat Briefing @ Digital Ship Posidonia
June 2016
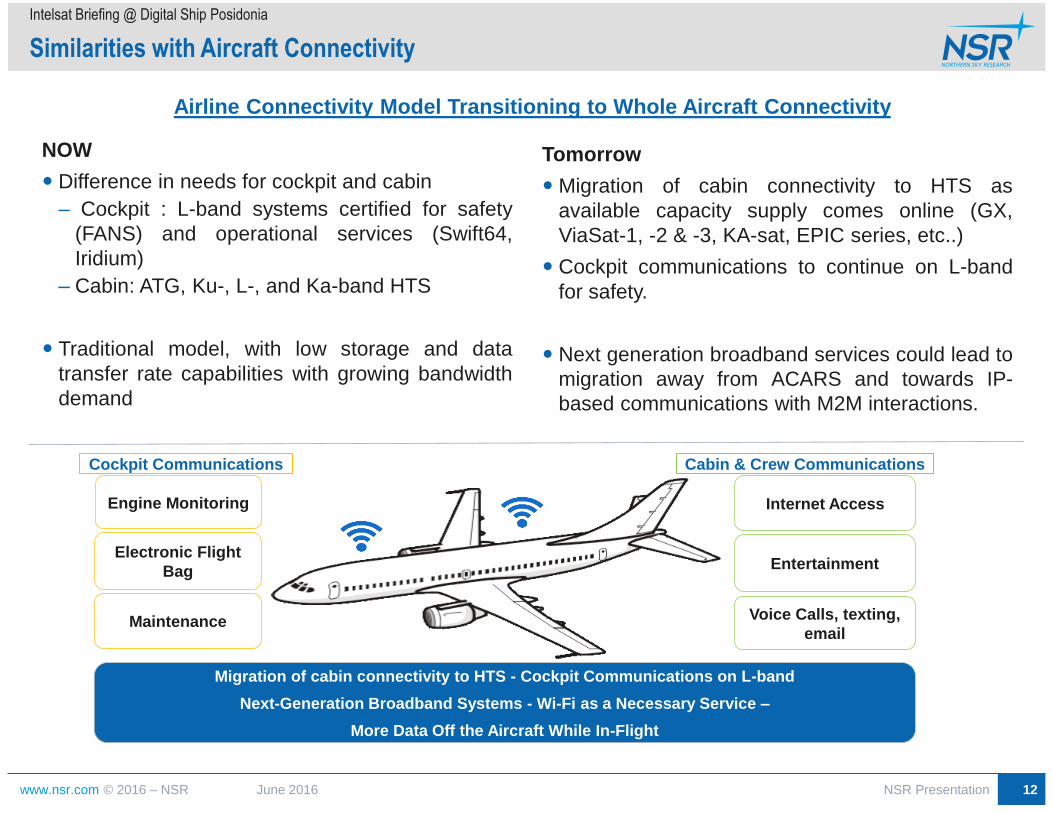
Airline Connectivity Model Transitioning to Whole Aircraft Connectivity
NOW
Difference in needs for cockpit and cabin
– Cockpit : L-band systems certified for safety
(FANS) and operational services (Swift64,
Iridium)
– Cabin: ATG, Ku-, L-, and Ka-band HTS
Traditional model, with low storage and data
transfer rate capabilities with growing bandwidth
demand
Tomorrow
Migration of cabin connectivity to HTS as
available capacity supply comes online (GX,
ViaSat-1, -2 & -3, KA-sat, EPIC series, etc..)
Cockpit communications to continue on L-band
for safety.
Next generation broadband services could lead to
migration away from ACARS and towards IP-
based communications with M2M interactions.
Electronic Flight
Bag
Internet Access
Entertainment
Engine Monitoring
Maintenance
Cockpit Communications Cabin & Crew Communications
Migration of cabin connectivity to HTS - Cockpit Communications on L-band
Next-Generation Broadband Systems - Wi-Fi as a Necessary Service –
More Data Off the Aircraft While In-Flight
Voice Calls, texting,
NSR Presentation 12
www.nsr.com © 2016 – NSR
State of the Market
Intelsat Briefing @ Digital Ship Posidonia
June 2016 NSR Presentation 13
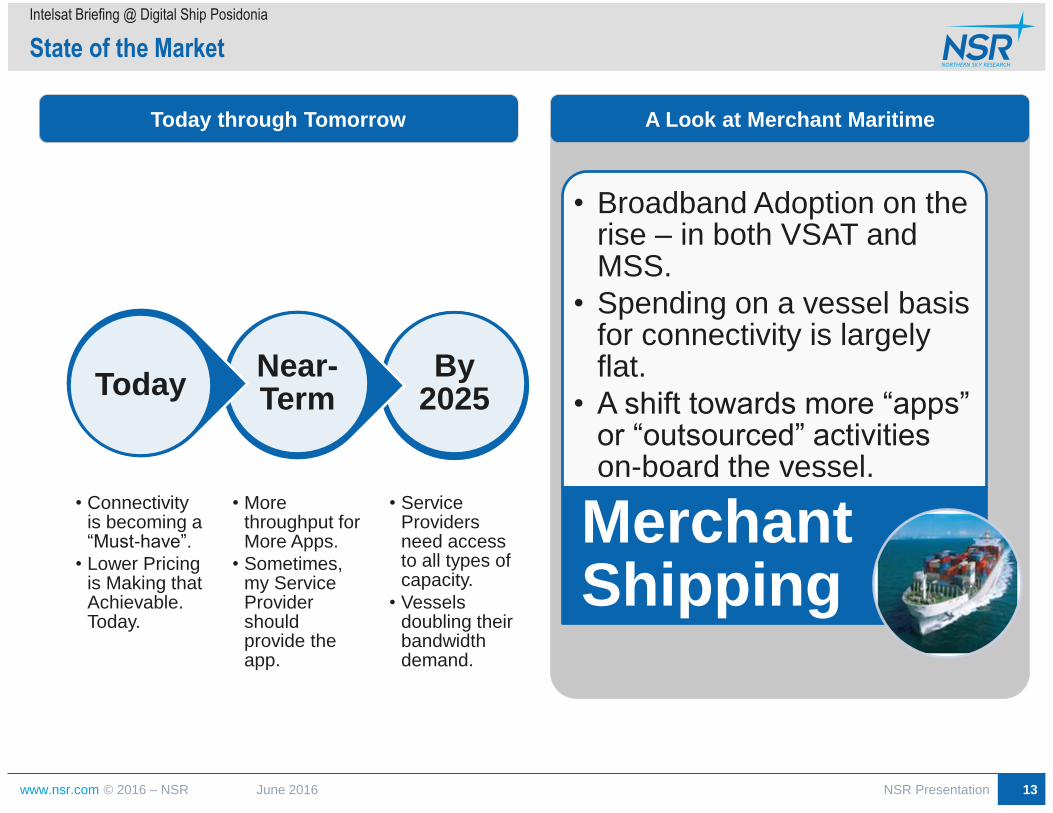
By 2025
• Service Providers need access to all types of capacity.
• Vessels doubling their bandwidth demand.
Near-Term
• More throughput for More Apps.
• Sometimes, my Service Provider should provide the app.
Today
• Connectivity is becoming a “Must-have”.
• Lower Pricing is Making that Achievable. Today.
Today through Tomorrow
• Broadband Adoption on the rise – in both VSAT and MSS.
• Spending on a vessel basis for connectivity is largely flat.
• A shift towards more “apps” or “outsourced” activities on-board the vessel.
Merchant Shipping
A Look at Merchant Maritime

www.nsr.com © 2016 – NSR
Merchant Maritime – Satcom Value Proposition
June 2016
ERP
Business Optimization
Vessel Monitoring Crew Calling
Streaming Media Crew Internet
VOD
Live TV E-Learning
Revenue and Capacity Revenue Opportunities Capacity Opportunities
Intelsat Briefing @ Digital Ship Posidonia
2015 2025
Merchant In-service Units MSS-BB
Non-GEO HTS
GEO-HTS, Ka-Band
GEO-HTS, Ku-band
GEO-HTS, C-band
FSS Ku-band
FSS C-band0% 10% 20% 30% 40% 50% 60% 70% 80% 90% 100%
Broadband vs. Non-Broadband Maritime Vessels
2015 Additions through 2025 Non-Broadband Vessels Source: NSR
NSR Presentation 14

www.nsr.com © 2016 – NSR
Challenges & Opportunities
www.nsr.com © 2016 – NSR
Applications Continues to Grow More Complex
Intelsat Briefing @ Digital Ship Posidonia
June 2016
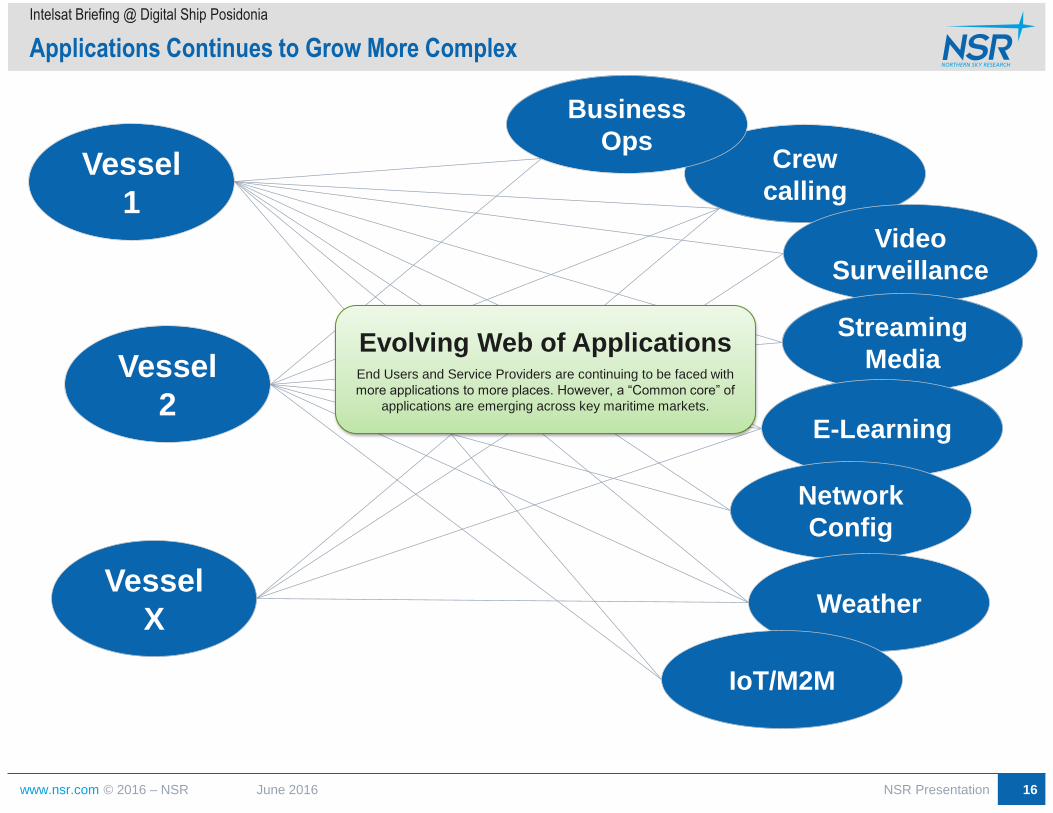
Vessel
1
Vessel
2
Crew
calling
Video
Surveillance
Streaming
Media
Business
Ops
E-Learning
Network
Config
Weather
IoT/M2M
Vessel
X
Evolving Web of Applications End Users and Service Providers are continuing to be faced with
more applications to more places. However, a “Common core” of
applications are emerging across key maritime markets.
NSR Presentation 16
www.nsr.com © 2016 – NSR
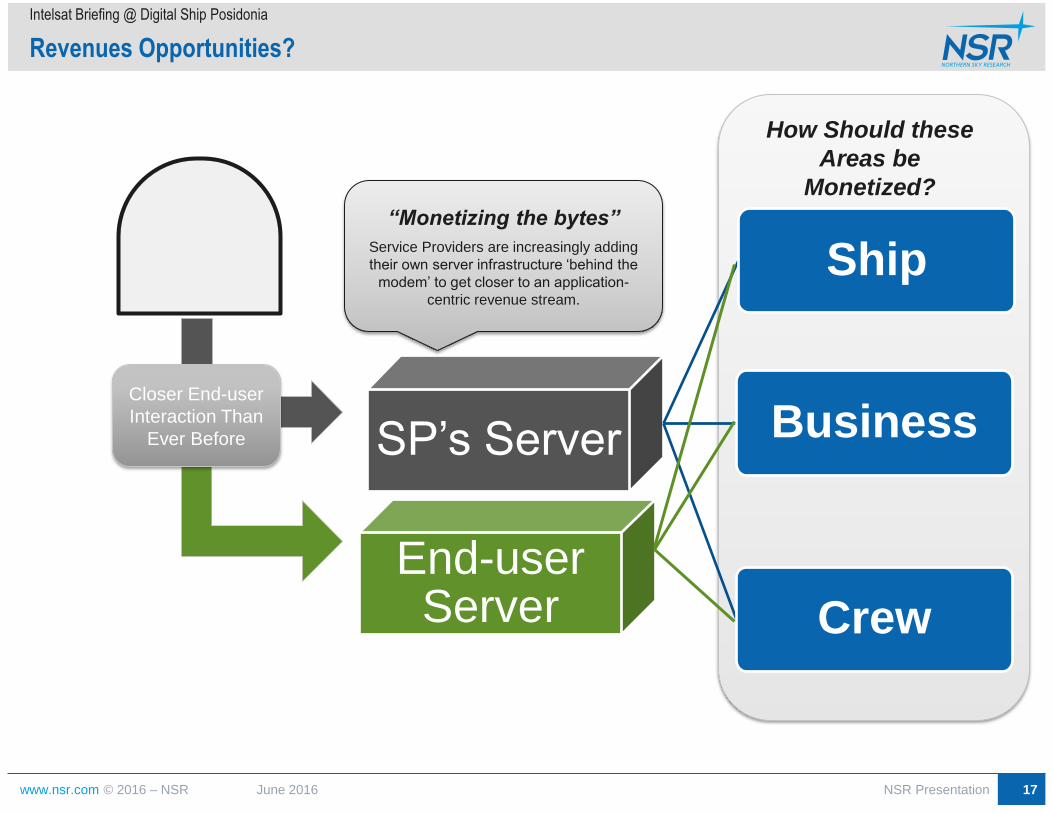
SP’s Server
Ship
Business
Crew
End-user Server
Revenues Opportunities?
Intelsat Briefing @ Digital Ship Posidonia
June 2016
How Should these
Areas be
Monetized?
“Monetizing the bytes”
Service Providers are increasingly adding
their own server infrastructure ‘behind the
modem’ to get closer to an application-
centric revenue stream.
Closer End-user
Interaction Than
Ever Before
NSR Presentation 17
www.nsr.com © 2016 – NSR
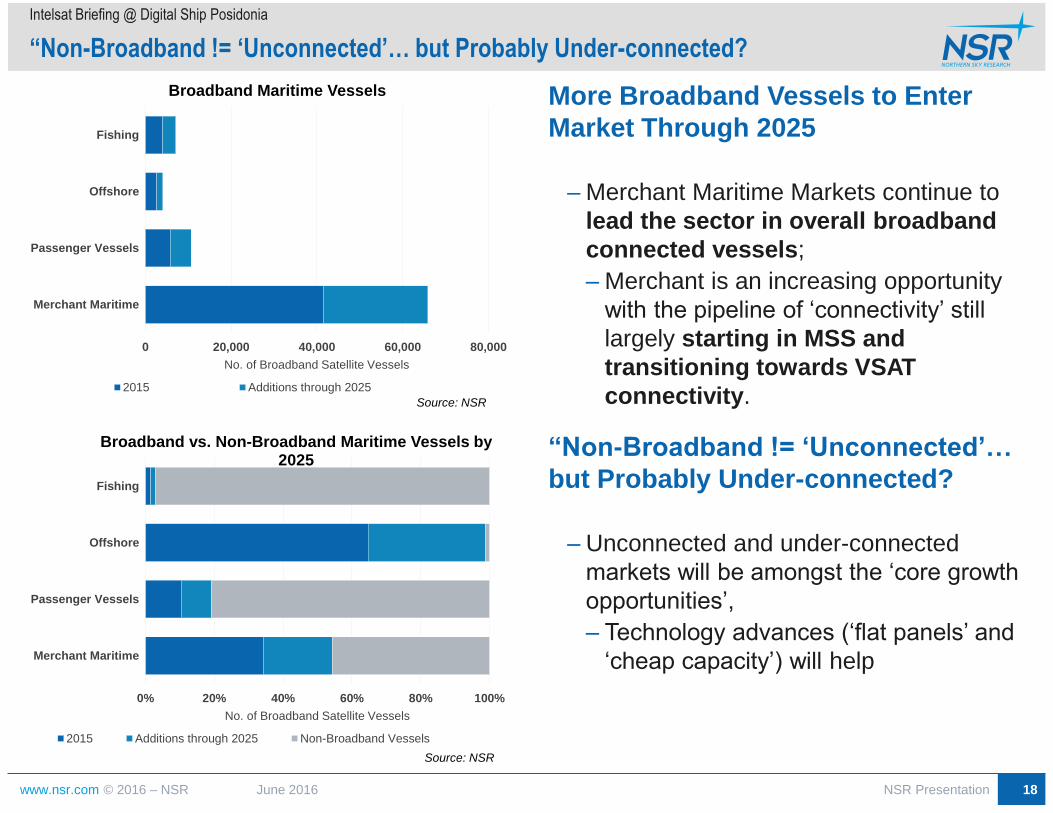
0 20,000 40,000 60,000 80,000
Merchant Maritime
Passenger Vessels
Offshore
Fishing
No. of Broadband Satellite Vessels
Broadband Maritime Vessels
2015 Additions through 2025
Source: NSR
More Broadband Vessels to Enter
Market Through 2025
– Merchant Maritime Markets continue to
lead the sector in overall broadband
connected vessels;
– Merchant is an increasing opportunity
with the pipeline of ‘connectivity’ still
largely starting in MSS and
transitioning towards VSAT
connectivity.
“Non-Broadband != ‘Unconnected’…
but Probably Under-connected?
– Unconnected and under-connected
markets will be amongst the ‘core growth
opportunities’,
– Technology advances (‘flat panels’ and
‘cheap capacity’) will help
“Non-Broadband != ‘Unconnected’… but Probably Under-connected?
Intelsat Briefing @ Digital Ship Posidonia
June 2016
0% 20% 40% 60% 80% 100%
Merchant Maritime
Passenger Vessels
Offshore
Fishing
No. of Broadband Satellite Vessels
Broadband vs. Non-Broadband Maritime Vessels by 2025
2015 Additions through 2025 Non-Broadband Vessels
Source: NSR
NSR Presentation 18
www.nsr.com © 2016 – NSR
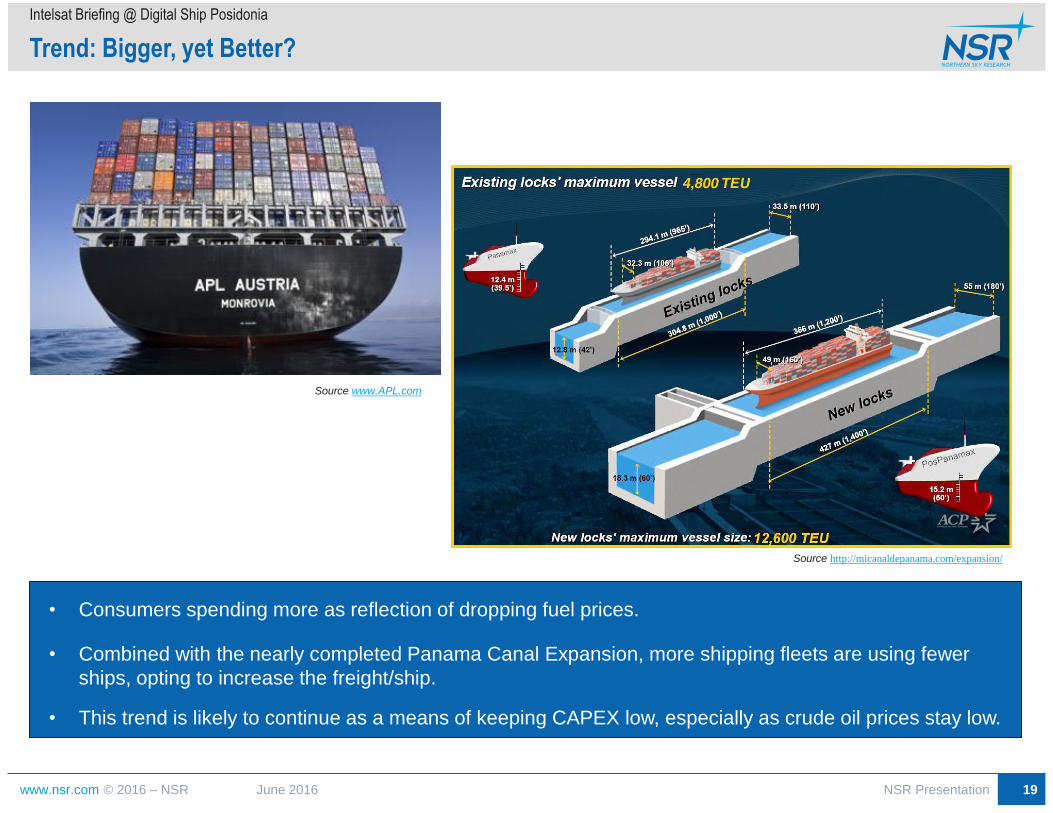
Trend: Bigger, yet Better?
Intelsat Briefing @ Digital Ship Posidonia
June 2016
• Consumers spending more as reflection of dropping fuel prices.
• Combined with the nearly completed Panama Canal Expansion, more shipping fleets are using fewer
ships, opting to increase the freight/ship.
• This trend is likely to continue as a means of keeping CAPEX low, especially as crude oil prices stay low.
Source www.APL.com
Source http://micanaldepanama.com/expansion/
NSR Presentation 19

www.nsr.com © 2016 – NSR
Maritime Markets Overview:
Vessel growth continues; however, challenges exist at
macro-economic level that restrains significant ‘pie
expansion’.
– Merchant Maritime still leans heavily on an M2M/IoT
narrowband play
– A ‘Bright spot’ in otherwise generally steady-state
market is Passenger markets poised to move to
HTS.
– Last-year’s setbacks are this years mid-term
challenges, offshore market will remain sluggish for
next 3-5 years
– Fishing markets represent the largest addressable
market.
Maritime Markets Overview
Intelsat Briefing @ Digital Ship Posidonia
June 2016
0
100,000
200,000
300,000
400,000
500,000
600,000
700,000
800,000
900,000
1,000,000
2015 2016 2017 2018 2019 2020 2021 2022 2023 2024 2025
In-s
erv
ice
Units
Global Maritime In-service Units
Merchant Passenger Offshore Fishing
Source: NSR
0.00
5.00
10.00
15.00
20.00
25.00
30.00
35.00
40.00
45.00
50.00
0.0
50.0
100.0
150.0
200.0
250.0
300.0
2015 2016 2017 2018 2019 2020 2021 2022 2023 2024 2025
Gb
ps
TP
Es
Global Maritime Capacity Demand
FSS C-band FSS Ku-band GEO-HTS, C-bandGEO-HTS, Ku-band GEO-HTS, Ka-Band Non-GEO HTS
Source: NSR
0
50,000
100,000
150,000
200,000
250,000
300,000
350,000
400,000
450,000
500,000
2015 2016 2017 2018 2019 2020 2021 2022 2023 2024 2025
Ve
sse
ls
Global Maritime Addressable Market
Merchant Maritime Passenger Vessels Offshore Fishing
Source: NSR
NSR Presentation 20
www.nsr.com © 2016 – NSR
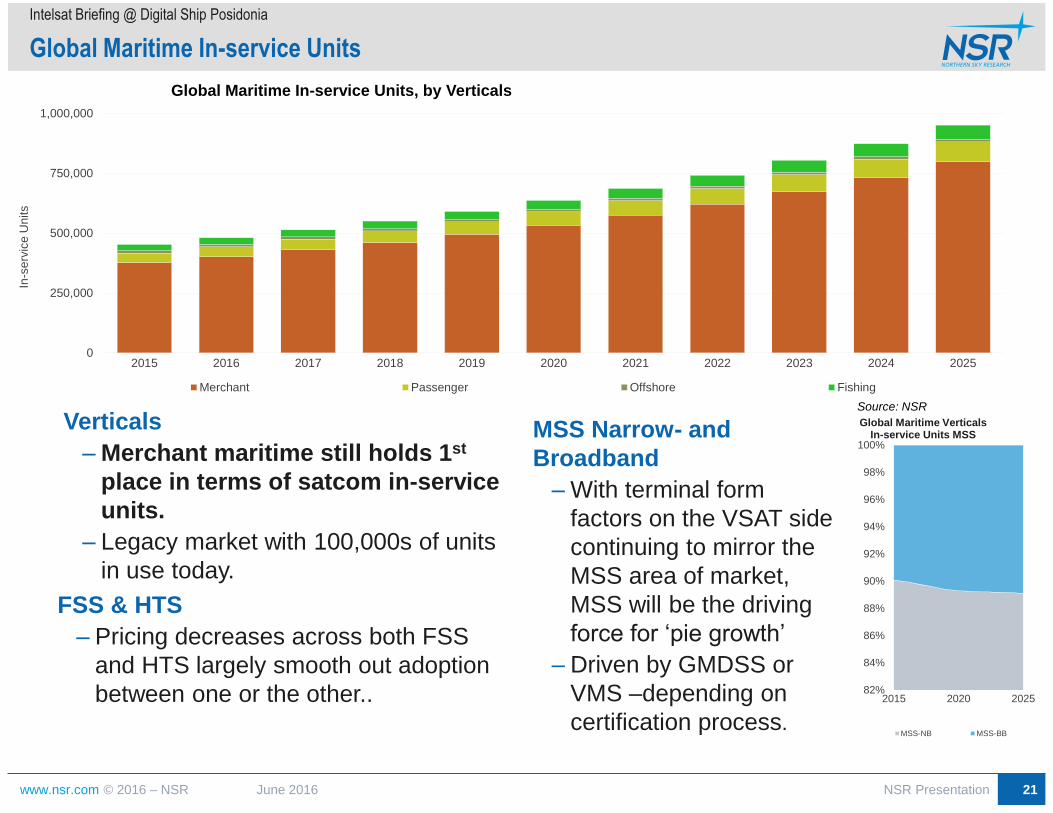
Global Maritime In-service Units
Intelsat Briefing @ Digital Ship Posidonia
June 2016
FSS & HTS
– Pricing decreases across both FSS
and HTS largely smooth out adoption
between one or the other..
MSS Narrow- and
Broadband
– With terminal form
factors on the VSAT side
continuing to mirror the
MSS area of market,
MSS will be the driving
force for ‘pie growth’
– Driven by GMDSS or
VMS –depending on
certification process.
82%
84%
86%
88%
90%
92%
94%
96%
98%
100%
2015 2020 2025
Global Maritime Verticals In-service Units MSS
MSS-NB MSS-BB
0
250,000
500,000
750,000
1,000,000
2015 2016 2017 2018 2019 2020 2021 2022 2023 2024 2025
In-s
erv
ice
Units
Global Maritime In-service Units, by Verticals
Merchant Passenger Offshore Fishing
Source: NSR
Verticals
– Merchant maritime still holds 1st
place in terms of satcom in-service
units.
– Legacy market with 100,000s of units
in use today.
NSR Presentation 21
www.nsr.com © 2016 – NSR
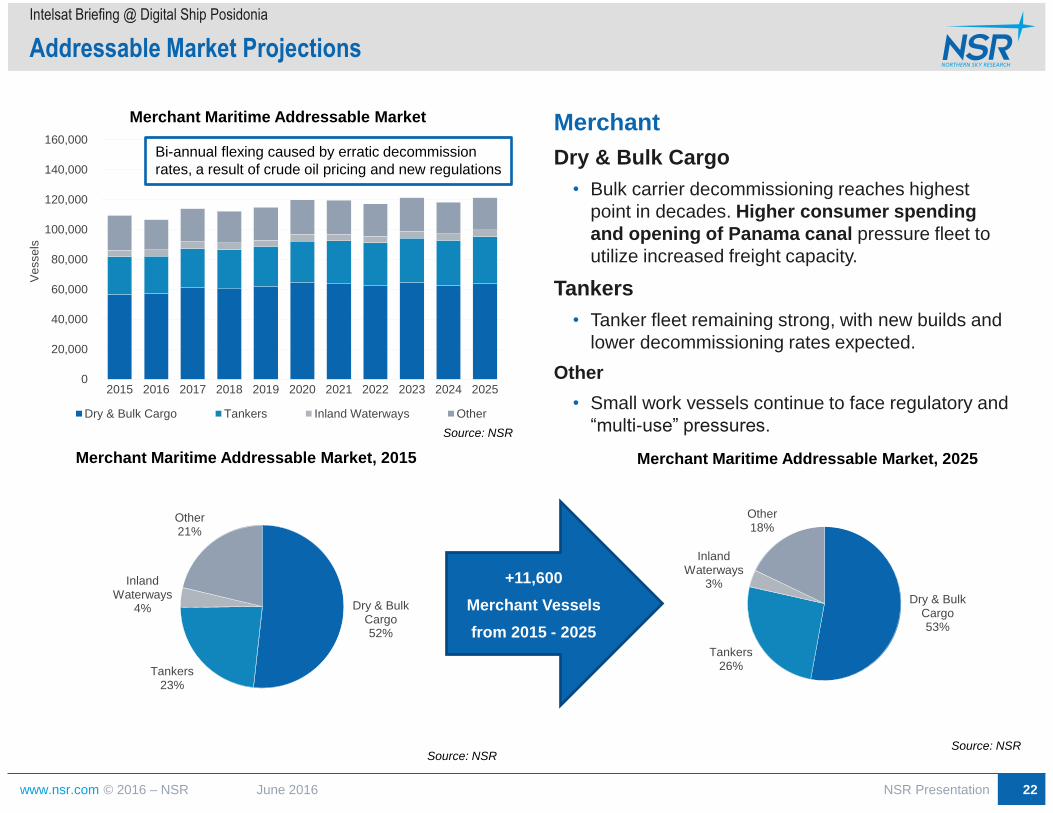
Addressable Market Projections
Intelsat Briefing @ Digital Ship Posidonia
June 2016
Merchant
Dry & Bulk Cargo
• Bulk carrier decommissioning reaches highest
point in decades. Higher consumer spending
and opening of Panama canal pressure fleet to
utilize increased freight capacity.
Tankers
• Tanker fleet remaining strong, with new builds and
lower decommissioning rates expected.
Other
• Small work vessels continue to face regulatory and
“multi-use” pressures.
+11,600
Merchant Vessels
from 2015 - 2025
0
20,000
40,000
60,000
80,000
100,000
120,000
140,000
160,000
2015 2016 2017 2018 2019 2020 2021 2022 2023 2024 2025
Ve
sse
ls
Merchant Maritime Addressable Market
Dry & Bulk Cargo Tankers Inland Waterways Other
Source: NSR
Bi-annual flexing caused by erratic decommission
rates, a result of crude oil pricing and new regulations
Dry & Bulk Cargo 52%
Tankers 23%
Inland Waterways
4%
Other 21%
Merchant Maritime Addressable Market, 2015
Source: NSR
Dry & Bulk Cargo 53%
Tankers 26%
Inland Waterways
3%
Other 18%
Merchant Maritime Addressable Market, 2025
Source: NSR
NSR Presentation 22
www.nsr.com © 2016 – NSR
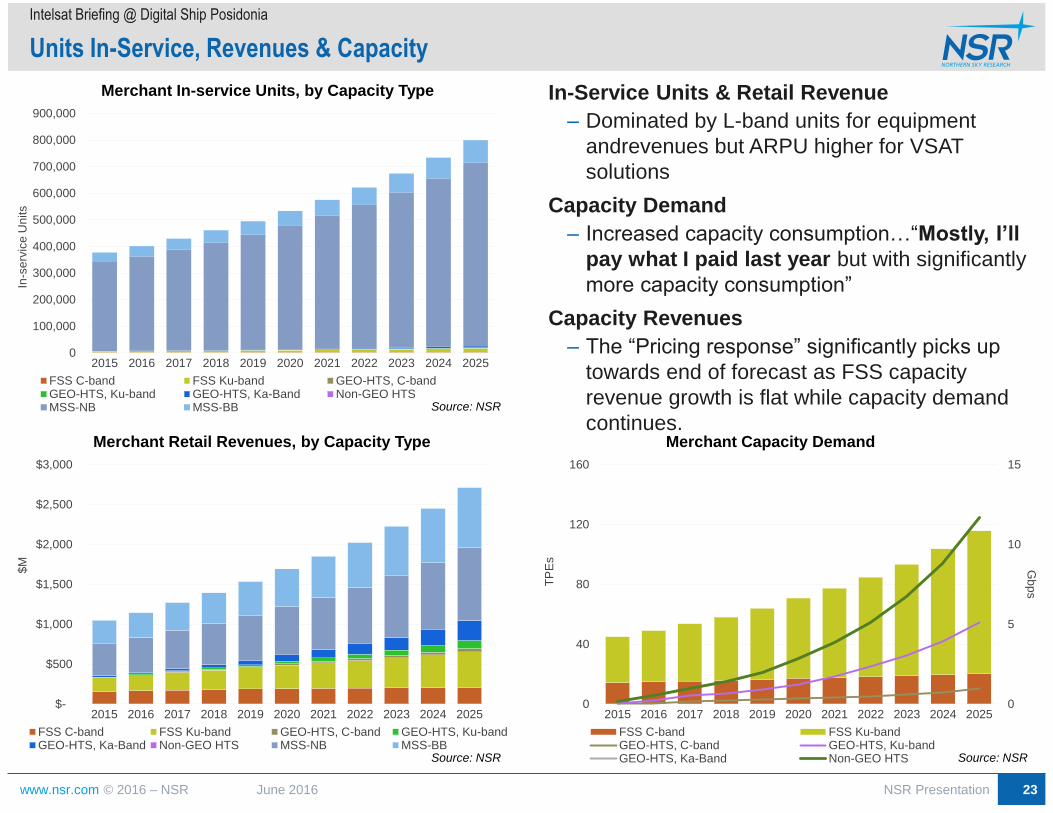
In-Service Units & Retail Revenue
– Dominated by L-band units for equipment
andrevenues but ARPU higher for VSAT
solutions
Capacity Demand
– Increased capacity consumption…“Mostly, I’ll
pay what I paid last year but with significantly
more capacity consumption”
Capacity Revenues
– The “Pricing response” significantly picks up
towards end of forecast as FSS capacity
revenue growth is flat while capacity demand
continues.
Units In-Service, Revenues & Capacity
Intelsat Briefing @ Digital Ship Posidonia
June 2016
$-
$500
$1,000
$1,500
$2,000
$2,500
$3,000
2015 2016 2017 2018 2019 2020 2021 2022 2023 2024 2025
$M
Merchant Retail Revenues, by Capacity Type
FSS C-band FSS Ku-band GEO-HTS, C-band GEO-HTS, Ku-bandGEO-HTS, Ka-Band Non-GEO HTS MSS-NB MSS-BB
Source: NSR
0
5
10
15
0
40
80
120
160
2015 2016 2017 2018 2019 2020 2021 2022 2023 2024 2025
Gb
ps
TP
Es
Merchant Capacity Demand
FSS C-band FSS Ku-bandGEO-HTS, C-band GEO-HTS, Ku-bandGEO-HTS, Ka-Band Non-GEO HTS Source: NSR
0
100,000
200,000
300,000
400,000
500,000
600,000
700,000
800,000
900,000
2015 2016 2017 2018 2019 2020 2021 2022 2023 2024 2025
In-s
erv
ice
Units
Merchant In-service Units, by Capacity Type
FSS C-band FSS Ku-band GEO-HTS, C-bandGEO-HTS, Ku-band GEO-HTS, Ka-Band Non-GEO HTSMSS-NB MSS-BB Source: NSR
NSR Presentation 23
www.nsr.com © 2016 – NSR
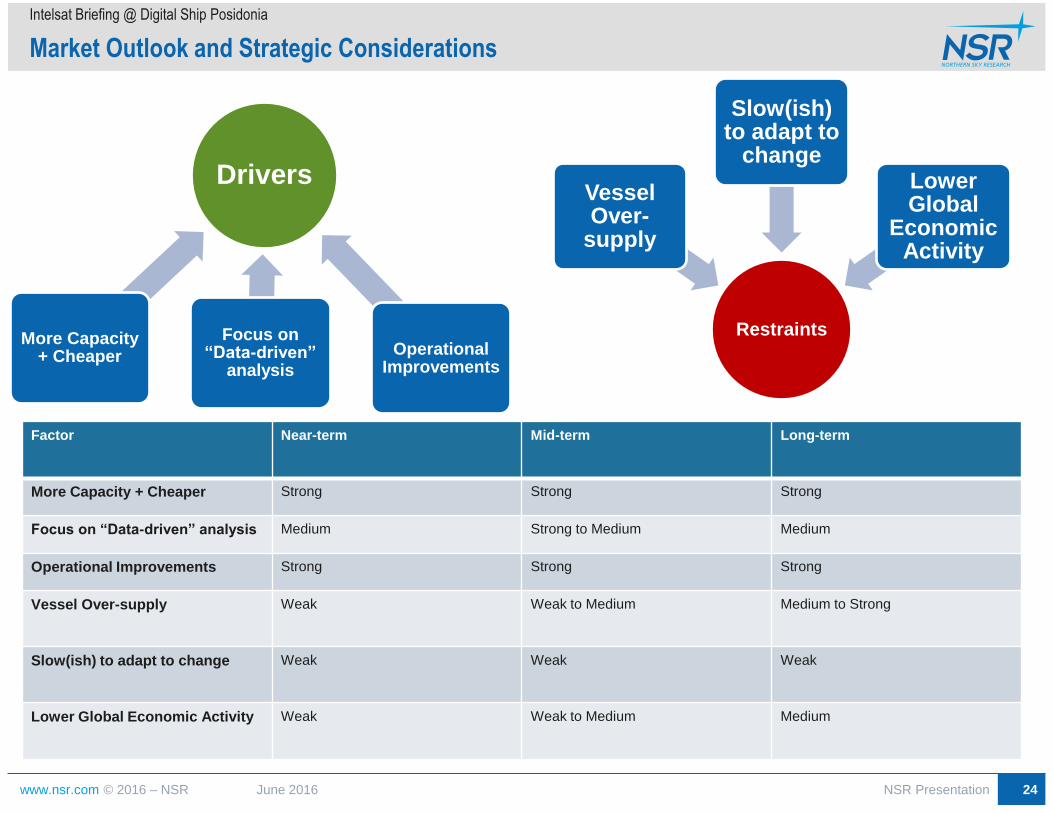
Market Outlook and Strategic Considerations
Intelsat Briefing @ Digital Ship Posidonia
June 2016
Drivers
More Capacity + Cheaper Operational
Improvements
Focus on “Data-driven”
analysis
Restraints
Vessel Over-
supply
Slow(ish) to adapt to
change Lower Global
Economic Activity
Factor Near-term Mid-term Long-term
More Capacity + Cheaper Strong Strong Strong
Focus on “Data-driven” analysis Medium Strong to Medium Medium
Operational Improvements Strong Strong Strong
Vessel Over-supply Weak Weak to Medium Medium to Strong
Slow(ish) to adapt to change Weak Weak Weak
Lower Global Economic Activity Weak Weak to Medium Medium
NSR Presentation 24
www.nsr.com © 2016 – NSR
www.nsr.com @NSR_Satcom
Northern Sky Research, LLC (NSR)
One Mifflin Place
Suite 400
Cambridge, MA 02138
United States
Phone: 617-674-7743
Thank You! Questions